Flexible Rate Revolving Note Private Placement Program Questions and Answers
|
|
|
- Eleanore Bates
- 5 years ago
- Views:
Transcription
1 Flexible Rate Revolving Note Private Placement Program Questions and Answers 1. Due to number of pages, a link will be provided to access our audit, is that acceptable? Response - Yes, however, please include a copy on the CD if possible. 2. If the integration fails for any reason or the District defaults on any of its debt what are the ramifications for SAWS and the City? Response - SB 341 provides guidance on the ramification for failure to timely integrate. Our interpretation is that if SAWS fails to timely integrate, pursuant to S.B. 341, 52. (f), the Texas Commission on Environmental Quality (TCEQ) may find SAWS in violation of its obligation under the system s certificate of convenience and necessity (CCN) to provide continuous and adequate service. The TCEQ may bring an enforcement action against SAWS, including the imposition of an administrative penalty under Section of the Texas Water Code. Section allows for a penalty up to $5,000, however, each day of the violation may be considered a separate violation. In the event of a default on the notes, the holder would be entitled to the remedies set forth in the notes, which could include requiring a requirement to increase rates in a manner sufficient to meet the coverage requirements of the outstanding District debt. The remedy of mandamus is available to require the compliance with these covenants, so long as the amount in question is not uncertain or in dispute. 3. SAWS has paid a fairly consistent amount to the City each year, how is that determined? As an example, is it based on Net Revenues after debt service or Gross Revenues? Response - Per Ordinance 75686, an amount not to exceed 5% of Gross Revenues of the System shall be transferred to the City of San Antonio General Fund. However, since inception, the transfer amount has been 2.7% of Gross Revenues. Per Section 11: Exception to Required Transfer to the City General Fund of the DSP Ordinance , Gross Revenues of the District Special Project is excluded from the payment to the City of San Antonio until integration. 4. Do you have a draft of the ordinance that will be governing this financing that you can share? Response A draft notes ordinance is currently not available, however, all required covenants for subordinate lien debt of the DSP, which is the lien level in which the Flexible Rate Revolving Note Private Placement Program will be placed, are outlined in the DSP Ordinance Please see Section 13: System Integration of the DSP Ordinance for a summary of when full integration occurs. 5. According to the most recent OS for SAWS, the tolling agreement with DOJ and EPA expired on April 30 th. Has this agreement been extended? Response The tolling agreement has been extended to July 9, We would like to have a current financial statement on the DSP.
2 Response Attached please find the last audited financial statement as of April 30, 2011, as well as the November 2011 financial report. This is the last report that was presented to the Bexar Met Board of Directors. Padgett & Stratemann is currently performing an audit of Bexar Met's financial results as of 1/31/2012. We are currently evaluating certain potential adjustments that may affect those results. 7. How will a reserve fund be established for this new credit facility, and what detail can you provide? Response It is the SAWS-DSP intention not to fund a reserve fund for this issue. 8. When do you anticipate receipt of the bond rating on the new credit facility, and do you have any indication what it might be? Response SAWS-DSP is currently working with the rating agencies and expect to receive a rating by the end of the negotiation period of May 24, 2012.
3 FINANCIAL REPORT APRIL 30, 2011
4 THIS PAGE INTENTIONALLY LEFT BLANK
5 C O N T E N T S Page ANNUAL FILING AFFIDAVIT... 1 INDEPENDENT AUDITOR S REPORT... 2 MANAGEMENT S DISCUSSION AND ANALYSIS... 4 BASIC FINANCIAL STATEMENTS Government-wide Financial Statements Statement of Net Assets Statement of Revenues, Expenses and Changes in Net Assets Statement of Cash Flows Fund Financial Statements Statement of Fiduciary Net Assets Statement of Changes in Fiduciary Net Assets Notes to Financial Statements REQUIRED SUPPLEMENTARY INFORMATION Schedule of Funding Progress Retirement Income Plan OTHER SUPPLEMENTARY INFORMATION Combining Schedule of Net Assets Combining Schedule of Revenues, Expenses and Changes in Net Assets Combining Schedule of Cash Flows... 53
6 C O N T E N T S Page TEXAS SUPPLEMENTARY INFORMATION (TSI) TSI-1. Schedule of Services and Rates TSI-2. Schedule of Enterprise Fund Expenses TSI-3. Schedule of Revenues, Expenses and Changes in Net Assets Budget to Actual TSI-4. Schedule of Temporary Investments TSI-5. Schedule of Debt Service Requirements TSI-6. Schedule of Changes in Long-Term Bonded Debt TSI-7. Comparative Schedule of Revenues and Expenses - Five Years TSI-8. Board Members, Key Personnel, and Consultants... 76
7
8 THIS PAGE INTENTIONALLY LEFT BLANK
, as of and for the year ended April 30, 2011, which collectively comprise the District s")
9 INDEPENDENT AUDITOR S REPORT Members of the Finance/Audit Committee and Board of Directors Bexar Metropolitan Water District San Antonio, Texas We have audited the accompanying financial statements of the business-type activities and the fiduciary fund of the Bexar Metropolitan Water District (the District), as of and for the year ended April 30, 2011, which collectively comprise the District s basic financial statements as listed in the table of contents. These financial statements are the responsibility of the District s management. Our responsibility is to express opinions on these financial statements based on our audit. We conducted our audit in accordance with auditing standards generally accepted in the United States of America and standards applicable to financial audits contained in Government Auditing Standards, issued by the Comptroller General of the United States. Those standards require that we plan and perform the audit to obtain reasonable assurance about whether the financial statements are free of material misstatement. An audit includes examining, on a test basis, evidence supporting the amounts and disclosures in the financial statements. An audit also includes assessing the accounting principles used and the significant estimates made by management, as well as evaluating the overall financial statement presentation. We believe that our audit provides a reasonable basis for our opinions. In our opinion, the financial statements referred to above present fairly, in all material respects, the respective financial position of the business-type activities and fiduciary fund of the District as of April 30, 2011, and the respective changes in financial position and, where applicable, cash flows thereof for the year then ended in conformity with accounting principles generally accepted in the United States of America. In accordance with Government Auditing Standards we have also issued our report dated September 22, 2011, on our consideration of the District s internal control over financial reporting and our tests of its compliance with certain provisions of laws, regulations, contracts, and grant agreements and other matters. The purpose of that report is to describe the scope of our testing of internal control over financial reporting and compliance and the results of that testing, and not to provide an opinion on internal control over financial reporting or on compliance. That report is an integral part of an audit performed in accordance with Government Auditing Standards and should be considered in assessing the results of our audit. 2
10 Bexar Metropolitan Water District Page 3 Management s discussion and analysis (on pages 4 through 13) and the schedule of funding progress identified as required supplementary information in the table of contents are not a required part of the basic financial statements, but are supplementary information required by the Government Accounting Standards Board. We have applied certain limited procedures, which consisted principally of inquiries of management regarding the methods of measurement and presentation of the required supplementary information. However, we did not audit such information and we do not express an opinion on it. Our audit was conducted for the purpose of forming opinions on the financial statements that collectively comprise the District s basic financial statements. The combining schedules listed in the table of contents are presented for purposes of additional analysis and are not a required part of the basic financial statements. The combining schedules are the responsibility of management and were derived from and related directly to the underlying accounting and other records used to prepare the financial statements. The information has been subjected to the auditing procedures applied in the audit of the financial statements and, in our opinion, are fairly stated in all material respects in relation to the financial statements as a whole. The Texas supplementary information listed in the table of contents are required by the Texas Commission on Environmental Quality as published in the Water District Financial Management Guide and are not a required part of the basic financial statements. The accompanying supplementary information, excluding the portion marked Unaudited, for which we express no opinion, have been subjected to the auditing procedures applied in the audit of the basic financial statements and, in our opinion, are fairly stated in all material respects in relation to the basic financial statements taken as a whole. WEAVER AND TIDWELL, L.L.P. Dallas, Texas September 22,
11 MANAGEMENT S DISCUSSION AND ANALYSIS (UNAUDITED) The management of the Bexar Metropolitan Water District (the District) provides this narrative discussion and analysis of the basic financial statements as an overview of the District s financial position and results of operations for the fiscal year ended April 30, Included in this section are: district overview financial highlights overview of the accompanying basic financial statements The Management s Discussion and Analysis (MD&A) should be read in conjunction with the audited financial statements, which can be found in the section following the MD&A. District Overview For the fiscal year ending April 30, 2011, the District experienced several events affecting the structure and management of its operations, including changes in upper management as well as the resulting effects of an unseasonably abnormal amount of rainfall within its service area. Regardless of the issues that had to be contended with, the District managed to maintain high quality customer service while implementing a number of the recommendations resulting from the various audits undergone in the previous fiscal year and taking steps to mitigate the uncontrollable circumstances affecting its operations. The result of all these factors is reflected as follows: Financial Highlights The assets of the District exceeded its liabilities at the close of the fiscal year by $96,446,971. Of this amount, $10,885,530 (Unrestricted Net Assets) may be used to meet the District s ongoing obligations. The District s total net assets increased by $1,094,213 (before capital contributions) at the close of the fiscal year. The District s operating revenues increased by $9,832,446 (16%) to $72,339,534 compared to the prior year s operating revenues of $62,507,088. The District s ending total assets equaled $386,292,546, which represents a 5% increase from the prior year in the amount of $19,676,296 from $366,616,250 in FY Regarding debt, the District refunded $35,210,000 in commercial paper notes and a taxable note, which brought the amount of outstanding commercial paper notes to $5,000,000 at April 30, 2010, and eliminated all of the Series 2008 taxable notes. 4
12 MANAGEMENT S DISCUSSION AND ANALYSIS (UNAUDITED) The District issued the Bexar Metropolitan Water District Waterworks System Revenue Refunding Bonds, Series 2010 in the amount of $23,390,000, and 2010A in the amount of $11,820,000. Total debt service coverage ratio increased from 0.98 in FY 2010 to a current ratio of 1.57 at the end of FY The debt covenant required a 1.25 ratio, while Board policy for this ratio is More information about the overall analysis of the District s financial position and results of operations is provided in the following sections. Overview of the Financial Statements The District s basic financial statements comprise three components: (1) government-wide financial statements, (2) fund financial statements, and (3) notes to the financial statements. Government-wide financial statements. The government-wide financial statements report information about the District, as a whole, using accounting methods similar to those used by private-sector businesses. As a proprietary fund, the District has prepared traditional income statements and balance sheets using private-sector accounting practices under a combination of Financial Accounting Standards Board (FASB) and GASB rules as prescribed in GASB Statement No. 20 for proprietary funds. The reports that the District has prepared are in accordance with the requirements of GASB Statement No. 34 as business-type activities. Activities such as the District s utility services are considered business-type not solely because they resemble those performed by the private sector but because there is an exchange involved between the receiver and provider of the service. For business-type activities, there is frequently a direct relationship between the charge for the service and the service itself. This exchange relationship causes users of financial information to focus on the costs of providing the service, the revenues obtained from the service, and the difference between the two. The Statement of net assets presents information on all of the District s assets and liabilities, with the difference between the two reported as net assets. Over time, increases and decreases in net assets may serve as a useful indicator of whether the financial position of the District is improving or deteriorating. The Statement of revenues, expenses, and changes in net assets shows the revenue sources, expense classifications, and reflects the change in net assets for the fiscal year. The Statement of cash flows reconciles the beginning and ending cash and cash equivalents, as well as demonstrates the sources and uses of funds received and expended. The government-wide financial statements can be found on pages of this report. 5
13 MANAGEMENT S DISCUSSION AND ANALYSIS (UNAUDITED) Fund financial statements. A fund is a grouping of related accounts that is used to maintain control over resources that have been segregated for specific activities or objectives. Fund financial statements provide detail information about the most significant funds. Establishment of some funds is required by state law or bond covenants. However, the Board may establish other funds to help control and manage money for particular purposes or as evidence of meeting legal responsibilities. The District reports two categories of funds: proprietary funds and fiduciary funds. Proprietary funds- The District charges customers for the services it provides through service delivery agreements to outside customers or through customer agreements within the District. These services are reported in proprietary funds. The District wide business-type activity is shown on pages of this report and the combining schedules are found on pages The District maintains two proprietary funds: Bexar Metropolitan Water District and Bexar Metropolitan Development Corporation (a blended component unit). The District s intent is that costs of providing the services to the general public on a continuing basis is financed through user charges in a manner similar to private enterprise. Fiduciary funds- The District reports on one fiduciary fund: the Retirement Income Plan Pension Trust Fund. Fiduciary funds are used to account for resources held for the benefit of parties outside the government. Fiduciary funds are not reflected in the government-wide financial statements because the resources of those funds are not available to support the District s own programs. The accounting used for fiduciary funds is much like that used for proprietary funds. The basic fiduciary fund financial statements can be found on pages of this report. Notes to the financial statements. The notes provide additional information that is essential for a full understanding of the data provided in the basic financial statements. The notes to the financial statements can be found on pages of this report. This report also includes required and other supplementary information. The required supplementary information concerning the District s progress in funding its obligations to provide pension benefits to its employees can be found on page 49 of this report. The other supplementary information consists of combining schedules for the operations of the District and the Development Corporation. In addition, other schedules have been included to comply with the Texas Commission on Environmental Quality (TCEQ) requirements. Government-wide Financial Analysis As noted earlier, net assets may serve over time as a useful indicator of a government s financial position. In the case of the District, total assets exceeded liabilities by $96,446,971 at the close of the fiscal year. At the end of the fiscal year, the District had unrestricted cash balances of $13,708,188 and unrestricted net assets of $10,885,530. Unrestricted cash balances increased $1,316,183 (11%) over the prior year, and unrestricted net assets decreased $1,526,820 (16%). The 6
14 MANAGEMENT S DISCUSSION AND ANALYSIS (UNAUDITED) District experienced increased revenues due to decreased rainfall in the area and a rate increase that was implemented in September of With the improved operating results the District is continuing to replenish the contingency reserve account that was depleted in the previous fiscal year. During the current fiscal year the balance in the account increased from $6,149 to $342,403 The District s net asset classification invested in capital assets net of related debt decreased by $1,502,113 or 2% to $65,514,597 for the year. Restricted net assets consist of amounts for debt service, construction, and contingencies. During the year, net assets restricted for debt service increased by $3,000,423 to $17,733,110. Net assets restricted for construction increased by $3,823 to $1,597,293. Amounts restricted for contingencies decreased by $621,215. Overall, restricted net assets increased by $2,383,031 to $20,046,844. Total net assets increased by $2,407,737 to $96,446,971. Elements of this increase are reflected in Table 1 and Table 2 below. Table 1 Bexar Metropolitan Water District's Statement of Net Assets Change % Unrestricted current assets $ 27,659,638 $ 24,838,291 $ 2,821,347 11% Restricted assets 25,435,829 21,403,841 4,031,988 19% Capital assets (net) 324,187, ,580,814 11,606,330 4% Other assets 9,009,935 7,793,304 1,216,631 16% Total assets $ 386,292,546 $ 366,616,250 $ 19,676,296 5% Unrestricted current liabilities $ 18,359,580 $ 11,222,460 $ 7,137,120 64% Current liabilities payable from restricted assets 12,314,215 10,866,287 1,447,928 13% Long-term debt 259,171, ,488,269 8,683,511 3% Total liabilities 289,845, ,577,016 17,268,559 6% Net assets Invested in capital assets, net of related debt 65,514,597 67,016,711 (1,502,114) -2% Restricted net assets Restricted for debt service 17,733,110 14,732,687 3,000,423 20% Restricted for construction 1,597,293 1,593,470 3,823 0% Restricted for contingencies 716,441 1,337,656 (621,215) -46% Total restricted net assets 20,046,844 17,663,813 2,383,031 13% Unrestricted net assets 10,885,530 9,358,710 1,526,820 16% Total net assets $ 96,446,971 $ 94,039,234 $ 2,407,737 3% 7
15 MANAGEMENT S DISCUSSION AND ANALYSIS (UNAUDITED) Table 2 Statement of Revenues, Expenses & Changes in Net Assets Year Ended April 30, 2011 % Change Variance Operating revenues Water sales to customers $ 65,020,111 $ 55,444,040 $ 9,576,071 17% Customer penalties and fees 1,511,286 1,481,629 29,657 2% Impact fees 1,130,724 1,148,244 (17,520) -2% Water development fees 1,466,000 1,225, ,000 20% Main and service extensions 459, ,708 1,051 0% Collection fees for sewer, garbage, and fire 361, ,022 (246,192) -40% Fire protection 283, ,264 41,249 17% Miscellaneous and regulatory fees 2,106,311 1,899, ,130 11% Total operating revenues 72,339,534 62,507,088 9,832,446 16% Operating expenses Production expenses 38,721,295 36,849,636 1,871,659 5% Administrative and general expenses 11,030,834 12,529,858 (1,499,024) -12% Depreciation expense 11,315,048 10,384, ,879 9% Total operating expenses 61,067,177 59,763,663 1,303,514 2% Operating income 11,272,357 2,743,425 8,528, % Non operating revenues (expenses) Grant revenue 121,121 50,000 71,121 0% Interest earned 164, ,850 (4,313) -3% Bad debts recovered 26,605 25,021 1,584 6% Gain/loss on disposal of assets (244,074) 578,795 (822,869) -142% Interest and fiscal charges (12,287,961) (11,766,186) (521,775) 4% Other non-operating revenues 2,041, ,890 1,494, % Total non-operating expenses (10,178,144) (10,396,630) 218,486-2% Increase/(decrease) in net assets before capital contributions and special items 1,094,213 (7,653,205) 8,747, % Capital contributions 1,313,524 2,200,878 (887,354) -40% Change in net assets $ 2,407,737 $ (5,452,327) $ 7,860, % 8
16 MANAGEMENT S DISCUSSION AND ANALYSIS (UNAUDITED) As illustrated in Table 2, the most significant increase was in water sales to customers. Rainfall continued through July 2010 but stopped in August 2010 and revenues started increasing. Further, the District implemented a 7% rate increase effective September 1, Production expenses did increase by 5% but this was offset by a 12% decrease in administrative and general expenses. This was due primarily to a reclassification of certain departments from the administrative category to the operations category. Overall expenses only increased by 2% despite increased water sales which leads to higher production expenses. This reflects the District s continued effort to reduce costs. Non-operating revenues were up $1.5 million primarily due to the sale of easements and rental revenue on the District s water towers which were renegotiated to better reflect current market rates. The only significant decrease in revenue was the continued decrease in developer capital contributions. This is due to the slow economy and lack of new building starts. Capital Asset and Debt Administration Capital Assets - The District s capital improvement plan consists of several major improvements and additions to the District s service area, including compliance related improvements. As of fiscal year end April 30, 2011, the District s capital assets totaled $324,187,144 (net of depreciation). This amount includes land, a water treatment plant, transmission lines, machinery and equipment, capitalized interest, construction in progress, vehicles, software, water diversion rights, and other equipment. The total increase in capital assets during the year was $11,606,330 or 4%. This change is due to the net effect of the purchase of transportation and construction equipment and a large number of capital projects completed during the year. Construction in Progress (CIP) ended in 2010 with a balance of $39,623,573. The net decrease in CIP in 2011 totaled $7,132,651, this included closing of $31,480,866 in completed projects and $24,348,215 of additions, bringing the ending CIP balance to $32,490,922. This decrease was due to the completion of several large construction projects. Additional information on the District s capital assets can be found in Note 5. of this report. Debt Administration - During the current fiscal year, the Bexar Metropolitan Water District Waterworks System Senior Lien Revenue Refunding Bonds, Series 2010 were issued in the amount of $23,390,000. The purpose of the bond issuance was to refund a portion of the District s Commercial Paper. Subordinate Revenue Refunding Bonds, Series 2010A were issued in the amount of $11,820,000 to refund 10,000,000 in taxable notes. Consequently, the District s total long term debt increased by $14,562,827 to $270,977,265, which is the net effect of the issuance of commercial paper notes in the current year, principal payments made during the fiscal year, changes in discounts, premiums and deferred refunding amounts and the accretion of interest on capital appreciation bonds. Subsequent to the fiscal year end, the District issued another $5,000,000 in commercial paper notes, bringing the total notes currently outstanding to $10,000,000. 9
17 MANAGEMENT S DISCUSSION AND ANALYSIS (UNAUDITED) As a component of the District s debt management program, each bond indenture provides for a debt service coverage ratio covenant. The covenant states that the District shall generate, in each year, net revenues (all revenues, excluding grant revenues, less operating expenses, less depreciation expense) equal to 1.25 times the maximum annual principal and interest payments outstanding on the senior lien bonds during the fiscal year, less capitalized interest. The District s debt service coverage ratio based on the activity for the year ended April 30, 2011 net of Component unit debt was The District s debt service ratio based on the maximum annual payment and interest payment was As of the end of the fiscal year, the District improved its underlying ratings from the three major rating agencies, Fitch Ratings, Moody s Investor Services, Inc., and Standard & Poor s Rating Services (S&P) mainly because all three agencies increased the ratings of municipal debt. They are assigned as follows: Fitch Ratings Moody s Investor Services, Inc Standard & Poor s Rating Services (S&P) Rating A A1 A It should be noted that Fitch and S&P put the District on negative outlook due to changes in management and the passage of legislation that may affection the District. This legislation will be discussed later in this document. See Note 11 for additional information on the changes in long term debt. Economic Outlook for the Future In developing the FY 2012 Operations and Maintenance budget, management considered numerous factors affecting the District s operations with regard to operational expenses as well as the generation of revenue. As it pertains to revenue, the season of the year, amount of rainfall, customer growth trends and changes in water rates and/or consumption are among the numerous factors that can affect the District s revenue stream. Conversely, while revenues are somewhat elastic due to demand, the expenses of the District are relatively fixed. These expenses are constant regardless of the volume of water sold to customers. The various aspects of the new budget are as follows: In FY 2012, it is projected that, of the $75,776,545 in projected operating revenues, approximately 87% will be generated from water sales to customers and agreements with wholesale water purveyors. The next largest revenue component is impact and water development fees which are projected to be 3% of revenues. Additional revenue intakes are illustrated in Graph 1. 10
 Graph 1")
18 MANAGEMENT S DISCUSSION AND ANALYSIS (UNAUDITED) Graph 1 11
 of the budget.")
19 MANAGEMENT S DISCUSSION AND ANALYSIS (UNAUDITED) As shown in Graph 2, the approved fiscal year budgeted expenses for the District total $77,719,598. As seen in the graph below, the largest source of the District s operational expenses are Water Supply Agreements, which constitute 27% ($21,073,765) of the budget. These agreements are essential to the District s operation in that they provide diverse water resources that allow the District to not be solely dependent on the Edwards Aquifer. Further, Salaries, Payroll Taxes and Benefits are the next largest category of expenses, which amount to $17,076,815 or 22% of the budget. This budget category consists of employee wages, payroll taxes and benefits for District employees, essential to the operation of the District. Other areas included in the District s budget include bond interest, depreciation expense, and operation & maintenance expenses. Graph 2 Based on the information previously illustrated, net assets are projected to increase by $9,150. Regarding the capital improvement program budget for FY 2012, the approved amount is $29,091,074. These expenditures will be funded with a combination of short term debt, water development and impact fees, and District operating revenues. 12
20 MANAGEMENT S DISCUSSION AND ANALYSIS (UNAUDITED) As in the prior year, the District utilized its restructured budget process to incorporate input from not only department directors, but from managers and supervisors who are in touch with the daily operational needs of the District. This budget process has led to a more realistic basis for the budget. Requests for Information This financial report is designed to provide a general overview of the Bexar Metropolitan Water District s finances. Questions concerning any of the information provided in this report or requests for additional financial information should be addressed to Gregg Henderson, Interim Director of Finance at Bexar Metropolitan Water District, 2047 W. Malone, San Antonio, Texas
21 BASIC FINANCIAL STATEMENTS
22 THIS PAGE INTENTIONALLY LEFT BLANK
23 Government-wide Financial Statements
24 STATEMENT OF NET ASSETS APRIL 30, 2011 ASSETS Business-Type Activities CURRENT ASSETS Unrestricted current assets Cash and cash equivalents $ 13,708,188 Accounts receivable: District customers (net of allowance for uncollectible accounts) 8,975,775 Miscellaneous (net of allowance for uncollectible accounts) 1,851,048 Prepaid expenses 816,614 Current portion of notes receivable 628,524 Inventory 1,679,489 Total unrestricted current assets 27,659,638 Restricted current assets Cash and cash equivalents 25,435,829 Total restricted current assets 25,435,829 Total current assets 53,095,467 NONCURRENT ASSETS Unrestricted noncurrent assets Capital assets Land 6,819,189 Construction in progress 32,490,922 Capital assets being depreciated 406,446,927 Less: accumulated depreciation (121,569,894) Total capital assets (net) 324,187,144 Other assets Assets held for sale 2,461,249 Unamortized bond issuance costs 4,369,364 Deferred charge 525,000 Notes receivable 1,654,322 Total other assets 9,009,935 Total noncurrent assets 333,197,079 TOTAL ASSETS $ 386,292,546 The Notes to Financial Statements are an integral part of this statement. 14
25 STATEMENT OF NET ASSETS APRIL 30, 2011 LIABILITIES AND NET ASSETS Business-Type Activities CURRENT LIABILITIES Current liabilities payable from unrestricted assets Accounts payable $ 10,088,822 Sewer and garbage collections 1,319,431 Accrued wages/payroll taxes payable 382,168 Prepaid customer accounts 477,369 Current portion of long term debt 5,190,485 Security deposits 274,821 Accrued vacation 373,043 Net pension liability 40,894 Other accrued expenses 212,547 Total unrestricted current liabilities 18,359,580 Current liabilities payable from restricted assets Revenue bonds payable within one year 6,615,000 Accrued bond interest payable 5,699,215 Total restricted current liabilities 12,314,215 Total current liabilities 30,673,795 NONCURRENT LIABILITIES Noncurrent portion of long term debt 259,171,780 Total noncurrent liabilities 259,171,780 TOTAL LIABILITIES 289,845,575 NET ASSETS Invested in capital assets, net of related debt 65,514,597 Restricted net assets Restricted for debt service 17,733,110 Restricted for construction 1,597,293 Restricted for contingencies 716,441 Total restricted net assets 20,046,844 Unrestricted net assets 10,885,530 TOTAL NET ASSETS $ 96,446,971 The Notes to Financial Statements are an integral part of this statement. 15
26 STATEMENT OF REVENUES, EXPENSES AND CHANGES IN NET ASSETS YEAR ENDED APRIL 30, 2011 Business-Type Activities OPERATING REVENUES Water sales $ 65,020,111 Customer penalties and fees 1,511,286 Impact fees 1,130,724 Water development fees 1,466,000 Main and service extensions 459,759 Collection fees for sewer, garbage and fire protection 361,830 Fire protection 283,513 Regulatory fees 2,106,311 Total operating revenues 72,339,534 OPERATING EXPENSES Production expenses 38,721,295 Administrative and general expenses 11,030,834 Depreciation 11,315,048 Total operating expenses 61,067,177 Operating income 11,272,357 NON-OPERATING REVENUES (EXPENSES) Grant revenue 121,121 Interest earned 164,537 Bad debts recovered 26,605 Other non-operating revenues 2,041,628 Loss on disposal of capital assets (244,074) Interest and fiscal charges (12,287,961) Total non-operating revenues (expenses) (10,178,144) Increase in net assets, before capital contributions 1,094,213 Capital contributions 1,313,524 Change in net assets 2,407,737 NET ASSETS, beginning balance 94,039,234 NET ASSETS, ending balance $ 96,446,971 The Notes to Financial Statements are an integral part of this statement. 16
27 THIS PAGE INTENTIONALLY LEFT BLANK
28 STATEMENT OF CASH FLOWS YEAR ENDED APRIL 30, 2011 Business-Type Activities CASH FLOWS FROM OPERATING ACTIVITIES: Cash received from customers $ 62,562,893 Cash received from other services 5,828,751 Cash payments to suppliers for goods and services (28,418,480) Cash payments to employees for services (15,765,763) Net cash provided by operating activities 24,207,401 CASH FLOWS FROM INVESTING ACTIVITIES: Investment income 164,537 Net cash provided by investing activities 164,537 CASH FLOWS FROM CAPITAL AND RELATED FINANCING ACTIVITIES: Cash received from issuance of debt 14,034,879 Repayments of bad debt 26,605 Other non-operating revenues 2,212,749 Cash proceeds from sale of capital assets 435,634 Principal payments - bonds and notes (5,605,000) Principal payments - capital leases (321,178) Proceeds from issuance of commerical paper 16,000,000 Retirement of commerical paper (11,000,000) Bond issuance costs (918,028) Interest paid on capital debt (10,118,172) Purchase of capital assets (23,771,256) Net cash used in capital and related financing activities (19,023,767) Net increase in cash and cash equivalents 5,348,171 Cash and cash equivalents, beginning of year 33,795,846 Cash and cash equivalents, end of year $ 39,144,017 The Notes to Financial Statements are an integral part of this statement. 17
29 STATEMENT OF CASH FLOWS YEAR ENDED APRIL 30, 2011 Business-Type Activities RECONCILIATION OF OPERATING INCOME TO NET CASH Net operating income $ 11,272,357 Adjustments to reconcile operating income to net cash provided by operating activities Depreciation 11,315,048 (Increase) decrease in: Accounts receivable - district customers (3,977,539) Accounts receivable - miscellaneous 20,614 Inventory of materials and supplies 39,529 Prepaid expenses 2,219,588 Deferred charges 1,050,000 Increase (decrease) in: Accounts payable 2,532,596 Sewer and garbage collection payable 67,807 Accrued wages/payroll taxes 133,554 Credit balances in accounts receivable 9,035 Security deposits 55,773 Accrued vacation (40,984) Insurance claims liability (450,695) Accrued expenses - other (39,129) Net pension obligation (153) Net cash provided by operating activities $ 24,207,401 Noncash capital and financing activities: Contributions of capital assets from developers $ 1,313,524 Capitalized interest costs $ 651,149 1,964,673 Reconcilliation of cash and cash equivalents to the statement of net assets: Cash and cash equivalents $ 13,708,188 Restricted cash and cash equivalents $ 25,435,829 39,144,017 The Notes to Financial Statements are an integral part of this statement. 18
30 THIS PAGE INTENTIONALLY LEFT BLANK
31 Fund Financial Statements
32 STATEMENT OF FIDUCIARY NET ASSETS APRIL 30, 2011 Retirement Income Plan Pension Trust Fund ASSETS Noncurrent assets Investments, at fair value: Unallocated separate accounts $ 1,120,345 Invested in insurance company 8,294,170 Common trust funds 699,357 Total noncurrent assets 10,113,872 Total assets 10,113,872 NET ASSETS Net assets Held in trust for pension benefits $ 10,113,872 The Notes to Financial Statements are an integral part of this statement. 19
33 STATEMENT OF CHANGES IN FIDUCIARY NET ASSETS YEAR ENDED APRIL 30, 2011 Retirement Income Plan Pension Trust Fund ADDITIONS: Contributions Employer $ 120,047 Total contributions 120,047 Investment earnings Net increase in the fair value of investments 1,130,479 Interest 13,259 Total investment earnings 1,143,738 Total additions 1,263,785 DEDUCTIONS: Benefits paid to plan members 336,608 Administrative expenses 103,779 Total deductions 440,387 Change in net assets 823,398 NET ASSETS, beginning balance 9,290,474 NET ASSETS, ending balance $ 10,113,872 The Notes to Financial Statements are an integral part of this statement. 20
34 NOTES TO FINANCIAL STATEMENTS NOTE 1. ORGANIZATION AND OPERATIONS Reporting Entity The Bexar Metropolitan Water District (the District), a political subdivision of the State of Texas, was created in 1945 as a stand-alone agency by an Act of the 49 th Legislature. Duties and functions of the District are in Article VATS, Title 128, Chapter 12. The District was created for the purpose of controlling, distributing and utilizing storm and flood waters of rivers and streams; and to control and regulate the accumulation and disposal of sewage and refuse. The District s service area consists of approximately 277 square miles in Bexar, Atascosa, Medina, and Comal counties. The District services the Southside of San Antonio, the City of Castle Hills, the City of Somerset, the Northeast service area, the Northwest and Texas Research Park area, the Southeast area, the Chaparral service area and the North Central areas, which include the cities of Hill Country Village, Hollywood Park, and the Stone Oak subdivision. The District, on a contract basis, collects garbage and sewer revenues for various entities within its service area. The District is governed by a seven member Board of Directors, elected from representative customer districts and has the authority to make decisions, appoint administrators and managers, and significantly influence operations. It also has the primary accountability for fiscal matters. Therefore, the District is a financial reporting entity as defined by the Governmental Accounting Standards Board (GASB) Statement No. 14, The Financial Reporting Entity, and is not included in any other governmental reporting entity. Component Units Under GASB 14 component units are organizations for which the District is financially accountable and all other organizations for which the nature and significance of their relationship with the District are such that exclusion would cause the reporting entity s financial statements to be misleading or incomplete. Financial accountability exists if the District appoints a voting majority of an organization s governing board and is either able to impose it s will on that organization or there is a potential for the organization to provide specific financial benefits to, or impose specific financial burdens on, the District. The District may be financially accountable for governmental organizations with a separately elected governing board, a governing board appointed by another government, or a jointly appointed board that is fiscally dependent on the District. The financial statements of the component units may be discretely presented in a separate column from the primary government or blended with the financial statements of the primary government. 21
35 NOTES TO FINANCIAL STATEMENTS NOTE 1. ORGANIZATION AND OPERATIONS CONTINUED Component Units Continued GASB 39 added clarification to GASB 14, by including entities which meet all three of the following requirements: 1. The economic resources received or held by the separate organization are entirely for the direct benefit of the primary government, its component units, or its constituents. 2. The primary government, or its component units, is entitled to, or has the ability to otherwise access, a majority of the economic resources received or held by the separate organization. 3. The economic resources received or held by an individual organization that the specific primary government, or its component units, is entitled to, or has the ability to access, are significant to the primary government. These financial statements present the District and its component units, entities which are legally separate from the District, but which were organized exclusively for the purposes of benefiting and accomplishing public purposes of, and to act on behalf of, the District. Blended component units, although legally separate entities are, in substance, part of the primary government s operations and thus, data from these units are generally combined with the data of the primary government. The District has two blended component units: Bexar Metropolitan Development Corporation and Bexar Metropolitan Water District Public Facility Corporation. Each blended component unit has an April 30 year-end. The Bexar Metropolitan Development Corporation was organized in January 1997 for the purpose of furthering the public purpose of the promotion and development of industrial and manufacturing enterprises, including the issuance and payment of the Bexar Metropolitan Development Corporation Water Facility Contract Revenue Bonds, Series The Bexar Metropolitan Development Corporation is currently operating a water treatment facility that it leases to the District. 22
36 NOTES TO FINANCIAL STATEMENTS NOTE 1. ORGANIZATION AND OPERATIONS CONTINUED Component Units Continued The Bexar Metropolitan Water District Public Facility Corporation was organized in January 1997 to assist the District in financing, refinancing, or providing public facilities. This Corporation has the authority to finance the acquisition of District obligations issued or incurred in accordance with existing law, to provide for the acquisition, construction, rehabilitation, renovation, repair, and the equipping, furnishing and placement in service of public facilities of the District. As of April 30, 2011, the Bexar Metropolitan Water District Public Facility Corporation had not been activated. Fiduciary Fund The District is the trustee, or fiduciary, of the Retirement Income Plan Pension Trust Fund. Due to the existence of a trust arrangement, these assets can be used only for the trust beneficiaries. The District s fiduciary activities are reported in a separate statement of fiduciary net assets and a statement of changes in fiduciary net assets. These activities are excluded from the government-wide financial statements because the assets cannot be used to support or finance the District s operations. NOTE 2. SUMMARY OF SIGNIFICANT ACCOUNTING POLICIES Measurement focus The accompanying financial statements are reported using the economic resources measurement focus and full accrual basis of accounting. Under this method, revenues are recorded when earned and expenses are recorded at the time liabilities are incurred, regardless of the timing of related cash flows. The District operates as an enterprise (proprietary) fund. Proprietary funds distinguish operating revenues and expenses from non-operating items. Operating revenues and expenses generally result from providing services and producing and delivering goods in connection with the proprietary fund s principal ongoing operation. The principal operating revenues of the District are charges to customers for providing water. Operating expenses include the cost of services, administrative expenses, and depreciation of capital assets. All revenues and expenses not meeting this definition are reported as non-operating revenues and expenses. When both restricted and unrestricted resources are available for use, it is the District s policy to use restricted resources first, then unrestricted resources as they are needed. 23
37 NOTES TO FINANCIAL STATEMENTS NOTE 2. SUMMARY OF SIGNIFICANT ACCOUNTING POLICIES CONTINUED Basis of Presentation The District presents its financial statements in accordance with GASB Statement 34 Basic Financial Statements and Management s Discussion and Analysis for State and Local Governments which provides guidance for governments engaged in business type activities. Accordingly, the basic financial statements and Required Supplementary Information (RSI) of the District consist of Management s Discussion and Analysis, Statement of Net Assets, Statement of Revenues, Expenses and Changes in Net Assets, Statement of Cash Flows, Notes to the Financial Statements, and Trend Information for the Retirement Plan. The District prepares its basic financial statements in conformity with generally accepted accounting principles (GAAP) promulgated by the Governmental Accounting Standards Board (GASB). The District applies all applicable GASB pronouncements as well as any Financial Accounting Standards Board statements and interpretations, Accounting Principles Board opinions and Accounting Research Bulletins issued on or before November 30, 1989 unless those pronouncements conflict with or contradict GASB pronouncements. The lease activity between the District and the Development Corporation is eliminated for financial statement presentation. The District also reports a fiduciary fund for the Defined Benefit Pension Plan. The pension trust fund accounts for the activities of the Defined Benefit Pension Plan, which accumulates resources for pension benefit payments to eligible employees. This fund is excluded from the government-wide statement of net assets and statement of revenues, expenses and changes in net assets since the assets are not available to support the District s own programs. Estimates The preparation of financial statements in conformity with accounting principles generally accepted in the United States of America requires management to make estimates and assumptions that affect amounts reported in the basic financial statements and accompanying notes. Accordingly, actual results could differ from those estimates. Cash and Cash Equivalents For purposes of the statement of cash flows, cash and cash equivalents are considered to be cash on hand, demand deposits, money market funds, and investments with a maturity of three months or less from the date of acquisition. 24
38 NOTES TO FINANCIAL STATEMENTS NOTE 2. SUMMARY OF SIGNIFICANT ACCOUNTING POLICIES CONTINUED Investments State statutes and the District s investment policies authorize the District to invest (shortterm and long-term) in fully secured certificates of deposit, eligible investment pools, U.S. Treasury Obligations, U.S. Agency Issues, high-grade secured commercial paper, banker s acceptances, fully collateralized repurchase agreements and certain stock and bond funds. Generally, short-term investments are stated at cost or amortized cost and long-term investments are reported at fair value. The District records any unrealized gains or losses on the long-term securities as non-operating revenues. Inventory Inventory consists of pipes, supplies, and other items used in the District s construction projects and system maintenance. These inventories are valued using the average cost method and are reported under the consumption method whereby inventory is expensed or capitalized (as a construction cost) when utilized. Capital Assets Capital assets, when purchased or constructed, are recorded at cost or estimated historical cost based on the corresponding asset class. The capital asset accounts include all of the District s assets including public domain (infrastructure) assets such as drainage systems, which have value only to the District, and assets acquired through capital leases. Assets acquired through contributions; such as those from land developers, are capitalized and recorded as capital assets and capital contributions (revenue) at estimated fair value at date of donation. It is the policy of the District to capitalize certain interest costs on revenue bonds and commercial paper associated with newly constructed capital asset additions. The applicable interest costs are reflected in the capitalized value of the assets constructed. The cost of normal maintenance and repairs that do not add to the value of the asset or materially extend asset lives are not capitalized but are charged to operating expense. Major improvements are capitalized and depreciated over the remaining useful lives of the related capital assets. Capital assets are depreciated and property under capital lease is amortized on the straight-line method using rates estimated to fully depreciate and amortize the costs of the asset group over their estimated useful lives. 25
39 NOTES TO FINANCIAL STATEMENTS NOTE 2. SUMMARY OF SIGNIFICANT ACCOUNTING POLICIES CONTINUED Capital Assets - Continued The capitalization threshold and estimated useful lives are as follows: Estimated Asset Class Capitalization Threshold Useful Lives Land and land improvements Capitalize All N/A Construction in progress $25,000 per project N/A Utility plant and distribution $25,000 per project 5-50 years Buildings/improvements $25,000 per project years Water rights diversion Capitalize All 40 years Equipment $5,000 per unit or per system 5-10 years Communication equipment $5,000 per unit or per system 10 years Computer equipment $5,000 per unit or per system 5 years Construction equipment $25,000 per project 5-10 years Software $15,000 per project 5 years Furniture and fixtures $5,000 per unit or per system 5 years Vehicles $5,000 per unit or per system 5 years Radio communication towers $5,000 per unit or per system 40 years Compensated Absences It is the District s policy to permit full time employees to accumulate earned but unused vacation and sick leave benefits. Vacation pay is accrued when earned and reported as a liability. Employees may accumulate from two to four weeks of vacation pay per year depending on their length of employment. As of April 30, 2011, accrued vacation payable is $373,043 and is reflected as a current liability. Accumulated sick leave is not payable upon termination and is therefore not recorded as a liability at year-end. Net Assets Net assets are reported as (1) invested in capital assets net of related debt; (2) restricted for debt service, construction, contingencies, and employees pension benefits, and; (3) unrestricted. Revenue Revenues are recognized as earned and generally result from providing water and sewer services to customers. Revenues resulting from other transactions are reported as non-operating revenues. 26
40 NOTES TO FINANCIAL STATEMENTS NOTE 2. SUMMARY OF SIGNIFICANT ACCOUNTING POLICIES CONTINUED Impact Fees Impact fees are recognized as a receivable and revenue at the time they are assessed, which is at the time of plat recordation, and when a contract is executed and a quotation for mains or services has been issued. In addition to that criteria, the probability of collection is considered. Since these resources are legally restricted for capital acquisition, their effect has been included in net assets restricted for construction. Amortization of Bond Related Costs Bond premiums, discounts, and loss on refunding are deferred and amortized over the life of the bonds using the effective interest method for premiums and discounts and the straight line method for loss on refunding. Bonds payable are reported net of the applicable premium/discount and loss. Bond issuance costs are reported as deferred charges and amortized over the term of the related debt using the straight-line method. Annual Budget The Board of Directors approves an annual budget each fiscal year, which estimates the amount of funds available from all sources for expenditure by the District during the fiscal year. The annual budget serves as a control device in executing the programs approved therein. Since the District operates as an enterprise fund, a Budget to Actual schedule is not required to be presented as part of the financial statements. However, a budget to actual schedule is included as supplementary information. The schedule reflects the original and final amended budget and compares the final amended budget to actual revenues and expenses. During the year the budget was not amended and expenses did not exceed appropriations in total. However, general and administrative expenses exceeded budget by $1,092,355 and bond and other interest expense exceeded budget by $860,592 for the year ended April 30,
41 NOTES TO FINANCIAL STATEMENTS NOTE 3. DEPOSITS AND INVESTMENTS Deposits At April 30, 2011, the carrying amount of the District's cash on deposit was $770,626 and the bank balance was $901,140. The District s cash deposits at April 30, 2011 and during the year ended April 30, 2011 were entirely covered by FDIC insurance and/or pledged collateral held by the District s pledging financial institution, as required by its investment policy and the Public Funds Investment Act. Investments As of April 30, 2011, the District had the following investments: Investment Amount Weighted Average Maturity (Days) Standard & Poors Rating LOGIC $ 30,737, AAA US Government Money Market 5,126, AAAm US Treasury Money Market 2,505, AAAm-G Total $ 38,369,671 The District invests in the Local Governmental Investment Cooperative (LOGIC) and money market funds. LOGIC is a public funds investment pool established pursuant to the Interlocal Cooperation Act and Public Funds Investment Act of Texas. It is governed by an Interlocal contract among participants, by-laws and board oversight of its investment and operating policies. LOGIC operates the portfolio in a manner consistent with Rule 2a-7 of the Investment Company Act of Accordingly, the fair value of the District s position in LOGIC is the same as the value of LOGIC s shares and does not include any unrealized gains and losses. LOGIC was organized in 1994 in conformity with the Interlocal Cooperation Act, Chapter 791 of the Texas Government Code, and operates under the Texas Public Funds Investment Act, Chapter 2256 of the Texas Government Code. The Public Funds Investment Act allows eligible local governments, state agencies, and non-profit corporations of the State of Texas to jointly invest their funds in permitted investments. LOGIC s governing body is a six member Board of Directors comprised of employees, officers, and elected officials. The day to day administration is performed by First Southwest Asset Management, Inc. and JP Morgan Chase provides participant support and marketing services. First Southwest Asset Management, Inc. provides administrative and participant support and marketing services. 28
42 NOTES TO FINANCIAL STATEMENTS NOTE 3. DEPOSITS AND INVESTMENTS CONTINUED Investments Continued JP Morgan Chase provides investment management, custody, fund accounting, and transfer agency services. Financial information for LOGIC can be obtained by calling TX-LOGIC or by requesting it by at The District maintains funds in a U.S. Government Money Market Fund and a U.S. Treasury Money Market Fund, which are invested by the District s agent in short-term obligations issued by the U.S. Government, its agencies or instrumentalities and repurchase agreements fully collateralized by these securities. The District reflects these funds as cash and cash equivalents. Interest Rate Risk. As a means of limiting its exposure to fair value losses arising from rising interest rates, the District s investment policy limits the maturities of investment pools and money market mutual funds to a weighted average maturity of less than ninety (90) days and two (2) years, respectively. Credit Risk. In accordance with the District s investment policy, investments in investment pools must be rated at least AAA, AAA-m, or its equivalent, and investments in money market mutual funds must be rated at least AAA. Concentration of Credit Risk. The investment policy of the District contains no limitations on the amount that can be invested in any one issuer. The following is a reconciliation of deposits and investments from the notes to the statement of net assets: Deposits and investments consist of the following: Cash on hand Deposits Money market funds LOGIC Total $ $ 3, ,626 7,632,141 30,737,530 39,144,017 Totals from Statement of Net Assets: Unrestricted Restricted Interest and sinking funds Reserve funds Construction funds Contingency funds Total $ $ 13,708,188 10,559,972 10,852,752 1,661,100 2,362,005 39,144,017 29
43 NOTES TO FINANCIAL STATEMENTS NOTE 4. ACCOUNTS RECEIVABLE District Customers The District customer accounts receivable consists of amounts due from customers for water. Included in this amount is $3,378,984 of unbilled water receivables and an allowance for uncollectible accounts of $2,156,955. Miscellaneous Receivables Miscellaneous receivables are comprised of the following: Impact fees $ 894,717 NSF checks 241,453 Service installations 354,911 Texas Department of Transportation 124,163 Repairs 166,383 SAWS information agreement 99,787 Fire hydrants 145,408 Timberwood assessment fees 7,739 Other miscellaneous receivables 45,613 Less: Allowance for uncollectible accounts (229,126) Total $ 1,851,048 30
44 NOTES TO FINANCIAL STATEMENTS NOTE 5. CAPITAL ASSET ACTIVITY Capital asset activity for the year ended April 30, 2011 was as follows: Beginning Balance May 1, 2010 Additions Deletions Ending Balance April 30, 2011 Capital assets, not subject to depreciation Land $ 6,819,554 $ - $ 365 $ 6,819,189 Construction in progress 39,623,573 24,348,215 31,480,866 32,490,922 Total capital assets not subject to depreciation 46,443,127 24,348,215 31,481,231 39,310,111 Capital assets, being depreciated Utility plant and distribution 342,912,559 29,501,529 2,655, ,758,804 Buildings and improvements 8,951, ,938-9,919,697 Equipment 17,165,011 13,348 32,292 17,146,067 Software 865, ,832 Vehicles 3,464, ,692 94,059 3,509,099 Water rights diversion 4,332, ,332,215 Furniture and fixtures 903,182 12, ,213 Total capital assets being depreciated 378,595,024 30,633,538 2,781, ,446,927 Less accumulated depreciation for: Utility plant and distribution (92,253,090) (9,576,074) (2,075,932) (99,753,232) Buildings and improvements (3,338,040) (350,235) - (3,688,275) Equipment (11,117,142) (915,037) (32,101) (12,000,078) Software (831,994) (10,495) - (842,489) Vehicles (2,726,538) (354,801) (94,459) (2,986,880) Water rights diversion (1,287,352) (108,306) - (1,395,658) Furniture and fixtures (903,182) (100) - (903,282) Total accumulated depreciation (112,457,338) (11,315,048) (2,202,492) (121,569,894) Total capital assets, net $ 312,580,813 $ 43,666,705 $ 32,060,374 $ 324,187,144 31
45 NOTES TO FINANCIAL STATEMENTS NOTE 5. CAPITAL ASSET ACTIVITY CONTINUED Depreciation expense for the current year was $11,315,048. Capital assets in the amount of $7,722,602 are considered idle as of April 30, 2011, of which $3,761,784 are being depreciated. NOTE 6. CAPITALIZED INTEREST COSTS Interest costs incurred on revenue bonds and commercial paper totaled for the year ended April 30, 2011 $11,780,427 and $651,149 was capitalized as part of the cost of the District s construction projects. NOTE 7. ASSETS HELD FOR SALE The District has the following properties that have been identified and authorized by its Board for sale. These properties remain on the District s records at their cost, as assets held for sale. Value Straus Medina Land $ 2,263, S. Zarzamora 85,348 Uptmore Land 83, Post Oak Park 10, Carlisle 7, Vickers 6, Carlisle 4,812 Total $ 2,461,249 NOTE 8. DEFERRED CHARGE Pursuant to a settlement agreement dated December 9, 2009 between the District and Water Exploration Co. (WECo) relating to the Water Supply Agreement Stein Tract, the District can apply a $2.1 million credit over two years from November 1, 2009 through October 31, 2011, at $87,500 per month against any amount due WECo. During the year ended April 30, 2011 the District applied $1,050,000 of the $2.1 million credit against amounts due WECo, leaving a deferred charge balance of $525,000 at April 30,
46 NOTES TO FINANCIAL STATEMENTS NOTE 9. NOTES RECEIVABLE In April 2011, the District entered an agreement to sell personal property, consisting of water wells and related equipment, in exchange for two notes receivable totaling $2,282,846. The notes are payable with monthly installments of $56,067, including interest at 2%, which offsets amounts owed by the District pursuant to a water supply agreement with Water Exploration Co., Ltd. Monthly installments began in May 2011 and continue through May 2014 and April NOTE 10. OPERATING LEASES The District leases a mail machine and several copiers under non-cancelable operating leases. Total costs for such leases were $87,014 for the year ended April 30, Future minimum lease payments follow: Year Ending April 30, Amount 2012 $ 75, , ,894 Total $ 167,385 33
47 NOTES TO FINANCIAL STATEMENTS NOTE 11. LONG TERM DEBT A summary of changes in long term debt for the year ended April 30, 2011 is as follows: Bonds payable: Outstanding Outstanding Due Within May 01, 2010 Additions Deductions April 30, 2011 One Year Revenue bonds payable $ 230,400,028 $ 23,390,000 $ (5,480,000) $ 248,310,028 $ 6,490,000 Subordinate revenue 875,000 11,820,000 (125,000) 12,570, ,000 notes payable Taxable note payable 10,000,000 - (10,000,000) - - Less deferred amounts: (Discounts)/premiums 484,391 (493,827) (95,168) (104,604) - Accounting loss (5,303,261) (703,534) 374,533 (5,632,262) - Total bonds payable 236,456,158 34,012,639 (15,325,635) 255,143,162 6,615,000 Accretion of interest on capital appreciation bonds 9,446,617 1,197,001-10,643,618 - Commercial paper notes payable 10,000,000 16,000,000 (21,000,000) 5,000,000 5,000,000 Capital leases payable 511,663 - (321,178) 190, ,485 Total $ 256,414,438 $ 51,209,640 $ (36,646,813) $ 270,977,265 $ 11,805,485 34
48 NOTES TO FINANCIAL STATEMENTS NOTE 11. LONG TERM DEBT Bonds payable at April 30, 2011 is comprised of the following individual issues: Interest Issue Outstanding at Rates Amount April 30, 2011 Revenue bonds payable Waterworks System Revenue Bonds, Series % to 5.60% $ 66,653,827 $ 33,662,217 Water Facility Contract Revenue Bond, Series % to 5.50% 30,296,424 19,051,424 Waterworks System Revenue Refunding Bonds, Series % to 5.37% 57,700,000 24,785,000 Waterworks System Revenue Refunding Bonds, Series % to 5.00% 53,741,387 51,181,387 Waterworks System Revenue Refunding Bonds, Series % to 5.00% 31,235,000 29,155,000 Waterworks System Revenue Refunding Bonds, Series % to 5.00% 67,215,000 67,085,000 Waterworks System Senior Lien Revenue Refunding Bonds, Series % to 5.88% 23,390,000 23,390,000 Total revenue bonds payable 248,310,028 Subordinate revenue notes payable Subordinate Revenue Notes, Series 1995A 0.00% 2,500, ,000 Subordinate Revenue Refunding Bonds, Series 2010A 2.80% to 7.30% 11,820,000 11,820,000 Total subordinate revenue notes payable 12,570,000 Total bonds payable $ 260,880,028 Revenue Bonds Payable The District issues revenue bonds to refund other bond issues and/or commercial paper notes, to provide funds for construction, repair and maintenance of existing facilities, to acquire new systems, and to pay the issuance costs. These bonds constitute special obligations of the District and are secured by revenues from the District s operation. On January 11, 2011, the District issued $23,390,000 of Waterworks System Senior Lien Revenue Refunding Bonds, Series 2010 with interest rates of 3.000% to 5.875% to refund $21,000,000 of commercial paper notes. The refunded commercial paper notes had an interest rate of 0.35%. On January 11, 2011, the District advance refunded $10,000,000 on a taxable note due May 1, The net proceeds of $10,197,198 were deposited with an escrow agent. As a result of the current refunding, the District increased its aggregate debt service payment to maturity by $8,815,324 and incurred an economic loss (difference between the present values of the debt service payments on the old and new debt) of $470,
49 NOTES TO FINANCIAL STATEMENTS NOTE 11. LONG TERM DEBT CONTINUED Revenue Bonds Payable Continued In prior years, the District defeased certain revenue bonds by placing the proceeds of new bonds in an irrevocable trust to provide for all future debt service payments on the old bonds. Accordingly, the trust account asset and liability for the defeased bonds are not included in the District s financial statements. At April 30, 2011, $52,554,000 of bonds outstanding are considered defeased, which includes the bonds defeased in the current year. The District has not defaulted on any principal or interest payments. There are a number of limitations and restrictions contained in the bond indentures. Management has complied with all significant limitations and restrictions through April 30, The Federal Tax Reform Act of 1986 requires issuers of tax-exempt debt to make payments to the United States Treasury for investment income received at yields that exceed the issuer s tax exempt borrowing rates. The Treasury requires payment for each issue every five years; therefore, the estimated liability is updated at that time for all tax-exempt issuances or when there is a change in yields. The District had no arbitrage rebate liability at April 30, The annual debt service requirements for the revenue bonds as of April 30, 2011 are as follows: Year Ending April 30, Amount Interest Accreted Interest Total 2012 $ 6,490,000 $ 11,055,606 $ - $ 17,545, ,730,000 11,054,233-17,784, ,395,000 10,770,500-18,165, ,765,069 11,412, ,838 19,102, ,903,143 11,208, ,857 19,078, ,193,001 52,010,380 5,361,999 96,565, ,075,118 39,701,702 3,554,882 94,331, ,414,945 39,109,218 14,865,458 99,389, ,203,752 25,491,460 11,065,933 76,761, ,140,000 3,769,084-41,909,084 Totals $ 248,310,028 $ 215,583,078 $ 36,739,967 $ 500,633,073 Revenue bonds payable interest is payable semi-annually on May 1 and November 1 each year. 36
50 NOTES TO FINANCIAL STATEMENTS NOTE 11. LONG TERM DEBT CONTINUED Subordinate Revenue Notes Payable On January 11, 2011, the District issued $11,820,000 of Waterworks System Subordinate Lien Revenue Refunding Bonds, Series 2010A with interest rates of 2.891% to 7.300% to refund $10,000,000 Bexar Metropolitan Water District Taxable Notes, Series 2008 with a 4.03% interest rate. The annual debt service requirements for the revenue notes payable as of April 30, 2011 are as follows: Year Ending April 30, Principal Interest Total 2012 $ 125,000 $ 604,528 $ 729, , ,137 1,442, , ,105 1,439, , ,199 1,441, , ,492 1,438, ,015,000 2,485,545 6,500, ,510,000 1,265,820 6,775,820 Total $ 12,570,000 $ 7,196,826 $ 19,766,826 Subordinate revenue bonds payable interest is payable semi-annually on May 1 and November 1 each year. Taxable Notes On January 28, 2008, the District issued $10,000,000 of Bexar Metropolitan Water District Taxable Notes, Series 2008 with a 4.03% interest rate. The note was scheduled to mature on May 1, 2011, and was refunded in full during the fiscal year ended April 30, The District does not have any taxable notes outstanding at April 30, Commercial Paper Note Program On July 1, 2002, the Board of Directors approved $50,000,000 of Bexar Metropolitan Water District Commercial Paper Notes that are used to provide funds for the interim financing of a portion of capital improvements to the District and to refinance, renew, or refund the existing notes. 37
51 NOTES TO FINANCIAL STATEMENTS NOTE 11. LONG TERM DEBT CONTINUED Commercial Paper Note Program Continued The District has covenanted to maintain, at all times, credit facilities with banks or other financial institutions which would provide available borrowing sufficient to pay the principal of the commercial paper notes. The borrowings under the Commercial Paper Note Program are equally and ratably secured by and are payable from (1) the proceeds from the sale of the bonds and (2) borrowing under and pursuant to the credit agreement. To further support the issuance of the commercial paper notes, the District entered into a letter of credit and reimbursement agreement (Agreement) with Wells Fargo Bank on December 29, 2010 to replace a letter of credit agreement with Bank of America. Pursuant to the Agreement, the Bank is obligated to loan to the District an aggregate amount not to exceed $50,000,000, plus 270 days interest at 15% or $5,547,946, for the purpose of paying amounts due under the Commercial Paper Note Program. Any borrowings under the Agreement are equally and ratably secured by and payable from the above mentioned sources pledged for payment of the Commercial Paper Note Program and from a pledge of the Net Revenues of the District, such pledge being subordinate to the pledge of Net Revenues securing all Senior Lien Obligations. At April 30, 2011, the $5,000,000 of commercial paper notes is classified as current, due to the District s June 2011 default of the Agreement with Wells Fargo Bank. As a result of the default, the entire outstanding balance of commercial paper will be due December 29, See Note 19 for further information. The interest rate on the notes outstanding at year-end was 0.44%. Capital Leases Payable The District entered into various lease agreements for financing the acquisition of heavy equipment, equipment, and vehicles. These lease agreements meet the definition of a capital lease for accounting purposes and, therefore, are recorded at the present value of future minimum lease payments as of the inception date. The terms of the leases are for 5 to 8 years with payments of $24,283 monthly and $291,396 annually and annual percentage rates from 3.55% to 5.25%. At the end of the respective lease terms, the ownership of the asset transfers to the District or the District has the option to purchase the asset. The leases are included as part of capital assets in the amounts of $2,166,174 (utility plant and distribution). The related amortization is included in accumulated depreciation within the same category of the asset in the amount of $1,296,
52 NOTES TO FINANCIAL STATEMENTS NOTE 11. LONG TERM DEBT CONTINUED Capital Leases Payable Continued Future minimum capital lease payments follow: Year Ending April 30, Amount 2012 $ 194,257 Total minimum lease payments 194,257 Less: Amount representing interest (3,772) Present value of future minimum lease payments $ 190,485 NOTE 12. RISK MANAGEMENT The District is exposed to various risks of loss related to torts, theft of, damage to and destruction of assets; business interruptions; errors and omissions; injuries to employees; and natural disasters for which the District carries commercial insurance for these risks of loss. Settled claims resulting from other risks of loss have not exceeded commercial insurance coverage in any of the past three fiscal years. The District contracts with the Texas Municipal League (TML) to provide workers compensation insurance. This multiple-employer account provides for a combination of modified self-insurance and stop-loss coverage. Contributions are set annually by TML. Liability by the District is generally limited to the contributed amounts. NOTE 13. DEFINED BENEFIT PENSION PLAN Plan Description The Bexar Metropolitan Water District Retirement Income Plan (the Plan) is a singleemployer defined benefit pension plan that covers all of its eligible employees. The Plan is governed by the District, who is authorized to establish and amend all plan provisions. The District has delegated the authority to manage certain plan assets to The Standard Insurance Company and GE Private Asset Management. The Standard Insurance Company issues a publicly available financial report that includes the applicable financial statements and required supplementary information. The report may be requested and obtained from the District s offices. The District s covered payroll for employees at May 1, 2010 (beginning of the Plan year) under this contract was $8,340,
53 NOTES TO FINANCIAL STATEMENTS NOTE 13. DEFINED BENEFIT PENSION PLAN CONTINUED Plan Amendment On June 30, 2008, the Board elected to freeze pension benefits and entry into the Plan effective September 30, Eligibility Prior to freezing entry into the Plan, employees were eligible to enter on May 1 (March 1 prior to May 1, 2007) and six months later following completion of 12 months of employment and attaining age 21. Participating employees accrue benefits if they work at least 1,000 hours per plan year. A terminating participant who has completed five years of service is entitled to receive a vested benefit starting on his normal retirement date. The amount of the benefit is equal to the retirement income earned on the basis of service to date and provided by employer contributions multiplied by the appropriate vested percentage from the table below, plus the benefit, if any, provided by the employee after-tax contributions. Years of Service Vested Percentages Less than 5 0% 5 or more 100% Notwithstanding the above schedule, the accrued benefits are 100% vested when an actively employed participant attains retirement age, becomes total and permanently disabled, or deceases. Any benefits derived from employee contributions are always 100% vested. Retirement Benefit Effective March 1, 1996, the normal retirement benefit is a monthly retirement income equal to 40% of basic monthly earnings reduced proportionally for less than 20 years of service. Basic monthly earnings are the average of the participant s monthly earnings over the last ten complete calendar years after December 31,
54 NOTES TO FINANCIAL STATEMENTS NOTE 13. DEFINED BENEFIT PENSION PLAN CONTINUED Summary of Significant Accounting Policies Basis of Accounting and Valuation of Investments The financial statements of the Plan are prepared using the accrual basis of accounting. Plan member contributions are recognized in the period in which the contributions are due. The District s contributions are recognized when due and a formal commitment to provide the contributions has been made. Benefits and refunds are recognized when due and payable in accordance with the terms of the Plan. All Plan investments are reported at fair value. Concentration of Credit Risk Identification, by amount and issuer, of investments in any one issuer that represent 5 percent or more of plan net assets (other than investments issued or explicitly guaranteed by the U.S. government and investments in mutual funds, external investment pools, and other pooled investments) follows: Amount at Investments April 30, 2011 Standard Insurance Company $ 1,819,702 Genworth Financial Trust Company 8,294,170 Total $ 10,113,872 41
55 NOTES TO FINANCIAL STATEMENTS NOTE 13. DEFINED BENEFIT PENSION PLAN CONTINUED Funding Policy The contribution requirements of plan members and the District are established and may be amended by the Plan s board. The Plan s funding policy provides for actuarially determined periodic contributions so that sufficient assets will be available to pay benefits as they come due. The unit credit method is used for the actuarial cost. Under this method, the actual or expected accrued benefit of each participant is allocated to the year in which it accrues. The normal cost is the present value of benefits expected to accrue in the current year. The actuarial cost is based on the following assumptions: Standard Insurance Company Actuarial Assumption Date of actuarial valuation May 1, 2010 Actuarial cost method Unit Credit Asset valuation method Market value Inflation rate None* Investment return 7.5% Projected salary increases 5% Post-retirement benefit increases None* Amortization method 30 year level dollar amortization * No assumption assumed by actuary 42
56 NOTES TO FINANCIAL STATEMENTS NOTE 13. DEFINED BENEFIT PENSION PLAN CONTINUED Annual Pension Cost The District made contributions to the plan totaling $120,047 during the year ended April 30, The annual pension cost, percentage of annual pension cost contributed, and the net pension obligation data at the end of the plan year and for each of the preceding two years is as follows: Percentage Annual of Annual Net Pension Plan Year Pension Cost Pension Cost Obligation (NPO) Ended (APC) Contributed (Asset) April 30, 2011 $ 119, % $ 40,894 April 30, ,018 0% 41,047 April 30, , % (212,971) Calculation of the net pension obligation follows: For the Plan Year Ending April 30, 2011 (1) Net pension obligation at May 1, 2010 $ 41,047 (2) Interest on net pension obligation (NPO) = (1) * ,080 (3) Annual required contribution (ARC) 120,047 (4) Amortization factor (5) Adjustment to ARC = (1) / (4) 3,233 (6) Annual pension cost (APC) 119,894 (7) Actual contribution made 120,047 (8) Increase/(decrease) in the NPO = (6) - (7) (153) (9) Net pension obigation at plan year end = (1) + (8) 40,894 43
57 NOTES TO FINANCIAL STATEMENTS NOTE 13. DEFINED BENEFIT PENSION PLAN CONTINUED Funded Status and Funding Progress The funded status as of May 1, 2010, the most recent actuarial valuation date, is as follows: Actuarial Valuation Date May 1, 2010 (1) Actuarial value of assets $ 9,290,474 (2) Actuarial accrued liability 9,565,628 (3) Funded ratio 97.1% (1)/(2) (4) Unfunded (overfunded) actuarial accrued liability (UAAL) 275,154 (2)-(1) (5) Annual covered payroll 8,340,178 (6) UAAL as a percentage of covered payroll 3.3% [(2)-(1)]/(5) The schedule of funding progress, presented as required supplementary information (RSI) following the notes to the financial statements, presents multiyear trend information about whether the actuarial value of plan assets is increasing or decreasing over time relative to the actuarial accrued liability for benefits. NOTE 14. DEFINED CONTRIBUTION PLAN The District provides pension benefits for all of its full-time employees through the Bexar Metropolitan Water District Employees 457 Plan (the 457 Plan), a single-employer defined contribution plan. The District is the sponsor and administrator of the 457 Plan and The Standard Insurance Company is the custodian and paying agent. As the administrator of the 457 Plan, the District reserves the right to amend, modify or terminate this Plan at any time. The 457 Plan was adopted January 1, 1997 to offer qualifying employees the opportunity to defer compensation until retirement or other occasion for distribution of benefits. The 457 Plan was amended effective October 1, 2008 to provide for automatic deferrals, employer matching contributions, vesting, and loan provisions. Effective October 1, 2008, all full-time employees are required to participate and defer 5% of their compensation, for each payroll period, to the 457 Plan, which is also the District s matching contribution. Although employees may elect to defer more than 5% of their compensation to the 457 Plan, the excess of 5% is not matched by the District. Federal law places a limit on the total amount that an employee may defer in any calendar year, and for calendar year 2010, the limit was $16,
58 NOTES TO FINANCIAL STATEMENTS NOTE 14. DEFINED CONTRIBUTION PLAN CONTINUED Employees are eligible to participate in the 457 Plan after three (3) months of service with the District as a full-time employee and entry dates into the plan are quarterly. Employees vest in the Plan upon completion of one year of service with the District. Covered employees are eligible to retire upon attaining the normal retirement age, which is the earlier of age 65 or the age at which the sum of their age and years of service equals 90. At April 30, 2011 there were a total of 304 employees participating in the 457 Plan. During the fiscal year ended April 30, 2011, employees deferred $752,221 of their compensation to the 457 Plan and the District s matching contribution totaled $174,707. NOTE 15. POST-EMPLOYMENT BENEFITS The District provides health care insurance benefits for retired employees and participants of the Bexar Metropolitan Water District Retirement Income Plan. To become eligible, the employee must retire from the District with a monthly income benefit (not lump sum distribution) from the Retirement Income Plan and make an election for health benefits according to his/her eligibility. If an election for coverage is not selected, or a dependent/spouse is not enrolled, the employee will not be eligible to pick up coverage or enroll any dependent in the future. The health care insurance benefits are as follows: Premium Reimbursement Program - an employee who retires after January 6, 1997 and commences to receive a monthly benefit from the District s pension plan is eligible to receive a reimbursement of the lesser of $100 per month or the amount of the medical and/or dental insurance premium. This plan was offered as part of the Retirement Plan and was frozen by the District on September 30, The District continues to pay premiums for those participants that were in the plan prior to it being frozen. Premium Paid in Full Program - an employee who retires after January 1, 2003 is eligible for health care insurance benefits at no charge if the following requirements are met: Twenty years of uninterrupted service with the District, and A combination of age plus the years of service that equals 90, with the minimum age being
59 NOTES TO FINANCIAL STATEMENTS NOTE 15. POST-EMPLOYMENT BENEFITS CONTINUED Health benefits continue through the age of sixty-five, at which time Medicare becomes the primary coverage and this plan becomes secondary coverage. Reduced Rate Program - an employee who retires after January 1, 2003 is eligible for purchased health benefits at a reduced rate if the following requirements are met: Twenty years of uninterrupted service with the District, but less than the rule of 90, and Minimum age of 55. Health benefits continue through the age of 65, at which time Medicare becomes the primary coverage and this plan becomes secondary coverage. Premium Reimbursement Program: The District had one participant in the premium reimbursement program during the year. Insurance premiums paid by the District on their behalf totaled $1,471 for the year ended April 30, Premium Paid in Full and Reduced Premium Programs: The District provides health insurance for retirees through its self-insurance program and recognizes the cost of providing these benefits on a pay-as-you-go basis by expensing the annual insurance premium. This accounting treatment is utilized due to there being no more than two participants since the inception of the program. The District had two participants in the premium paid in full program and none in the reduced premium program during the current year. Insurance premiums and claims paid totaled $5,286 at April 30, As of April 30, 2011, the premium paid in full and the reduced premium programs were terminated by the District and will no longer be offered to employees; however, the District will continue to pay for the existing participating employees. NOTE 16. WATER LEASE AGREEMENTS The District leases water rights from individuals with an Edwards Aquifer Authority water permit. Total costs for such leases were $1,551,231 for the year ended April 30, NOTE 17. CONTINGENCIES AND COMMITMENTS Pending Litigation The District is the subject of various claims and litigation, which have arisen in the ordinary course of its operations. Management, in consultation with legal counsel, is of the opinion that the District s liabilities in certain cases, if decided adversely to the District, could be material. However, the District s legal counsel is unable to form a judgment that an unfavorable outcome is either possible or remote. 46
60 NOTES TO FINANCIAL STATEMENTS NOTE 17. CONTINGENCIES AND COMMITMENTS CONTINUED Construction Contracts The District is committed under various contracts for completion of construction or acquisition of capital assets totaling approximately $10,846,906 as of April 30, Water Purchase Contracts The District entered into a water supply agreement in 1991 with Bexar-Medina-Atascosa Counties W.C.I.D. No. 1 (BMA) to purchase water. The agreement was amended in 1992, 1995, 1999, 2003 and The basic term of this contract is fifty (50) years with an additional forty (40) year option. The contract requires the District to take or pay 19,974 acre feet per year at rate of $69 per acre feet until January 1, 2013 when the price will be adjusted. The District entered into a forty (40) year regional tax-exempt water supply contract with Canyon Regional Water Authority (CRWA). This contract requires the District to take or pay for 4,000 acre feet of water. Minimum amounts will be recalculated each year. The District also has the responsibility to fund a proportionate share of all capital and operating agreements with this entity. The District entered into a ten-year water purchase agreement in 2003, as amended with Canyon Lake Water Supply Corporation. The District has agreed to buy 500,000 gallons per day of treated potable water. Additionally, the District agrees to sell 600 acre feet per annum of its 2,000 acre feet per annum of out-of-district water allocation from Canyon Lake Reservoir. However, no out-of-district water has been made available to the District. On March 28, 2007, the District entered into a twenty-five (25) year water supply agreement with Water Exploration Co., Ltd. (WECo) to provide Trinity Aquifer water to its Hill Country service area. Effective November 2009, the District can apply a $2.1 million credit over two years from November 1, 2009 through October 31, 2011, at $87,500 per month against any amount due WECo. Beginning December 22, 2009, without regard to the amount of water produced from the wells, the District is to pay WECo each month at least the monthly minimum payment. The monthly payment is 1/12th of the amount calculated by multiplying the price for that production year by 1,000 gallons of the annual production amount. However, if 1/12th of the annual production amount is not available from the wells during the calendar month, then the District s payment for that calendar month shall be based solely on the water actually produced. 47
61 NOTES TO FINANCIAL STATEMENTS NOTE 18. SUBSEQUENT EVENTS Subsequent to year end, the District has borrowed an additional $5,000,000 under the Commercial Paper Note Program. During the 82nd Texas Legislative Session, Senate Bill 341 (SB 341) was passed, with portions to be effective June 17, 2011 and other portions to be effective upon preclearance. SB 341 requires that an election be held in the District by the next uniform election date, to decide by a majority of its voters, whether the District shall be dissolved and all of the District s assets, obligations, and duties be transferred to the San Antonio Water System. The enactment of Senate Bill 341 triggered an event of default under the letter of credit and reimbursement agreement with Wells Fargo Bank. On July 20, 2011, Wells Fargo issued a Limited Issuance Notice to the District and Paying Agent which halted all borrowings under the Commercial Paper Note Program. The letter of credit expires on December 29, 2011 at which time, all amounts outstanding under the Commercial Paper Note Program will become due. On September 6, 2011, the United States Justice Department gave preclearance to the election which means the decision to dissolve the District will be decided by the rate payers. The decision to dissolve the District will be placed on the ballot for the November 2011 election. Subsequent to year end, the District entered into a contract to sell the Straus Medina Land property listed as assets held for sale for $4,037,
62 THIS PAGE INTENTIONALLY LEFT BLANK
63 REQUIRED SUPPLEMENTARY INFORMATION
64 REQUIRED SUPPLEMENTARY INFORMATION (UNAUDITED) RETIREMENT INCOME PLAN Schedule of Funding Progress Historical trend information about the Bexar Metropolitan Water District Retirement Income Plan (the Plan) is presented herewith as required supplementary information. It is intended to help users assess the Plan s funding status on an on-going basis, assess progress made in accumulating assets to pay benefits as they come due, and make comparisons with other utility retirement systems. Actuarial Valuation Date May 1, 2010 May 1, 2009 May 1, 2008 (1) Actuarial value of assets $ 9,290,474 $ 8,456,703 $ 11,629,134 (2) Actuarial accrued liability 9,565,628 9,987,780 10,163,664 (3) Funded ratio 97.1% 84.7% 114.4% (1)/(2) (4) Unfunded (overfunded) 275,154 1,531,077 (1,465,470) actuarial accrued liability (UAAL) (2)-(1) (5) Annual covered payroll 8,340,178 9,037,568 10,345,686 (6) UAAL as a percentage of 3.3% 16.9% (14.2%) covered payroll [(2)-(1)]/(5) Note: The Standard Insurance Company issues a publicly available financial report that includes the applicable financial statements and required supplementary information. The report may be requested and obtained from the District s offices. 49
65 OTHER SUPPLEMENTARY INFORMATION
66 COMBINING SCHEDULE OF NET ASSETS APRIL 30, 2011 ASSETS Bexar Bexar Metropolitan Metropolitan Development Eliminating Water District Corporation Entries Total CURRENT ASSETS Unrestricted current assets Cash and cash equivalents $ 12,910,791 $ 797,397 $ - $ 13,708,188 Accounts receivable: District customers (net of allowance for uncollectible accounts) 8,975, ,975,775 Miscellaneous (net of allowance for uncollectible accounts) 1,851, ,851,048 Intercompany receivable 150 5,830 (5,980) - Prepaid expenses 816, ,614 Current portion of notes receivable 628, ,524 Inventory 1,679, ,679,489 Total unrestricted current assets 26,862, ,227 (5,980) 27,659,638 Restricted current assets Cash and cash equivalents 21,311,057 4,124,772-25,435,829 Total restricted current assets 21,311,057 4,124,772-25,435,829 Total current assets 48,173,448 4,927,999 (5,980) 53,095,467 NONCURRENT ASSETS Unrestricted noncurrent assets Capital assets Land 6,819, ,819,189 Construction in progress 32,490, ,490,922 Capital assets being depreciated 377,929,802 28,517, ,446,927 Less: accumulated depreciation (114,270,559) (7,299,335) - (121,569,894) Total capital assets (net) 302,969,354 21,217, ,187,144 Other assets Assets held for sale 2,461, ,461,249 Unamortized bond issuance costs 3,773, ,481-4,369,364 Notes receivable 1,654, ,654,322 Deferred charge 525, ,000 Total other assets 8,414, ,481-9,009,935 Total noncurrent assets 311,383,808 21,813, ,197,079 TOTAL ASSETS $ 359,557,256 $ 26,741,270 $ (5,980) $ 386,292,546 50
67 LIABILITIES AND NET ASSETS Bexar Bexar Metropolitan Metropolitan Development Eliminating Water District Corporation Entries Total CURRENT LIABILITIES Current liabilities payable from unrestricted assets Accounts payable $ 9,773,011 $ 315,811 $ - $ 10,088,822 Sewer and garbage collections 1,319, ,319,431 Accrued wages/payroll taxes payable 382, ,168 Prepaid customer accounts 477, ,369 Current portion of long term debt 5,190, ,190,485 Security deposits 274, ,821 Intercompany payable 5, (5,980) - Accrued vacation 373, ,043 Net pension liability 40, ,894 Other accrued expenses 212, ,547 Total unrestricted current liabilities 18,049, ,961 (5,980) 18,359,580 Current liabilities payable from restricted assets Revenue bonds payable within one year 5,195,000 1,420,000-6,615,000 Accrued bond interest payable 5,363, ,217-5,699,215 Total restricted current liabilities 10,558,998 1,755,217-12,314,215 Total current liabilities 28,608,597 2,071,178 (5,980) 30,673,795 NONCURRENT LIABILITIES Noncurrent portion of long term debt 236,196,265 22,975, ,171,780 Total noncurrent liabilities 236,196,265 22,975, ,171,780 TOTAL LIABILITIES 264,804,862 25,046,693 (5,980) 289,845,575 NET ASSETS Invested in capital assets, net of related debt 63,198,329 2,316,268-65,514,597 Restricted net assets Restricted for debt service 13,943,555 3,789,555-17,733,110 Restricted for construction 1,597, ,597,293 Restricted for contingencies 342, , ,441 Total restricted net assets 15,883,251 4,163,593-20,046,844 Unrestricted net assets 15,670,814 (4,785,284) - 10,885,530 TOTAL NET ASSETS $ 94,752,394 $ 1,694,577 - $ 96,446,971 51
68 COMBINING SCHEDULE OF REVENUES, EXPENSES AND CHANGES IN NET ASSETS YEAR ENDED APRIL 30, 2011 Bexar Bexar Metropolitan Metropolitan Development Eliminating Water District Corporation Entries Total OPERATING REVENUES Water sales $ 65,020,111 $ 4,673,119 $ (4,673,119) $ 65,020,111 Customer penalties and fees 1,511, ,511,286 Impact fees 1,130, ,130,724 Water development fees 1,466, ,466,000 Main and service extensions 459, ,759 Collection fees for sewer, garbage and fire protection 361, ,830 Fire protection 283, ,513 Regulatory fees 2,106, ,106,311 Total operating revenues 72,339,534 4,673,119 (4,673,119) 72,339,534 OPERATING EXPENSES Production expenses 41,951,380 1,443,034 (4,673,119) 38,721,295 Administrative and general expenses 11,016,898 13,936-11,030,834 Depreciation 10,196,606 1,118,442-11,315,048 Total operating expenses 63,164,884 2,575,412 (4,673,119) 61,067,177 Operating income 9,174,650 2,097,707-11,272,357 NON-OPERATING REVENUES (EXPENSES) Grant revenue 121, ,121 Interest earned 163, ,537 Bad debts recovered 26, ,605 Other non-operating revenues 2,041, ,041,628 Gain (loss) on disposal of capital assets 54,031 (298,105) - (244,074) Interest and fiscal charges (10,975,856) (1,312,105) - (12,287,961) Total non-operating revenue (expenses) (8,568,735) (1,609,409) - (10,178,144) Increase in net assets, before capital contributions 605, ,298-1,094,213 Capital contributions 1,313, ,313,524 Change in net assets 1,919, ,298-2,407,737 NET ASSETS, beginning balance 92,832,955 1,206,279-94,039,234 NET ASSETS, ending balance $ 94,752,394 $ 1,694,577 $ - $ 96,446,971 52
69 THIS PAGE INTENTIONALLY LEFT BLANK
70 COMBINING SCHEDULE OF CASH FLOWS YEAR ENDED APRIL 30, 2011 Bexar Bexar Metropolitan Metropolitan Development Eliminating Water District Corporation Entries Total CASH FLOWS FROM OPERATING ACTIVITIES: Cash received from customers $ 62,562,893 $ 4,673,119 $ (4,673,119) $ 62,562,893 Cash received from other services 5,828, ,828,751 Cash payments to suppliers for goods and services (31,153,970) (1,937,629) 4,673,119 (28,418,480) Cash payments to employees for services (15,765,763) - - (15,765,763) Net cash provided by operating activities 21,471,911 2,735,490-24,207,401 CASH FLOWS FROM INVESTING ACTIVITIES: Investment income 163, ,537 Net cash provided by investing activities 163, ,537 CASH FLOWS FROM CAPITAL AND RELATED FINANCING ACTIVITIES: Cash received from issuance of debt 14,034, ,034,879 Repayments of bad debt 26, ,605 Other non-operating revenues 2,212, ,212,749 Cash proceeds from sale of capital assets 435, ,634 Principal payments - bonds and notes (4,250,000) (1,355,000) - (5,605,000) Principal payments - capital leases (321,178) - - (321,178) Premium on issuance - - Proceeds from issuance of commerical paper 16,000,000 16,000,000 Retirement of commerical paper (11,000,000) (11,000,000) Bond issuance costs (918,028) (918,028) Interest paid on capital debt (9,415,898) (702,274) - (10,118,172) Purchase of capital assets (22,343,259) (1,427,997) - (23,771,256) Net cash used in capital and related financing activities (15,538,496) (3,485,271) - (19,023,767) Net increase (decrease) in cash and cash equivalents 6,097,151 (748,980) - 5,348,171 Cash and cash equivalents, beginning of year 28,124,697 5,671,149-33,795,846 Cash and cash equivalents, end of year $ 34,221,848 $ 4,922,169 $ - $ 39,144,017 53
71 COMBINING SCHEDULE OF CASH FLOWS CONTINUED YEAR ENDED APRIL 30, 2011 Bexar Bexar Metropolitan Metropolitan Development Eliminating Water District Corporation Entries Total RECONCILIATION OF OPERATING INCOME TO NET CASH PROVIDED BY OPERATING ACTIVITIES Net operating income $ 9,174,650 $ 2,097,707 $ - $ 11,272,357 Adjustments to reconcile operating income to net cash provided by operating activities Depreciation 10,196,606 1,118,442-11,315,048 Credit losses (Increase) decrease in: Accounts receivable - district customers (3,977,539) - - (3,977,539) Accounts receivable - miscellaneous 20, ,614 Inventory of materials and supplies 39, ,529 Prepaid expenses 2,219, ,219,588 Deferred charges 1,050, ,050,000 Increase (decrease) in: - Accounts payable 3,013,255 (480,659) - 2,532,596 Sewer and garbage collection payable 67, ,807 Accrued wages/payroll taxes 133, ,554 Credit balances in accounts receivable 9, ,035 Security deposits 55, ,773 Accrued vacation (40,984) - - (40,984) Insurance claims liability (450,695) - - (450,695) Accrued expenses - other (39,129) - - (39,129) Net pension obligation (153) - - (153) Total cash provided by operating activities $ 21,471,911 $ 2,735,490 $ - $ 24,207,401 Noncash capital and financing activities: Contributions of capital assets from developers 1,313, ,313,524 Capitalized interest costs 651, ,149 $ 1,964,673 $ - $ - $ 1,964,673 Reconcilliation of cash and cash equivalents to the statement of net assets: Cash and cash equivalents $ 12,910,791 $ 797,397 $ - $ 13,708,188 Restricted cash and cash equivalents 21,311,057 4,124,772-25,435,829 $ 34,221,848 $ 4,922,169 $ - $ 39,144,017 54
72 THIS PAGE INTENTIONALLY LEFT BLANK
73 TEXAS SUPPLEMENTARY INFORMATION
74 SCHEDULE OF SERVICES AND RATES YEAR ENDED APRIL 30, 2011 (unaudited) 1. Services provided by the District during the fiscal year: X Retail Water Solid Waste/Garbage Fire Protection Retail Wastewater Irrigation Flood Control X Wholesale Water Parks/Recreation Security Wholesale Wastewater Drainage Roads Participates in joint venture, regional system and/or wastewater service (other than emergency interconnect) Other 2. Retail Service Providers Water: a. Retail rates based on 5/8 meter (or equivalent): Wastewater: Surcharge: Flat Rate per 1,000 Minimum Minimum Rate Gallons over Charge Usage Y/N Minimum Usage Usage Levels See attached schedule N/A N/A District employs winter averaging for wastewater usage: N/A Total charges per 10,000 gallon usage: Water: See attached schedule Wastewater: N/A b. Water and wastewater retail connections: Total Active ESFC Active Meter Size Connections Connections Factor ESFC's Unmetered (1) - X 1.0-5/8" or 3/4" (1) 88,936 X ,936 1" (1) 2,279 X 2.5 5, /2" (1) 961 X 5.0 4,805 2" (1) 766 X 8.0 6,128 3" (1) 144 X ,160 4" (1) 79 X ,975 6" (1) 32 X ,600 8" (1) 15 X ,200 10" (1) 1 X Total water 93, ,617 Total wastewater (1) Information not available N/A 55
75 SCHEDULE OF SERVICES AND RATES YEAR ENDED APRIL 30, 2011 (unaudited) 3. Total water consumption during the fiscal year (rounded to the nearest thousand): Gallons pumped into system: 14,107,917 Gallon billed to customers: 11,157,409 Water Accountability Ratio: 79% * The water accountability ratio is an indicator for the raw variance between the amount of water pumped into the system and the amount billed to customers. This calculation does not consider unbilled water that is accounted for by the District, including water loss from main breaks and leaks, fire hydrant usage, and theft of service. 4. Location of District: County or Counties in which District is located: Bexar, Atascosa, Medina, Comal Is the District located entirely within one county? Yes No X Is the District located within one city? Entirely Partly X Not at all City or Cities in which District is located: San Antonio, Somerset, Castle Hills, Hill Country Village, Hollywood Park, and Bulverde Is the District located within a city s extra territorial jurisdiction (ETJ)? Entirely Partly X Not at all ETJ s in which District is located: San Antonio, Somerset, Castle Hills, Hill Country Village, Hollywood Park, and Bulverde Are Board Members appointed by an office outside the District? Yes No X 56
76 Residential Water Rates and Fees Capacity Reservation Fee Meter Size (Inches) Volumetric Charges SCHEDULE OF SERVICES AND RATES YEAR ENDED APRIL 30, 2011 (unaudited) SERVICE RATES Effective September 1, 2010 Capacity Reservation Fee/Month 5/8" $ /4" " /2" " Consumption Block Rate/1,000 gallons 0-5,000 gallons $ ,001-7,000 gallons ,001-10,000 gallons ,001-17,000 gallons 3.95 Over 17,000 gallons 6.30 Total charges per 10,000 gallons water usage: Volumetric charge: Capacity reservation fee 7.93 Total $ Commercial Water Rates and Fees Capacity Reservation Fee Meter Size (Inches) Volumetric Charges Capacity Reservation Fee/Month 5/8" $ /4" " /2" " /2" " " " 1, " 2, Consumption Block Rate/1,000 gallons 0-25,000 gallons $ ,001-40,000 gallons , ,000 gallons 4.95 Over 150,000 gallons
77 SCHEDULE OF SERVICES AND RATES YEAR ENDED APRIL 30, 2011 (unaudited) System Improvement Fee (for all customer classes) $1.84 per 1,000 gallons EAA Management - Regulatory Fee (for all customer classes) $0.15 per 1,000 gallons TCEQ Pass-through Fee: Percentage of Bexar Met Retail Water Revenue 0.5% TCEQ Surcharge Fee (effective 01/30/2010): Per customer.18 cents Effective July 1, 2003 Install Service Charge Charges 3/4" x 5/8" $ 750 3/4" x 1" 850 1" x 1" 950 Square meter box 100 Annual Fire Protection Charge Charges 4" Fire line $ 500 6" Fire line 750 8" Fire line 1,000 10" Fire line 1,250 12" Fire line 1,500 Miscellaneous Charges Charges Turn on open fixtures each occurrence* $ 25 Straight connection, new construction** 1,000 Straight connection, each occurrence 100 Straight connection, fire hydrant*** 2,500 Broken locks, each occurrence 50 Crimping of service, each occurrence 250 *Effective: May 5, 2005 **Effective: February 27, 2006 ***Effective: March 27,
78 SCHEDULE OF SERVICES AND RATES YEAR ENDED APRIL 30, 2011 (unaudited) Non-Refundable Meter Size G.P.M. Service Fee 5/8" x 3/4" SR 20 $ 25 3/4" x 1" SR " x 1" SR /2" x 1-1/2" SR /2" x 2" 35 2" x 2" Turbo SR " x 3" Turbo SR " Turbo " Compound meter " Turbo w/strainer " Compound meter " Meter 60 8" Meter 60 10" Meter 60 12" Meter 70 6" Fire line meter " Fire line meter " Fire line meter 60 12" Fire line meter 70 Main Extension Fees Non-Refundable Service Fee Homeowner minimum (per linear foot) $ 14 Install fire hydrant for homeowners only 1,200 Pro-rated main (per linear foot) - commercial " Ductile pipe (by exception only) Quoted 8" Ductile pipe - fire hydrants included Quoted 12" Ductile pipe - fire hydrants included Quoted 16" Ductile pipe - fire hydrants included Quoted 24" Ductile pipe - fire hydrants included Quoted Other materials (C 900, Drisco Pipe, etc.) Quoted 59
79 SCHEDULE OF SERVICES AND RATES YEAR ENDED APRIL 30, 2011 (unaudited) Impact Fees Effecitive January 1, 2010 Somerset/Southside** Total Meter Meter Size GPM EDU Impact Fee Install Fee 5/8 or 3/4 20 $1, x 1 $ 1,390 $ 200* 1 50 $1, x 2 2, * 1 1/2 100 $1, x 5 6,950 Quoted $1, x 8 11,120 Quoted $1, x 18 25,020 Quoted $1, x 32 44,480 Quoted 6 1,400 $1, x 70 97,300 Quoted 8 2,400 $1, x ,800 Quoted 10 3,800 $1, x ,100 Quoted Southeast** Total Meter Meter Size GPM EDU Impact Fee Install Fee 5/8 or 3/4 20 $1, x 1 $ 1,291 $ 200* 1 50 $1, x 2 2, * 1 1/2 100 $1, x 5 6,455 Quoted $1, x 8 10,328 Quoted $1, x 18 23,238 Quoted $1, x 32 41,312 Quoted 6 1,400 $1, x 70 90,370 Quoted 8 2,400 $1, x ,920 Quoted 10 3,800 $1, x ,290 Quoted Northeast** Total Meter Meter Size GPM EDU Impact Fee Install Fee 5/8 or 3/4 20 $ x 1 $ 666 $ 200* 1 50 $ x 2 1, * 1 1/2 100 $ x 5 3,330 Quoted $ x 8 5,328 Quoted $ x 18 11,988 Quoted $ x 32 21,312 Quoted 6 1,400 $ x 70 46,620 Quoted 8 2,400 $ x ,920 Quoted 10 3,800 $ x ,540 Quoted 60
80 SCHEDULE OF SERVICES AND RATES YEAR ENDED APRIL 30, 2011 (unaudited) Northwest** Total Meter Meter Size GPM EDU Impact Fee Install Fee 5/8 or 3/4 20 $3, x 1 $ 3,612 $ 200* 1 50 $3, x 2 7, * 1 1/2 100 $3, x 5 18,060 Quoted $3, x 8 28,896 Quoted $3, x 18 65,016 Quoted $3, x ,584 Quoted 6 1,400 $3, x ,840 Quoted 8 2,400 $3, x ,440 Quoted 10 3,800 $3, x ,280 Quoted Hill Country** Total Meter Meter Size GPM EDU Impact Fee Install Fee 5/8 or 3/4 20 $4, x 1 $ 4,488 $ 200* 1 50 $4, x 2 8, * 1 1/2 100 $ x 5 22,440 Quoted $ x 8 35,904 Quoted $ x 18 80,784 Quoted 4 1,000 $ x ,616 Quoted 6 1,400 $ x ,160 Quoted 8 2,400 $ x ,560 Quoted 10 3,800 $ x ,720 Quoted Woods at Spring Branch/Oakland Estates/Bulverde Hills** Total Meter Meter Size GPM EDU Impact Fee Install Fee 5/8 or 3/4 20 $ x 1 $ 387 $ 200* 1 50 $ x * 1 1/2 100 $ x 5 1,935 Quoted $ x 8 3,096 Quoted $ x 18 6,966 Quoted 4 1,000 $ x 32 12,384 Quoted 6 1,400 $ x 70 27,090 Quoted 8 2,400 $ x ,440 Quoted 10 3,800 $ x ,530 Quoted * If service installed by Developer ** If applicable additional fees apply if service installed by BMWD 61
81 SCHEDULE OF ENTERPRISE FUND EXPENSES YEAR ENDED APRIL 30, 2011 Bexar Bexar Metropolitan Metropolitan Development Eliminating Water District Corporation Entries Total PRODUCTION EXPENSES Payroll and payroll taxes $ 10,533,339 $ - $ - $ 10,533,339 Utilities 3,574, ,574,576 Fuel expense 1,184, ,184,268 Insurance benefits 2,905, ,905,720 Maintenance 4,768, ,768,229 Production expenses - 1,443,034-1,443,034 Lease payments to development corporation 4,673,119 - (4,673,119) - Water purchases and treatment 14,104, ,104,804 Contracts and rentals 888, ,867 Miscellaneous expenses 9, ,559 Total production expenses 42,642,481 1,443,034 (4,673,119) 39,412,396 Operating expenses allocated to capital projects (691,101) - - (691,101) Net operating expenses 41,951,380 1,443,034 (4,673,119) 38,721,295 ADMINISTRATIVE AND GENERAL EXPENSES Payroll and payroll taxes 3,714, ,714,121 Directors fees 58, ,800 Agency fees 477, ,506 Advertising and photography expense 109, ,606 Insurance expense 322, ,567 Professional services 1,456,625 7,225-1,463,850 Contract labor Office supplies and expense 99, ,251 Communication expenses 278, ,425 Dues and subscriptions 55, ,352 License and permits 154, ,129 Postage 498, ,410 Training 35, ,660 Travel and entertainment 26, ,572 Utilities 149, ,394 Security 89, ,559 Data processing services 370, ,925 Credit losses 762, ,878 Benefits and hiring expenses 1,610, ,610,963 Financial expenses 587,058 6, ,679 Elections expenses 116, ,261 Miscellaneous expenses 908, ,519 Total administrative and general expenses 11,883,321 13,936-11,897,257 Overhead allocated to capital projects (866,423) - - (866,423) Net administrative and general expenses 11,016,898 13,936-11,030,834 Depreciation expense 10,196,606 1,118,442-11,315,048 TOTAL OPERATING EXPENSES $ 63,164,884 $ 2,575,412 $ (4,673,119) $ 61,067,177 Number of full time employees: 355 Number of part-time employees: 5 62
82 SCHEDULE OF REVENUES, EXPENSES AND CHANGES IN NET ASSETS BUDGET TO ACTUAL YEAR ENDED APRIL 30, 2011 Variance with Actual Final Budget Original Final Amended Amounts Favorable/ Budget Budget GAAP Basis * (Nonfavorable) OPERATING REVENUES Water sales to customers $ 64,463,247 $ 64,463,247 $ 65,020,111 $ 556,864 Wholesale water agreements 593, ,951 - (593,951) Sewer revenue Customer penalties & fees 1,615,000 1,615,000 1,511,286 (103,714) Impact fees/ water development fees 2,252,572 2,252,572 2,596, ,152 Main and service extensions 550, , ,759 (90,241) Collection fees 524, , ,830 (162,450) Fire protection 250, , ,513 33,513 Regulatory assessment fee 2,210,220 2,210,220 2,106,311 (103,909) Total operating revenues 72,459,270 72,459,270 72,339,534 (119,736) OPERATING EXPENSES Production expenses 41,952,879 41,952,879 41,951,380 1,499 Administrative and general expenses 9,924,543 9,924,543 11,016,898 (1,092,355) Depreciation 10,300,000 10,300,000 10,196, ,394 Total operating expenses 62,177,422 62,177,422 63,164,884 (987,462) Operating income 10,281,848 10,281,848 9,174,650 (1,107,198) NON-OPERATING REVENUES (EXPENSES) Grant revenue , ,121 Interest earned 215, , ,736 (51,264) Bad debts recovered 10,000 10,000 26,605 16,605 Other non-operating revenues 915, ,000 2,041,628 1,126,628 Net gain on disposal of capital assets ,031 54,031 Interest and fiscal charges (11,412,698) (11,836,448) (10,975,856) 860,592 Total non-operating revenues (expenses) (10,272,698) (10,272,698) (8,568,735) 2,127,713 Increase in net assets, before capital contributions 9,150 9, ,915 1,020,515 Capital contributions - - 1,313,524 1,313,524 CHANGE IN NET ASSETS $ 9,150 $ 9,150 $ 1,919,439 $ 2,334,039 * Actual expenses do not include the Bexar Metropolitan Development Corporation since an annual budget is not adopted. 63
83 SCHEDULE OF TEMPORARY INVESTMENTS YEAR ENDED APRIL 30, 2011 Identification Interest Interest or Rate Balance Receivable Certificate at End Maturity at End at End Description Number of Year Date of Year of Year Local Government Investment Cooperative % Open $ 10,559,948 $ - Local Government Investment Cooperative % Open 125,990 - Local Government Investment Cooperative % Open - - Local Government Investment Cooperative % Open 342,403 - Local Government Investment Cooperative % Open 8,798,545 - Local Government Investment Cooperative % Open 1,661,101 - Local Government Investment Cooperative % Open 1,597,293 - Local Government Investment Cooperative % Open 3,072,456 - Local Government Investment Cooperative % Open 1,740,631 - Local Government Investment Cooperative % Open 1,656,823 - Local Government Investment Cooperative % Open 1,182,340 - Bank of New York US Govt MM Fund % Open 204,000 - Bank of New York US Treasury MM Fund % Open 2,505,971 - Bank of New York US Govt MM Fund % Open 22,245 - Bank of New York US Govt MM Fund % Open 1,645,563 - Bank of New York US Govt MM Fund % Open 2,105,171 - Bank of New York US Govt MM Fund % Open 371,366 - Bank of New York US Govt MM Fund % Open 407,901 - Bank of New York US Govt MM Fund % Open 18,130 - Bank of New York US Govt MM Fund % Open 344,717 - Bank of New York US Govt MM Fund % Open 7,077 - Totals $ 38,369,671 $ - 64
84 SCHEDULE OF DEBT SERVICE REQUIREMENTS YEAR ENDED APRIL 30, 2011 Revenue Bonds Revenue Refunding Bond Series 2007 Bond Series May Fiscal Year Principal Interest Total Principal Interest Total ,110,000 1,396,835 2,506,835 1,345,000 1,210,849 2,555, ,160,000 1,345,760 2,505,760 1,405,000 1,157,194 2,562, ,210,000 1,292,435 2,502, ,000 1,121,972 1,386, ,265,000 1,236,748 2,501, ,000 1,107,459 1,382, ,830,000 1,167,110 2,997, ,000 1,095,365 1,270, ,925,000 1,072,998 2,997, ,000 1,085,690 1,270, ,020, ,560 2,989, ,000 1,075,478 1,270, ,115, ,530 2,987, ,000 1,064,863 1,264, ,215, ,625 2,985, ,000 1,053,710 1,268, ,325, ,125 2,982, ,000 1,041,885 1,266, ,440, ,000 2,978, ,000 1,029,963 1,264, ,560, ,000 2,973, ,000 1,017,838 1,267, ,220, ,500 2,513, ,000 1,005,088 1,265, ,325, ,875 2,504, , ,713 1,266, ,435,000 60,875 2,495, , ,713 1,262, ,325, ,463 3,237, ,440, ,813 3,231, ,570, ,432 3,233, ,700, ,388 3,228, ,840, ,425 3,226, ,985, ,159 3,222, ,135,000 80,334 3,215, $ 29,155,000 $ 12,266,976 $ 41,421,976 $ 24,785,000 $ 19,636,794 $ 44,421,794 65
85 SCHEDULE OF DEBT SERVICE REQUIREMENTS YEAR ENDED APRIL 30, 2011 Revenue Notes Series 1995A Revenue Bonds Series May Accreted Fiscal Year Principal Principal Interest Interest Total ,000-1,460,000-1,460, ,000-1,460,000-1,460, ,000-1,460,000-1,460, ,000-1,460,000-1,460, ,000-1,460,000-1,460, ,000-1,460,000-1,460, ,460,000-1,460, ,460,000-1,460, ,460,000-1,460, ,460,000-1,460, ,460,000-1,460, ,460,000-1,460, ,955,000 1,386,125-4,341, ,105,000 1,234,625-4,339, ,265,000 1,075,375-4,340, , ,750 2,020,545 3,588, , ,750 2,055,448 3,588, , ,750 2,087,022 3,588, , ,750 2,115,547 3,588, , ,750 2,143,277 3,589, , ,750 2,168,068 3,588, , ,750 2,192,256 3,588, , ,750 2,215,168 3,588, , ,750 2,235,565 3,588, , ,750 2,254,881 3,588, ,305, ,125-7,141, ,620, ,000-7,133, ,950, ,750-7,123, $ 750,000 $ 33,662,217 $ 32,676,500 $ 21,487,776 $ 87,826,493 66
86 SCHEDULE OF DEBT SERVICE REQUIREMENTS YEAR ENDED APRIL 30, 2011 Revenue Bonds Series May Accreted Fiscal Year Principal Interest Interest Total ,000 2,269,050-2,979, ,000 2,238,238-2,978, ,965,000 2,173,387-4,138, ,050,000 2,073,013-4,123, ,365,000 1,994,462-3,359, ,405,000 1,939,063-3,344, ,460,000 1,874,462-3,334, ,515,000 1,807,663-3,322, ,575,000 1,743,500-3,318, ,635,000 1,672,850-3,307, ,725,000 1,597,250-3,322, ,800,000 1,517,938-3,317, ,880,000 1,435,137-3,315, ,965,000 1,348,625-3,313, ,050,000 1,258,288-3,308, ,925,000 1,114,037-5,039, ,387, ,237 1,667,781 5,036, ,750, , ,595 3,545, ,768, , ,084 3,548, ,789, , ,153 3,549, ,855, ,562-3,547, ,985, ,162-3,546, ,130, ,750-3,545, ,290, ,250-3,545, ,460,000 86,500-3,546, $ 51,181,387 $ 33,607,556 $ 4,443,613 $ 89,232,556 67
87 SCHEDULE OF DEBT SERVICE REQUIREMENTS YEAR ENDED APRIL 30, 2011 Bexar Metropolitan Development Corp Revenue Series May Accreted Fiscal Year Principal Interest Interest Total ,420, ,352-2,056, ,485, ,261-2,051, ,560, ,250-2,090, , , ,838 2,165, , , ,857 2,165, , ,250 1,006,980 2,165, , ,250 1,043,114 2,165, , ,250 1,074,260 2,165, , ,250 1,103,772 2,165, , ,250 1,133,873 2,165, , ,250 1,160,327 2,165, , ,250 1,185,408 2,165, , ,250 1,209,148 2,165, ,635, ,375-2,046, ,720, ,500-2,047, ,805, ,375-2,044, ,895, ,875-2,041, ,990,000 49,750-2,039, $ 19,051,424 $ 8,210,238 $ 10,808,576 $ 38,070,238 68
88 SCHEDULE OF DEBT SERVICE REQUIREMENTS YEAR ENDED APRIL 30, 2011 Revenue Refunding Bond Series May Fiscal Year Principal Interest Total ,905,000 3,077,000 4,982, ,940,000 3,038,550 4,978, ,985,000 2,989,375 4,974, ,040,000 2,929,000 4,969, ,430,000 2,855,875 5,285, ,575,000 2,748,975 5,323, ,830,000 2,613,850 5,443, ,960,000 2,482,050 5,442, ,095,000 2,343,625 5,438, ,255,000 2,184,875 5,439, ,415,000 2,018,125 5,433, ,585,000 1,843,125 5,428, ,340,000 1,720,000 3,060, ,410,000 1,651,250 3,061, ,485,000 1,578,875 3,063, ,560,000 1,502,750 3,062, ,640,000 1,422,750 3,062, ,725,000 1,338,625 3,063, ,810,000 1,250,250 3,060, ,905,000 1,157,375 3,062, ,005,000 1,059,625 3,064, ,105, ,875 3,061, ,215, ,875 3,063, ,325, ,375 3,060, ,445, ,125 3,061, ,570, ,750 3,060, ,705, ,875 3,063, ,840, ,250 3,060, ,985,000 74,625 3,059, $ 67,085,000 $ 48,107,675 $ 115,192,675 69
89 SCHEDULE OF DEBT SERVICE REQUIREMENTS YEAR ENDED APRIL 30, 2011 Revenue Refunding Bond Series 2010 Revenue Refunding Bond Series 2010A 1-May Principal Interest Total Fiscal Year Principal Interest Total - 1,005,520 1,005, , ,543-1,248,231 1,248, , ,137 1,317, ,000 1,242,081 1,652, , ,105 1,314, ,000 1,229,556 1,654, , ,199 1,316, ,000 1,216,113 1,651, , ,492 1,313, ,000 1,201,169 1,651, , ,530 1,316, ,000 1,183,894 1,653, , ,165 1,315, ,000 1,164,081 1,654, , ,665 1,315, ,000 1,142,513 1,652, , ,865 1,312, ,000 1,118,984 1,653, , ,435 1,316, ,000 1,092,613 1,652, , ,737 1,312, ,000 1,063,863 1,653, ,020, ,015 1,316, ,000 1,033,613 1,653, ,095, ,817 1,313, ,000 1,001,863 1,651, ,180, ,780 1,315, , ,059 1,653, ,270,000 46,355 1,316, , ,606 1,651, , ,281 1,652, , ,719 1,654, , ,675 1,653, , ,456 1,654, , ,831 1,651, ,010, ,481 1,655, ,070, ,681 1,655, ,130, ,431 1,652, ,200, ,444 1,655, ,270, ,638 1,653, ,345, ,822 1,651, ,430, ,306 1,655, ,515, ,797 1,653, ,605,000 47,147 1,652, $ 23,390,000 $ 25,156,468 $ 48,546,468 $ 11,820,000 $ 7,221,840 $ 19,041,840 70
90 SCHEDULE OF DEBT SERVICE REQUIREMENTS YEAR ENDED APRIL 30, 2011 Total Debt Service Accreted Principal Interest Interest Total 6,615,000 11,685,149-18,300,149 7,430,000 11,796,371-19,226,371 8,110,000 11,533,605-19,643,605 7,505,162 11,267, ,838 19,697,225 7,668,143 10,992, ,857 19,627,667 7,973,020 10,674,675 1,006,980 19,654,675 8,291,886 10,297,659 1,043,114 19,632,659 8,615,740 9,922,102 1,074,260 19,612,102 8,966,228 9,532,088 1,103,772 19,602,088 9,361,128 9,097,404 1,133,873 19,592,404 9,794,673 8,633,938 1,160,327 19,588,938 10,254,592 8,142,029 1,185,408 19,582,029 10,795,852 7,622,530 1,209,148 19,627,530 12,545,000 6,955,106-19,500,106 13,195,000 6,293,040-19,488,040 10,909,377 5,693,981 2,020,545 18,623,903 9,661,694 5,228,706 3,723,228 18,613,629 9,348,298 4,810,964 2,966,617 17,125,879 7,608,316 4,429,288 3,041,631 15,079,235 7,887,259 4,081,225 3,113,430 15,081,914 9,221,852 3,684,927 2,168,068 15,074,847 9,637,666 3,237,602 2,192,256 15,067,524 6,794,778 2,844,056 2,215,168 11,854,002 7,104,382 2,506,806 2,235,565 11,846,753 7,444,982 2,151,819 2,254,881 11,851,682 10,145,000 1,710,513-11,855,513 10,670,000 1,178,697-11,848,697 11,220, ,306-11,839,306 4,500, ,422-4,713,422 1,605,000 47,147-1,652,147 $ 260,880,028 $ 186,884,047 $ 36,739,965 $ 484,504,040 71
91 SCHEDULE OF CHANGES IN LONG-TERM BONDED DEBT YEAR ENDED APRIL 30, 2011 Development Corp. Revenue TWDB Revenue Revenue Refunding Bonds Bonds Bonds Bonds Series 1995A Series 1998 Series 1998 Series 2002 Interest rate None % % % Dates interest payable May & Nov 1 May & Nov 1 May & Nov 1 May & Nov 1 Maturity Dates 5/1/97 to 5/1/99 to 5/1/01 to 7/15/02 to 5/1/2016 5/1/2038 5/1/2029 5/1/2032 Beginning bonds outstanding $ 875,000 $ 34,622,217 $ 20,406,424 $ 26,080,000 Bonds sold during the current year Bonds retired during the current year (125,000) (960,000) (1,355,000) (1,295,000) Ending bonds outstanding $ 750,000 $ 33,662,217 $ 19,051,424 $ 24,785,000 Interest paid during the current year $ - $ 1,482,560 $ 702,275 $ 1,260,361 Paying Agent's Name and City TWDB Bonds, Series 1995A Revenue Bonds, Series 1998 Waterworks System Revenue Bonds, Series 1998 Waterworks System Revenue Refunding Bonds, Series 2002 Waterworks System Revenue Refunding Bonds, Series 2006 Waterworks System Revenue Refunding Bonds, Series 2007 Taxable Notes, Series 2008 Waterworks System Revenue Refunding Bonds, Series 2009 Waterworks System Senior Lien Revenue Refunding Bonds, Series 2010 Waterworks System Subordinate Revenue Refunding Bonds, Series 2010A Commercial Paper Notes Bond Authority The Bank of New York, New York, NY Chase Corporate Trust Services, Dallas, TX Chase Corporate Trust Services, Dallas, TX The Bank of New York, New York, NY US Bank - Corporate Trust, Los Angeles, CA US Bank - Corporate Trust, Los Angeles, CA Bank of America, San Antonio, TX The Bank of New York Mellon, Dallas, TX The Bank of New York Mellon, Dallas, TX The Bank of New York Mellon, Dallas, TX Bankers Trust Company, New York, NY Revenue Commercial Refunding Bonds Paper Bonds Total Amount Authorized $ 96,951,827 $ 50,000,000 $ 245,101,387 $ 392,053,214 Amount Issued 96,951,827 5,000, ,101, ,053,214 Remaining to be Issued $ - $ 45,000,000 $ - $ 45,000,000 Debt Service Cash and Temporary Balances April 30, 2011 $ 25,435,829 Average Annual Debt Service Payments for the Remaining Term of All Debt $ 16,150,135 72
92 SCHEDULE OF CHANGES IN LONG-TERM BONDED DEBT YEAR ENDED APRIL 30, 2011 Revenue Revenue Revenue Revenue Revenue Refunding Refunding Taxable Refunding Refunding Refunding Bonds Bonds Notes Bonds Bonds Bonds Series 2006 Series 2007 Series 2008 Series 2009 Series 2010 Series 2010A % % 4.03% % % % May & Nov 1 May & Nov 1 May & Nov 1 May & Nov 1 May & Nov 1 May & Nov 1 5/1/07 to 5/1/09 to 11/1/08 to 5/1/10 to 5/1/13 to 5/1/12 to 5/1/2035 5/1/2025 5/1/2011 5/1/2039 5/1/2040 5/1/2025 $ 51,861,387 $ 30,215,000 $ 10,000,000 $ 67,215,000 $ - $ ,390,000 11,820,000 (680,000) (1,060,000) (10,000,000) (130,000) - - $ 51,181,387 $ 29,155,000 $ - $ 67,085,000 $ 23,390,000 $ 11,820,000 $ 2,298,588 $ 1,445,660 $ 403,000 $ 2,959,632 $ - $ - 73
93 THIS PAGE INTENTIONALLY LEFT BLANK
94 COMPARATIVE SCHEDULE OF REVENUES AND EXPENSES FIVE YEARS YEAR ENDED APRIL 30, 2011 Amounts OPERATING REVENUES Water sales to customers $ 65,020,111 $ 55,444,040 $ 62,191,413 $ 47,421,846 $ 48,223,715 Sewer revenues 1,511, Customer penalties and fees 1,130,724 1,481,629 1,632,152 1,457,259 2,218,542 Impact fees 1,466,000 1,148,244 1,054,450 2,531,306 5,746,887 Water development fees 459,759 1,225,000 1,670,800 2,600,203 3,567,741 Main and service extensions ** - 458, , ,065 1,543,574 Collection fees for sewer, garbage, and fire 361, , , ,186 1,198,839 Fire protection 283, , , , ,518 Miscellaneous and regulatory fees 2,106,311 1,899,181 1,635,315 1,329,794 1,469,477 Total operating revenues 72,339,534 62,507,088 69,798,031 57,242,261 64,121,293 OPERATING EXPENSES Production expenses 38,721,295 36,849,636 34,701,962 28,841,778 32,116,279 Administrative and general expenses 11,030,834 12,529,859 14,397,974 13,134,560 13,701,581 Depreciation expense 11,315,048 10,384,169 10,162,671 9,819,936 9,514,474 Total operating expenses 61,067,177 59,763,664 59,262,607 51,796,274 55,332,334 OPERATING INCOME 11,272,357 2,743,423 10,535,424 5,445,987 8,788,959 NON-OPERATING REVENUES (EXPENSES) Grant revenue 121,121 50, ,043 Interest earned 164, , ,651 1,015,838 1,095,447 Bad debts recovered 26,605 25,021 3,118 5,550 8,472 Gain/loss on disposal of assets (244,074) 578, , , ,964 Interest and fiscal charges (12,287,961) (11,766,186) (11,070,424) (9,825,827) (10,634,636) Other non-operating revenues 2,041, , , , ,778 Total non-operating revenues (expenses) (10,178,144) (10,396,630) (9,380,984) (7,454,235) (8,631,932) INCREASE/(DECREASE) IN NET ASSETS BEFORE CAPITAL CONTRIBUTIONS AND SPECIAL ITEMS 1,094,213 (7,653,207) 1,154,440 (2,008,248) 157,027 Capital contributions 1,313,524 2,220,878 7,355,624 19,615,636 11,545,737 Special items , CHANGE IN NET ASSETS $ 2,407,737 $ (5,432,328) $ 9,288,814 $ 17,607,388 $ 11,702,764 ** Main and Service Extensions were reclassified to operating revenues since these are revenues generated by its ongoing operations. 74
95 COMPARATIVE SCHEDULE OF REVENUES AND EXPENSES FIVE YEARS YEAR ENDED APRIL 30, 2011 Percent of Total Revenues % 88.7% 89.1% 82.8% 75.2% 2.1% 0.0% 0.0% 0.0% 0.0% 1.6% 2.4% 2.3% 2.5% 3.5% 2.0% 1.8% 1.5% 4.4% 9.0% 0.6% 2.0% 2.4% 4.5% 5.6% 0.0% 0.7% 0.7% 1.6% 2.4% 0.5% 1.0% 1.3% 1.4% 1.9% 0.4% 0.4% 0.3% 0.4% 0.2% 2.9% 3.0% 2.3% 2.3% 2.3% 100.0% 100.0% 100.0% 100.0% 100.0% 53.5% 59.0% 49.7% 50.4% 50.1% 15.2% 20.0% 20.6% 22.9% 21.4% 15.6% 16.6% 14.6% 17.2% 14.8% 84.4% 95.6% 84.9% 90.5% 86.3% 15.6% 4.4% 9.5% 13.7% 13.7% 0.2% 0.1% 0.0% 0.0% 0.1% 0.2% 0.3% 0.8% 1.8% 1.7% 0.0% 0.0% 0.0% 0.0% 0.0% (0.3%) 0.9% 1.2% 0.6% 0.8% (17.0%) (18.8%) (15.9%) (17.2%) (16.6%) 2.8% 0.9% 0.5% 1.7% 0.5% (14.1%) (16.6%) (13.4%) (13.0%) (13.5%) 1.5% (12.2%) 1.7% (3.5%) 0.2% 1.8% 3.6% 10.5% 34.3% 18.0% 0.0% 0.0% 1.1% 0.0% 0.0% 0.0% 3.3% (8.7%) 13.3% 30.8% 18.3% 75
96 BOARD MEMBERS, KEY PERSONNEL, AND CONSULTANTS YEAR ENDED APRIL 30, 2011 Term of Office Fees of Board (Elected or Office Title at Members Appointed) Paid Year End Guadalupe I. Lopez (Elected) $ 7,200 President Yvonne Cardona (Elected) $ 4,000 Vice President Greg Elliott (Elected) $ 3,000 Secretary Lesley Wenger (Elected) $ 7,200 Director Jerry G. Gonzales (Elected) $ 3,450 Director Vanessa Ybarra (Elected) $ 7,200 Director John Shackelford (Elected) $ 7,200 Director
97 BOARD MEMBERS, KEY PERSONNEL, AND CONSULTANTS YEAR ENDED APRIL 30, 2011 Key Administrative Date Annual Personnel Hired Salary Title Tom Gallier 4/18/2011 $ 190,000 Interim General Manager Melissa Killen 2/17/2009 $ 115,000 General Counsel Jesse Morin 11/3/1997 $ 102,290 Director of Finance Edna Wigfall Crute 1/3/2005 $ 96,304 Director of Administration Robert R. Villareal II 3/9/2009 $ 95,000 Acting Director of Engineering Roger Placencia 8/1/1994 $ 90,000 Director of Operations Mike Lopez 12/24/2007 $ 90,000 Director of Public Affairs Rosa H. Gawlik 1/19/2010 $ 90,000 Director of Customer Service 77
98 BOARD MEMBERS, KEY PERSONNEL, AND CONSULTANTS YEAR ENDED APRIL 30, 2011 Consultants Fees Type Garza/Gonzalez & Associates $ 118,600 District Auditors Gale, Wilson & Sanchez, PLLC $ 98,923 Legal Services Winstead PC $ 96,783 Legal Services Lloyd Gosselink $ 96,067 Legal Services The Gardner Law Firm $ 94,568 Legal Services Shelton & Valadez, PC $ 89,778 Legal Services Rolando L. Rios & Associates $ 88,269 Legal Services Web Head Group $ 67,400 Technology Services Mr Valuation Consulting, LLC $ 60,000 Property Appraisal Services Wet Rock Groundwater Services LLC $ 48,038 Geologist Consultant Services Denim Group, Ltd. $ 46,150 Technology Services Hahn, Texas $ 44,570 Public Relations Stepwise Utility Advisors, LLC $ 42,855 Rate Analysts Weaver and Tidwell LLP $ 25,000 District Auditors Bridgepoint Consulting, LLC $ 23,300 Accounting Services New Horizons $ 19,200 Technology Services Technisource, Inc. $ 18,713 Technology Services Computer Solutions $ 18,280 Technology Services Ogletree,Deakins,Nash,Smoak.Stewart P.C. $ 17,082 Legal Services Kjh Consulting, LLC $ 15,190 Legal Services C&C Groundwater Services LLC $ 14,000 Geologist Consultant Services Frost National Bank-Capital Markets $ 14,000 Financial Advisor Seeking HR $ 12,633 HR Services Others $ 25,481 Misc Advisors 78

99


100

101

102

103


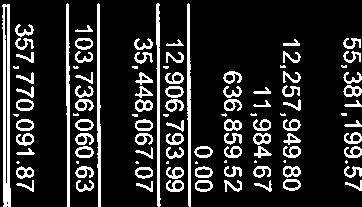
104
105

106

107
108


109

110
111


112


113


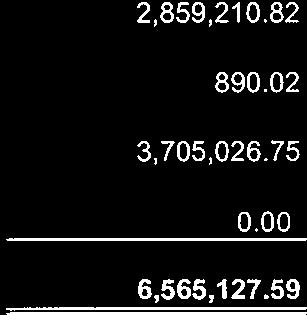
114


115
116

117

118

119


120
Basic Financial Statements and Report of Independent Certified Public Accountants City of Dallas, Texas Dallas Water Utilities (An Enterprise Fund of
 Basic Financial Statements and Report of Independent Certified Public Accountants City of Dallas, Texas September 30, 2016 FINANCIAL STATEMENTS For Fiscal Year Ended September 30, 2016 TABLE OF CONTENTS
PULASKI COUNTY PUBLIC SERVICE AUTHORITY (A COMPONENT UNIT OF PULASKI COUNTY, VIRGINIA)
") PULASKI COUNTY PUBLIC SERVICE AUTHORITY (A COMPONENT UNIT OF PULASKI COUNTY, VIRGINIA) FINANCIAL REPORT YEAR ENDED JUNE 30, 2017 Pulaski County Public Service Authority (A Component Unit of Pulaski County,
PULASKI COUNTY PUBLIC SERVICE AUTHORITY (A COMPONENT UNIT OF PULASKI COUNTY, VIRGINIA) FINANCIAL REPORT YEAR ENDED JUNE 30, 2017 Pulaski County Public Service Authority (A Component Unit of Pulaski County,
City of Chicago Department of Water Management Sewer Fund Comprehensive Annual Financial Report For the Year Ended December 31, 2012
 City of Chicago Department of Water Management Sewer Fund Comprehensive Annual Financial Report For the Year Ended December 31, 2012 Rahm Emanuel, Mayor Lois Scott, Chief Financial Officer Amer Ahmad,
PERKIOMEN TOWNSHIP. Collegeville, Pennsylvania. December 31, 2016
 PERKIOMEN TOWNSHIP Collegeville, Pennsylvania December 31, 2016 TABLE OF CONTENTS Page Number 1-2 Table of Contents 3-5 Independent Auditor's Report 6-11 Management s Discussion and Analysis BASIC FINANCIAL
Greater New Haven Water Pollution Control Authority. Financial Report June 30, 2016 and 2015
 Greater New Haven Water Pollution Control Authority Financial Report June 30, 2016 and 2015 Contents Financial Section Independent auditor s report 1-2 Management s Discussion and Analysis - unaudited
BROWARD COUNTY, FLORIDA WATER AND WASTEWATER FUND A Major Fund of Broward County, Florida
 BROWARD COUNTY, FLORIDA WATER AND WASTEWATER FUND A Major Fund of Broward County, Florida Financial Statements For the Years Ended September 30, 2013 and 2012 BROWARD COUNTY, FLORIDA WATER AND WASTEWATER
Montgomery County Emergency Services District No. 8 For the Year Ended September 30, 2014
 ANNUAL FINANCIAL REPORT of the Montgomery County Emergency Services District No. 8 For the Year Ended September 30, 2014 (This page intentionally left blank.) Montgomery County Emergency Services District
GALVESTON COUNTY MUNICIPAL UTILITY DISTRICT NO. 12 GALVESTON COUNTY, TEXAS ANNUAL AUDIT REPORT SEPTEMBER 30, 2017
 GALVESTON COUNTY MUNICIPAL UTILITY DISTRICT NO. 12 GALVESTON COUNTY, TEXAS ANNUAL AUDIT REPORT SEPTEMBER 30, 2017 C O N T E N T S INDEPENDENT AUDITOR S REPORT 1-2 MANAGEMENT S DISCUSSION AND ANALYSIS 3-7
PULASKI COUNTY PUBLIC SERVICE AUTHORITY (A COMPONENT UNIT OF PULASKI COUNTY, VIRGINIA)
") PULASKI COUNTY PUBLIC SERVICE AUTHORITY (A COMPONENT UNIT OF PULASKI COUNTY, VIRGINIA) FINANCIAL REPORT YEAR ENDED JUNE 30, 2016 Pulaski County Public Service Authority (A Component Unit of Pulaski County,
PULASKI COUNTY PUBLIC SERVICE AUTHORITY (A COMPONENT UNIT OF PULASKI COUNTY, VIRGINIA) FINANCIAL REPORT YEAR ENDED JUNE 30, 2016 Pulaski County Public Service Authority (A Component Unit of Pulaski County,
CHARTER TOWNSHIP OF COMMERCE OAKLAND COUNTY, MICHIGAN FINANCIAL STATEMENTS FOR THE YEAR ENDED DECEMBER 31, 2016 AND INDEPENDENT AUDITORS REPORT
 OAKLAND COUNTY, MICHIGAN FINANCIAL STATEMENTS FOR THE YEAR ENDED DECEMBER 31, 2016 AND INDEPENDENT AUDITORS REPORT C O N T E N T S PAGE INDEPENDENT AUDITORS REPORT 1-2 MANAGEMENT'S DISCUSSION AND ANALYSIS
Marin Municipal Water District
 Marin Municipal Water District Corte Madera, California Basic Financial Statements And Independent Auditors Report For the years ended June 30, 2012 and 2011 Basic Financial Statements Table of Contents
Eagle River Water and Sanitation District Vail, Colorado. Financial Statements December 31, 2014
 Vail, Colorado Financial Statements Financial Statements Table of Contents Page INDEPENDENT AUDITOR S REPORT Management s Discussion and Analysis A1 A2 B1 B8 Basic Financial Statements: Statement of Net
SONOMA VALLEY COUNTY SANITATION DISTRICT (A Component Unit of the County of Sonoma)
") SONOMA VALLEY COUNTY SANITATION DISTRICT (A Component Unit of the County of Sonoma) Independent Auditors' Report, Management's Discussion and Analysis and Basic Financial Statements For the Fiscal Year
SONOMA VALLEY COUNTY SANITATION DISTRICT (A Component Unit of the County of Sonoma) Independent Auditors' Report, Management's Discussion and Analysis and Basic Financial Statements For the Fiscal Year
FINANCIAL STATEMENTS. For the years ended June 30, 2013 and 2012
 FINANCIAL STATEMENTS For the years ended June 30, 2013 and 2012 CONTENTS Page INDEPENDENT AUDITORS REPORT ON FINANCIAL STATEMENTS AND SUPPLEMENTAL INFORMATION 3-4 MANAGEMENT S DISCUSSION & ANALYSIS 5-10
VILLAGE OF GOLF, FLORIDA COMPREHENSIVE ANNUAL FINANCIAL REPORT FOR THE FISCAL YEAR ENDED SEPTEMBER 30, 2014
 VILLAGE OF GOLF, FLORIDA COMPREHENSIVE ANNUAL FINANCIAL REPORT FOR THE FISCAL YEAR ENDED SEPTEMBER 30, 2014 Prepared by: Finance Department VILLAGE OF GOLF, FLORIDA TABLE OF CONTENTS INTRODUCTORY SECTION
CITY OF SANGER, TEXAS
 FINANCIAL REPORT SEPTEMBER 30, 2010 C O N T E N T S INDEPENDENT AUDITOR S REPORT... 1 Page(s) MANAGEMENT S DISCUSSION AND ANALYSIS (UNAUDITED) 3-11 BASIC FINANCIAL STATEMENTS Government-wide Financial
TEXAS TREASURY SAFEKEEPING TRUST COMPANY (A Component Unit of the State of Texas) Basic Financial Statements. August 31, 2012
 Basic Financial Statements. August 31, 2012") (A Component Unit of the State of Texas) Basic Financial Statements (With Independent Auditors Report Thereon) Table of Contents Independent Auditors Report 1 Management s Discussion and Analysis 3 Basic
(A Component Unit of the State of Texas) Basic Financial Statements (With Independent Auditors Report Thereon) Table of Contents Independent Auditors Report 1 Management s Discussion and Analysis 3 Basic
TOWN OF SHARON FINANCIAL STATEMENTS AND SUPPLEMENTARY SCHEDULES. Year Ended June 30, 2011
 FINANCIAL STATEMENTS AND SUPPLEMENTARY SCHEDULES Year Ended June 30, 2011 BAUDE & ROLFE, P.C. CERTIFIED PUBLIC ACCOUNTANTS 35 Huntington Street New London, CT 06320 TABLE OF CONTENTS INDEPENDENT AUDITOR
City of Chicago Department of Water Management Water Fund Comprehensive Annual Financial Report For the Years Ended December 31, 2016 and 2015
 City of Chicago Department of Water Management Water Fund Comprehensive Annual Financial Report For the Years Ended December 31, 2016 and 2015 Rahm Emanuel, Mayor Carole L. Brown, Chief Financial Officer
CITY OF TWIN FALLS, IDAHO
 FINANCIAL STATEMENTS SEPTEMBER 30, 2008 FINANCIAL STATEMENTS TABLE OF CONTENTS INDEPENDENT AUDITOR'S REPORT 1-2 FINANCIAL STATEMENTS Government-Wide Financial Statements 3 Statement of Net Assets 4 Statement
Eagle River Water and Sanitation District Vail, Colorado. Financial Statements December 31, 2013
 Vail, Colorado Financial Statements Financial Statements Table of Contents Page INDEPENDENT AUDITOR S REPORT Management s Discussion and Analysis A1 A2 B1 B8 Basic Financial Statements: Statement of Net
METROPOLITAN SEWER DISTRICT OF GREATER CINCINNATI HAMILTON COUNTY TABLE OF CONTENTS. Independent Auditor s Report... 1
 METROPOLITAN SEWER DISTRICT OF GREATER CINCINNATI TABLE OF CONTENTS TITLE PAGE Independent Auditor s Report... 1 Prepared by Management: Management s Discussion and Analysis... 5 Basic Financial Statements:
Fountain Valley Authority (A Component Unit of the City of Colorado Springs, Colorado)
") (A Component Unit of the City of Colorado Springs, Colorado) Financial Statements and Report of Independent Certified Public Accountants (A Component Unit of the City of Colorado Springs, Colorado) Financial
(A Component Unit of the City of Colorado Springs, Colorado) Financial Statements and Report of Independent Certified Public Accountants (A Component Unit of the City of Colorado Springs, Colorado) Financial
BOULDER COUNTY HOUSING AUTHORITY Boulder, Colorado. FINANCIAL STATEMENTS December 31, 2011
 Boulder, Colorado FINANCIAL STATEMENTS December 31, 2011 Table of Contents Page Independent Auditor s Report Management s Discussion and Analysis i iii Basic Financial Statements Balance Sheet 1 Statement
CHEROKEE COUNTY WATER AND SEWERAGE AUTHORITY CHEROKEE COUNTY, GEORGIA FINANCIAL STATEMENTS FOR THE FISCAL YEAR ENDED AUGUST 31, 2017
 CHEROKEE COUNTY WATER AND SEWERAGE AUTHORITY CHEROKEE COUNTY, GEORGIA FINANCIAL STATEMENTS FOR THE FISCAL YEAR ENDED AUGUST 31, 2017 TOGETHER WITH INDEPENDENT AUDITORS REPORTS FINANCIAL STATEMENTS AUGUST
City of Del Rey Oaks. Annual Financial Report June 30, Chavan & Associates, LLP Certified Public Accountants
 City of Del Rey Oaks Annual Financial Report Chavan & Associates, LLP Certified Public Accountants www.cnallp.com Page Intentionally Left Blank Annual Financial Report For the year ended TABLE OF CONTENTS
BROWARD COUNTY, FLORIDA WATER AND WASTEWATER FUND A Major Fund of Broward County, Florida
 BROWARD COUNTY, FLORIDA WATER AND WASTEWATER FUND A Major Fund of Broward County, Florida Special Purpose Financial Statements Years Ended September 30, 2012 and 2011 BROWARD COUNTY, FLORIDA WATER AND
CHEROKEE COUNTY WATER AND SEWERAGE AUTHORITY FINANCIAL REPORT FOR THE FISCAL YEAR ENDING AUGUST 31, 2012
 CHEROKEE COUNTY WATER AND SEWERAGE AUTHORITY FINANCIAL REPORT FOR THE FISCAL YEAR ENDING AUGUST 31, 2012 CHEROKEE COUNTY WATER AND SEWERAGE AUTHORITY FINANCIAL REPORT FOR THE FISCAL YEAR ENDED AUGUST 31,
CITY OF ROSEBUD, TEXAS FINANCIAL STATEMENTS AS OF
 FINANCIAL STATEMENTS AS OF SEPTEMBER 30, 2013 TOGETHER WITH INDEPENDENT AUDITORS REPORT THEREON AND SUPPLEMENTARY INFORMATION Prepared by: Donald L. Allman, CPA Certified Public Accountant 205 E. University
SONOMA VALLEY COUNTY SANITATION DISTRICT (A Component Unit of the County of Sonoma) Independent Auditor s Reports, Management s Discussion and
 Independent Auditor s Reports, Management s Discussion and") . SONOMA VALLEY COUNTY SANITATION DISTRICT (A Component Unit of the County of Sonoma) Independent Auditor s Reports, Management s Discussion and Analysis and Basic Financial Statements For the Fiscal Year
. SONOMA VALLEY COUNTY SANITATION DISTRICT (A Component Unit of the County of Sonoma) Independent Auditor s Reports, Management s Discussion and Analysis and Basic Financial Statements For the Fiscal Year
Audited Financial Statements and Other Supplementary Information. Town of Jay, Maine. June 30, Proven Expertise and Integrity
 Audited Financial Statements and Other Supplementary Information Town of Jay, Maine June 30, 2014 Proven Expertise and Integrity CONTENTS JUNE 30, 2014 INDEPENDENT AUDITORS' REPORT 1-3 PAGE MANAGEMENT
TOWN OF PLAINFIELD, CONNECTICUT
 FINANCIAL REPORT JUNE 30, 2009 McGladrey & Pullen, LLP is a member firm of RSM International, an affiliation of separate and independent legal entities. COMPREHENSIVE ANNUAL FINANCIAL REPORT TABLE OF
CITY OF DETROIT WATER FUND. Basic Financial Statements and Required Supplementary Information. June 30, 2006 and 2005
 Basic Financial Statements and Required Supplementary Information (With Independent Auditors Report Thereon) Table of Contents Page(s) Independent Auditors Report 1 2 Basic Financial Statements: Statements
SAN CARLOS PARK FIRE PROTECTION AND RESCUE SERVICE DISTRICT FORT MYERS, FLORIDA FINANCIAL REPORT FOR THE FISCAL YEAR ENDED SEPTEMBER 30, 2016
 SAN CARLOS PARK FIRE PROTECTION AND RESCUE SERVICE DISTRICT FORT MYERS, FLORIDA FINANCIAL REPORT FOR THE FISCAL YEAR ENDED SEPTEMBER 30, 2016 SAN CARLOS PARK FIRE PROTECTION AND RESCUE SERVICE DISTRICT
CITY OF ANAHEIM WATER UTILITY FUND. Financial Statements. June 30, 2016 and (With Independent Auditors Report Thereon)
") Financial Statements (With Independent Auditors Report Thereon) Table of Contents Page Independent Auditors Report 1 Management s Discussion and Analysis (Unaudited) 3 Financial Statements: Statement of
Financial Statements (With Independent Auditors Report Thereon) Table of Contents Page Independent Auditors Report 1 Management s Discussion and Analysis (Unaudited) 3 Financial Statements: Statement of
Town of Ramapo, New York
 Financial Statements and Supplementary Information Year Ended December 31, 2014 Table of Contents Page No. Independent Auditors' Report Management's Discussion and Analysis Basic Financial Statements
Village of Eau Claire, Michigan. Financial Report with Supplemental Information February 29, 2016
 Financial Report with Supplemental Information February 29, 2016 Contents Report Letter 1-2 Management's Discussion and Analysis 3-7 Basic Financial Statements Government-wide Financial Statements: Statement
Basic Financial Statements
 2018 Basic Financial Statements For the Fiscal Year Ended June 30, 2018 San Diego, CA 4705 9/18 San Diego Association of Governments San Diego, California Basic Financial Statements and Independent Auditor
Solid Waste Management 2006 Financial Report
 Solid Waste Management 2006 Financial Report City of Tacoma Public Works Environmental Services Table of Contents Independent Auditor s Report... 2 Management s Discussion and Analysis... 4 Financial
AUGUSTA, GEORGIA UTILITIES AUGUSTA, GEORGIA FINANCIAL REPORT FOR THE YEARS ENDED DECEMBER 31, 2013 AND 2012
 FINANCIAL REPORT FOR THE YEARS ENDED DECEMBER 31, 2013 AND 2012 FINANCIAL REPORT FOR THE YEARS ENDED DECEMBER 31, 2013 AND 2012 TABLE OF CONTENTS Page INDEPENDENT AUDITOR S REPORT... 1-3 FINANCIAL STATEMENTS
CITY OF CLEVELAND, OHIO DEPARTMENT OF PUBLIC UTILITIES DIVISION OF WATER
 REPORT ON AUDITS OF FINANCIAL STATEMENTS For the years ended December 31, 2004 and 2003 TABLE OF CONTENTS Independent Accountants' Report... 1 Page Management s Discussion and Analysis... 3-15 Balance
Fresno, California FINANCIAL STATEMENTS. For the Year Ended June 30, 2017
 FINANCIAL STATEMENTS For the Year Ended TABLE OF CONTENTS Page Independent Auditor s Report... 1 Management s Discussion and Analysis... 3 Basic Financial Statements: Government-Wide Financial Statements:
TOWNS COUNTY WATER AND SEWERAGE AUTHORITY YOUNG HARRIS, GEORGIA FINANCIAL STATEMENTS AS OF JUNE 30, 2016 AND INDEPENDENT AUDITOR S REPORT
 TOWNS COUNTY WATER AND SEWERAGE AUTHORITY YOUNG HARRIS, GEORGIA FINANCIAL STATEMENTS AS OF JUNE 30, 2016 AND INDEPENDENT AUDITOR S REPORT TOWNS COUNTY WATER AND SEWERAGE AUTHORITY CONTENTS Financial Section
BROWARD COUNTY, FLORIDA WATER AND WASTEWATER FUND A Major Fund of Broward County, Florida
 BROWARD COUNTY, FLORIDA WATER AND WASTEWATER FUND A Major Fund of Broward County, Florida Financial Statements For the Years Ended BROWARD COUNTY, FLORIDA WATER AND WASTEWATER FUND FINANCIAL STATEMENTS
The City of Crystal City, Missouri. Financial Statements, Independent Auditor's Reports, and Supplementary Information.
 The City of Crystal City, Missouri Financial Statements, Independent Auditor's Reports, and Supplementary Information March 31, 2018 The City of Crystal City, Missouri Table of Contents Financial Section
PLATTE CANYON WATER AND SANITATION DISTRICT Arapahoe and Jefferson Counties, Colorado. FINANCIAL STATEMENTS For the Year Ended December 31, 2013
 Arapahoe and Jefferson Counties, Colorado FINANCIAL STATEMENTS For the Year Ended December 31, 2013 TABLE OF CONTENTS PAGE INDEPENDENT AUDITORS REPORT... I MANAGEMENT S DISCUSSION AND ANALYSIS....1 BASIC
TOWNSHIP OF LOWER MUNICIPAL UTILITIES AUTHORITY REPORT ON AUDIT OF FINANCIAL STATEMENTS YEARS ENDED NOVEMBER 30, 2013 AND 2012
 TOWNSHIP OF LOWER MUNICIPAL UTILITIES AUTHORITY REPORT ON AUDIT OF FINANCIAL STATEMENTS YEARS ENDED NOVEMBER 30, 2013 AND 2012 TABLE OF CONTENTS FINANCIAL SECTION Page Independent Auditor's Report 1-3
HARRIS COUNTY MUNICIPAL UTILITY DISTRICT NO. 238 HARRIS COUNTY, TEXAS ANNUAL AUDIT REPORT AUGUST 31, 2018
 HARRIS COUNTY MUNICIPAL UTILITY DISTRICT NO. 238 HARRIS COUNTY, TEXAS ANNUAL AUDIT REPORT AUGUST 31, 2018 C O N T E N T S INDEPENDENT AUDITOR S REPORT 1-2 MANAGEMENT S DISCUSSION AND ANALYSIS 3-8 BASIC
CITY OF FLORENCE, ALABAMA ELECTRICITY, GAS, AND WATER AND WASTEWATER DEPARTMENTS. FINANCIAL STATEMENTS JUNE 30, 2010 and 2009
 ELECTRICITY, GAS, AND WATER AND WASTEWATER DEPARTMENTS FINANCIAL STATEMENTS JUNE 30, 2010 and 2009 ELECTRICITY, GAS, AND WATER AND WASTEWATER DEPARTMENTS TABLE OF CONTENTS Independent Auditor s Report
Township of Algoma Kent County, Michigan FINANCIAL STATEMENTS Year ended March 31, 2018
 Kent County, Michigan FINANCIAL STATEMENTS Year ended March 31, 2018 CONTENTS Page INDEPENDENT AUDITOR S REPORT 3-4 MANAGEMENT S DISCUSSION AND ANALYSIS 5-11 BASIC FINANCIAL STATEMENTS Government-wide
TOWN OF NEW FAIRFIELD, CONNECTICUT. FINANCIAL REPORT June 30, 2012
 TOWN OF NEW FAIRFIELD, CONNECTICUT FINANCIAL REPORT June 30, 2012 FINANCIAL REPORT TABLE OF CONTENTS Page List of Principal Officials... i Independent Auditor s Report... 1-2 Management s Discussion and
City of Chicago, Illinois Water Fund
 City of Chicago, Illinois Water Fund Basic Financial Statements as of and for the Years Ended December 31, 2010 and 2009, Required Supplementary Information, Additional Information, Statistical Data, and
CITY OF FLORENCE, ALABAMA ELECTRICITY, GAS, AND WATER AND WASTEWATER DEPARTMENTS. FINANCIAL STATEMENTS JUNE 30, 2007 and 2006
 ELECTRICITY, GAS, AND WATER AND WASTEWATER DEPARTMENTS FINANCIAL STATEMENTS JUNE 30, 2007 and 2006 ELECTRICITY, GAS, AND WATER AND WASTEWATER DEPARTMENTS TABLE OF CONTENTS Independent Auditors Report 1
PENNRIDGE SCHOOL DISTRICT
 ANNUAL FINANCIAL REPORT Year Ended June 30, 2011 INTRODUCTORY SECTION TABLE OF CONTENTS Page No. INTRODUCTORY SECTION Table of Contents... 1 FINANCIAL SECTION Independent Auditors' Report... 3 Management's
CITY OF FRIENDSWOOD, TEXAS
 COMPREHENSIVE ANNUAL FINANCIAL REPORT YEAR ENDED SEPTEMBER 30, 2011 Officials Issuing Report: Roger C. Roecker City Manager Cindy S. Edge Director of Administrative Services COMPREHENSIVE ANNUAL FINANCIAL
BLOCK HOUSE MUNICIPAL UTILITY DISTRICT
 WILLIAMSON COUNTY, TEXAS ANNUAL FINANCIAL REPORT SEPTEMBER 30, 2015 McCALL GIBSON SWEDLUND BARFOOT PLLC Certified Public Accountants WILLIAMSON COUNTY, TEXAS ANNUAL FINANCIAL REPORT SEPTEMBER 30, 2015
FIRE DISTRICT NO. 6 TOWNSHIP OF GLOUCESTER, NEW JERSEY REPORT OF AUDIT FOR THE YEAR ENDED DECEMBER 31, 2016
 FIRE DISTRICT NO. 6 TOWNSHIP OF GLOUCESTER, NEW JERSEY REPORT OF AUDIT FOR THE YEAR ENDED DECEMBER 31, 2016 39256 FIRE DISTRICT NO. 6 TOWNSHIP OF GLOUCESTER, NEW JERSEY Table of Contents ROSTER OF OFFICIALS
CAMPBELL, RAPPOLD & YURASITS LLP Certified Public Accountants 1033 South Cedar Crest Boulevard Allentown, PA 18103
 NORTHAMPTON BOROUGH MUNICIPAL AUTHORITY - WATER PROJECT Financial Statements, Independent Auditor's Report and Supplementary Information March 31, 2017 and 2016 CAMPBELL, RAPPOLD & YURASITS LLP Certified
Village of Bolingbrook, Illinois
 Village of Bolingbrook, Illinois Annual Financial Report 0 Table of Contents PAGE INDEPENDENT AUDITOR S REPORT 1-3 BASIC FINANCIAL STATEMENTS Government-Wide Financial Statements Statement of Net Position
NORTHTOWN MUNICIPAL UTILITY DISTRICT
 NORTHTOWN MUNICIPAL UTILITY DISTRICT YEAR ENDED FINANCIAL STATEMENTS, SUPPLEMENTARY INFORMATION AND INDEPENDENT AUDITOR S REPORT NORTHTOWN MUNICIPAL UTILITY DISTRICT FINANCIAL STATEMENTS, SUPPLEMENTARY
FINANCIAL STATEMENTS. June 30, 2017 and 2016
 FINANCIAL STATEMENTS June 30, 2017 and 2016 CONTENTS Page INDEPENDENT AUDITORS' REPORT ON FINANCIAL STATEMENTS AND SUPPLEMENTAL INFORMATION 3-4 MANAGEMENT'S DISCUSSION AND ANALYSIS 5-11 FINANCIAL STATEMENTS
VILLAGE OF RICHMOND, ILLINOIS ANNUAL FINANCIAL REPORT
 VILLAGE OF RICHMOND, ILLINOIS ANNUAL FINANCIAL REPORT FOR THE FISCAL YEAR ENDED APRIL 30, 2015 VILLAGE OF RICHMOND TABLE OF CONTENTS APRIL 30, 2015 PAGE INDEPENDENT AUDITOR S REPORT 1 REQUIRED SUPPLEMENTARY
MUSTANG SPECIAL UTILITY DISTRICT
 MUSTANG SPECIAL UTILITY DISTRICT of Denton County, Texas COMPREHENSIVE ANNUAL FINANCIAL REPORT FOR THE FISCAL YEAR ENDED SEPTEMBER 30, 2016 General Manager Chris Boyd Finance Director Patty Parks MUSTANG
SUFFOLK COUNTY WATER AUTHORITY. Financial Statements and Required Supplementary Information. May 31, 2017 and 2016
 Financial Statements and Required Supplementary Information (With Independent Auditors Reports Thereon) Table of Contents Independent Auditors Report 1 Management s Discussion and Analysis (Unaudited)
CITY OF SAN JUAN, TX ANNUAL FINANCIAL REPORT FOR THE YEAR ENDED SEPTEMBER 30, 2011 TABLE OF CONTENTS
 Exhibit CITY OF SAN JUAN, TX ANNUAL FINANCIAL REPORT FOR THE YEAR ENDED SEPTEMBER 30, 2011 TABLE OF CONTENTS Page Independent Auditors' Report 2 Management's Discussion and Analysis 4 Basic Financial Statements
ARTESIA SPECIAL HOSPITAL DISTRICT EDDY COUNTY, NEW MEXICO FINANCIAL STATEMENTS
 ARTESIA SPECIAL HOSPITAL DISTRICT EDDY COUNTY, NEW MEXICO FINANCIAL STATEMENTS AS OF JUNE 30, 2010 AND 2009 (This page intentionally left blank) 2 INTRODUCTORY SECTION 3 (This page intentionally left blank)
Bailey, Hodshire & Company, P.C. CERTIFIED PUBLIC ACCOUNTANTS
 Bailey, Hodshire & Company, P.C. CERTIFIED PUBLIC ACCOUNTANTS 479 E. CHICAGO STREET PHONE: (517) 849-2410 P.O. BOX 215 FAX: (517) 849-2493 JONESVILLE, MI 49250 E-MAIL: baileyhodshire@sbcglobal.net INDEPENDENT
CITY OF CARSON CITY, MICHIGAN
 , MICHIGAN FINANCIAL STATEMENTS Vredeveld Haefner LLC CPAs and Consultants TABLE OF CONTENTS FINANCIAL SECTION PAGE Independent Auditors Report 1-2 Management s Discussion and Analysis 3-8 Basic Financial
ANNUAL FINANCIAL REPORT. of the CITY OF PINEY POINT VILLAGE, Toms. For the Year Ended December 31, 2010
 ANNUAL FINANCIAL REPORT of the CITY OF PINEY POINT VILLAGE, Toms For the Year Ended December 31, 2010 (This page intentionally left blank.) CITY OF PINEY POINT VILLAGE, TEXAS TABLE OF CONTENTS December
Reading Area Water Authority A Component Unit of the City of Reading. Financial Statements
 Financial Statements Table of Contents Page INDEPENDENT AUDITOR'S REPORT 1 and 2 MANAGEMENT'S DISCUSSION AND ANALYSIS 3 to 8 FINANCIAL STATEMENTS Statement of Net Position 9 Statement of Revenues, Expenses
INDEPENDENT AUDITORS REPORT 1 MANAGEMENT S DISCUSSION AND ANALYSIS Statements of Net Assets 11
 University of Idaho Financial Statements for the Years Ended June 30, 2003 and 2002 and Independent Auditors Report Including Single Audit Reports for the Year Ended June 30, 2003 UNIVERSITY OF IDAHO TABLE
MADISON METROPOLITAN SEWERAGE DISTRICT Madison, Wisconsin. FINANCIAL STATEMENTS December 31, 2015 and 2014
 MADISON METROPOLITAN SEWERAGE DISTRICT Madison, Wisconsin FINANCIAL STATEMENTS TABLE OF CONTENTS PAGE INDEPENDENT AUDITOR S REPORT... 1 MANAGEMENT S DISCUSSION AND ANALYSIS... 3 BASIC FINANCIAL STATEMENTS
CITY OF PATASKALA LICKING COUNTY REGULAR AUDIT
 CITY OF PATASKALA LICKING COUNTY REGULAR AUDIT YEAR ENDED DECEMBER 31, 1999 CITY OF PATASKALA LICKING COUNTY TABLE OF CONTENTS TITLE PAGE Report of Independent Accountants... 1 General Purpose Financial
RIVIERA BEACH COMMUNITY REDEVELOPMENT AGENCY (A Component Unit of the City of Riviera Beach, Florida)
") RIVIERA BEACH COMMUNITY REDEVELOPMENT AGENCY Audited Financial Statements Fiscal year ended September 30, 2017 HCT Certified Public Accountants & Consultants, LLC 3816 Hollywood Boulevard, Suite 203 Hollywood,
RIVIERA BEACH COMMUNITY REDEVELOPMENT AGENCY Audited Financial Statements Fiscal year ended September 30, 2017 HCT Certified Public Accountants & Consultants, LLC 3816 Hollywood Boulevard, Suite 203 Hollywood,
New Hanover County Airport Authority A Component Unit of New Hanover County. Financial Statements and Compliance Year Ended June 30, 2018
 New Hanover County Airport Authority A Component Unit of New Hanover County Financial Statements and Compliance Year Ended June 30, 2018 Contents Financial section Independent auditors report 1-3 Management
Town of Harrison, Maine
 Audited Financial Statements and Other Financial Information Town of Harrison, Maine June 30, 2018 Proven Expertise and Integrity CONTENTS PAGE INDEPENDENT AUDITORS' REPORT 1-3 MANAGEMENT S DISCUSSION
City of Diboll, Texas
 ANNUAL FINANCIAL REPORT of the For the Year Ended (This page intentionally left blank.) TABLE OF CONTENTS FINANCIAL SECTION Independent Auditor s Report 1 Management s Discussion and Analysis 7 Basic Financial
CHEROKEE COUNTY WATER AND SEWERAGE AUTHORITY CHEROKEE COUNTY, GEORGIA FINANCIAL STATEMENTS FOR THE FISCAL YEAR ENDED AUGUST 31, 2016
 CHEROKEE COUNTY WATER AND SEWERAGE AUTHORITY CHEROKEE COUNTY, GEORGIA FINANCIAL STATEMENTS FOR THE FISCAL YEAR ENDED AUGUST 31, 2016 TOGETHER WITH INDEPENDENT AUDITORS REPORTS FINANCIAL STATEMENTS AUGUST
CITY OF MIDDLESBORO, KENTUCKY. BASIC FINANCIAL STATEMENTS AND SUPPLEMENTARY INFORMATION YEAR ENDED JUNE 30, 2015 with REPORT ON INDEPENDENT AUDITORS
 CITY OF MIDDLESBORO, KENTUCKY BASIC FINANCIAL STATEMENTS AND SUPPLEMENTARY INFORMATION YEAR ENDED JUNE 30, 2015 with REPORT ON INDEPENDENT AUDITORS CONTENTS Independent Auditor's Report... 1 Management's
Town of Chelsea, Maine
 Audited Financial Statements Town of Chelsea, Maine June 30, 2016 Proven Expertise and Integrity CONTENTS JUNE 30, 2016 PAGE INDEPENDENT AUDITORS' REPORT 1-3 MANAGEMENT S DISCUSSION AND ANALYSIS 4-11 BASIC
Parking Authority of the City of Paterson, NJ
 Parking Authority of the City of Paterson, NJ Financial Statements Years Ended Parking Authority of the City of Paterson, NJ Table of Contents PAGE Management's Discussion and Analysis 1 Independent Auditors'
TEXAS LOTTERY COMMISSION TABLE OF CONTENTS
 TEXAS LOTTERY COMMISSION TABLE OF CONTENTS Page No. Letter of Transmittal... 1 FINANCIAL SECTION Independent Auditor s Report... 4 Management s Discussion and Analysis... 7 Basic Financial Statements:
Village of Suffern, New York
 Financial Statements and Supplementary Information Year Ended May 31, 2015 Table of Contents Independent Auditors' Report Management's Discussion and Analysis Basic Financial Statements Government-Wide
CITY OF CLEVELAND, OHIO DEPARTMENT OF PUBLIC UTILITIES DIVISION OF WATER
 REPORT ON AUDITS OF FINANCIAL STATEMENTS For the years ended December 31, 2007 and 2006 TABLE OF CONTENTS Independent Accountants' Report... 1-2 Page Management s Discussion and Analysis... 3-13 Balance
MONROE COUNTY WATER AUTHORITY (A Discretely Presented Component Unit of the County of Monroe, New York)
") MONROE COUNTY WATER AUTHORITY (A Discretely Presented Component Unit of the County of Monroe, New York) Financial Statements as of December 31, 2017 Together with Independent Auditor s Report MONROE COUNTY
MONROE COUNTY WATER AUTHORITY (A Discretely Presented Component Unit of the County of Monroe, New York) Financial Statements as of December 31, 2017 Together with Independent Auditor s Report MONROE COUNTY
CITY OF BARRETT. Financial Statements. For the Year Ended December 31, 2010
 Financial Statements For the Year Ended December 31, 2010 Table of Contents Page SECTION I - INTRODUCTION SECTION City Council 1 SECTION II - FINANCIAL SECTION INDEPENDENT AUDITOR S REPORT 2 REQUIRED SUPPLEMENTARY
TATUM INDEPENDENT SCHOOL DISTRICT
 TATUM INDEPENDENT SCHOOL DISTRICT ANNUAL FINANCIAL REPORT FOR THE YEAR ENDED AUGUST 31, 2017 Tatum Independent School District Annual Financial Report For The Year Ended August 31, 2017 TABLE OF CONTENTS
STATE OF NEW MEXICO EL VALLE DE LOS RANCHOS WATER & SANITATION DISTRICT ANNUAL FINANCIAL REPORT JUNE 30, 2016
 STATE OF NEW MEXICO EL VALLE DE LOS RANCHOS WATER & SANITATION DISTRICT ANNUAL FINANCIAL REPORT JUNE 30, 2016 (This page intentionally left blank.) INTRODUCTORY SECTION (This page intentionally left blank.)
VILLAGE OF WEST BARABOO, WISCONSIN FINANCIAL STATEMENTS WITH INDEPENDENT AUDITOR'S REPORT. Year Ended December 31, 2011
 FINANCIAL STATEMENTS WITH INDEPENDENT AUDITOR'S REPORT Year Ended December 31, 2011 Johnson Block & Company, Inc. Certified Public Accountants 1315 Bad Axe Court; P.O. Box 271 Viroqua, Wisconsin 54665
CITY OF RICE, MINNESOTA AUDITED FINANCIAL STATEMENTS DECEMBER 31, 2017
 AUDITED FINANCIAL STATEMENTS SCHLENNER WENNER & CO. Certified Public Accountants & Business Consultants TABLE OF CONTENTS INTRODUCTORY SECTION: CITY COUNCIL AND OFFICIALS... 1 FINANCIAL SECTION: INDEPENDENT
Texas Treasury Safekeeping Trust Company (A Component Unit of the State of Texas) Basic Financial Statements August 31, 2017
 Basic Financial Statements August 31, 2017") Texas Treasury Safekeeping Trust Company (A Component Unit of the State of Texas) Basic Financial Statements Contents Independent Auditor s Report 1-2 Management s Discussion and Analysis 3-6 Basic Financial
Texas Treasury Safekeeping Trust Company (A Component Unit of the State of Texas) Basic Financial Statements Contents Independent Auditor s Report 1-2 Management s Discussion and Analysis 3-6 Basic Financial
(This page intentionally left blank.)
") (This page intentionally left blank.) ANNUAL FINANCIAL REPORT of the For the Year Ended (This page intentionally left blank.) TABLE OF CONTENTS FINANCIAL SECTION Independent Auditor s Report 1 Management
(This page intentionally left blank.) ANNUAL FINANCIAL REPORT of the For the Year Ended (This page intentionally left blank.) TABLE OF CONTENTS FINANCIAL SECTION Independent Auditor s Report 1 Management
HARRIS COUNTY WATER CONTROL AND IMPROVEMENT DISTRICT NO. 50
 HARRIS COUNTY, TEXAS ANNUAL FINANCIAL REPORT JUNE 30, 2016 McCALL GIBSON SWEDLUND BARFOOT PLLC Certified Public Accountants HARRIS COUNTY, TEXAS ANNUAL FINANCIAL REPORT JUNE 30, 2016 T A B L E O F C
GALVESTON COUNTY WATER CONTROL AND IMPROVEMENT DISTRICT NO. 1
 GALVESTON COUNTY, TEXAS ANNUAL FINANCIAL REPORT SEPTEMBER 30, 2017 McCALL GIBSON SWEDLUND BARFOOT PLLC Certified Public Accountants GALVESTON COUNTY, TEXAS ANNUAL FINANCIAL REPORT SEPTEMBER 30, 2017 T
WEST BAY SANITARY DISTRICT FINANCIAL STATEMENTS AND INDEPENDENT AUDITOR S REPORT JUNE 30, 2015 * * *
 WEST BAY SANITARY DISTRICT FINANCIAL STATEMENTS AND INDEPENDENT AUDITOR S REPORT JUNE 30, 2015 * * * CHAVAN & ASSOCIATES LLP CERTIFIED PUBLIC ACCOUNTANTS 1475 SARATOGA AVE, SUITE 180 SAN JOSE, CA 95129
Texas Treasury Safekeeping Trust Company (A Component Unit of the State of Texas) Basic Financial Statements. August 31, 2014
 Basic Financial Statements. August 31, 2014") (A Component Unit of the State of Texas) Basic Financial Statements Table of Contents Independent Auditor s Report 1 Management s Discussion and Analysis 4 Basic Financial Statements Statement of Net Position
(A Component Unit of the State of Texas) Basic Financial Statements Table of Contents Independent Auditor s Report 1 Management s Discussion and Analysis 4 Basic Financial Statements Statement of Net Position
FORT BEND COUNTY MUNICIPAL UTILITY DISTRICT NO. 128 FORT BEND COUNTY, TEXAS FINANCIAL REPORT. July 31, 2018
 FORT BEND COUNTY MUNICIPAL UTILITY DISTRICT NO. 128 FORT BEND COUNTY, TEXAS FINANCIAL REPORT Table of Contents Schedule Page Independent Auditors Report 1 Management s Discussion and Analysis 5 BASIC
CITY OF MIDDLESBORO, KENTUCKY. BASIC FINANCIAL STATEMENTS AND SUPPLEMENTARY INFORMATION YEAR ENDED JUNE 30, 2014 with REPORT ON INDEPENDENT AUDITORS
 CITY OF MIDDLESBORO, KENTUCKY BASIC FINANCIAL STATEMENTS AND SUPPLEMENTARY INFORMATION YEAR ENDED JUNE 30, 2014 with REPORT ON INDEPENDENT AUDITORS CONTENTS Independent Auditor's Report... 1 Management's
CITY OF AVENAL CALIFORNIA
 CALIFORNIA FINANCIAL STATEMENTS FOR THE YEAR ENDED JUNE 30, 2014 JUNE 30, 2014 TABLE OF CONTENTS INDEPENDENT AUDITOR S REPORT...1 BASIC FINANCIAL STATEMENTS: Government-Wide Financial Statements: Statement
HARRIS COUNTY WATER CONTROL AND IMPROVEMENT DISTRICT NO. 96
 HARRIS COUNTY, TEXAS ANNUAL FINANCIAL REPORT JULY 31, 2018 McCALL GIBSON SWEDLUND BARFOOT PLLC Certified Public Accountants HARRIS COUNTY, TEXAS ANNUAL FINANCIAL REPORT JULY 31, 2018 T A B L E O F C