Why we need an Economic Plan B
|
|
|
- Tracy Bishop
- 5 years ago
- Views:
Transcription

1 Why we need an Economic Plan B (and what it might look like) NERI Research Seminar, 25 April, 2012 Tom Healy Director Nevin Economic Research Institute Dublin Tom.healy@nerinstitute.ie
 Economic Plan B spearheaded by EU States with fiscal space We need such a Plan very soon to begin to reverse the current")
2 Key Points Confronted with a major crisis of unemployment and therefore social cohesion across Europe Fiscal Austerity is not working We need a European (and Irish) Economic Plan B spearheaded by EU States with fiscal space We need such a Plan very soon to begin to reverse the current disastrous path

3 Plan A Reduce wage share of total income Reduce the size of Government Liberalise labour & product markets Re-structure welfare Incentivise work Privitise remaining public enterprises
4 Stabilising (GDP)?
5 Domestic Demand Q12007Q22007Q32007Q42008Q12008Q22008Q32008Q42009Q12009Q22009Q32009Q42010Q12010Q22010Q32010Q42011Q12011Q22011Q32011Q4

6 Seanfhocal
7 change in real gdp Austerity regression line 10.0% 5.0% 0.0% -3.0% -2.0% -1.0% 0.0% 1.0% 2.0% 3.0% 4.0% Gre Latv Ire -5.0% -10.0% -15.0% -20.0% change real gdp Lith Slova Mal Ger FR <- change in govt consumption % initial real GDP ->
8 15% Components of growth in real GDP (% points) 10% 5% 0% External Demand Domestic Demand -5% -10% -15%
9 Youth Unemployment Jan 12 Indicator 2.2 Quarterly Economic Facts Spain Greece ** Slovakia Portugal Lithuania * Italy Latvia *** Rep Ireland Bulgaria Poland Hungary Cyprus * Estonia * Romania *** France United King * EU 27 Sweden EU 15 Belgium Finland Czech Republic Slovenia * Denmark Luxembourg Malta Netherlands Austria Germany * Dec2011 ** Nov 2011 ***Sep 2011

10 Medium-Term Expenditure Reductions (CER, Dec 2011) Total Current Capital Total

11 The Future of the Public Capital Programme We believe it is economic nonsense, when unemployment is so high and private investment has collapsed, to cut back on productive public investment. We cannot keep chasing the economy down by simply focusing on raised taxes/decreased Government spending.
12 While revenue raising measures will play an important role, the need to reduce expenditure is an inescapable reality (CER, page 7)
13 Plan A: Trends in govt. spend & Revenue % GDP '01 '02 '03 '04 '05 '06 '07 '08 '09 ' EU27 Exp IE Exp EU27 Rev IE Rev
14 Plan B: Trends in govt. spend & revenue % GDP '01 '02 '03 '04 '05 '06 '07 '08 '09 ' EU27 Exp IE Exp EU27 Rev IE Rev
15 Plan A: Trends in govt. spend & Revenue % GDP '01 '02 '03 '04 '05 '06 '07 '08 '09 ' EU27 Exp IE Exp EU27 Rev IE Rev
16 Plan A: Total Govt Spend % GDP 2017 Finland France Denmark Belgium Belgium Italy Austria Hungary Netherlands Sweden Slovenia Germany Portugal Luxembourg Cyprus Poland Greece Spain Malta UK Estonia Slovak Ireland Bulgaria Romania Lithuania Latvia
17 Plan B: Total Govt Spend % GDP 2017 Finland France Denmark Belgium Belgium Italy Austria Hungary Netherlands Sweden Slovenia Ireland Germany Portugal Luxembourg Cyprus Poland Greece Spain Malta UK Estonia Slovak Bulgaria Romania Lithuania Latvia

18 Plan A: Total Govt Revenue % GDP 2011 Denmark Finland Hungary Sweden France Belgium Austria Italy Netherl EU 17 Portugal Germany EU 27 Slovenia Luxemb Cyprus Greece United King Czech Rep Malta Estonia Poland Ireland Latvia Spain Bulgaria Slovakia Romania Lithuania

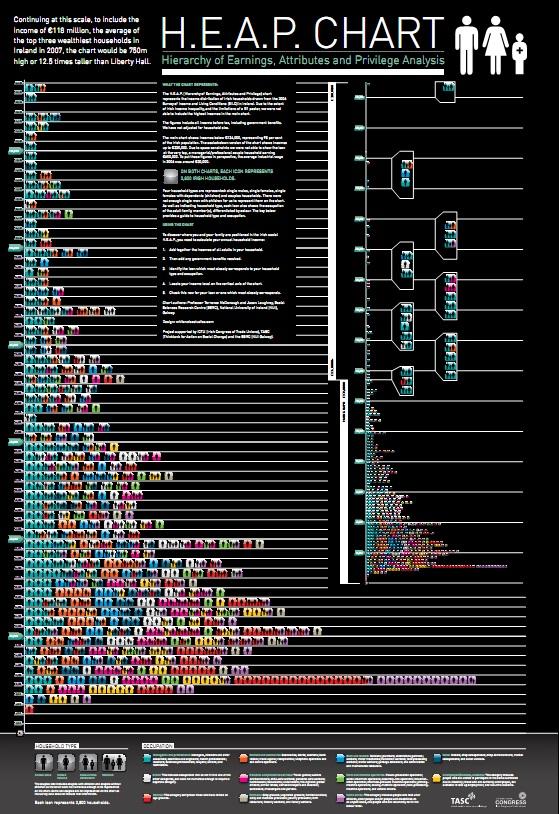
19 Who can pay?
20 20
21
22 Towards a 0.5% structural deficit? Total Deficit Structural Deficit Further fiscal consolidation

23 General Government Deficit % GDP 2011 Estonia Cyclical Structural Luxembourg Finland Germany Malta Austria Belgium Italy Netherlands EA-17 Slovenia Portugal France Slovakia Spain Cyprus Greece Ireland
24 Plan B what might it look like? Part 1 do no further harm thru more cuts in public spending Part 2 Investment in social and economic infrastructure Green New Deal Part 3a Afflict the comfortable - rebalance taxation towards unproductive wealth and high income inc FAT tax

25 Plan B what might it look like? Part 3b Comfort the afflicted - protect low pay/low income groups/young people Part 4 Seek orderly, negotiated debt write-downs private and socialised private debt Part 5 Reform private and public sectors Part 6 Grow indigenous, exporting firms in key sectors Part 7 Reform Banking
26 Plan B Strand 2 INVEST IN INFRASTRUCTURE We believe that the economic crisis provides us with a unique opportunity to invest in Ireland s strategic infrastructure. There is huge spare capacity in the economy, with a large pool of skilled and un-skilled unemployed workers.
27 NPRF & Commercial Semi-State Private sources (inc pensions) + + European Investment Bank 5 billion 5 billion 5 billion
28 NPRF & Commercial Semi-State Private sources (inc. pensions) + + European Investment Bank 5 billion 5 billion 5 billion 15 billion Investment Fund
29 NPRF & Commercial Semi-State Private sources (inc pensions) + + European Investment Bank 5 billion 5 billion 5 billion 15 billion Investment Fund Water Broadband Energy Early Childhood Retrofitting
30 15 billion Investment Fund bn bn bn bn bn
31 Plan A: Investment % GDP in 2017 Romania Latvia Slovak Estonia Bulgaria Poland Austria Lithuania Belgium Belgium Luxembourg France Slovenia Sweden Finland Netherlands Spain Italy Hungary Germany UK Greece Portugal Denmark Cyprus Malta Ireland
32 Would it be possible to imagine in 2022? Fundamental human rights cultural, economic and social are respected in both jurisdictions of the island? Some measure of lost economic sovereignty is restored following the ignominious events of Autumn 2010? That sovereignty is shared in a renewed European project based on stronger economic integration and democratic governance? Both parts of the island of Ireland take their place along with Britain and other Northern European States as an example of a social market economy based on the principles of freedom and human solidarity consistent with the aspirations of the Democratic Programme of the first Dáil?

33 Ar scáth a chéile a mhaireann pobal na heorpa
34
EU-28 RECOVERED PAPER STATISTICS. Mr. Giampiero MAGNAGHI On behalf of EuRIC
 EU-28 RECOVERED PAPER STATISTICS Mr. Giampiero MAGNAGHI On behalf of EuRIC CONTENTS EU-28 Paper and Board: Consumption and Production EU-28 Recovered Paper: Effective Consumption and Collection EU-28 -
EU BUDGET AND NATIONAL BUDGETS
 DIRECTORATE GENERAL FOR INTERNAL POLICIES POLICY DEPARTMENT ON BUDGETARY AFFAIRS EU BUDGET AND NATIONAL BUDGETS 1999-2009 October 2010 INDEX Foreward 3 Table 1. EU and National budgets 1999-2009; EU-27
EMPLOYMENT RATE Employed/Working age population (15-64 years)
") 1 EMPLOYMENT RATE 1980-2003 Employed/Working age population (15-64 years 80 % Finland (Com 75 70 65 60 EU-15 Finland (Stat. Fin. 55 50 80 82 84 86 88 90 92 94 96 98 00 02 9.9.2002/SAK /TL Source: European
1 EMPLOYMENT RATE 1980-2003 Employed/Working age population (15-64 years 80 % Finland (Com 75 70 65 60 EU-15 Finland (Stat. Fin. 55 50 80 82 84 86 88 90 92 94 96 98 00 02 9.9.2002/SAK /TL Source: European
EMPLOYMENT RATE IN EU-COUNTRIES 2000 Employed/Working age population (15-64 years)
") EMPLOYMENT RATE IN EU-COUNTRIES 2 Employed/Working age population (15-64 years EU-15 Denmark Netherlands Great Britain Sweden Portugal Finland Austria Germany Ireland Luxembourg France Belgium Greece Spain
EMPLOYMENT RATE IN EU-COUNTRIES 2 Employed/Working age population (15-64 years EU-15 Denmark Netherlands Great Britain Sweden Portugal Finland Austria Germany Ireland Luxembourg France Belgium Greece Spain
Live Long and Prosper? Demographic Change and Europe s Pensions Crisis. Dr. Jochen Pimpertz Brussels, 10 November 2015
 Live Long and Prosper? Demographic Change and Europe s Pensions Crisis Dr. Jochen Pimpertz Brussels, 10 November 2015 Old-age-dependency ratio, EU28 45,9 49,4 50,2 39,0 27,5 31,8 2013 2020 2030 2040 2050
European Advertising Business Climate Index Q4 2016/Q #AdIndex2017
 European Advertising Business Climate Index Q4 216/Q1 217 ABOUT Quarterly survey of European advertising and market research companies Provides information about: managers assessment of their business
EMPLOYMENT RATE Employed/Working age population (15 64 years)
") EMPLOYMENT RATE 198 26 Employed/Working age population (15 64 years 8 % Finland 75 EU 15 EU 25 7 65 6 55 5 8 82 84 86 88 9 92 94 96 98 2 4** 6** 14.4.25/SAK /TL Source: European Commission 1 UNEMPLOYMENT
EMPLOYMENT RATE 198 26 Employed/Working age population (15 64 years 8 % Finland 75 EU 15 EU 25 7 65 6 55 5 8 82 84 86 88 9 92 94 96 98 2 4** 6** 14.4.25/SAK /TL Source: European Commission 1 UNEMPLOYMENT
Youth Integration into the labour market Barcelona, July 2011 Jan Hendeliowitz Director, Employment Region Copenhagen & Zealand Ministry of
 Youth Integration into the labour market Barcelona, July 2011 Jan Hendeliowitz Director, Employment Region Copenhagen & Zealand Ministry of Employment, Denmark Chair of the OECD-LEED Directing Committee
REPORT FROM THE COMMISSION TO THE EUROPEAN PARLIAMENT, THE COUNCIL, THE EUROPEAN ECONOMIC AND SOCIAL COMMITTEE AND THE COMMITTEE OF THE REGIONS
 EUROPEAN COMMISSION Brussels,.4.29 COM(28) 86 final/ 2 ANNEXES to 3 ANNEX to the REPORT FROM THE COMMISSION TO THE EUROPEAN PARLIAMENT, THE COUNCIL, THE EUROPEAN ECONOMIC AND SOCIAL COMMITTEE AND THE COMMITTEE
EUROPA - Press Releases - Taxation trends in the European Union EU27 tax...of GDP in 2008 Steady decline in top corporate income tax rate since 2000
 DG TAXUD STAT/10/95 28 June 2010 Taxation trends in the European Union EU27 tax ratio fell to 39.3% of GDP in 2008 Steady decline in top corporate income tax rate since 2000 The overall tax-to-gdp ratio1
Fiscal rules in Lithuania
 Fiscal rules in Lithuania Algimantas Rimkūnas Vice Minister, Ministry of Finance of Lithuania 3 June, 2016 Evolution of National and EU Fiscal Regulations Stability and Growth Pact (SGP) Maastricht Treaty
DG TAXUD. STAT/11/100 1 July 2011
 DG TAXUD STAT/11/100 1 July 2011 Taxation trends in the European Union Recession drove EU27 overall tax revenue down to 38.4% of GDP in 2009 Half of the Member States hiked the standard rate of VAT since
January 2010 Euro area unemployment rate at 9.9% EU27 at 9.5%
 STAT//29 1 March 20 January 20 Euro area unemployment rate at 9.9% EU27 at 9.5% The euro area 1 (EA16) seasonally-adjusted 2 unemployment rate 3 was 9.9% in January 20, the same as in December 2009 4.
First estimate for 2011 Euro area external trade deficit 7.7 bn euro bn euro deficit for EU27
 27/2012-15 February 2012 First estimate for 2011 Euro area external trade deficit 7.7 152.8 deficit for EU27 The first estimate for the euro area 1 (EA17) trade in goods balance with the rest of the world
Consumer Credit. Introduction. June, the 6th (2013)
") Consumer Credit in Europe at end-2012 Introduction Crédit Agricole Consumer Finance has published its annual survey of the consumer credit market in 27 European Union countries (EU-27) for the sixth year
Consumer Credit in Europe at end-2012 Introduction Crédit Agricole Consumer Finance has published its annual survey of the consumer credit market in 27 European Union countries (EU-27) for the sixth year
May 2012 Euro area international trade in goods surplus of 6.9 bn euro 3.8 bn euro deficit for EU27
 108/2012-16 July 2012 May 2012 Euro area international trade in goods surplus of 6.9 3.8 deficit for EU27 The first estimate for the euro area 1 (EA17) trade in goods balance with the rest of the world
Approach to Employment Injury (EI) compensation benefits in the EU and OECD
 compensation benefits in the EU and OECD") Approach to (EI) compensation benefits in the EU and OECD The benefits of protection can be divided in three main groups. The cash benefits include disability pensions, survivor's pensions and other short-
Approach to (EI) compensation benefits in the EU and OECD The benefits of protection can be divided in three main groups. The cash benefits include disability pensions, survivor's pensions and other short-
June 2014 Euro area international trade in goods surplus 16.8 bn 2.9 bn surplus for EU28
 127/2014-18 August 2014 June 2014 Euro area international trade in goods surplus 16.8 bn 2.9 bn surplus for EU28 The first estimate for the euro area 1 (EA18) trade in goods balance with the rest of the
June 2012 Euro area international trade in goods surplus of 14.9 bn euro 0.4 bn euro surplus for EU27
 121/2012-17 August 2012 June 2012 Euro area international trade in goods surplus of 14.9 0.4 surplus for EU27 The first estimate for the euro area 1 (EA17) trade in goods balance with the rest of the world
January 2014 Euro area international trade in goods surplus 0.9 bn euro 13.0 bn euro deficit for EU28
 STAT/14/41 18 March 2014 January 2014 Euro area international trade in goods surplus 0.9 13.0 deficit for EU28 The first estimate for the euro area 1 (EA18) trade in goods balance with the rest of the
JOINT STATEMENT. The representatives of the governments of the Member States, meeting within the Council of
 JOINT STATEMENT The representatives of the governments of the Member States, meeting within the Council of the EU, and The Swiss Federal Council, Have drawn up the following Joint Statement on company
Macroeconomic overview SEE and Macedonia
 Macroeconomic overview SEE and Macedonia Zoltan Arokszallasi Chief Analyst, Macro & FX/FI Research Erste Group Bank Erste Investors Breakfast, 29 September, Skopje 02. Oktober SEE shows mixed performance
2017 Figures summary 1
 Annual Press Conference on January 18 th 2018 EIB Group Results 2017 2017 Figures summary 1 European Investment Bank (EIB) financing EUR 69.88 billion signed European Investment Fund (EIF) financing EUR
Growth, competitiveness and jobs: priorities for the European Semester 2013 Presentation of J.M. Barroso,
 Growth, competitiveness and jobs: priorities for the European Semester 213 Presentation of J.M. Barroso, President of the European Commission, to the European Council of 14-1 March 213 Economic recovery
October 2010 Euro area unemployment rate at 10.1% EU27 at 9.6%
 STAT//180 30 November 20 October 20 Euro area unemployment rate at.1% EU27 at 9.6% The euro area 1 (EA16) seasonally-adjusted 2 unemployment rate 3 was.1% in October 20, compared with.0% in September 4.
Lowest implicit tax rates on labour in Malta, on consumption in Spain and on capital in Lithuania
 STAT/13/68 29 April 2013 Taxation trends in the European Union The overall tax-to-gdp ratio in the EU27 up to 38.8% of GDP in 2011 Labour taxes remain major source of tax revenue The overall tax-to-gdp
Spain France. England Netherlands. Wales Ukraine. Republic of Ireland Czech Republic. Romania Albania. Serbia Israel. FYR Macedonia Latvia
 Germany Belgium Portugal Spain France Switzerland Italy England Netherlands Iceland Poland Croatia Slovakia Russia Austria Wales Ukraine Sweden Bosnia-Herzegovina Republic of Ireland Czech Republic Turkey
Second estimate for the third quarter of 2008 EU27 current account deficit 39.5 bn euro 19.3 bn euro surplus on trade in services
 STAT/09/12 22 January 2009 Second estimate for the third quarter of 20 EU27 current account deficit 39.5 bn euro 19.3 bn euro surplus on trade in According to the latest revisions1, the EU272 external
NOTE. for the Interparliamentary Meeting of the Committee on Budgets
 NOTE for the Interparliamentary Meeting of the Committee on Budgets THE ROLE OF THE EU BUDGET TO SUPPORT MEMBER STATES IN ACHIEVING THEIR ECONOMIC OBJECTIVES AS AGREED WITHIN THE FRAMEWORK OF THE EUROPEAN
Measuring financial protection: an approach for the WHO European Region
 Division of Health Systems and Public Health WHO Regional Office for Europe Measuring financial protection: an approach for the WHO European Region Jon Cylus WHO Barcelona Office for Health Systems Strengthening
Communication on the future of the CAP
 Communication on the future of the CAP The CAP towards 2020: meeting the food, natural resources and territorial challenges of the future Tassos Haniotis, Director Agricultural Policy Analysis and Perspectives
CANADA EUROPEAN UNION
 THE EUROPEAN UNION S PROFILE Economic Indicators Gross domestic product (GDP) at purchasing power parity (PPP): US$20.3 trillion (2016) GDP per capita at PPP: US$39,600 (2016) Population: 511.5 million
STAT/12/ October Household saving rate fell in the euro area and remained stable in the EU27. Household saving rate (seasonally adjusted)
") STAT/12/152 30 October 2012 Quarterly Sector Accounts: second quarter of 2012 Household saving rate down to 12.9% in the euro area and stable at 11. in the EU27 Household real income per capita fell by
STAT/12/152 30 October 2012 Quarterly Sector Accounts: second quarter of 2012 Household saving rate down to 12.9% in the euro area and stable at 11. in the EU27 Household real income per capita fell by
Taxation trends in the European Union Further increase in VAT rates in 2012 Corporate and top personal income tax rates inch up after long decline
 STAT/12/77 21 May 2012 Taxation trends in the European Union Further increase in VAT rates in 2012 Corporate and top personal income tax rates inch up after long decline The average standard VAT rate 1
Gender pension gap economic perspective
 Gender pension gap economic perspective Agnieszka Chłoń-Domińczak Institute of Statistics and Demography SGH Part of this research was supported by European Commission 7th Framework Programme project "Employment
COMMISSION OF THE EUROPEAN COMMUNITIES COMMISSION STAFF WORKING DOCUMENT. Annex to the
 COMMISSION OF THE EUROPEAN COMMUNITIES Brussels, 19122006 SEC(2006) 1690 COMMISSION STAFF WORKING DOCUMENT Annex to the COMMUNICATION FROM THE COMMISSION TO THE COUNCIL, THE EUROPEAN PARLIAMENT AND THE
4 Distribution of Income, Earnings and Wealth
 NERI Quarterly Economic Facts Autumn 2014 4 Distribution of Income, Earnings and Wealth Indicator 4.1 Indicator 4.2a Indicator 4.2b Indicator 4.3a Indicator 4.3b Indicator 4.4 Indicator 4.5a Indicator
PUBLIC PROCUREMENT INDICATORS 2011, Brussels, 5 December 2012
 PUBLIC PROCUREMENT INDICATORS 2011, Brussels, 5 December 2012 1. INTRODUCTION This document provides estimates of three indicators of performance in public procurement within the EU. The indicators are
Pre-Budget Submission
 Pre-Budget Submission A different fiscal adjustment is possible Autumn 2013 2 Contents Summary 3 Current economic outlook 3 The Deficit 3 The Current Plan 4 An Alternative Approach 5 Conclusion 10 References
THE IMPACT OF THE PUBLIC DEBT STRUCTURE IN THE EUROPEAN UNION MEMBER COUNTRIES ON THE POSSIBILITY OF DEBT OVERHANG
 THE IMPACT OF THE PUBLIC DEBT STRUCTURE IN THE EUROPEAN UNION MEMBER COUNTRIES ON THE POSSIBILITY OF DEBT OVERHANG Robert Huterski, PhD Nicolaus Copernicus University in Toruń Faculty of Economic Sciences
August 2012 Euro area international trade in goods surplus of 6.6 bn euro 12.6 bn euro deficit for EU27
 146/2012-16 October 2012 August 2012 Euro area international trade in goods surplus of 6.6 12.6 deficit for EU27 The first estimate for the euro area 1 (EA17) trade in goods balance with the rest of the
The Cyprus Economy: from Recovery to Sustainable Growth. Vincenzo Guzzo Resident Representative in Cyprus
 The Economy: from Recovery to Sustainable Growth Vincenzo Guzzo Resident Representative in Growth momentum remains strong 18 : Real GDP ( billion) 1 Deviation from Pre-Crisis Level and Trend (Percent)
11 th Economic Trends Survey of the Impact of Economic Downturn
 11 th Economic Trends Survey 11 th Economic Trends Survey of the Impact of Economic Downturn 11 th Economic Trends Survey COUNTRY ANSWERS Austria 155 Belgium 133 Bulgaria 192 Croatia 185 Cyprus 1 Czech
Courthouse News Service
 14/2009-30 January 2009 Sector Accounts: Third quarter of 2008 Household saving rate at 14.4% in the euro area and 10.7% in the EU27 Business investment rate at 23.5% in the euro area and 23.6% in the
Chart pack to council for cooperation on macroprudential policy
 Chart pack to council for cooperation on macroprudential policy Contents List of charts... 3 Macro and macro-financial setting... 5 Swedish macroeconomic setting... 5 Foreign macroeconomic setting... Macro-financial
74 ECB THE 2012 MACROECONOMIC IMBALANCE PROCEDURE
 Box 7 THE 2012 MACROECONOMIC IMBALANCE PROCEDURE This year s European Semester (i.e. the framework for EU policy coordination introduced in 2011) includes, for the first time, the implementation of the
January 2009 Euro area external trade deficit 10.5 bn euro 26.3 bn euro deficit for EU27
 STAT/09/40 23 March 2009 January 2009 Euro area external trade deficit 10.5 26.3 deficit for EU27 The first estimate for the euro area 1 (EA16) trade balance with the rest of the world in January 2009
Electricity & Gas Prices in Ireland. Annex Business Electricity Prices per kwh 2 nd Semester (July December) 2016
 2016") Electricity & Gas Prices in Ireland Annex Business Electricity Prices per kwh 2 nd Semester (July December) 2016 ENERGY POLICY STATISTICAL SUPPORT UNIT 1 Electricity & Gas Prices in Ireland Annex Business
Electricity & Gas Prices in Ireland Annex Business Electricity Prices per kwh 2 nd Semester (July December) 2016 ENERGY POLICY STATISTICAL SUPPORT UNIT 1 Electricity & Gas Prices in Ireland Annex Business
3 Labour Costs. Cost of Employing Labour Across Advanced EU Economies (EU15) Indicator 3.1a
 Indicator 3.1a") 3 Labour Costs Indicator 3.1a Indicator 3.1b Indicator 3.1c Indicator 3.2a Indicator 3.2b Indicator 3.3 Indicator 3.4 Cost of Employing Labour Across Advanced EU Economies (EU15) Cost of Employing Labour
3 Labour Costs Indicator 3.1a Indicator 3.1b Indicator 3.1c Indicator 3.2a Indicator 3.2b Indicator 3.3 Indicator 3.4 Cost of Employing Labour Across Advanced EU Economies (EU15) Cost of Employing Labour
Council conclusions on "First Annual Report to the European Council on EU Development Aid Targets"
 COUNCIL OF THE EUROPEAN UNION Council conclusions on "First Annual Report to the European Council on EU Development Aid Targets" 3091st FOREIGN AFFAIRS Council meeting Brussels, 23 May 2011 The Council
May 2009 Euro area external trade surplus 1.9 bn euro 6.8 bn euro deficit for EU27
 STAT/09/106 17 July 2009 May 2009 Euro area external trade surplus 1.9 6.8 deficit for EU27 The first estimate for the euro area 1 (EA16) trade balance with the rest of the world in May 2009 gave a 1.9
Quarterly Financial Accounts Household net worth reaches new peak in Q Irish Household Net Worth
 Quarterly Financial Accounts Q4 2017 4 May 2018 Quarterly Financial Accounts Household net worth reaches new peak in Q4 2017 Household net worth rose by 2.1 per cent in Q4 2017. It now exceeds its pre-crisis
Domestic Debt Market Development in Poland Marek Szczerbak Republic of Poland Ministry of Finance Public Debt Department
 Domestic Debt Market Development in Poland Marek Szczerbak Republic of Poland Ministry of Finance Public Debt Department DMF Stakeholders Forum 2011 Berne, 8-9 June 2011 1 I. Historical perspective 2 Developing
EU KLEMS Growth and Productivity Accounts March 2011 Update of the November 2009 release
 EU KLEMS Growth and Productivity Accounts March 2011 Update of the November 2009 release Description of methodology and country notes Prepared by Reitze Gouma, Klaas de Vries and Astrid van der Veen-Mooij
How to complete a payment application form (NI)
") How to complete a payment application form (NI) This form should be used for making a payment from a Northern Ireland Ulster Bank account. 1. Applicant Details If you are a signal number indemnity holder,
How to complete a payment application form (NI) This form should be used for making a payment from a Northern Ireland Ulster Bank account. 1. Applicant Details If you are a signal number indemnity holder,
Sustainability and Adequacy of Social Security in the Next Quarter Century:
 Sustainability and Adequacy of Social Security in the Next Quarter Century: Balancing future pensions adequacy and sustainability while facing demographic change Krzysztof Hagemejer (Author) John Woodall
Updates and revisions of national SUTs for the November 2013 release of the WIOD
 Updates and revisions of national SUTs for the November 2013 release of the WIOD Edited by Marcel Timmer (University of Groningen) With contributions from: Abdul A. Erumban, Reitze Gouma and Gaaitzen J.
EU State aid: Guidelines on State aid for environmental protection and energy making of -
 EU State aid: Guidelines on State aid for environmental protection and energy 2014-2020 - making of - NHO Seminar Oslo, 5 November 2014 Guido Lobrano, Senior Legal Adviser Summary What is BUSINESSEUROPE?
Tax Survey Effective tax ratesof employees with different income levels in 25countries. Ivan Fučík. Fučík & partners, Prague, Czech Republic
 Tax Survey 2012 Effective tax ratesof employees with different income levels in 25countries Ivan Fučík Fučík & partners, Prague, Czech Republic E-mail: ivan@fucik.cz www.fucik.cz Content Introduction of
Report Penalties and measures imposed under the UCITS Directive in 2016 and 2017
 Report Penalties and measures imposed under the Directive in 206 and 207 4 April 209 ESMA34-45-65 4 April 209 ESMA34-45-65 Table of Contents Executive Summary... 3 2 Background and relevant regulatory
SELECTED MAJOR SOCIAL SECURITY PENSION REFORMS IN EUROPE, Source: ISSA Databases
 SELECTED MAJOR SOCIAL SECURITY PENSION REFORMS IN EUROPE, 1995-2014 Source: ISSA Databases COUNTRY AREA YR SUMMARY OBJECTIVE POSSIBLE EVALUATION CRITERIA* United Kingdom Pensions 2014 Replacing public
Macroeconomic scenarios for skill demand and supply projections, including dealing with the recession
 Alphametrics (AM) Alphametrics Ltd Macroeconomic scenarios for skill demand and supply projections, including dealing with the recession Paper presented at Skillsnet technical workshop on: Forecasting
Miroljub Labus. Budget. Introduction into Economic System of the EU. Faculty of Law, Belgrade
 Miroljub Labus Budget Introduction into Economic System of the EU Faculty of Law, Belgrade Baldwin & Wyplosz: The Economics of European Integration, Ch.17 Monday, December 1 st, 2014 20:30 21:15 Fiscal
Governor of the Bank of Latvia
 Lessons from Latvia s internal adjustment strategy Ilmārs Rimšēvičs Governor of the Bank of Latvia September 4, 2012 Presentation outline Overheating of Latvia s economy Expansionary consolidation Lessons
A. INTRODUCTION AND FINANCING OF THE GENERAL BUDGET. EXPENDITURE Description Budget Budget Change (%)
") DRAFT AMENDING BUDGET NO. 2/2018 VOLUME 1 - TOTAL REVENUE A. INTRODUCTION AND FINANCING OF THE GENERAL BUDGET FINANCING OF THE GENERAL BUDGET Appropriations to be covered during the financial year 2018
DRAFT AMENDING BUDGET NO. 2/2018 VOLUME 1 - TOTAL REVENUE A. INTRODUCTION AND FINANCING OF THE GENERAL BUDGET FINANCING OF THE GENERAL BUDGET Appropriations to be covered during the financial year 2018
Burden of Taxation: International Comparisons
 Burden of Taxation: International Comparisons Standard Note: SN/EP/3235 Last updated: 15 October 2008 Author: Bryn Morgan Economic Policy & Statistics Section This note presents data comparing the national
3 Labour Costs. Cost of Employing Labour Across Advanced EU Economies (EU15) Indicator 3.1a
 Indicator 3.1a") 3 Labour Costs Indicator 3.1a Indicator 3.1b Indicator 3.1c Indicator 3.2a Indicator 3.2b Indicator 3.3 Indicator 3.4 Cost of Employing Labour Across Advanced EU Economies (EU15) Cost of Employing Labour
3 Labour Costs Indicator 3.1a Indicator 3.1b Indicator 3.1c Indicator 3.2a Indicator 3.2b Indicator 3.3 Indicator 3.4 Cost of Employing Labour Across Advanced EU Economies (EU15) Cost of Employing Labour
Quarterly Gross Domestic Product of Montenegro 3 rd quarter 2017
 MONTENEGRO STATISTICAL OFFICE R E L E A S E No: 224 Podgorica, 22 December 2017 When using the data, please name the source Quarterly Gross Domestic Product of Montenegro 3 rd quarter 2017 The release
Raising the retirement age is the labour market ready for active ageing: evidence from EB and Eurofound research
 Raising the retirement age is the labour market ready for active ageing: evidence from EB and Eurofound research Robert Anderson, EUROFOUND, Dublin Reforming pension systems in Europe and Central Asia
Dividends from the EU to the US: The S-Corp and its Q-Sub. Peter Kirpensteijn 23 September 2016
 Dividends from the EU to the : The S-Corp and its Q-Sub Peter Kirpensteijn 23 September 2016 The Inc: large multinational manufacturing company residents The LLC: holding company owned by tax residents
ILO World of Work Report 2013: EU Snapshot
 Greece Spain Ireland Poland Belgium Portugal Eurozone France Slovenia EU-27 Cyprus Denmark Netherlands Italy Bulgaria Slovakia Romania Lithuania Latvia Czech Republic Estonia Finland United Kingdom Sweden
SEE macroeconomic outlook Recovery gains traction, fiscal discipline improving. Alen Kovac, Chief Economist EBC May 2016 Ljubljana
 SEE macroeconomic outlook Recovery gains traction, fiscal discipline improving Alen Kovac, Chief Economist EBC May 216 Ljubljana Real economy highlights Recent GDP track record reveals more favorable footprint
Second estimate for the first quarter of 2010 EU27 current account deficit 34.8 bn euro 10.8 bn euro surplus on trade in services
 109/2010-22 July 2010 Second estimate for the first quarter of 2010 EU27 current account deficit 34.8 bn euro 10.8 bn euro surplus on trade in According to the latest revisions 1, the EU27 2 external current
Rozvoj zam stnanosti v sociálních slu bách: klí ové faktory a perspektivy. Shaping employment in social services: key factors and future perspectives
 Rozvoj zam stnanosti v sociálních slu bách: klí ové faktory a perspektivy Shaping employment in social services: key factors and future perspectives T. Sirovátka and O. Hora Focus Development of health
The EFTA Statistical Office: EEA - the figures and their use
 The EFTA Statistical Office: EEA - the figures and their use EEA Seminar Brussels, 13 September 2012 1 Statistics Comparable, impartial and reliable statistical data are a prerequisite for a democratic
Lithuania: in a wind of change. Robertas Dargis President of the Lithuanian Confederation of Industrialists
 Lithuania: in a wind of change Robertas Dargis President of the Lithuanian Confederation of Industrialists 2017 06 15 Lithuanian Confederation of Industrialists - the largest business organisation in Lithuania
34 th Associates Meeting - Andorra, 25 May Item 5: Evolution of economic governance in the EU
 34 th Associates Meeting - Andorra, 25 May 2012 - Item 5: Evolution of economic governance in the EU Plan of the Presentation 1. Fiscal and economic coordination: how did it start? 2. Did it work? 3. Five
January 2005 Euro-zone external trade deficit 2.2 bn euro 14.0 bn euro deficit for EU25
 42/2005-23 March 2005 January 2005 Euro-zone external trade deficit 2.2 14.0 deficit for EU25 The first estimate for euro-zone 1 trade with the rest of the world in January 2005 was a 2.2 billion euro
COMMUNICATION FROM THE COMMISSION
 EUROPEAN COMMISSION Brussels, 20.2.2019 C(2019) 1396 final COMMUNICATION FROM THE COMMISSION Modification of the calculation method for lump sum payments and daily penalty payments proposed by the Commission
AIB - CEBS Stress Test. 23rd July 2010
 AIB - CEBS Stress Test 23rd July 2010 Allied Irish Banks, p.l.c. ("AIB") [NYSE: AIB] welcomes today s earlier announcements of the EU-wide stress testing exercise co-ordinated by the Committee of European
March 2005 Euro-zone external trade surplus 4.2 bn euro 6.5 bn euro deficit for EU25
 STAT/05/67 24 May 2005 March 2005 Euro-zone external trade surplus 4.2 6.5 deficit for EU25 The first estimate for euro-zone 1 trade with the rest of the world in March 2005 was a 4.2 billion euro surplus,
EIOPA Statistics - Accompanying note
 EIOPA Statistics - Accompanying note Publication references: Published statistics: [Balance sheet], [Premiums, claims and expenses], [Own funds and SCR] Disclaimer: Data is drawn from the published statistics
COUNCIL OF THE EUROPEAN UNION. Brussels, 21 December 2009 (OR. en) 16488/3/09 REV 3 STAT 32 FIN 519
 16488/3/09 REV 3 STAT 32 FIN 519") COUNCIL OF THE EUROPEAN UNION Brussels, 21 December 2009 (OR. en) 16488/3/09 REV 3 STAT 32 FIN 519 LEGISLATIVE ACTS AND OTHER INSTRUMTS Subject: COUNCIL REGULATION adjusting with effect from 1 July 2009
COUNCIL OF THE EUROPEAN UNION Brussels, 21 December 2009 (OR. en) 16488/3/09 REV 3 STAT 32 FIN 519 LEGISLATIVE ACTS AND OTHER INSTRUMTS Subject: COUNCIL REGULATION adjusting with effect from 1 July 2009
Taxation trends in the European Union EU27 tax ratio at 39.8% of GDP in 2007 Steady decline in top personal and corporate income tax rates since 2000
 DG TAXUD STAT/09/92 22 June 2009 Taxation trends in the European Union EU27 tax ratio at 39.8% of GDP in 2007 Steady decline in top personal and corporate income tax rates since 2000 The overall tax-to-gdp
Introduction 283,602,000,000 ( 284 billion ) 71 billion 10.71%
 71 billion 10.71%") Introduction Over the last 4 years (between 2012 to 2015 inclusive) the UK has imported 283,602,000,000 ( 284 billion ) more from the rest of the EU than the UK and NI have exported to the EU resulting
Introduction Over the last 4 years (between 2012 to 2015 inclusive) the UK has imported 283,602,000,000 ( 284 billion ) more from the rest of the EU than the UK and NI have exported to the EU resulting
FCCC/SBI/2010/10/Add.1
 United Nations Framework Convention on Climate Change Distr.: General 25 August 2010 Original: English Subsidiary Body for Implementation Contents Report of the Subsidiary Body for Implementation on its
August 2008 Euro area external trade deficit 9.3 bn euro 27.2 bn euro deficit for EU27
 STAT/08/143 17 October 2008 August 2008 Euro area external trade deficit 9.3 27.2 deficit for EU27 The first estimate for the euro area 1 (EA15) trade balance with the rest of the world in August 2008
Quarterly Gross Domestic Product of Montenegro 2st quarter 2016
 Government of Montenegro Statistical Office of Montenegro Quarterly Gross Domestic Product of Montenegro 2st quarter 2016 The release presents the preliminary data for quarterly gross domestic product
The CAP reform process in perspective: issues of the post-2013 debate
 The CAP reform process in perspective: issues of the post-213 debate Tassos Haniotis Director - Economic Analysis, Perspectives and Evaluations DG for Agriculture and Rural Development European Commission
Comparing pay trends in the public services and private sector. Labour Research Department 7 June 2018 Brussels
 Comparing pay trends in the public services and private sector Labour Research Department 7 June 2018 Brussels Issued to be covered The trends examined The varying patterns over 14 years and the impact
PREZENTĀCIJAS NOSAUKUMS
 Which Structural Reforms Matter for economic growth: PREZENTĀCIJAS NOSAUKUMS Evidence from Bayesian Model Averaging Olegs Krasnopjorovs (Latvijas Banka) 2 nd Lisbon Conference on Structural Reforms 06.07.2017
The macroeconomic effects of a carbon tax in the Netherlands Íde Kearney, 13 th September 2018.
 The macroeconomic effects of a carbon tax in the Netherlands Íde Kearney, th September 08. This note reports estimates of the economic impact of introducing a carbon tax of 50 per ton of CO in the Netherlands.
EIB Financing for Social and Affordable Housing
 EIB Financing for Social and Affordable Housing Andrea Colantonio, Urban Development Division, European Investment Bank Affordable housing for inclusive cities, 16 th May 2018 Brussels European Investment
4,400 OF BRITISH IN THE TIME IT TAKES TO READ THIS TITLE WILL HAVE SPENT TAXPAYERS MONEY THE EUROPEAN UNION
 IN THE TIME IT TAKES TO READ THIS TITLE THE EUROPEAN UNION WILL HAVE SPENT 4,400 OF BRITISH TAXPAYERS MONEY A115 EU fiscal review booklet 2013.indd 1 04/12/2014 12:00 Reforming taxes, cutting spending
Bank resolution in the Swedish context
 Bank resolution in the Swedish context Hans Lindblad Director General UBS Annual Nordic Financial Services Conference Stockholm 8 september 2016 The Swedish economy is performing well GDP growth is strong
Consumer credit market in Europe 2013 overview
 Consumer credit market in Europe 2013 overview Crédit Agricole Consumer Finance published its annual survey of the consumer credit market in 28 European Union countries for seven years running. 9 July
OVERVIEW OF VALUE ADDED TAX AND EXCISE DUTY IN THE COUNTRIES OF EUROPEAN UNION. R. Suba3ien4, dr. assoc. professor Vilnius University, Lithuania
 OVERVIEW OF VALUE ADDED TAX AND EXCISE DUTY IN THE COUNTRIES OF EUROPEAN UNION R. Suba3ien4, dr. assoc. professor Vilnius University, Lithuania Taxes and contributions are the main source of income for
DATA SET ON INVESTMENT FUNDS (IVF) Naming Conventions
 Naming Conventions") DIRECTORATE GENERAL STATISTICS LAST UPDATE: 10 APRIL 2013 DIVISION MONETARY & FINANCIAL STATISTICS ECB-UNRESTRICTED DATA SET ON INVESTMENT FUNDS (IVF) Naming Conventions The series keys related to Investment
DIRECTORATE GENERAL STATISTICS LAST UPDATE: 10 APRIL 2013 DIVISION MONETARY & FINANCIAL STATISTICS ECB-UNRESTRICTED DATA SET ON INVESTMENT FUNDS (IVF) Naming Conventions The series keys related to Investment
TAXATION OF TRUSTS IN ISRAEL. An Opportunity For Foreign Residents. Dr. Avi Nov
 TAXATION OF TRUSTS IN ISRAEL An Opportunity For Foreign Residents Dr. Avi Nov Short Bio Dr. Avi Nov is an Israeli lawyer who represents taxpayers, individuals and entities. Areas of Practice: Tax Law,
VALUE ADDED TAX COMMITTEE (ARTICLE 398 OF DIRECTIVE 2006/112/EC) WORKING PAPER NO 924
 WORKING PAPER NO 924") EUROPEAN COMMISSION DIRECTORATE-GENERAL TAXATION AND CUSTOMS UNION Indirect Taxation and Tax administration Value added tax taxud.c.1(2017)1561748 EN Brussels, 14 March 2017 VALUE ADDED TAX COMMITTEE (ARTICLE
EUROPEAN COMMISSION DIRECTORATE-GENERAL TAXATION AND CUSTOMS UNION Indirect Taxation and Tax administration Value added tax taxud.c.1(2017)1561748 EN Brussels, 14 March 2017 VALUE ADDED TAX COMMITTEE (ARTICLE