LOOKING FORWARD: WHY THE ROAD TO PROSPERITY STARTS WITH EQUITY
|
|
|
- Frederica Lawrence
- 5 years ago
- Views:
Transcription


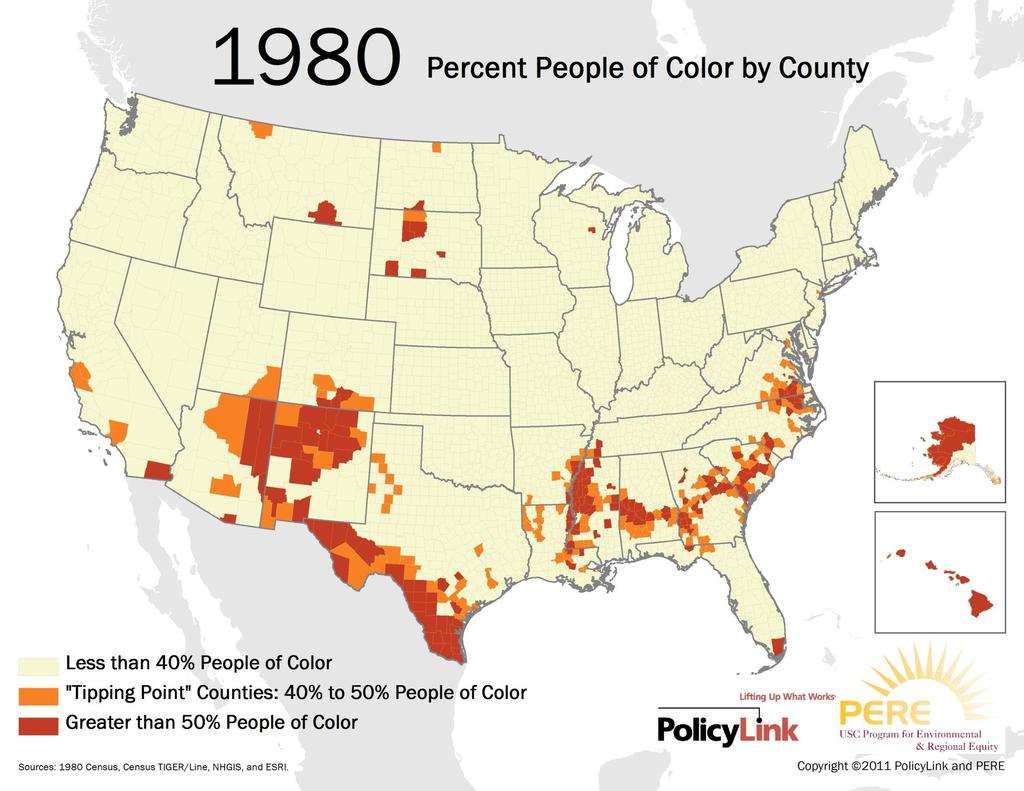
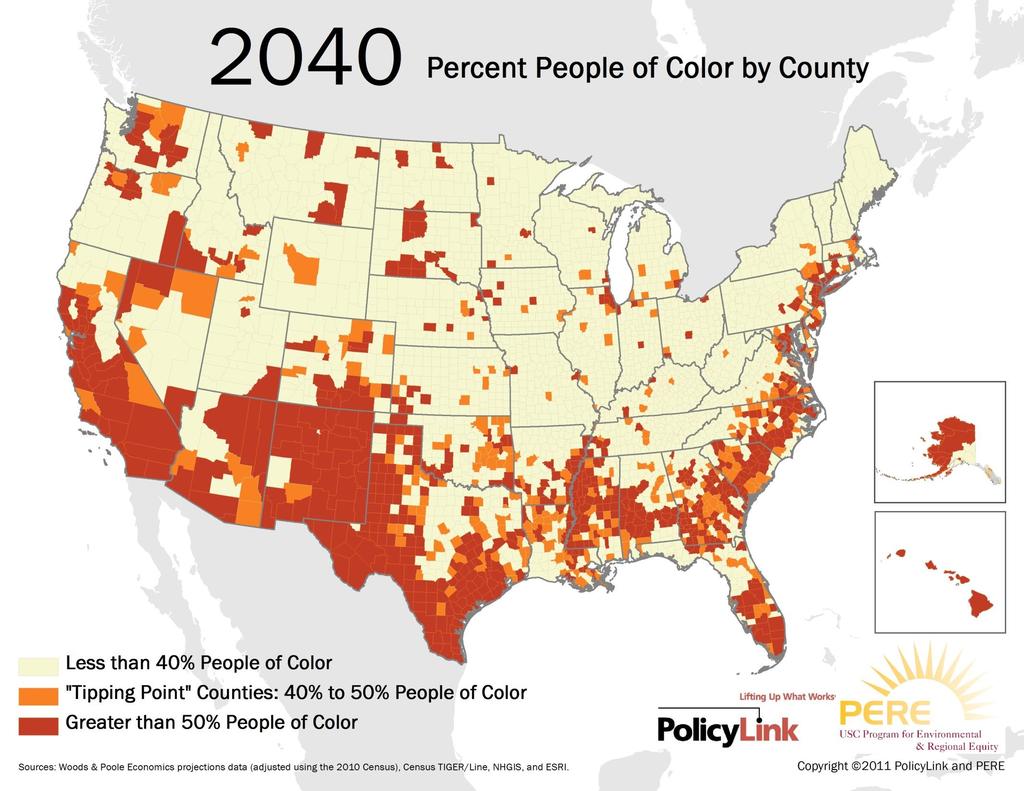
1 LOOKING FORWARD: WHY THE ROAD TO PROSPERITY STARTS WITH EQUITY MANUEL
2 Decadal Population Growth Rates by Race/Ethnicity United States, % 109% 100% 50% 53% 58% 50% 43% 43% 0% 16% 12% 11% 4% 3% 1% White Black Latino Asian/Pacific Islander
3 Decadal Population Growth Rates by Race/Ethnicity Colorado, % 100% 100% 73% 71% 50% 41% 45% 12% 20% 10% 28% 24% 26% 19% 0% White Black Latino Asian/Pacific Islander
4 Decadal Population Growth Rates by Race/Ethnicity Denver-Aurora, CO Metro, % 100% 88% 102% 80% 50% 43% 48% 10% 23% 18% 22% 9% 20% 29% 0% White Black Latino Asian/Pacific Islander
5 Total Population Growth by Decade Denver-Aurora, CO Metro, People of Color Non-Hispanic White 276, , , , ,288 78,

6 U.S. Change in Youth (<18) Population by Race/Ethnicity, ,788, , ,683 White Black Latino API Other -248,081-4,310,525
7 Change in Youth Population by Race/Ethnicity U.S. and Colorado, White Black Latino API Other 50% 40% 39% 45% 41% 37% 30% 31% 31% 20% 10% 6% 0% -10% -10% -2% U.S. -3% Colorado -20%
8 Changing Demographics United States, % 90% 80% 70% 60% 6% 12% 3% 9% 12% 2% 2% 3% 3% 4% 4% 5% 6% 7% 8% 13% 12% 16% 12% 19% 12% 22% 12% 24% 13% Other Native American Asian/Pacific Islander 50% Latino 40% 30% 20% 80% 76% 69% 64% 59% 55% 51% Black White 10% 0%
9 Changing Demographics Colorado, % 90% 80% 70% 60% 2% 12% 13% 3% 4% 2% 2% 3% 2% 3% 4% 3% 3% 4% 4% 17% 4% 21% 4% 23% 4% 26% 4% 29% 4% Other Native American Asian/Pacific Islander 50% Latino 40% 30% 20% 83% 81% 74% 70% 66% 62% 58% Black White 10% 0%
10 Changing Demographics Denver-Aurora, CO Metro, % 90% 80% 70% 60% 50% 2% 11% 13% 5% 6% 2% 2% 3% 3% 3% 4% 4% 4% 5% 6% 19% 5% 22% 5% 26% 5% 29% 5% 32% 6% Other Native American Asian/Pacific Islander Latino 40% 30% 20% 81% 79% 71% 66% 61% 56% 52% Black White 10% 0%
11 Percent Foreign Born U.S., Colorado, and Denver-Aurora, CO Metro Denver-Aurora Metro Colorado United States 15% 12% 9% 6% 3% 6.2% 4.5% 4.0% 7.9% 5.0% 4.3% 11.1% 10.9% 8.6% 12.7% 12.1% 9.7% 0%
12 Race/Ethnicity by Nativity, Denver-Aurora, CO Metro, API, U.S.-born 1.3% Latino, Immigrant 6.6% API, Immigrant 2.4% Other or mixed race 2.2% Latino, U.S.-born 16% Black 6% White 65%
13
14
15
16
17
18
19
20 *white tracts = no population

21 *white tracts = no population
22
23 Median Age by Race/Ethnicity, U.S. Colorado White API Black Native American and Alaska Native Latino Other or mixed race

24 THE GAP MATTERS

25 THE GAP MATTERS
26 Racial Generation Gap U.S. and Colorado, 1980 to % 45% 40% 35% 30% 25% 20% 15% 10% 5% US POC Youth Colorado POC Youth US POC Seniors Colorado POC Seniors The generation gap 0%

27 CHALLENGE OF INEQUALITY
28 CHALLENGE OF INEQUALITY percent of income % Income Distribution in the U.S., Educational Attainment by Race/Ethnicity/Nativity, % 15% 10% 5% Top 1% (incomes above $394,000 in 2012) Top 5-1% (incomes between $161,000 and $394,000) Top 10-5% (incomes between $114,000 and $161,000) 0% Source: Emmanuel Saez, Striking It Richer: The Evolution of Top Incomes in the United States (Update : September 15, 2013.
29 BUT ISN T COLORADO GROWING? Job Growth Rate U.S., Denver, and Colorado, % Denver-Aurora, CO Colorado United States 100% 80% 60% 40% 20% 0%

30 Income Percentiles, Earned Income for Full-Time Workers ($2010) U.S. and Denver-Aurora, CO Metro, * Denver-Aurora, CO United States 18% 15% 11% 4% 10th Percentile 20th Percentile 50th Percentile 80th Percentile 90th Percentile -1% -5% -11% -10% -8% -16%
31 BUT WE MOVE UP OVER TIME? Class Stickiness Income Inequality 31
32 AND WHAT ABOUT RACE? Percent of Families Living Below 150 Percent of the Federal Poverty Line by Race/Ethnicity Colorado % 37% 41% 41% 31% 19% 19% 23% 22% 24% White Black Latino Asian/Pacific Islander All
33 AND WHAT ABOUT RACE? Percent of Families Living Below 150 Percent of the Federal Poverty Line by Race/Ethnicity Denver-Aurora, CO Metro % 38% 39% 36% 15% 16% 26% 21% 21% 18% White Black Latino Asian/Pacific Islander All
34 AND WHAT ABOUT RACE? Educational Attainment (of Adults 25-64) by Race/Ethnicity Colorado, % 9% 24% 23% 11% 28% 13% 6% 20% 28% 48% 7% 16% 38% 9% 23% BA or higher AA degree Some college HS Diploma 19% 4% 27% 11% 33% White Black Latino Asian/Pacific Islander 18% 21% 12% 9% All Less than HS


35 HOUSING BURDEN AS CHALLENGE Denver-Aurora Metro, All Asian/Pacific Islander White Latino Black 65% 60% 55% 57% 50% 45% 46% 39% 35%

36 THINKING NEW: EQUITY AND GROWTH Conventional wisdom in economics says there is a trade-off between equity and efficiency. But, new evidence shows that regions that work toward equity have stronger and more resilient economic growth for everyone.


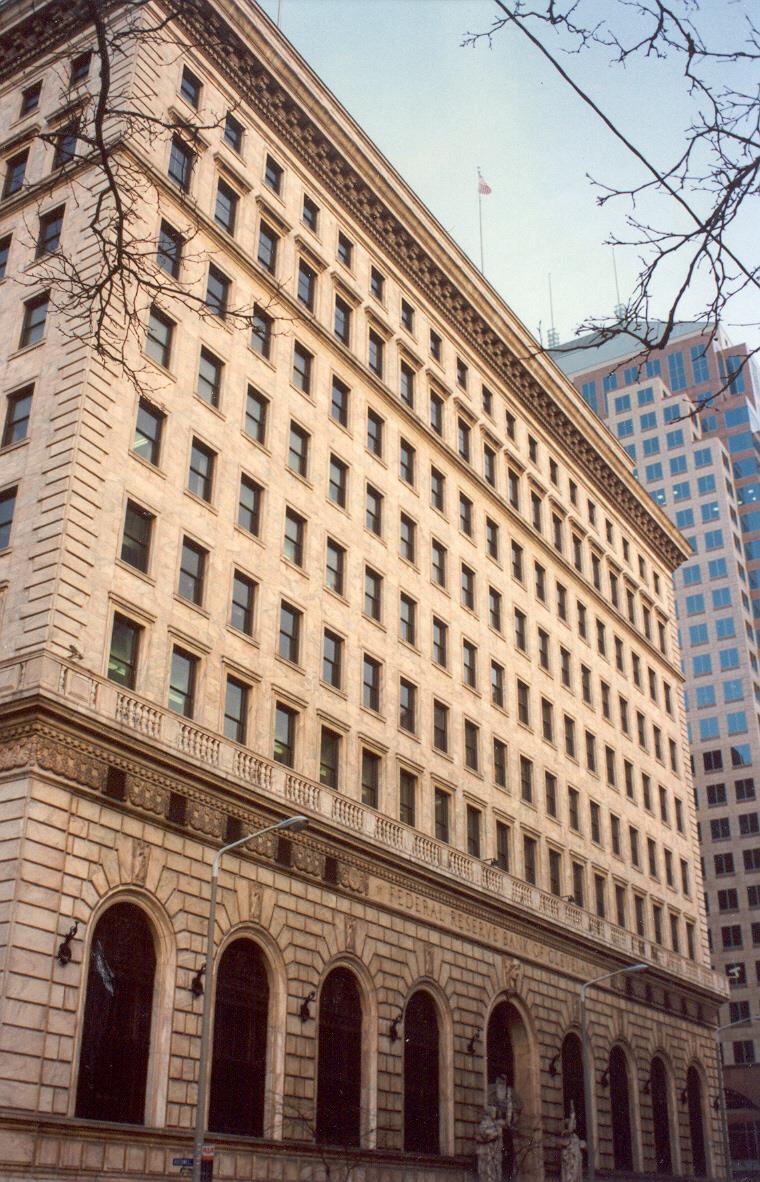
37 EVIDENCE: EQUITY AND GROWTH Even the Federal Reserve Bank of Cleveland found that that racial inclusion and income equality matter for growth. Image Sources:


38 EVIDENCE: EQUITY AND GROWTH
39 EVIDENCE: EQUITY AND GROWTH We have developed these ideas further in...

40 AND WHY SO IMPORTANT NOW?


41 A WAY FORWARD: EQUITABLE GROWTH So it s a challenge for all of us: economic development folks and business leaders need to rethink the role of equity But equity proponents need to consider economic realities and constraints and propose feasible, growth-enhancing approaches And we need the workforce, land use, transit, financial and fiscal policies and practices to make this real

42 ROOTS AND RELATIONSHIPS
43 DATA AND DIALOGUE
44


45 VALUES AND VISION Speak to people s aspirations for the future not just their anger and anxieties Stress that equity and inclusion are fundamental to economy not add-on s Have the courage to take risks, to convene unusual allies, to challenge systems and old beliefs


46 LEADING THROUGH THE DIVIDE

47 FOR
Advancing Health Equity and Inclusive Growth in the Sacramento Region: Narrative and Data for an Equity Policy Agenda
 Advancing Health Equity and Inclusive Growth in the Sacramento Region: Narrative and Data for an Equity Policy Agenda Equity is the Superior Growth Model Racial inequities hinder economic prosperity Sacramento
FUTURE LANDSCAPES. The effects of changing demographics. Background. Future landscapes: The effects of changing demographics February, 2007
 FUTURE LANDSCAPES The effects of changing demographics Background DRCOG Board Retreat 1 Our region is changing Demographic facts: Rapid growth of the older population Increasing immigration Flexible, creative
The Well-Being of Women in Utah
 1 The Well-Being of Women in Utah YWCA Utah s vision is that all Utah women are thriving and leading the lives they choose, with their strength benefiting their families, communities, and the state as
Regional Data Snapshot
 Regional Data Snapshot Population, Economy & Education Features SET Civic Forum Ozark Foothills Region, Missouri Table of Contents 01 Overview 03 Human Capital 02 Demography 04 Labor Force 01 overview
Commission District 4 Census Data Aggregation
 Commission District 4 Census Data Aggregation 2011-2015 American Community Survey Data, U.S. Census Bureau Table 1 (page 2) Table 2 (page 2) Table 3 (page 3) Table 4 (page 4) Table 5 (page 4) Table 6 (page
Northwest Census Data Aggregation
 Northwest Census Data Aggregation 2011-2015 American Community Survey Data, U.S. Census Bureau Table 1 (page 2) Table 2 (page 2) Table 3 (page 3) Table 4 (page 4) Table 5 (page 4) Table 6 (page 5) Table
Riverview Census Data Aggregation
 Riverview Census Data Aggregation 2011-2015 American Community Survey Data, U.S. Census Bureau Table 1 (page 2) Table 2 (page 2) Table 3 (page 3) Table 4 (page 4) Table 5 (page 4) Table 6 (page 5) Table
Zipe Code Census Data Aggregation
 Zipe Code 66101 Census Data Aggregation 2011-2015 American Community Survey Data, U.S. Census Bureau Table 1 (page 2) Table 2 (page 2) Table 3 (page 3) Table 4 (page 4) Table 5 (page 4) Table 6 (page 5)
Zipe Code Census Data Aggregation
 Zipe Code 66103 Census Data Aggregation 2011-2015 American Community Survey Data, U.S. Census Bureau Table 1 (page 2) Table 2 (page 2) Table 3 (page 3) Table 4 (page 4) Table 5 (page 4) Table 6 (page 5)
National Equity Atlas Data & Methods: Technical Documentation
 National Equity Atlas Data & Methods: Technical Documentation Prepared by PolicyLink and the USC Program for Environmental and Regional Equity March 5, 2015 This document provides more detailed information
Chapter 10 Equity and Environmental Justice
 Chapter 10 Equity and Environmental Justice Introduction An important consideration for the 2040 Transportation Policy Plan is its impact on all populations in the Minneapolis-Saint Paul region, particularly
Independence, MO Data Profile 2015
 , MO Data Profile 2015 5 year American Community Survey (ACS) Jackson County, Missouri Data sources: U.S. Census Bureau, American Community Survey (ACS), 2011 2015 (released December 8, 2016), compared
Regional Data Snapshot
 Regional Data Snapshot Population, Economy & Education Features SET Civic Forum Forest Country Region (FCR), Texas Table of Contents 01 Overview 03 Human Capital 02 Demography 04 Labor Force 01 overview
The distribution of wealth in the United States and implications for a net worth tax
 The distribution of wealth in the United States and implications for a net worth tax March 2019 By Greg Leiserson, Will McGrew, and Raksha Kopparam Wealth inequality in the United States is high and has
Demographics, Wealth and Opportunity
 NCSL Family Opportunity Forum Demographics, Wealth and Opportunity June 14, 2016 William R. Emmons Federal Reserve Bank of St. Louis William.R.Emmons@stls.frb.org These comments do not necessarily represent
In Baltimore City today, 20% of households live in poverty, but more than half of the
 Building Economic Opportunity in Baltimore: A Data Profile Baltimore Highlights In Baltimore City today, 20% of households live in poverty, but more than half of the city s population 55% is financially
ABOUT ULI MN. VISION Thriving communities.
 ABOUT ULI MN MISSION Urban Land Institute Minnesota engages public and private sector leaders to foster collaboration, share knowledge, and join in meaningful strategic action. VISION Thriving communities.
27% 42% 51% 16% 51% 19% PROFILE. Assets & opportunity ProfILe: PortLANd. key highlights. ABoUt the ProfILe ASSETS & OPPORTUNITY
 Assets & opportunity ProfILe: PortLANd ASSETS & OPPORTUNITY PROFILE key highlights 27% of Portland households live in asset poverty Cities have long been thought of as places of opportunity for low-income
Enrollment Type. Proportion of Non AAS Students by Enrollment Type. UW Colleges Campus Profile: UW Fox Valley
 Ten Year Enrollment Trends by Enrollment Type Fall AAS High School Special Audit Other Total Enrollment 2008 1473 62 88 5 13 1641 2009 1520 111 106 1 10 1748 2010 1583 118 97 9 24 1831 2011 1615 105 79
What does your Community look like and how is it changing?
 What does your Community look like and how is it changing? Trends in the State population related to health and health determinants and where you can find this data to support your local work Who is Likely
Enrollment Type. UW Colleges Campus Profile: UW Marathon County. Proportion of Non AAS Students by Enrollment Type
 Ten Year Enrollment Trends by Enrollment Type Fall AAS High School Special Audit Other Total Enrollment 2008 1250 12 62 11 28 1363 2009 1292 22 57 13 15 1399 2010 1315 25 41 14 14 1409 2011 1266 15 41
Enrollment Type. UW Colleges Campus Profile: UW Manitowoc. Proportion of Non AAS Students by Enrollment Type
 Ten Year Enrollment Trends by Enrollment Type Fall AAS High School Special Audit Other Total Enrollment 2008 507 10 16 1 6 540 2009 489 14 31 5 9 548 2010 573 11 20 4 4 612 2011 624 10 20 4 6 664 2012
The Demographics of Wealth
 Demographics and the Future of American Families The Demographics of Wealth May 13, 2015 William R. Emmons Bryan J. Noeth Center for Household Financial Stability Federal Reserve Bank of St. Louis William.R.Emmons@stls.frb.org
Poverty Rises, Median Income Falls and More Minnesotans Go Without Health Insurance in 2010
 Poverty Rises, Median Income Falls and More Minnesotans Go Without Health Insurance in 2010 Economic well-being of Minnesotans is declining The United States has weathered two recessions in the last decade,
Occupational Therapy Assistant Occupation Overview
 Occupational Therapy Assistant Occupation Overview Emsi Q1 2018 Data Set March 2018 Western Technical College 400 Seventh Street La Crosse, Wisconsin 54601 608.785.9200 Emsi Q1 2018 Data Set www.economicmodeling.com
Respiratory Therapy Occupation Overview
 Respiratory Therapy Occupation Overview Emsi Q1 2018 Data Set March 2018 Western Technical College 400 Seventh Street La Crosse, Wisconsin 54601 608.785.9200 Emsi Q1 2018 Data Set www.economicmodeling.com
Wealth Inequality and the American Dream
 Wealth Inequality and the American Dream Economic Realities of the American Dream Professors Steve Fazzari and Mark Rank April 16, 2018 Ray Boshara Director, Center for Household Financial Stability Federal
31% 41% 11% 50% 18% PROFILE ASSETS & OPPORTUNITY PROFILE: SAN FRANCISCO KEY HIGHLIGHTS ABOUT THE PROFILE ASSETS & OPPORTUNITY
 ASSETS & OPPORTUNITY PROFILE: SAN FRANCISCO ASSETS & OPPORTUNITY PROFILE KEY HIGHLIGHTS 31% of San Francisco residents live in asset poverty Cities have long been thought of as places of opportunity for
City of Modesto Homebuyer Assistance Program
 City of Modesto Homebuyer Assistance Program Overview The City of Modesto s (City) Homebuyer Assistance Program provides deferred-payment; lowinterest loans to assist low income families purchase a qualified
University of Minnesota
 neighborhood profile October 2011 About this area The University neighborhood is bordered by 11th Avenue Southeast, University Avenue, 15th Avenue Southeast, the railroad tracks, Oak Street, and the Mississippi
Trend Analysis of Changes to Population and Income in Philadelphia, using American Community Survey (ACS) Data
 Data") OFFICE OF THE PRESIDENT FINANCE AND BUDGET TEAM City Council of Philadelphia 9.22.17 Trend Analysis of Changes to Population and Income in Philadelphia, using 2010-2016 American Community Survey (ACS)
OFFICE OF THE PRESIDENT FINANCE AND BUDGET TEAM City Council of Philadelphia 9.22.17 Trend Analysis of Changes to Population and Income in Philadelphia, using 2010-2016 American Community Survey (ACS)
Nest Egg for Retirement? The Realities of Asset Holdings for Older Adults
 Nest Egg for Retirement? The Realities of Asset Holdings for Older Adults Laura Sullivan, Ph.D. Candidate Heller School for Social Policy and Management Brandeis University Presentation Outline Background
Mid - City Industrial
 Minneapolis neighborhood profile October 2011 Mid - City Industrial About this area The Mid-City Industrial neighborhood is bordered by I- 35W, Highway 280, East Hennepin Avenue, and Winter Street Northeast.
Camden Industrial. Minneapolis neighborhood profile. About this area. Trends in the area. Neighborhood in Minneapolis.
 Minneapolis neighborhood profile October 2011 Camden Industrial About this area The Camden Industrial neighborhood is bordered by 48th Avenue North, the Mississippi River, Dowling Avenue North, Washington
Building Wealth for Families and Employees
 Building Wealth for Families and Employees Grow Our Own Summit Marshall, MN November 8, 2018 Ray Boshara* Senior Advisor; Director, Center for Household Financial Stability Federal Reserve Bank of St.
Shingle Creek. Minneapolis neighborhood profile. About this area. Trends in the area. Neighborhood in Minneapolis. October 2011
 neighborhood profile October 2011 About this area The neighborhood is bordered by 53rd Avenue North, Humboldt Avenue North, 49th Avenue North, and Xerxes Avenue North. It is home to Olson Middle School.
Metro Houston Population Forecast
 Metro Houston Population Forecast Projections to 2050 Prepared by the Greater Houston Partnership Research Department Data from Texas Demographic Center www.houston.org April 2017 Greater Houston Partnership
REGIONAL SNAPSHOT. Foothills Region, North Carolina
 REGIONAL SNAPSHOT Foothills Region, North Carolina Table of contents 01 Overview 04 Labor force 02 Demography 05 Industry and occupation 03 Human capital 01 overview Foothills Region, NC What is a regional
BLACK AND LATINO RETIREMENT (IN)SECURITY. Nari Rhee, Ph.D. February, 2012 HIGHLIGHTS
SECURITY. Nari Rhee, Ph.D. February, 2012 HIGHLIGHTS") UNIVERSITY OF CALIFORNIA, BERKELEY CENTER FOR LABOR RESEARCH AND EDUCATION RESEARCH BRIEF BLACK AND LATINO RETIREMENT (IN)SECURITY Nari Rhee, Ph.D. February, 2012 HIGHLIGHTS Black and Latino seniors are
UNIVERSITY OF CALIFORNIA, BERKELEY CENTER FOR LABOR RESEARCH AND EDUCATION RESEARCH BRIEF BLACK AND LATINO RETIREMENT (IN)SECURITY Nari Rhee, Ph.D. February, 2012 HIGHLIGHTS Black and Latino seniors are
Town Profiles: Demographic, Economic, and Housing Statistics for De Smet City and Wall Town, SOuth Dakota
 South Dakota State University Open PRAIRIE: Open Public Research Access Institutional Repository and Information Exchange Census Data Center News Releases SDSU Census Data Center 12-7-2017 Town Profiles:
Tyler Area Economic Overview
 Tyler Area Economic Overview Demographic Profile. 2 Unemployment Rate. 4 Wage Trends. 4 Cost of Living Index...... 5 Industry Clusters. 5 Occupation Snapshot. 6 Education Levels 7 Gross Domestic Product
The Racial Wealth Gap: Latinos
 FACT SHEET April 2014 The Racial Wealth Gap: Latinos Facts At A Glance The median wealth of White households is 18 times that of Latino households. The growing racial wealth gap occurring in the U.S. is
2018:IIIQ Nevada Unemployment Rate Demographics Report*
 2018:IIIQ Nevada Unemployment Rate Demographics Report* Department of Employment, Training & Rehabilitation Research and Analysis Bureau Dr. Tiffany Tyler-Garner, Director Dennis Perea, Deputy Director
This is a PDF version of the 2019 Law survey. To complete the survey, follow this link to the online form.
 This is a PDF version of the 2019 Law360 400 survey. To complete the survey, follow this link to the online form. Welcome to the 2019 Law360 400 survey! The answers to these questions will be used for
Occupation Overview Industrial Health & Safety Related Occupations in Kern
 Occupation Overview Industrial Health & Safety Related Occupations in Kern EMSI Q2 2015 Data Set Taft College 29 Emmons Park Drive Taft, California 93268 661.763.7700 EMSI Q2 2015 Data Set www.economicmodeling.com
City of Modesto Homeowner Rehabilitation Program
 City of Modesto Homeowner Rehabilitation Program Overview The City of Modesto s (City) Homeowner Rehabilitation Program is designed to repair or eliminate health and safety hazards in residential properties,
MetroWest Health Foundation Trends and Projections
 MetroWest Health Foundation Trends and Projections Seleeke Flingai, PhD, MPA Research Analyst II Metropolitan Area Planning Council November 16, 2018 DRAFT Natick, MA Photo credit: Natick Department of
Minnesota Energy Industry
 Energy Industry Jobs Q3 2000 Q3 2001 Q3 2002 Q3 2003 Q3 2004 Q3 2005 Q3 2006 Q3 2007 Q3 2008 Q3 2009 Q3 2010 Q3 2011 Q3 Q3 Q3 Q3 Q3 2016 Minnesota Energy Consortium April 13, 2017 Cameron Macht DEED Labor
REGIONAL SNAPSHOT. Eastern Shore Region, Virginia
 REGIONAL SNAPSHOT Eastern Shore Region, Virginia Table of contents 01 Overview 04 Labor force 02 Demography 05 Industry and occupation 03 Human capital 01 overview Eastern Shore Region, VA What is a regional
Occupation Overview Criminal Justice Administration-Corrections Related Occupations in Kern
 Occupation Overview Criminal Justice Administration-Corrections Related Occupations in Kern EMSI Q2 2015 Data Set Taft College 29 Emmons Park Drive Taft, California 93268 661.763.7700 EMSI Q2 2015 Data
Aging in America: Income and Assets of People on Medicare
 Aging in America: Income and Assets of People on Medicare November 6, 2015 National Health Policy Forum Gretchen Jacobson, Ph.D. Associate Director, Program on Medicare Policy Kaiser Family Foundation
REGIONAL SNAPSHOT. Indiana 15 Regional Planning Commission Region, Indiana
 REGIONAL SNAPSHOT Indiana 15 Regional Planning Commission Region, Indiana Table of contents 01 Overview 04 Labor force 02 Demography 05 Industry and occupation 03 Human capital 01 overview Indiana 15 Regional
REGIONAL SNAPSHOT. Northern Shenandoah Valley Regional Partnership (NSVRP), Virginia
, Virginia") REGIONAL SNAPSHOT Northern Shenandoah Valley Regional Partnership (NSVRP), Virginia Table of contents 01 Overview 04 Labor force 02 Demography 05 Industry and occupation 03 Human capital 01 overview Northern
REGIONAL SNAPSHOT Northern Shenandoah Valley Regional Partnership (NSVRP), Virginia Table of contents 01 Overview 04 Labor force 02 Demography 05 Industry and occupation 03 Human capital 01 overview Northern
LAKE FOREST NEIGHBORHOOD PROFILE
 LAKE FOREST NEIGHBORHOOD PROFILE July 2017 Prepared in Partnership Between the Kentucky State Data Center at the University of Louisville and Metro United Way This data profile uses 2010 census tract boundaries
Regional Health Assessment. for Greater Kansas City
 2015 Regional Health Assessment for Greater Kansas City Prepared for the REACH Healthcare Foundation by the Mid-America Regional Council www.reachhealth.org 913-432-4196 www.marc.org 816-474-4240 Dean
REGIONAL SNAPSHOT. Crossing Borders Region (CBR), Oklahoma
, Oklahoma") REGIONAL SNAPSHOT Crossing Borders Region (CBR), Oklahoma Table of contents 01 Overview 04 Labor force 02 Demography 05 Industry and occupation 03 Human capital 01 overview Crossing Borders Region, OK
REGIONAL SNAPSHOT Crossing Borders Region (CBR), Oklahoma Table of contents 01 Overview 04 Labor force 02 Demography 05 Industry and occupation 03 Human capital 01 overview Crossing Borders Region, OK
City of Coachella First Time Home Buyer Program
 City of Coachella First Time Home Buyer Program The City of Coachella s (City) First-time Homebuyer Down Payment Assistance Program provides deferred-payment, low-interest loans to assist low income families
39% 22% 56% 49% 35% 60% PROFILE. Assets & opportunity ProfILe: winston-salem ANd forsyth CoUNtY. KeY HIgHLIgHts. AboUt the ProfILe
 Assets & opportunity ProfILe: winston-salem ANd forsyth CoUNtY ASSETS & OPPORTUNITY PROFILE KeY HIgHLIgHts 39% of Winston-Salem households live in asset poverty Cities have long been thought of as places
Occupation Overview. EMSI Q Data Set. Criminal Justice Program. October Western Technical College
 Occupation Overview EMSI Q2 2015 Data Set Criminal Justice Program October 2015 Western Technical College 400 Seventh Street La Crosse, Wisconsin 54601 608.785.9200 EMSI Q2 2015 Data Set www.economicmodeling.com
Purchase of Service Data: Regional Center of Orange County
 California s Protection & Advocacy System Toll-Free (800) 776-5746 Purchase of Service Data: Regional Center of Orange County December 2013, Pub #F090.01 In 2012 a new law was added to the Lanterman Act.
Purchase of Service Data: San Andreas Regional Center
 California s Protection & Advocacy System Toll-Free (800) 776-5746 Purchase of Service Data: San Andreas Regional Center December 2013, Pub #F092.01 In 2012 a new law was added to the Lanterman Act. The
NORTH MINNEAPOLIS: INTRODUCTION
 NORTH MINNEAPOLIS: INTRODUCTION This report is part of a larger collaborative between the Local Initiatives Support Corporation (LISC) and the Center for Urban and al Affairs (CURA) that addresses regional
REGIONAL SNAPSHOT. Partner for Progress Region, NE
 REGIONAL SNAPSHOT Partner for Progress Region, NE Table of contents 01 Overview 04 Labor force 02 Demography 05 Industry and occupation 03 Human capital 01 overview Partner for Progress Region, NE What
From Crisis to Transition Demographic trends and American housing futures, with lessons from Texas
 From Crisis to Transition Demographic trends and American housing futures, with lessons from Texas Rolf Pendall, Ph.D. The Urban Institute Presentation to the Bipartisan Housing Commission, San Antonio,
Demographic Trends and the Older Workforce
 Demographic Trends and the Older Workforce November 10, 2004 Linda Barrington, Ph.D. The Conference Board www.conference-board.org THE CONFERENCE BOARD Finding solutions together Councils Conferences Symposium
2018 Trustee & Employee Diversity Update. June 2018
 2018 Trustee & Employee Diversity Update June 2018 Highlights at a Glance Established DEI Task Force & Steering Committee DEI Transparency: posted demographic data publicly Defined diversity, equity and
Economic Overview City of Tyler, TX. January 8, 2018
 Economic Overview City of Tyler, TX January 8, 2018 DEMOGRAPHIC PROFILE...3 EMPLOYMENT TRENDS...5 WAGE TRENDS...5 COST OF LIVING INDEX...6 INDUSTRY SNAPSHOT...7 OCCUPATION SNAPSHOT...9 INDUSTRY CLUSTERS...
Nickel & Dimed In Pennsylvania The Falling Purchasing Power of the Tipped Minimum Wage By Mark Price 1 September 17, 2013
 Nickel & Dimed In Pennsylvania The Falling Purchasing Power of the Tipped Minimum Wage By Mark Price 1 September 17, 2013 KEYSTONE RESEARCH CENTER 412 N. Third St. Harrisburg PA 17101 717.255.7181 Executive
Closing the Racial Wealth Divide
 Closing the Racial Wealth Divide United for a Fair Economy Phone: (617) 423-2148 Fax: (617) 423-0191 Web: www.faireconomy.org Email: info@faireconomy.org September 2006 The Nation at a Crossroads What
What America Is Thinking On Energy Issues February 2016
 What America Is Thinking On Energy Issues February 2016 South Carolina Presented by: Harris Poll Interviewing: January 22-31, 2016 Respondents: 600 Registered Voters Method: Telephone Weighting: Results
What America Is Thinking About Energy Issues February 2016 Presented by: Harris Poll
 What America Is Thinking About Energy Issues February 2016 Virginia Presented by: Harris Poll Interviewing: January 22 February 1, 2016 Respondents: 630 Registered Voters Method: Telephone Weighting: Results
The Health of Jefferson County: 2010 Demographic Update
 The Health of : 2010 Demographic Update BACKGROUND How people live the sociodemographic context of their lives influences their health. People who have lower incomes may not have the resources to meet
NEW MEXICO Budget Cuts Hurt Families, Communities, and the Economy
 THE COST OF CUTS IN NEW MEXICO Budget Cuts Hurt Families, Communities, and the Economy INTRODUCTION In 2008, the United States experienced a severe financial crisis, the result of increasingly risky practices
Covered California Delivering on the Promise of Care. State of Reform Health Policy Conference Anne Price November 6, 2015
 Covered California Delivering on the Promise of Care State of Reform Health Policy Conference Anne Price November 6, 2015 Covered California s Promise: Better Care Healthier People Lower Cost How Covered
Economic Overview York County, South Carolina. February 14, 2018
 Economic Overview York County, February 14, 2018 DEMOGRAPHIC PROFILE... 3 EMPLOYMENT TRENDS... 5 UNEMPLOYMENT RATE... 5 WAGE TRENDS... 6 COST OF LIVING INDEX... 6 INDUSTRY SNAPSHOT... 7 OCCUPATION SNAPSHOT...
Rifle city Demographic and Economic Profile
 Rifle city Demographic and Economic Profile Community Quick Facts Population (2014) 9,289 Population Change 2010 to 2014 156 Place Median HH Income (ACS 10-14) $52,539 State Median HH Income (ACS 10-14)
THE STATE OF WORKING ALABAMA
 THE STATE OF WORKING ALABAMA 2006 ARISE CITIZENS POLICY PROJECT THE STATE OF WORKING ALABAMA 2006 Arise Citizens Policy Project (ACPP) has partnered with the Economic Policy Institute (EPI) to assess the
Jane Place Neighborhood Sustainability Initiative! Application:! Palmyra Apartments!
 Thank you for contacting Jane Place Neighborhood Sustainability Initiative regarding rental availabilities at 2739 Palmyra Street. The first step in the process is to complete the enclosed application."
GERMANTOWN-PARISTOWN NEIGHBORHOOD PROFILE
 GERMANTOWN-PARISTOWN NEIGHBORHOOD PROFILE July 2017 Prepared in Partnership Between the Kentucky State Data Center at the University of Louisville and Metro United Way Louisville s traditional urban neighborhoods
Economic Overview Long Island
 Report created on August 29, 2017 Economic Overview Long Island Contact: Lisa.Montiel@suny.edu DEMOGRAPHIC PROFILE... 3 EMPLOYMENT TRENDS... 5 UNEMPLOYMENT RATE... 5 WAGE TRENDS... 6 COST OF LIVING INDEX...
SOUTH LOUISVILLE NEIGHBORHOOD PROFILE
 SOUTH LOUISVILLE NEIGHBORHOOD PROFILE July 2017 Prepared in Partnership Between the Kentucky State Data Center at the University of Louisville and Metro United Way Louisville s traditional urban neighborhoods
EASTWOOD-LONG RUN NEIGHBORHOOD PROFILE
 EASTWOOD-LONG RUN NEIGHBORHOOD PROFILE July 2017 Prepared in Partnership Between the Kentucky State Data Center at the University of Louisville and Metro United Way This data profile uses 2010 census tract
State of Working Colorado 2013
 State of Working Colorado 2013 By Andrew Ball 0 The Colorado Center on Law and Policy advances the health, economic security and wellbeing of lowincome Coloradans through research, education, advocacy
PLANNING FOR RETIREMENT: ADDRESSING THE RETIREMENT SECURITY GAP IN BLACK AND HISPANIC HOUSEHOLDS
 December 2018 PLANNING FOR RETIREMENT: ADDRESSING THE RETIREMENT SECURITY GAP IN BLACK AND HISPANIC HOUSEHOLDS The latest National Retirement Risk Index (NRRI) research explores the retirement preparedness
Economic Overview Monterey County, California. July 22, 2016
 Economic Overview Monterey July 22, 2016 DEMOGRAPHIC PROFILE... 3 EMPLOYMENT TRENDS... 5 UNEMPLOYMENT RATE... 5 WAGE TRENDS... 6 COST OF LIVING INDEX... 6 INDUSTRY SNAPSHOT... 7 OCCUPATION SNAPSHOT...
SHELBY PARK NEIGHBORHOOD PROFILE
 SHELBY PARK NEIGHBORHOOD PROFILE July 2017 Prepared in Partnership Between the Kentucky State Data Center at the University of Louisville and Metro United Way Louisville s traditional urban neighborhoods
Economic Overview Loudoun County, Virginia. October 23, 2017
 Economic Overview October 23, 2017 DEMOGRAPHIC PROFILE... 3 EMPLOYMENT TRENDS... 5 UNEMPLOYMENT RATE... 5 WAGE TRENDS... 6 COST OF LIVING INDEX... 6 INDUSTRY SNAPSHOT... 7 OCCUPATION SNAPSHOT... 9 INDUSTRY
DEMOGRAPHIC PROFILE...3 EMPLOYMENT TRENDS...5 UNEMPLOYMENT RATE...5 WAGE TRENDS...6 COST OF LIVING INDEX...6 INDUSTRY SNAPSHOT...7
 March 14, 2017 DEMOGRAPHIC PROFILE...3 EMPLOYMENT TRENDS...5 UNEMPLOYMENT RATE...5 WAGE TRENDS...6 COST OF LIVING INDEX...6 INDUSTRY SNAPSHOT...7 OCCUPATION SNAPSHOT...9 INDUSTRY CLUSTERS... 12 EDUCATION
Expanding the CalEITC: A Smart Investment to Broaden Economic Security in California
 calbudgetcenter.org Expanding the CalEITC: A Smart Investment to Broaden Economic Security in California @alissa_brie @skimberca @CalBudgetCenter ALISSA ANDERSON, SENIOR POLICY ANALYST SARA KIMBERLIN,
CHEROKEE-SENECA NEIGHBORHOOD PROFILE
 CHEROKEE-SENECA NEIGHBORHOOD PROFILE July 2017 Prepared in Partnership Between the Kentucky State Data Center at the University of Louisville and Metro United Way Louisville s traditional urban neighborhoods
FAMILY ASSETS FOR INDEPENDENCE IN MINNESOTA (FAIM) FAIM New Participant Application Form AGENCY USE ONLY : Agency Name:
 FAIM New Participant Application Form AGENCY USE ONLY : Agency Name:") FAMILY ASSETS FOR INDEPENDENCE IN MINNESOTA (FAIM) AGENCY USE ONLY : FAIM New Participant Application Form Revised 05/23/14 Agency Name: Bank Account Number of 1 st Deposit Asset Grant First Name MI Last
FAMILY ASSETS FOR INDEPENDENCE IN MINNESOTA (FAIM) AGENCY USE ONLY : FAIM New Participant Application Form Revised 05/23/14 Agency Name: Bank Account Number of 1 st Deposit Asset Grant First Name MI Last
October 28, Economic Overview Yellowstone County, Montana
 October 28, 2016 Economic Overview Yellowstone DEMOGRAPHIC PROFILE...3 EMPLOYMENT TRENDS...5 UNEMPLOYMENT RATE...5 WAGE TRENDS...6 COST OF LIVING INDEX...6 INDUSTRY SNAPSHOT...7 OCCUPATION SNAPSHOT...9
Economic Overview Western New York
 Report created on August 29, 2017 Economic Overview Western New Contact: Lisa.Montiel@suny.edu DEMOGRAPHIC PROFILE... 3 EMPLOYMENT TRENDS... 5 UNEMPLOYMENT RATE... 5 WAGE TRENDS... 6 COST OF LIVING INDEX...
Contingent and Alternative Employment Arrangements, May U.S. BUREAU OF LABOR STATISTICS bls.gov
 Contingent and Alternative Employment Arrangements, May 2017 1 U.S. BUREAU OF LABOR STATISTICS bls.gov Gig economy No official BLS definition of gig economy or gig workers Researchers use many different
Economic Overview Fairfax / Falls Church. October 23, 2017
 Economic Overview Fairfax / Falls Church October 23, 2017 DEMOGRAPHIC PROFILE... 3 EMPLOYMENT TRENDS... 5 UNEMPLOYMENT RATE... 5 WAGE TRENDS... 6 COST OF LIVING INDEX... 6 INDUSTRY SNAPSHOT... 7 OCCUPATION
PORTLAND NEIGHBORHOOD PROFILE
 PORTLAND NEIGHBORHOOD PROFILE July 2017 Prepared in Partnership Between the Kentucky State Data Center at the University of Louisville and Metro United Way Louisville s traditional urban neighborhoods
Economic Overview Long Island
 Report created on October 20, 2015 Economic Overview Long Island Created using: Contact: Lisa.Montiel@suny.edu DEMOGRAPHIC PROFILE...3 EMPLOYMENT TRENDS...5 UNEMPLOYMENT RATE...5 WAGE TRENDS...6 COST OF
Economic Overview New York
 Report created on October 20, 2015 Economic Overview Created using: Contact: Lisa.Montiel@suny.edu DEMOGRAPHIC PROFILE...3 EMPLOYMENT TRENDS...5 UNEMPLOYMENT RATE...5 WAGE TRENDS...6 COST OF LIVING INDEX...6
Economic Development Strategy Appendix I: Data Summary. Data Summary
 Economic Development Strategy Appendix I: 1 DATA CAVEATS Multiple sources, scales, and time periods Connect and triangulate, don t fixate This is sifted & simplified This is one of several City analyses
REPORT. Hispanics and the Social Security Debate. Richard Fry. Rakesh Kochhar. Jeffrey Passel. Roberto Suro. March 16, 2005
 REPORT March 16, 2005 Hispanics and the Social Security Debate By Richard Fry Rakesh Kochhar Jeffrey Passel Roberto Suro Pew Hispanic Center A Pew Research Center Project www.pewhispanic.org 1615 L Street,