WEST CONTRA COSTA UNIFIED SCHOOL DISTRICT Richmond, California. FINANCIAL STATEMENTS June 30, 2013
|
|
|
- Jean Sabrina Malone
- 5 years ago
- Views:
Transcription
1 Richmond, California FINANCIAL STATEMENTS June 30, 2013
2 FINANCIAL STATEMENTS WITH SUPPLEMENTARY INFORMATION For the Year Ended June 30, 2013 TABLE OF CONTENTS Page Independent Auditor's Report 1 Management's Discussion and Analysis 4 Basic Financial Statements: Government-Wide Financial Statements: Statement of Net Position 15 Statement of Activities 16 Fund Financial Statements: Balance Sheet - Governmental Funds 17 Reconciliation of the Governmental Funds Balance Sheet - to the Statement of Net Position 18 Statement of Revenues, Expenditures and Change in Fund Balances - Governmental Funds 19 Reconciliation of the Statement of Revenues, Expenditures and Change in Fund Balances - Governmental Funds - to the Statement of Activities 20 Statement of Net Position - Proprietary Fund - Self-Insurance Fund 22 Statement of Change in Net Position - Proprietary Fund - Self-Insurance Fund 23 Statement of Cash Flows - Proprietary Fund - Self-Insurance Fund 24 Statement of Fiduciary Net Position - Trust and Agency Funds 25 Statement of Change in Fiduciary Net Position - Retiree Benefits Trust Fund 26 Notes to Basic Financial Statements 27
3 FINANCIAL STATEMENTS WITH SUPPLEMENTARY INFORMATION For the Year Ended June 30, 2013 TABLE OF CONTENTS (Continued) Page Required Supplementary Information: General Fund Budgetary Comparison Schedule 60 Schedule of Other Postemployment Benefits (OPEB) Funding Progress 61 Notes to Required Supplementary Information 62 Supplementary Information: Combining Balance Sheet - All Non-Major Funds 63 Combining Statement of Revenues, Expenditures and Change in Fund Balances - All Non-Major Funds 64 Organization 65 Schedule of Average Daily Attendance 66 Schedule of Instructional Time 67 Schedule of Expenditure of Federal Awards 68 Reconciliation of Unaudited Actual Financial Report with Audited Financial Statements 71 Schedule of Financial Trends and Analysis - Unaudited 72 Schedule of Charter Schools 73 Notes to Supplementary Information 74 Independent Auditor's Report on Compliance with State Laws and Regulations 75 Independent Auditor's Report on Internal Control over Financial Reporting and on Compliance and Other Matters Based on an Audit of Financial Statements Performed in Accordance with Government Auditing Standards 78
4 FINANCIAL STATEMENTS WITH SUPPLEMENTARY INFORMATION For the Year Ended June 30, 2013 TABLE OF CONTENTS (Continued) Page Independent Auditor's Report on Compliance for Each Major Federal Program and Report on Internal Control Over Compliance 80 Findings and Recommendations: Schedule of Audit Findings and Questioned Costs 82 Status of Prior Year Findings and Recommendations 87
5
6

7
8 Bruce Harter, Ph.D. Superintendent of Schools INTRODUCTION 1108 Bissell Avenue Richmond, CA Telephone (510) MANAGEMENT S DISCUSSION AND ANALYSIS (MD&A) Sheri Gamba Associate Superintendent Business Services Management's discussion and analysis of West Contra Costa Unified School District s (District) financial performance provides an overview of the District s financial activities for the fiscal year ended June 30, It should be read in conjunction with the District s financial statements. The Management s Discussion and Analysis (MD&A) is an element of the reporting model adopted by the Governmental Accounting Standards Board (GASB) in their Statement No. 34, Basic Financial Statements and Management s Discussion and Analysis for State and Local Governments, issued June 1999; GASB Statement No. 37, Basic Financial Statements and Management s Discussion and Analysis for State and Local Governments: Omnibus, an amendment to GASB Statements No. 21 and No. 34, issued in June 2001; GASB Statement No. 38, Certain Financial Statement Note Disclosures issued in 2001 and GASB Statement No. 45, Accounting and Financial Reporting by Employers for Postemployment Benefits Other Than Pensions, issued in Certain comparative information between the current year and the prior year is required to be presented in the MD&A. FINANCIAL AND EDUCATIONAL HIGHLIGHTS The District s financial position has stabilized over the past year. The net position of the District as of June 2013 is $202,490,983 as compared to the June 2012 restated net position, $203,049,575 a net decline of $558,592. The financial statements cap off another year of uncertainty as it relates to the State and National economy. However with the passage of Proposition 30 in the November of 2012, and the commitment from the State of California to reduce the deferrals the District was able to avoid interfund or external borrowing for cash. In spite of the improvement the District was still owed over $24 million in unrestricted general fund dollars at the end of the year. The District prepares for the school year with a sense of hope for the new Local Control Funding Formula (LCFF), which promises an eight year implementation that will bring the District increased revenues, and an ability to better serve our neediest students. The landmark legislation is being shepherded in over the course of with new budget, community engagement and activity accountability provisions. The District has tackled the difficult task of managing a budget in order to remain solvent during tough times, now it will tackle the new LCFF with equal resolve for success. 4
9 REPORTING THE DISTRICT AS A WHOLE The complete annual financial report is a product of three separate parts: the basic financial statements, supplementary information, and this section, Management's Discussion and Analysis. The three sections together provide a comprehensive overview of the District. The basic financials are comprised of two kinds of statements that present financial information from different perspectives, District-wide and funds. District-wide financial statements, which comprise the first two statements, provide both short-term and long-term information about the District s overall financial position. Individual parts of the District, which are reported as fund financial statements, focus on reporting the District s operations in more detail. These fund financial statements comprise the remaining statements. Basic services funding (i.e., regular and special education) is described in the governmental funds statements. Short and long-term financial information about the activities of the District that operate like businesses (self-insurance funds) are provided in the proprietary funds statements. Financial relationships, for which the District acts solely as an agent or trustee, for the benefit of others to whom the resources belong, are presented in the fiduciary fund statements. Notes to the basic financials, which are included in the financial statements, provide more detailed data and explain some of the information in the statements. A comparison of the District s budget for the year is included as required supplementary information. 5
10 The following matrix summarizes the major features of the District s financial statements, including the portion of the District s activities they cover and the types of information they contain. The remainder of the overview section of management s discussion and analysis highlights the structure and contents of each of the statements. Major Features of the District-Wide and Fund Financial Statements Fund Statements Type of Statement District-wide Governmental Funds Proprietary Funds Fiduciary Funds Scope Required financial statements Accounting basis and measurement focus Type of asset/liability information Type of inflow/outflow information Entire district, except fiduciary activities Statement of net position Statement of activities Accrual accounting and economic resources focus All assets and liabilities, both financial and capital, short-term and longterm All revenues and expenses during year, regardless of when cash is received or paid The activities of the district that are not proprietary or fiduciary, such as special revenue and debt service funds Balance sheet Statement of revenues, expenditures & changes in fund balances Modified accrual accounting and current financial resources focus Only assets expected to be used up and liabilities that come due during the year or soon thereafter; no capital assets included Revenues for which cash is received during or soon after the end of the year; expenditures when goods or services have been received and payment is due during the year or soon thereafter OVERVIEW OF THE FINANCIAL STATEMENTS Activities the district operates similar to private businesses: such as the selfinsurance fund Statement of net position Statement of revenues, expenses & changes in fund net position Statement of cash flows Accrual accounting and economic resources focus All assets and liabilities, both financial and capital, short-term and longterm All revenues and expenses during year, regardless of when cash is received or paid Instances in which the district administers resources on behalf of someone else, such as student activities and retiree benefits funds Statement of fiduciary net position Statement of changes in fiduciary net position Accrual accounting and economic resources focus All assets and liabilities, both shortterm and long-term; Standard funds do not currently contain non-financial assets, though they can All revenues and expenses during year, regardless of when cash is received or paid The District s basic financial statements are comprised of three components: 1) District-wide financial statements, 2) fund financial statements and 3) notes to the basic financial statements. 6
11 Government-Wide Financial Statements The government-wide financial statements are designed to provide readers with a broad overview of the District s finances in a manner similar to a private sector s business. The Statement of Net Assets and the Statement of Activities The District as a whole is reported in the District-wide statements and uses accounting methods similar to those used by companies in the private sector. All of the District s assets and liabilities are included in the statement of net assets. The statement of activities reports all of the current year s revenues and expenses regardless of when cash is received or paid. The District s financial health or position (net position) can be measured by the difference between the District s assets and liabilities. Increase or decrease in the net assets of the District over time are indicators of whether its financial position is improving or deteriorating, respectively. Additional non-financial factors such as condition of school buildings and other facilities and changes in the property tax base of the District need to be considered in assessing the overall health of the district. The Statement of Net Position and the Statement of Activities show all District operations as governmental activities, the basic services provided by the District, such as regular and special education, administration and transportation. Property taxes and state formula aid finance most of these activities. The District-wide financial statements can be found on pages 14 through 15 of this report. REPORTING THE DISTRICT S MOST SIGNIFICANT FUNDS Fund Financial Statements A fund is a group of related accounts that is used to maintain control over resources that have been segregated for specific activities or objectives. The District, like other local governments, uses fund accounting to ensure compliance with finance-related legal requirements. Fund financial statements report essentially the same functions as those reported in the District-wide financial statements. However, unlike the District-wide financial statements, fund financial statements focus on near-term inflows and outflows of spendable resources, as well as on balances of spendable resources available at the end of the fiscal year. 7
12 The District has three kinds of funds: Governmental Funds Most of the District s basic services are included in governmental funds, which generally focus on: 1. How cash and other financial assets can be readily converted to cash flow (in and out). 2. The balances left at year-end that are available for spending. The governmental fund statements provide a detailed short-term view. These help determine whether there are more or fewer financial resources that can be spent in the near future for financing the District s programs. Because this kind of information does not encompass the additional long-term focus of the District-wide statements, additional information is provided on page 18 that explains the differences (or relationships) between them. Proprietary Funds The proprietary fund category includes Internal Service Funds. Internal Service funds report activities that provide supplies and services for the other programs and activities of the District. The District has one internal fund: a self-insurance fund. Fiduciary Funds For assets that belong to others, such as the scholarship fund and/or student activities fund, the District acts as the trustee, or fiduciary. The District is responsible for ensuring that the assets reported in these funds are used only for their intended purposes. A separate statement of fiduciary net position and a statement of change in fiduciary net position report the District s fiduciary activities. These activities are excluded from the District-wide financial statements, as the District cannot use the assets to finance the operations. THE DISTRICT AS A WHOLE Net Assets The District s combined net position was lower on June 30, 2013 than it was the year before decreasing by $0.6 million to $202.5 million as reflected on the next page. 8
13 Net Position GOVERNMENTAL ACTIVITIES Current Assets $ 216,749,190 $ 304,687,783 Capital Assets 1,029,566, ,032,972 Total Assets 1,246,315,801 1,275,720,755 Deferred Outflows Deferred loss on refunding 3,005,267 0 Current Liabilities 34,323,115 52,541,526 Long-term Liabilities 1,012,506,970 1,009,279,010 Total Liabilities 1,046,830,085 1,061,820,536 Net Position: Net Investment in Capital Assets, net of related debt 174,254, ,455,424 Restricted For: Capital Projects 17,899,950 50,488,711 Debt Service 48,126,375 47,714,715 Educational Programs 21,983,898 26,055,436 Other Purposes 8,936,696 8,811,871 Unrestricted (68,709,937) (53,625,938) Effect of change in accounting principal (10,850,644) Total Net Position $ 202,490,983 $ 203,049,575 The District's financial position is the product of many factors. However, three events of the last year stand out: Through the bond program, together with State apportionments for school facilities, the District has continued construction of new schools and has continued the process of renovating its existing schools. These activities have increased the capital assets of the District. The Board was able to increase District reserves and now maintains $11.7 million in the Districts Special Reserve Fund, these dollars were set aside as insurance toward potential cuts during the economic downturn. The District s pay off of the State loan in 2012 and the payoff of other long term debt from the 1990 s, released the District from the oversight of a State Trustee. This is year-end closing marks the one year anniversary of the pay-off and highlights the Board s commitment to ongoing fiscal responsibility. 9
14 Changes in Net Position The District s total expenditures exceeded its revenue by $0.6 million. Property taxes, State Aid and other general sources accounted for most of the District s revenues contributing approximately 66 cents per every dollar of revenue received while Federal, State and local grants and contributions for specific purposes provided approximately 34 cents of every dollar of revenue. GOVERNMENTAL ACTIVITIES Revenues: Program revenues: Charges for Services $ 961,324 $ 1,018,569 Operating Grants and Contributions 81,148,964 90,954,406 Capital Grants and Contributions 19,021,544 15,847,349 Total Program Revenues 101,131, ,820,324 General Revenues: Property Taxes 130,734, ,963,108 Federal and State Aid 118,672, ,022,794 Interest and Investment Earnings 512, ,458 Interagency revenues: Miscellaneous 5,024,888 4,366,687 Total General Revenues 254,944, ,059,047 Total Revenues 356,076, ,879,371 Expenses: Instruction 164,357, ,712,977 Support Services: Administrative 43,109,309 43,025,262 Student Support 43,410,992 41,317,106 Non-Student Support 19,206,508 16,304,857 Plant Services 32,965,110 30,790,480 Ancillary Services 7,167,818 7,829,975 Transfers between agencies 1,124,895 2,802,547 Community Services 166, ,465 Interest on long-term debt 45,127,115 37,650,021 Total Expenses 356,635, ,588,690 Change in Net Position $ (558,592) $ 19,290,681 Governmental Activities The following table presents the costs of five major activities: Instruction, Support Services, Facility and Plant Services, Ancillary Services and Other. The table also shows each activity s net cost (total cost less fees generated by the activities and intergovernmental aid provided for specific programs). The net cost of services shows the financial burden that was placed on the District for each of these functions. 10
15 The cost of all programs was $356.6 million for this fiscal year. The users of District programs as well as Federal, State and local governments who provided funds for specific programs provided $101.1 million. The balance of the District s expenditures was paid for by State apportionments for ADA and by local property taxes. Property taxes comprised of $130,734,829 of this amount while Federal and State education aid formulas contributed the remaining $118,672,377. Total Cost Net (Expense) Revenue Total Cost Net (Expense) Revenue Instruction $ 164,357,143 $ (108,912,961) $ 166,712,977 $ (106,595,668) Support Services 105,726,809 (66,633,643) 100,647,225 (60,184,844) Facilities and Plant 32,965,110 (31,635,568) 30,790,480 (29,400,850) Ancillary Services 7,167,818 (1,904,475) 7,829,975 (2,269,491) Other 46,418,205 (46,416,606) 40,608,033 (40,317,513) Total $ 356,635,085 $ (255,503,253) $ 346,588,690 $ (238,768,366) THE DISTRICT S FUNDS The financial position of the District as a whole is reflected in its governmental fund statements. As the District completed the year, its governmental funds reported a combined fund balance of $188 million, below last year s combined ending fund balance of $249 million. This decrease is due to activities in the District s Building Fund. General Fund Budgetary Highlights Over the course of the year, the District revises the annual operating budget several times due to changes in State and federal funding. The District is required to prepare financial reports for the school board twice a year. This is done through the preparation of the First and Second Interim Reports, which are prepared based on information available as of October 31 and January 31 respectively. Budget adjustments and revisions can be classified into the following types: Appropriation of prior year ending fund balances and deferred revenues derived primarily from Federal, State and local government sources for specific programs. New appropriations or budget augmentations for programs and expenditures that were not known or anticipated at the time of budget development. The final revised general fund budget of the District reflected anticipated revenues of $262.7 million against appropriated expenditures of $290 million thus anticipating a decrease of $27.3 million in overall fund balance. This variance is due to potential expenditure of prior year restricted grant fund balances and spending some of the special reserve fund balance. 11
16 Actual revenues were less than anticipated and actual expenditures were also less than anticipated. The combination of these variances resulted in a higher million than projected ending fund balance, the majority of the variance occurred due to restricted fund (grant related) items. Summary of Revenues for Governmental Function The following schedule represents a summary of the general operating fund, special revenue fund, capital projects fund and debt service fund revenues for the fiscal year ended June 30, 2013, and the increase and decrease (in amount and percentage) in relations to prior year amounts. Increase (Decrease) Percent Increase 2013 Percent of From Prior (Decrease) From Fiscal Year Total Fiscal Year Prior Fiscal Year Revenue Limit Sources $ 149,957,871 42% $ 2,111, % Federal 42,786,953 12% (7,990,462) (15.74)% Other State 84,878,249 24% (2,480,298) (2.84)% Other Local 77,077,224 22% (3,985,141) (4.92)% Total Revenues $ 354,700, % $ (12,344,285) (3.36)% The following schedule represents a summary of the general operating fund, special revenue fund, capital projects fund, and bond interest & redemption fund expenditures for the fiscal year ended June 30, 2013, and the increase and decrease (in amount and percentage) in relations to prior year amounts. Summary of Expenditures by Object Code Increase (Decrease) Percent Increase 2013 Percent of From Prior (Decrease) From Fiscal Year Total Fiscal Year Prior Fiscal Year Certificated salaries $ 107,725, % $ (1,435,965) (1.31)% Classified salaries 48,672, % 739, % Employee benefits 64,730, % 227, % Books and supplies 17,773, % (3,654,001) (17.05)% Services, other operation expenses 53,550, % 1,101, % Capital outlay 68,563, % (23,144,277) (25.24)% Debt service: Principal 20,567, % (6,789,550) (24.81)% Interest 33,844, % 1,547, % Other outgo 59, % 29, % Total Expenditures $ 415,486, % $ (31,376,847) (7.02)% 12
17 CAPITAL ASSET AND DEBT ADMINISTRATION By June 30, 2013, the District had invested $1.3 billion in a broad range of capital assets including land, school buildings, athletic facilities, computer and audio-visual equipment as well as support facilities as reflected in the following table. Additional information about the capital assets of the District can also be found in footnote 4. Total depreciation expense for the year was $20.5 million while additions to net capital assets amounted to approximately $58.5 million. Construction, planning and design activities continued during the year related to the renovation of the District s elementary and secondary schools. Capital Assets Governmental Activities Balance, Balance, July 1, 2012 Additions Reductions June 30, 2013 Governmental activities: Land $ 52,371,291 $ - $ - $ 52,371,291 Site Improvements 61,980,429 4,122,896-66,103,325 Buildings 803,589,807 86,809, ,398,893 Machinery and Equipment 13,993,750 3,090,991 (1,692,147) 15,392,604 Construction In Progress 303,721,265 76,921,186 (98,771,833) 281,870,618 Totals at historical cost 1,235,656,542 80,012,177 (100,463,980) 1,306,136,731 Less: accumulated depreciation Site Improvements (41,046,185) (1,544,223) (775,248) (41,815,160) Buildings (216,049,750) (17,579,749) (6,513,548) (227,115,951) Machinery and Equipment (7,527,635) (1,361,703) (1,250,329) (7,639,009) Total accumulated depreciation (264,623,570) (20,485,675) (8,539,125) (276,570,120) Governmental activities, capital Assets, Net $ 971,032,972 $ 59,526,502 $ (992,863) $ 1,029,566,611 Long-Term Liabilities In recent years the District has received approval from the voters to issue $1.63 billion in bonds. Measure E was approved for $40 million in November 1998 to fund various capital improvement projects and to construct a new middle school. Measure M in the amount of $150 million was approved in November 2000 to renovate the elementary schools of the District. Measure D was approved in March 2002 to renovate the secondary schools of the District as well as provide additional funds to supplement Measure M. This measure is in the amount of $300 million. Measure J was approved for $400 million in November 2005 to continue repairing all school facilities, improve classroom safety and technology. Measure D was approved for $380 million in 2010 and Measure E was approved for $360 million in November 2012 and will be used toward the continued renovation and rebuilding program for elementary and secondary schools. The District will continue to sell and issue bonds authorized by these measures in amounts necessary to meet the cash flow needs of the construction projects as they progress over the next several years. 13
18 Long-Term Liabilities (continued) At year end the District had $1,012.5 million in general obligation bonds and other long-term liabilities outstanding, an increase over the prior year of $3.2 million. The activities of the District s long-term liabilities are reflected in the table below as well as the footnotes to the financial statements in note number 6. The General Obligation Bonds have been sold with insurance at the highest rating possible. Governmental Activities Amounts Balance Balance Due Within July 1, 2012 Additions Deductions June 30, 2013 One Year General Obligation Bonds $ 821,578,849 $ 98,200,000 $ 124,348,713 $ 795,430,136 $ 20,282,206 Accreted Interest 60,762,662 15,269,291-76,031,953 1,427,794 GO Bond Premium 25,353,204 10,180,869 1,947,702 33,586, Certificates of Participation 8,415, ,000 7,915, ,000 Compensated absences 3,422, ,601-3,763,728 - OPEB Obligation 89,718,345 23,087,931 17,026,494 95,779,782 17,814,962 Child care facilities loan 28,823-28, Total Long-term liabilities $ 1,009,279,010 $ 147,079,692 $ 143,851,732 $ 1,012,506,970 $ 40,049,962 The state limits the amount of general obligation debt the District can issue to 2.5 percent of the assessed value of all taxable property within the District s boundaries. The District has applied for and been granted four waivers of this limit by the California State Board of Education, one for Measure D 2002, one for Measure J 2005, one for Measure D 2010 and one for Measure E These waivers allow the District to issue bonds up to an amount not to exceed 3.5% of assessed value for the 2002 Measure D and 2005 Measure J and 5.0% of assessed value for the Measure D 2010 and Measure E 2012 bond authorizations. Notes to Basic Financial Statements The Notes to Basic Financial Statements complement the financial statements by describing qualifying factors and changes throughout the fiscal year. ECONOMIC FACTORS AND NEXT YEAR S BUDGETS AND RATES The State of California has a renewed commitment to fund school districts through the LCFF. The State Budget for includes increased revenue for the District based upon its student population. The District is expecting increased revenue over the 8 year implementation period of the LCFF. The State s economy must continue to grow in order to achieve the funding levels anticipated in the program. The passage of Proposition 30 has helped mitigate the cash flow concerns and provide stability to the District s revenue. 14
19 BASIC FINANCIAL STATEMENTS
20 STATEMENT OF NET POSITION June 30, 2013 ` Governmental Activities ASSETS Cash and investments (Note 2) $ 173,033,520 Receivables 42,868,678 Stores inventory 846,992 Non-depreciable capital assets (Note 4) 334,241,909 Depreciable capital assets, net of accumulated depreciation (Note 4) 695,324,702 Total assets 1,246,315,801 DEFERRED OUTFLOWS Deferred loss from refunding of debt 3,005,267 LIABILITIES Accounts payable 32,918,181 Unpaid claims and claim adjustment expenses (Note 5) 500,000 Unearned revenue 904,934 Long-term liabilities (Note 6): Due within one year 40,049,962 Due after one year 972,457,008 Total liabilities 1,046,830,085 NET POSITION Net investment in capital assets 173,088,892 Restricted (Note 7) 98,112,028 Unrestricted (68,709,937) Total net position $ 202,490,983 See accompanying notes to financial statements. 15
21 STATEMENT OF ACTIVITIES For the Year Ended June 30, 2013 Net (Expense) Revenues and Changes in Program Revenues Net Position Charges Operating Capital for Grants and Grants and Governmental Expenses Services Contributions Contributions Activities Governmental activities (Note 4): Instruction $ 164,357,143 $ - $ 36,422,638 $ 19,021,544 (108,912,961) Instruction-related services: Supervision of instruction 22,024,218-12,660,998 - (9,363,220) Instructional library, media and technology 3,264, ,565 - (2,822,011) School site administration 17,820, ,966 - (17,566,549) Pupil services: Home-to-school transportation 8,320,531-2,033,685 - (6,286,846) Food services 14,485, ,674 12,870,864 - (696,335) All other pupil services 20,604,588-8,264,232 - (12,340,356) General administration: Data processing 5,324, ,376 - (5,166,556) All other general administration 13,881,576 31,853 1,457,953 - (12,391,770) Plant services 32,965,110 10,797 1,318,745 - (31,635,568) Ancillary services 7,167,818-5,263,343 - (1,904,475) Community services 166,195-1,599 - (164,596) Other outgo 1,124, (1,124,895) Interest on long-term liabilities 45,127, (45,127,115) Total governmental activities $ 356,635,085 $ 961,324 $ 81,148,964 $ 19,021,544 $ (255,503,253) General revenues: Taxes and subventions: Taxes levied for general purposes 64,376,754 Taxes levied for debt service 50,515,963 Taxes levied for other specific purposes 15,842,112 Federal and state aid not restricted to specific purposes 118,672,377 Interest and investment earnings 512,567 Miscellaneous 5,024,888 Total general revenues 254,944,661 Change in net position (558,592) Net position, July 1, 2012, as previously stated 213,900,219 Cumulative effect of change in accounting principle (10,850,644) Net position, July 1, 2012, as restated 203,049,575 Net position, June 30, 2013 $ 202,490,983 See accompanying notes to financial statements. 16
22 BALANCE SHEET GOVERNMENTAL FUNDS June 30, 2013 Bond Interest and All Total General Building Redemption Non-Major Governmental Fund Fund Fund Funds Funds ASSETS Cash and investments: Cash in County Treasury $ 26,956,843 $ 60,748,258 $ 48,106,428 $ 22,338,214 $ 158,149,743 Cash awaiting deposit Cash on hand and in banks 22, ,186 43,777 Cash in revolving fund 70, ,000 Cash with Fiscal Agent - 6,120,512-1,042,373 7,162,885 Local Agency Investment Fund 931,982 1,507,313-1,168,335 3,607,630 Receivables 38,991,154 29,723 19,947 3,825,624 42,866,448 Stores inventory 234, , ,992 Total assets $ 67,206,571 $ 68,405,806 $ 48,126,375 $ 29,009,473 $ 212,748,225 LIABILITIES AND FUND BALANCES Liabilities: Accounts payable $ 9,664,874 $ 12,962,438 $ - $ 1,270,465 $ 23,897,777 Unearned revenue 511, , ,934 Total liabilities 10,176,873 12,962,438-1,663,400 24,802,711 Fund balances: Nonspendable 304, , ,992 Restricted 21,983,898 55,443,368 48,126,375 26,733, ,286,723 Assigned 13,039, ,039,725 Unassigned 21,702, ,702,074 Total fund balances 57,029,698 55,443,368 48,126,375 27,346, ,945,514 Total liabilities and fund balances $ 67,206,571 $ 68,405,806 $ 48,126,375 $ 29,009,473 $ 212,748,225 See accompanying notes to financial statements. 17
23 RECONCILIATION OF THE GOVERNMENTAL FUNDS BALANCE SHEET - TO THE STATEMENT OF NET POSITION June 30, 2013 Total fund balances - Governmental Funds $ 187,945,514 Amounts reported for governmental activities in the statement of net position are different because: Capital assets used for governmental activities are not financial resources and, therefore, are not reported as assets in governmental funds. The cost of the assets is $1,306,136,731 and the accumulated depreciation is $276,570,120 (Note 4). 1,029,566,611 Long-term liabilities are not due and payable in the current period and, therefore, are not reported as liabilities in the governmental funds. Long-term liabilities at June 30, 2013 consisted of (Note 6): General Obligation Bonds $ (795,430,136) Premium on General Obligation Bonds (33,586,371) Accreted interest (76,031,953) Certificates of Participation (7,915,000) Other Postemployment Benefits (OPEB) (Note 9) (95,779,782) Compensated absences (3,763,728) (1,012,506,970) Internal service funds are used to conduct certain activities for which costs are charged to other funds on a full cost-recovery basis. Net position of the Self-Insurance Fund is: 1,698,615 In the governmental funds, interest on long-term liabilities is not recognized until the period in which it matures and is paid. In the government-wide statement of activities, it is recognized in the period that it is incurred. (7,218,054) Losses on refundings of debt are categorized as deferred outflows and are amortized over the life of the related debt (Note 6). 3,005,267 Total net position - governmental activities $ 202,490,983 See accompanying notes to financial statements. 18
24 STATEMENT OF REVENUES, EXPENDITURES AND CHANGES IN FUND BALANCES GOVERNMENTAL FUNDS For the Year Ended June 30, 2013 Bond Interest and All Total General Building Redemption Non-Major Governmental Fund Fund Fund Funds Funds Revenues: Revenue limit sources: State apportionment $ 88,565,509 $ - $ - $ - $ 88,565,509 Local sources 61,392, ,392,362 Total revenue limit 149,957, ,957,871 Federal sources 25,624,711-3,947,748 13,214,494 42,786,953 Other state sources 60,899, , ,384 22,920,572 84,878,249 Other local sources 22,115, ,292 50,036,406 3,975,498 77,077,224 Total revenues 258,597,051 1,405,144 54,587,538 40,110, ,700,297 Expenditures: Certificated salaries 105,317, ,407, ,725,336 Classified salaries 41,534,667 1,063,870-6,073,566 48,672,103 Employee benefits 61,417, ,708-2,899,060 64,730,699 Books and supplies 9,380,887 1,933,832-6,458,567 17,773,286 Contract services and operating expenditures 45,764,340 5,675,052-2,111,008 53,550,400 Capital outlay 532,720 42,843,303-25,187,258 68,563,281 Other outgo 59, ,293 Debt service: Principal retirement 500,000-20,038,713 28,823 20,567,536 Interest 628,071-33,216,792-33,844,863 Total expenditures 265,135,820 51,929,765 53,255,505 45,165, ,486,797 (Deficiency) excess of revenues (under) over expenditures (6,538,769) (50,524,621) 1,332,033 (5,055,143) (60,786,500) Other financing sources (uses): Proceeds from issuance of general obligation bonds ,200,000-98,200,000 Refunding of general obligation bonds - - (104,310,000) - (104,310,000) Other proceeds from debt issuance ,180,869-10,180,869 Other financing uses - - (4,070,869) - (4,070,869) Operating transfers in 2,449, ,945,654 4,395,435 Operating transfers out (1,815,654) - - (2,579,781) (4,395,435) Total other financing sources (uses) 634, (634,127) - Net changes in fund balances (5,904,642) (50,524,621) 1,332,033 (5,689,270) (60,786,500) Fund balances, July 1, ,934, ,967,989 46,794,342 33,035, ,732,014 Fund balances, June 30, 2013 $ 57,029,698 $ 55,443,368 $ 48,126,375 $ 27,346,073 $ 187,945,514 See accompanying notes to financial statements. 19
25 RECONCILIATION OF THE STATEMENT OF REVENUES, EXPENDITURES AND CHANGES IN FUND BALANCES - GOVERNMENTAL FUNDS - TO THE STATEMENT OF ACTIVITIES For the Year Ended June 30, 2013 Net changes in fund balances - Total Governmental Funds $ (60,786,500) Amounts reported for governmental activities in the statement of activities are different because: Acquisition of capital assets is an expenditure in the governmental funds, but increases capital assets in the statement of net position (Note 4). $ 80,012,177 Depreciation of capital assets is an expense that is not recorded in the governmental funds (Note 4). (20,485,675) Gain or loss from disposal of capital assets are reported as revenue for entire proceeds in the governmental funds, but in the statement of activities, only the resulting gain or loss is reported (Note 4). (992,863) In governmental funds, if debt is issued at a premium or at a discount, the premium or discount is recognized as revenue in the period it is incurred. In government-wide statements, the premium or discount is amortized as interest over the life of the debt (Note 6). (8,233,167) Repayment or refunding of principal on long-term liabilities is an expenditure in the governmental funds, but decreases the long-term liabilities in the statement of net position (Note 6). 124,877,536 Losses on refundings of debt are categorized as deferred outflows and are amortized over the life of the related debt (Note 6). 3,005,267 In governmental funds, proceeds from debt are recognized as Other Financing Sources, but in the statement of net position as an increases to liabilities. Amounts recognized in governmental funds as proceeds from debt, net of issue premium, were (Note 6). (98,200,000) In governmental funds, interest on long-term liabilities is recognized in the period that it becomes due. In the government-wide statement of activities, it is recognized in the period that it is incurred. 2,039,337 Accreted interest on capital appreciation bonds is not recorded in the governmental funds, but increases the long-term liabilities in the statement of net position (Note 6). (15,269,291) Internal service funds are used to conduct certain activities for which costs are charged to other funds on a full cost recovery basis. Change in net position for the Self-Insurance Fund was. (122,375) (Continued) 20
26 RECONCILIATION OF THE STATEMENT OF REVENUES, EXPENDITURES AND CHANGES IN FUND BALANCES - GOVERNMENTAL FUNDS - TO THE STATEMENT OF ACTIVITIES (Continued) For the Year Ended June 30, 2013 In government funds, OPEB costs are recognized when employer contributions are made. In the statement of activities, OPEB costs are recognized on the accrual basis. This year, the difference between OPEB costs and actual employer contributions was (Notes 6 and 9). $ (6,061,437) In the statement of activities, expenses related to compensated absences are measured by the amounts earned during the year. In the governmental funds, expenditures are measured by the amount of financial resources used (Note 6). (341,601) $ 60,227,908 Change in net position of governmental activities $ (558,592) See accompanying notes to financial statements. 21
27 STATEMENT OF NET POSITION - PROPRIETARY FUND SELF-INSURANCE FUND June 30, 2013 ASSETS Cash and investments: Cash in County Treasury $ 3,996,777 Cash with Fiscal Agent 1,958 Receivables 2,230 Total assets 4,000,965 LIABILITIES Accounts payable 1,802,350 Unpaid claims and claim adjustment expenses 500,000 Total liabilities 2,302,350 NET POSITION Restricted $ 1,698,615 See accompanying notes to financial statements. 22
28 STATEMENT OF CHANGE IN NET POSITION - PROPRIETARY FUND SELF-INSURANCE FUND For the Year Ended June 30, 2013 Operating revenues: Self-insurance premiums $ 1,755,100 Operating expenses: Classified Salaries 74,988 Employee Benefits 37,155 Books and supplies 755 Contract services 1,768,918 Total operating expenses 1,881,816 Operating loss (126,716) Non-operating revenue: Interest income 4,341 Change in net position (122,375) Total net position, July 1, ,820,990 Total net position, June 30, 2013 $ 1,698,615 See accompanying notes to financial statements. 23
29 STATEMENT OF CASH FLOWS - PROPRIETARY FUND SELF-INSURANCE FUND For the Year Ended June 30, 2013 Cash flows from operating activities: Cash received from self-insurance premiums $ 1,755,100 Cash paid for salaries and benefits (112,143) Cash paid for books and supplies (755) Cash paid for contract services (422,694) Cash paid for claims (1,290,881) Net cash used in operating activities (71,373) Cash flows provided by non-capital financing activities: Cash received from agency fund to provide for premium payments 1,715,957 Cash flows provided by investing activities: Interest income received 2,111 Increase in cash and investments 1,646,695 Cash and investments, July 1, ,352,040 Cash and investments, June 30, 2013 $ 3,998,735 Reconciliation of operating loss to net cash used in operating activities: Operating loss $ (126,716) Adjustments to reconcile operating loss to net cash used in operating activities: Increase in accounts payable 55,343 Net cash used in operating activities $ (71,373) See accompanying notes to financial statements. 24
30 STATEMENT OF FIDUCIARY NET POSITION TRUST AND AGENCY FUNDS June 30, 2013 ASSETS Trust Agency Fund Funds Retiree Payroll Student Benefits Clearing Body Trust Fund Funds Total Cash in County Treasury (Note 2) $ 6,683,851 $ 1,433,430 $ - $ 8,117,281 Cash on hand and in banks (Note 2) , ,325 Investments (Note 2) 7,196, ,196,979 Receivables 7,294 47,888-55,182 Total assets 13,888,124 1,481, ,325 16,317,767 LIABILITIES Accounts payable 14,541 1,481,318-1,495,859 Due to student groups , ,325 Total liabilities 14,541 1,481, ,325 2,444,184 NET POSITION Held in trust for retiree benefits (Note 7) $ 13,873,583 $ - $ - $ 13,873,583 See accompanying notes to financial statements. 25
31 STATEMENT OF CHANGE IN FIDUCIARY NET POSITION RETIREE BENEFITS TRUST FUND For the Year Ended June 30, 2013 Revenues: Other local sources $ 19,102,132 Expenditures: Contract services and operating expenditures (Note 9) 18,048,424 Change in net position 1,053,708 Net position, July 1, ,819,875 Net position, June 30, 2013 $ 13,873,583 See accompanying notes to financial statements. 26
32 NOTES TO BASIC FINANCIAL STATEMENTS 1. SUMMARY OF SIGNIFICANT ACCOUNTING POLICIES West Contra Costa Unified School District (the "District") accounts for its financial transactions in accordance with the policies and procedures of the California Department of Education's California School Accounting Manual. The accounting policies of the District conform to accounting principles generally accepted in the United States of America as prescribed by the Governmental Accounting Standards Board. The following is a summary of the more significant policies: Reporting Entity The Board of Education is the level of government which has governance responsibilities over all activities related to public school education in the District. The Board is not included in any other governmental "reporting entity" as defined by the Governmental Accounting Standards Board since Board members have decision-making authority, the power to designate management, the responsibility to significantly influence operations and primary accountability for fiscal matters. On January 13, 1994, certain members of the District's Board of Education and District employees formed a nonprofit benefit corporation, known as the West Contra Costa Unified School District Financing Corporation (the "Corporation"), which is organized under the Nonprofit Benefit Corporation Law of the State of California. The purpose of this Corporation is to provide financial assistance to the District by financing, constructing and leasing various public facilities, land, and equipment for the use, benefit, and enjoyment of the public served by the District. The Corporation issued Certificates of Participation (COPs), a form of long-term debt, which the District used to finance continuing operations. The COPs are collateralized by an underlying leasepurchase agreement between the Corporation and the District. The District and the Corporation have a financial and operational relationship that meets the reporting entity definition of Codification of Governmental Accounting and Financial Reporting Standards, Section 2100, for inclusion of the Corporation as a component unit of the District. The basic, but not the only criterion for including a governmental department, agency, institution, commission, public authority, or other governmental organization in a governmental unit's reporting entity for general purpose financial reports is the ability of the governmental unit's elected officials to exercise oversight responsibility over such agencies. Oversight responsibility implies that the nongovernmental unit is dependent on another and the dependent unit should be reported as part of the other. Oversight responsibility is derived from the governmental unit's power and includes, but is not limited to: Financial interdependency Selection of governing authority Designation of management Ability to significantly influence operations Accountability for fiscal matters 27
33 NOTES TO BASIC FINANCIAL STATEMENTS (Continued) 1. SUMMARY OF SIGNIFICANT ACCOUNTING POLICIES (Continued) Reporting Entity (Continued) Accordingly, for the year ended June 30, 2013, the financial activities of the Corporation have been blended into the financial statements of the District. The Corporation's financial activities are presented in the Corporation Debt Service Fund. COPs issued by the Corporation are included as long-term liabilities in the government-wide financial statements. Basis of Presentation - Financial Statements The basic financial statements include a Management's Discussion and Analysis (MD & A) section providing an analysis of the District's overall financial position and results of operations, financial statements prepared using full accrual accounting for all of the District's activities, including infrastructure, and a focus on the major funds. Basis of Presentation - Government-Wide Financial Statements The Statement of Net Position and the Statement of Activities displays information about the reporting government as a whole. Fiduciary funds are not included in the government-wide financial statements. Fiduciary funds are reported only in the Statement of Fiduciary Net Position and the Statement of Change in Fiduciary Net Position at the fund financial statement level. The Statement of Net Position and the Statement of Activities are prepared using the economic resources measurement focus and the accrual basis of accounting. Revenues, expenses, gains, losses, assets and liabilities resulting from exchange and exchange-like transactions are recognized when the exchange takes place. Revenues, expenses, gains, losses, assets and liabilities resulting from nonexchange transactions are recognized in accordance with the requirements of Governmental Accounting Standards Board Codification Section (GASB Cod. Sec.) N Program revenues: Program revenues included in the Statement of Activities derive directly from the program itself or from parties outside the District's taxpayers or citizenry, as a whole; program revenues reduce the cost of the function to be financed from the District's general revenues. Allocation of indirect expenses: The District reports all direct expenses by function in the Statement of Activities. Direct expenses are those that are clearly identifiable with a function. Depreciation expense is specifically identified by function and is included in the direct expense of each function. Interest on general long-term liabilities is considered an indirect expense and is reported separately on the Statement of Activities. 28
34 NOTES TO BASIC FINANCIAL STATEMENTS (Continued) 1. SUMMARY OF SIGNIFICANT ACCOUNTING POLICIES (Continued) Basis of Presentation - Fund Accounting The accounts of the District are organized on the basis of funds, each of which is considered to be a separate accounting entity. The operations of each fund are accounted for with a separate set of self-balancing accounts that comprise its assets, liabilities, fund equity, revenues, and expenditures or expenses, as appropriate. District resources are allocated to and accounted for in individual funds based upon the purpose for which they are to be spent and the means by which spending activities are controlled. A - Major Funds 1. General Fund: The General Fund is the general operating fund of the District and accounts for all revenues and expenditures of the District not encompassed within other funds. All general tax revenues and other receipts that are not allocated by law or contractual agreement to some other fund are accounted for in this fund. General operating expenditures and the capital improvement costs that are not paid through other funds are paid from the General Fund. For financial reporting purposes, the current year activity and year end balance of the Special Reserve for Other than Capital Outlay Projects Fund is combined with the General Fund. 2. Building Fund: The Building Fund is used to account for resources used for the acquisition of capital facilities by the District. 3. Bond Interest and Redemption Fund: B - Other Funds The Bond Interest and Redemption Fund is used to account for the accumulation of resources for, and the payment of, general long-term debt principal, interest, and related costs. Special Revenue Funds are used to account for the proceeds of specific revenue sources that are legally restricted to expenditures for specific purposes. This includes the Adult Education, Child Development, Cafeteria and Deferred Maintenance Funds. Capital Projects Funds are used to account for resources used for the acquisition of capital facilities by the District. This includes the Capital Facilities, County School Facilities, and Special Reserve for Capital Outlay Projects Funds. 29
35 NOTES TO BASIC FINANCIAL STATEMENTS (Continued) 1. SUMMARY OF SIGNIFICANT ACCOUNTING POLICIES (Continued) Basis of Presentation - Fund Accounting (Continued) B - Other Funds (Continued) Basis of Accounting Debt Service Funds are used to account for the accumulation of resources for, and payment of, general long-term liabilities principal, interest, and related costs. This includes Corporation Debt Service and Debt Service Funds. The Self-Insurance Fund is an Internal Service Fund used to account for services rendered on a cost-reimbursement basis within the District. The Self-Insurance Fund is further used to account for resources committed to pay for costs arising from property losses and liability claims that are covered, or only partially covered, through purchased insurance. The Retiree Benefits Trust Fund is a trust fund used to account for the accumulation of funds for the District's defined post-employment healthcare plan. Agency Funds are used to account for various funds where the District acts as an agent. This classification includes the Payroll Clearing Fund and Student Body Funds. In the Payroll Clearing Fund, the "due to regulatory agencies" account is used to hold dedicated funds for payroll and related expenses. The Student Body Funds include all cash activity, assets and liabilities of the various student bodies of the District. Basis of accounting refers to when revenues and expenditures or expenses are recognized in the accounts and reported in the basic financial statements. Basis of accounting relates to the timing of the measurement made, regardless of the measurement focus applied. Accrual Governmental activities in the government-wide financial statements and the proprietary and fiduciary fund financial statements are presented on the accrual basis of accounting. Revenues are recognized when earned and expenses are recognized when incurred. Modified Accrual The governmental funds financial statements are presented on the modified accrual basis of accounting. Under the modified accrual basis of accounting, revenues are recorded when susceptible to accrual; i.e., both measurable and available. "Available" means collectible within the current period or within 60 days after year end. Expenditures are generally recognized under the modified accrual basis of accounting when the related liability is incurred. The exception to this general rule is that principal and interest on general obligation long-term liabilities, if any, is recognized when due. 30
36 NOTES TO BASIC FINANCIAL STATEMENTS (Continued) 1. SUMMARY OF SIGNIFICANT ACCOUNTING POLICIES (Continued) Budgets and Budgetary Accounting By state law, the Board of Education must adopt a final budget by July 1. A public hearing is conducted to receive comments prior to adoption. The Board of Education complied with these requirements. Receivables Receivables are made up principally of amounts due from the State of California for Revenue Limit funding and Categorical programs. The District has determined that no allowance for doubtful accounts was needed as of June 30, Stores Inventory Inventories in the General and Cafeteria Funds are valued at average cost. Stores inventory recorded in the General and Cafeteria Funds consists mainly of school supplies and consumable supplies. Inventories are recorded as an expenditure at the time the individual inventory items are transferred from the warehouse to schools and offices. Cafeteria Food Purchases Cafeteria purchases include food purchased through the State of California Office of Surplus Property, for which the District is required to pay only a handling charge. The state does not require the Cafeteria Fund to record the fair market value of these commodities. The expenditures for these items would have been greater had the District paid fair market value for the government surplus food commodities. Capital Assets Capital assets purchased or acquired, with an original cost of $5,000 or more, are recorded at historical cost or estimated historical cost. Contributed assets are reported at fair market value as of the date received. Additions, improvements and other capital outlay that significantly extend the useful life of an asset are capitalized. Other costs incurred for repairs and maintenance are expensed as incurred. Capital assets are depreciated using the straight-line method over 4-30 years depending on asset types. Compensated Absences Compensated absences totaling $3,763,728 are recorded as a liability of the District. The liability is for the earned but unused benefits. 31
37 NOTES TO BASIC FINANCIAL STATEMENTS (Continued) 1. SUMMARY OF SIGNIFICANT ACCOUNTING POLICIES (Continued) Accumulated Sick Leave Sick leave benefits are not recognized as liabilities of the District. The District's policy is to record sick leave as a operating expenditure or expense in the period taken since such benefits do not vest nor is payment probable; however, unused sick leave is added to the creditable service period for calculation of retirement benefits for certain STRS and CalPERS employees, when the employee retires. Unearned Revenue Revenue from federal, state, and local special projects and programs is recognized when qualified expenditures have been incurred. Funds received but not earned are recorded as unearned revenue until earned. Restricted Net Position Restrictions of the ending net position indicate the portions of net position not appropriable for expenditure or amounts legally segregated for a specific future use. The restriction for unspent categorical program revenues are state programs where the revenue received is restricted for expenditures only in that particular program. The restriction for the future payment of self-insurance claims represents the portion of net position to be used for future payment of self-insured claims. The restriction for special revenues represents the portion of net position restricted for special purposes. The restriction for capital projects represents the portion of net position restricted for capital projects. The restriction for debt service repayments represents the portion of net position which the District plans to expend on debt repayment. The restriction for retiree benefits represents the portion of net position which will be used for payment of health insurance premiums for current and future retirees. It is the District's policy to first use restricted net position when allowable expenditures are incurred. Fund Balance Classifications Governmental Accounting Standards Board Codification Sections 1300 and 1800, Fund Balance Reporting and Governmental Fund Type Definitions (GASB Cod. Sec and 1800) implements a five-tier fund balance classification hierarchy that depicts the extent to which a government is bound by spending constraints imposed on the use of its resources. The five classifications, discussed in more detail below, are nonspendable, restricted, committed, assigned and unassigned. A - Nonspendable Fund Balance: The nonspendable fund balance classification reflects amounts that are not in spendable form, such as revolving fund cash and stores inventory. 32
38 NOTES TO BASIC FINANCIAL STATEMENTS (Continued) 1. SUMMARY OF SIGNIFICANT ACCOUNTING POLICIES (Continued) Fund Balance Classifications (Continued) B - Restricted Fund Balance: The restricted fund balance classification reflects amounts subject to externally imposed and legally enforceable constraints. Such constraints may be imposed by creditors, grantors, contributors, or laws or regulations of other governments, or may be imposed by law through constitutional provisions or enabling legislation. These are the same restrictions used to determine restricted net assets as reported in the government-wide and fiduciary trust fund statements. C - Committed Fund Balance: The committed fund balance classification reflects amounts subject to internal constraints self-imposed by formal action of the Board of Education. The constraints giving rise to committed fund balance must be imposed no later than the end of the reporting period. The actual amounts may be determined subsequent to that date but prior to the issuance of the financial statements. Formal action by the Board of Education is required to remove any commitment from any fund balance. At June 30, 2013, the District had no committed fund balances. D - Assigned Fund Balance: The assigned fund balance classification reflects amounts that the District's Board of Education has approved to be used for specific purposes, based on the District's intent related to those specific purposes. The Board of Education can designate personnel with the authority to assign fund balances, however, as of June 30, 2013, no such designation has occurred. E - Unassigned Fund Balance: In the General Fund only, the unassigned fund balance classification reflects the residual balance that has not been assigned to other funds and that is not restricted, committed, or assigned to specific purposes. In any fund other than the General Fund, a positive unassigned fund balance is never reported because amounts in any other fund are assumed to have been assigned, at least, to the purpose of that fund. However, deficits in any fund, including the General Fund that cannot be eliminated by reducing or eliminating amounts assigned to other purposes are reported as negative unassigned fund balance. 33
39 NOTES TO BASIC FINANCIAL STATEMENTS (Continued) 1. SUMMARY OF SIGNIFICANT ACCOUNTING POLICIES (Continued) Fund Balance Policy The District has an expenditure policy relating to fund balances. For purposes of fund balance classifications, expenditures are to be spent from restricted fund balances first, followed in order by committed fund balances (if any), assigned fund balances and lastly unassigned fund balances. While GASB Cod. Sec and 1800 do not require districts to establish a minimum fund balance policy or a stabilization arrangement, GASB Cod. Sec and 1800 do require the disclosure of a minimum fund balance policy and stabilization arrangements, if they have been adopted by the Board of Education. At June 30, 2013, the District has not established a minimum fund balance policy nor has it established a stabilization arrangement. Property Taxes Secured property taxes are attached as an enforceable lien on property as of March 1. Taxes are due in two installments on or before December 10 and April 10. Unsecured property taxes are due in one installment on or before August 31. The County of Contra Costa bills and collects taxes for the District. Encumbrances Encumbrance accounting is used in all budgeted funds to reserve portions of applicable appropriations for which commitments have been made. Encumbrances are recorded for purchase orders, contracts, and other commitments when they are written. Encumbrances are liquidated when the commitments are paid. All encumbrances are liquidated at June 30. Eliminations and Reclassifications In the process of aggregating data for the Statement of Net Position and the Statement of Activities, some amounts reported as interfund activity and balances in the funds were eliminated or reclassified. Interfund receivables and payables were eliminated to minimize the "grossing up" effect on assets and liabilities within the governmental activities column. Estimates The preparation of basic financial statements in conformity with accounting principles generally accepted in the United States of America requires management to make estimates and assumptions. These estimates and assumptions affect the reported amounts of assets and liabilities and disclosure of contingent assets and liabilities at the date of the financial statements and the reported amounts of revenues and expenditures during the reporting period. Accordingly, actual results may differ from those estimates. 34
40 NOTES TO BASIC FINANCIAL STATEMENTS (Continued) 1. SUMMARY OF SIGNIFICANT ACCOUNTING POLICIES (Continued) New Accounting Pronouncements In November 2010, the GASB issued Statement No. 61, The Financial Reporting Entity: Omnibus. The Statement improves financial reporting for a governmental financial reporting entity. The requirements of Statement No. 14, The Financial Reporting Entity, and the related financial reporting requirements of Statement No. 34, Basic Financial Statements and Management s Discussion and Analysis for State and Local Governments, were amended to better meet user needs and to address reporting entity issues. This statement was adopted for the District s fiscal year ended June 30, 2013 with no material impact on the District. In December 2010, the GASB issued Statement No. 62, Codification of Accounting and Financial Reporting Guidance Contained in Pre-November 30, 1989 FASB and AICPA Pronouncements. The Statement incorporates into the GASB s authoritative literature certain accounting and financial reporting guidance that is included in the following pronouncements issued on or before November 30, 1989, which does not conflict with or contradict GASB pronouncements: (1) Financial Accounting Standards Board (FASB) Statements and Interpretations; (2) Accounting Principles Board Opinions; and (3) Accounting Research Bulletins of the American Institute of Certified Public Accountants (AICPA) Committee on Accounting Procedure. This statement was adopted for the District s fiscal year ended June 30, 2013 with no material impact on the District. In June 2011, the GASB issued Statement No. 63, Financial Reporting of Deferred Outflows of Resources, Deferred Inflows of Resources, and Net Position. This Statement provides a new statement of net position format to report all assets, deferred outflows of resources, liabilities, deferred inflows of resources, and net position (which is the net residual amount of the other elements). This Statement requires that deferred outflows of resources and deferred inflows of resources be reported separately from assets and liabilities. This Statement also amends certain provisions of GASB Statement No. 34, Basic Financial Statement and Management s Discussion and Analysis for State and Local Governments, and related pronouncements to reflect the residual measure in the statement of financial position as net position, rather than net assets. This statement was adopted for the District s fiscal year ended June 30, 2013 with no material impact on financial statements of the District. 35
41 NOTES TO BASIC FINANCIAL STATEMENTS (Continued) 1. SUMMARY OF SIGNIFICANT ACCOUNTING POLICIES (Continued) New Accounting Pronouncements (Continued) In March 2012, the GASB issued Statement No. 65, Items Previously Reported as Assets and Liabilities. This Statement establishes accounting and financial reporting standards that reclassify, as deferred outflows of resources or deferred inflows of resources, certain items that were previously reported as assets and liabilities and recognizes, as outflows of resources or inflows of resources, certain items that were previously reported as assets and liabilities. This Statement also provides other financial reporting guidance related to the impact of the financial statement elements deferred outflows of resources and deferred inflows of resources, such as changes in the determination of the major fund calculations and limiting the use of the term deferred in financial statement presentations. The provisions of this Statement are effective for the District s fiscal year ended June 30, 2014, with earlier application being encouraged. Based on the implementation of Statement No. 65 the District s July 1, 2012 net position was restated by $10,850,644 because bond issuance costs were no longer capitalized. In addition, the District recorded a deferred outflow due to the loss on refunding debt of $3,005,267. In March 2012, the GASB issued Statement No. 66, Technical Corrections 2013, an amendment of GASB Statements No. 10 and No. 61. The objective of this Statement is to improve accounting and financial reporting for a governmental financial reporting entity by resolving conflicting guidance that resulted from the issuance of two pronouncements, Statements No. 64, Fund Balance Reporting and Governmental Fund Type Definitions, and No. 62, Codification of Accounting and Financial Reporting Guidance Contained in Pre- November 30, 1989 FASB and AICPA Pronouncements. This Statement amends Statement No. 10, Accounting and Financial Reporting for Risk Financing and Related Insurance Issues, by removing the provision that limits fundbased reporting of an entity s risk financing activities to the general fund and the internal service fund type. As a result, Districts should base their decisions about fund type classification on the nature of the activity to be reported, as required in Statement 54 and Statement No. 34, Basic Financial Statements-and Management s Discussion and Analysis-for State and Local Governments. This Statement also amends Statement 62 by modifying the specific guidance on accounting for (1) operating lease payments that vary from a straight line basis, (2) the difference between the initial investment (purchase price) and the principal amount of a purchased loan or group of loans, and (3) servicing fees related to mortgage loans that are sold when the stated service fee rate differs significantly from a current (normal) servicing fee rate. These changes clarify how to apply Statement No. 13, Accounting for Operating Leases with Scheduled Rent Increases, and result in guidance that is consistent with the requirements in Statement No. 48, Sales and Pledges of Receivables and Future Revenues and Intra-Entity Transfers of Assets and Future Revenues, respectively. The provisions of this Statement are effective for the District s fiscal year ended June 30, 2014, with earlier application encouraged. Management has not determined what impact, if any, this GASB statement will have on the District s financial statements. 36
42 NOTES TO BASIC FINANCIAL STATEMENTS (Continued) 1. SUMMARY OF SIGNIFICANT ACCOUNTING POLICIES (Continued) New Accounting Pronouncements (Continued) In June 2012, the GASB issued Statement No. 67, Financial Reporting for Pension Plans. This Statement replaces the requirements of Statement No. 25, Financial Reporting for Defined Benefit Pension Plans and Note Disclosures for Defined Contribution Plans and Statement No. 50 as they relate to pension plans that are administered through trusts or similar arrangements meeting certain criteria. The Statement builds upon the existing framework for financial reports of defined benefit pension plans, which includes a statement of fiduciary net position (the amount held in a trust for paying retirement benefits) and a statement of changes in fiduciary net position. Statement No. 67 enhances note disclosures and RSI for both defined benefit and defined contribution pension plans. Statement No. 67 also requires the presentation of new information about annual money-weighted rates of return in the notes to the financial statements and in 10-year RSI schedules. This Statement is effective for the District s financial period beginning June 30, Management has not determined what impact, if any, this GASB statement might have on its financial statements. In June 2012, the GASB issued Statement No. 68, Accounting and Financial Reporting for Pensions. This Statement replaces the requirements of Statement No. 27, Accounting for Pensions by State and Local Governmental Employers and Statement No. 50, Pension Disclosures, as they relate to governments that provide pensions through pension plans administered as trusts or similar arrangements that meet certain criteria. Statement No. 68 requires governments providing defined benefit pensions to recognize their long-term obligation for pension benefits as a liability for the first time, and to more comprehensively and comparably measure the annual costs of pension benefits. The Statement also enhances accountability and transparency through revised and new note disclosures and required supplementary information (RSI). This Statement is effective for the District s financial period beginning June 30, Management has not determined what impact, if any, this GASB statement might have on the District's financial statements. 37
43 2. CASH AND INVESTMENTS NOTES TO BASIC FINANCIAL STATEMENTS (Continued) Cash and investments at June 30, 2013 consisted of the following: Governmental Activities Governmental Proprietary Fiduciary Funds Fund Total Activities Pooled Funds: Cash in County Treasury $158,149,743 $ 3,996,777 $162,146,520 $ 8,117,281 Cash awaiting deposit Deposits: Cash on hand and in banks 43,777-43, ,325 Cash in revolving fund 70,000-70,000 - Total pooled funds and deposits 158,264,270 3,996, ,261,047 9,065,606 Investments: Cash with Fiscal Agent 7,162,885 1,958 7,164,843 - Local Agency Investment Fund 3,607,630-3,607,630 7,196,979 Total investments 10,770,515 1,958 10,772,473 7,196,979 Total $169,034,785 $ 3,998,735 $173,033,520 $ 16,262,585 Pooled Funds In accordance with Education Code Section 41001, the District maintains substantially all of its cash in the Contra Costa County Treasury. The County pools these funds with those of school districts in the County and invests the cash. These pooled funds are carried at cost which approximates fair value. Interest earned is deposited quarterly into participating funds. Any investment losses are proportionately shared by all funds in the pool. Earnings are calculated on an annual basis and funds allocated to participating funds are adjusted to the calculated annual rate at year-end. Because the District's deposits are maintained in a recognized pooled investment fund under the care of a third party and the District's share of the pooled investment fund does not consist of specific, identifiable investment securities owned by the District, no disclosure of the individual deposits and investments or related custodial credit risk classifications is required. In accordance with applicable state laws, the Contra Costa County Treasurer may invest in derivative securities. However, at June 30, 2013, the Contra Costa County Treasurer has represented that the Treasurer's pooled investment fund contained no derivatives or other investments with similar risk profiles. 38
44 NOTES TO BASIC FINANCIAL STATEMENTS (Continued) 2. CASH AND INVESTMENTS (Continued) Deposits - Custodial Credit Risk The District limits custodial credit risk by ensuring uninsured balances are collateralized by the respective financial institution. Cash balances held in banks are insured up to $250,000 by the Federal Deposit Insurance Corporation (FDIC) and are collateralized by the respective financial institution. At June 30, 2013, the carrying amount of the District s accounts was $1,062,102, and the bank balances were $1,157,374. Of the bank balances, $849,463 was uninsured but collateralized. Cash with Fiscal Agent The Cash with Fiscal Agent in the Building Fund represents contract retentions that are placed with an independent third party. These amounts are carried in the contractor's name and all investment risk resides with the contractor. The Cash with Fiscal Agent in the Special Reserve for Capital Outlay Projects, Corporation Debt Service and Self-Insurance Funds represents amounts held by third parties in the District's name. Local Agency Investment Fund West Contra Costa Unified School District places certain funds with the State of California's Local Agency Investment Fund (LAIF). The District is a voluntary participant in LAIF, which is regulated by California Government Code Section under the oversight of the Treasurer of the State of California and the Pooled Money Investment Board. The State Treasurer's Office pools these funds with those of other governmental agencies in the state and invests the cash. The fair value of the District's investment in the pool is reported in the accompanying financial statements based upon the District's pro-rata share of the fair value provided by LAIF for the entire LAIF portfolio (in relation to the amortized cost of that portfolio). The monies held in the pooled investments funds are not subject to categorization by risk category. The balance available for withdrawal is based on the accounting records maintained by LAIF, which are recorded on an amortized cost basis. Funds are accessible and transferable to the master account within twenty-four hours notice. Included in LAIF's investment portfolio are collateralized mortgage obligations, mortgage-backed securities, other asset-backed securities, and floating rate securities issued by federal agencies, government-sponsored enterprises and corporations. LAIF is administered by the State Treasurer. LAIF investments are audited annually by the Pooled Money Investment Board and the State Controller's Office. Copies of this audit may be obtained from the State Treasurer's Office: 915 Capitol Mall; Sacramento, California The Pooled Money Investment Board has established policies, goals, and objectives to make certain that their goal of safety, liquidity and yield are not jeopardized. 39
45 NOTES TO BASIC FINANCIAL STATEMENTS (Continued) 2. CASH AND INVESTMENTS (Continued) Interest Rate Risk The District does not have a formal investment policy that limits cash and investment maturities as a means of managing its exposure to fair value losses arising from increasing interest rates. At June 30, 2013, the District had no significant interest rate risk related to cash and investments held. Credit Risk The District does not have a formal investment policy that limits its investment choices other than the limitations of state law. Concentration of Credit Risk The District does not place limits on the amount it may invest in any one issuer. At June 30, 2013, the District had no concentration of credit risk. 3. INTERFUND TRANSACTIONS Interfund Activity Transactions between funds of the District are recorded as interfund transfers, except for the Self-Insurance Fund activity which is recorded as income and expenditures of the Self-Insurance Fund and the funds which incur payroll costs, respectively. The unpaid balances at year end, as a result of such transactions, are shown as due to and due from other funds. At June 30, 2013, there were no outstanding interfund receivable or payable balances. Interfund Transfers Interfund transfers consist of operating transfers from funds receiving revenue to funds through which the resources are to be expended. Interfund transfers for the fiscal year were as follows: Transfer from the General Fund to the Adult Education Fund to cover the cost of operations for the Adult Education program. $ 1,815,654 Transfer from the Special Reserve for Capital Outlay Projects Fund to Child Development Fund for reimbursement of lost portables. 130,000 Transfer from the Adult Education Fund to the General Fund for indirect cost support. 46 Transfer from the Child Development Fund to the General Fund for indirect cost support. 60,739 Transfer from the Cafeteria Fund to the General Fund for indirect cost support. 466,412 Transfer from the Deferred Maintenance Fund to the General Fund for Tier III flexibility provisions of SBX3 4. 1,000,000 Transfer from the Debt Service Fund to the General Fund to partially cover Certificates of Participation payments. 922,584 $ 4,395,435 40
46 4. CAPITAL ASSETS NOTES TO BASIC FINANCIAL STATEMENTS (Continued) A schedule of changes in capital assets for the year ended June 30, 2013 is shown below: Governmental Activities Balance Transfers Transfers Balance July 1, and and June 30, 2012 Additions Deductions 2013 Non-depreciable: Land $ 52,371,291 $ - $ - $ 52,371,291 Work-in-process 303,721,265 76,921,186 (98,771,833) 281,870,618 Depreciable: Buildings 803,589,797-86,809, ,398,893 Site improvements 61,980,429-4,122,896 66,103,325 Equipment 13,993,760 3,090,991 (1,692,147) 15,392,604 Totals, at cost 1,235,656,542 80,012,177 (9,531,988) 1,306,136,731 Less accumulated depreciation: Buildings (216,049,750) (17,579,749) (6,513,548) (227,115,951) Site improvements (41,046,185) (1,544,223) (775,248) (41,815,160) Equipment (7,527,635) (1,361,703) (1,250,329) (7,639,009) Total accumulated depreciation (264,623,570) (20,485,675) (8,539,125) (276,570,120) Capital assets, net $ 971,032,972 $ 59,526,502 $ (992,863) $1,029,566,611 Depreciation expense was charged to governmental activities as follows: Instruction $ 11,136,299 Supervision of instruction 1,527,421 Instructional library, media and technology 224,903 School site administration 1,122,273 Home to school transportation 558,248 Food services 950,104 All other pupil services 1,265,898 Ancillary services 522,938 Community services 10,383 All other general administration 840,123 Centralized data processing 266,428 Plant services 2,060,657 Total depreciation expense $ 20,485,675 41
47 5. SELF-INSURANCE CLAIMS NOTES TO BASIC FINANCIAL STATEMENTS (Continued) The District is self-insured for property and liability claims. For accounting and reporting purposes, the District has established a separate Self-Insurance Fund for the payment of claims. For the year ended June 30, 2013, the District provides coverage up to a maximum of $100,000 for each property or liability claim. The District participates in a joint powers authority for claims in excess of coverage provided by the Fund (Note 10). The liability for unpaid claims and claim adjustment expenses represents the ultimate cost of claims that have been reported but not settled and of claims that have been incurred but not reported. These claims will be paid in future years. District management recomputes the liability annually using available updated claims data. Every three years, the District contracts with an actuary who performs an actuarial study using a variety of statistical techniques to produce current estimates that consider claim frequency and other economic factors. The liabilities for unpaid claims and claim adjustment expenses are as follows: June 30, June 30, Unpaid claim and claim adjustment expenses, beginning of year $ 500,000 $ 500,000 Total incurred claims and claim adjustment expenses 1,290, ,587 Total payments (1,290,881) (708,587) Total unpaid claims and claim adjustment expenses at end of year $ 500,000 $ 500,000 42
48 NOTES TO BASIC FINANCIAL STATEMENTS (Continued) 6. LONG-TERM LIABILITIES General Obligation Bonds The District's General Obligation Bonds are issued under separate authorizations which were approved by voters of the District over the past several years. As of June 30, 2013, the Measures with outstanding balances and their respective election year include Measure E of 1998, Measure M of 2000, Measure D of 2002, Measure J of 2005, and Measure D of Proceeds from the Bonds are being used to improve, construct or refurbish the District's schools. Maturity Amount of Outstanding Issued Redeemed Outstanding Interest Date of Date Original July 1, Current Current June 30, Bond Rate % Issuance August 1, Issuance 2012 Year Year 2013 Measure E, Refunding Series A 4.15% - 5.7% $ 28,610,000 $ 18,495,000 $ - $ 1,160,000 $ 17,335,000 Measure E, Refunding Series B 4.3% - 6.0% ,255,000 6,810, ,000 6,415,000 Measure M, Series C 2.5% - 5.0% ,000,000 43,115,000-43,115,000 - Measure D, Series A 4.25% - 7.0% ,000,000 11,515,000-11,515,000 - Measure D, Series B 4.1% - 5.0% ,000,000 40,460,000-40,460,000 - Measure D, Series C, Current Interest 4.0% - 5.0% ,000,000 35,625,000-10,080,000 25,545,000 Measure D, Series C, Capital Appreciation 2.4% - 5.8% ,999,377 28,179, ,115 27,523,014 Measure D, Series D, Capital Appreciation 3.15% % ,998,106 93,145,012-2,327,598 90,817,414 Measure J, Series A 4.0% - 5.0% ,000,000 61,280, ,280,000 Measure J, Series B 5.0% - 6.0% ,000, ,025, ,025,000 Measure J, Series C1 6.24% % ,084,759 52,084, ,084,759 Measure J, Series C2 8.46% ,825,000 52,825, ,825, Refunding 3.0% % ,860,000 49,955,000-3,600,000 46,355,000 Measure J, Series D1 6.56% ,000,000 25,000, ,000,000 Measure J, Series D2 6.80% % ,499,949 2,499, ,499, Refunding 3.0% % ,565,000 85,565,000-4,425,000 81,140, Measure D, Series A 3.0% - 5.0% ,000,000 79,000,000-6,615,000 72,385, Measure D, Series A-1 3.0% - 5.0% ,000,000 21,000, ,000, Refunding 3.0% % ,200,000-98,200,000-98,200,000 $ 1,097,897,191 $ 821,578,849 $ 98,200,000 $ 124,348,713 $ 795,430,136 43
49 6. LONG-TERM LIABILITIES (Continued) NOTES TO BASIC FINANCIAL STATEMENTS (Continued) General Obligation Bonds (Continued) The annual requirements to amortize the 2001 Refunding Measure E, Series A, General Obligation Bonds Payable, outstanding as of June 30, 2013, are as follows: Year Ended June 30, Principal Interest Total 2014 $ 1,225,000 $ 953,335 $ 2,178, ,295, ,880 2,185, ,355, ,560 2,178, ,435, ,653 2,186, ,520, ,901 2,194, ,010,000 2,010,136 11,020, ,495, ,381 1,625,381 $ 17,335,000 $ 6,234,846 $ 23,569,846 The annual requirements to amortize the 2001 Refunding Measure E, Series B, General Obligation Bonds Payable, outstanding as of June 30, 2013, are as follows: Year Ended June 30, Principal Interest Total 2014 $ 425,000 $ 378,785 $ 803, , , , , , , , , , , , , ,220, ,450 4,060, ,000 48, ,900 $ 6,415,000 $ 2,531,240 $ 8,946,240 44
50 6. LONG-TERM LIABILITIES (Continued) NOTES TO BASIC FINANCIAL STATEMENTS (Continued) General Obligation Bonds (Continued) The annual requirements to amortize the 2005 Measure D, Series C, Current Interest General Obligation Bonds Payable, outstanding as of June 30, 2013, are as follows: Year Ended June 30, Principal Interest Total 2014 $ 905,000 $ 1,211,935 $ 2,116, ,193,835 1,193, ,193,835 1,193, ,035,000 1,172,618 2,207, ,085,000 1,128,344 2,213, ,575,000 4,981,319 8,556, ,480,000 4,564,500 8,044, ,455,000 2,613,625 13,068, ,010, ,750 5,263,750 $ 25,545,000 $ 18,313,761 $ 43,858,761 The annual requirements to amortize the 2005 Measure D, Series C, Capital Appreciation General Obligation Bonds Payable, outstanding as of June 30, 2013, are as follows: Year Ended June 30, Principal Interest Total 2014 $ 739,473 $ 475,527 $ 1,215, , ,172 1,415, , ,343 1,620, , ,443 1,840, , ,360 1,500, ,182,913 7,527,087 12,710, ,789,918 15,005,082 21,795, ,510,192 24,299,808 31,810, ,922,836 16,127,164 20,050,000 $ 27,523,014 $ 66,431,986 $ 93,955,000 45
51 6. LONG-TERM LIABILITIES (Continued) NOTES TO BASIC FINANCIAL STATEMENTS (Continued) General Obligation Bonds (Continued) The annual requirements to amortize the 2006 Measure D, Series D, Capital Appreciation General Obligation Bonds Payable, outstanding as of June 30, 2013, are as follows: Year Ended June 30, Principal Interest Total 2014 $ 2,527,733 $ 952,267 $ 3,480, ,719,715 1,215,285 3,935, ,904,482 1,520,519 4,425, ,054,074 1,880,926 4,935, ,818,039 2,706,962 6,525, ,584,695 19,805,305 39,390, ,998,966 34,586,034 55,585, ,600,021 57,309,979 80,910, ,609,689 35,925,309 47,534,998 $ 90,817,414 $155,902,586 $246,720,000 The annual requirements to amortize the 2006 Measure J, Series A, General Obligation Bonds Payable, outstanding as of June 30, 2013, are as follows: Year Ended June 30, Principal Interest Total 2014 $ 545,000 $ 2,948,103 $ 3,493, ,710,000 2,903,003 4,613, ,775,000 2,832,415 4,607, ,850,000 2,757,871 4,607, ,920,000 2,678,915 4,598, ,900,000 12,001,548 22,901, ,530,000 9,013,000 22,543, ,910,000 5,225,000 22,135, ,140, ,750 13,068,750 $ 61,280,000 $ 41,288,605 $102,568,605 46
52 6. LONG-TERM LIABILITIES (Continued) NOTES TO BASIC FINANCIAL STATEMENTS (Continued) General Obligation Bonds (Continued) The annual requirements to amortize the 2009 Measure J, Series B, General Obligation Bonds Payable, outstanding as of June 30, 2013, are as follows: Year Ended June 30, Principal Interest Total 2014 $ - $ 6,656,375 $ 6,656, ,656,375 6,656, ,225,000 6,625,750 7,850, ,900,000 6,538,125 8,438, ,600,000 6,433,125 8,033, ,700,000 30,194,625 42,894, ,200,000 24,449,625 52,649, ,000,000 14,413,688 47,413, ,400,000 3,622,500 40,022,500 $115,025,000 $105,590,188 $220,615,188 The annual requirements to amortize the 2010 Measure J, Series C1, General Obligation Bonds Payable, outstanding as of June 30, 2013, are as follows: Year Ended June 30, Principal Interest Total 2017 $ 324,003 $ 400,997 $ 725, ,333 1,243,667 2,065, ,116,614 19,003,386 30,120, ,398,919 27,886,081 41,285, ,356,107 85,293, ,650, ,067,783 4,917,217 5,985,000 $ 52,084,759 $138,745,241 $190,830,000 47
53 6. LONG-TERM LIABILITIES (Continued) NOTES TO BASIC FINANCIAL STATEMENTS (Continued) General Obligation Bonds (Continued) The annual requirements to amortize the 2010 Measure J, Series C2, General Obligation Bonds Payable, outstanding as of June 30, 2013, are as follows: Year Ended June 30, Principal Interest Total 2014 $ - $ 4,468,995 $ 4,468, ,468,995 4,468, ,468,995 4,468, ,468,995 4,468, ,468,995 4,468, ,344,975 22,344, ,344,975 22,344, ,344,975 22,344, ,825,000 4,935,353 57,760,353 $ 52,825,000 $ 94,315,253 $147,140,253 The annual requirements to amortize the 2009 General Obligation Refunding Bonds outstanding as of June 30, 2013, are as follows: Year Ended June 30, Principal Interest Total 2014 $ 4,575,000 $ 1,878,331 $ 6,453, ,120,000 1,690,656 6,810, ,070,000 1,457,256 8,527, ,505,000 1,154,163 9,659, ,950, ,619 11,690, ,895,000 2,197,094 5,092, ,610,000 1,449,816 5,059, ,630, ,681 4,030,681 $ 46,355,000 $ 10,968,616 $ 57,323,616 48
54 6. LONG-TERM LIABILITIES (Continued) NOTES TO BASIC FINANCIAL STATEMENTS (Continued) General Obligation Bonds (Continued) The annual requirements to amortize the 2010 Measure J, Series D1, General Obligation Bonds Payable, outstanding as of June 30, 2013, are as follows: Year Ended June 30, Principal Interest Total 2014 $ - $ 286,250 $ 286, , , , , , , , , ,180,000 1,413,045 4,593, ,820, ,068 22,070,068 $ 25,000,000 $ 3,094,363 $ 28,094,363 The annual requirements to amortize the 2010 Measure J, Series D2, General Obligation Bonds Payable, outstanding as of June 30, 2013, are as follows: Year Ended June 30, Principal Interest Total $ 2,499,949 $ 31,320,051 $ 33,820,000 The annual requirements to amortize the 2011 Refunding General Obligation Bonds Payable, outstanding as of June 30, 2013, are as follows: Year Ended June 30, Principal Interest Total 2014 $ 3,800,000 $ 3,814,913 $ 7,614, ,285,000 3,595,838 9,880, ,150,000 3,320,913 9,470, ,900,000 3,060,263 8,960, ,110,000 2,814,913 7,924, ,515,000 8,837,804 48,352, ,380, ,550 15,042,550 $ 81,140,000 $ 26,107,194 $107,247,194 49
55 6. LONG-TERM LIABILITIES (Continued) NOTES TO BASIC FINANCIAL STATEMENTS (Continued) General Obligation Bonds (Continued) The annual requirements to amortize the 2010 Measure D, Series A, General Obligation Bonds Payable, outstanding as of June 30, 2013, are as follows: Year Ended June 30, Principal Interest Total 2014 $ 5,540,000 $ 3,544,000 $ 9,084, ,460,900 3,460, ,460,900 3,460, ,460,900 3,460, ,460,900 3,460, ,000 17,246,500 18,096, ,470,000 16,840,019 19,310, ,890,000 15,729,838 25,619, ,280,000 10,840,888 36,120, ,355,000 3,070,569 31,425,569 $ 72,385,000 $ 81,115,414 $153,500,414 The annual requirements to amortize the 2010 Measure D, Series A-1, General Obligation Bonds Payable, outstanding as of June 30, 2013, are as follows: Year Ended June 30, Principal Interest Total 2014 $ - $ 281,400 $ 281, , , , , , , , , ,407,000 1,407, ,407,000 1,407, ,000, ,500 21,703,500 $ 21,000,000 $ 4,924,500 $ 25,924,500 50
56 6. LONG-TERM LIABILITIES (Continued) NOTES TO BASIC FINANCIAL STATEMENTS (Continued) General Obligation Bonds (Continued) The annual requirements to amortize the 2012 General Obligation Refunding Bonds Payable, outstanding as of June 30, 2013, are as follows: Year Ended June 30, Principal Interest Total 2014 $ - $ 4,882,000 $ 4,882, ,882,000 4,882, ,882,000 4,882, ,882,000 4,882, ,882,000 4,882, ,690,000 24,293,750 26,983, ,745,000 20,304,625 58,049, ,765,000 7,303,375 65,068,375 $ 98,200,000 $ 76,311,750 $174,511,750 The bonds which were refunded by the 2012 General Obligation Refunding Bonds are considered defeased and are longer included as a liability of the District. At June 30, 2013, the outstanding balance of the defeased bonds was $104,310,000. Although the 2012 refundings resulted in the recognition of an accounting loss of $3,005,267 for the year ended June 30, 2013, the District in effect decreased its aggregate debt service payments by $12.5 million over the next twenty-one years, and the District obtained an economic gain of $9.5 million. Calculation of the difference in cash flow requirements and economic loss are as follows: Old debt service cash flows $189,783,044 New debt service cash flows 177,237,533 Cash flow difference $ 12,545,511 Present value of old debt cash flows $122,309,456 Present value of new debt cash flows 112,798,055 Economic gain $ 9,511,401 51
57 6. LONG-TERM LIABILITIES (Continued) Certificates of Participation NOTES TO BASIC FINANCIAL STATEMENTS (Continued) On August 24, 2005, the West Contra Costa Unified School District Financing Corporation issued Certificates of Participation (COPs). The proceeds of this issuance were used to refund a 1994 COPS issuance. Semi-annual payments are made and include interest at amounts varying from 4.34% to 5.15%. Scheduled payments for the COPs are as follows: Year Ended June 30, Principal Interest Total 2014 $ 525,000 $ 400,867 $ 925, , , , , , , , , , , , , ,715, ,720 4,638, ,295,000 66,690 1,361,690 $ 7,915,000 $ 2,721,817 $ 10,636,817 Schedule of Changes in Long-Term Liabilities A schedule of changes in long-term liabilities for the year ended June 30, 2013 is shown below: Balance Balance Amounts July 1, June 30, Due Within 2012 Additions Deductions 2013 One Year Governmental activities: General Obligation Bonds $ 821,578,849 $ 98,200,000 $ 124,348,713 $ 795,430,136 $ 20,282,206 General Obligation Bonds Premium 25,353,204 10,180,869 1,947,702 33,586,371 - Accreted interest 60,762,662 15,269,291-76,031,953 1,427,794 Certificates of Participation 8,415, ,000 7,915, ,000 Child care facilities loan 28,823-28, OPEB obligation (Note 9) 89,718,345 23,087,931 17,026,494 95,779,782 17,814,962 Compensated absences 3,422, ,601-3,763,728 - Total $1,009,279,010 $ 147,079,692 $ 143,851,732 $1,012,506,970 $ 40,049,962 Payments on the General Obligation Bonds are made from the Bond Interest and Redemption Fund. Payments on the Certificates of Participation are made from the General Fund. Payments on the child care facilities acquisition loan are made from the Child Development Fund. Payments on the OPEB obligation are made from the Retiree Benefits Trust Fund. Payments on compensated absences are made from the fund for which the related employee worked. 52
58 7. NET POSITION / FUND BALANCES NOTES TO BASIC FINANCIAL STATEMENTS (Continued) Restricted net position consisted of the following at June 30, 2013: Governmental Fiduciary Activities Funds Restricted for unspent categorical program revenues $ 21,983,898 $ - Restricted for future payment of self-insured claims 1,698,615 - Restricted for special revenues 7,238,081 - Restricted for capital projects 19,065,059 - Restricted for debt service 48,126,375 - Restricted for retiree benefits - 13,873,583 Total restricted net position $ 98,112,028 $ 13,873,583 Fund balances, by category, at June 30, 2013 consisted of the following: Bond Interest and All General Building Redemption Non-Major Fund Fund Fund Funds Total Nonspendable: Revolving cash fund $ 70,000 $ - $ - $ - $ 70,000 Stores Inventory 234, , ,992 Subtotal nonspendable 304, , ,992 Restricted: Unspent categorical revenues 21,983, ,983,898 Adult education ,065,909 2,065,909 Child development , ,052 Food services ,098,099 3,098,099 Deferred maintenance ,304,030 1,304,030 Capital projects - 55,443,368-19,065,059 74,508,427 Debt service ,126,375 1,042,933 49,169,308 Subtotal restricted 21,983,898 55,443,368 48,126,375 26,733, ,286,723 Assigned: Tier III flexibility 11,669, ,669,725 UTR ratified agreement 1,370, ,370,000 Subtotal Assigned 13,039, ,039,725 Unassigned: Designated for economic uncertainty 7,992, ,992,728 Undesignated 13,709, ,709,346 Subtotal Unassigned 21,702, ,702,074 Total fund balances $ 57,029,698 $ 55,443,368 $ 48,126,375 $ 27,346,073 $ 187,945,514 53
59 8. EMPLOYEE RETIREMENT SYSTEMS NOTES TO BASIC FINANCIAL STATEMENTS (Continued) Qualified employees are covered under multiple-employer defined benefit pension plans maintained by agencies of the State of California. Certificated employees are members of the State Teachers' Retirement System (STRS), and classified employees are members of the California Public Employees' Retirement System (CalPERS). Plan Description and Provisions California Public Employees' Retirement System (CalPERS) Plan Description The District contributes to the School Employer Pool under the California Public Employees' Retirement System (CalPERS), a cost-sharing multiple-employer public employee retirement system defined benefit pension plan administered by CalPERS. The plan provides retirement and disability benefits, annual cost-of-living adjustments, and death benefits to plan members and beneficiaries. Benefit provisions are established by state statutes, as legislatively amended, within the Public Employees' Retirement Law. CalPERS issues a separate comprehensive annual financial report that includes financial statements and required supplementary information. Copies of the CalPERS annual financial report may be obtained from the CalPERS Executive Office, 400 Q Street, Sacramento, California Funding Policy Active plan members are required to contribute 7% of their salary and the District is required to contribute an actuarially determined rate. The actuarial methods and assumptions used for determining the rate are those adopted by the CalPERS Board of Administration. The required employer contribution rate for fiscal year was % of annual payroll. The contribution requirements of the plan members are established by state statute. The District's contributions to CalPERS for the fiscal years ending June 30, 2011, 2012 and 2013 were $3,775,389, $4,213,692 and $4,523,452, respectively, and equal 100% of the required contributions for each year. State Teachers' Retirement System (STRS) Plan Description The District contributes to the State Teachers' Retirement System (STRS), a costsharing multiple-employer public employee retirement system defined benefit pension plan administered by STRS. The plan provides retirement, disability and survivor benefits to beneficiaries. Benefit provisions are established by state statutes, as legislatively amended, within the State Teachers' Retirement Law. STRS issues a separate comprehensive annual financial report that includes financial statements and required supplementary information. Copies of the STRS annual financial report may be obtained from the STRS Executive Office, 100 Waterfront Place, West Sacramento, California
60 NOTES TO BASIC FINANCIAL STATEMENTS (Continued) 8. EMPLOYEE RETIREMENT SYSTEMS (Continued) Plan Description and Provisions (Continued) State Teachers' Retirement System (STRS) (Continued) Funding Policy Active plan members are required to contribute 8% of their salary. The required employer contribution rate for fiscal year was 8.25% of annual payroll. The contribution requirements of the plan members are established by state statute. The District's contributions to STRS for the fiscal years ending June 30, 2011, 2012 and 2013 were $8,409,803, $8,544,399 and $8,461,859, respectively, and equal 100% of the required contributions for each year. 9. OTHER POSTEMPLOYMENT BENEFITS In addition to the pension benefits described in Note 8, the District provides postemployment health benefits to all employees (1) hired prior to December 31, 2006 and who have attained five continuous years of service with the District (as defined by PERS/STRS); (2) are hired after January 1, 2007 and have attained ten continuous years of service with the District (as defined by PERS/STRS). Dental benefits are provided to employees who meet the rule of "75" (number of years worked plus age equals 75 or more) to qualify for post employment dental benefits. As of June 30, 2013, a total of 2,419 retirees met the health care benefit requirement. The District offers retirees a choice of two health maintenance organizations (HMO's) for health benefits and a supplemental Medicare Part A Plan; dental benefits are offered through one insurer. The District pays 100% for the monthly HMO up to the cost of the CalPERS Northern California Blue Shield health plan and 100% dental for eligible employees and their spouses who retired prior to January 1, Employees who retire after January 1, 2007 are covered by the terms of their bargaining union that are in effect at their retirement date. All eligible retirees and their spouses who qualify for Medicare benefits must apply for and pay for the Part B premium as required by law. Expenditures for post-employment health care benefits are recognized when paid. 55
61 NOTES TO BASIC FINANCIAL STATEMENTS (Continued) 9. OTHER POSTEMPLOYMENT BENEFITS (Continued) Annual OPEB Cost and Net OPEB Obligation The District's annual other postemployment benefit (OPEB) cost (expense) is calculated based on the annual required contribution of the employer (ARC), an amount actuarially determined in accordance with the parameters of GASB Statement 45. The ARC represents a level of funding that, if paid on an ongoing basis, is projected to cover normal cost each year and amortize any unfunded actuarial liabilities (or funding excess) over a period not to exceed thirty years. The following table shows the components of the District's annual OPEB cost for the year, the amount actually contributed to the plan, and changes in the District's net OPEB obligation: Annual required contribution $ 23,367,100 Interest on net OPEB obligation 4,037,326 Adjustment to annual required contribution (4,316,495) Annual OPEB cost 23,087,931 Contributions made (17,026,494) Increase in net OPEB obligation 6,061,437 Net OPEB obligation - beginning of year 89,718,345 Net OPEB obligation - end of year $ 95,779,782 The District's annual OPEB cost, the percentage of annual OPEB cost contributed to the plan, and the net OPEB obligation for the year ended June 30, 2013 and preceding two years were as follows: Percentage of Annual Fiscal Year Annual OPEB Cost Net OPEB Ended OPEB Cost Contributed Obligation June 30, 2011 $ 23,606, % $ 84,111,607 June 30, 2012 $ 24,550, % $ 89,718,345 June 30, 2013 $ 23,087, % $ 95,779,782 56
62 NOTES TO BASIC FINANCIAL STATEMENTS (Continued) 9. OTHER POSTEMPLOYMENT BENEFITS (Continued) Funded Status and Funding Progress As of July 1, 2012, the most recent actuarial valuation date, the plan was unfunded. The actuarial liability for benefits was $364,528,416 and the actuarial value of assets was $0, resulting in a unfunded actuarial accrued liability (UAAL) of $364,528,416. However, the District has set aside $13,873,583 in the Retiree Benefits Trust Fund for future payment of these benefits. No current employees are covered by the Plan. The OPEB plan is currently operated as a pay-as-you-go plan. Actuarial valuations of an ongoing plan involve estimates of the value of reported amounts and assumptions about the probability of occurrence of events far into the future. Examples include assumptions about future employment, mortality, and the healthcare cost trend. Amounts determined regarding the funded status of the plan and the annual required contributions of the employer are subject to continual revision as actual results are compared with past expectations and new estimates are made about the future. The schedule of funding progress, presented as required supplementary information following the notes to the financial statements, presents multiyear trend information about whether the actuarial value of plan assets is increasing or decreasing over time relative to the actuarial accrued liabilities for benefits. Actuarial Methods and Assumptions Projections of benefits for financial reporting purposes are based on the substantive plan (the plan as understood by the employer and the plan members) and include the types of benefits provided at the time of each valuation and the historical pattern of sharing of benefit costs between the employer and plan members to that point. The actuarial methods and assumptions used include techniques that are designed to reduce the effects of short-term volatility in actuarial accrued liabilities and the actuarial value of assets, consistent with the long-term perspective of the calculations. In the July 1, 2012 actuarial valuation, the entry age normal cost method was used. The actuarial assumptions included a 4.5 percent investment rate of return (net of administrative expenses), which is a blended rate of the expected long-term investment returns on plan assets and on the employer's own investments calculated based on the funded level of the plan on the valuation date, and an annual healthcare cost trend rate of 8.5 percent initially, reduced by decrements to an ultimate rate of 5.5 percent after 10 years. Both rates included a 3.25 percent inflation assumption. The actuarial value of assets was determined using techniques that spread the effects of short-term volatility in the market value of investments over a five-year period. The UAAL is being amortized as a level percentage of projected payroll on an open basis. The remaining amortization period at June 30, 2013, was 25 years. 57
63 10. JOINT POWERS AGREEMENTS NOTES TO BASIC FINANCIAL STATEMENTS (Continued) Contra Costa County Schools Insurance Group The District is a member with other school districts of a Joint Powers Authority, Contra Costa County Schools Insurance Group (CCCSIG), for the operation of a common risk management and insurance program for workers' compensation coverage. The following is a summary of financial information for CCCSIG at June 30, 2013: Total assets $ 93,655,160 Total liabilities $ 78,994,453 Total net position $ 14,660,707 Total revenues $ 42,123,990 Total expenses $ 42,145,080 Change in net position $ (21,090) Northern California Regional Liability Excess Fund (Nor Cal Relief) The District is a member with other agencies of a Joint Powers Authority, Northern California Regional Liability Excess Fund (Nor Cal Relief), for the operation of a common risk management and insurance program for property and liability coverage. The following is a summary of financial information for Nor Cal Relief at June 30, 2012 (most recent information available): Total assets $ 63,057,995 Total liabilities $ 33,010,616 Total net assets $ 30,047,379 Total revenues $ 38,435,295 Total expenses $ 34,816,047 Change in net assets $ 3,619,248 The relationship between the District and the Joint Powers Authorities is such that the Joint Powers Authorities are not component units of the District for financial reporting purposes. 11. CONTINGENCIES Contingent Liabilities The District is subject to legal proceedings and claims which arise in ordinary course of business. In the opinion of management, the amount of ultimate liability with respect to these actions will not materially affect the financial position or results of operations of the District. The District has received federal and state funds for specific purposes that are subject to review and audit by the grantor agencies. Although such audits could result in expenditure disallowances under terms of the grants, it is management's opinion that any required reimbursements or future revenue offsets subsequently determined will not have a material effect on the financial position or results of operations of the District. Construction Commitments As of June 30, 2013, the District has approximately $107,301,004 in outstanding commitments on construction contracts. 58
64 12. SUBSEQUENT EVENTS General Obligation Bonds NOTES TO BASIC FINANCIAL STATEMENTS (Continued) On October 31, 2013, the District issued Election of 2012, Series A General Obligation Bonds totaling $85,000,000. The bonds were issued to finance the construction and upgrade of certain schools and other District facilities authorized by the 2012 Election. The Board of Supervisors of Contra Costa County is empowered and obligated to annually levy and collect ad valorem property taxes without limitation as to rate or amount on all taxable property in the District, for the repayment of interest, principal and premium, if any. The Bonds bear interest at rates ranging from 4.0% to 5.5% and are scheduled to mature through August 1, On October 31, 2013, the District issued Election of 2010, Series B General Obligation Bonds totaling $40,000,000. The bonds were issued to finance the construction and upgrade of certain schools and other District facilities authorized by the 2010 Election. The Board of Supervisors of Contra Costa County is empowered and obligated to annually levy and collect ad valorem property taxes without limitation as to rate or amount on all taxable property in the District, for the repayment of interest, principal and premium, if any. The Bonds bear interest at rates ranging from 2.0% to 5.5% and are scheduled to mature through August 1,
65 REQUIRED SUPPLEMENTARY INFORMATION
66 GENERAL FUND BUDGETARY COMPARISON SCHEDULE For the Year Ended June 30, 2013 Budget Variance Favorable Original Final Actual (Unfavorable) Revenues: Revenue limit sources: State apportionment $ 92,664,668 $ 88,946,661 $ 88,565,509 $ (381,152) Local sources 55,589,910 61,096,457 61,392, ,905 Total revenue limit 148,254, ,043, ,957,871 (85,247) Federal sources 25,780,824 31,663,584 25,624,711 (6,038,873) Other state sources 56,493,658 59,036,192 60,899,441 1,863,249 Other local sources 20,507,475 21,908,121 22,115, ,907 Total revenues 251,036, ,651, ,597,051 (4,053,964) Expenditures: Certificated salaries 102,999, ,512, ,317,911 2,194,550 Classified salaries 40,963,091 42,161,236 41,534, ,569 Employee benefits 62,107,767 63,442,953 61,417,931 2,025,022 Books and supplies 10,274,961 14,149,584 9,380,887 4,768,697 Contract services and operating expenditures 46,193,996 57,196,420 45,764,340 11,432,080 Capital outlay 3,869,298 4,510, ,720 3,977,661 Other outgo 50, ,572 59,293 43,279 Debt service: Principal retirement 500, , ,000 - Interest 424, , ,071 (203,104) Total expenditures 267,383, ,000, ,135,820 24,864,754 Deficiency of revenues under expenditures (16,346,806) (27,349,559) (6,538,769) 20,810,790 Other financing sources (uses): Operating transfers in 3,538,442 3,479,785 2,449,781 (1,030,004) Operating transfers out - - (1,815,654) (1,815,654) Total other financing sources (uses) 3,538,442 3,479, ,127 (2,845,658) Net change in fund balance (12,808,364) (23,869,774) (5,904,642) 17,965,132 Fund balance, July 1, ,934,340 62,934,340 62,934,340 - Fund balance, June 30, 2013 $ 50,125,976 $ 39,064,566 $ 57,029,698 $ 17,965,132 See accompanying notes to required supplementary information. 60
67 SCHEDULE OF OTHER POSTEMPLOYMENT BENEFITS (OPEB) FUNDING PROGRESS For the Year Ended June 30, 2013 Schedule of Funding Progress Unfunded UAAL as a Actuarial Actuarial Percentage Fiscal Actuarial Actuarial Accrued Accrued of Year Valuation Value of Liability Liability Funded Covered Covered Ended Date Assets (AAL) (UAAL) Ratio Payroll* Payroll* 6/30/2011 July 1, 2010 $0 $386 million $386 million 0% $0 0% 6/30/2012 July 1, 2010 $0 $386 million $386 million 0% $0 0% 6/30/2013 July 1, 2012 $0 $365 million $365 million 0% $0 0% * No current employees are covered by the Plan. See accompanying notes to required supplementary information. 61
68 NOTES TO REQUIRED SUPPLEMENTARY INFORMATION 1. PURPOSE OF SCHEDULES A - Budgetary Comparison Schedule The District employs budget control by object codes and by individual appropriation accounts. Budgets are prepared on the modified accrual basis of accounting in accordance with accounting principles generally accepted in the United States of America as prescribed by the Governmental Accounting Standards Board. The budgets are revised during the year by the Board of Education to provide for revised priorities. Expenditures cannot legally exceed appropriations by major object code. The originally adopted and final revised budgets for the General Fund are presented as Required Supplementary Information. The basis of budgeting is the same as GAAP. B - Schedule of Other Postemployment Benefits Funding Progress The Schedule of Funding Progress presents multi-year trend information which compares, over time, the actuarially accrued liability for benefits with the actuarial value of accumulated plan assets. 62
69 SUPPLEMENTARY INFORMATION
70 COMBINING BALANCE SHEET ALL NON-MAJOR FUNDS June 30, 2013 Special Reserve for County Capital Corporation Adult Child Deferred Capital School Outlay Debt Debt Education Development Cafeteria Maintenance Facilities Facilities Projects Service Service Fund Fund Fund Fund Fund Fund Fund Fund Fund Total ASSETS Cash in County Treasury $ 1,972,754 $ 610,106 $ 99,621 $ 1,303,025 $ 1,282,952 $ 9,936,802 $ 7,132,954 $ - $ - $ 22,338,214 Cash awaiting deposit Cash on hand and in banks 21, ,186 Cash with Fiscal Agent ,042,373-1,042,373 Local Agency Investment Fund 3, ,165, ,168,335 Receivables 296,987 4,278 3,498,434 1,005 1,030 9,243 14, ,825,624 Stores inventory , ,991 Total assets $ 2,294,153 $ 614,384 $ 4,211,796 $ 1,304,030 $ 2,449,091 $ 9,946,045 $ 7,147,041 $ 1,042,373 $ 560 $ 29,009,473 LIABILITIES AND FUND BALANCES Liabilities: Accounts payable $ 228,244 $ 64,397 $ 500,706 $ - $ 6,477 $ - $ 470,641 $ - $ - $ 1,270,465 Unearned revenue - 392, ,935 Total liabilities 228, , ,706-6, , ,663,400 Fund balances: Nonspendable , ,991 Restricted 2,065, ,052 3,098,099 1,304,030 2,442,614 9,946,045 6,676,400 1,042, ,733,082 Total fund balances 2,065, ,052 3,711,090 1,304,030 2,442,614 9,946,045 6,676,400 1,042, ,346,073 Total liabilities and fund balances $ 2,294,153 $ 614,384 $ 4,211,796 $ 1,304,030 $ 2,449,091 $ 9,946,045 $ 7,147,041 $ 1,042,373 $ 560 $ 29,009,473 63
71 COMBINING STATEMENT OF REVENUES, EXPENDITURES AND CHANGE IN FUND BALANCES ALL NON-MAJOR FUNDS For the Year Ended June 30, 2013 Special Reserve for County Capital Corporation Adult Child Deferred Capital School Outlay Debt Debt Education Development Cafeteria Maintenance Facilities Facilities Projects Service Service Fund Fund Fund Fund Fund Fund Fund Fund Fund Total Revenues: Federal sources $ 364,091 $ 457,811 $ 12,392,592 $ - $ - $ - $ - $ - $ - $ 13,214,494 Other state sources 324,771 1,658, ,570 1,090,587-18,962, ,920,572 Other local sources 421, , ,210 5,792 1,374,767 68, ,459-2,771 3,975,498 Total revenues 1,109,948 2,263,754 14,255,372 1,096,379 1,374,767 19,031, ,459-2,771 40,110,564 Expenditures: Certificated salaries 1,430, , ,407,425 Classified salaries 681, ,523 4,744, ,073,566 Employee benefits 497, ,522 1,815, ,899,060 Books and supplies 63,181 19,828 6,362, , ,458,567 Contract services and operating expenditures 242,630 30, ,012 89, ,337-1,066, ,111,008 Capital outlay ,310-5,773 24,946, ,187,258 Debt service: Principal retirement - 28, ,823 Total expenditures 2,914,757 2,289,758 13,602,850 89, ,110 24,946,405 1,080, ,165,707 (Deficiency) excess of revenues (under) over expenditures (1,804,809) (26,004) 652,522 1,007,034 1,132,657 (5,915,291) (104,023) - 2,771 (5,055,143) Other financing sources (uses): Operating transfers in 1,815, , ,945,654 Operating transfers out (46) (60,739) (466,412) (1,000,000) - - (130,000) - (922,584) (2,579,781) Total other financing sources (uses) 1,815,608 69,261 (466,412) (1,000,000) - - (130,000) - (922,584) (167,715) Net change in fund balances 10,799 43, ,110 7,034 1,132,657 (5,915,291) (234,023) - (919,813) (5,689,270) Fund balances, July 1, ,055, ,795 3,524,980 1,296,996 1,309,957 15,861,336 6,910,423 1,042, ,373 33,035,343 Fund balances, June 30, 2013 $ 2,065,909 $ 157,052 $ 3,711,090 $ 1,304,030 2,442,614 $ 9,946,045 $ 6,676,400 $ 1,042,373 $ 560 $ 27,346,073 64
72 ORGANIZATION June 30, 2013 West Contra Costa Unified School District was established as the Richmond Unified School District on July 1, 1985, and, with the passage of AB 535, was renamed the West Contra Costa Unified School District on March 17, The District is comprised of an area of approximately 112 square miles located in Contra Costa County in the State of California. There were no changes in the boundaries of the District during the current year. The District is currently operating one special education pre-school, thirty four elementary, two kindergarten through eighth, six middle, one middle-college high and six high schools. The District also maintains two alternative high schools, an elementary community day school and a school for continuing adult education. BOARD OF EDUCATION Name Office Term Expires Ms. Madeline Kronenberg President December 3, 2014 Mr. Charles Ramsey Clerk December 3, 2014 Mr. Randall Enos Member December 2, 2016 Mr. Todd A Groves Member December 2, 2016 Ms. Elaine Merriweather Member December 3, 2014 ADMINISTRATION Bruce Harter, Ph.D. Superintendent of Schools Wendell Greer Associate Superintendent, K-12 William Fay Associate Superintendent for Operations Sheri Gamba Associate Superintendent for Business Services Nia Rashidchi Assistant Superintendent of Educational Services Kenneth Whittemore Assistant Superintendent of Human Resources 65
73 SCHEDULE OF AVERAGE DAILY ATTENDANCE For the Year Ended June 30, 2013 Original Audited* Second Second Period Period Annual Report Report Report Elementary: Kindergarten 2,490 2,490 2,493 First through Third 7,059 7,059 7,050 Fourth through Eighth 9,964 9,964 9,947 Home and Hospital Special Education Non Public Schools Community Day School Total Elementary 20,393 20,393 20,365 Secondary: Regular Classes 6,678 6,678 6,622 Special Education Compulsory Continuation Education Community Day School Home and Hospital Non Public Schools Total Secondary 7,580 7,644 7,523 27,973 28,037 27,888 * Reflects revisions made by the District, based on an internal review of records. See accompanying notes to supplementary information. 66
74 SCHEDULE OF INSTRUCTIONAL TIME For the Year Ended June 30, 2013 Statutory Reduced Statutory Reduced Number Minutes Minutes of Days Require- Require- Actual Actual Actual Traditional Grade Level ment ment Minutes Minutes Minutes Calendar Status DISTRICT Kindergarten 36,000 35,000 31,500 30,625 36, In Compliance Grade 1 50,400 49,000 45,160 43,906 50, In Compliance Grade 2 50,400 49,000 45,160 43,906 50, In Compliance Grade 3 50,400 49,000 45,160 43,906 50, In Compliance Grade 4 54,000 52,500 45,160 43,906 54, In Compliance Grade 5 54,000 52,500 45,160 43,906 54, In Compliance Grade 6 54,000 52,500 45,160 43,906 54, In Compliance Grade 7 54,000 52,500 45,160 43,906 55, In Compliance Grade 8 54,000 52,500 45,160 43,906 55, In Compliance Grade 9 64,800 63,000 52,898 51,429 63, In Compliance Grade 10 64,800 63,000 52,898 51,429 63, In Compliance Grade 11 64,800 63,000 52,898 51,429 63, In Compliance Grade 12 64,800 63,000 52,898 51,429 63, In Compliance See accompanying notes to supplementary information. 67
75 SCHEDULE OF EXPENDITURE OF FEDERAL AWARDS For the Year Ended June 30, 2013 Pass- Through Federal Entity Federal Catalog Federal Grantor/Pass-Through Identifying Expend- Number Grantor/Program or Cluster Title Number itures U. S. Department of Education - Passed through California Department of Education Special Education Cluster: Special Education IDEA: Basic Local Assistance Entitlement, Part B, Sec. 611 (Formerly ) $ 5,652, Special Education IDEA: Local Assistance Part B, Sec 611 Private School ISPs , A Special Education - Alternative Dispute Resolution, Part B, Sec , A Special Education - State Performance Plan Facilitated Review , A Special Education IDEA: Preschool Local Entitlement, Part B, Sec. 611 (Age 3-5) , A Special Education IDEA: Preschool Staff Development, Part B, Sec , A Special Education IDEA: Mental Health Services, Part B, Sec , Special Education IDEA: Preschool Grant, Part B, Sec 619 (Age 3-4-5) ,382 Subtotal Special Education Cluster 6,804,891 School Improvement Grants Cluster: NCLB: Title I, School Improvement Grant (SIG) ,512, NCLB: ARRA Title I, School Improvement Grant (SIG) for Elementary and Secondary ,441,006 School Improvement Grants Cluster 4,953,939 Adult Education Programs: A Adult Education: Adult Basic Education and ESL , Adult Education: Adult Secondary Education , A Adult Education: English Literacy and Civics Education ,266 Subtotal Adult Education Programs: 362,728 NCLB: Title III Programs: NCLB: Title III, Limited English Proficiency (LEP) Student Program ,192, NCLB: Title III, Immigrant Education Program ,863 Subtotal NCLB: Title III Programs: 1,291,608 (Continued) 68
76 SCHEDULE OF EXPENDITURE OF FEDERAL AWARDS (Continued) For the Year Ended June 30, 2013 Pass- Through Federal Entity Federal Catalog Federal Grantor/Pass-Through Identifying Expend- Number Grantor/Program or Cluster Title Number itures U.S. Department of Education - Passed through California Department of Education (Continued) NCLB: Title IV Programs: NCLB: Title IV, Part B, 21st Century Community Learning Centers Program $ 1,210, NCLB: Title IV, Part B, 21st Century Community Learning Centers Program High School Assets ,588 Subtotal NCLB: Title IV Programs: 1,265,553 Carl D Perkins Programs: Carl D. Perkins Career and Technical Education Secondary, Section 131 (Vocational Education) , Carl D Perkins Career and Technical Education Adult, Section ,363 Subtotal Carl D Perkins Programs: 221,495 Fund for the Improvement of Education: X Teaching American History , E Readiness and Emergency Management ,064 Subtotal Fund for the Improvement of Education: 472, NCLB: Title I, Part A, Basic Grants Low Income and Neglected ,347, Department of Rehabilitation: Workability II Transitions Partnership Program , Special Education IDEA: Early Intervention Grants, Part C , Safe and Supportive Schools Programmatic Intervention (S3) , NCLB: Title X, McKinney-Vento Homeless Assistance Grants , NCLB: Title II, Part D, Enhancing Education Through Technology (EETT) , C Learning Without Borders N/A 339, NCLB: Title II, Part A, Improving Teacher Quality ,287, Education Jobs Fund (SB 847) ,678 Total U.S. Department of Education 25,496,569 (Continued) 69
77 SCHEDULE OF EXPENDITURE OF FEDERAL AWARDS (Continued) For the Year Ended June 30, 2013 Pass- Through Federal Entity Federal Catalog Federal Grantor/Pass-Through Identifying Expend- Number Grantor/Program or Cluster Title Number itures U.S. Department of Health and Human Services - Passed through California Department of Education Dept of Health Care Services: Medi-Cal Billing Option ,468 U.S. Department of Agriculture - Passed through California Department of Education Child Nutrition Cluster: Child Nutrition: School Programs ,687, Child Nutrition: Summer Food Service Program Operations ,319 Subtotal Child Nutrition Cluster 12,392,592 Total Federal Programs $ 38,607,629 See accompanying notes to supplementary information. 70
78 RECONCILIATION OF UNAUDITED ACTUAL FINANCIAL REPORT WITH AUDITED FINANCIAL STATEMENTS For the Year Ended June 30, 2013 There were no adjustments proposed to any funds of the District. See accompanying notes to supplementary information. 71
79 SCHEDULE OF FINANCIAL TRENDS AND ANALYSIS For the Year Ended June 30, 2013 (In Thousands) (UNAUDITED) General Fund (Budget) Revenues and other financing sources $ 258,120 $ 261,047 $ 275,566 $ 269,254 Expenditures 270, , , ,706 Other uses and transfers out - 1, Total outgo 270, , , ,706 Change in fund balance $ (12,263) $ (5,904) $ 6,031 $ 9,548 Ending fund balance $ 44,767 $ 57,030 $ 62,934 $ 56,903 Available reserves $ 19,785 $ 21,702 $ 22,173 $ 18,071 Designated for economic uncertainties $ 8,091 $ 7,993 $ 8,169 $ 7,860 Undesignated fund balance $ 11,694 $ 13,709 $ 14,004 $ 10,211 Available reserves as percentages of total outgo 7.32% 5.14% 8.23% 6.96% All Funds Total long-term liabilities $ 972,457 $ 1,012,507 $ 1,009,279 $ 918,349 Average daily attendance at P-2 (not in thousands) 27,971 28,037 27,598 27,589 The General Fund fund balance has increased by $9,675,000 over the past three years. The fiscal year budget projects a decrease of $12,263,000. For a district this size, the State of California requires available reserves of at least 3 percent of total General Fund expenditures, transfers out, and other uses. The District has met this requirement. The District has incurred an operating deficit in the fiscal year , and anticipates incurring an operating deficit during the fiscal year. Total long-term liabilities have increased by $94,158,000 over the past two years, due primarily to the issuance of General Obligation Bonds (See Note 6 to the financial statements). Average daily attendance has increased by 448 over the past two years. The District anticipates a decrease of 66 ADA for the fiscal year. See accompanying notes to supplementary information. 72
80 SCHEDULE OF CHARTER SCHOOLS For the Year Ended June 30, 2013 Charter Schools Chartered by District Manzanita Charter School Leadership High Charter School Richmond College Prep K-5 West Community High School Richmond Charter Academy Included in District Financial Statements, or Separate Report Separate Report Separate Report Separate Report Separate Report Separate Report See accompanying notes to supplementary information. 73
81 1. PURPOSE OF SCHEDULES NOTES TO SUPPLEMENTARY INFORMATION A - Schedule of Average Daily Attendance Average daily attendance is a measurement of the number of pupils attending classes of the District. The purpose of attendance accounting from a fiscal standpoint is to provide the basis on which apportionments of state funds are made to school districts. This schedule provides information regarding the attendance of students at various grade levels and in different programs. B - Schedule of Instructional Time The District has received incentive funding for increasing instructional time as provided by the Incentives for Longer Instructional Day and Year. This schedule presents information on the amount of instructional time offered by the District, and whether the District complied with the provisions of Education Code Sections through C - Schedule of Expenditure of Federal Awards OMB Circular A-133 requires a disclosure of the financial activities of all federally funded programs. This schedule was prepared to comply with A-133 requirements, and is presented on the modified accrual basis of accounting. The following schedule provides a reconciliation between revenues reported on the Statement of Revenues, Expenditures and Change in Fund Balances and the related expenditures reported on the Schedule of Expenditure of Federal Awards. The reconciling amounts represent Federal funds that have been recorded as revenues that have not been expended by June 30, CFDA Description Number Amount Total Federal revenues, Statement of Revenues, Expenditures and Change in Fund Balances $ 42,786,953 Less: Federal reimbursement of interest paid on Build America Bonds N/A (3,947,748) Medi-Cal Billing Funds not spent (231,576) Total Schedule of Expenditure of Federal Awards $ 38,607,629 74
82 NOTES TO SUPPLEMENTARY INFORMATION (Continued) 1. PURPOSE OF SCHEDULES (Continued) D - Reconciliation of Unaudited Actual Financial Report with Audited Financial Statements This schedule provides the information necessary to reconcile the Unaudited Actual Financial Report to the audited financial statements. E - Schedule of Financial Trends and Analysis - Unaudited This schedule provides information on the District's financial condition over the past three years and its anticipated condition for the fiscal year, as required by the State Controller's Office. The information in this schedule has been derived from audited information. F - Schedule of Charter Schools This schedule provides information for the California Department of Education to monitor financial reporting by Charter Schools. 2. EARLY RETIREMENT INCENTIVE PROGRAM Education Code Section requires certain disclosure in the financial statements of districts which adopt Early Retirement Incentive Programs pursuant to Education Code Sections and For the fiscal year ended June 30, 2013, the District did not adopt this program. 75

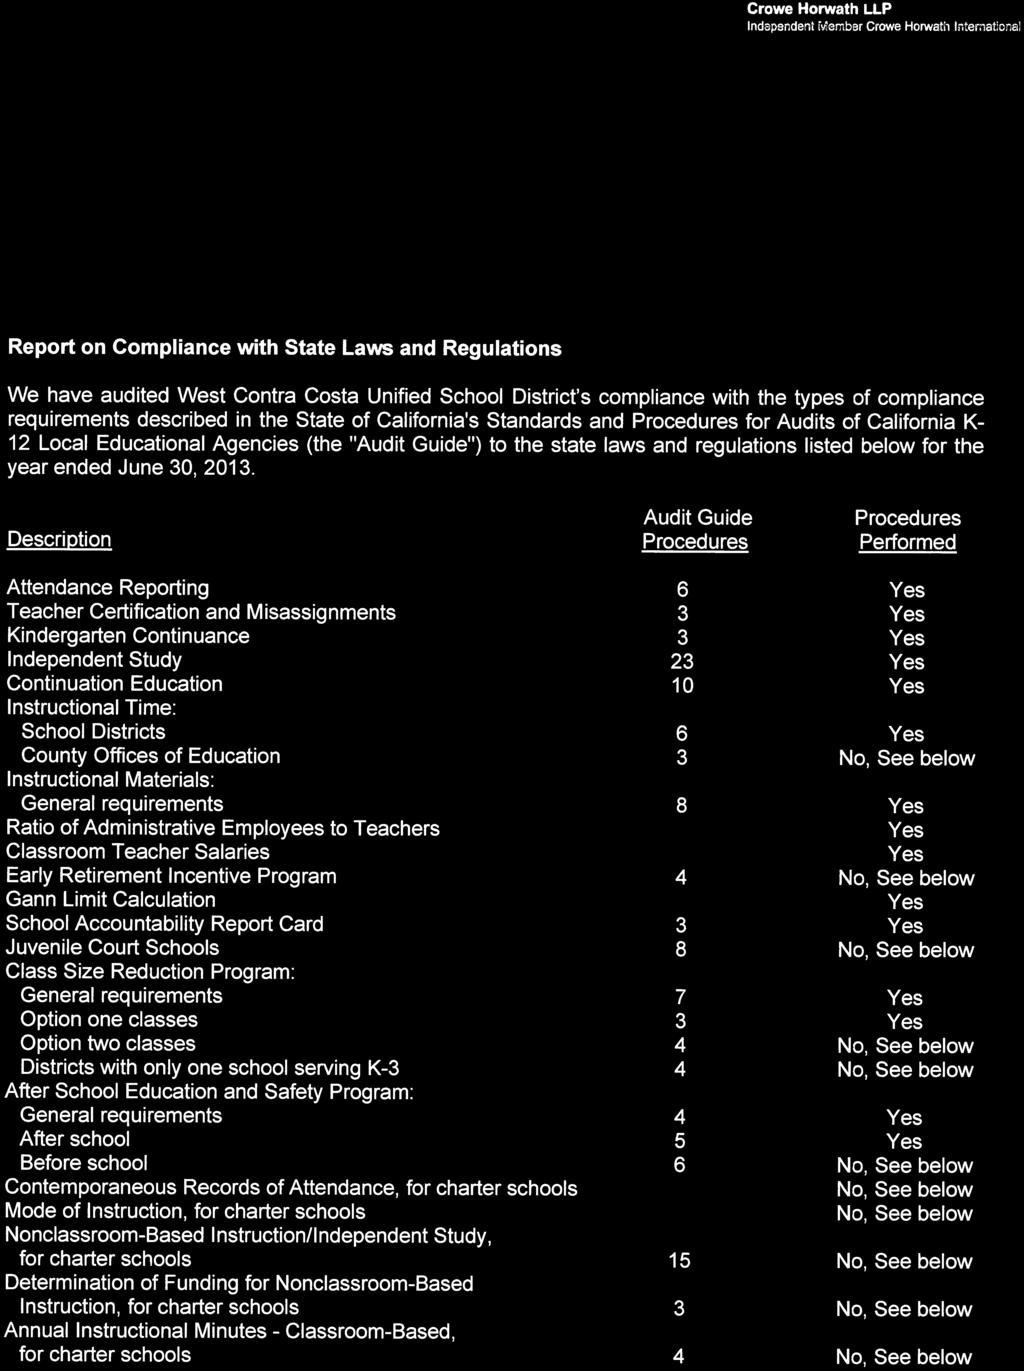
83
84

85
86

87
88
WEST CONTRA COSTA UNIFIED SCHOOL DISTRICT
 WEST CONTRA COSTA UNIFIED SCHOOL DISTRICT AUDIT REPORT JUNE 30, 2015 OF CONTRA COSTA COUNTY RICHMOND, CALIFORNIA JUNE 30, 2015 The West Contra Costa Unified School District was established as the Richmond
BEAUMONT UNIFIED SCHOOL DISTRICT AUDIT REPORT For the Fiscal Year Ended June 30, 2016
 BEAUMONT UNIFIED SCHOOL DISTRICT AUDIT REPORT For the Fiscal Year Ended June 30, 2016 For the Fiscal Year Ended June 30, 2016 Table of Contents FINANCIAL SECTION Page Independent Auditors' Report... 1
NATOMAS UNIFIED SCHOOL DISTRICT. FINANCIAL STATEMENTS June 30, 2017
 FINANCIAL STATEMENTS June 30, 2017 FINANCIAL STATEMENTS WITH SUPPLEMENTARY INFORMATION For the Year Ended June 30, 2017 CONTENTS INDEPENDENT AUDITOR'S REPORT... 1 MANAGEMENT'S DISCUSSION AND ANALYSIS...
AUBURN UNION SCHOOL DISTRICT. FINANCIAL STATEMENTS June 30, 2016
 FINANCIAL STATEMENTS June 30, 2016 FINANCIAL STATEMENTS WITH SUPPLEMENTARY INFORMATION For the Year Ended June 30, 2016 (Continued) CONTENTS INDEPENDENT AUDITOR'S REPORT... 1 MANAGEMENT'S DISCUSSION AND
FONTANA UNIFIED SCHOOL DISTRICT AUDIT REPORT For the Fiscal Year Ended June 30, 2017
 FONTANA UNIFIED SCHOOL DISTRICT AUDIT REPORT For the Fiscal Year Ended June 30, 2017 For the Fiscal Year Ended June 30, 2017 Table of Contents FINANCIAL SECTION Page Independent Auditors' Report... 1 Management's
AUBURN UNION SCHOOL DISTRICT Auburn, California. FINANCIAL STATEMENTS June 30, 2014
 Auburn, California FINANCIAL STATEMENTS June 30, 2014 FINANCIAL STATEMENTS WITH SUPPLEMENTARY INFORMATION For the Year Ended June 30, 2014 TABLE OF CONTENTS Page Independent Auditor's Report 1 Management's
NATOMAS UNIFIED SCHOOL DISTRICT. FINANCIAL STATEMENTS June 30, 2016
 FINANCIAL STATEMENTS June 30, 2016 FINANCIAL STATEMENTS WITH SUPPLEMENTARY INFORMATION For the Year Ended June 30, 2016 CONTENTS INDEPENDENT AUDITOR'S REPORT... 1 MANAGEMENT'S DISCUSSION AND ANALYSIS...
AMADOR COUNTY UNIFIED SCHOOL DISTRICT. FINANCIAL STATEMENTS June 30, 2018
 FINANCIAL STATEMENTS June 30, 2018 FINANCIAL STATEMENTS WITH SUPPLEMENTARY INFORMATION For the Year Ended June 30, 2018 CONTENTS INDEPENDENT AUDITOR'S REPORT... 1 MANAGEMENT'S DISCUSSION AND ANALYSIS...
BERRYESSA UNION SCHOOL DISTRICT AUDIT REPORT For the Fiscal Year Ended June 30, 2018
 AUDIT REPORT For the Fiscal Year Ended June 30, 2018 For the Fiscal Year Ended June 30, 2018 Table of Contents FINANCIAL SECTION Page Independent Auditors Report... 1 Management s Discussion and Analysis...
TUSTIN UNIFIED SCHOOL DISTRICT AUDIT REPORT For the Fiscal Year Ended June 30, 2017
 TUSTIN UNIFIED SCHOOL DISTRICT AUDIT REPORT For the Fiscal Year Ended June 30, 2017 For the Fiscal Year Ended June 30, 2017 Table of Contents FINANCIAL SECTION Page Independent Auditors Report... 1 Management
CAMPBELL UNION HIGH SCHOOL DISTRICT San Jose, California. FINANCIAL STATEMENTS June 30, 2013
 San Jose, California FINANCIAL STATEMENTS June 30, 2013 FINANCIAL STATEMENTS WITH SUPPLEMENTARY INFORMATION For the Year Ended June 30, 2013 TABLE OF CONTENTS Page Independent Auditor's Report 1 Management's
NATOMAS UNIFIED SCHOOL DISTRICT Sacramento, California. FINANCIAL STATEMENTS June 30, 2014
 Sacramento, California FINANCIAL STATEMENTS June 30, 2014 FINANCIAL STATEMENTS WITH SUPPLEMENTARY INFORMATION For the Year Ended June 30, 2014 TABLE OF CONTENTS Page Independent Auditor's Report 1 Management's
LAS VIRGENES UNIFIED SCHOOL DISTRICT AUDIT REPORT For the Fiscal Year Ended June 30, 2016
 LAS VIRGENES UNIFIED SCHOOL DISTRICT AUDIT REPORT For the Fiscal Year Ended June 30, 2016 For the Fiscal Year Ended June 30, 2016 Table of Contents FINANCIAL SECTION Page Independent Auditors Report...
BENICIA UNIFIED SCHOOL DISTRICT COUNTY OF SOLANO BENICIA, CALIFORNIA FINANCIAL STATEMENTS WITH INDEPENDENT AUDITOR S REPORT
 COUNTY OF SOLANO BENICIA, CALIFORNIA FINANCIAL STATEMENTS WITH INDEPENDENT AUDITOR S REPORT FOR THE FISCAL YEAR ENDED JAMES MARTA & COMPANY LLP CERTIFIED PUBLIC ACCOUNTANTS 701 HOWE AVENUE, E3 SACRAMENTO,
OXNARD SCHOOL DISTRICT AUDIT REPORT For the Fiscal Year Ended June 30, 2017
 AUDIT REPORT For the Fiscal Year Ended June 30, 2017 For the Fiscal Year Ended June 30, 2017 Table of Contents FINANCIAL SECTION Page Independent Auditors Report... 1 Management s Discussion and Analysis...
FONTANA UNIFIED SCHOOL DISTRICT AUDIT REPORT For the Fiscal Year Ended June 30, 2018
 FONTANA UNIFIED SCHOOL DISTRICT AUDIT REPORT For the Fiscal Year Ended June 30, 2018 For the Fiscal Year Ended June 30, 2018 Table of Contents FINANCIAL SECTION Page Independent Auditors' Report... 1 Management's
MORONGO UNIFIED SCHOOL DISTRICT AUDIT REPORT For the Fiscal Year Ended June 30, 2017
 MORONGO UNIFIED SCHOOL DISTRICT AUDIT REPORT For the Fiscal Year Ended June 30, 2017 For the Fiscal Year Ended June 30, 2017 Table of Contents FINANCIAL SECTION Page Independent Auditors' Report... 1 Management's
MOUNT PLEASANT ELEMENTARY SCHOOL DISTRICT San Jose, California. FINANCIAL STATEMENTS June 30, 2011
 MOUNT PLEASANT ELEMENTARY SCHOOL DISTRICT San Jose, California FINANCIAL STATEMENTS June 30, 2011 FINANCIAL STATEMENTS WITH SUPPLEMENTARY INFORMATION For the Year Ended June 30, 2011 TABLE OF CONTENTS
SONOMA COUNTY OFFICE OF EDUCATION AUDIT REPORT For the Fiscal Year Ended June 30, 2018
 SONOMA COUNTY OFFICE OF EDUCATION AUDIT REPORT For the Fiscal Year Ended June 30, 2018 For the Fiscal Year Ended June 30, 2018 Table of Contents FINANCIAL SECTION Page Independent Auditors Report... 1
WASHINGTON UNIFIED SCHOOL DISTRICT West Sacramento, California. FINANCIAL STATEMENTS June 30, 2015
 West Sacramento, California FINANCIAL STATEMENTS June 30, 2015 FINANCIAL STATEMENTS WITH SUPPLEMENTARY INFORMATION For the Year Ended June 30, 2015 (Continued) CONTENTS INDEPENDENT AUDITOR'S REPORT...
COTATI-ROHNERT PARK UNIFIED SCHOOL DISTRICT COUNTY OF SONOMA ROHNERT PARK, CALIFORNIA
 COTATI-ROHNERT PARK UNIFIED SCHOOL DISTRICT COUNTY OF SONOMA ROHNERT PARK, CALIFORNIA AUDIT REPORT JUNE 30, 2016 CHAVAN & ASSOCIATES, LLP CERTIFIED PUBLIC ACCOUNTANTS 1475 SARATOGA AVE., SUITE 180 SAN
CALAVERAS UNIFIED SCHOOL DISTRICT COUNTY OF CALAVERAS SAN ANDREAS, CALIFORNIA ANNUAL FINANCIAL REPORT JUNE 30, 2014
 COUNTY OF CALAVERAS SAN ANDREAS, CALIFORNIA ANNUAL FINANCIAL REPORT JUNE 30, 2014 JUNE 30, 2014 FINANCIAL SECTION TABLE OF CONTENTS Page Independent Auditor's Report 1 Management s Discussion and Analysis
FONTANA UNIFIED SCHOOL DISTRICT AUDIT REPORT For the Fiscal Year Ended June 30, 2015
 FONTANA UNIFIED SCHOOL DISTRICT AUDIT REPORT For the Fiscal Year Ended June 30, 2015 For the Fiscal Year Ended June 30, 2015 Table of Contents FINANCIAL SECTION Page Independent Auditors Report... 1 Management
FONTANA UNIFIED SCHOOL DISTRICT AUDIT REPORT For the Fiscal Year Ended June 30, 2013
 FONTANA UNIFIED SCHOOL DISTRICT AUDIT REPORT For the Fiscal Year Ended June 30, 2013 For the Fiscal Year Ended June 30, 2013 Table of Contents FINANCIAL SECTION Page Independent Auditors Report... 1 Management
SAN LEANDRO UNIFIED SCHOOL DISTRICT ANNUAL FINANCIAL REPORT JUNE 30, 2018
 SAN LEANDRO UNIFIED SCHOOL DISTRICT ANNUAL FINANCIAL REPORT TABLE OF CONTENTS FINANCIAL SECTION Independent Auditor's Report 2 Management's Discussion and Analysis 5 Basic Financial Statements Government-Wide
SANTA CLARA COUNTY OFFICE OF EDUCATION AUDIT REPORT For the Fiscal Year Ended June 30, 2014
 SANTA CLARA COUNTY OFFICE OF EDUCATION AUDIT REPORT For the Fiscal Year Ended June 30, 2014 For the Fiscal Year Ended June 30, 2014 Table of Contents FINANCIAL SECTION Page Independent Auditors Report...
PARADISE UNIFIED SCHOOL DISTRICT. County of Butte Paradise, California
 County of Butte Paradise, California FINANCIAL STATEMENTS AND SUPPLEMENTARY INFORMATION WITH INDEPENDENT AUDITORS REPORTS TABLE OF CONTENTS Page Number FINANCIAL SECTION Independent Auditors Report 1 Required
DELHI UNIFIED SCHOOL DISTRICT Delhi, California. FINANCIAL STATEMENTS June 30, 2014
 Delhi, California FINANCIAL STATEMENTS June 30, 2014 FINANCIAL STATEMENTS WITH SUPPLEMENTARY INFORMATION For the Year Ended June 30, 2014 TABLE OF CONTENTS Page Independent Auditor's Report 1 Management's
LONG BEACH UNIFIED SCHOOL DISTRICT LOS ANGELES COUNTY
 LOS ANGELES COUNTY REPORT ON AUDIT OF FINANCIAL STATEMENTS AND SUPPLEMENTARY INFORMATION INCLUDING REPORTS ON COMPLIANCE June 30, 2016 TABLE OF CONTENTS June 30, 2016 INDEPENDENT AUDITOR S REPORT MANAGEMENT'S
GLENN COUNTY OFFICE OF EDUCATION AUDIT REPORT
 GLENN COUNTY OFFICE OF EDUCATION AUDIT REPORT For the Fiscal Year Ended June 30, 2010 AUDIT REPORT For the Fiscal Year Ended June 30, 2010 Table of Contents FINANCIAL SECTION Page Independent Auditor s
TWIN RIVERS UNIFIED SCHOOL DISTRICT COUNTY OF SACRAMENTO MCCLELLAN, CALIFORNIA
 TWIN RIVERS UNIFIED SCHOOL DISTRICT COUNTY OF SACRAMENTO MCCLELLAN, CALIFORNIA FINANCIAL STATEMENTS WITH INDEPENDENT AUDITOR'S REPORT TABLE OF CONTENTS FINANCIAL SECTION PAGE INDEPENDENT AUDITOR'S REPORT
LONG BEACH UNIFIED SCHOOL DISTRICT LOS ANGELES COUNTY
 LOS ANGELES COUNTY REPORT ON AUDIT OF FINANCIAL STATEMENTS AND SUPPLEMENTARY INFORMATION INCLUDING REPORTS ON COMPLIANCE AUDIT REPORT CONTENTS Page INDEPENDENT AUDITOR'S REPORT MANAGEMENT S DISCUSSION
MOUNT DIABLO UNIFIED SCHOOL DISTRICT AUDIT REPORT For the Fiscal Year Ended June 30, 2015
 MOUNT DIABLO UNIFIED SCHOOL DISTRICT AUDIT REPORT For the Fiscal Year Ended June 30, 2015 For the Fiscal Year Ended June 30, 2015 Table of Contents FINANCIAL SECTION Page Independent Auditors Report...
CENTRAL UNION HIGH SCHOOL DISTRICT COUNTY OF IMPERIAL EL CENTRO, CALIFORNIA AUDIT REPORT JUNE 30, 2018
 COUNTY OF IMPERIAL EL CENTRO, CALIFORNIA AUDIT REPORT JUNE 30, 2018 Introductory Section Central Union High School District Audit Report For The Year Ended June 30, 2018 TABLE OF CONTENTS Page Exhibit/Table
EL DORADO COUNTY OFFICE OF EDUCATION. FINANCIAL STATEMENTS June 30, 2017
 FINANCIAL STATEMENTS June 30, 2017 FINANCIAL STATEMENTS WITH SUPPLEMENTARY INFORMATION For the Year Ended June 30, 2017 CONTENTS INDEPENDENT AUDITOR'S REPORT... 1 MANAGEMENT'S DISCUSSION AND ANALYSIS...
ESPARTO UNIFIED SCHOOL DISTRICT COUNTY OF YOLO ESPARTO, CALIFORNIA FINANCIAL STATEMENTS WITH INDEPENDENT AUDITOR'S REPORT JUNE 30, 2014
 COUNTY OF YOLO ESPARTO, CALIFORNIA FINANCIAL STATEMENTS WITH INDEPENDENT AUDITOR'S REPORT JUNE 30, 2014 TABLE OF CONTENTS PAGE INDEPENDENT AUDITOR'S REPORT 1 MANAGEMENT S DISCUSSION AND ANALYSIS 3 BASIC
COTATI-ROHNERT PARK UNIFIED SCHOOL DISTRICT COUNTY OF SONOMA ROHNERT PARK, CALIFORNIA AUDIT REPORT JUNE 30, 2014
 COTATI-ROHNERT PARK UNIFIED SCHOOL DISTRICT COUNTY OF SONOMA ROHNERT PARK, CALIFORNIA AUDIT REPORT JUNE 30, 2014 CHAVAN & ASSOCIATES, LLP CERTIFIED PUBLIC ACCOUNTANTS 1475 SARATOGA AVE., SUITE 180 SAN
CAMPBELL UNION HIGH SCHOOL DISTRICT San Jose, California. FINANCIAL STATEMENTS June 30, 2011
 San Jose, California FINANCIAL STATEMENTS June 30, 2011 FINANCIAL STATEMENTS WITH SUPPLEMENTARY INFORMATION For the Year Ended June 30, 2011 TABLE OF CONTENTS Page Independent Auditors' Report 1-2 Management's
HUGHSON UNIFIED SCHOOL DISTRICT ANNUAL FINANCIAL REPORT JUNE 30, 2016
 ANNUAL FINANCIAL REPORT TABLE OF CONTENTS FINANCIAL SECTION Independent Auditor's Report 2 Management's Discussion and Analysis 5 Basic Financial Statements Government-Wide Financial Statements Statement
SWEETWATER UNION HIGH SCHOOL DISTRICT
 SWEETWATER UNION HIGH SCHOOL DISTRICT AUDIT REPORT For the Fiscal Year Ended June 30, 2010 AUDIT REPORT For the Fiscal Year Ended June 30, 2010 Table of Contents FINANCIAL SECTION Page Independent Auditor
LAGUNA BEACH UNIFIED SCHOOL DISTRICT ANNUAL FINANCIAL REPORT JUNE 30, 2018
 LAGUNA BEACH UNIFIED SCHOOL DISTRICT ANNUAL FINANCIAL REPORT TABLE OF CONTENTS FINANCIAL SECTION Independent Auditor's Report 2 Management's Discussion and Analysis 5 Basic Financial Statements Government-Wide
CENTRAL UNION HIGH SCHOOL DISTRICT COUNTY OF IMPERIAL EL CENTRO, CALIFORNIA AUDIT REPORT JUNE 30, 2017
 COUNTY OF IMPERIAL EL CENTRO, CALIFORNIA AUDIT REPORT JUNE 30, 2017 Wilkinson Hadley King & Co. LLP CPA's and Advisors 218 W. Douglas Ave. El Cajon, California Introductory Section Central Union High School
FORESTHILL UNION SCHOOL DISTRICT COUNTY OF PLACER FORESTHILL, CALIFORNIA
 COUNTY OF PLACER FORESTHILL, CALIFORNIA FINANCIAL STATEMENTS WITH INDEPENDENT AUDITOR'S REPORT TABLE OF CONTENTS FINANCIAL SECTION PAGE INDEPENDENT AUDITOR'S REPORT 1 MANAGEMENT'S DISCUSSION AND ANALYSIS
NEVADA JOINT UNION HIGH SCHOOL DISTRICT Grass Valley, California. FINANCIAL STATEMENTS June 30, 2014
 Grass Valley, California FINANCIAL STATEMENTS June 30, 2014 FINANCIAL STATEMENTS WITH SUPPLEMENTARY INFORMATION For the Year Ended June 30, 2014 TABLE OF CONTENTS Page Independent Auditor's Report 1 Management's
LONG BEACH UNIFIED SCHOOL DISTRICT LOS ANGELES COUNTY
 LOS ANGELES COUNTY REPORT ON AUDIT OF FINANCIAL STATEMENTS AND SUPPLEMENTARY INFORMATION INCLUDING REPORTS ON COMPLIANCE June 30, 2017 TABLE OF CONTENTS June 30, 2017 INDEPENDENT AUDITORS REPORT MANAGEMENT'S
SAN DIEGO UNIFIED SCHOOL DISTRICT. FINANCIAL STATEMENTS June 30, 2017
 FINANCIAL STATEMENTS June 30, 2017 FINANCIAL STATEMENTS WITH SUPPLEMENTARY INFORMATION For the Year Ended June 30, 2017 CONTENTS INDEPENDENT AUDITOR'S REPORT... 1 MANAGEMENT'S DISCUSSION AND ANALYSIS...
SEQUOIA UNION HIGH SCHOOL DISTRICT COUNTY OF SAN MATEO REDWOOD CITY, CALIFORNIA AUDIT REPORT JUNE 30, 2015
 SEQUOIA UNION HIGH SCHOOL DISTRICT COUNTY OF SAN MATEO REDWOOD CITY, CALIFORNIA AUDIT REPORT JUNE 30, 2015 CHAVAN & ASSOCIATES, LLP CERTIFIED PUBLIC ACCOUNTANTS 1475 SARATOGA AVE., SUITE 180 SAN JOSE,
PALO ALTO UNIFIED SCHOOL DISTRICT ANNUAL FINANCIAL REPORT FOR THE YEAR ENDED JUNE 30, 2016
 PALO ALTO UNIFIED SCHOOL DISTRICT ANNUAL FINANCIAL REPORT FOR THE YEAR ENDED TABLE OF CONTENTS FINANCIAL SECTION Independent Auditor's Report 2 Management s Discussion and Analysis 5 Basic Financial Statements
NEVADA JOINT UNION HIGH SCHOOL DISTRICT Grass Valley, California. FINANCIAL STATEMENTS June 30, 2013
 Grass Valley, California FINANCIAL STATEMENTS June 30, 2013 FINANCIAL STATEMENTS WITH SUPPLEMENTARY INFORMATION For the Year Ended June 30, 2013 TABLE OF CONTENTS Page Independent Auditor's Report 1 Management's
CENTRAL UNION HIGH SCHOOL DISTRICT COUNTY OF IMPERIAL EL CENTRO, CALIFORNIA AUDIT REPORT (REVISED) JUNE 30, 2014
 JUNE 30, 2014") COUNTY OF IMPERIAL EL CENTRO, CALIFORNIA AUDIT REPORT (REVISED) JUNE 30, 2014 Wilkinson Hadley King & Co. LLP CPA's and Advisors 218 W. Douglas Ave. El Cajon, California Introductory Section Central Union
COUNTY OF IMPERIAL EL CENTRO, CALIFORNIA AUDIT REPORT (REVISED) JUNE 30, 2014 Wilkinson Hadley King & Co. LLP CPA's and Advisors 218 W. Douglas Ave. El Cajon, California Introductory Section Central Union
SAN LEANDRO UNIFIED SCHOOL DISTRICT ANNUAL FINANCIAL REPORT JUNE 30, 2016
 SAN LEANDRO UNIFIED SCHOOL DISTRICT ANNUAL FINANCIAL REPORT TABLE OF CONTENTS FINANCIAL SECTION Independent Auditor s Report 2 Management's Discussion and Analysis 5 Basic Financial Statements Government-Wide
ANNUAL FINANCIAL REPORT JUNE 30, 2015
 ANNUAL FINANCIAL REPORT TABLE OF CONTENTS FINANCIAL SECTION Independent Auditor's Report 2 Management's Discussion and Analysis 5 Basic Financial Statements Government-Wide Financial Statements Statement
WASHINGTON UNIFIED SCHOOL DISTRICT ANNUAL FINANCIAL REPORT JUNE 30, 2015
 ANNUAL FINANCIAL REPORT TABLE OF CONTENTS FINANCIAL SECTION Independent Auditor's Report 2 Management's Discussion and Analysis 5 Basic Financial Statements Government-Wide Financial Statements Statement
SEQUOIA UNION HIGH SCHOOL DISTRICT COUNTY OF SAN MATEO REDWOOD CITY, CALIFORNIA AUDIT REPORT JUNE 30, 2013
 SEQUOIA UNION HIGH SCHOOL DISTRICT COUNTY OF SAN MATEO REDWOOD CITY, CALIFORNIA AUDIT REPORT JUNE 30, 2013 CHAVAN &ASSOCIATES, LLP CERTIFIED PUBLIC ACCOUNTANTS 1475 SARATOGA AVE., SUITE 180 SAN JOSE, CA
SONOMA VALLEY UNIFIED SCHOOL DISTRICT COUNTY OF SONOMA SONOMA, CALIFORNIA AUDIT REPORT. June 30, 2016
 SONOMA VALLEY UNIFIED SCHOOL DISTRICT COUNTY OF SONOMA SONOMA, CALIFORNIA AUDIT REPORT June 30, 2016 CHAVAN & ASSOCIATES, LLP CERTIFIED PUBLIC ACCOUNTANTS 1475 SARATOGA AVE., SUITE 180 SAN JOSE, CA 95129
BURLINGAME SCHOOL DISTRICT COUNTY OF SAN MATEO REDWOOD CITY, CALIFORNIA AUDIT REPORT JUNE 30, 2017
 BURLINGAME SCHOOL DISTRICT COUNTY OF SAN MATEO REDWOOD CITY, CALIFORNIA AUDIT REPORT JUNE 30, 2017 CHAVAN & ASSOCIATES, LLP CERTIFIED PUBLIC ACCOUNTANTS 1475 SARATOGA AVE., SUITE 180 SAN JOSE, CA 95129
CENTRAL UNION HIGH SCHOOL DISTRICT COUNTY OF IMPERIAL EL CENTRO, CALIFORNIA AUDIT REPORT JUNE 30, 2016
 COUNTY OF IMPERIAL EL CENTRO, CALIFORNIA AUDIT REPORT JUNE 30, 2016 Wilkinson Hadley King & Co. LLP CPA's and Advisors 218 W. Douglas Ave. El Cajon, California Introductory Section Central Union High School
MONTEREY PENINSULA UNIFIED SCHOOL DISTRICT Monterey, California. FINANCIAL STATEMENTS June 30, 2014
 MONTEREY PENINSULA UNIFIED SCHOOL DISTRICT Monterey, California FINANCIAL STATEMENTS June 30, 2014 FINANCIAL STATEMENTS WITH SUPPLEMENTARY INFORMATION For the Year Ended June 30, 2014 TABLE OF CONTENTS
KENTFIELD SCHOOL DISTRICT COUNTY OF MARIN KENTFIELD, CALIFORNIA AUDIT REPORT JUNE 30, 2018
 COUNTY OF MARIN KENTFIELD, CALIFORNIA AUDIT REPORT JUNE 30, 2018 JUNE 30, 2018 TABLE OF CONTENTS FINANCIAL SECTION Page Independent Auditor's Report 1 Management s Discussion and Analysis (Unaudited)
CULVER CITY UNIFIED SCHOOL DISTRICT
 AUDIT REPORT JUNE 30, 2018 TABLE OF CONTENTS JUNE 30, 2018 FINANCIAL SECTION Independent Auditors Report... 1 Management s Discussion and Analysis... 4 Basic Financial Statements Government-wide Financial
GARVEY SCHOOL DISTRICT OF LOS ANGELES COUNTY ROSEMEAD, CALIFORNIA. AUDIT REPORT June 30, 2015
 OF LOS ANGELES COUNTY ROSEMEAD, CALIFORNIA AUDIT REPORT TABLE OF CONTENTS FINANCIAL SECTION Independent Auditor's Report 1 Management's Discussion and Analysis 3 Basic Financial Statements: Government-wide
MORENO VALLEY UNIFIED SCHOOL DISTRICT RIVERSIDE COUNTY MORENO VALLEY, CALIFORNIA
 RIVERSIDE COUNTY MORENO VALLEY, CALIFORNIA ANNUAL FINANCIAL STATEMENTS WITH REPORT OF INDEPENDENT CERTIFIED PUBLIC ACCOUNTANT JUNE 30, 2014 TABLE OF CONTENTS JUNE 30, 2014 PAGE INTRODUCTORY SECTION TABLE
BANNING UNIFIED SCHOOL DISTRICT ANNUAL FINANCIAL REPORT JUNE 30, 2016
 BANNING UNIFIED SCHOOL DISTRICT ANNUAL FINANCIAL REPORT TABLE OF CONTENTS FINANCIAL SECTION Independent Auditor's Report 2 Management's Discussion and Analysis 5 Basic Financial Statements Government-Wide
LONG BEACH UNIFIED SCHOOL DISTRICT LOS ANGELES COUNTY
 LOS ANGELES COUNTY REPORT ON AUDIT OF FINANCIAL STATEMENTS AND SUPPLEMENTARY INFORMATION INCLUDING REPORTS ON COMPLIANCE AUDIT REPORT CONTENTS Page INDEPENDENT AUDITOR'S REPORT MANAGEMENT S DISCUSSION
SANTA BARBARA UNIFIED SCHOOL DISTRICT ANNUAL FINANCIAL REPORT JUNE 30, 2013
 SANTA BARBARA UNIFIED SCHOOL DISTRICT ANNUAL FINANCIAL REPORT TABLE OF CONTENTS FINANCIAL SECTION Independent Auditors' Report 2 Management's Discussion and Analysis 5 Basic Financial Statements Government-Wide
LA MESA SPRING VALLEY SCHOOL DISTRICT AUDIT REPORT JUNE 30, 2016
 LA MESA SPRING VALLEY SCHOOL DISTRICT AUDIT REPORT JUNE 30, 2016 TABLE OF CONTENTS FOR THE YEAR ENDED JUNE 30, 2016 FINANCIAL SECTION Independent Auditors Report... 1 Management s Discussion and Analysis...
ANNUAL FINANCIAL REPORT JUNE 30, 2017
 ANNUAL FINANCIAL REPORT TABLE OF CONTENTS FINANCIAL SECTION Independent Auditor's Report 2 Management's Discussion and Analysis 5 Basic Financial Statements Government-Wide Financial Statements Statement
HORICON ELEMENTARY SCHOOL DISTRICT COUNTY OF SONOMA ANNAPOLIS, CALIFORNIA AUDIT REPORT JUNE 30, 2018
 COUNTY OF SONOMA ANNAPOLIS, CALIFORNIA AUDIT REPORT JUNE 30, 2018 JUNE 30, 2018 TABLE OF CONTENTS FINANCIAL SECTION Page Independent Auditor's Report 1 Management s Discussion and Analysis (Unaudited)
BAKERSFIELD CITY SCHOOL DISTRICT ANNUAL FINANCIAL REPORT JUNE 30, 2017
 ANNUAL FINANCIAL REPORT TABLE OF CONTENTS FINANCIAL SECTION Independent Auditor's Report 2 Management's Discussion and Analysis 5 Basic Financial Statements Government-Wide Financial Statements Statement
RIO BRAVO-GREELEY UNION SCHOOL DISTRICT KERN COUNTY BAKERSFIELD, CALIFORNIA JUNE 30, 2016
 KERN COUNTY BAKERSFIELD, CALIFORNIA JUNE 30, 2016 AUDIT REPORT PREPARED BY LINGER, PETERSON & SHRUM CERTIFIED PUBLIC ACCOUNTANTS Recieved 12/09/2016 This Page Is Intentionally Left Blank INTRODUCTORY SECTION
FILLMORE UNIFIED SCHOOL DISTRICT
 AUDIT REPORT JUNE 30, 2017 TABLE OF CONTENTS FOR THE YEAR ENDED JUNE 30, 2017 FINANCIAL SECTION Independent Auditors Report... 1 Management s Discussion and Analysis... 4 Basic Financial Statements Government
LOS GATOS UNION SCHOOL DISTRICT COUNTY OF SANTA CLARA LOS GATOS, CALIFORNIA AUDIT REPORT JUNE 30, 2014
 COUNTY OF SANTA CLARA LOS GATOS, CALIFORNIA AUDIT REPORT JUNE 30, 2014 JUNE 30, 2014 TABLE OF CONTENTS FINANCIAL SECTION Independent Auditor's Report Management's Discussion and Analysis (Unaudited) 1
ANNUAL FINANCIAL REPORT JUNE 30, 2017
 ANNUAL FINANCIAL REPORT TABLE OF CONTENTS FINANCIAL SECTION Independent Auditor's Report 2 Management's Discussion and Analysis 5 Basic Financial Statements Government-Wide Financial Statements Statement
WASHINGTON UNIFIED SCHOOL DISTRICT ANNUAL FINANCIAL REPORT JUNE 30, 2014
 ANNUAL FINANCIAL REPORT TABLE OF CONTENTS FINANCIAL SECTION Independent Auditor's Report 2 Management's Discussion and Analysis 5 Basic Financial Statements Government-Wide Financial Statements Statement
MARK TWAIN UNION ELEMENTARY SCHOOL DISTRICT ANNUAL FINANCIAL REPORT FOR THE YEAR ENDED JUNE 30, 2017
 MARK TWAIN UNION ELEMENTARY SCHOOL DISTRICT ANNUAL FINANCIAL REPORT FOR THE YEAR ENDED This page left blank intentionally. TABLE OF CONTENTS FOR THE YEAR ENDED FINANCIAL SECTION Independent Auditor s Report
MORONGO UNIFIED SCHOOL DISTRICT ANNUAL FINANCIAL REPORT JUNE 30, 2015
 ANNUAL FINANCIAL REPORT TABLE OF CONTENTS FINANCIAL SECTION Independent Auditor's Report 2 Management's Discussion and Analysis 5 Basic Financial Statements Government-Wide Financial Statements Statement
MARK TWAIN UNION ELEMENTARY SCHOOL DISTRICT ANNUAL FINANCIAL REPORT FOR THE YEAR ENDED JUNE 30, 2018
 MARK TWAIN UNION ELEMENTARY SCHOOL DISTRICT ANNUAL FINANCIAL REPORT FOR THE YEAR ENDED This page left blank intentionally. TABLE OF CONTENTS FOR THE YEAR ENDED FINANCIAL SECTION Independent Auditor's Report
DINUBA UNIFIED SCHOOL DISTRICT
 AUDIT REPORT JUNE 30, 2016 TABLE OF CONTENTS FOR THE YEAR ENDED JUNE 30, 2016 FINANCIAL SECTION Independent Auditors Report... 1 Management s Discussion and Analysis... 4 Basic Financial Statements Government
VENTURA UNIFIED SCHOOL DISTRICT VENTURA COUNTY
 VENTURA COUNTY REPORT ON AUDIT OF FINANCIAL STATEMENTS AND SUPPLEMENTARY INFORMATION INCLUDING REPORTS ON COMPLIANCE AUDIT REPORT CONTENTS Page INDEPENDENT AUDITOR S REPORT MANAGEMENT S DISCUSSION AND
WASHINGTON UNIFIED SCHOOL DISTRICT ANNUAL FINANCIAL REPORT JUNE 30, 2016
 ANNUAL FINANCIAL REPORT TABLE OF CONTENTS FINANCIAL SECTION Independent Auditor's Report 2 Management's Discussion and Analysis 5 Basic Financial Statements Government-Wide Financial Statements Statement
SOLEDAD UNIFIED SCHOOL DISTRICT ANNUAL FINANCIAL REPORT JUNE 30, 2015
 ANNUAL FINANCIAL REPORT TABLE OF CONTENTS FINANCIAL SECTION Independent Auditor's Report 2 Management's Discussion and Analysis 5 Basic Financial Statements Government-Wide Financial Statements Statement
MANHATTAN BEACH UNIFIED SCHOOL DISTRICT TABLE OF CONTENTS JUNE 30, 2010
 TABLE OF CONTENTS FINANCIAL SECTION Independent Auditors' Report 2 Management's Discussion and Analysis 4 Basic Financial Statements Government-Wide Financial Statements Statement of Net Assets 13 Statement
MANHATTAN BEACH UNIFIED SCHOOL DISTRICT ANNUAL FINANCIAL REPORT JUNE 30, 2016
 MANHATTAN BEACH UNIFIED SCHOOL DISTRICT ANNUAL FINANCIAL REPORT TABLE OF CONTENTS FINANCIAL SECTION Independent Auditor's Report 2 Management's Discussion and Analysis 5 Basic Financial Statements Government-Wide
MUROC JOINT UNIFIED SCHOOL DISTRICT KERN COUNTY NORTH EDWARDS, CALIFORNIA
 KERN COUNTY NORTH EDWARDS, CALIFORNIA ANNUAL FINANCIAL STATEMENTS WITH REPORT OF INDEPENDENT CERTIFIED PUBLIC ACCOUNTANT JUNE 30, 2018 TABLE OF CONTENTS JUNE 30, 2018 PAGE INTRODUCTORY SECTION TABLE OF
ESCALON UNIFIED SCHOOL DISTRICT OF SAN JOAQUIN COUNTY ESCALON, CALIFORNIA JUNE 30, 2016 GOVERNING BOARD MEMBER OFFICE TERM EXPIRES
 OF SAN JOAQUIN COUNTY ESCALON, CALIFORNIA JUNE 30, 2016 GOVERNING BOARD MEMBER OFFICE TERM EXPIRES Richard Thompson President 2018 Amy Bavaro Vice President 2016 Martha Coelho Clerk 2016 Kate Powell Member
MILLBRAE SCHOOL DISTRICT COUNTY OF SAN MATEO MILLBRAE, CALIFORNIA AUDIT REPORT. June 30, 2013
 MILLBRAE SCHOOL DISTRICT COUNTY OF SAN MATEO MILLBRAE, CALIFORNIA AUDIT REPORT June 30, 2013 CHAVAN &ASSOCIATES, LLP CERTIFIED PUBLIC ACCOUNTANTS 1475 SARATOGA AVE., SUITE 180 SAN JOSE, CA 95129 This Page
SOUTH PASADENA UNIFIED SCHOOL DISTRICT AUDIT REPORT JUNE 30, 2016
 SOUTH PASADENA UNIFIED SCHOOL DISTRICT AUDIT REPORT JUNE 30, 2016 12/14/2016 TABLE OF CONTENTS FOR THE YEAR ENDED JUNE 30, 2016 FINANCIAL SECTION Independent Auditors Report... 1 Management s Discussion
LOS ALAMITOS UNIFIED SCHOOL DISTRICT ANNUAL FINANCIAL REPORT JUNE 30, 2016
 LOS ALAMITOS UNIFIED SCHOOL DISTRICT ANNUAL FINANCIAL REPORT TABLE OF CONTENTS FINANCIAL SECTION Independent Auditor's Report 2 Management's Discussion and Analysis 5 Basic Financial Statements Government-Wide
MILLBRAE SCHOOL DISTRICT COUNTY OF SAN MATEO MILLBRAE, CALIFORNIA AUDIT REPORT. June 30, 2016
 MILLBRAE SCHOOL DISTRICT COUNTY OF SAN MATEO MILLBRAE, CALIFORNIA AUDIT REPORT June 30, 2016 CHAVAN & ASSOCIATES, LLP CERTIFIED PUBLIC ACCOUNTANTS 1475 SARATOGA AVE., SUITE 180 SAN JOSE, CA 95129 This
Trinity Alps Unified School District County of Trinity Weaverville, California
 County of Trinity Weaverville, California FINANCIAL STATEMENTS AND SUPPLEMENTARY INFORMATION WITH INDEPENDENT AUDITORS REPORTS June 30, 2017 TABLE OF CONTENTS June 30, 2017 Page Number Independent Auditors
CORONADO UNIFIED SCHOOL DISTRICT AUDIT REPORT JUNE 30, 2016
 AUDIT REPORT JUNE 30, 2016 TABLE OF CONTENTS FOR THE YEAR ENDED JUNE 30, 2016 FINANCIAL SECTION Independent Auditors Report... 1 Management s Discussion and Analysis... 4 Basic Financial Statements Government
WILLIAM S. HART UNION HIGH SCHOOL DISTRICT ANNUAL FINANCIAL REPORT JUNE 30, 2017
 WILLIAM S. HART UNION HIGH SCHOOL DISTRICT ANNUAL FINANCIAL REPORT JUNE 30, 2017 TABLE OF CONTENTS JUNE 30, 2017 FINANCIAL SECTION Independent Auditor's Report 2 Management's Discussion and Analysis 5
POINT ARENA SCHOOLS AUDIT REPORT JUNE 30, 2018
 AUDIT REPORT JUNE 30, 2018 TABLE OF CONTENTS JUNE 30, 2018 FINANCIAL SECTION Independent Auditors Report... 1 Management s Discussion and Analysis... 4 Basic Financial Statements Government-wide Financial
CITY SCHOOL DISTRICT OF THE CITY OF ALBANY. Financial Statements and Required Reports Under OMB Circular A-133 as of June 30, 2015
 CITY SCHOOL DISTRICT OF THE CITY OF ALBANY Financial Statements and Required Reports Under OMB Circular A-133 as of June 30, 2015 CONTENTS Page INDEPENDENT AUDITOR S REPORT. 1-2 MANAGEMENT S DISCUSSION
CERES UNIFIED SCHOOL DISTRICT ANNUAL FINANCIAL REPORT JUNE 30, 2014
 Vavrinek, Trine, Day & Co., LLP Certified Public Accountants VALUE THE DIFFERENCE December 14, 2014 State Controller's Office Division of Audits Financial Audits Bureau - Education Oversight Unit Via PDF
ANNUAL FINANCIAL REPORT JUNE 30, 2018
 ANNUAL FINANCIAL REPORT TABLE OF CONTENTS FINANCIAL SECTION Independent Auditor's Report 2 Management's Discussion and Analysis 5 Basic Financial Statements Government-Wide Financial Statements Statement
LAKESIDE UNION SCHOOL DISTRICT COUNTY OF SAN DIEGO LAKESIDE, CALIFORNIA AUDIT REPORT JUNE 30, 2016
 COUNTY OF SAN DIEGO LAKESIDE, CALIFORNIA AUDIT REPORT JUNE 30, 2016 Wilkinson Hadley King & Co. LLP CPA's and Advisors 218 W. Douglas Ave. El Cajon, California Introductory Section Lakeside Union School
FORT ROSS ELEMENTARY SCHOOL DISTRICT COUNTY OF SONOMA CAZADERO, CALIFORNIA AUDIT REPORT JUNE 30, 2014
 COUNTY OF SONOMA CAZADERO, CALIFORNIA AUDIT REPORT JUNE 30, 2014 Received by MLaMar December 10, 2014 JUNE 30, 2014 TABLE OF CONTENTS FINANCIAL SECTION Page Independent Auditor's Report 1 Management s
LOS ALAMITOS UNIFIED SCHOOL DISTRICT ANNUAL FINANCIAL REPORT JUNE 30, 2015
 LOS ALAMITOS UNIFIED SCHOOL DISTRICT ANNUAL FINANCIAL REPORT TABLE OF CONTENTS FINANCIAL SECTION Independent Auditor's Report 2 Management's Discussion and Analysis 5 Basic Financial Statements Government-Wide
SAN MARINO UNIFIED SCHOOL DISTRICT LOS ANGELES COUNTY
 LOS ANGELES COUNTY REPORT ON AUDIT OF FINANCIAL STATEMENTS AND SUPPLEMENTARY INFORMATION INCLUDING REPORTS ON COMPLIANCE Received by MLaMar December 15, 2014 AUDIT REPORT CONTENTS Page INDEPENDENT AUDITOR'S