Annual Financial Report Fiscal Year 2016
|
|
|
- Morgan Washington
- 5 years ago
- Views:
Transcription


1 Annual Financial Report Fiscal Year 2016 Comprehensive Annual Financial Report for the Fiscal Year Ended September 30, 2016 of the Jacksonville, Florida flyjacksonville.com Jacksonville International Airport Cecil Airport Jacksonville Executive at Craig Airport Herlong Recreational Airport
2 Jacksonville, Florida COMPREHENSIVE ANNUAL FINANCIAL REPORT FOR THE FISCAL YEARS ENDED SEPTEMBER 30, 2016 AND SEPTEMBER 30, 2015 PREPARED BY: FINANCE DIVISION RICHARD A. ROSSI CHIEF FINANCIAL OFFICER ROSS JONES DIRECTOR OF FINANCE
3 September 30, 2016 TABLE OF CONTENTS INTRODUCTORY SECTION (UNAUDITED) Letter of Transmittal...i-iii Board of Directors and Executive Staff...iv Certificate of Achievement for Excellence in Financial Reporting...v Organizational Chart...vi FINANCIAL SECTION Report of Independent Certified Public Accountant Management's Discussion and Analysis (unaudited) Financial Statements: Summary Statements of Net Position Statements of Revenues, Expenses, and Changes in Net Position...20 Statement of Cash Flows Notes to Financial Statements REQUIRED SUPPLEMENTARY INFORMATION (UNAUDITED) Schedule of Funding Progress...79 Schedule of the Authority's Proportionate Share of the Net Pension Liability Florida Retirement System Pension Plan...80 Schedule of Authority's Contributions Florida Retirement System Pension Plan...81 Schedule of Authority's Proportionate Share of the Net Pension Liability Health Insurance Subsidy Pension Plan...82 Schedule of Authority's Contributions - Health Insurance Subsidy Pension Plan...83 STATISTICAL SECTION (UNAUDITED) Objectives of the Statistical Section...84 FINANCIAL TRENDS INFORMATION Changes in Cash and Cash Equivalents Principal Operating Revenues, Airline Rates and Charges and Cost Per Enplaned Passenger
4 September 30, 2016 TABLE OF CONTENTS (CONTINUED) STATISTICAL-REVENUE CAPACITY INFORMATION Total Revenues, Expenses, and Changes in Net Position Principal Revenues Payers STATISTICAL-DEBT CAPACITY INFORMATION Ratio of Annual Bond Debt Service to Total Expenses Excluding Depreciation...94 Debt Service Coverage Bond Tables Outstanding Debt by Type STATISTICAL-DEMOGRAPHIC AND ECONOMIC INFORMATION Top 10 Employers of Jacksonville Demographic and Economic Statistics STATISTICAL-OPERATING INFORMATION Enplanements Landed Weights Number of Employees Aircraft Operations Airlines Serving Jacksonville International Airport Primary Origination and Destination Passenger Markets Airport Capital Asset Information
5 This page intentionally left blank
6 Introductory Introductory Annual Financial Report Fiscal Year 2016 Jacksonville International Airport Cecil Airport Jacksonville Executive at Craig Airport Herlong Recreational Airport
7 April 29, 2017 To the Board of Directors of the : We present the Annual Financial Report of the (the Authority) for the fiscal year ended September 30, The Finance Department prepared this report. Responsibility for both the accuracy of the presented data and completeness and fairness of the presentation, including all disclosures, rest with the Authority. To the best of our knowledge and belief, this report fairly presents and fully discloses the Authority s financial position, changes in financial position, and cash flows in accordance with accounting principles generally accepted in the United States of America. Please refer to the Management Discussion and Analysis (MD&A) for additional information of the financial position of the Authority. Reporting Entity and Its Services The Authority, a public body corporate and politic, was established by the State of Florida on June 5, 2001, to own and operate aviation facilities in Duval County, Florida. A seven member Board of Directors presently governs the Authority. The Board of Directors establishes Authority policy and appoints a Chief Executive Officer to implement it. The Board of Directors annually elects a Chairman, Vice-Chairman, Secretary, and Treasurer. Directors serve a four year term. Directors may serve a maximum of two successive terms. Directors serve as volunteers and do not receive a salary or any other compensation for their services. The Board of Directors appoints the Chief Executive Officer who serves at its pleasure. Steven Grossman, Chief Executive Officer of the Authority, plans and directs all the programs and activities of the Authority, focusing on the future and the development of long-term business strategies. The Authority airport system consists of Jacksonville International Airport, Jacksonville Executive at Craig Airport, Herlong Recreational Airport, and Cecil Airport. Economic Condition and Outlook Situated in the corner of Northeast Florida, Jacksonville is considered the metropolitan market for over ten Florida and South Georgia counties. The City of Jacksonville is the hub of an array of services that include an international airport, three general aviation airports, a deep-water port, travel and tourism, recreational and sports activities, medical and health, higher education and cultural amenities. With a Metropolitan Statistical Area (MSA) population of over one million, Jacksonville is on the verge of being classified as a i
8 first-tier city. The Jacksonville MSA consists of Baker, Clay, Duval, Nassau, Putnam, and St. Johns Counties. The strength of Jacksonville s economy lies in its uniquely diversified structure, not heavily dependent on any one major employer or employment sector. The community enjoys a natural location for distribution and warehousing activities. Quality lifestyle, labor force, and cultural/educational/medical facilities are considered key resources in the market s ability to sustain future growth. Long-term Financial Planning The Authority maintains a five year financial planning horizon. The controlling documents are a five year plan of operating and capital. The Authority is maintaining, at a minimum, over nine months of operating cash on hand to guard against significant economic downturn. In an effort to provide revenue diversification the Authority is currently pursuing various options in real estate development and sources of non-aviation revenue. In regards to the Authority s long-term debt obligations, the Authority had revenue notes of $ million outstanding as of September 30, Since the Authority no longer has any revenue bonds, no bond service coverage ratio is required. Accounting Systems The management of the Authority is responsible for establishing and maintaining internal control designed to ensure that the assets of the Authority are safeguarded. In addition, as a recipient of federal financial assistance, the Authority is responsible for ensuring that adequate internal control is in place to ensure compliance with laws and regulations related to the Airport Improvement Program (AIP) and the Aviation Safety and Capacity Expansion Act. The objectives of internal control are to provide management with reasonable assurance that the resources are safeguarded against waste, loss and misuse, and reliable data are recorded, maintained and fairly disclosed in reports. The current internal controls provide the Authority with a solid base of reliable financial records from which financial statements are prepared. These accounting controls provide reasonable assurance that accounting data is reliable and available to facilitate the preparation of financial statements on a timely basis. Inherent limitations should be recognized in considering the potential effectiveness of any system of internal control. The concept of reasonable assurance is based on the recognition that the cost of a system of internal control should not exceed the benefits derived and that the evaluation of those factors requires judgment by management. The Authority s financial statements are prepared in accordance with accounting principles generally accepted in the United States of America, using the accrual basis of accounting. The Authority is a local government proprietary fund, and therefore the activities are reported in conformity with governmental accounting and financial reporting principles issued by the Governmental Accounting Standards Board (GASB). ii
9 Budgetary Control The Authority s annual budget is a financial planning tool outlining the estimated revenues and expenses for the Authority. Prior to July 1 of each year, the Authority prepares and submits its budget to the City Council of the City of Jacksonville for the ensuing fiscal year. Budgetary control and evaluation are affected by comparing actual interim and annual results with budget. The Authority conducts periodic reviews to ensure compliance with the provisions of the annual operating budget approved by the Board of Directors and the City Council of the City of Jacksonville. Certain assumptions are made in determining the annual budget and accordingly subsequent results could differ substantially from those projected. In keeping with the requirements of a proprietary fund, budgetary comparisons have not been included in the financial section of this report; however, a narrative on the budget is included in the Notes to the Financial Statements. Independent Audit A firm of independent certified public accountants is retained each year to conduct an audit of the financial statements of the Authority in accordance with auditing standards generally accepted in the United States and to meet the requirements of the Federal Single Audit Act of 1984, as amended. The Authority selected the firm of RSM US, LLP to perform these services. Their opinion is presented with this report. The reports required under the Single Audit Act are presented under separate cover. Each year, the independent certified public accountants meet with the Audit and Finance Committee of the Board of Directors to review the results of the audit. Acknowledgements The publication of this annual financial report is the culmination of a year of hard work by the Authority s Finance Department. I appreciate the commitment, effort, and perseverance of the Finance Department staff in the preparation of this report and for our annual accomplishments. I also thank the Chief Executive Officer, Senior Management, and the Board of Directors for their leadership and support in planning and conducting the financial operations of the Authority in a responsible and progressive manner. Respectfully submitted, Richard A. Rossi Chief Financial Officer iii
10 Jacksonville, Florida Board of Directors Patrick Kilbane...Chairman Giselle Carson...Vice Chairman Jay Demetree...Secretary Russell Thomas...Treasurer Ray Alfred...Member Teresa H. Davlantes...Member Frank Mackesy...Member Senior Staff Steve Grossman...Chief Executive Officer Tony Cugno...Chief Operating Officer Richard A. Rossi...Chief Financial Officer Rosa Beckett...Chief Administrative Officer Rusty Chandler...Chief Cecil Airport and General Aviation Debra Braga...Chief Legal Officer iv
11 v
12 Organizational Chart Board of Directors %JKGH'ZGEWVKXG1HƂEGT (Steve Grossman) Chief Cecil Airport And General Aviation Chief Financial 1HƂEGT Chief Legal 1HƂEGT Chief Administrative 1HƂEGT Chief Operating 1HƂEGT Director External Affairs Director Marketing (Rusty Chandler) (Richard Rossi) (Debra Braga) (Rosa Beckett) (Tony Cugno) (Michael Stewart) (Barbara Halverstadt) -Cecil Airport -Jacksonville Executive at Craig Airport -Herlong Recreational Airport -Budget -Finance -Business Development -Human Resources -Procurement -Information Technology -Public Safety and Security -Planning and Engineering -Operations -Facilities -Government Affairs -Media Relations -Public Relations -Air Service Development -Social Media -Marketing and Promotion vi
13 Independent Auditor s Report The Board of Directors Jacksonville, Florida Report on the Financial Statements We have audited the accompanying financial statements of (the Authority), as of and for the years ended September 30, 2016 and 2015, and the related notes to the financial statements, which collectively comprise the Authority s basic financial statements as listed in the table of contents. Management s Responsibility for the Financial Statements Management is responsible for the preparation and fair presentation of these financial statements in accordance with accounting principles generally accepted in the United States of America; this includes the design, implementation and maintenance of internal control relevant to the preparation and fair presentation of financial statements that are free from material misstatement, whether due to fraud or error. Auditor s Responsibility Our responsibility is to express an opinion on these financial statements based on our audit. We conducted our audit in accordance with auditing standards generally accepted in the United States of America and the standards applicable to financial audits contained in Government Auditing Standards, issued by the Comptroller General of the United States. Those standards require that we plan and perform the audit to obtain reasonable assurance about whether the financial statements are free from material misstatement. An audit involves performing procedures to obtain audit evidence about the amounts and disclosures in the financial statements. The procedures selected depend on the auditor s judgment, including the assessment of the risks of material misstatement of the financial statements, whether due to fraud or error. In making those risk assessments, the auditor considers internal control relevant to the entity s preparation and fair presentation of the financial statements in order to design audit procedures that are appropriate in the circumstances, but not for the purpose of expressing an opinion on the effectiveness of the entity s internal control. Accordingly, we express no such opinion. An audit also includes evaluating the appropriateness of accounting policies used and the reasonableness of significant accounting estimates made by management, as well as evaluating the overall presentation of the financial statements. We believe that the audit evidence we have obtained is sufficient and appropriate to provide a basis for our audit opinion. 1
14 Opinion In our opinion, the financial statements referred to above present fairly, in all material respects, the financial position of the Authority, as of September 30, 2016 and 2015, and the change in financial position and, cash flows thereof for the years then ended in accordance with accounting principles generally accepted in the United States of America. Other Matters Required Supplementary Information Accounting principles generally accepted in the United States of America require that the management s discussion and analysis (MD&A), the schedule of funding progress other post-employment benefits plan, the schedules of the Authority proportionate share of the net pension liability for FRS and HIS, and the schedules of Authority contributions for FRS and HIS be presented to supplement the basic financial statements. Such information, although not a part of the basic financial statements, is required by the Governmental Accounting Standards Board who considers it to be an essential part of financial reporting for placing the basic financial statements in an appropriate operational, economic, or historical context. We have applied certain limited procedures to the required supplementary information in accordance with auditing standards generally accepted in the United States of America, which consisted of inquiries of management about the methods of preparing the information and comparing the information for consistency with management s responses to our inquiries, the basic financial statements, and other knowledge we obtained during our audit of the basic financial statements. We do not express an opinion or provide any assurance on the information because the limited procedures do not provide us with sufficient evidence to express an opinion or provide any assurance. Other Information Our audit was conducted for the purpose of forming an opinion on the financial statements that collectively comprise the Authority s basic financial statements. The introductory and statistical sections are presented for purposes of additional analysis and are not a required part of the basic financial statements. The introductory and statistical sections have not been subjected to the auditing procedures applied in the audit of the basic financial statements, and accordingly, we do not express an opinion or provide any assurance on them. Other Reporting Required by Government Auditing Standards In accordance with Government Auditing Standards, we have also issued, under separate cover, our report dated April 29, 2017 on our consideration of the Authority s internal control over financial reporting and on our tests of its compliance with certain provisions of laws, regulations, contracts, and grant agreements and other matters. The purpose of that report is to describe the scope of our testing of internal control over financial reporting and compliance and the results of that testing, and not to provide an opinion on the internal control over financial reporting or on compliance. That report is an integral part of an audit performed in accordance with Government Auditing Standards in considering the Authority s internal control over financial reporting and compliance. Jacksonville, Florida April 29,
15 Management's Discussion and Analysis September 30, 2016 and 2015 Introduction The following discussion and analysis of the financial performance and activity of the Jacksonville Aviation Authority "the Authority" is meant to provide an introduction to and understanding of the Authority s basic financial statements for fiscal years ended September 30, 2016 and The discussion has been prepared by management and is unaudited and should be read in conjunction with the financial statements and associated notes thereto, which follow this section. The Authority is a body corporate and politic, established by the state of Florida on June 5, 2001, pursuant to the provisions of Chapter of the Laws of Florida, to own and operate aviation facilities in Duval County, Florida. Prior to October 1, 2001, the Authority operated as a division of the Jacksonville Port Authority. Pursuant to the provisions of Chapter of the Laws of Florida, the Authority changed its name from Jacksonville Airport Authority to effective June 10, The Authority consists of a seven member board, four members appointed by the Governor of the State of Florida and confirmed by the State Senate, and three members appointed by the Mayor of the City of Jacksonville and confirmed by the City Council of the City of Jacksonville. The Authority operates an airport system that consists of four airports: Jacksonville International Airport (JIA), Jacksonville Executive at Craig Airport, Herlong Recreational Airport and Cecil Airport. The organization consists of approximately 274 full-time employees in a structure that includes administration, airport management and operations, and police. The Authority is self-supporting, using aircraft landing fees, fees from terminal and other rentals, and revenues from concessions to fund operating expenses. The Authority is not taxpayer funded. The capital construction program is funded by debt issued by the Authority, federal and state grants, passenger facility charges (PFCs) and Authority revenues. The accompanying financial statements present the financial position of the Authority only. The Authority does not have any component units and is not involved in any joint ventures. 3
16 Using the Financial Statements The Authority s financial report includes three financial statements: the statements of net position, the statements of revenues, expenses and changes in net position and the statements of cash flows. The financial statements are prepared in accordance with accounting principles generally accepted in the United States of America as promulgated by the Government Accounting Standards Board (GASB). The Authority is structured as a single enterprise fund with revenues recognized when earned and expenses recognized when incurred. Capital asset related costs are capitalized and are depreciated (except land and construction in progress) over their estimated useful lives. Certain components of net position are restricted for debt service and, where applicable, for construction activities. The statements of net position each present the Authority s financial position as of one point in time, September 30, 2016 and 2015, and include all assets and deferred outflows of resources and liabilities and deferred inflows of resources of the Authority. The statements of net position demonstrate that the Authority s assets and deferred outflows of resources equal liabilities and deferred inflows of resources plus net position. Net position represents the residual interest in the Authority s assets and deferred outflows of resources after liabilities and deferred inflows of resources are deducted. Net position is displayed in three components: invested in capital assets, restricted, and unrestricted. The statements of revenues, expenses, and changes in net position report total operating revenues, operating expenses, non-operating revenues and expenses, and other changes in net position. Revenues and expenses are categorized as either operating or non-operating based upon management s policy as established and disclosed in the notes to the financial statements. Significant recurring sources of the Authority s revenues, including PFC s, investment income and federal, state and local grants, are reported as non-operating revenues. The Authority s interest expense is reported as non-operating expense. The statements of cash flows present information about how the Authority s cash and cash equivalents position changed during the fiscal years. The statements of cash flows classify cash receipts and cash payments as resulting from operating activities, financing activities and investing activities. Authority s Activity Highlights The demand for air transportation is, to a large degree, dependent upon the demographic and economic characteristics of an airport s air trade area (i.e., the geographical area served by an airport). This relationship is particularly true for origin-destination (O&D) passenger traffic, which has been the primary component of demand at JIA. The major portion of demand for air travel at the JIA is largely influenced more by the local characteristics of the area served than by individual air carrier decisions regarding hub and service patterns in support of connecting activity. JIA is classified by the Federal Aviation Administration (FAA) as a medium hub facility based on its percentage of nationwide enplanements. Passenger enplanements at JIA for the fiscal year ended September 30, 2016 totaled 2.80 million, an increase of 2.85% from the prior fiscal year. The increase is a result of an improving economy. In fiscal year 2015, JIA had enplanements of 2.72 million, an increase of 4.58% from fiscal year
17 Authority s Activity Highlights (continued) Landed weight totaled 3.54 million for fiscal year 2016, an decrease of 0.03% from the prior year. In fiscal year 2015, JIA had landed weight of 3.54 million, an increase of 1.35% from fiscal year As in 2015, Delta Airlines and American Airlines dominated 2016 in enplanements activity and landed weight. Southwest, JetBlue and United, comprise the remainder of the signatory airlines serving JIA and generated the majority of the enplanements. Passengers, enplanements and landed weights for the fiscal years ending September 30, were as follows: Total passengers 5,585,523 5,425,988 5,191,718 % (decrease) increase 2.94 % 4.51 % 1.28 % Enplanements 2,799,587 2,722,032 2,602,821 % (decrease) increase 2.85 % 4.58 % 1.53 % Landed weight 3,543,794 3,544,733 3,497,573 % (decrease) increase (0.03)% 1.35 % (2.65)% For fiscal year 2016, the Jacksonville International Airport average daily air carrier departures were 86 compared to 81 and 90 departures in 2015 and 2014, respectively. Financial Highlights The Authority s assets and deferred outflows exceeded liabilities and deferred inflows of resources for fiscal year 2016 by approximately $ million compared to $ million and $ million in fiscal years 2015 and 2014, respectively. Unrestricted net position as of the end of fiscal years 2016, 2015 and 2014 was approximately $49.65 million, $41.00 million and $37.75 million, respectively. The Authority may use these funds for any lawful purpose. The overall financial position of the Authority has increased as indicated by this fiscal year s increase in total net position. The improving trend for fiscal years 2016 and 2015 is due primarily to earnings from increased passenger activity and concession revenues. The Authority s total debt decreased by $35.14 million and $12.77 million in fiscal years 2016 and 2015, respectively. During fiscal year 2016, the Authority made normal scheduled debt service payments of $11.10 million. During fiscal year 2015, the Authority made normal scheduled debt service payments of $12.77 million. 5
18 Operating Revenues In fiscal year 2016 operating revenues increased by 6.43% from The primary factor was an increase in Fees & charges of 8.82% due to an increase in landing fees. In fiscal year 2015 operating revenues increased by 9.52% from The primary factor was an increase in Space & facility rentals of 13.14% due to space rented. Operating Expenses In fiscal year 2016 operating expenses before depreciation and amortization increased by 6.23% over Wages and benefits increased 17.37% due to increased headcount and pension expense. In fiscal year 2015 operating expenses before depreciation and amortization increased by 6.85% over Promotions, advertising & dues increased 46.71% due to increased marketing airline incentives. Operating Margin In fiscal year 2016 the operating margin increased 0.12% from 36.04% in 2015 to 36.16% in The primary reason for the increase was that revenue growth outpaced increases in expense. In fiscal year 2015 the operating margin increased 1.60% from 34.44% in 2014 to 36.04% in Non-operating Revenues Non-operating revenues in fiscal year 2016 increased 12.49% from This was result of an increase in the fair value of investments. Non-operating revenues in fiscal year 2015 increased 6.48% from This was result of an increase in Passenger Facility Revenue due to increased enplanements. Non-operating Expenses Non-operating expenses decreased by 11.83% and 25.16% in fiscal years 2016 and 2015, respectively. This was a result of reduction in interest expense. Capital Contributions Capital contributions increased in fiscal year 2016 by 31.68% and increased in fiscal year 2015 by 17.65%. These fluctuations are influenced by factors such as grant availability and project timing. Summary Statement of Net Position The summary statement of net position presents the financial position of the Authority at the end of each fiscal year. The summary statement of net position includes all assets and deferred outflows of resources, liabilities and deferred inflow of resources, and net position of the Authority. Financial position is the difference between total assets and deferred outflows of resources and liabilities and deferred inflows of resources and are an indicator of the current fiscal health of the Authority. 6
19 Summary Statement of Net Position (dollar amounts in thousands) Increase/ (Decrease) from 2015 % Increase/ (Decrease) from 2015 Assets Current $ 81,960 $ 89,380 $ (7,420) (8.30)% Noncurrent (restricted/other) 19,041 23,143 (4,102) (17.72) Capital assets, net 543, ,668 2, Total Assets 644, ,191 (9,245) (1.41) Deferred outflow of resources 16,349 11,304 5, % Liabilities Current 22,823 26,356 (3,533) (13.40)% Current - Restricted 9,575 13,808 (4,233) (30.66) Long-term 118, ,509 (24,901) (17.35) Total liabilities 151, ,673 (32,667) (17.79) Deferred inflow of resources 3,942 4,505 (563) (12.50)% Net Position Net investment in capital assets 441, ,670 36, % Restricted 15,693 31,646 (15,953) (50.41) Unrestricted 49,654 41,001 8, Total net position $ 506,347 $ 477,317 $ 29, Working capital Current assets $ 81,960 $ 89,380 $ (7,420) (8.30)% Current liabilities (32,398) (40,164) 7,766 (19.34) Working capital $ 49,562 $ 49,216 $ Current ratio During 2016 total assets decreased by 1.41%, deferred outflow of resources increased by 44.63%, total liabilities decreased by 17.79%, and total deferred inflow of resources decreased by 12.50% These changes resulted in an increase in net position of 6.08%. 7
20 Summary Statement of Net Position (continued) (dollar amounts in thousands) Increase/ (Decrease) from 2014 % Increase/ (Decrease) from 2014 Assets Current $ 89,380 $ 83,106 $ 6, % Noncurrent (restricted/other) 23,143 22, Capital assets, net 541, , Total Assets 654, ,441 7, Deferred outflow of resources 11,304 7,867 3, % Liabilities Current 26,356 28,161 (1,805) (6.41)% Current - Restricted 13,808 13, Long-term 143, ,033 (8,524) (5.61) Total liabilities 183, ,863 (10,190) (5.26) Deferred inflow of resources 4,505 5,705 (1,200) (21.03)% Net Position Net investment in capital assets 404, ,557 18, % Restricted 31,646 30,436 1, Unrestricted 41,001 37,750 3, Total net position $ 477,317 $ 454,743 $ 22, Working capital Current assets $ 89,380 $ 83,106 $ 6, % Current liabilities (40,164) (41,830) 1,666 (3.98) Working capital $ 49,216 $ 41,276 $ 7, Current ratio During 2015 total assets increased by 1.20%, deferred outflow of resources increased by 43.69%, total liabilities decreased by 5.26% and deferred inflow of resources decreased by 21.03%. These changes resulted in an increase in net position of 4.96%. 8
21 Signatory Airline Rates and Charges The Authority entered into a new airline use and lease agreement (the agreement) effective October 1, This is a five year agreement that terminates on September 30, Airlines that have entered into the agreement are considered signatory airlines. The signatory airlines are responsible for their affiliates. The affiliates claimed by the signatory airlines receive the signatory rate. All other airlines will be assessed at 125 percent of the signatory rates. In the agreement the terminal and airfield are residual. Under the residual method the Airlines agree to pay the cost of running the terminal and airfield that are not allocated to other airport users or covered by nonairline sources of revenue. The cost less the revenue associated with the terminal is divided by the airline terminal leased square footage to determine the average rental rate. The residual method guarantees the Authority will break even on the airfield and terminal cost centers. The agreement with the signatory airlines was hybrid in nature, with a residual rate-making methodology for the airfield and a compensatory methodology for the terminal. The Authority also had the ability under the agreement to adjust airlines rates and charges at any time throughout the year to ensure adherence to all financial covenants in its bond resolutions. No such adjustments were made during fiscal years 2016, 2015, and The rates and charges for the signatory airlines at September 30 were as follows: Landing fees (per 1,000 lbs. MGLW) $ 3.15 $ 2.87 $ 2.80 Average terminal rental rate (per square foot) Conditioned space (per square foot) Unconditioned space (per square foot) Note: 2016 rates are estimates 9
22 Operating Revenues and Expenses The following charts and tables show the major sources and the percentage of operating revenues and expenses for fiscal years 2016, 2015 and (dollar amounts in thousands) Operating revenues: Concessions $ 17,771 $ 16,933 $ 15,504 Fees & charges 14,668 13,479 12,189 Space & facility rentals 26,705 24,608 21,751 Parking 18,993 18,191 17,257 Other revenue 1,688 1,794 1,783 Total operating revenues 79,825 75,005 68,484 Operating expenses: Wage & benefits 25,328 21,579 19,613 Services & supplies 14,581 14,537 14,208 Repairs & maintenance 2,607 2,097 2,209 Promotions, advertising & dues 1,052 2,453 1,672 Registration & travel Utilities & taxes 4,855 5,116 5,223 Other operating expenses 2,151 1,877 1,682 Depreciation & amortization 31,346 28,575 28,951 Total operating expenses 82,306 76,547 73,847 Operating loss (2,481) (1,542) (5,363) Nonoperating revenues: Passenger facility charges 10,983 10,955 10,554 Investment income 1, Payments from federal & state agencies Other revenues 1, Total nonoperating revenues 14,139 12,569 11,804 Nonoperating expenses: Interest expense 3,946 4,775 5,071 Other expenses ,582 Total nonoperating expenses 4,390 4,979 6,653 Income (loss) before capital contributions 7,268 6,048 (211) Capital contributions 21,762 16,526 14,047 Change in net position 29,030 22,574 13,835 Net position, beginning of year 477, , ,907 Net position, end of year $ 506,347 $ 477,317 $ 454,743 *The beginning balance as of October 1, 2014 has been adjusted to reflect the adoption of GASB Statements No. 68 and

23 Operating Revenues Operating revenue increased by 6.43% and 9.52% in fiscal years 2016 and 2015, respectively. Refer to the changes in net position section of this MD&A for additional information related to operating revenues. 11

24 12
25 Operating Revenues by Major Classification (dollar amounts in thousands) Increase/ (Decrease) from 2015 % Increase/ (Decrease) from 2015 Concessions $ 17,771 $ 16,933 $ % Fees & charges 14,668 13,479 1, Space & facility rentals 26,705 24,608 2, Parking 18,993 18, Other revenue 1,688 1,794 (106) (5.91) Total operating revenues $ 79,825 $ 75,005 $ 4, % (dollar amounts in thousands) Increase/ (Decrease) from 2014 % Increase/ (Decrease) from 2014 Concessions $ 16,933 $ 15,504 $ 1, % Fees & charges 13,479 12,189 1, Space & facility rentals 24,608 21,751 2, Parking 18,191 17, Other revenue 1,794 1, Total operating revenues $ 75,005 $ 68,484 $ 6, % 13

26 Operating Expenses Operating expenses, before depreciation and amortization, increased 6.23% and 6.85% in fiscal years 2016 and 2015, respectively. Refer to the changes in net positions section of this MD&A for additional information related to operating expenses. 14

27 15
28 Operating Expense by Major Classification (dollar amounts in thousands) Increase/ (Decrease) from 2015 % Increase/ (Decrease) from 2015 Wages & benefits $ 25,328 $ 21,579 $ 3, % Services & supplies 14,581 14, Repairs & maintenance 2,607 2, Promotions, advertising & dues 1,052 2,453 (1,401) (57.11) Registration & travel Utilities & taxes 4,855 5,116 (261) (5.10) Other operating expenses 2,151 1, Total operating expenses $ 50,960 $ 47,972 $ 2, % (dollar amounts in thousands) Increase/ (Decrease) * from 2014 % Increase/ (Decrease) from 2014 Wages & benefits $ 21,579 $ 19,613 $ 1, % Services & supplies 14,537 14, Repairs & maintenance 2,097 2,209 (112) (5.07) Promotions, advertising & dues 2,453 1, Registration & travel Utilities & taxes 5,116 5,223 (107) (2.05) Other operating expenses 1,877 1, Total operating expenses $ 47,972 $ 44,896 $ 3, % *Amounts in 2014 column have been restated for effects of implementation of GASB Statements No. 68 and 71. Debt Activity The Authority issued new debt in fiscal year 2016 of $26.50 million. In 2016, normal debt service payments reduced the overall debt by $35.14 million. Additional payments were made in the amount of $2.00 million. In July 2016, the Authority defeased the remaining portion of the 2006 airport revenue bond in the amount of $47.62 million. In 2015, the debt service payments reduced the overall debt by $12.77 million. Refer to note 10 for a more detailed explanation of long-term debt activity. Debt Service Coverage Debt service coverage is a covenant of the bond resolutions requiring that a surplus of funds be available in the amount of 125% of principal and interest due in the subsequent year. In years in which the Authority held revenue bonds we presented our coverage ratio as an indication to bond holders that adequate funds were available for timely debt service. Since the Authority no longer holds any revenue 16
29 bonds no debt service coverage ratio is required for Historically, the Authority has maintained a coverage ratio in excess of its requirement. The actual debt service coverage ratio for the fiscal years 2015 and 2014 was 2.10 and 2.84, respectively. Cash and Investment Management The Authority s cash and cash equivalents decreased $3.52 million for fiscal year 2016 over Cash and cash equivalents, unrestricted, decreased by $2.55 million and restricted cash and cash equivalents decreased by $0.97 million. The Authority s cash and cash equivalents increased $2.37 million for fiscal year 2015 over Cash and cash equivalents, unrestricted, increased by $1.12 million and restricted cash and cash equivalents increased by $1.25 million. Capital Construction During 2016, the Authority expended approximately $32.50 million on capital activities. Major projects in 2016 include the HBS rehab and upgrade and the taxiway G and taxi lane G1 and apron reconstruction. During 2015, the Authority expended approximately $34.35 million on capital activities. Major projects in 2015 include the design and construction of Hangar 935 and the construction of a taxiway at Cecil Airport. Average monthly capital construction spending was $2.71 million, $2.86 million and $2.42 million for fiscal years 2016, 2015 and 2014, respectively. Refer to note 6 for a more detailed discussion of capital activity. Economic Factors and Next Years Budget The Authority projected a modest increase in enplanements for fiscal year 2017 in relation to the prior year. Revenues for fiscal year 2017 are forecasted to be approximately $79.93 million or 0.13% above fiscal year Operating expenses before depreciation and amortization for fiscal year 2017 are forecasted to be approximately $54.09 million or 6.14% above fiscal year The Authority expects to see modest growth in fiscal year 2017 as we anticipate an increase in space and facility rentals and improving financial conditions of the nation's airlines. Cost for security and other operational expenses continue to increase. The Authority continues to seek opportunities to diversify its revenues. Contacting the Authority s Financial Management The financial report is designed to provide the Authority s board of directors, management, investors, creditors and customers with a general view of the Authority s finances and to demonstrate the Authority s accountability for the funds it receives and expends. For additional information about this report, or if you need additional financial information, please contact Chief Financial Officer, Pecan Park Road, Jacksonville, Florida
30 Statements of Net Position (dollar amounts in thousands) September 30, Assets Current assets: Cash and cash equivalents $ 32,736 $ 33,704 Investments 36,516 28,278 Restricted cash and cash equivalents - 13,808 Accounts receivable, net of allowance of $120 in 2016 and $198 in ,598 4,444 Accounts receivable - restricted - 1,231 Grants receivable 4,201 5,889 Interest receivable Notes receivable Inventory and other assets 1,558 1,631 Total current assets 81,960 89,380 Noncurrent assets: Restricted cash and cash equivalents 15,693 4,433 Restricted investments - 15,154 Notes receivable 3,348 3,556 Total noncurrent assets 19,041 23,143 Capital assets: Land 71,120 71,120 Construction in progress 17,747 15,884 Property, plant and equipment 921, ,963 Less: accumulated depreciation (467,145) (436,615) Other capital assets, net of amortization 1,213 1,316 Total capital assets 543, ,668 Total noncurrent and capital assets 562, ,811 Total assets 644, ,191 Deferred Outflows of Resources Derivative instrument - swap 2,251 2,466 Loss on refunding 2,992 3,514 Pension 11,106 5,324 Total deferred outflow of resources 16,349 11, Total assets and deferred outflows of resources $ 661,295 $ 665,495 See accompanying notes. 18
31 Statements of Net Position (continued) (dollar amounts in thousands) September 30, Liabilities Current liabilities payable from unrestricted assets: Accounts payable $ 4,032 $ 4,209 Accrued expenses 16,541 20,569 Construction contracts and retainage payable 2,250 1,578 Total current liabilities payable from unrestricted assets 22,823 26,356 Current liabilities payable from restricted assets: Bonds and notes payable - current portion 9,075 12,020 Accrued interest payable 500 1,788 Total current liabilities payable from restricted assets 9,575 13,808 Total current liabilities 32,398 40,164 Long-term liabilities OPEB liability 2,100 2,018 Bonds and notes payable 93, ,688 Derivative instrument - swap 2,251 2,466 Net pension liability 20,592 12,337 Total long-term liabilities 118, ,509 Total liabilities 151, ,673 Deferred Inflow of Resources Gain on refunding Pension 2,995 4,278 Total deferred inflow of resources 3,942 4,505 Net Position Net investment in capital assets 441, ,670 Restricted for debt service - 10,040 Restricted for capital acquisition and construction 5,282 11,202 Restricted other 10,411 10,404 Unrestricted 49,654 41,001 Total net position 506, ,317 Total liabilities and net position $ 661,295 $ 665,495 See accompanying notes. 19
32 Statements of Revenues, Expenses, and Changes in Net Position (dollar amounts in thousands) For the Year Ended September 30, Operating revenues: Concessions $ 17,771 $ 16,933 Fees & charges 14,668 13,479 Space & facility rentals 26,705 24,608 Parking 18,993 18,191 Other revenue 1,688 1,794 Total operating revenues 79,825 75,005 Operating expenses: Wages & benefits 25,328 21,579 Services & supplies 14,581 14,537 Repairs & maintenance 2,607 2,097 Promotions, advertising & dues 1,052 2,453 Registration & travel Utilities & taxes 4,855 5,116 Other operating expenses 2,151 1,877 Operating expenses before depreciation and amortization 50,960 47,972 Operating income before depreciation and amortization 28,865 27,033 Depreciation & amortization 31,346 28,575 Operating loss (2,481) (1,542) Nonoperating revenues: Passenger facility charges 10,983 10,955 Investment income 1, Payments from federal & state agencies Other revenues 1, Total nonoperating revenues 14,139 12,569 Nonoperating expenses: Interest expense 3,946 4,775 Other expenses Total nonoperating expenses 4,390 4,979 Income before capital contributions 7,268 6,048 Capital contributions 21,762 16,526 Change in net position 29,030 22,574 Net position, beginning of year 477, ,743 Net position, end of year $ 506,347 $ 477,317 See accompanying notes. 20
33 Statements of Cash Flows For the Year Ended September 30, (dollar amounts in thousands) Cash Flows from Operating Activities Receipts from customers and tenants $ 78,901 $ 74,815 Payments to suppliers for goods and services (29,972) (23,573) Payments to employees for services (23,847) (22,012) Other nonoperating (expense) revenue Net cash provided by operating activities 26,018 29,433 Cash flows non-capital and related financing activities Nonoperating grants received Net cash provided by non-capital financing activities Cash flows from capital and related financing activities Acquisition and construction of capital assets (25,090) (34,348) Principal paid on capital debt (61,640) (12,765) Interest paid on capital debt (4,821) (4,478) Proceeds on new debt 26,500 - Proceeds from sale of equipment Contributions-in-aid of construction 15,493 13,769 Passenger facility charges received 10,983 10,955 Net cash used in capital and related financing activities (38,354) (26,828) Cash flows from investing activities Collections on notes receivable Interest on investments Purchase of investment securities (60,743) (44,425) Proceeds from sale and maturities of investment securities 68,126 42,793 Net cash provided by (used in) investing activities 8,617 (493) Net change in cash and cash equivalents (3,517) 2,365 Cash and equivalents, beginning of year 51,945 49,580 Cash and equivalents, end of year $ 48,429 $ 51,945 See accompanying notes. 21
34 Statements of Cash Flows (continued) Reconciliation of operating (loss) to net cash provided by operating activities For the Year Ended September 30, (dollar amounts in thousands) Operating loss $ (2,481) $ (1,542) Adjustment to reconcile operating loss to net cash provided by operating activities Depreciation and amortization expense 31,346 28,575 Increase in accounts receivable (923) (192) Increase (decrease) in inventory and other assets 73 (220) Increase (decrease) in accounts payable (177) 196 Increase in pension deferred outflow (5,782) (3,761) Increase in accrued expenses 4,309 7,339 Increase in pension deferred inflow (1,283) (1,166) Other nonoperating revenue Net cash provided by operating activities $ 26,018 $ 29,432 Non-cash investing, capital and financing activities: Change in fair value of investments $ 468 $ 6 Capital assets acquired through contracts payable and accruals $ 2,250 $ 39,787 Capital Contributions Receivable $ 4,201 $ 5,889 Capital assets contributed to the Authority $ 7,956 $ - See accompanying notes. 22
35 This page intentionally left blank

36 Notes to Financial Statements Annual Financial Report Fiscal Year 2016 Notes Jacksonville International Airport Cecil Airport Jacksonville Executive at Craig Airport Herlong Recreational Airport
37 Notes to Financial Statements September 30, 2016 and Organization and Reporting Entity Organization The (the Authority), a body corporate and politic, was established by the State of Florida (State) on June 5, 2001, pursuant to the provisions of Chapter which was amended on June 17, 2004 by Chapter , of the Laws of Florida to own and operate aviation facilities in Duval County, Florida. The Authority is independent, distinct from, and not an agent of the State or any other of the State s political subdivisions, including the County of Duval (County). Prior to October 1, 2001, the Authority operated as a division of the Jacksonville Port Authority. Pursuant to the provisions of Chapter of the Laws of Florida, the Authority changed its name from Jacksonville Airport Authority to effective June 10, The Authority s Board of Directors consists of seven members, four appointed by the Governor of the State of Florida and confirmed by the State Senate and three appointed by the Mayor of the City of Jacksonville (City) and confirmed by the City Council. The Authority is not subject to Federal, State or local income or sales taxes. Reporting Entity The Authority follows the criteria set forth in accounting principles generally accepted in the United States of America (GAAP) as promulgated by the Government Accounting Standards Board (GASB). The accompanying financial statements present the financial activities of the Authority only. The Authority does not have any component units and is not involved in any joint ventures. 2. Summary of Significant Accounting Policies New Accounting Guidance GASB 72: Fair Value Measurement and Application The objective of Statement No. 72 is to address accounting and financial reporting issues related to fair value measurements. The definition of fair value is the price that would be received to sell an asset or paid to transfer a liability in an orderly transaction between market participants at the measurement date. This Statement provides guidance for determining a fair value measurement for financial reporting purposes. This Statement also provides guidance for applying fair-value to certain investments and disclosures related to all fair-value measurements. The provisions of this statement are effective for financial statements for fiscal years beginning after June 15, 2015, which is the Authority s fiscal year The Authority adopted GASB 72 in the current fiscal year financial statements, in Note 3, to the financial statements. The implementation of GASB Statement No.75 will require the Authority to record 23
38 Notes to Financial Statements (continued) 2. Summary of Significant Accounting Policies (continued) the net OPEB liability where we currently record the net OPEB obligation. Management believes that this change in accounting principle will not result in a significant change to the Authority's financial position. GASB 75: Accounting and Financial Reporting for Postemployment Benefits Other Than Pensions The objective of Statement No. 75 is to improve accounting and financial reporting by state and local governments for postemployment benefits other than pensions (other postemployment benefits or OPEB). It also improves information provided by state and local governmental employers about financial support for OPEB that is provided by other entities. The provisions of this statement are effective for financial statements for fiscal years beginning after June 15, 2017, which is the Authority s fiscal year GASB 76: The Hierarchy of Generally Accepted Accounting Principles for State and Local Governments The objective of Statement No. 76 is to identify in the context of the current governmental financial reporting environment the hierarchy of generally accepted accounting principles (GAAP). The "GAAP hierarchy" consists of the sources of accounting principles used to prepare financial statements of state and local governmental entities in conformity with GAAP and the framework for selecting these principles. This Statement reduces the GAAP hierarchy to two categories of authoritative GAAP and addresses the use of authoritative and nonauthoritative literature in the event that the accounting treatment for a transaction or other event is not specified within a source of authoritative GAAP. This Statement supersedes Statement No. 55, The Hierarchy of Generally Accepted Accounting Principles for State and Local Governments. The provisions of this statement are effective for financial statements for fiscal years beginning after June 15, 2015, which is the Authority s fiscal year The implementation of this statement did not have a material impact on the Authority's financial statements. GASB 77: Tax Abatement Disclosures The objective of Statement No. 77 is to provide additional disclosures and information necessary for end uses to evaluate the financial health of government and access accountability. This Statement will provide additional disclosures to assess how tax abatements affect the financial position and results of operations, including the ability to raise resources in the future. The provisions of this statement are effective for financial statements for fiscal years beginning after December 15, 2015, which is the Authority s fiscal year The Authority is still evaluating the impact of this statement on the financial statements. 24
39 Notes to Financial Statements (continued) 2. Summary of Significant Accounting Policies (continued) GASB 78: Pensions Provided Through Certain Multiple-Employer Defined Benefit Pension Plans The objective of Statement No. 78 is to address a practice issue regarding the scope and applicability of Statement No. 68, Accounting and Financial Reporting for Pensions. This issue is associated with pensions provided through certain multiple-employer defined benefit pension plans and to state or local governmental employers whose employees are provided with such pensions. The provisions of this statement are effective for financial statements for fiscal years beginning after December 15, 2015, which is the Authority s fiscal year The Authority is still evaluating the impact of this statement on the financial statements. GASB 79: Certain External Investment Pools and Pool Participants The objective of Statement No. 79 is to address accounting and financial reporting for certain external investment pools and pool participants. The provisions of this statement are effective for financial statements for fiscal years beginning after June 15, 2015, except for certain provisions on portfolio quality, custodial credit risk, and shadow pricing. The provisions of this statement are effective for reporting periods beginning after December 15, 2015, which is the Authority s fiscal year The Authority is still evaluating the impact of this statement on the financial statements. GASB 82: Pension Issues - an amendment of GASB Statements No. 67, No. 68, and No. 73 The objective of Statement No. 82 is to address certain issues that have been raised with respect to Statements No. 67, Financial Reporting for Pension Plans, No. 68, Accounting and Financial Reporting for Pensions, and No. 73, Accounting and Financial Reporting for Pensions and Related Assets That Are Not within the Scope of GASB Statement 68, and Amendments to Certain Provisions of GASB Statements 67 and 68. Specifically, this Statement addresses issues regarding (1) the presentation of payroll-related measures in required supplementary information, (2) the selection of assumptions and the treatment of deviations from the guidance in an Actuarial Standard of Practice for financial reporting purposes, and (3) the classifaction of payments made by employers to satisfy employee (plan member) contribution requirements. The requirements of the Statement are effective for reporting periods beginning after June 15, 2016, except for the requirements of this Statement for the selection of assumptions in a circumstance in which an employer's pension liability is measured as of a date other than the employer's most recent fiscal yearend. In that circumstance, the requirements for the selection of assumptions are effective for that employer in the first reporting period in which the measurement date of the pension liability is on or after June 15, 2017, which is the Authority's fiscal year
40 Notes to Financial Statements (continued) 2. Summary of Significant Accounting Policies (continued) GASB 83: Certain Asset Retirement Obligations The objective of Statement No. 83 is to improve financial reporting by developing requirements on recognition and measurement for asset retirement obligations (ARO), other than landfills. This Statement establishes criteria for determining the timing and pattern of recognition of a liability and a corresponding deferred outflow of resources for AROs. This Statement requires that recognition occur when the liability is both incurred and reasonably estimable. An ARO is a legally enforceable liability associated with the retirement of a tangible capital asset. A government that has legal obligations to perform future asset retirement activities related to its tangible captial assets should recognize a liability based on the guidance in this Statement. The requirements of this Statement are effective for reporting periods beginning after June 15, The Authority is still evaluating the impact of this statement on the financial statements. Basis of Accounting The accompanying financial statements have been prepared on the accrual basis. The Authority reports as a business type activity, as defined by the GASB. Business type activities are those that are financed in whole or in part by fees charges to external parties for goods or services. The Authority s activities are accounted for similar to those often found in the private sector using the flow of economic resources measurement focus and the accrual basis of accounting. All assets, deferred outflows of resources, liabilities, deferred inflows of resources, net position, revenues, and expenses are accounted for through a single enterprise fund with revenues recorded when earned and expenses recorded at the time liabilities are incurred. Current assets include cash and amounts convertible to cash during the next normal operating cycle or one year. Current liabilities include those obligations to be liquidated with current assets. Revenues from airlines, rental cars, parking and concessions are reported as operating revenues. Capital grants, financing or investment related transactions are reported as non-operating revenues. All expenses related to operating the Authority are reported as operating expenses. Interest expense and financing costs are reported as non-operating expenses. The Authority s bond resolutions specify the flow of funds from revenues and specify the requirements for the use of certain restricted and unrestricted assets. 26
41 Notes to Financial Statements (continued) 2. Summary of Significant Accounting Policies (continued) Net Position Net position represents the residual interest in the Authority s assets and deferred outflows of resources after liabilities and deferred inflows of resources are deducted and consists of three components: net investment in capital assets, restricted, and unrestricted. Net investment in capital assets includes capital assets, net of accumulated depreciation, reduced by outstanding debt net of debt service reserves. Net position is reported as restricted when constraints are imposed by third parties or enabling legislation. The Authority s restricted net position is expendable. In certain cases, the Authority may fund outlays for a particular purpose from both restricted and unrestricted resources. In order to calculate the amounts reported as restricted net position and unrestricted net position, a flow assumption must be made about the order in which the resources are considered to be applied. It is the Authority s policy to consider restricted net position to have been depleted before unrestricted net position. Proprietary Accounting and Financial Reporting The accompanying financial statements have been prepared in conformity with GAAP as applied to governmental units. The GASB is the accepted standard-setting body establishing governmental accounting and financial reporting principles. Budgeting Requirements The Authority s annual budgeting process is a financial planning tool used to establish the estimated revenues and expenditures for the Authority. The annual budget is developed after reviewing revenue forecasts, the impact of funding increases on landing fees, rental rates and other rates and charges, prior year actual, current program levels, new operating requirements, and the overall economic climate of the region and airline industry. The budget to actual results are periodically reviewed throughout the year to ensure compliance with the provisions of the Authority s entity-wide annual operating budget, which is approved by the Board of Directors and the City Council of the City. 27
42 Notes to Financial Statements (continued) 2. Summary of Significant Accounting Policies (continued) Prior to July 1 of each year, the Authority prepares and submits its budget to the City Council for the ensuing fiscal year. The City Council may increase or decrease the appropriation requested by the Authority on a total basis or a line-by-line basis. The Authority s Chief Executive Officer has been delegated the authority to approve budgetary changes to the budget within all categories, subject to the following limitations: once adopted, the total budget may only be increased through action of the City Council; operating budget item transfers may be made with the approval to the Chief Executive Officer or his designee, line-to-line capital budget transfers may be made with the approval of the Chief Executive Officer or his designee if it is cumulatively less than or equal to $100,000 or with the approval of the Board if over $100,000. In keeping with the requirements of a proprietary fund budget, budget comparisons have not been included in the financial section of this report. Revenue Recognition Airfield Landing Fee Charges Landing fees are principally generated from scheduled airlines, cargo carriers and non-scheduled commercial aviation and are based on the landed weight of the aircraft. The estimated landing fee structure is determined annually based on the residual cost recovery method, pursuant to an agreement between the Authority and the signatory airlines based on the operating budget of the Authority, and it is adjusted at year-end for the actual landed weight of all aircraft. Landing fees are recognized as a component of operating revenue when the related facilities are utilized. See separate note on Airline Lease and Use Agreement for further details. Terminal Rents, Concession and Ground Transportation Rentals and concession fees are generated from airlines, parking structures and lots, rental cars, fixed based operators, food and beverage, retail, advertising and other commercial tenants. Leases with the airlines are based on residual cost recovery method, through rates and charges pursuant to the agreement. Leases are typically for terms from one or more years and generally require rentals based on the volume of business, with specific minimum annual rental payments required. Rental revenue is recognized on a straight line basis over the life of the respective leases and concession revenue is recognized based on reported concession revenue and typically based on a minimum rental guarantee. Rental revenue and concession revenue are recognized as operating revenue on the Statements of Revenues, Expenses, and Changes in Net Position. Other All other types of operating revenue are recognized when earned. 28
43 Notes to Financial Statements (continued) 2. Summary of Significant Accounting Policies (continued) Cash, Cash Equivalents and Investments The deposit and investment of Authority monies is governed by provisions of its enabling legislation and by an investment policy adopted by the Authority. The Governing Body has authorized the Authority to establish bank accounts with a qualified depository pursuant to Chapter 280 of the Florida Statutes. Accordingly, all of the Authority s deposits are considered fully collateralizedd. For purposes of reporting cash flows, the Authority considers all highly liquid investments (including restricted assets) with original maturities of three months or less to be cash equivalents. Cash equivalents, which are stated at amortized cost, consist of money market funds and cash investment pools payable on demand. The Governing Body has authorized the Authority to invest in obligations of the U.S. Government and certain of its agencies, repurchase agreements, investment grade commercial paper, money market funds, corporate bonds, time deposits, bankers acceptances, state and/or local debt, and the Florida State Board of Administration Investment Pool. Restricted bond proceeds are invested in accordance with the bond indenture agreements. Receivables Receivables are reported at their gross value when earned and are reduced by the estimated portion that is expected to be uncollectible. The allowance for uncollectible accounts is based on collection history, aviation industry trends and current information regarding the credit worthiness of the tenants and others doing business with the Authority. When continued collection activity results in receipt of amounts previously written off, revenue is recognized for the amount collected. Inventory Inventory consists of supplies and parts, and fuel and is stated at the lower of cost or market on a weighted average and FIFO basis, respectively. Restricted Assets Restricted assets consist of monies and other resources, which are legally restricted. Major classes of restricted assets are discussed below. Operations and maintenance (O&M) fund is an asset representing proceeds restricted to pay the next succeeding two months of budgeted operations and maintenance expenses. 29
44 Notes to Financial Statements (continued) 2. Summary of Significant Accounting Policies (continued) Passenger facility charges (PFC) funds are assets representing PFC collections based on an approved Federal Aviation Administration (FAA) application to impose such charges on enplaned passengers at Jacksonville International Airport (JIA). These funds are restricted for designated capital projects and any debt incurred to finance the construction of those projects. The Authority recognizes and reports PFCs as non-operating revenue when all conditions have been met that entitle the Authority to retain the PFCs. Renewal and replacement fund is deemed to be fully funded when the balance therein is one million dollars. The assets are to be used only to make unusual or extraordinary repairs to facilities included as a part of the airport system, to make required deposits to the debt service fund if available amounts in other funds are not sufficient for such purposes and to make required deposits to the reserve fund and rebate fund if amounts in other funds are not sufficient for such purposes. Capital Assets Capital assets are stated at historical cost, net of accumulated depreciation. The Authority s capitalization threshold is $5,000. The costs for property and facilities includes capitalized interest during the period of construction (see Note 6). Tenants have funded some construction and improvements of airport facilities from their own working capital. Under agreements with the Authority, the property reverts to the Authority upon termination or expiration of the agreement. These assets, when obtained by the Authority, are recorded at acquisition value as of date of transfer. Major improvements and replacements of property are capitalized. Maintenance, repairs and minor improvements and replacements are expensed as incurred. When properties are disposed of, the related costs and accumulated depreciation are removed from the respective accounts and any gain or loss on disposition is reflected in current operations. Depreciation of capital assets is computed using the straight-line method at various rates considered adequate to allocate costs over the estimated useful lives of such assets. The estimated lives by general classification are as follows: Asset Class Life in Years Buildings 5-50 Other improvements 3-50 Equipment 3-20 Intangibles
45 Notes to Financial Statements (continued) 2. Summary of Significant Accounting Policies (continued) Capitalization of Interest Interest costs incurred during the construction of eligible capital assets projects are capitalized. Bond Issuance Costs Bond issuance costs represent costs incurred in the process of issuing bonds and are expensed in the year of issuance. Compensated Absences Employees accrue annual leave in varying amounts based on length of service combined with position level, up to a maximum of 320 hours. Employees who will accrue more than 320 hours of annual leave by December 31 will be paid for the excess hours on the last pay period of the calendar year. The liability for compensated absences earned through year-end, but not yet taken, is accrued by charging the expense for the change in the liability from the prior year. Pension Plan For purposes of measuring the net pension liability, deferred outflows of resource and deferred inflows of resources related to pensions, and pension expense, information about the fiduciary net position of the Florida Retirement System (FRS) and Health Insurance Subsidy (HIS) defined benefit plans (Plans), additions to/deductions from both Plans fiduciary net position have been determined on the same basis as they are reported by the Plans and are recorded in the Authority's financial statements. For this purpose, benefit payments (including refunds of employee contributions) are recognized when due and payable in accordance with the benefit terms. Investments are reported a fair value. Deferred outlfows/inflows of resources In addition to assets, the statement of financial position includes a separate section for deferred outflows of resources. This separate financial statement section, deferred outflows of resources, represents a consumption of net position that applies to future periods and so will not be recognized as an outflow of resources (expenses) until that time. The Authority currently reports an accumulated decrease in fair value of a derivative swap (see note 10), the net deferred loss on refunding of debt, as well as deferred outflows related to pensions in this category. 31
46 Notes to Financial Statements (continued) 2. Summary of Significant Accounting Policies (continued) In addition to liabilities, the statement of financial position includes a separate section for deferred inflows of resources. This separate financial statement section, deferred inflows of resources, represents an acquisition of net position that applies to a future period and so will not be recognized as an inflow of resources (revenue) until that time. The Authority currently reports deferred inflows related to the net deferred gain on refunding of debt, as well as deferred inflows related to pensions in this category. Capital Contributions: Federal and State Grants The Authority receives federal and state grants in support of its capital construction program. The federal program provides funding for airport development, airport planning and noise compatibility programs from the Airport and Airways Trust Funds in the form of both entitlement and discretionary grants for eligible projects. The State of Florida and individual tenants also provide funds for capital programs. Certain expenditures for airport capital improvements are funded through the airport improvement program (AIP) of the FAA, with certain matching funds provided by the State of Florida s Department of Transportation and the Authority, or from various state allocations or grant programs. Capital funding provided under government grants is considered earned as the allowable expenditures are incurred. Grants for capital asset acquisition, facility development and rehabilitation and eligible long-term planning studies are reported in the statement of revenues, expenses and changes in net position, after non-operating revenues and expenses, as capital contributions. Passenger Facility Charges In 1990, Congress approved the Aviation Safety and Capacity Expansion Act which authorized domestic airports to impose a PFC on enplaning passengers. In May 1991, the FAA issued the regulations for the use and reporting of PFCs. PFCs may be used for airport projects that meet as least one of the following criteria: preserve or enhance safety, security, or capacity of the national air transportation system, reduce noise or mitigate noise impacts resulting from an airport, or furnish opportunities for enhanced competition between or among carriers. PFC charges at the rate of $3.00 per enplaned passenger have been levied by the Authority since April 1, 1994, under an FAA approved application to impose $12.26 million in PFC fees. Since this first record of decision the Authority has submitted and received approval to collect $ million since inception through November 1, In February 2003, with an earliest charge effective date of May 1, 2003, the FAA approved an amendment to impose and use passenger facility charges, at JIA at a new rate of $4.50. This amendment also permits the Authority to finance certain projects with PFC revenues. Through September 30, 2016, the Authority has collected, including interest earnings, PFCs totaling approximately $ million. PFCs, along with related interest earnings are recognized and recorded as non-operating revenue in the year collected by the air carriers. 32
47 Notes to Financial Statements (continued) 2. Summary of Significant Accounting Policies (continued) The Authority has expended approximately $ million of PFCs on projects funded on a pay-as-yougo and financing basis. Arbitrage Rebate Liability The United States Treasury has issued regulations on calculating the rebate due to the United States Government on arbitrage profits and determining compliance with the arbitrage rebate provisions of the Tax Reform Act of Arbitrage profits arise when the Authority temporarily invests the proceeds of tax-exempt debt in securities with higher yields. As of September 30, 2016 and 2015 the Authority did not have an arbitrage liability. Management Estimates The preparation of financial statements in conformity with GAAP requires management to make estimates and assumptions that affect certain reported amounts and disclosures. Accordingly, through subsequent events, actual results could differ from those estimated. Reclassifications Certain amounts in the 2015 financial statements have been reclassified to conform to the presentation in the 2016 financial statements. 33
48 Notes to Financial Statements (continued) 3. Investments Credit Risk The primary objectives of the Authority s investment policy are the safety of capital, the liquidity of the portfolio, and the yield of the investments. Bond proceeds may be invested in securities as permitted in the bond indentures. Otherwise, assets of the Authority may be invested in: (a) the Florida Local Government Surplus Funds Trust Fund (Florida PRIME); (b) United States government securities; (c) United States government agencies, federal instruments; (d) federal instrumentalities; (e) interest bearing time deposit or savings accounts, provided that any such deposits are secured by the Security for Public Deposits Act, Chapter 280, Florida Statutes; (f) repurchase agreements; (g) commercial paper at the time of purchase rated A-1 by Standard & Poor s (S&P) and P-1 by Moody s Investor Services (Moody s); (h) corporate notes that have a long-term debt rating at the time of purchase, at a minimum AA by S&P and Aa by Moody s; (i) bankers acceptances rated, at a minimum, A-1 by S&P and P-1 by Moody s; (j) state and/or local government taxable and/or tax-exempt debt rated at least AA by S&P and Aa by Moody s or rated at least SP-1 by S&P or MIG-1 by Moody s for short term debt; (k) registered investment companies (money market mutual funds) registered under the Federal Investment Company Act of 1940 and operated in accordance with 17 C.F.R a-7; (l) mortgagebacked securities; (m) asset-backed securities; and (n) short term bond funds. Consistent with the Authority s investment policy bond resolutions: 1) all of the U.S. government agency securities held in the portfolio are issued or guaranteed by agencies created pursuant to an Act of Congress as an agency of the United States of America and at the time of their purchase were rated AA+ by S&P; 2) the Local Government Surplus Funds Trust Fund is rated AAAm by S&P; it is administered by the State Board of Administration, under the regulatory oversight of the State of Florida, Chapter 19-7 of the Florida Administrative Code. The value of the Authority s investment is the same as the value of the pool shares; 3) the money market mutual funds are each rated AAA by S&P. The investments in the Local Government Surplus Funds Trust Fund and the money market mutual funds are classified as cash equivalents on the accompanying statements of net position. 34
49 Notes to Financial Statements (continued) 3. Investments (continued) The Authority's investments are rated as follows: (dollar amounts September 30, 2016 in thousands) Investment Type Rating S&P Fair Value US Treasury and government agency securities AAA $ 6,529 US Treasury and government agency securities AA+ 19,461 Money market mutual funds AAA 10,720 Commercial Paper A-1 1,395 Corporate Bonds AAA 2,943 Corporate Bonds AA+ 225 Corporate Bonds AA 299 Corporate Bonds AA- 1,504 Corporate Bonds A 2,486 Corporate Bonds A- 1,361 Corporate Bonds * BBB+ 214 Corporate Bonds * BB- 99 Total $ 47,236 Note * - These bonds were rated A- or better at the time of purchase, as required by policy. The bonds were downgraded after the purchase date. (dollar amounts September 30, 2015 in thousands) Investment Type Rating S&P Fair Value US Treasury and government agency securities AAA $ 1,809 US Treasury and government agency securities AA+ 1,403 US Treasury and government agency securities AA 30,756 Money market mutual funds AAA 7,643 Commercial Paper A-1 2,867 Corporate Bonds AAA 2,354 Corporate Bonds AA- 50 Corporate Bond A 3,760 Corporate Bonds A- 433 Total $ 51,075 Interest Rate Risk Section (17), Florida Statutes, limits investment maturities to provide sufficient liquidity to pay obligations as they come due. As a means of limiting its exposure to fair value losses arising from rising interest rates, the Authority s investment policy requires the investment portfolio to be structured in such a manner as to provide sufficient liquidity to pay obligations as they come due. To the extent possible, investment maturities are matched with known cash needs and anticipated cash flow requirements. 35
50 Notes to Financial Statements (continued) 3. Investments (continued) Additionally, maturity limitations for investments related to the issuance of debt are outlined in the bond resolution relating to those bond issues. The Authority s investment policy also limits investments in commercial paper to maturities not to exceed 270 days. Investment Maturity Distribution Type of investments (dollar amounts in thousands) Less than One to One Year Five from 9/30/2016 Years Total US Treasury and government agency securities $ 1,080 $ 24,910 $ 25,990 Money market mutual funds* 10,720-10,720 Commercial Paper 1, ,465 Corporate Bonds 911 8,150 9,061 Total investments $ 14,106 $ 33,130 $ 47,236 Type of investments (dollar amounts in thousands) Less than One to One Year Five from 9/30/2015 Years Total US Treasury and government agency securities $ 7,629 $ 26,339 $ 33,968 Money market mutual funds* 7,643-7,643 Commercial Paper 2,867-2,867 Corporate Bonds 100 6,497 6,597 Total investments $ 18,239 $ 32,836 $ 51,075 *Reported as cash equivalents on the statements of net position Custodial Credit Risk All securities purchased by, and all collateral obtained by, the Authority under its investment policy shall be properly designated as assets of the Authority and may be held in safekeeping by a third party custodial bank or other third party custodial institution. As of September 30, 2016, all investment securities of the Authority are held with an appropriate custodian or trustee or are held in accounts in the name of, and belonging to, the Authority. 36
51 Notes to Financial Statements (continued) 3. Investments (continued) Concentration of Credit Risk Exclusive of restricted funds, the following are the Authority s investment percentages limits. The Authority s investment in the Florida Local Government Surplus Funds Trust Fund and the United States Government Securities shall not exceed 100% of the total investment portfolio. The Authority shall not exceed 80% of its portfolio value invested in Federal Instrumentalities. Total United States Government Agencies, Repurchase Agreements, and Registered Investment Companies held by the Authority shall each not exceed 50% of the total value of the investment portfolio. The Authorities investment in Commercial Paper and Bankers Acceptance shall not exceed 35% of the total investment portfolio. Maximum exposure to any Interest Bearing Time Deposits or Savings Accounts, Corporate Notes or Short Term Bond Funds shall be limited to 25% of the total investment portfolio. Maximum exposure to Mortgage-Backed Securities and State and/or Local Government Taxable and /or Tax-Exempt Debt shall not exceed 20% of the total investment portfolio. The Authority shall not exceed 10% of its portfolio value for Asset-Backed Securities. As of September 30, 2016, all investment holdings of the Authority are in compliance with these policies. Investments in any one issuer representing 5% of more of the Authority s total investments as of September 30, 2016 are as follows: $9.22 million 19.52% invested in issues of the Federal Home Loan Banks; $6.53 million 13.82% invested in US Treasury Notes; $2.71 million 5.73% invested in Federal National Mortgage Association; and $2.37 million 5.01% invested in Federal Home Loan Mortgage Corporation. 37
52 Notes to Financial Statements (continued) 3. Investments (continued) (dollar amounts in thousands) September 30, 2016 Unrestricted Restricted Fair Value Investments: US Treasury and government agency securities $ 26,092 $ - $ 26,092 Money market mutual funds* - 10,617 10,617 Commercial Paper 1,395-1,395 Corporate Bonds 9,132-9,132 Total investments $ 36,619 $ 10,617 $ 47,236 (dollar amounts in thousands) September 30, 2015 Unrestricted Restricted Fair Value Investments: US Treasury and government agency securities $ 18,814 $ 15,154 $ 33,968 Money market mutual funds* 761 6,882 7,643 Commercial Paper 2,867-2,867 Corporate Bonds 6,597-6,597 Total investments $ 29,039 $ 22,036 $ 51,075 *Reported as cash equivalents on the statements of net position The Authority follows GASB No. 31, Accounting and Financial Reporting for Certain Investments and for External Investment Pools, which requires the adjustment of the carrying value of investments to fair value to be represented as a component of investment income. Investments are presented at fair value, which is based on available or equivalent market values. The Authority categorizes its fair value measurements within the fair value hierarchy established by generally accepted accounting principles. The hierarchy is based on the valuation inputs used to measure the fair value of the asset. Level 1 inputs are quoted prices in active markets for identical assets; Level 2 inputs are observable, either directly or indirectly, such as quoted prices for similar assets, quoted prices in markets that are not active, or other inputs that are observable or can be corroborated by observable market data for substantially the same term of the asset; Level 3 inputs are significant unobservable inputs. The authority has no investments valued using level 3 inputs. 38
53 Notes to Financial Statements (continued) 3. Investments (continued) The Authority has the following recurring fair value measurements as of September 30, 2016: US Treasury securities and government agencyof $26.09 million are valued using quoted prices in an active market foridentical assets (Level 1 inputs). Commercial paper of $1.40 million and corporate bond of $6.60 million are valued using a matrix pricing model (Level 2 inputs). The following shows a reconciliation of the investment categories to the statements of net position for cash equivalents and investments for the fiscal years September 30, 2016 and (dollar amounts in thousands) Cash & Investments as of September 30, 2016 Local Money Government Market Investment Surplus Fund Mutual Funds Securities Total Investments Total Cash & Investments Cash Current assets: Cash and cash equivalents $ 32,735 $ - $ - $ - $ - $ 32,735 Investments ,619 36,619 36,619 Noncurrent assets: Restricted cash and cash equivalents 5,372-10,617-10,617 15,989 $ 38,107 $ - $ 10,617 $ 36,619 $ 47,236 $ 85,343 39
54 Notes to Financial Statements (continued) 3. Investments (continued) (dollar amounts in thousands) Cash & Investments as of September 30, 2015 Local Money Government Market Investment Surplus Fund Mutual Funds Securities Total Investments Total Cash & Investments Cash Current assets: Cash and cash equivalents $ 32,943 $ - $ 761 $ - $ 761 $ 33,704 Investments ,278 28,278 28,278 Restricted cash and cash equivalents 9,203-4,605-4,605 13,808 Noncurrent assets: Restricted cash and cash equivalents 2,156-2,277-2,277 4,433 Restricted investments ,154 15,154 15,154 $ 44,302 $ - $ 7,643 $ 43,432 $ 51,075 $ 95, Receivables Accounts receivable are recorded net of allowances for uncollectible accounts of $120 thousand and $198 thousand at September 30, 2016 and 2015, respectively. Accounts receivable at year-end are comprised of the following: Percent of Balance September 30, Receivables from: Airlines % % Concessionaires/non-aviation % % Parking customers 4.34 % 3.07 % 40
55 Notes to Financial Statements (continued) 4. Receivables (continued) The Authority entered into separate operating and lease agreements with various tenants where the following note receivables were issued: November 01, 2014 for $87.80 thousand over forty-eight months at no interest, November 01, 2013 for $250 thousand over fifty-four months at an 8% interest rate, April 1, 2009 for $ thousand over 83 months at an interest rate of 3.5%, and February 25, 2005 for $4.63 million over twenty-five years at an interest rate ranging from 6% to 9%. The current rate of interest for 2016 is 8%. (dollar amounts in thousands) October 1, 2015 Balance Increases Decreases September 30, 2016 Balance Amounts Due Within One Year $ 3,817 $ - $ (244) $ 3,573 $ 225 (dollar amounts in thousands) October 1, 2014 Balance Increases Decreases September 30, 2015 Balance Amounts Due Within One Year $ 4,081 $ 2 $ (266) $ 3,817 $
56 Notes to Financial Statements (continued) 5. Restricted Assets Restricted assets, as of September 30, are as follows: (dollar amounts in thousands) Current restricted cash and cash equivalents Debt Service $ 9,575 $ 13,808 Non current restricted cash and cash equivalents State forfeiture $ - $ 19 Federal forfeiture Flexible spending PFC 5,142 1,711 Operating and maintenance 9, Pooled bond reserve - 2,131 Capital recovery R&R fund 1, Total non current restricted cash and cash equivalents $ 15,693 $ 4,433 Restricted investments Pooled bond reserve $ - $ 5,053 R&R fund - 1,026 O&M fund - 9,075 Total restricted investments $ - $ 15,154 42
57 Notes to Financial Statements (continued) 6. Capital Assets Capital assets activity for the years ended September 30, 2016 and 2015: Beginning Balance October 1, 2015 (dollar amounts in thousands) Transfers and Additions Transfers and Disposals Ending Balance September 30, 2016 Capital assets not being depreciated: Land $ 71,120 $ - $ - $ 71,120 Construction in progress 15,884 25,304 (23,441) 17,747 Total capital assets not being depreciated 87,004 25,304 (23,441) 88,867 Other capital assets: Buildings and Structures 142,882 5, ,509 Other improvements 687,233 18, ,261 Equipment 59,847 7,814 (421) 67,240 Total other capital assets 889,962 31,469 (421) 921,010 Intangible capital assets 7, ,035 Less amortization (6,330) (492) - (6,822) Total intangible assets 1,318 (105) - 1,213 Total assets being depreciated 891,280 31,364 (421) 922,223 Total capital assets 978,284 56,668 (23,862) 1,011,090 Less: Accumulated depreciation Buildings 68,513 4,032-72,545 Other improvements 329,416 22, ,916 Equipment 38,686 4,042 (44) 42,684 Total accumulated depreciation 436,615 30,574 (44) 467,145 $ 541,669 $ 26,094 $ (23,818) $ 543,945 Depreciation expense for the years ended September 30, 2016 and 2015 was $30.57 million and $28.08 million, respectively. During the fiscal year ended September 30, 2016 we capitalized $ thousand in interest. We did not capitalize any interest in
58 Notes to Financial Statements (continued) 6. Capital Assets (continued) Beginning Balance October 1, 2014 (dollar amounts in thousands) Transfers and Additions Transfers and Disposals Ending Balance September 30, 2015 Capital assets not being depreciated: Land $ 71,120 $ - $ - $ 71,120 Construction in progress 31,755 29,383 (45,254) 15,884 Total capital assets not being depreciated 102,875 29,383 (45,254) 87,004 Other capital assets: Buildings 122,462 20, ,882 Other improvements 666,332 20, ,233 Equipment 56,255 3,894 (302) 59,847 Total other capital assets 845,049 45,215 (302) 889,962 Intangible capital assets 7, ,648 Less amortization (5,829) (501) - (6,330) Total intangible assets 1,781 (463) - 1,318 Total assets being depreciated 846,830 44,752 (302) 891,280 Total capital assets 949,705 74,135 (45,556) 978,284 Less: Accumulated depreciation Buildings 64,911 3,602-68,513 Other improvements 308,170 21, ,416 Equipment 35,751 3,227 (292) 38,686 Total accumulated depreciation 408,832 28,075 (292) 436,615 $ 540,873 $ 46,060 $ (45,264) $ 541,669 44
59 Notes to Financial Statements (continued) 7. Pension Plans Plan Description Florida Retirement System All the full-time employees of the Authority participate in the Florida Retirement System (the FRS), a cost sharing multiple-employer defined benefit plan. Benefit provisions are established under Chapter 121, Florida Statutes, which may be amended by the Florida Legislature. The FRS is administered by the State of Florida, Division of Retirement. The Florida Legislature passed Senate Bill 2100 effective July 1, This bill changed eligibility requirements and created a mandatory employee contribution of 3%. Because of this bill, there are now two groups of employees participating in the FRS program. These groups are defined by their date of employment; those who began employment before July 1, 2011 and those who began on or after July 1, For those employees who began employment before July 1, 2011 the following applies: The FRS provides vesting of benefits after six years of creditable service. Members are eligible for normal retirement after they have met one of the following: (1) six years of service and age 62, or the age after age 62 that the member becomes vested, or thirty years of service regardless of age (may include four years military), whichever comes first; or (2) six years of special risk service and age 55, or twentyfive total years of special risk services and age 52 (may include four years wartime military service), or twenty-five total years special risk service, regardless of age, or thirty years of any creditable service, regardless of age (may include four years wartime military service). Early retirement may be taken any time after completing six years of service; however, there is a 5% benefit reduction for each year prior to normal retirement age. Benefits are computed on the basis of age, average final compensation, and years of service. Average final compensation is the average of the five highest fiscal years of earnings. The FRS also provides death and disability benefits. Benefits are established by Florida Statutes. 45
60 Notes to Financial Statements (continued) 7. Pension Plans (continued) For those employees who began employment on or after July 1, 2011 the following applies: The FRS provides vesting of benefits after eight years of creditable service. Members are eligible for normal retirement after they have met one of the following: (1) eight years of service and age 65, or the age after age 65 that the member becomes vested, or thirty three years of service regardless of age (may include four years military), whichever comes first; or (2) eight years of special risk service and age 60, or thirty total years of special risk services and age 57 (may include four years wartime military service), or thirty total years special risk service, regardless of age, or thirty years of any creditable service, regardless of age (may include four years wartime military service). Early retirement may be taken any time after completing eight years of service; however, there is a 5% benefit reduction for each year prior to normal retirement age. Benefits are computed on the basis of age, average final compensation, and years of service. Average final compensation is the average of the eight highest fiscal years of earnings. The FRS also provides death and disability benefits. Benefits are established by Florida Statutes. The FRS issues a publicly available financial report that includes financial statements and required supplementary information. This report may be obtained by writing to the Florida State Retirement System, Division of Policy, Cedars Executive Center Building C, 2639 North Monroe Street, Tallahassee, Florida, , attention Research and Education; or by contacting Research & Education by at rep@frs.state.fl.us, or by phone at (850) Funding Policy Florida Retirement System The Authority is required by Florida Statute to contribute monthly employer contributions at actuarially determined rates that, expressed as percentages of annual covered payroll are adequate to accumulate sufficient assets to pay benefits when due. Level-percentage-of-payroll employer contribution rates, established by state law, are determined using the entry-age actuarial funding method. If an unfunded actuarial liability reemerges, as a result of future plan benefit changes, assumption changes, or methodology changes it is assumed any unfunded actuarial liability would be amortized over 30 years, using level dollar amounts. Except for gains reserved for rate stabilization, it is anticipated future actuarial gains and losses are amortized on a rolling 10% basis, as a level dollar amount. The Senate Bill 2100 enacted in July 2011 created a 3% mandatory pre-tax employee contribution, as well as, a reduction in contribution rates for the employer. 46
61 Notes to Financial Statements (continued) 7. Pension Plans (continued) The following table shows the required contributions for the different classes of employee participants: Deferred Year Special risks participants retirement option participants Senior management participants Regular participants 07/01/ /30/2017 Employer % % % 7.52 % Employee 3.00 % - % 3.00 % 3.00 % Total % % % % 07/01/ /30/2016 Employer % % % 7.26 % Employee 3.00 % - % 3.00 % 3.00 % Total % % % % 07/01/ /30/2015 Employer % % % 7.37 % Employee 3.00 % - % 3.00 % 3.00 % Total % % % % Contributions made to the FRS were equal to the required amount, as of September 30, are as follows: (dollar amounts in thousands) Employer $ 1,878 $ 1,712 $ 1,515 Employee Total $ 2,380 $ 2,178 $ 1,944 Pension Liabilities, Pension Expense, and Deferred Outflows of Resources and Deferred Inflows of Resources Related to Pensions At September 30, 2016 and 2015, the Authority reported a liability of $14.13 million and $6.96 million for its proportionate share of the Plan's net pension liability. The net pension liability was measured as of June 30, 2016 and 2015 and the total pension liability used to calculate the net pension liability was determined by an actuarial valuation as of July 1, 2016 and
62 Notes to Financial Statements (continued) 7. Pension Plans (continued) The Authority's proportionate share of the net pension liability was based on the Authority's 2016 and 2015 fiscal year contributions relative to the 2016 and 2015 fiscal year contributions of all participating members. At June 30, 2016 and 2015 the Authority's proportionate share was % and % perspectively, which was an increase of % from its proportionate share measured as of June 30, 2015 and an increase of % from its proportionate share measured as of June 30, For the fiscal years ended September 30, 2016 and 2015, the Authority recognized pension expense of $1.37 and $1.31 million related to the Plan. In addition, the Authority reported deferred outflows of resources and deferred inflows of resources related to pensions from the following sources: Description Deferred Outflows of Resources (dollar amounts in thousands) Deferred Deferred Inflows of Outflows of Resources Resources Deferred Inflows of Resources Differences between expected and actual experience $ 1,082 $ (132) $ 735 $ 165 Change of assumptions Net difference between projected and actual earnings on FRS pension plan investments 6,501 (2,848) 2,452 4,113 Changes in proportion and differences between Authority's FRS contributions and proportionate share of contributions Authority's contributions subsequent to the measurement date Total $ 9,628 $ (2,980) $ 4,631 $ 4,278 48
63 Notes to Financial Statements (continued) 7. Pension Plans (continued) For fiscal years ended September 30, 2016 and 2015 deferred outflow of resources related to pensions, totaled $ and $ thousand, resulting from Authority contributions to the Plan subsequent to the measurement date, and will be recognized as a reduction of the net pension liability in the fiscal year ended September 30, 2017 and 2016, respectively. Other amounts reported as deferred outflows of resources and deferred inflows of resources related to pensions will be recognized in pension expense as follows: (dollar amounts in thousands) Actuarial Assumptions 2016 Deferred outlfows/(infl Fiscal Year Ending September 30 ows) net 2017 $ 1, , , , ,438 Thereafter 331 The total pension liability in the July 1, 2016 and 2015 actuarial valuations were determined using the following actuarial assumptions, applied to all periods included in the measurement: Inflation 2.60% 2.60% Salary increases - average including inflation 3.25% 3.25% Investment rate of return - net of pension plan investment expense including inflation 7.60% 7.65% Mortality rates were based on the Generational RP-2000 with Projection Scale BB, with adjustments for mortality improvements based on Scale BB. The actuarial assumptions used in the July 1, 2016 and 2015 valuation were based on the results of an actuarial experience study for the period July 1, 2008 through June 30, The long-term expected rate of return on pension plan investments was based on assumptions developed by Milliman's capital market assumptions team and by a capital market assumptions team from Aon Hewitt Investment Consulting, which consults to the Florida State Board of Administration. The table below shows Milliman's assumptions for each of the asset classes in which the plan was invested at that 49
64 Notes to Financial Statements (continued) 7. Pension Plans (continued) time based on the long-term target asset allocation. The allocation policy's description of each asset class was used to map the target allocation to the asset classes shown below. Each asset class assumption is based on a consistent set of underlying assumptions, and includes an adjustment for the inflation assumption. These assumptions are not based on historical returns, but instead are based on forwardlooking capital market economic model. In the comprehensive annual financial report issued by FRS for the plan year ended June 30, 2016, management of the plan included a disclosure about the investment rate of return assumption as set by the 2016 FRS Actuarial Assumption Conference and the exception taken (unreasonable assumption) by the Plan Actuary in its Actuarial Valuation report of the Plan as of and for the year ended June 30, Management of the Authority considered this information, as well as the audited financial statements of the FRS Pension Plan and Employer Allocation Reports issued by the Auditor General of the State of Florida as of and for the year ended June 30, 2016, which both contained unmodified opinions and has concluded that the information provided by the Plan for reporting by the cost-sharing employers was reasonable. July 1, 2016 Actuarial Assumptions Compound Annual (Geometric) Asset Class Target Allocation (1) Annual Arithmetic Return Return Target Allocation (1) Cash 1.00 % 3.00 % 3.00 % 1.70 % Fixed Income Global equity Real estate (property) Private Equity Strategic investments Total Assumed Inflation - Mean 2.60 % 1.90 % Note: (1) As outlined in the Plan's investment policy 50
65 Notes to Financial Statements (continued) 7. Pension Plans (continued) July 1, 2015 Actuarial Assumptions Compound Annual (Geometric) Asset Class Target Allocation (1) Annual Arithmetic Return Return Target Allocation (1) Cash 1.00 % 3.20 % 3.10 % 1.70 % Fixed Income Global equity Real estate (property) Private Equity Strategic investments Total % Assumed inflation - Mean 2.60 % 1.90 % Note: (1) As outlined in the Plan's investment policy Discount Rate The discount rate used to measure the total pension liability was 7.60% for 2016 and 7.65% for The Plan's fiduciary net position was projected to be available to make all projected future benefit payments of current active and inactive employees. Therefore, the discount rate for calculating the total pension liability is equal to the long-term expected rate of return. 51
66 Notes to Financial Statements (continued) 7. Pension Plans (continued) Sensitivity of the Authority's Proportionate Share of the Net Position Liability to Changes in the Discount Rate The following presents the Authority's proportionate share of the net pension liability as of June 30, 2016 as calculated using the discount rate of 7.60%, as well as what the Authority's proportionate share of the net pension liability would be if it were calculated using a discount rate that is 1% point lower 6.60% or 1% point higher 8.60% than the current rate for 2016.The Authority's proportionate share of the net pension liability as of June 30, 2015 as calculated using the discount rate of 7.65%, as well as what the Authority's proportionate share of the net pension liability would be if it were calculated using a doscount rate that is 1% point lower, 6.65% or 1% point higher 8.65% than the rate for (dollar amounts in thousands) % Decrease Current Discount Rate 1% Increase 1% Decrease Current Discount Rate 1% Increase 6.60% 7.60% 8.60% 6.65% % Authority's proportionate share of the net pension liability $ 26,017 $ 14,132 $ 4,238 $ 18,034 $ 6,960 $ (2,256) Pension Plan Fiduciary Net Position Detailed information about the Plan's fiduciary net position is available in the separately issued FRS Pension Plan and Other State Administered Systems Comprehensive Annual Financial Report. The Retiree Health Insurance Subsidy Program (HIS) Plan Description The Retiree Health Insurance Subsidy Program (HIS Plan) is a cost-sharing multiple-employer defined benefit pension plan established under section , Florida Statutes and may be amended by the Florida Legislature at any time. The benefit is a monthly payment to assist retirees of the Stateadministered retirement systems in paying their health insurance costs and is administered by the Division of Retirement within the Florida Department of Management Services, Division of Retirement. 52
67 Notes to Financial Statements (continued) 7. Pension Plans (continued) Benefits Provided For the fiscal year ended September 30, 2016 and 2015, eligible retirees and beneficiaries received a monthly HIS payment of $5 for each year of creditable service completed at the time of retirement with a minimum HIS payment of $30 and a maximum HIS benefit of $150 per month, pursuant to Section , Florida Statutes. To be eligible to receive a HIS Plan benefit, a retiree under a Stateadministered retirement system must provide proof of health insurance coverage, which may include Medicare. Contributions The HIS Plan is funded by required contributions from FRS participating employers as set by the Florida Legislature. Employer contributions are a percentage of gross compensation for all active FRS members. For the fiscal year ended June 30, 2016 and 2015, the contribution rate was 2.22% and 1.66% of payroll pursuant to section , Florida Statues. The Authority contributed 100% of its statutorily required contributions for the current and preceding three years. The HIS Plan contributions are deposited in a separate trust fund from which payments are authorized. The HIS Plan benefits are not guaranteed and are subject to annual legislative appropriation. In the event the legislative appropriation or available funds fail to provide full subsidy benefits to all participants, benefits may be reduced or canceled. Pension Liabilities, Pension Expenses, and Deferred Outflows of Resources and Deferred Inflows of Resources Related to Pensions. At September 30, 2016 and 2015, the Authority reported a net pension liability of $6.46 and $5.38 million for its proportionate share of the HIS Plan's net pension liability. The net pension liability was measured as of June 30, 2016 and 2015, and the total pension liability used to calculate the net pension liability was determined by an actuarial valuation as of July 1, 2016 and The Authority's proportionate share of the net pension liability was based on the Authority's 2016 and 2015 fiscal year contributions relative to the total 2016 and 2015 fiscal year contributions of all participating members. At June 30, 2016 and 2015, the Authority's proportionate share was %, and % which was an increase of % from its proportionate share measured as of June 30, 2015, and an increase of % from its proportionate share measured as of June 30,
68 Notes to Financial Statements (continued) 7. Pension Plans (continued) For the fiscal year ended September 30, 2016 and 2015, the Authority recognized pension expense of $ and $ thousand related to the HIS Plan. In addition, the Authority reported deferred outflows of resources and deferred inflows of resources related to pensions from the following sources: Deferred Outflows of Resources (dollar amounts in thousands) Deferred Deferred Inflows of Outflows of Resources Resources Deferred Inflows of Resources Description Differences between expected and actual experience $ - $ (15) $ - $ - Change of assumptions 1, Net difference between projected and actual earnings on FRS HIS investments Changes in proportion and differences between Authority's FRS contributions and proportionate share of contributions Authority's contributions subsequent to the measurement date Total $ 1,478 $ (15) $ 693 $ - For fiscal years ended September 30, 2016 and 2015 deferred outflows of resources related to pensions, totaling $81.00 and $74.00 thousand, resulting from Authority contributions to the HIS Plan subsequent to the measurement date will be recognized as a reduction of the net pension liability in the fiscal year ended September 30, 2017 and Other amounts reported as deferred outflows of resources and deferred inflows of resources related to pensions will be recognized in pension expense as follows: (dollar amounts in thousands) Deferred Outflow/(Inflo Fiscal Year Ending September 30 ws) Net 2017 $ Thereafter
69 Notes to Financial Statements (continued) 7. Pension Plans (continued) Actuarial Assumptions The total pension liability in the July 1, 2016 and 2015, actuarial valuations, for the HIS Plan, was determined using the following actuarial assumptions, applied to all periods include in the measurement: Inflation 2.60% 2.60% Salary increases 3.25% 3.25% Investment rate of return 2.85% 3.80% Mortality rates were based on the Generational RP-2000 with Projected Scale BB. The actuarial assumptions used in the July 1, 2016 valuation were based on the results of the actuarial experience study for the period July 1, 2010, through June 30, Discount Rate The discount rate used to measure the total pension liability relating to the HIS Plan were 2.85% and 3.80% for 2016 and In general, the discount rate for calculating the total pension liability is equal to the single rate equivalent to discounting at the long-term expected rate of return for benefit payments prior to the projected depletion date. Because the HIS benefit is essentially funded on a pay-as-you-go basis, the depletion date is considered to be immediate, and the single equivalent discount rate is equal to the municipal bond rate selected by the HIS Plan sponsor. The Bond Buyer General Obligation 20-Bond Municipal Bond Index as adopted as the applicable municipal bond index. Sensitivity of the Authority's Proportionate Share of the Net Pension Liability to Changes in the Discount Rate The following presents the Authority's proportionate share of the net pension liability, for the HIS Plan, calculated using the discount rate of 2.85% and 3.80% for 2016 and 2015, as well as what the Authority's proportionate share of the net pension liability would be if it were calculated using a discount rate that is 1% point lower or 1 % point higher than the current rate. (dollar amounts in thousands) % Decrease Current Discount Rate 1% Increase 1% Decrease Current Discount Rate 1% Increase 1.85% 2.85% 3.85% 2.80% 3.80% 4.80% Authority's proportionate share of the net pension liability $ 7,412 $ 6,460 $ 5,671 $ 6,127 $ 5,377 $ 4,752 55
70 Notes to Financial Statements (continued) 7. Pension Plans (continued) Pension Plan Fiduciary Net Position Detailed information about the HIS Plan's fiduciary net position is available in the separately issued FRS Pension Plan and Other State Administered Systems Comprehensive Annual Financial Report. FRS - Defined Contribution Pension Plan The SBA administers the defined contribution plan officially titled the FRS Investment Plan (Investment Plan). The Investment Plan is reported in the SBA s annual financial statements and in the State of Florida Comprehensive Annual Financial Report. As provided in Section , Florida Statutes, eligible FRS members may elect to participate in the Investment Plan in lieu of the FRS defined benefit plan. Authority employees participating in DROP are not eligible to participate in the Investment Plan. Employer and employee contributions, including amounts contributed to individual member s accounts, are defined by law, but the ultimate benefit depends in part on the performance of investment funds. Benefit terms, including contribution requirements, for the Investment Plan are established and may be amended by the Florida Legislature. The Investment Plan is funded with the same employer and employee contribution rates that are based on salary and membership class (Regular Class, Elected County Officers, etc.), as the FRS defined benefit plan. Contributions are directed to individual member accounts, and the individual members allocate contributions and account balances among various approved investment choices. Costs of administering plan, including the FRS Financial Guidance Program, are funded through an employer contribution of 0.04% of payroll and by forfeited benefits of plan members. For all membership classes, employees are immediately vested in their own contributions and are vested after one year of service for employer contributions and investment earnings. If an accumulated benefit obligation for service credit originally earned under the FRS Pension Plan is transferred to the Investment Plan, the member must have the years of service required for FRS Pension Plan vesting (including the service credit represented by the transferred funds) to be vested for these funds and the earnings on the funds. Nonvested employer contributions are placed in a suspense account for up to five years. If the employee returns to FRS-covered employment within the five-year period, the employee will regain control over their account. If the employee does not return within the five-year period, the employee will forfeit the accumulated account balance. For the fiscal year ended September 30, 2016, the information for the amount of forfeitures was unavailable from the SBA; however, management believes that these amounts, if any, would be immaterial to the Authority. 56
71 Notes to Financial Statements (continued) 7. Pension Plans (continued) After termination and applying to receive benefits, the member may rollover vested funds to another qualified plan, structure a periodic payment under the Investment Plan, receive a lump-sum distribution, leave the funds invested for future distribution, or any combination of these options. Disability coverage is provided; the member may either transfer the account balance to the FRS Pension Plan when approved for disability retirement to receive guaranteed lifetime monthly benefits under the FRS Pension Plan, or remain in the Investment Plan and rely upon that account balance for retirement income. The Authority s Investment Plan pension expense totaled $337,201 for the fiscal year ended September 30, 2016, and $287,691 for the fiscal year ended September 30, Deferred Compensation Plans The Authority offers its employees a deferred compensation plan (the 457 Plan) created in accordance with IRS Code Section 457. The 457 Plan, which is available to all full-time employees, permits employees to defer a portion of their salary until future years. The deferred compensation is not available to employees until termination, retirement, death, or unforeseeable emergency. Investments are managed by the 457 Plan s trustee under one of several investment options, or a combination thereof. The choice of the investment option(s) is made by the participant. All 457 Plan assets are held by trustees for the exclusive benefits of participants and beneficiaries. Thus, the assets and liabilities relating to the 457 Plan are not reflected on the Authority s statements of net position. The Authority also offers its employees a deferred compensation plan (the 401(a) Plan), created in accordance with the IRS Code Section 401(a). The Authority contributes a specified amount for each dollar the employee defers to the 401(a) Plan. All 401(a) Plan assets are held by trustees for the exclusive benefit of participants and beneficiaries. Thus, the assets and liabilities of the 401(a) Plan are not reflected on the Authority's Statement of Net Position. 57
72 Notes to Financial Statements (continued) 9. Postretirement Health and Other Benefits Plan Description The Authority provides medical, dental, vision and life insurance benefits for eligible retirees and their dependents under a single-employer defined benefit healthcare plan administered by the Authority. An employee is eligible to receive benefits from the plan upon retirement under FRS plan provisions. To be eligible for retiree benefits, the employee must be covered under the medical plan as an active participant immediately prior to retirement. Participants who are not eligible for retirement at the time of their termination are not eligible for immediate or future benefits from the plan. Retirees opting to participate are asked to pay a premium amount that is equal to the cost to provide insurance coverage to retirees. The premium amount retirees pay is a blended rate for covering both active and retired Plan members. The fact that the blended rate retirees pay is less than the cost of covering retired members and their beneficiaries results in an implicit rate subsidy by the Authority, which gives rise to the benefit. Retiree and spousal coverage is provided for the lifetime of the participants. However, benefits are valued as payable only until age 65, as the option of enrolling in Medicare is a much more attractive option at a lower cost. The Authority is required to value their postretirement health and other benefits biennially. The most recent actuarial valuation date was fiscal year ended September 30, Due to the small amounts involved, vision benefits are not included in the valuation. Life insurance benefits are provided on a fully insured basis and are provided by unsubsidized retiree contributions. As such, life insurance benefits are not included in the valuation. Funding Policy The contribution requirements of plan members and the Authority are established by the Authority. The required contribution is based on a projected pay-as-you-go financing requirement. The Authority has not established an OPEB trust fund to accumulate assets to fund Plan obligations and has no statutory or contractual obligation to fund the Plan. Plan members are required to pay 100% of the premium for the plans selected. Monthly premium amounts vary depending on the plans selected and choice of coverage for employee only or employee plus spouse. 58
73 Notes to Financial Statements (continued) 9. Postretirement Health and Other Benefits (continued) Annual OPEB Cost and Net OPEB Obligation The Authority s OPEB cost is calculated based on the annual required contribution (ARC) of the employer and amount actuarially determined in accordance with the parameters of GASB Statement 45. The ARC represents a level of funding that, if paid on an ongoing basis, is projected to cover normal cost each year and amortize any unfunded actuarial liability, or funding excess, over a period not to exceed thirty years. The following table shows the components of the Authority s annual OPEB cost for the fiscal years 2016 and 2015, the amount actually contributed to the plan, and changes in the Authority s net OPEB obligation. The annual OPEB cost decreased in fiscal year 2014 due to changes in assumptions used for post retirement benefits after the age of 65. The net OPEB obligation of $2.10 and $2.02 million is recorded as a long-term liability in the statements of net position for fiscal years 2016 and 2015, respectively. (dollar amounts in thousands) Determination of Annual Required Contribution Normal cost at year end $ 133 $ 72 Amortization of UAAL Annual required contribution (ARC) $ 231 $ 131 Determination of net OPEB obligation Annual required contribution $ 231 $ 131 Interest on prior year net OPEB obligation Adjustment to ARC (195) (229) Annual OPEB cost $ 117 $ (15) Contributions made* (Decrease) Increase in net OPEB obligation $ 82 $ (59) Net OPEB obligation - beginning of year 2,018 2,077 Net OPEB obligation - end of year $ 2,100 $ 2,018 *Assuming no additional funding, employer contributions will be equal to the net expected employer benefit payments (gross benefit cost offset by the retiree's contributions) during the and fiscal year. GASB 45 defines contributions for this purpose to be actual benefit payments during the year plus contributions, if any, made to a separate, irrevocable trust. 59
74 Notes to Financial Statements (continued) 9. Postretirement Health and Other Benefits (continued) The following table shows the annual OPEB cost and net OPEB obligation at September 30, 2016, 2015 and (dollar amounts in thousands Percentage of Fiscal Year Ended Annual OPEB Cost Authority Contribution OPEB Cost Contributed Net OPEB Obligation 9/30/2016 $ 117 $ % $ 2,100 9/30/2015 (15) 44 (293.33) 2,018 9/30/2014 (19) 37 (194.74) 2,077 Funded Status and Funding Progress As of September 30, 2016 and September 30, 2015 the plan was not funded. The actuarial accrued liability (AAL) for benefits was $1.70 and $1.02 million for 2016 and 2015, respectively. The actuarial value of assets for both 2016 and 2015 was zero, resulting in an unfunded actuarial accrued liability (UAAL) of $1.70 and $1.02 million in 2016 and For fiscal years 2016 and 2015 the covered payroll (annual payroll of active employees covered by the plan) was $17.45 and $16.11 million, respectively. The ratio of the UAAL to the covered payroll was 9.74% for 2016 and 6.33% for Actuarial valuations of an ongoing plan involve estimates of the value of reported amounts and assumptions about the probability of occurrences of events far into the future. Examples are assumptions about future employment, mortality, and the healthcare cost trend. Amounts determined regarding the funded status of the plan and the annual required contributions of the employer are subject to continual revision as actual results are compared with past expectations and new estimates are made about the future. The schedule of funding progress, presented as required supplementary information following the notes to the financial statements, presents the most recent actuarial valuation date of September 30, 2016 and September 30, 2015 relating to the actuarial accrued liability. Actuarial Methods and Assumptions Projections of benefits for financial reporting purposes are based on the substantive plan (the plan as understood by the employer and the plan members) and included the types of benefits provided at the time of valuation and the historical pattern of sharing of benefit costs between the employer and plan members at that point. The actuarial methods and assumptions used include techniques that are designed to reduce the effects of short-term volatility in actuarial accrued liabilities and actuarial value of assets, consistent with long-term perspective of the calculations. 60
75 Notes to Financial Statements (continued) 9. Postretirement Health and Other Benefits (continued) The fiscal years 2016 and 2015 actuarial valuations were computed using the projected unit credit actuarial cost method, which consists of the following components: (1) the normal cost is the actuarial present value of benefits allocated to the valuation year (with the allocation period being from date of hire to date of retirement); (2) the actuarial liability is the actuarial present value of benefits accrued as of the valuation date; (3) the amortization of the actuarial liability is a level dollar amount over a closed period of 30 years; (4) valuation assets are equal to the market value of assets as of the valuation date, if any; and (5) unfunded actuarial liability is the difference between the actuarial liability and the valuation assets. Since the plan is unfunded there is no assumption of investment return. Because benefits are not based on payroll no assumptions are made for salary increases. The actuarial liability is amortized over the maximum permissible period under GASB 45 of 30 years. There are 22 years remaining. It should be noted that GASB 45 allows a variety of cost methods to be used. The Authority elected the unit credit actuarial cost method because it is generally easy to understand and is widely used for the valuation of postemployment benefits other than pensions. Other methods used do not change the ultimate liability, but do allocate it differently between what has been earned in the past and what will be earned in the future. In addition to the actuarial method used, actuarial cost estimates depend to an important degree on the assumptions made relative to various occurrences, such as rate of expected investment earnings by the fund, rates of mortality among active and retired employees, rates of termination from employment, and retirement rates. The Authority used demographic assumptions provided by the pension actuary for the Florida Retirement System under which employees are covered. The September 30, 2016 and 2015 costs and liabilities were determined using the following assumptions: (1) discount rate of 4.0% per annum, compounded annually; (2) pre-retirement mortality rates and postretirement mortality rates were based on the sex-distinct RP-2000 generational mortality table; (3) assumptions regarding withdrawal rates, retirement rates, disability, marriage assumptions, participation levels and retiree claim costs can be found in the detailed actuarial valuation report; (4) assumed medical care cost trend rates of 10.00% and 10.00%, for fiscal year 2016 and Future years are estimated by adjusting the starting claim costs by an assumed ongoing cost trend, resulting in an ultimate rate of 5.00% for fiscal year 2016 assumptions and 5.00% for fiscal year 2015 assumptions; (5) as the plan is unfunded, no assumptions have been made regarding investment returns; (6) the plan is not related to salaries, therefore no assumptions have been made regarding projected salary increases. The Authority does not have a separate audited GAAP-basis postemployment benefit plan report available for the defined benefit plan. The Authority does have an Actuarial Valuation of Postretirement Benefits under GASB 45 report. For additional information about this report, or if you need additional information, please contact Chief Financial Officer, Pecan Park Road, Jacksonville, FL
76 Notes to Financial Statements (continued) 10. Long-Term Indebtedness A summary of changes to long-term indebtedness follows: (dollar amounts in thousands) 2015 Balance Increases Decreases 2016 Balance Due Within One Year Revenue bonds $ 50,530 $ - $ 50,530 $ - $ - Revenue refunding notes 87,350 26,500 11, ,740 9,075 Total 137,880 26,500 61, ,740 9,075 Less amounts due within one year (12,020) (9,075) Total long term portion 125,860 93,665 Unamortized bond premium Total long term bonds and notes payable $ 126,688 $ 26,500 $ 62,468 $ 93,665 (dollar amounts in thousands) October 1, 2014 Balance Increases Decreases September 30, 2015 Balance Due Within One Year Revenue bonds $ 53,265 $ - $ 2,735 $ 50,530 $ 2,910 Revenue refunding notes 97,380-10,030 87,350 9,110 Total 150,645-12, ,880 12,020 Less amounts due within one year (11,765) (12,020) Total long term portion 138, ,860 Unamortized bond premium Total long term bonds and notes payable $ 139,783 $ - $ 12,840 $ 126,688 62
77 Notes to Financial Statements (continued) 10. Long-Term Indebtedness (continued) 2006 Airport Revenue Bonds On October 11, 2006, revenue bonds Series 2006 (AMT) were issued in the amount $ million. They were issued in fully registered form in initial denominations of $5,000 or any integral multiple thereof at a fixed rate of interest between 4.4% and 5%. The purpose of the 2006 bonds were for financing the costs of acquisition, construction and installation of capital improvements to JIA, paying the cost of a municipal bond insurance policy, funding a portion of the reserve requirement and paying issuance costs. Concurrently with the issuance of the 2006 bonds, Ambac Assurance Company issued its municipal bond insurance policy for the 2006 bonds. The policy guarantees the scheduled principal payment and interest on the 2006 bonds when due. Moody s, S&P and Fitch assigned underlying ratings of A2, A and A, respectively, to the 2006 bonds. On July 5, 2016 the Authority defeased the remaining balance on the 2006 Airport Revenue Bonds. Principal and interest defeased were $47.62 million and $1.17 million, respectively. The original maturity date of October 2027 was shortened due to the refinancing of the bond. Proceeds to pay off the bonds came from the 2016 revenue note and Authority funds. 63
78 Notes to Financial Statements (continued) 10. Long-Term Indebtedness (continued) 2008 Compass Note On April 1, 2008 a note was issued from Compass Bank (Compass) in the amount of $41.49 million. The purpose of the note was to refund the 2005 airport revenue refunding bonds, pay a portion of the 2005 swap termination fee and pay issue costs. The note has a variable interest rate of 65% of 1-month LIBOR plus basis points (0.6435%). The annual interest rate at September 30, 2016 was 0.772%. Payments of the long-term outstanding note will require the following principal and interest payments based on the amounts outstanding at September 30, 2016 and the fixed interest rate of 3.412%: (dollar amounts in thousands) Year Ending September 30, Principal Interest Total 2017 $ 2,485 $ 835 $ 3, , , , , , , , , , ,264 Total $ 25,710 $ 4,146 $ 29,856 64
79 Notes to Financial Statements (continued) 10. Long-Term Indebtedness (continued) 2012 Revenue Refunding Note On December 4, 2012 a revenue refunded note was issued from TD Bank, National Association in the amount of $48.47 million. The purpose of the note was a partial refunding of the 2006 bonds, series 2031, 2033 and The Authority refunded a portion of the bonds in order to take advantage of favorable interest rates and reduce interest expense. This refunding resulted in a present value economic gain of $24.15 million. The note has a fixed interest rate of 1.73%. The Authority paid $167 thousand of issuance cost for the 2012 revenue refunding note. The aggregate difference in debt service is a reduction of $45.09 million. Payments of the long-term outstanding note will require the following principal and interest payments based on the amounts outstanding at September 30, 2016: (dollar amounts in thousands) Year Ending September 30, Principal Interest Total 2017 $ 1,525 $ 712 $ 2, , , , , , , , , , ,128 Total $ 41,890 $ 4,157 $ 46,047 65
80 Notes to Financial Statements (continued) 10. Long-Term Indebtedness (continued) 2013 Revenue Refunding Note On July 10, 2013 a revenue refunding note was issued from Sabadell United Bank, N.A. (Sabadell) in the amount of $20.00 million. The purpose of the note was to refund the 2003 A-1 and A-2 bonds. The note has a fixed rate of.85%. The net proceeds of $20.00 million, plus an additional $6.22 million, for a total of $26.22 million, were deposited in an irrevocable escrow account to provide for the full in-substance defeasance of the 2003 A-1 and A-2 revenue bonds. The refunding resulted in a present value interest savings $15.33 million. The result was an in-substance defeasance of the 2003 A-1 and A-2 bonds. Payments of the long-term outstanding note will require the following principal and interest payments based on the amounts outstanding at September 30, 2016: (dollar amounts in thousands) Year Ending September 30, Principal Interest Total 2017 $ 5,640 $ 49 $ 5, , ,013 Total $ 8,640 $ 62 $ 8,702 66
81 Notes to Financial Statements (continued) 10. Long-Term Indebtedness (continued) 2016 Revenue Refunding Note On July 5, 2016 a revenue refunding note was issued from Bank United in the amount of $26.5 million. The purpose of the note was to refund the 2006 Revenue bonds. The note has a fixed rate of 1.807%. The net proceeds of of $26.5 million, plus an additional $22.42 million, for a total of $48.92 million, were deposited in an irrevocable escrow account to provide for the full insubstance defeasance of the 2006 revenue bonds. The outstanding balances of September 30, 2016 for the 2006 revenue bonds were principal of $47.62 million and interest of $1.17 million. The present value of the annual savings of the refunding is $6.65 million and the total savings is $9.27 million. The Authority paid $ thousand of issuance cost for the 2016 revenue refunding note. Payments of the long-term outstanding note will require the following principal and interest payments based on the amounts outstanding at September 30, (dollar amounts in thousands) Year Ending September 30, Principal Interest Total 2017 $ - $ 239 $ , , , , , , , , , , , ,124 Total $ 26,500 $ 2,220 $ 28,720 67
82 Notes to Financial Statements (continued) 10. Long-Term Indebtedness (continued) Annual Requirements Annual requirements to repay all outstanding long-term debt as of September 30, 2016 are as follows: 2016 Revenue Refunding Note 2012 Revenue Refunding Note (dollar amounts in thousands) 2013 Revenue Refunding Note Total Principal and Interest Year Ending September 30, 2008 Note Total Principal Total Interest 2017 $ 239 $ 3,320 $ 2,237 $ 5,689 $ 11,485 $ 9,650 $ 1, ,447 3,319 2,210 3,013 11,989 10,090 1, ,006 3,319 2,184-13,509 11,835 1, ,130 3,317 2,157-7,604 6,135 1, ,131 3,317 2,131-7,579 6,265 1, ,643 13,264 35,128-59,035 56,660 2, , ,124 2, $ 28,720 $ 29,856 $ 46,047 $ 8,702 $ 113,325 $ 102,740 $ 10,583 Debt Service Reserve The amount available for debt service consists of resources from the 2006 Debt Service Fund legally required to be used for Debt service until the related debt is extinguished. (dollar amounts in thousands) Restricted for Debt Service $ 10,617 $ 4,605 68
83 Notes to Financial Statements (continued) 10. Long-Term Indebtedness (continued) Interest Rate Swap Agreement between Compass Bank and the On March 18, 2008 the Authority entered into an interest rate swap with Compass as part of a refunding of the Authority s outstanding series 2005 revenue refunding bonds and issuance of the 2008 Compass note. The objective of the swap is to synthetically create a fixed-rate debt. The executed transactions consisted of a new $41.49 million floating-to-fixed matched rate swap effective April 1, 2008 whereby the Authority pays to Compass a fixed rate of % and received from Compass 65% of 1-month LIBOR plus basis points (0.6435%). The fixed rate interest paid and the interest received from Compass are recorded in interest expense on the statements of revenues, expenses and changes in net position. The swap s notional amount of $41.49 million matches the $41.49 million Compass note. The note and the related swap agreement mature on October 1, The Authority received no upfront fees related to the swap transaction executed on March 18, As per the terms of the swap, on behalf of the Authority, an advisory fee of approximately $25 thousand was paid by the Authority to the Financial Advisor, Public Financial Management. This fee was contingent upon completion of the swap transaction. As of September 30, 2016 and 2015 the fair value of the swap was a negative $2.25 million and $2.47 million respectively, which represent the amount the Authority would pay to exit the swap transaction as of that date based on prevailing interest rates. The fair value of the interest rate swap agreement and related hedging instrument is reported in the longterm debt section of the statements of net position. The Authority adopted GASB Statement No. 53, therefore, for effective hedging instruments; hedge accounting is applied where fair value changes are recorded on the statements of net position as either a deferred outflow or a deferred inflow. 69
84 Notes to Financial Statements (continued) 10. Long-Term Indebtedness (continued) The terms of the floating to fixed rate swap agreement outstanding at September 30, 2016, are as follows: Effective date 4/1/2008 Maturity date 10/1/ % (monthly, Swap fixed rate Act/360) 65%* 1-Mo Libor (monthly, Swap variable rate Act/360) basis points Margin (0.6435%) Counterparty Compass The following table includes fiscal year 2016 and 2015 summary information for the Authority s effective cash flow hedge related to the outstanding floating to fixed interest swap agreement which is recorded as a derivative instrument liability and offsetting deferred outflow of resource Compass Note (dollar amounts in thousands) Notional Changes in Fair Value Classification Fair Value Amount Outstanding September 30, 2016 $ 215 Derivative instrument - swap $ (2,251) $ 25,710 September 30, 2015 $ (198) Derivative instrument - swap $ (2,466) $ 28,115 Fair value amounts were calculated using market rates as of September 30, 2016 and 2015 respectively, and standard cash flow present valuing techniques (Level 2 inputs). For fiscal years ended September 30, 2016 and 2015, the weighted average rates of interest for floating to fixed interest rate swap agreement and the total net swap earnings were as follows: 70
85 Notes to Financial Statements (continued) 10. Long-Term Indebtedness (continued) 65% of LIBOR Index: Notional amount outstanding $ 25,710 $ 28,115 Variable rate received (weighted average) % % Fixed rate paid (weighted average) % % Risks Credit Risk: As of September 30, 2016 the Authority is not exposed to credit risk or the risk of economic loss due to a counterparty default on its outstanding swap because the swap had a negative fair value. However, should the interest rates change and the fair values of the swap become positive, the Authority would be exposed to credit risk in the amount of the swap s fair value. Moody s, S&P and Fitch have assigned ratings of Baa2, BBB and BBB, respectively, to Compass. The swap agreement contains varying collateral agreements with the counterparties. The swap requires collateralization of the fair value of the swap should the counterparty s credit rating fall below the applicable thresholds. Interest Rate Risk: The Authority has no interest rate risk associated with the outstanding swap that would adversely affect the Authority s cash flow, since interest paid and received on the swap are based on the same index. The Authority is exposed to interest rate risk as it relates to the fair value of the swap in the event of termination. Basis Risk: The Authority has no basis risk associated with the outstanding swap. The interest rate for the swap interest expense is based on the same index as the interest received from the swap, 65% of the one monthly LIBOR rate plus.6435 basis points. Termination Risk: The Authority or the counterparty may terminate the swap if the other party fails to perform under the terms of the respective contracts. As of September 30, 2016 the swap termination fee had a negative fair value, therefore the Authority would incur additional expenses relating to termination. 71
86 Notes to Financial Statements (continued) 10. Long-Term Indebtedness (continued) Market Access Risk: The Authority is exposed to market access risk due to market disruptions in the municipal bond market that could inhibit the issuing of bonds and relating hedging instruments. Swap Payments and Associated Debt Using rates as of September 30, 2016, the following table summarizes the anticipated net cash flows of the debt service requirements of the Compass note and net swap payments, assuming current interest rates remain the same. As rates vary, bond interest payments and swap payments will vary. (dollar amounts in thousands) Year Ending September 30, Principal Interest Swap, Net Total 2017 $ 2,485 $ 189 $ 646 $ 3, , , , , , , , , , ,265 Total $ 25,710 $ 938 $ 3,208 $ 29, Airline Lease and Use Agreements The Airline Lease and Use Agreement provides for the lease to signatory airlines exclusive use of certain premises, non-exclusive use of certain public use premises in the terminal and in the ramp area and nonexclusive use of the landing area at JIA. This is a residual agreement with a five year term ending on September 30, For the purposes of accounting for costs, expenses and revenues and establishing signatory airline rentals, fees and charges, the airline agreement provides for dividing the airport system into separate cost centers. Certain cost centers are designated direct cost centers and other are designated indirect cost centers. The indirect cost centers are used to accumulate indirect costs which are then allocated to the direct cost centers. Two direct cost centers, the terminal and the airfield, are included in the establishment of rentals, fees and charges for signatory airlines. The remaining cost centers (excluded cost centers) of the airport system are: ground transportation, non-aviation, aviation, JAX Executive at Craig Airport, Herlong Airport, and Cecil Airport. The signatory airlines have no responsibility under the airline agreement for the payments of any costs incurred by the Authority and attributable to the excluded cost centers. 72
87 Notes to Financial Statements (continued) 11. Airline Lease and Use Agreements (continued) Under the residual method, the Airlines agree to pay the cost of running the terminal that are not allocated to other airport users or covered by nonairline sources of revenue. The cost less the revenue associated with the terminal is divided by the airline terminal leased square footage to determine the average rental rate. The residual method guarantees the Authority will break even on the terminal cost center. The airline agreement provides that the aggregate of rentals, fees and charges of all signatory airlines will be sufficient to pay for the net costs attributable to the airfield. The net costs attributable to the airfield are allocated among the signatory airlines on the basis of the landed weight of aircraft and are paid as landing fees. Under the residual method the costs include the satisfaction of all the Authority s obligations to make deposits and payments under the bond resolution which are properly attributable to such areas. The agreement includes an annual guaranteed transfer to the signatory airlines of $11.28 million for each year of the agreement. The guaranteed transfer reduces the cost per enplanement for the airlines. This transfer is distributed to the airlines based on individual airline s percentage of enplanements over total enplanements. 12. Airport Tenant Agreements The Authority has entered into concession agreements with tenants for the use of certain airport facilities including, but not limited to, ready/return rental car parking areas, buildings, terminals, customer service areas, advertising, food and beverage, retail, and on-airport rental cars. Normally, the terms of the agreement include a fixed minimum annual guarantee (MAG) payment to the airport as well as additional contingent payments based on the tenants annual sales volume of business. Revenues exceeded the MAG amounts due in 2016 of $13.30 million by $2.70 million. Some of the agreements provide for a periodic review and re-determination of the payment amounts. 73
88 Notes to Financial Statements (continued) 12. Airport Tenant Agreements (continued) Minimum future rental income for each of the next five years and thereafter, excluding contingent amounts on non-cancelable operating leases at September 30, 2016 as follows: (dollar amounts Year in thousands) 2017 $ 45, , , , , , , , , , Thereafter 3,920 $ 184,712 The signatory airline agreements are renegotiated at the end of their term. The current signatory agreement expires September 30,
89 Notes to Financial Statements (continued) 13. Capital Contributions The Authority receives, on a reimbursement basis, grants from the State of Florida and the U.S. Government for certain capital construction projects through the Airline Improvement Program. As a recipient of state and federal financial assistance, the Authority is responsible for maintaining an internal control structure that ensures compliance with all laws and regulations related to this program. This program is subject to federal and state audit. Total federal and state grant capital contributions were $21.76 million and $16.53 million respectively, for the years ended September 30, 2016 and Management estimates that no material disallowance will result from such audits. The Authority received federal and state grants for the capital programs for the years ended September 30, 2016 and 2015 as summarized in the table below. (dollar amounts in thousands) Capital Programs: State grants for construction $ 777 $ 8,564 Federal grants for construction 1,814 4,936 TSA grants for construction 11,214 2,580 Other contributions for construction 7, $ 21,761 $ 16,526 The Authority receives federal and state grants in support of its capital construction program. The federal program provides funding for airport development, airport planning and other eligible programs for the airports and airways trust funds in the form of entitlement and discretionary grants for eligible projects. The State also provided discretionary funds for capital programs. Funds approval and payment are contingent upon annual legislative appropriation. Grants for capital asset acquisition, facility development, rehabilitation of facilities and long-term planning are reported in the statements of revenues, expense and changes in net position as capital contributions. 75
90 Notes to Financial Statements (continued) 14. Operating Grants The Authority received TSA funds for the operating programs for years ended September 30, 2016 and 2015 as summarized in the tables below. (dollar amounts in thousands) Year ended September Operating programs: TSA K-9 Federal programs $ 318 $ 369 The TSA K-9 program funds are awarded based on expenses of training, caring for and working with the explosive device detection dogs. Grants for operating programs for the year ended September 30, 2016 and 2015 are reported in the statements of revenues, expenses and changes in net position as non-operating revenue. 15. Payments to City of Jacksonville During fiscal years 2016 and 2015, the Authority paid approximately $4.93 million and $4.22 million to the City for expenses relating to legal, insurance, firefighting and miscellaneous services. 16. Commitments and Contingencies Terminal and Capital Improvement Program As of September 30, 2016 and 2015, the Authority has outstanding contractual commitments for completion of certain capital improvement projects, totaling $9.90 million and $22.46 million of which an estimated $6.00 million and $15.38 million are eligible for partial reimbursement, respectively, from the FAA, State of Florida and Transportation Security Administration. The remaining amount is expected to be funded from existing PFCs, debt instruments and/or future debt issuance, and Authority funds. 76
91 Notes to Financial Statements (continued) 16. Commitments and Contingencies (continued) Concentration of Credit Risk The Authority leases facilities to the airlines under certain leases and/or use agreements and to other businesses under agreements to operate concessions with the airport system. Amounts due from airlines represent approximately 68.87% and 77.71% of accounts receivable for 2016 and 2015, respectively. Airline operating revenues represent approximately 30.93% and 29.73% of total operating revenues for 2016 and 2015, respectively. Revenue received from five major airlines and a leasing company totaled 58.43% and 60.56% of total operating revenues for 2016 and 2015, respectively. This includes 15.15% from Delta Air Lines, 14.95% from American Airlines, and 9.86% from Southwest Airlines Co. in For 2015 Delta was 17.35%, American Airlines was 12.64% and Southwest was 11.32%. Compliance Audits The Authority participates in a number of programs that are fully or partially funded by grants received from other governmental units. Expenditures financed by grants are subject to audit by the appropriate grantor government or agency. If expenditures are disallowed due to noncompliance with grant program regulations, the Authority may be required to reimburse the grantor government or agency. The amount, if any, of expenditures which may be disallowed by the granting government or agency is expected to be immaterial. Litigation The Authority is named as a defendant in lawsuits from time to time. During the fiscal year two lawsuits against the Authority were settled, however at year-end there were no pending lawsuits naming the Authority as a defendant. 17. Risk Management The Authority is exposed to various risks of loss related to torts; theft of, damage to and destruction of assets; error and omissions; injuries to employees, and natural disasters. The Authority participates in the City s experience rated self-insurance plan which provides for auto liability, comprehensive general liability, and workers compensation coverage. The Authority s expense is the premium charge by the City s self-insurance plan. The City has excess coverage for individual workers compensation claims above $1.20 million. 77
92 Notes to Financial Statements (continued) 17. Risk Management (continued) Liability for claims incurred is the responsibility of, and is recorded in, the City s self-insurance plan. The premiums are calculated on a retrospective or prospective basis depending on the claims experience of the Authority and other participants in the City s self-insurance programs. The Authority s workers compensation expense is the premium charged by the City s self-insurance plan. Premium expense in 2016 amounted to $ thousand which included an additional premium expense of $ thousand for excess expenses for the prior year. In 2015 the premium was $4.63 thousand which included a credit refund of $ thousand excess premiums from the The Authority s property insurance premium expenses amounted to $ thousand and $ thousand for the years ended September 30, 2016 and 2015, respectively. The Authority is also a participant in the City s general liability insurance program. General liability insurance premium expense amounted to $73.15 thousand and $44.67 thousand for the years ended September 30, 2016 and As a part of the Authority s risk management program, certain commercial insurance policies are purchased to cover designated exposures and potential loss programs, such as airport, kidnap and pollution liability policies. During the last three years the amounts of settlements did not exceed the insurance coverage. In addition, all tenants and businesses accessing the airport system are required to have commercial insurance coverage naming the Authority as additional insured. 78
93 Required Supplementary Information Schedule of Funding Progress Postretirement Healthcare Benefits unaudited Valuation Date AAL Actuarial Value of Assets (dollar amounts in thousands) UAAL Percent Funded Annual Covered Payroll UAAL as of Percent of Payroll 9/30/2016 $ 1,696 $ - $ 1,696 - % $ 17, % 9/30/2015 $ 1,019 $ - $ 1,019 - % $ 16, % 9/30/2014 $ 1,019 $ - $ 1,019 - % $ 15, % Actuarial liability determined under the projected unit credit cost method AAL - Actuarial accrued liability UAAL - Unfunded actuarial accrued liability The increase in the AAL between 2015 and 2016 pertains to the incorporating of benefits for post 65 year old individuals. 79
94 Required Supplementary Information Schedule of the Authority's Proportionate Share of the Net Pension Liability Florida Retirement System Pension Plan Last Ten Years (unaudited) (dollar amounts in thousands) Authority's proportion of the FRS net pension liability % % % Authority's proportionate share of the FRS net pension liability $ 14,132 $ 6,960 $ 3,147 Authority's covered-employee payroll $ 13,614 $ 12,692 $ 11,907 Authority's proportionate share of the FRS net pension liability as a percentage of its covered-employee payroll % 54.00% 26.43% FRS Plan fiduciary net position as a percentage of the total pension liability 84.88% 92.00% 96.09% Note: The amounts presented for each fiscal year were determined as of Sept. 30th. The schedule is presented to illistrate the requirements of GASB Statement 68. Currently, only data for fiscal years ending June 30, 2014, 2015, and 2016 are available. 80
95 Required Supplemental Information Schedule of Authority's Contributions Florida Retirement System Pension Plan Last Ten Years (unaudited) (dollar amounts in thousands) Contractually required FRS contribution $ 1,553 $ 1,314 $ 1,130 FRS contributions in relation to the contractually required contribution 1,553 1,314 1,130 FRS contribution deficiency (excess) $ - $ - $ - Authority's covered-employee payroll $ 13,614 $ 12,692 $ 11,907 FRS contributions as a percentage of covered-employee payroll 11.41% 10.35% 9.49% Note: The amounts presented for each fiscal year were determined as of Sept. 30th. The schedule is presented to illistrate the requirements of GASB Statement 68. Currently, only data for fiscal years ending June 30, 2014, 2015, and 2016 are available. 81
96 Required Supplemental Information Schedule of Authority's Proportionate Share of the Net Pension Liability Health Insurance Subsidy Pension Plan Last Ten Years September 30, 2016 (unaudited) (dollar amounts in thousands) Authority's proportion of the HIS net pension liability % % % Authority's proportionate share of the HIS net pension liability $ 6,460 $ 5,377 $ 4,758 Authority's covered-employee payroll $ 12,692 $ 15,243 $ 15,109 Authority's proportionate share of the HIS net pension liability as a percentage of its covered-employee payroll 50.90% 35.28% 31.49% HIS Plan fiduciary net position as a percentage of the total pension liability 0.99% 33.61% 31.51% Note: Covered payroll includes the normal cost and unfunded actuarial liability payroll for active Pension Plan and Investment Plan members and the payroll of reemployed reitrees without renewed membership. Note: The amounts presented for each fiscal year were determined as of Sept. 30th. The schedule is presented to illistrate the requirements of GASB Statement 68. Currently, only data for fiscal years ending June 30, 2014, 2015 and 2016 are available. 82
97 Required Supplemental Information Schedule of Authority's Contributions - Health Insurance Subsidy Pension Plan September 30, 2016 (dollar amounts in thousands) Last Ten Years (unaudited) (dollar amounts in thousands) Contractually required HIS contribution $ 325 $ 202 $ 174 HIS contributions in relation to the contractually required HIS contribution HIS contribution deficiency (excess) $ - $ - $ - Authority's covered-employee payroll $ 12,692 $ 15,243 $ 15,109 HIS contributions as a percentage of covered-employee payroll 2.56% 1.33% 1.15% Note: Covered payroll includes the normal cost and unfunded actuarial liability payroll for active Pension Plan members and the payroll of remployed retirees without renewed membership. Note: The amounts presented for each fiscal year were determined as of September 30th. The schedule is presented to illistrate the requirements of GASB Statement 68. Currently, only data for fiscal years ending June 30, 2014, 2015, and 2016 are available. 83
98 This page intentionally left blank


99 Statistical Annual Financial Report Fiscal Year Statistical Jacksonville International Airport Cecil Airport Jacksonville Executive at Craig Airport Herlong Recreational Airport
100 The objectives of the Statistical Section Information The objectives of statistical section information are to provide financial statement users with additional historical perspective, context, and detail to assist in using the information in the financial statements, notes to financial statements, and required supplementary information to understand and assess the Authority s economic condition. Statistical information is presented in the following five categories: Financial Trend Information Assists users in understanding and assessing how the Authority s financial position has changed over time. Revenue Capacity Information Assists users in understanding and assessing the factors affecting the Authority s ability to generate its own source revenue. Debt Capacity Information Assists users in understanding and assessing the Authority s debt burden and its ability to issue additional debt. Demographic and Economic Information Assists users in understanding and assessing the Authority s socioeconomic environment within which it operates and to provide information that facilitates comparisons of financial statement information over time among other airports. Operating Information Provides contextual information about the Authority s operations and resources to assist readers in using financial statement information to understand and assess the Authority s economic condition. 84
101 Changes in Cash and Cash Equivalents Last Ten Fiscal Years (unaudited) (dollar amounts in thousands) Cash flows from operating activities $ 26,018 $ 29,433 $ 22,865 $ 30,980 Cash flows from non-capital financing activities ,157 Cash flows from capital and related financing activities (38,354) (26,828) (15,350) (39,864) Cash flows from investing activities 8,617 (493) 5,616 10,588 Net change in cash and cash equivalents (3,517) 2,365 13,373 2,861 Cash and equivalents, beginning of year 51,945 49,580 36,207 33,346 Cash and equivalents, end of year $ 48,428 $ 51,945 $ 49,580 $ 36,207 Non-cash investing, capital and financing activities Change in fair value of investments $ 468 $ 6 $ (201) $ (404) Capitalized Interest $ (763) $ - $ - $ - Capital assets acquired through contracts payable and accruals $ 2,250 $ 39,787 $ 4,398 $ (816) Grants Receivable $ 4,201 $ 5,889 $ - $ - Source: unaudited financial statements 85
102 Changes in Cash and Cash Equivalents Last Ten Fiscal Years (unaudited) (dollar amounts in thousands) $ 21,739 $ 20,621 $ 20,849 $ 13,512 $ 22,561 $ 29, , (9,782) (29,295) (18,022) (21,141) (32,593) (82,103) 35,705 (1,786) 5,727 (16,776) (4,723) ,194 (9,099) 8,527 (16,037) (23,528) (58,540) 66,717 42,445 33,918 49,955 73, ,023 65,306 $ 33,346 $ 42,445 $ 33,918 $ 49,955 $ 73,483 $ 132,023 $ 156 $ (254) $ 41 $ 76 $ (265) $ (243) $ - $ (83) $ (84) $ (393) $ (1,664) $ (230) $ - $ - $ - $ - $ - $ - $ - $ - $ - $ - $ - $ - 86
103 Principal Operating Revenues, Airline Rates and Charges and Cost Per Enplaned Passenger Years Ended September 30, (unaudited) (dollar amounts in thousands) Concessions Rent-A-Car $ 10,620 $ 10,521 $ 9,861 $ 8,929 $ 9,040 Food & beverage 2,449 2,338 2,139 1,973 1,808 Retail 1,814 1,790 1,715 1,679 1,771 Fuel flowage fees 1,475 1, Other concessions 1,413 1,249 1,263 1,233 1,158 Total concessions 17,771 16,933 15,503 14,361 14,481 Fees & charges Landing fees - signatory 9,577 8,788 8,237 8,835 6,028 Landing fees - non-signatory ,553 Passenger screening - signatory ,440 Passenger screening - non-signatory Security user fees 1,154 1,156 1,092 1,078 1,005 Other fees 3,623 3,231 2,785 2,574 2,817 Total Fees & charges 14,668 13,479 12,189 12,513 13,272 Space & facility rentals Air cargo building Ramp use - signatory Ramp use - non-signatory 1,303 1,892 1, Hangar spaces 5,431 5,136 4,120 3,423 2,805 Terminal space rentals - signatory 9,931 7,648 7,575 8,975 2,826 Terminal space rentals - non-signatory Other lease rentals 8,905 8,489 7,503 6,714 5,925 Total space & facility rentals 26,705 24,608 21,750 21,478 14,179 Parking Economy lots 1, 2 & 3 3,130 3,075 2,942 2,910 2,808 Garages & daily surface lot 15,262 14,512 13,719 13,097 13,016 Other parking Total parking 18,993 18,191 17,256 16,601 16,172 Other revenue Electric Fuel sales Other revenue Total other revenues 1,688 1,795 1,784 1,919 2,313 Total operating revenues $ 79,825 $ 75,006 $ 68,482 $ 66,872 $ 60,417 Signatory airline rates and charges (amounts in full numbers) Gross landing fee (per 1,000 lbs) $ 3.15 $ 2.87 $ 2.80 $ 2.63 $ 2.37 Average annual terminal rent (per sq. ft.) $ $ $ $ $ Enplaned passengers 2,799,587 2,722,032 2,602,821 2,563,570 2,644,059 Cost per enplaned passenger $ - $ 6.13 $ 6.27 $ 6.78 $ 7.46 Source: audited financial statements 87
104 Principal Operating Revenues, Airline Rates and Charges and Cost Per Enplaned Passenger Years Ended September 30, (unaudited) (dollar amounts in thousands) Concessions Rent-A-Car $ 9,053 $ 8,815 $ 9,252 $ 9,456 $ 9,469 Food & beverage 1,776 1,619 1,618 1,850 1,751 Retail 1,731 1,820 1,752 1,442 1,415 Fuel flowage fees Other concessions ,128 1,282 1,329 Total concessions 14,134 13,768 14,423 14,788 14,740 Fees & charges Landing fees - signatory 5,431 4,357 2,548 2,310 4,806 Landing fees - non-signatory 1, ,081 Passenger screening - signatory 1,408 1,185 1,269 1,416 1,337 Passenger screening - non-signatory Security user fees 983 3,415 4,289 4,600 4,693 Other fees 2,944 2,282 2,393 3,178 3,023 Total Fees & charges 12,485 12,283 11,464 12,117 15,176 Space & facility rentals Air cargo building Ramp use - signatory Ramp use - non-signatory Hangar spaces 2,726 2,458 2,736 2,230 2,108 Terminal space rentals - signatory 6,200 5,219 6,851 3,313 5,493 Terminal space rentals - non-signatory Other lease rentals 5,741 5,833 4,921 4,825 4,486 Total space & facility rentals 17,131 15,718 16,524 12,769 14,692 Parking Economy lots 1, 2 & 3 2,793 3,412 3,779 4,238 3,538 Garages & daily surface lot 13,318 11,805 11,964 13,447 13,254 Other parking Total parking 16,398 15,407 15,986 17,956 17,059 Other revenue Electric Fuel sales Other revenue Total other revenues 2,334 2,104 1,513 1,716 2,177 Total operating revenues $ 62,482 $ 59,280 $ 59,910 $ 59,346 $ 63,844 Signatory airline rates and charges (amounts in full numbers) Gross landing fee (per 1,000 lbs) $ 2.06 $ 1.42 $ 1.41 $ 1.07 $ 1.50 Average annual terminal rent (per sq. ft.) $ $ $ $ $ Enplaned passengers 2,783,809 2,777,807 2,813,208 3,058,006 3,167,664 Cost per enplaned passenger $ 6.46 $ 5.30 $ 5.72 $ 5.68 $ 4.88 Source: audited financial statements 88
105 Total Revenues, Expenses and Changes in Net Position Years Ended September 30, (unaudited) (dollar amounts in thousands) Operating revenues: Concessions $ 17,771 $ 16,933 $ 15,504 $ 14,361 $ 14,482 Fees & charges 14,668 13,479 12,189 12,513 13,272 Space & facility rentals 26,705 24,608 21,751 21,478 14,179 Parking 18,993 18,191 17,257 16,601 16,171 Other revenue 1,688 1,794 1,783 1,919 2,313 Total operating revenues 79,825 75,005 68,484 66,872 60,417 Operating expenses: Wages & benefits 25,328 21,579 19,612 20,139 19,014 Services & supplies 14,581 14,537 14,208 14,054 13,755 Repairs & maintenance 2,607 2,097 2,209 1,811 1,978 Promotion, advertising & dues 1,052 2,453 1,672 1, Registration & travel Utilities & taxes 4,855 5,116 5,223 5,255 5,425 Other operating expenses 2,151 1,877 1,682 1,661 1,797 Depreciation and amortization 31,346 28,575 28,951 27,812 27,525 Total operating expenses 82,306 76,547 73,846 72,389 70,650 Operating (loss)/income (2,481) (1,542) (5,362) (5,517) (10,233) Nonoperating revenues: Passenger facility charges 10,983 10,955 10,554 10,310 10,743 Investment income 1, ,037 Payments from primary government Payment from federal & state agencies Contributions from other governments Other revenues 1, ,400 1,180 Total nonoperating revenues 14,139 12,569 11,804 12,792 13,203 Nonoperating expenses: Interest expense 3,946 4,775 5,071 7,273 8,874 Contributions to other governments Other expenses , Total nonoperating expenses 4,390 4,979 6,653 7,511 9,018 Loss before capital contributions 7,268 6,048 (211) (236) (6,048) Capital contributions 21,762 16,526 14,047 11,989 8,347 Change in net position 29,030 22,574 13,836 11,753 2,299 Net position at end of year: Net investment in capital assets 441, , , , ,251 Restricted 15,693 31,646 30,437 27,413 39,093 Unrestricted 49,654 41,001 37,750 44,403 47,248 Total net position $ 506,347 $ 477,317 $ 454,744 $ 453,345 $ 441,592 Source: audited financial statements 89
106 Total Revenues, Expenses and Changes in Net Position Years Ended September 30, (unaudited) (dollar amounts in thousands) Operating revenues: Concessions $ 14,134 $ 13,768 $ 14,423 $ 14,788 $ 14,740 Fees & charges 12,485 12,283 11,464 12,117 15,176 Space & facility rentals 17,131 15,718 16,524 12,769 14,692 Parking 16,398 15,406 15,985 17,956 17,058 Other revenue 2,334 2,104 1,513 1,716 2,177 Total operating revenues 62,482 59,279 59,909 59,346 63,843 Operating expenses: Wages & benefits 18,390 16,862 16,833 17,405 16,336 Services & supplies 13,355 12,332 11,671 12,438 12,000 Repairs & maintenance 1,981 2,200 2,085 2,590 2,454 Promotion, advertising & dues Registration & travel Utilities & taxes 5,534 5,259 5,973 4,723 3,571 Other operating expenses 1,743 1,549 1,833 2,788 2,287 Depreciation and amortization 30,753 30,394 30,284 26,273 23,880 Total operating expenses 72,782 69,319 69,496 67,151 61,316 Operating (loss)/income (10,300) (10,040) (9,587) (7,805) 2,527 Nonoperating revenues: Passenger facility charges 11,195 11,329 11,506 12,398 13,130 Investment income 981 1,549 3,312 6,037 10,992 Payments from primary government Payment from federal & state agencies Contributions from other governments Other revenues Total nonoperating revenues 12,894 14,447 15,094 18,691 24,341 Nonoperating expenses: Interest expense 9,330 9,369 10,191 10,226 13,569 Contributions to other governments , Other expenses ,463 1, Total nonoperating expenses 9,496 9,597 21,654 12,114 13,795 Loss before capital contributions (6,902) (5,190) (16,147) (1,228) 13,073 Capital contributions 9,502 10,011 16,132 20,442 23,600 Change in net position 2,600 4,821 (15) 19,214 36,673 Net position at end of year: Net investment in capital assets 349, , , , ,911 Restricted 39,875 39,495 34,406 32,793 38,323 Unrestricted 49,727 44,934 38,221 40,781 37,439 Total net position $ 439,293 $ 436,693 $ 431,872 $ 431,887 $ 412,673 Source: audited financial statements 90
107 Principal Revenue Payers Year Ended September 30, (unaudited) 2016 Amount % Of Revenue (dollar amounts in thousands) 2015 % Of Amount Revenue 2014 Amount % Of Revenue Delta Air Lines $ 12, % $ 13, % $ 12, % American Airlines 11, % 9, % 4, % Southwest Airlines Co. 7, % 8, % 9, % United Airlines 5, % 5, % 4, % Enterprise Leasing Company 4, % 4, % 3, % JetBlue 4, % 4, % 3, % Host International Inc. 2, % 2, % 2, % Hertz Corporation, The 2, % 2, % 2, % Avis Rent A Car 2, % 2, % - - % Budget Rent a Car System, Inc 2, % 2, % - - % US Airways Group, Inc. - - % 3, % 7, % U.S General Services Administration - - % - - % 2, % DTG Operations - - % - - % - - % Paradies Shops - - % - - % - - % Vanguard Car Rental USA Inc. - - % - - % - - % Federal Express Corporation - - % - - % - - % Continental Airlines - - % - - % - - % Signature Flight Support Corp - - % - - % - - % Total Principal Revenue Payers $ 56, % $ 58, % $ 52, % Total operating revenues $ 79, % $ 75, % $ 68, % Source: Records 91
108 Principal Revenue Payers Year Ended September 30, (unaudited) 2013 Amount % Of Revenue (dollar amounts in thousands) 2012 % Of Amount Revenue 2011 Amount % Of Revenue Delta Air Lines $ 11, % $ 8, % $ 7, % American Airlines 4, % 2, % 2, % Southwest Airlines Co. 9, % 6, % 5, % United Airlines - - % - - % - - % Enterprise Leasing Company - - % - - % 1, % JetBlue 2, % 2, % - - % Host International Inc. 2, % 2, % 1, % Hertz Corporation, The 2, % 2, % 2, % Avis Rent A Car 1, % 1, % 1, % Budget Rent a Car System, Inc - - % - - % - - % US Airways Group, Inc. 6, % 4, % 4, % U.S General Services Administration - - % - - % - - % DTG Operations 1, % - - % 1, % Paradies Shops 1, % 1, % - - % Vanguard Car Rental USA Inc. - - % 2, % 2, % Federal Express Corporation - - % - - % - - % Continental Airlines - - % - - % - - % Signature Flight Support Corp - - % - - % - - % Total Principal Revenue Payers $ 44, % $ 33, % $ 31, % Total operating revenues $ 66, % $ 60, % $ 62, % Source: Records 92
109 Principal Revenue Payers Year Ended September 30, (unaudited) 2010 Amount % Of Revenue 2009 Amount (dollar amounts in thousands) % Of 2008 Revenue Amount % Of Revenue 2007 Amount % Of Revenue Delta Air Lines $ 3, % $ 3, % $ 3, % $ 3, % American Airlines - - % - - % 1, % - - % Southwest Airlines Co. 3, % 2, % 3, % 3, % United Airlines - - % - - % - - % - - % Enterprise Leasing Company - - % - - % - - % - - % JetBlue - - % - - % - - % - - % Host International Inc. 1, % 2, % 2, % 2, % Hertz Corporation, The 2, % 2, % 2, % 2, % Avis Rent A Car 2, % 2, % 2, % 2, % Budget Rent a Car System, Inc 1, % - - % 1, % 1, % US Airways Group, Inc. 2, % 2, % 2, % 2, % U.S General Services Administration - - % - - % - - % - - % DTG Operations - - % - - % - - % - - % Paradies Shops 1, % 1, % 1, % - - % Vanguard Car Rental USA Inc. 2, % 2, % 2, % 2, % Federal Express Corporation 1, % 2, % 2, % 2, % Continental Airlines - - % 1, % 1, % 1, % Signature Flight Support Corp - - % - - % % - - % Total Principal Revenue Payers $ 23, % $ 22, % $ 27, % $ 24, % Total operating revenues $ 59, % $ 59, % $ 59, % $ 63, % Source: Records 93
110 Ratio of Annual Bond Debt Service to Total Expenses Excluding Depreciation Years Ended September 30, (unaudited) Fiscal Year Principal (1) Interest (dollar amounts in thousands) Total Debt Service Total Expenses Other than Depreciation Ratio of Debt Service to Expenditures 2016 $ 12,020 $ 3,946 $ 15,966 $ 50, % ,765 4,775 16,540 47, ,390 5,071 11,461 45, ,220 7,273 17,493 44, ,775 8,733 18,508 43, ,400 6,528 15,928 32, ,005 9,369 18,374 38, ,335 9,396 16,731 39, ,475 11,911 19,386 40, ,228 13,060 20,288 37, Note 1: The principal amounts reflect the normal debt service requirements for the year. Source: Records 94
111 Debt Service Coverage Last Ten Fiscal Years (unaudited) (dollar amounts in thousands) Revenues: Concessions $ 17,771 $ 16,933 $ 15,504 $ 14,361 Fees & charges 14,668 13,479 12,189 12,513 Space & facility rentals 26,705 24,608 21,751 21,478 Parking 18,993 18,191 17,257 16,601 Other revenue 1,688 1,794 1,783 1,919 Interest income 1, Transfers-signatory airline agreement Transfers-PFC Series 2006, ,091 8,073 7,115 6,124 Total revenues and transfers 89,367 84,004 76,266 73,655 Less: Operating and maintenance expenses (excluding depreciation and expenses associated with payments from other governments) 50,960 47,972 44,895 44,577 Net operating revenues 38,407 36,032 31,371 29,078 Revenue bond service charges for: Series 2016 note Series 2013 note 6,253 5, Series 2012 note (PFC backed) 3,258 3,302 2, Series 2008 note 3,302 3,297 3,298 3,301 Series 2006 bonds (PFC backed) 5,251 5,221 5,243 5,843 Series 2005 RR bonds Series 2003B-1 bonds (PFC backed) Series 2003B-1 bonds Series 2003A bonds ,156 Series 2000 bonds Total revenue bond service charges $ 18,178 $ 17,126 $ 11,048 $ 17,030 Revenue bond service coverage Required bond service coverage Total enplanements 2,800 2,722 2,603 2,564 Debt per enplanement $ 6.49 $ 6.29 $ 4.24 $ 6.64 Source: Records 95
112 Debt Service Coverage Last Ten Fiscal Years (unaudited) (dollar amounts in thousands) $ 14,482 $ 14,134 $ 13,768 $ 14,423 $ 14,788 $ 14,740 13,272 12,485 12,283 11,464 12,117 15,176 14,179 17,131 15,718 16,524 12,769 14,692 16,171 16,398 15,406 15,985 17,956 17,058 2,313 2,334 2,104 1,513 1,716 2,177 1, ,549 2,773 6,037 10,992 3,750 4,667 5,041 4,397 8,872 5,984 7,175 7,541 7,548 7,334 7,861 41,264 72,379 75,671 73,417 74,413 82, ,083 43,125 42,029 38,925 39,212 40,878 37,436 29,254 33,642 34,492 35,201 41,238 84, ,302 3,319 3,317 1,960 1,209-7,673 7,875 7,815 7,554 7,861 5, ,945 4, , ,966 7,174 7,182 7,238 7,217 7,231 7, $ 18,149 $ 18,376 $ 18,370 $ 16,731 $ 18,246 $ 52, ,644 2,784 2,778 2,813 3,058 3,168 $ 6.86 $ 6.60 $ 6.61 $ 5.95 $ 5.97 $ Source: Records 96
113 Debt Service As of September 30, 2016 (unaudited) 2008 swap variable interest income/expense 2008 swap fixed interest expense Bond Year Date Fiscal Year Principal Coupon Interest Debt Svs. Yr Principal Coupon Interest Debt Svs. Yr /01/ $ 2,485, % $ 99,241 $ - $ 2,485, % $ 438,613 $ /01/ ,649 2,673, ,219 3,319, /01/ ,570, % 89,649-2,570, % 396, /01/ ,728 2,739, ,374 3,318, /01/ ,660, % 79,728-2,660, % 352, /01/ ,461 2,809, ,995 3,319, /01/ ,750, % 69,461-2,750, % 306, /01/ ,846 2,878, ,080 3,317, /01/ ,845, % 58,846-2,845, % 260, /01/ ,864 2,951, ,544 3,316, /01/ ,945, % 47,864-2,945, % 211, /01/ ,496 3,029, ,302 3,317, /01/ ,045, % 36,496-3,045, % 161, /01/ ,743 3,106, ,355 3,315, /01/ ,150, % 24,743-3,150, % 109, /01/ ,584 3,187,327-55,616 3,314, /01/ ,260, % 12,584 3,272,584 3,260, % 55,616 3,315, /01/ /01/ /01/ /01/ /01/ /01/ /01/ TOTAL $ 25,710,000 $ 937,983 $ 26,647,983 $ 25,710,000 $ 4,145,583 $ 29,855,580 Call Feature Purpose: 100% New Money Refunding Eligibility Source: 97
114 Debt Service As of September 30, 2016 (unaudited) Series 2012 Revenue Refunding Note Bond Year Date Fiscal Year Principal Coupon Interest Debt Svs. Yr /01/ $ 1,525, % $ 362,349 $ /01/ ,157 2,236, /01/ ,525, % 349, /01/ ,966 2,210, /01/ ,525, % 335, /01/ ,775 2,183, /01/ ,525, % 322, /01/ ,584 2,157, /01/ ,525, % 309, /01/ ,392 2,130, /01/ ,525, % 296, /01/ ,201 2,104, /01/ ,740, % 283,201 33,023, /01/ /01/ /01/ /01/ /01/ /01/ /01/ /01/ /01/ /01/ /01/ TOTAL $ 41,890,000 $ 4,156,499 $46,046,499 Call Feature Purpose: 2006 Bond Partial Refinance Refunding Eligibility Source: Records 98
115 Debt Service As of September 30, 2016 (unaudited) Series 2013 Revenue Refunding Note Bond Year Date Fiscal Year Principal Coupon Interest Debt Svs. Yr /01/ $ 5,640, % $ 36,720 $ /01/ ,750 5,689, /01/ ,000, % 12,750 3,012, /01/ /01/ /01/ /01/ /01/ /01/ /01/ /01/ /01/ /01/ /01/ /01/ /01/ /01/ /01/ /01/ /01/ /01/ /01/ /01/ /01/ TOTAL $ 8,640,000 $ 62,220 $ 8,702,220 Call Feature Purpose: Payoff 2003 A-1 & A-2 Bonds Refunding Eligibility Source: Records 99
116 Debt Service As of September 30, 2016 (unaudited) Series 2016 Revenue Refunding Note Bond Year Date Fiscal Year Principal Coupon Interest Debt Svs. Yr /01/ $ % $ - $ 239, /01/ , /01/ ,995, % 239,427 3,446, /01/ , /01/ ,650, % 212,368 8,005, /01/ , /01/ ,860, % 143,250 2,129, /01/ , /01/ ,895, % 126,445 2,130, /01/ , /01/ ,930, % 109,324 2,131, /01/ , /01/ ,960, % 91,886 2,126, /01/ , /01/ ,000, % 74,177 2,130, /01/ , /01/ ,035, % 56,107 2,128, /01/ , /01/ ,070, % 37,721 2,126, /01/ , /01/ ,105, % 19,019 2,124, /01/ /01/ /01/ TOTAL $ 26,500,000 $ 2,219,448 $28,719,448 Call Feature Purpose: Defease 2006 Bonds Refunding Eligibility Source: Records 100
117 Total Debt Service As of September 30, 2016 (unaudited) Bond Year Date Fiscal Year Principal Interest Debt Svs. Yr /01/ $ 9,650,000 $ 837,682 $ /01/ ,553 11,485, /01/ ,090, , /01/ ,708 11,988, /01/ ,835, , /01/ ,020 13,508, /01/ ,135, , /01/ ,109 7,604, /01/ ,265, , /01/ ,260 7,578, /01/ ,400, , /01/ ,389 7,553, /01/ ,745, , /01/ ,532 38,464, /01/ ,150, , /01/ ,723 5,445, /01/ ,295, , /01/ ,721 5,444, /01/ ,070,000 37, /01/ ,019 2,126, /01/ ,105,000 19, /01/ ,124, /01/ /01/ TOTAL $ 102,740,000 $10,583,750 $13,323,750 Source: Records 101
118 Outstanding Debt by Type Years Ended September 30, 2016 Last Ten Fiscal Years (unaudited) (dollar amounts in thousands) Revenue Fiscal Year Revenue Bonds Revenue Notes Refunding Bonds Notes Payable Total 2016 $ - $ 102,740 $ - $ - $ 102, ,530 87, , ,265 97, , ,885 68,465 32, , ,950 34,855 37, , ,095 36,955 42, , ,320 38,985 47, , ,375 40,950 52, , ,375 41,490 57, , , , ,775
119 Top 10 Employers of Jacksonville (unaudited) Naval Air Station Jacksonville 20,000 20,000 25,240 25,240 25,240 Duval County Public Schools 13,106 12,744 14,480 14,480 14,480 Baptist Health 10,615 9,159 8,270 8,270 8,270 Naval Station Mayport 9,000 9,000 9,000 9,000 12,670 City of Jacksonville 7,273 8,003 8,820 8,820 8,820 Florida Blue 6,000 6,000 6,500 6,500 6,000 UF Health Jacksonville 6,000 3, Clay County School Board 4,616 5, St. Johns County School District 4,388 4, Citigroup Inc. 4,317 3,500 4,200 4,200 5,000 CSX 3,400 3, Publix Distribution Center - 6, Mayo Clinic - 5,211 4,970 4,970 4,970 St. Vincent's HealthCare - 5, Bi-Lo Holdings, LLC - 4, J P Morgan Chase - 3,900 4,200 4,200 - United Parcel Service ,100 Bank of America Merrill Lynch - - 8,000 8,000 6,400 Winn-Dixie Wal-Mart State of Florida Total 88, ,323 93,680 93,680 95,950 Information for 2016 is not currently available. Each employer's percentage of total employment is also unavailable. Source: 2015 Jacksonville Business Journal - Book of Lists 15-16, 2014 Jacksonville Business Journal - Book of Lists 14-15, 2013 About.com Jacksonville, 2012 Jacksonville Economic Development 2011 and 2010 Jacksonville Cornerstone Regional Development Partnership, 2009 Jacksonville Economic Development, 2008 Jacksonville Cornerstone, 2007 and 2006 Data The Florida Times-Union, Largest Employers in Jacksonville Area Information was not available for the prior 3 years 103
120 Naval Air Station Jacksonville 25,245 19,500 22,245 25,245 Duval County Public Schools 14,489 14,489 14,489 14,284 Baptist Health 8,276 5,600 7,000 7,000 Naval Station Mayport 12,677 15,293 15,293 15,293 City of Jacksonville 8,828 8,828 8,828 8,828 Florida Blue 6,000 9,000 7,000 7,000 UF Health Jacksonville Clay County School Board St. Johns County School District Citigroup Inc. 4,863 5,000 4,200 - CSX - - 4,400 - Publix Distribution Center - 6,615-6,615 Mayo Clinic 4,978 5,000 5,000 - St. Vincent's HealthCare Bi-Lo Holdings, LLC J P Morgan Chase United Parcel Service 4, Bank of America Merrill Lynch 3,800-4,000 - Winn-Dixie - 6,200-6,200 Wal-Mart ,800 State of Florida ,056 Total 93,256 95,525 92, ,321 Information for 2016 is not currently available. Each employer's percentage of total employment is also unavailable. Source: 2015 Jacksonville Business Journal - Book of Lists 15-16, 2014 Jacksonville Business Journal - Book of Lists 14-15, 2013 About.com Jacksonville, 2012 Jacksonville Economic Development 2011 and 2010 Jacksonville Cornerstone Regional Development Partnership, 2009 Jacksonville Economic Development, 2008 Jacksonville Cornerstone, 2007 and 2006 Data The Florida Times-Union, Largest Employers in Jacksonville Area Information was not available for the prior 3 years 104
121 Calendar Year Demographic and Economic Statistics Metropolitan Statistical Area of Jacksonville (unaudited) Population Personal Income (in thousands) Per Capita Personal Income Unemployment Rate ,449,481 $64,094,915 $ 44, % ,419,127 61,608,676 43, % ,394,624 60,175,990 43, % ,377,850 57,731,463 41, % ,360,998 55,394,044 40, % ,349,103 53,308,761 39, % ,328,144 52,297,000 39, % ,316,528 53,381,000 40, % ,304,199 48,931,673 40, % ,278,626 47,972,228 37, % Note: Population for 2015 is estimated. Sources: BEARFACTS Bureau of Economic Analysis: Regional Economic Accounts-Jacksonville, FL Bureau of Labor Statistics - Jacksonville, FL Metropolitan Statistical Area 2006 Population Estimate from US Census Bureau Unemployment Rate from the US Department of Labor, Bureau of Labor Statistics 105
122 Jacksonville, Florida Jacksonville International Airport Enplanements (unaudited) 2016 Market Share Market Share 2015 DELTA AIR LINES INC 852, % 858, % AMERICAN AIRLINES CORPORATION 761, % 742, % SOUTHWEST AIRLINES CO 501, % 524, % JETBLUE AIRWAYS CORPORATION 346, % 299, % UNITED AIRLINES 258, % 234, % SILVER AIRWAYS CORP 13, % 40, % ALLEGIANT AIR LLC 60, % 18, % AIR GROUND LOGISTICS INC 4, % 3, % AIR CANADA 2, % - - % US AIRWAYS INC - - % - - % AIRTRAN AIRLINES INC - - % - - % REPUBLIC AIRLINES INC - - % - - % AMERICAN EAGLE AIRLINES - - % - - % CONTINENTAL EXPRESS - - % - - % UNITED EXPRESS AIRLINES CO MESA AIRLINES - - % - - % SHUTTLE AMERICA CORPORATION - - % - - % PINNACLE AIRLINES - - % - - % GOJET AIRLINES - - % - - % COMPASS AIRLINES INC - - % - - % UNITED EXPRESS - - % - - % ATLANTIC SOUTHEAST AIRLINES - - % - - % US AIRWAYS EXPRESS MESA - - % - - % SHUTTLE AMERICA CORPORATION (UNITED) - - % - - % COMAIR INC - - % - - % CHAUTAUQUA AIRLINES INC - - % - - % SHUTTLE AMERICA CORPORATION (CONTINENTAL) - - % - - % CONTINENTAL AIRLINES - - % - - % GOJET AIRLINES (DELTA AIRLINES) - - % - - % EXPRESSJET AIRLINES INC (DELTA AIRLINES) - - % - - % PSA AIRLINES INC - - % - - % AIR WISCONSIN AIRLINES CORPORATION CO US AIRWAYS - - % - - % MESABA AIRLINES - - % - - % ATLANTIC SOUTHEAST AIRLINES (CONTINENTAL) - - % - - % ATLANTIC SOUTHEAST AIRLINES (UNITED) - - % - - % FREEDOM AIRLINES (DELTA) CO MESA AIRLINES - - % - - % EXPRESS JET - - % - - % FRONTIER - - % - - % GULFSTREAM (CONTINENTAL CONN.) - - % - - % SKYWEST (DELTA CONNECTION) - - % - - % TRANS STATES (AMERICAN) - - % - - % NORTHWEST AIRLINES INC - - % - - % TOTAL ENPLANEMENTS 2,799, % 2,722, % Source: Records Effective FY2013 Note: Under new agreement Signatory Airlines are reporting for their affiliates 106
123 Jacksonville, Florida Jacksonville International Airport Enplanements (unaudited) DELTA AIR LINES INC 818, , , ,465 AMERICAN AIRLINES CORPORATION 278, , , ,969 SOUTHWEST AIRLINES CO 604, , , ,020 JETBLUE AIRWAYS CORPORATION 200, , , ,195 UNITED AIRLINES 222, ,782 33,872 45,072 SILVER AIRWAYS CORP 17,043 6,119 2,927 - ALLEGIANT AIR LLC AIR GROUND LOGISTICS INC 1,833 2,054 4,416 4,543 AIR CANADA US AIRWAYS INC 459, , , ,870 AIRTRAN AIRLINES INC , ,138 REPUBLIC AIRLINES INC ,842 76,740 AMERICAN EAGLE AIRLINES , ,783 CONTINENTAL EXPRESS , ,975 UNITED EXPRESS AIRLINES CO MESA AIRLINES ,446 55,888 SHUTTLE AMERICA CORPORATION ,691 13,463 PINNACLE AIRLINES ,525 28,892 GOJET AIRLINES ,552 22,740 COMPASS AIRLINES INC ,232 44,836 UNITED EXPRESS ,366 1,645 ATLANTIC SOUTHEAST AIRLINES ,425 51,217 US AIRWAYS EXPRESS MESA ,835 10,465 SHUTTLE AMERICA CORPORATION (UNITED) ,033 9,294 COMAIR INC ,532 61,685 CHAUTAUQUA AIRLINES INC - - 7,901 7,226 SHUTTLE AMERICA CORPORATION (CONTINENTAL) - - 6,217 13,533 CONTINENTAL AIRLINES - - 6,048 2,593 GOJET AIRLINES (DELTA AIRLINES) - - 4,035 - EXPRESSJET AIRLINES INC (DELTA AIRLINES) - - 3,702 - PSA AIRLINES INC - - 1,268 1,239 AIR WISCONSIN AIRLINES CORPORATION CO US AIRWAYS MESABA AIRLINES ATLANTIC SOUTHEAST AIRLINES (CONTINENTAL) ,011 ATLANTIC SOUTHEAST AIRLINES (UNITED) ,978 FREEDOM AIRLINES (DELTA) CO MESA AIRLINES EXPRESS JET FRONTIER GULFSTREAM (CONTINENTAL CONN.) SKYWEST (DELTA CONNECTION) TRANS STATES (AMERICAN) NORTHWEST AIRLINES INC TOTAL ENPLANEMENTS 2,602,821 2,563,570 2,644,059 2,783,809 Source: Records 107
124 Jacksonville, Florida Jacksonville International Airport Enplanements (unaudited) DELTA AIR LINES INC 659, , , ,370 AMERICAN AIRLINES CORPORATION 163, , , ,886 SOUTHWEST AIRLINES CO 609, , , ,338 JETBLUE AIRWAYS CORPORATION 118, , , ,377 UNITED AIRLINES 53,003 49,205 88,149 22,622 SILVER AIRWAYS CORP ALLEGIANT AIR LLC AIR GROUND LOGISTICS INC 4,191 3,258 3,792 6,835 AIR CANADA US AIRWAYS INC 400, , , ,063 AIRTRAN AIRLINES INC 166, , , ,536 REPUBLIC AIRLINES INC 49,598 48,834 20,742 11,764 AMERICAN EAGLE AIRLINES 85,634 74, , ,006 CONTINENTAL EXPRESS 147, ,950 77, ,739 UNITED EXPRESS AIRLINES CO MESA AIRLINES 39,843 57,791 36,684 65,563 SHUTTLE AMERICA CORPORATION 5, PINNACLE AIRLINES 39,506 42,633 30,892 42,338 GOJET AIRLINES 58,063 44,845 26,151 60,106 COMPASS AIRLINES INC 41,195 47,205 32,493 - UNITED EXPRESS ATLANTIC SOUTHEAST AIRLINES 4,326 3, ,727 US AIRWAYS EXPRESS MESA 7,264 1,531 1,653 2,786 SHUTTLE AMERICA CORPORATION (UNITED) COMAIR INC 63,305 79, , ,296 CHAUTAUQUA AIRLINES INC 19,409 54,097 34,746 11,126 SHUTTLE AMERICA CORPORATION (CONTINENTAL) CONTINENTAL AIRLINES 24,739 77, , ,554 GOJET AIRLINES (DELTA AIRLINES) EXPRESSJET AIRLINES INC (DELTA AIRLINES) PSA AIRLINES INC 1,462-1,626 1,697 AIR WISCONSIN AIRLINES CORPORATION CO US AIRWAYS ,878 3,855 MESABA AIRLINES 7,219-6,373 - ATLANTIC SOUTHEAST AIRLINES (CONTINENTAL) ATLANTIC SOUTHEAST AIRLINES (UNITED) 1, FREEDOM AIRLINES (DELTA) CO MESA AIRLINES 5, EXPRESS JET ,531 29,042 FRONTIER ,719 11,694 GULFSTREAM (CONTINENTAL CONN.) - - 5,606 14,053 SKYWEST (DELTA CONNECTION) ,074 TRANS STATES (AMERICAN) ,075 40,486 NORTHWEST AIRLINES INC - 69,963 94, ,731 TOTAL ENPLANEMENTS 2,777,807 2,813,208 3,058,006 3,167,664 Source: Records 108
125 Jacksonville, Florida Landed Weights (weights in 1000 lbs) (unaudited) 2016 Market Share Market Share 2015 DELTA AIR LINES INC 934, % 993, % AMERICAN AIRLINES CORPORATION 877, % 904, % SOUTHWEST AIRLINES CO 565, % 593, % JETBLUE AIRWAYS CORPORATION 388, % 334, % UNITED AIRLINES 266, % 239, % SILVER AIRWAYS CORP 24, % 57, % ALLEGIANT AIR LLC 62, % 18, % AIR GROUND LOGISTICS INC 12, % 9, % AIR CANADA 3, % - - % US AIRWAYS INC - - % - - % REPUBLIC AIRLINES INC - - % - - % AIRTRAN AIRLINES INC - - % - - % ENVOY AIR - - % - - % COMPASS AIRLINES INC - - % - - % UNITED EXPRESS AIRLINES CO MESA AIRLINES - - % - - % PINNACLE AIRLINES - - % - - % GOJET AIRLINES - - % - - % GOJET AIRLINES (DELTA AIRLINES) - - % - - % SHUTTLE AMERICA CORPORATION (UNITED) - - % - - % US AIRWAYS EXPRESS MESA - - % - - % EXPRESSJET AIRLINES INC (DELTA AIRLINES) - - % - - % SHUTTLE AMERICA CORPORATION - - % - - % AIR WISCONSIN AIRLINES CORPORATION CO US AIRWAYS - - % - - % PSA AIRLINES INC - - % - - % ATLANTIC SOUTHEAST AIRLINES - - % - - % UNITED EXPRESS - - % - - % COMAIR INC - - % - - % SHUTTLE AMERICA CORPORATION (CONTINENTAL) - - % - - % CONTINENTAL AIRLINES - - % - - % CHAUTAUQUA AIRLINES INC - - % - - % CONTINENTAL EXPRESS - - % - - % MESABA AIRLINES - - % - - % ATLANTIC SOUTHEAST AIRLINES (CONTINENTAL) - - % - - % ATLANTIC SOUTHEAST AIRLINES (UNITED) - - % - - % DAL GLOBAL SERVICES INC - - % - - % ATLANTIC COAST AIRLINES - - % - - % AMERICAN (TRANS STATES) - - % - - % EXPRESS JET - - % - - % FRONTIER - - % - - % GULFSTREAM (CONTINENTAL) - - % - - % INDEPENDENCE AIR - - % - - % SKYWEST (DELTA CONNECTION) - - % - - % TRANS STATES - - % - - % AIR WISCONSIN (US AIRWAYS) - - % - - % NORTHWEST AIRLINES INC - - % - - % TOTAL COMMERCIAL AIRLINES 3,135, % 3,150, % AIR CARGO CARRIERS: FEDERAL EXPRESS CORPORATION 206, % 203, % UNITED PARCEL SERVICE COMPANY 198, % 188, % SUBURBAN AIR FREIGHT INC % - - % AMERIFLIGHT LLC 1, % 3, % MOUNTAIN AIR CARGO INC - - % 43 - % MISCELLANEOUS - - % - - % ABX - - % - - % DHL - - % - - % TOTAL CARGO AIRLINES 407, % 394, % TOTAL LANDED WEIGHTS 3,543, % 3,544, % Source: Records Effective FY 2014 Note: Under the current airline agreement Affiliate's landed weights are reported under the Signatory Airline. 109
126 Jacksonville, Florida Landed Weights (weights in 1000 lbs) (unaudited) DELTA AIR LINES INC 989,362 1,021, , ,499 AMERICAN AIRLINES CORPORATION 304, , , ,024 SOUTHWEST AIRLINES CO 781, , , ,870 JETBLUE AIRWAYS CORPORATION 225, , , ,867 UNITED AIRLINES 243, ,258 49,993 66,766 SILVER AIRWAYS CORP 23,057 8,265 3,933 - ALLEGIANT AIR LLC AIR GROUND LOGISTICS INC 5,289 5,583 12,180 11,463 AIR CANADA US AIRWAYS INC 530, , , ,833 REPUBLIC AIRLINES INC ,784 85,395 AIRTRAN AIRLINES INC , ,650 ENVOY AIR , ,674 COMPASS AIRLINES INC ,023 52,538 UNITED EXPRESS AIRLINES CO MESA AIRLINES ,625 67,918 PINNACLE AIRLINES ,596 34,363 GOJET AIRLINES ,855 28,810 GOJET AIRLINES (DELTA AIRLINES) - - 5,963 - SHUTTLE AMERICA CORPORATION (UNITED) ,993 15,258 US AIRWAYS EXPRESS MESA ,712 11,172 EXPRESSJET AIRLINES INC (DELTA AIRLINES) - - 4,256 - SHUTTLE AMERICA CORPORATION ,786 17,027 AIR WISCONSIN AIRLINES CORPORATION CO US AIRWAYS - - 1, PSA AIRLINES INC - - 1,730 1,394 ATLANTIC SOUTHEAST AIRLINES ,651 64,670 UNITED EXPRESS ,246 1,662 COMAIR INC ,125 87,737 SHUTTLE AMERICA CORPORATION (CONTINENTAL) ,051 23,863 CONTINENTAL AIRLINES - - 9,880 4,407 CHAUTAUQUA AIRLINES INC - - 7,341 6,907 CONTINENTAL EXPRESS , ,645 MESABA AIRLINES ATLANTIC SOUTHEAST AIRLINES (CONTINENTAL) ,866 ATLANTIC SOUTHEAST AIRLINES (UNITED) ,455 DAL GLOBAL SERVICES INC ATLANTIC COAST AIRLINES AMERICAN (TRANS STATES) EXPRESS JET FRONTIER GULFSTREAM (CONTINENTAL) INDEPENDENCE AIR SKYWEST (DELTA CONNECTION) TRANS STATES AIR WISCONSIN (US AIRWAYS) NORTHWEST AIRLINES INC TOTAL COMMERCIAL AIRLINES 3,102,311 3,204,434 3,293,725 3,580,857 AIR CARGO CARRIERS: FEDERAL EXPRESS CORPORATION 205, , , ,323 UNITED PARCEL SERVICE COMPANY 186, , , ,799 SUBURBAN AIR FREIGHT INC 2,479 3,272 3,203 2,090 AMERIFLIGHT LLC MOUNTAIN AIR CARGO INC MISCELLANEOUS ABX DHL TOTAL CARGO AIRLINES 395, , , ,114 TOTAL LANDED WEIGHTS 3,497,573 3,592,920 3,680,570 3,981,971 Source: Records 110
127 Jacksonville, Florida Landed Weights (weights in 1000 lbs) (unaudited) DELTA AIR LINES INC 722, , , ,714 AMERICAN AIRLINES CORPORATION 181, , ,777 - SOUTHWEST AIRLINES CO 862, , , ,542 JETBLUE AIRWAYS CORPORATION 152, , , ,747 UNITED AIRLINES 76,189 65, ,232 28,118 SILVER AIRWAYS CORP ALLEGIANT AIR LLC AIR GROUND LOGISTICS INC AIR CANADA US AIRWAYS INC 529, , , ,664 REPUBLIC AIRLINES INC 56,686 55,227 20,112 15,041 AIRTRAN AIRLINES INC 200, , , ,352 ENVOY AIR 99,474 88, , ,487 COMPASS AIRLINES INC 35,875 46,903 36,776 - UNITED EXPRESS AIRLINES CO MESA AIRLINES 45,630 61,844 40,321 73,408 PINNACLE AIRLINES 45,024 40,519 37,150 46,671 GOJET AIRLINES - 56,213 42,681 75,040 GOJET AIRLINES (DELTA AIRLINES) 73, SHUTTLE AMERICA CORPORATION (UNITED) US AIRWAYS EXPRESS MESA 7,720 1,397 2,132 3,363 EXPRESSJET AIRLINES INC (DELTA AIRLINES) SHUTTLE AMERICA CORPORATION 5, AIR WISCONSIN AIRLINES CORPORATION CO US AIRWAYS PSA AIRLINES INC 1,851-2,295 1,900 ATLANTIC SOUTHEAST AIRLINES 4,730 4, ,792 UNITED EXPRESS COMAIR INC 68,834 89, , ,499 SHUTTLE AMERICA CORPORATION (CONTINENTAL) CONTINENTAL AIRLINES 30,343 94, , ,848 CHAUTAUQUA AIRLINES INC 21,983 56,301 32,547 10,707 CONTINENTAL EXPRESS 142, ,231 80, ,876 MESABA AIRLINES 5,240-2,867 - ATLANTIC SOUTHEAST AIRLINES (CONTINENTAL) ATLANTIC SOUTHEAST AIRLINES (UNITED) DAL GLOBAL SERVICES INC ATLANTIC COAST AIRLINES 1, AMERICAN (TRANS STATES) ,773 EXPRESS JET ,862 50,733 FRONTIER ,574 15,926 GULFSTREAM (CONTINENTAL) ,266 26,646 INDEPENDENCE AIR SKYWEST (DELTA CONNECTION) ,735 TRANS STATES ,235 43,128 AIR WISCONSIN (US AIRWAYS) ,854 4,277 NORTHWEST AIRLINES INC - 71, , ,429 TOTAL COMMERCIAL AIRLINES 3,373,028 3,569,951 4,012,000 3,929,416 AIR CARGO CARRIERS: FEDERAL EXPRESS CORPORATION 212, , , ,005 UNITED PARCEL SERVICE COMPANY 189, , , ,114 SUBURBAN AIR FREIGHT INC AMERIFLIGHT LLC MOUNTAIN AIR CARGO INC MISCELLANEOUS 16,478 18,474 16,760 5,918 ABX - 7,029 26,293 28,491 DHL ,126 TOTAL CARGO AIRLINES 419, , , ,654 TOTAL LANDED WEIGHTS 3,792,053 4,020,983 4,519,111 4,446,070 Source: Records 111
128 Number of Employees Year Ended September 30, (unaudited) 2016 Employees 2015 Employees 2014 Employees 2013 Employees 2012 Employees FT PT FT PT FT PT FT PT FT PT Executive Director Marketing Information Technology External Affairs Human Resources Procurement Accounting & Finance Planning & Engineering Business Development Cecil Airport JaxEx at Craig Airport Herlong Airport Building Maintenance Field Maintenance HBS Custodial Police/Security Airport Operations DBE Customer Service Employee Relations Training & Development Air Trade Total FT - Full time employee working more than 35 hours PT - Part time employee working 35 hours or less Source: Records 112
129 Number of Employees Year Ended September 30, (unaudited) 2011 Employees 2010 Employees 2009 Employees 2008 Employees 2007 Employees FT PT FT PT FT PT FT PT FT PT Executive Director Marketing Information Technology External Affairs Human Resources Procurement Accounting & Finance Planning & Engineering Business Development Cecil Airport JaxEx at Craig Airport Herlong Airport Building Maintenance Field Maintenance HBS Custodial Police/Security Airport Operations DBE Customer Service Employee Relations Training & Development Air Trade Total FT - Full time employee working more than 35 hours PT - Part time employee working 35 hours or less Source: Records 113
130 Aircraft Operations Year Ended September 30, 2016 (unaudited) Air Carrier Air Taxi Gen Aviation Military Total Aircraft Operations ,307 16,351 12,594 16, , ,552 18,528 11,223 9,199 93, ,457 20,168 11,544 6,460 87, ,358 18,301 13,755 7,145 90, ,101 15,594 12,519 5,926 89, ,105 19,956 13,536 7,275 98, ,004 22,602 12,694 6,553 94, ,467 22,325 11,925 5,908 97, ,937 32,227 12,098 4, , ,997 37,163 15,447 5, ,515 Source: Records 114
131 Airlines Serving Jacksonville International Airport Year Ended September 30, (unaudited) Signatory Airlines American Airlines X X X X X X X X X X Delta Airlines X X X X X X X X X X JetBlue X X X X X X X X X X Northwest Airlines X X X Southwest Airlines X X X X X X X X X X United Airlines X X X X X X X X X X US Airways - X X X X X X X X X Total Signatory Airlines Non-signatory Airlines Sky Regional (Air Canada) X AirTran X X X X X X X Air Wisconsin (American Air) X X X X X X X Allegiant X X American Eagle X X X X X X X Endeavor Airlines (formerly ASA) X X X X X X X Charters X X X X X X X Chautauqua X X X X X X Comair X X X X X X Compass Airline X X X X X X - Continental Airlines X X X X X X Continental Express X X X X X X Express Jet (United Air) X X X X Florida Gulf Freedom Airlines X Frontier X X Go Jet (United) X X X X X X X Gulfstream X X Independence Air Mesa (American Air) X X X X X X X Mesaba X X X - X - Pinnacle X X X X X X X PSA Airlines X X X X - X X Republic (American Air) X X X X X X X Shuttle America (Delta) X X X X Silver Airways X X X X X Skywest X X Trans States X X Total Non-signatory Airlines Total Signatory and Non-signatory Airlines Cargo UPS X X X X X X X X X X FedEx X X X X X X X X X X Mountain Air Cargo - X - - X X Suburban Air Freight X X X X X X Ameriflight, LLC X X X X - X ABX X X X X DHL X Total Cargo Airlines Starting in 2013 affiliates are reported under signatory airlines. Source: Jacksonville Aviaition Authority Records 115
132 Primary Origination and Destination Passenger Markets Year Ended September 30, 2016 (unaudited) Rank Market 1 Atlanta SH 2 Charlotte SH 3 New York JFK MH 4 Washington National MH 5 Miami SH 6 New York La Guardia MH 7 Chicago O'Hare MH 8 Dallas-Fort Worth MH 9 New York Newark MH 10 Baltimore-Washington MH 11 Fort Lauderdale/Hollywood SH 12 Houston Intercontinental MH 13 Nashville SH 14 Philadelphia MH 15 Boston MH 16 Washington Dulles MH 17 Chicago Midway MH 18 Denver MH 19 Houston Hobby MH 20 Minneapolis - St. Paul MH 21 Detroit Wayne County MH Source: Records Trip Length SH (short haul) = 0 to 600 miles MH (medium haul) = 601 to 1,800 miles LH (long haul) = over 1,801 miles 116
133 Airport Capital Asset Information Year Ended September 30, 2016 (unaudited) Jacksonville International Airport Location Area Airport Code Runways Taxiways Aprons Terminal with 2 Concourses Aircraft Gates Cargo Parking spaces Hotel 18 Miles North of Downtown Jacksonville 8,296 Acres - JAX 10,000 Feet Runway 7/25 (Primary) 7,700 Feet Runway 13/ Foot Wide 2 50 Foot Wide 2 90 Foot Wide 3 60 Foot Wide Foot Wide 1,575,752 Sq. Yards 736,138 Sq. Ft. 14 Gates leased by Signatory Airlines 6 Gates operated by JAA 1 International/Charter Gate - South of Terminal 225,000 Sq. Ft. Consisting of 4 Buildings 86,600 Sq. Yrds. Consisting of 3 Cargo Ramps 39,785 Sq. Ft. Aircraft Maintenance Facility 833 Short-term Hourly Garage 1,963 Daily Garage 1,722 Daily Surface Lot 4,411 Economy Lots 8, Rooms - Jacksonville Airport Hotel 153,000 Sq. Ft. General Aviation Airports: Jacksonville Executive at Craig Airport Location Area Runways Fixed Based Operators (FBO) 9 Miles East of Downtown Jacksonville 1,328 Acres 4,000 Feet 4,000 Feet - Craig Air Center - Sky Harbor Source: Records 117
134 Airport Capital Asset Information Year Ended September 30, 2016 (unaudited) (continued) Herlong Airport Location Area Runways Cecil Airport Location Area Runways Aprons 9 Miles Southwest of Downtown Jacksonville 1,449 Acres 4,000 Feet 3,500 Feet 13 Miles Southwest of Downtown Jacksonville 6,078 Acres 12,500 Feet 8,000 Feet 8,000 Feet 4,439 Feet 672,953 Sq. Yrds. Source: Records 118

135 This page intentionally left blank
136 14201 Pecan Park Road Jacksonville, FL 32218

137

138
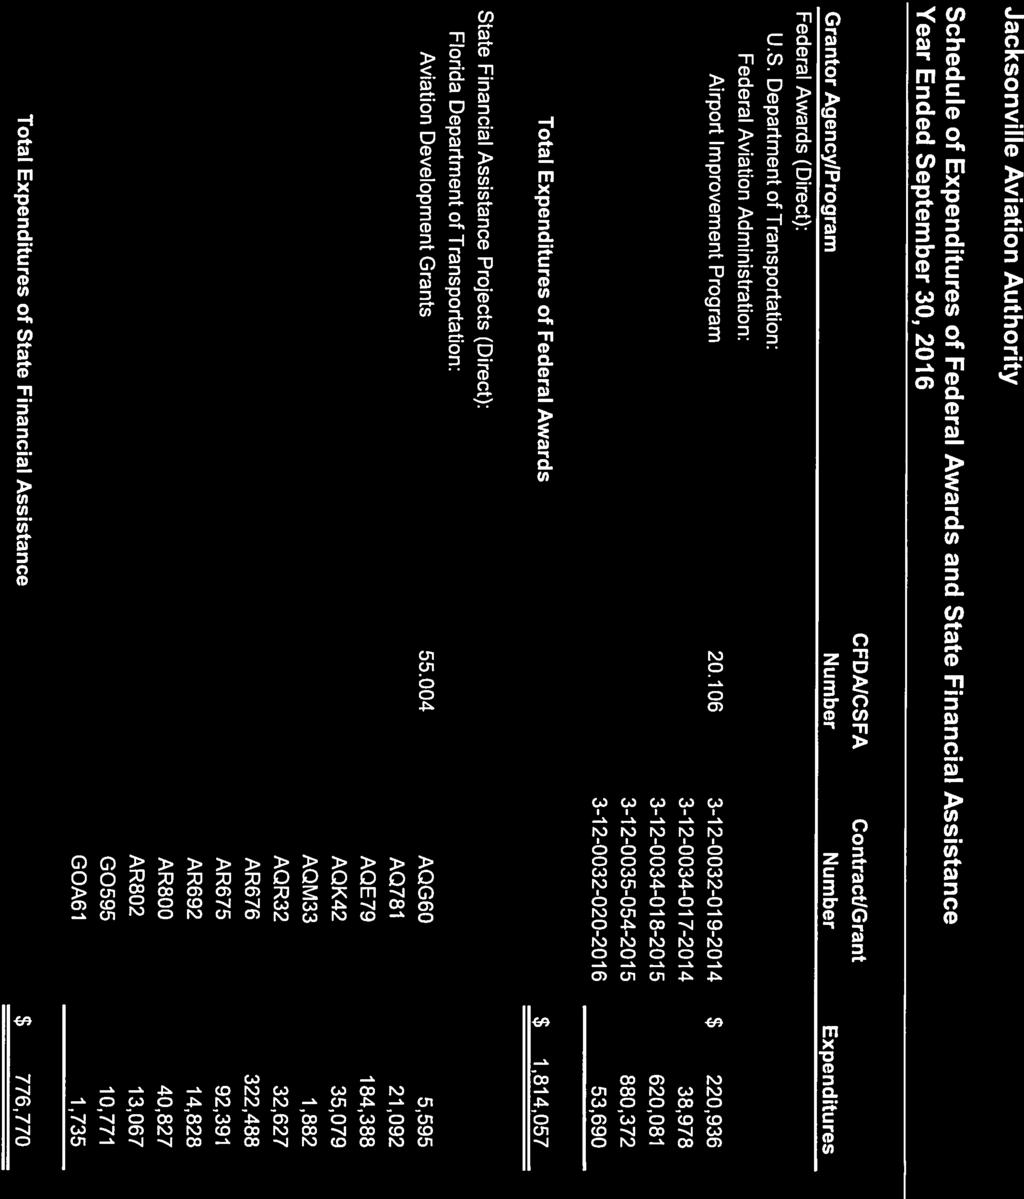
139

140

141


142

143
144


145

146

147

148

149

150

151


152


153


154

155


156
Jacksonville Aviation Authority
 www.flyjacksonville.com Annual Financial Report Fiscal Year 2014 Comprehensive Annual Financial Report for the Fiscal Years Ended September 30, 2014 and September 30, 2013 of the Jacksonville Aviation
Jacksonville Aviation Authority
 Annual Report 2006 One Team. One Mission. efficiency 14201 Pecan Park Road, Adm Jacksonville, FL 32229 USA Jaa - Head quarters Phone: (904)741-2000 Annual Report 2006 www.jaa. aero The own and operates
Palm Beach County, Florida Department of Airports. Financial Report September 30, 2015
 Palm Beach County, Florida Department of Airports Financial Report September 30, 2015 Contents Independent Auditor s Report 1-2 Management s Discussion and Analysis (Unaudited) 3-17 Financial Statements:
City of Chicago Chicago Midway International Airport An Enterprise Fund of the City of Chicago
 City of Chicago Chicago Midway International Airport An Enterprise Fund of the City of Chicago Comprehensive Annual Financial Report For the Years Ended December 31, 2017 and 2016 Rahm Emanuel, Mayor Carole
Portland International Jetport (An Enterprise Fund of the City of Portland, Maine) Financial Statements For the years ended June 30, 2017 and 2016
 Financial Statements For the years ended June 30, 2017 and 2016") Portland International Jetport (An Enterprise Fund of the City of Portland, Maine) Financial Statements For the years ended June 30, 2017 and 2016 (An Enterprise Fund of the City of Portland, Maine) Financial
Portland International Jetport (An Enterprise Fund of the City of Portland, Maine) Financial Statements For the years ended June 30, 2017 and 2016 (An Enterprise Fund of the City of Portland, Maine) Financial
City of Chicago, Illinois Chicago O Hare International Airport
 City of Chicago, Illinois Chicago O Hare International Airport Basic Financial Statements for the Years Ended December 31, 2007 and 2006, Required Supplementary Information, Additional Information, Statistical
City of Chicago, Illinois Chicago O Hare International Airport
 City of Chicago, Illinois Chicago O Hare International Airport Basic Financial Statements for the Years Ended December 31, 2005 and 2004, Required Supplementary Information, Additional Information, Statistical
City of Chicago, Illinois Chicago O Hare International Airport
 City of Chicago, Illinois Chicago O Hare International Airport Basic Financial Statements for the Years Ended December 31, 2006 and 2005, Required Supplementary Information, Additional Information, Statistical
Basic Financial Statements and Report of Independent Certified Public Accountants City of Dallas, Texas Airport Revenues Fund (An Enterprise Fund of
 Basic Financial Statements and Report of Independent Certified Public Accountants City of Dallas, Texas TABLE OF CONTENTS Page Report of Independent Certified Public Accountants 1 Management s Discussion
Gulfport Biloxi Regional Airport Authority Gulfport, Mississippi. Financial Statements. September 30, 2014 and Contents
 Gulfport Biloxi Regional Airport Authority Gulfport, Mississippi Financial Statements September 30, 2014 and 2013 Contents Independent Auditors' Report... 1-3 Section I Management s Discussion and Analysis...
LOUIS ARMSTRONG NEW ORLEANS INTERNATIONAL AIRPORT (A Proprietary Component Unit of the City of New Orleans)
") (A Proprietary Component Unit of the City of New Orleans) Financial Statements and Supplemental Schedules (With Independent Auditors Report Thereon) (A Proprietary Component Unit of the City of New Orleans)
(A Proprietary Component Unit of the City of New Orleans) Financial Statements and Supplemental Schedules (With Independent Auditors Report Thereon) (A Proprietary Component Unit of the City of New Orleans)
LAMBERT ST. LOUIS INTERNATIONAL AIRPORT (An Enterprise Fund of the City of St. Louis, Missouri)
") Basic Financial Statements and Supplementary Information (With Independent Auditors Report Thereon) Table of Contents Page Independent Auditors Report 1 Management s Discussion and Analysis Unaudited 4
Basic Financial Statements and Supplementary Information (With Independent Auditors Report Thereon) Table of Contents Page Independent Auditors Report 1 Management s Discussion and Analysis Unaudited 4
Bradley International Airport Enterprise Fund and General Aviation Airports Enterprise Fund
 Bradley International Airport and General Aviation Airports Financial Report with Supplemental Information June 30, 2018 Contents Independent Auditor's Report 1-3 Management's Discussion and Analysis 4-25
City of Chicago, Illinois Chicago Midway International Airport
 City of Chicago, Illinois Chicago Midway International Airport Basic Financial Statements as of and for the Years Ended December 31, 2009 and 2008, Required Supplementary Information, Additional Information,
Gulfport Biloxi Regional Airport Authority Gulfport, Mississippi. Financial Statements. September 30, 2015 and Contents
 Gulfport Biloxi Regional Airport Authority Gulfport, Mississippi Financial Statements September 30, 2015 and 2014 Contents Independent Auditors' Report... 1-3 Section I Management s Discussion and Analysis...
New Hanover County Airport Authority A Component Unit of New Hanover County. Financial Statements and Compliance Year Ended June 30, 2018
 New Hanover County Airport Authority A Component Unit of New Hanover County Financial Statements and Compliance Year Ended June 30, 2018 Contents Financial section Independent auditors report 1-3 Management
LOUIS ARMSTRONG NEW ORLEANS INTERNATIONAL AIRPORT (A Proprietary Component Unit of the City of New Orleans) Financial Statements and Supplemental
 Financial Statements and Supplemental") (A Proprietary Component Unit of the City of New Orleans) Financial Statements and Supplemental Schedules (With Independent Auditors Report Thereon) A Proprietary Component Unit of the City of New Orleans)
(A Proprietary Component Unit of the City of New Orleans) Financial Statements and Supplemental Schedules (With Independent Auditors Report Thereon) A Proprietary Component Unit of the City of New Orleans)
FINANCIAL REPORT METROPOLITAN WASHINGTON AIRPORTS AUTHORITY
 FINANCIAL REPORT METROPOLITAN WASHINGTON AIRPORTS AUTHORITY REPORT OF INDEPENDENT ACCOUNTANTS To the Board of Directors of the Metropolitan Washington Airports Authority In our opinion, the accompanying
BLOOMINGTON-NORMAL AIRPORT AUTHORITY OF MCLEAN COUNTY, ILLINOIS FINANCIAL STATEMENTS AND INDEPENDENT AUDITOR S REPORT.
 OF MCLEAN COUNTY, ILLINOIS FINANCIAL STATEMENTS AND INDEPENDENT AUDITOR S REPORT April 30, 2015 OF MCLEAN COUNTY, ILLINOIS TABLE OF CONTENTS Page(s) INDEPENDENT AUDITOR S REPORT... 1-3 MANAGEMENT S DISCUSSION
Supplemen. Prepared by: airport.com
 Sarasota, Florida Financial Statements withh Management s Discussion and Analysis including Supplemen ntary and Compliance Reports and Schedules For the years endedd Prepared by: Finance Department www.srq
MOBILE AIRPORT AUTHORITY
 FINANCIAL STATEMENTS AND SUPPLEMENTARY INFORMATION FOR THE YEAR ENDED SEPTEMBER 30, 2016 WITH COMPARATIVE TOTALS FOR THE YEAR ENDED SEPTEMBER 30, 2015 Introductory Section Transmittal Letter Financial
Broward County Aviation Department. A Major Fund of Broward County, Florida. Financial Statements For the Years Ended September 30, 2016 and 2015
 Broward County Aviation Department A Major Fund of Broward County, Florida Financial Statements For the Years Ended September 30, 2016 and 2015 FINANCIAL STATEMENTS TABLE OF CONTENTS FOR THE YEARS ENDED
CINCINNATI/NORTHERN KENTUCKY INTERNATIONAL AIRPORT ANNUAL FINANCIAL AND OPERATING INFORMATION
 CINCINNATI/NORTHERN KENTUCKY INTERNATIONAL AIRPORT ANNUAL FINANCIAL AND OPERATING INFORMATION ISSUER: Kenton County Airport Board SUBMITTER INFORMATION: Name: Sheila R. Hammons Title: Secretary-Treasurer
HILLSBOROUGH COUNTY AVIATION AUTHORITY FINANCIAL STATEMENTS, OTHER FINANCIAL INFORMATION AND COMPLIANCE REPORTS
 FINANCIAL STATEMENTS, OTHER FINANCIAL INFORMATION AND COMPLIANCE REPORTS YEARS ENDED TABLE OF CONTENTS YEARS ENDED INDEPENDENT AUDITORS REPORT 1 MANAGEMENT S DISCUSSION AND ANALYSIS 4 FINANCIAL STATEMENTS
Palm Beach County, Florida Department of Airports. Financial Report September 30, 2017
 Palm Beach County, Florida Department of Airports Financial Report September 30, 2017 Contents Independent Auditor s Report 1-2 Management s Discussion and Analysis (Unaudited) 3-16 Financial Statements:
Financial Report st Quarter/Unaudited
 Financial Report 2014 1st Quarter/Unaudited MANAGEMENT S DISCUSSION AND ANALYSIS City and County of Denver Management s Discussion and Analysis For the Three Months Ended March 31, 2014 The following discussion
Gulfport Biloxi Regional Airport Authority Gulfport, Mississippi. Financial Statements. September 30, 2017 and Contents
 Gulfport Biloxi Regional Airport Authority Gulfport, Mississippi Financial Statements September 30, 2017 and 2016 Contents Independent Auditors' Report... 1-3 Section I Management s Discussion and Analysis...
Financial Report with Supplemental Information December 31, 2015
 Financial Report with Supplemental Information December 31, 2015 Contents Report Letter 1-3 Management's Discussion and Analysis 4-11 Basic Financial Statements Statement of Net Position 12 Statement of
Palm Beach County, Florida Department of Airports. Financial Report September 30, 2012
 Palm Beach County, Florida Department of Airports Financial Report September 30, 2012 Contents Independent Auditor s Report 1 2 Management s Discussion and Analysis 3 17 Financial Statements: Statements
ST. LOUIS LAMBERT INTERNATIONAL AIRPORT (An Enterprise Fund of the City of St. Louis, Missouri)
") Basic Financial Statements and Supplementary Information (With Independent Auditors Report Thereon) Table of Contents Page Independent Auditors Report 1 Management s Discussion and Analysis Unaudited 4
Basic Financial Statements and Supplementary Information (With Independent Auditors Report Thereon) Table of Contents Page Independent Auditors Report 1 Management s Discussion and Analysis Unaudited 4
Celebrating 25 Years of Excellence
 Celebrating 25 Years of Excellence Comprehensive Annual Financial Report Fiscal Year Ended June 30, 2017 Chino Hills, California , CALIFORNIA COMPREHENSIVE ANNUAL FINANCIAL REPORT FISCAL YEAR ENDED JUNE
Year Ended December 31, Comprehensive Annual Financial Report. (A Component Unit of the County of Kent, Michigan)
") Year Ended December 31, 2017 Comprehensive Annual Financial Report (A Component Unit of the County of Kent, Michigan) Year Ended December 31, 2017 Comprehensive Annual Financial Report (A Component Unit
Year Ended December 31, 2017 Comprehensive Annual Financial Report (A Component Unit of the County of Kent, Michigan) Year Ended December 31, 2017 Comprehensive Annual Financial Report (A Component Unit
HILLSBOROUGH COUNTY AVIATION AUTHORITY FINANCIAL STATEMENTS, OTHER FINANCIAL INFORMATION AND COMPLIANCE REPORTS
 FINANCIAL STATEMENTS, OTHER FINANCIAL INFORMATION AND COMPLIANCE REPORTS YEARS ENDED SEPTEMBER 30, 2014 AND 2013 TABLE OF CONTENTS YEARS ENDED SEPTEMBER 30, 2014 AND 2013 INDEPENDENT AUDITORS' REPORT 1
BARKLEY REGIONAL AIRPORT AUTHORITY FINANCIAL STATEMENTS With Independent Auditor s Report. FOR THE YEARS ENDED JUNE 30, 2016 and 2015
 FINANCIAL STATEMENTS With Independent Auditor s Report FOR THE YEARS ENDED JUNE 30, 2016 and 2015 TABLE OF CONTENTS INDEPENDENT AUDITOR S REPORT... 1-2 FINANCIAL STATEMENTS Statements of Net Position...
Fort Collins ~ Loveland Municipal Airport
 Fort Collins ~ Loveland Municipal Airport Year Ended December 31, 2014 TABLE OF CONTENTS PAGE Letter of Transmittal... 2 Independent Auditors Report... 4 Management s Discussion and Analysis... 7 Basic
FINANCIAL STATEMENTS AND INDEPENDENT AUDITORS' REPORTS CITY OF ST. AUGUSTINE BEACH ST. AUGUSTINE BEACH, FLORIDA SEPTEMBER 30, 2016
 FINANCIAL STATEMENTS AND INDEPENDENT AUDITORS' REPORTS CITY OF ST. AUGUSTINE BEACH ST. AUGUSTINE BEACH, FLORIDA SEPTEMBER 30, 2016 FINANCIAL STATEMENTS AND INDEPENDENT AUDITORS' REPORTS CITY OF ST. AUGUSTINE
LOUIS ARMSTRONG NEW ORLEANS INTERNATIONAL AIRPORT (A Proprietary Component Unit of the City of New Orleans)
") (A Proprietary Component Unit of the City of New Orleans) Financial Statements and Supplemental Schedules December 31, 2006 and 2005 (With Independent Auditors' Report Thereon) Under provisions of state
(A Proprietary Component Unit of the City of New Orleans) Financial Statements and Supplemental Schedules December 31, 2006 and 2005 (With Independent Auditors' Report Thereon) Under provisions of state
Annual Financial Report
 2015-2016 Annual Financial Report PALM BEACH STATE COLLEGE ANNUAL FINANCIAL REPORT June 30, 2016 Table of Contents MANAGEMENT S DISCUSSION AND ANALYSIS... 1 BASIC FINANCIAL STATEMENTS...11 Statement of
CITY OF COATESVILLE COATESVILLE, PENNSYLVANIA
 COATESVILLE, PENNSYLVANIA BASIC FINANCIAL STATEMENTS WITH SUPPLEMENTARY INFORMATION DECEMBER 31, 2014 TABLE OF CONTENTS PAGE INDEPENDENT AUDITOR S REPORT 1-3 MANAGEMENT S DISCUSSION AND ANALYSIS 4-12 BASIC
CLINTON CITY BASIC FINANCIAL STATEMENTS AND REQUIRED SUPPLEMENTARY INFORMATION WITH INDEPENDENT AUDITOR'S REPORTS YEAR ENDED JUNE 30, 2018
 BASIC FINANCIAL STATEMENTS AND REQUIRED SUPPLEMENTARY INFORMATION WITH INDEPENDENT AUDITOR'S REPORTS YEAR ENDED TABLE OF CONTENTS Independent Auditors Report... 1-2 Management s Discussion and Analysis...
Sarasota Manatee Airport Authority Sarasota, Florida
 www.srq-airport.com Sarasota Manatee Airport Authority Sarasota, Florida Financial Statements with Management s Discussion and Analysis including Supplementary and Compliance Reports and Schedules For
Financial Audit PALM BEACH STATE COLLEGE. For the Fiscal Year Ended June 30, Report No March 2016
 March 2016 PALM BEACH STATE COLLEGE For the Fiscal Year Ended June 30, 2015 Financial Audit Sherrill F. Norman, CPA Auditor General Board of Trustees and President During the 2014-15 fiscal year, Dr. Dennis
CHARLESTON COUNTY AIRPORT DISTRICT FINANCIAL REPORT FOR THE FISCAL YEARS ENDED JUNE 30, 2017 AND 2016
 CHARLESTON COUNTY AIRPORT DISTRICT FINANCIAL REPORT FOR THE FISCAL YEARS ENDED JUNE 30, 2017 AND 2016 CHARLESTON COUNTY AIRPORT DISTRICT FINANCIAL REPORT FOR THE FISCAL YEARS ENDED JUNE 30, 2017 AND 2016
ENGLEWOOD WATER DISTRICT FINANCIAL STATEMENTS AND SUPPLEMENTARY INFORMATION YEARS ENDED SEPTEMBER 30, 2017 AND 2016
 FINANCIAL STATEMENTS AND SUPPLEMENTARY INFORMATION YEARS ENDED TABLE OF CONTENTS YEARS ENDED INDEPENDENT AUDITORS REPORT 1 MANAGEMENT S DISCUSSION AND ANALYSIS 4 BASIC FINANCIAL STATEMENTS STATEMENTS OF
BIRMINGHAM AIRPORT AUTHORITY FINANCIAL STATEMENTS. June 30, With Independent Auditor's Report
 FINANCIAL STATEMENTS June 30, 2014 With Independent Auditor's Report Birmingham, Alabama TABLE OF CONTENTS PAGE INDEPENDENT AUDITOR'S REPORT MANAGEMENT'S DISCUSSION AND ANALYSIS (UNAUDITED) 3-10 FINANCIAL
City of Chicago Department of Water Management Water Fund Comprehensive Annual Financial Report For the Years Ended December 31, 2016 and 2015
 City of Chicago Department of Water Management Water Fund Comprehensive Annual Financial Report For the Years Ended December 31, 2016 and 2015 Rahm Emanuel, Mayor Carole L. Brown, Chief Financial Officer
CITY OF ATWATER, CALIFORNIA ANNUAL FINANCIAL REPORT FOR THE FISCAL YEAR ENDED JUNE 30, 2016
 CITY OF ATWATER, CALIFORNIA ANNUAL FINANCIAL REPORT FOR THE FISCAL YEAR ENDED JUNE 30, 2016 Prepared by: Finance Department This page intentionally left blank. Basic Financial Statements Table of Contents
CITY OF GLENCOE, MINNESOTA FINANCIAL STATEMENTS AND SUPPLEMENTARY INFORMATION YEAR ENDED DECEMBER 31, 2015
 FINANCIAL STATEMENTS AND SUPPLEMENTARY INFORMATION YEAR ENDED DECEMBER 31, 2015 TABLE OF CONTENTS YEAR ENDED DECEMBER 31, 2015 INTRODUCTORY SECTION CITY OFFICIALS 1 FINANCIAL SECTION INDEPENDENT AUDITORS
CITY OF BANNING, CALIFORNIA FINANCIAL STATEMENTS FOR THE FISCAL YEAR ENDED JUNE 30, 2017
 , CALIFORNIA FINANCIAL STATEMENTS FOR THE FISCAL YEAR ENDED JUNE 30, 2017 THIS PAGE INTENTIONALLY LEFT BLANK FINANCIAL STATEMENTS FOR THE FISCAL YEAR ENDED JUNE 30, 2017 TABLE OF CONTENTS Page Number INDEPENDENT
City of Grand Ledge. FINANCIAL STATEMENTS (With Required Supplementary Information) June 30, 2018
 June 30, 2018") FINANCIAL STATEMENTS (With Required Supplementary Information) TABLE OF CONTENTS Page INDEPENDENT AUDITOR S REPORT MANAGEMENT S DISCUSSION AND ANALYSIS i-iii iv-x BASIC FINANCIAL STATEMENTS Government-wide
FINANCIAL STATEMENTS (With Required Supplementary Information) TABLE OF CONTENTS Page INDEPENDENT AUDITOR S REPORT MANAGEMENT S DISCUSSION AND ANALYSIS i-iii iv-x BASIC FINANCIAL STATEMENTS Government-wide
FINANCIAL REPORT (unaudited)
") FINANCIAL REPORT (unaudited) For the Quarter Ended June 30, 2018 *** UNAUDITED - FOR INTERNAL REVIEW*** Page Financial Information... 1 Management s Discussion and Analysis Statements of Net Position Statements
FINANCIAL REPORT (unaudited) For the Quarter Ended June 30, 2018 *** UNAUDITED - FOR INTERNAL REVIEW*** Page Financial Information... 1 Management s Discussion and Analysis Statements of Net Position Statements
HENDRY COUNTY, FLORIDA
 HENDRY COUNTY, FLORIDA ANNUAL FINANCIAL REPORT FOR THE FISCAL YEAR ENDED SEPTEMBER 30, 2015 PREPARED BY: BARBARA S. BUTLER CLERK OF THE CIRCUIT COURT STEVE CLARK FINANCE DIRECTOR TABLE OF CONTENTS SECTION
LOUIS ARMSTRONG NEW ORLEANS INTERNATIONAL AIRPORT (A Proprietary Component Unit of the City of New Orleans) Table of Contents
 Table of Contents") Table of Contents Independent Auditors Report 1 3 Management s Discussion and Analysis 4 16 Financial Statements: Statements of Net Position as of 17 18 Statements of Revenues, Expenses, and Changes in
Table of Contents Independent Auditors Report 1 3 Management s Discussion and Analysis 4 16 Financial Statements: Statements of Net Position as of 17 18 Statements of Revenues, Expenses, and Changes in
FINANCIAL REPORT (unaudited)
") FINANCIAL REPORT (unaudited) For the Quarter Ended September 30, 2018 *** UNAUDITED - FOR INTERNAL REVIEW*** Page Financial Information... 1 Management s Discussion and Analysis Statements of Net Position
FINANCIAL REPORT (unaudited) For the Quarter Ended September 30, 2018 *** UNAUDITED - FOR INTERNAL REVIEW*** Page Financial Information... 1 Management s Discussion and Analysis Statements of Net Position
WEST BAY SANITARY DISTRICT FINANCIAL STATEMENTS AND INDEPENDENT AUDITOR S REPORT JUNE 30, 2015 * * *
 WEST BAY SANITARY DISTRICT FINANCIAL STATEMENTS AND INDEPENDENT AUDITOR S REPORT JUNE 30, 2015 * * * CHAVAN & ASSOCIATES LLP CERTIFIED PUBLIC ACCOUNTANTS 1475 SARATOGA AVE, SUITE 180 SAN JOSE, CA 95129
FINANCIAL REPORT (unaudited)
") FINANCIAL REPORT (unaudited) For the Quarter Ended March 31, 2018 *** UNAUDITED - FOR INTERNAL REVIEW*** Page Financial Information... 1 Management s Discussion and Analysis Statements of Net Position
FINANCIAL REPORT (unaudited) For the Quarter Ended March 31, 2018 *** UNAUDITED - FOR INTERNAL REVIEW*** Page Financial Information... 1 Management s Discussion and Analysis Statements of Net Position
CITY OF COATESVILLE COATESVILLE, PENNSYLVANIA
 COATESVILLE, PENNSYLVANIA BASIC FINANCIAL STATEMENTS WITH SUPPLEMENTARY INFORMATION DECEMBER 31, 2015 TABLE OF CONTENTS INDEPENDENT AUDITOR S REPORT 1-3 PAGE MANAGEMENT S DISCUSSION AND ANALYSIS 4-13 BASIC
Basic Financial Statements and Report of Independent Certified Public Accountants City of Dallas, Texas Dallas Water Utilities (An Enterprise Fund of
 Basic Financial Statements and Report of Independent Certified Public Accountants City of Dallas, Texas September 30, 2016 FINANCIAL STATEMENTS For Fiscal Year Ended September 30, 2016 TABLE OF CONTENTS
CITY OF INGLEWOOD BASIC FINANCIAL STATEMENTS AND SUPPLEMENTAL INFORMATION FOR THE YEAR ENDED SEPTEMBER 30, 2015
 BASIC FINANCIAL STATEMENTS AND SUPPLEMENTAL INFORMATION FOR THE YEAR ENDED SEPTEMBER 30, 2015 BASIC FINANCIAL STATEMENTS AND SUPPLEMENTAL INFORMATION FOR THE YEAR ENDED SEPTEMBER 30, 2015 THIS PAGE INTENTIONALLY
ESSEX COUNTY COLLEGE (A Component Unit of the County of Essex) FINANCIAL STATEMENTS AND SUPPLEMENTARY INFORMATION YEARS ENDED JUNE 30, 2018 AND 2017
 FINANCIAL STATEMENTS AND SUPPLEMENTARY INFORMATION YEARS ENDED JUNE 30, 2018 AND 2017") (A Component Unit of the County of Essex) FINANCIAL STATEMENTS AND SUPPLEMENTARY INFORMATION YEARS ENDED JUNE 30, 2018 AND 2017 CliftonLarsonAllen LLP TABLE OF CONTENTS YEARS ENDED JUNE 30, 2018 AND 2017
(A Component Unit of the County of Essex) FINANCIAL STATEMENTS AND SUPPLEMENTARY INFORMATION YEARS ENDED JUNE 30, 2018 AND 2017 CliftonLarsonAllen LLP TABLE OF CONTENTS YEARS ENDED JUNE 30, 2018 AND 2017
FORT WAYNE-ALLEN COUNTY AIRPORT AUTHORITY FORT WAYNE, INDIANA COMPREHENSIVE ANNUAL FINANCIAL REPORT FISCAL YEAR ENDED DECEMBER 31, 2016.
 FORT WAYNE, INDIANA COMPREHENSIVE ANNUAL FINANCIAL REPORT FISCAL YEAR ENDED DECEMBER 31, 2016 Prepared by: Ronnie C. Portis, CPA Controller Sabrina P. Driver Accounting Janice R. Lewis Accounting This
BRAWLEY ELEMENTARY SCHOOL DISTRICT COUNTY OF IMPERIAL BRAWLEY, CALIFORNIA ANNUAL FINANCIAL REPORT JUNE 30, 2016
 COUNTY OF IMPERIAL BRAWLEY, CALIFORNIA ANNUAL FINANCIAL REPORT JUNE 30, 2016 Wilkinson Hadley King & Co. LLP CPA's and Advisors 218 W. Douglas Ave El Cajon, CA 92020 Introductory Section Brawley Elementary
HUNTSVILLE-MADISON COUNTY AIRPORT AUTHORITY AUDITED FINANCIAL STATEMENTS JUNE 30, 2017 AND 2016
 HUNTSVILLE-MADISON COUNTY AIRPORT AUTHORITY AUDITED FINANCIAL STATEMENTS JUNE 30, 2017 AND 2016 CONTENTS FINANCIAL STATEMENTS Independent Auditor's Report Page 1 Management s Discussion and Analysis 3
Jackson County Board of Education
 Jackson County Board of Education Financial Statements Year Ended June 30, 2018 Sylva, North Carolina Members of the Board of Education Ali Laird-Large, Chairperson Elizabeth Cooper, Vice Chairperson Abigail
TEMPLETON COMMUNITY SERVICES DISTRICT FINANCIAL STATEMENTS JUNE 30, 2018
 TEMPLETON COMMUNITY SERVICES DISTRICT FINANCIAL STATEMENTS L & C Leaf & Cole, LLP Certified Public Accountants FINANCIAL STATEMENTS TABLE OF CONTENTS Independent Auditor s Report 1-2 Management s Discussion
MARK TWAIN UNION ELEMENTARY SCHOOL DISTRICT ANNUAL FINANCIAL REPORT FOR THE YEAR ENDED JUNE 30, 2018
 MARK TWAIN UNION ELEMENTARY SCHOOL DISTRICT ANNUAL FINANCIAL REPORT FOR THE YEAR ENDED This page left blank intentionally. TABLE OF CONTENTS FOR THE YEAR ENDED FINANCIAL SECTION Independent Auditor's Report
COLUSA COUNTY LOCAL TRANSPORTATION COMMISSION, CALIFORNIA
 COLUSA COUNTY LOCAL TRANSPORTATION COMMISSION, CALIFORNIA FINANCIAL STATEMENTS TOGETHER WITH INDEPENDENT AUDITOR S REPORT FOR THE YEAR ENDED JUNE 30, 2016 THIS PAGE INTENTIONALLY LEFT BLANK Annual Financial
DES MOINES AIRPORT AUTHORITY. Basic Financial Statements, Required Supplementary Information and OMB Uniform Guidance Reports.
 a discretely presented component unit of the City of Des Moines, Iowa Basic Financial Statements, Required Supplementary Information and OMB Uniform Guidance Reports (With Independent Auditors Reports
CAFR COMPREHENSIVE ANNUAL FINANCIAL REPORT
 C I T Y OF LY N WO OD FISCAL YEAR 2014-2015 CAFR COMPREHENSIVE ANNUAL FINANCIAL REPORT Y E A R E N DING J U N E 3 0, 2 0 1 5 Comprehensive Annual Financial Report City of Lynwood, California with Report
Town of Wells, Maine
 Audited Financial Statements and Other Financial Information Town of Wells, Maine June 30, 2018 Proven Expertise and Integrity CONTENTS PAGE INDEPENDENT AUDITORS' REPORT 1-3 MANAGEMENT S DISCUSSION AND
MARPLE NEWTOWN SCHOOL DISTRICT FINANCIAL STATEMENTS AND SINGLE AUDIT. For the Year Ended June 30, 2016
 FINANCIAL STATEMENTS AND SINGLE AUDIT For the Year Ended June 30, 2016 TABLE OF CONTENTS Page INDEPENDENT AUDITOR S REPORT 1 MANAGEMENT S DISCUSSION AND ANALYSIS (Unaudited) 4 BASIC FINANCIAL STATEMENTS
NIAGARA FRONTIER TRANSPORTATION AUTHORITY (A Component Unit of the State of New York) FINANCIAL STATEMENTS. MARCH 31, 2018 and 2017
 FINANCIAL STATEMENTS. MARCH 31, 2018 and 2017") NIAGARA FRONTIER TRANSPORTATION AUTHORITY FINANCIAL STATEMENTS MARCH 31, 2018 and 2017 Table of Contents Page Independent Auditors Report 1 Management Certification: Management s Certification of the Financial
NIAGARA FRONTIER TRANSPORTATION AUTHORITY FINANCIAL STATEMENTS MARCH 31, 2018 and 2017 Table of Contents Page Independent Auditors Report 1 Management Certification: Management s Certification of the Financial
Town of Ogunquit, Maine
 Audited Financial Statements and Other Financial Information Town of Ogunquit, Maine June 30, 2017 Proven Expertise and Integrity CONTENTS PAGE INDEPENDENT AUDITORS' REPORT 1-3 MANAGEMENT S DISCUSSION
CITY OF NEDERLAND, TEXAS. Comprehensive Annual Financial Report
 Comprehensive Annual Financial Report For the Year Ended September 30, 2014 Prepared by the Finance Department INTRODUCTORY SECTION Comprehensive Annual Financial Report September 30, 2014 Table of Contents
Accounting & Consulting Group, LLP. Certified Public Accountants
 Accounting & Consulting Group, LLP Certified Public Accountants STATE OF NEW MEXICO CITY OF EUNICE HOUSING AUTHORITY A COMPONENT UNIT OF THE CITY OF EUNICE, NEW MEXICO ANNUAL FINANCIAL REPORT FOR THE
CITY OF CENTERVILLE, GEORGIA ANNUAL FINANCIAL REPORT FOR THE FISCAL YEAR ENDED JUNE 30, 2013
 ANNUAL FINANCIAL REPORT FOR THE FISCAL YEAR ENDED JUNE 30, 2013 NICHOLS, CAULEY & ASSOCIATES, LLC Certified Public Accountants Certified Financial Planners Certified Internal Auditors Certified Government
SALEM CITY CORPORATION FINANCIAL STATEMENTS
 FINANCIAL STATEMENTS FOR THE YEAR ENDED JUNE 30, 2016 ii Table of Contents Introductory Section Page Letter of transmittal... 3 Financial Section Independent Auditors Report... 7 Management Discussion
Parking Authority of the City of Paterson, NJ
 Parking Authority of the City of Paterson, NJ Financial Statements Years Ended Parking Authority of the City of Paterson, NJ Table of Contents PAGE Management's Discussion and Analysis 1 Independent Auditors'
(This page intentionally left blank.)
") (This page intentionally left blank.) ANNUAL FINANCIAL REPORT of the For the Year Ended (This page intentionally left blank.) TABLE OF CONTENTS FINANCIAL SECTION Independent Auditor s Report 1 Management
(This page intentionally left blank.) ANNUAL FINANCIAL REPORT of the For the Year Ended (This page intentionally left blank.) TABLE OF CONTENTS FINANCIAL SECTION Independent Auditor s Report 1 Management
CITY OF PAHOKEE, FLORIDA FINANCIAL STATEMENTS WITH INDEPENDENT AUDITOR S REPORT THEREON
 FINANCIAL STATEMENTS WITH INDEPENDENT AUDITOR S REPORT THEREON FISCAL YEAR ENDED SEPTEMBER 30, 2014 FINANCIAL STATEMENTS SEPTEMBER 30, 2014 TABLE OF CONTENTS Pages FINANCIAL SECTION Independent Auditor
MUSTANG SPECIAL UTILITY DISTRICT
 MUSTANG SPECIAL UTILITY DISTRICT of Denton County, Texas COMPREHENSIVE ANNUAL FINANCIAL REPORT FOR THE FISCAL YEAR ENDED SEPTEMBER 30, 2016 General Manager Chris Boyd Finance Director Patty Parks MUSTANG
COMPREHENSIVE ANNUAL FINANCIAL REPORT
 (A Discretely Presented Component Unit of the Charter County of Wayne, Michigan) COMPREHENSIVE ANNUAL FINANCIAL REPORT For the Year Ended (A Discretely Presented Component Unit of the Charter County of
WAYNE COUNTY AIRPORT AUTHORITY (A Discretely Presented Component Unit of the Charter County of Wayne, Michigan) Comprehensive Annual Financial Report
 Comprehensive Annual Financial Report") (A Discretely Presented Component Unit of the Charter County of Wayne, Michigan) Comprehensive Annual Financial Report Year Ended Prepared by: Controller s Office Table of Contents Page(s) Introductory
(A Discretely Presented Component Unit of the Charter County of Wayne, Michigan) Comprehensive Annual Financial Report Year Ended Prepared by: Controller s Office Table of Contents Page(s) Introductory
AUGUSTA REGIONAL AIRPORT AT BUSH FIELD
 Augusta, Georgia Financial Statements for the years ended December 31, 2008 and 2007 Management s Discussion and Analysis (Unaudited) The following discussion and analysis of the financial performance
VILLAGE OF GOLF, FLORIDA COMPREHENSIVE ANNUAL FINANCIAL REPORT FOR THE FISCAL YEAR ENDED SEPTEMBER 30, 2014
 VILLAGE OF GOLF, FLORIDA COMPREHENSIVE ANNUAL FINANCIAL REPORT FOR THE FISCAL YEAR ENDED SEPTEMBER 30, 2014 Prepared by: Finance Department VILLAGE OF GOLF, FLORIDA TABLE OF CONTENTS INTRODUCTORY SECTION
City and County of Denver Municipal Airport System ANNUAL FINANCIAL REPORT December 31, 2014 and 2013
 ANNUAL FINANCIAL REPORT ANNUAL FINANCIAL REPORT TABLE OF CONTENTS Page Introductory Section (Unaudited) Introduction 1 Financial Section Independent Auditor s Report 8 Management s Discussion and Analysis
CITY DEPARTM DIVISIO REPORT ON
 CITY OF CLE EVELAND, OHIO DEPARTM MENT OF PUBLIC UTILITIES DIVISIO N OF WATER REPORT ON AUDIT OF FINANCIAL STATEMENTS For the year ended December 31, 2016 This page intentionally left blank. TABLE OF CONTENTS
CITY OF GLENCOE, MINNESOTA FINANCIAL STATEMENTS AND SUPPLEMENTARY INFORMATION YEAR ENDED DECEMBER 31, 2014
 FINANCIAL STATEMENTS AND SUPPLEMENTARY INFORMATION YEAR ENDED DECEMBER 31, 2014 TABLE OF CONTENTS DECEMBER 31, 2014 INTRODUCTORY SECTION1 CITY OFFICIALS 1 FINANCIAL SECTION2 INDEPENDENT AUDITORS REPORT
FINANCIAL STATEMENTS. (Unaudited) Six Months Ended. March 31, 2016 and 2015
 Six Months Ended. March 31, 2016 and 2015") FINANCIAL STATEMENTS (Unaudited) Six Months Ended March 31, 2016 and 2015 GREATER ORLANDO AVIATION AUTHORITY Orlando, Florida TABLE OF CONTENTS Page ORLANDO INTERNATIONAL AIRPORT Independent Accountants
FINANCIAL STATEMENTS (Unaudited) Six Months Ended March 31, 2016 and 2015 GREATER ORLANDO AVIATION AUTHORITY Orlando, Florida TABLE OF CONTENTS Page ORLANDO INTERNATIONAL AIRPORT Independent Accountants
WISCONSIN INDIANHEAD TECHNICAL COLLEGE
 WISCONSIN INDIANHEAD TECHNICAL COLLEGE Annual Audited Financial Statements for fiscal year ending, June 30, 2017 Wisconsin Indianhead Technical College District Shell Lake, WI Financial Statements With
SALEM CITY CORPORATION FINANCIAL STATEMENTS
 FINANCIAL STATEMENTS FOR THE YEAR ENDED JUNE 30, 2017 Allred Jackson, PC 50 East 2500 North, Suite 200 North Logan, UT 84341 (P) 435.752.6441 (F) 435.752.6451 www.allredjackson.com ii Table of Contents
CITY OF ALTURAS ALTURAS, CALIFORNIA BASIC FINANCIAL STATEMENTS
 CITY OF ALTURAS ALTURAS, CALIFORNIA BASIC FINANCIAL STATEMENTS JUNE 30, 2016 TABLE OF CONTENTS PAGE Independent Auditors Report 1-2 Management s Discussion and Analysis 3-10 Basic Financial Statements:
HOUSING AND DINING SYSTEM
 Table of Contents Management s Discussion and Analysis... 3 Independent Auditor s Report... 11 Financial Statements Statements of Net Position... 14 Statements of Revenues, Expenses and Changes in Net
WISCONSIN INDIANHEAD TECHNICAL COLLEGE
 WISCONSIN INDIANHEAD TECHNICAL COLLEGE Annual Audited Financial Statements for fiscal year ended June 30, 2012 Wisconsin Indianhead Technical College District Shell Lake, WI Financial Statements With
CITY OF HEMPHILL, TEXAS ANNUAL FINANCIAL REPORT FOR THE YEAR ENDED JUNE 30, 2015
 ANNUAL FINANCIAL REPORT FOR THE YEAR ENDED JUNE 30, 2015 Annual Financial Report For the Year Ended June 30, 2015 Table of Contents Page FINANCIAL SECTION Independent Auditor s Report... 1-3 Management
Town of Wells, Maine
 Audited Financial Statements and Other Financial Information Town of Wells, Maine June 30, 2017 Proven Expertise and Integrity CONTENTS JUNE 30, 2017 PAGE INDEPENDENT AUDITORS' REPORT 1-3 MANAGEMENT S
CITY OF LAGUNA BEACH, CALIFORNIA. Comprehensive Annual Financial Report. For the Fiscal Year Ended June 30, 2015
 CITY OF LAGUNA BEACH, CALIFORNIA Comprehensive Annual Financial Report For the Fiscal Year Ended June 30, 2015 CITY OF LAGUNA BEACH, CALIFORNIA COMPREHENSIVE ANNUAL FINANCIAL REPORT FOR THE FISCAL YEAR
Essex County College (A Component Unit of the County of Essex)
") Basic Financial Statements, Management s Discussion and Analysis and Schedules of Expenditures of Federal and State Awards (With Independent Auditors Reports Thereon) Report on Financial Statements and
Basic Financial Statements, Management s Discussion and Analysis and Schedules of Expenditures of Federal and State Awards (With Independent Auditors Reports Thereon) Report on Financial Statements and
The University of North Florida Financing Corporation, Inc.
 The University of North Florida Financing Corporation, Inc. Financial Statements and Supplementary Information as of and for the Years Ended June 30, 2015 and 2014, and Independent Auditor s Report The
In the opinion of Gilmore & Bell, P.C., Bond Counsel, under existing law and assuming continued compliance with certain requirements of the Internal
 In the opinion of Gilmore & Bell, P.C., Bond Counsel, under existing law and assuming continued compliance with certain requirements of the Internal Revenue Code of 1986, as amended (the Code ), (a) (1)