APPENDIX FOR FIVE FACTS ABOUT BELIEFS AND PORTFOLIOS
|
|
|
- Cathleen Park
- 5 years ago
- Views:
Transcription
1 APPENDIX FOR FIVE FACTS ABOUT BELIEFS AND PORTFOLIOS Stefano Giglio Matteo Maggiori Johannes Stroebel Steve Utkus A.1 RESPONSE RATES We next provide more details on the response rates to the GMS-Vanguard Survey. The top panel of Figure A.1 reports the number of responses in each wave, with different shades of gray tracking the first wave in which an individual responded. Starting in wave 5, we receive more responses from individuals who are re-respondents than from individuals who are responding for the first time. The bottom panel shows that about 35% of responses come from individuals who have responded to one survey only (though some of these may end up responding to future surveys). Over 25% of responses come from individuals who have responded to at least four survey waves, and 10% come from individuals who have responded to at least six survey waves. Figure A.1: Number of Responses by Wave Number of Responses ,000 1,500 2,000 2,500 Number of Responses per Wave First Wave Answered Number of Responses 0 2,000 4,000 6,000 8,000 Number of Responses By Total Responses from Respondent First Wave Answered Note: Figure shows number of responses to the GMS-Vanguard Survey. The top panel shows the number of responses per wave. The bottom panel shows the total number of responses separately by how many survey waves a person has responded to. In both panels, the colors correspond to the waves in which these individuals first answered. A.1
2 A.2 TRADING DATA In this Appendix, provide more details on the data construction for our trading analysis. For investors with retail accounts (which are 80% of the Vanguard investors we contacted), we have obtained transaction-level data since we began administering our survey (beginning of 2017). For each trade by a Vanguard investor in our sample, we observe the anonymized id of the investor (that can be linked to the survey), the day of the trade, the amount traded, and the CUSIP and ticker of the security traded. We also observe the asset class composition of each security (individual security or fund): percentage invested in equity, fixed-income, cash, other, and unknown (we group other and unknown together). The classification is provided to us directly by Vanguard. For individual securities, the classification is relatively obvious: equity securities are classified as 100% equity, bonds as 100% fixed income, etc...for mutual funds and ETFs, Vanguard relies on both internal data (for Vanguard operated funds) and external data (from Morningstar) to divide the investment of the funds in the various asset classes. Finally, the data contains a code that describes the type of transaction: whether it s a purchase of an asset with cash, a sale, an exchange of two different stocks, a purchase with cash from outside Vanguard, and so on. We use this information to compute, for each trade, how the portfolio allocation into equity, fixed income, cash and other investments (as well as outside money) changes as a result of the trade. We do so by combining the information about the type of trade (buy, sell, etc) with the dollar amount of the trade and with the allocation of the asset traded into asset classes (equity, fixed income, etc). We divide our sample period in two-week intervals (for each month, from the 1st to the 15th of the month, and from the 15th to the end of the month). We do this in two-week increments because our survey is administered around the 15th of the month. Each trade is then assigned to the corresponding interval, and all trades are aggregated by interval. This procedure yields, for each interval, the total increase/decrease in equity, fixed income, cash, and other and unknown in the portfolio during the interval, as well as the total inflow/outflow of money from Vanguard and the total volume of trade during the interval. We then merge this transaction data with the portfolio data, which are snapshots of the portfolios held at the end of each month. We can then compute the change during the interval in the fraction of portfolio allocated to equity, fixed income, cash and other due to trading. For intervals starting on the 15th of the month (for which therefore we do not observe the snapshot of the market value of the portfolio at that point in time), we use instead the imputed value of the portfolio combining the beginning-of-month portfolio value and the change in value due to trading during the first two weeks. The analysis in the main body of the paper focuses on windows" between any two consecutive surveys answered by each individual. An individual, for example, might have answered wave 1 and 3 of the survey, so that a four-month window has passed between the two answers. For the analysis in the paper, we aggregate all the 15-day intervals in each window to focus on trading that occurred during the window. A.2
3 A.3 BELIEFS AND PORTFOLIOS: A LOG-LOG SPECIFICATION We report here a modification to the specification in Equation 1 in which we regress the logarithm of portfolio shares on the logarithm of expected excess returns and the logarithm of the subjective variance. We have to exclude observations in which either the portfolio share or the expected excess returns are too close to zero or negative. 1 Table A.1: Beliefs and Portfolios: The Log-Log Specification log(equity Share (%)) (1) (2) (3) log(expected 1Y Excess Stock Return (%)) 0.092*** 0.088*** (0.010) (0.009) (0.008) log(standard Deviation 1Y Stock Return (%)) 0.046* (0.021) (0.020) (0.016) Controls N Y Y Individual Fixed Effects N N Y R Squared N 14,489 14,483 14,483 Note: Table shows results from the Log-Log specification discussed in Section A.3. The unit of observation is a survey response, the dependent variable is the logarithm of the equity share. Column 2 also control for the respondents age, gender, region of residence, wealth, and the survey wave. Column 3 includes individual fixed effects. Standard errors are clustered at the respondent level. Significance levels: (p<0.10), (p<0.05), (p<0.01). Table A.1 reports the results. The first two columns differ only in the inclusion of controls. Similarly to our main specification, we find a robust and statistically significant relationship between portfolio shares and expected (excess) returns, but a weak relationship with the subjective standard deviation. According to the Merton (1969) model, the coefficient predictions are: 1 on expected excess returns and 2 on subjective standard deviation. For expected returns, instead, we find a coefficient of 0.09, approximately 10 times too small. This specification, therefore, further confirms the result of a statistically robust but small sensitivity of portfolio shares to expected returns. Under the Merton (1969) model, the coefficient of relative risk aversion enters this specification in a linearly additive manner, and therefore individual heterogeneity in risk aversion can be controlled for by individual fixed effects. Column 3 of Table A.1 reports the corresponding results; the equity sensitivity is still positive but much smaller at The estimate is also no longer statistically significant. The lack of significance can be understood in the context of our trading analysis in Section II.D. A regression with individual fixed effects is identifying off the time-series variation within each individual of beliefs and portfolio shares. Since trading occurs very infrequently, this variation mostly reflects market changes to which the agent does not respond, thus providing a noisy relationship between beliefs and portfolio changes. 1 We impose that portfolio equity share is between 1% and 100%, and expected excess return are between 1% and 13%. The upper bound of 13% is chosen to be comparable with the restriction of 15% expected returns used in the main body of the paper given 1-year treasuries rates around 2% during this period. A.3
4 A.4 BELIEFS AND DEMOGRAPHICS: FULL RESULTS In the main body of the paper, we explored the relationships between beliefs and portfolios, conditional on demographic characteristics of the individual survey respondents. In Table III, we focused on presenting our main coefficients of interest. Column 1 of Table A.2 additionally shows the coefficients on the control variables corresponding to Column 1 of Table III. Equity shares are decreasing significantly across age groups. Relative to individuals below the age of 40, those aged above 60 have an equity share that more than 20 percentage points lower. This relationship between age and equity shares is consistent with standard advice on asset allocation when saving for retirement, where the implied risk aversion is increasing as individuals approach retirement age. It is also consistent with the asset allocation in target retirement funds. Equity shares are not systematically different across gender, region of location, and wealth quintiles. Table A.2: Beliefs by Demographics (1) (2) (3) (4) (5) (6) (7) (8) (9) (10) Equity Share (%) Expected 1 Year Stock Returns Standard Dev. Expected 1 Year Stock Returns Probability 1 Year Stock Returns < 30% Expected 10 Year Stock Returns Expected 1 Year Bond Returns Expected 3 Year GDP Growth Expected 10 Year GDP Growth Difficulty of Stock Question Confidence in Stock Answer Expected 1Y Stock Return (%) 0.749*** (0.052) Male * 0.313*** 0.210*** 0.434*** 0.241*** 0.201*** (0.643) (0.108) (0.101) (0.159) (0.076) (0.060) (0.045) (0.053) (0.022) (0.018) Age [40, 50] 5.498*** ** ** *** (0.920) (0.235) (0.184) (0.276) (0.139) (0.100) (0.081) (0.095) (0.037) (0.037) Age [50, 60] *** 0.656** 0.993*** 0.510* *** * 0.207*** (0.865) (0.200) (0.161) (0.235) (0.125) (0.093) (0.076) (0.087) (0.033) (0.033) Age [60, 70] *** 0.432* 1.288*** * *** *** 0.088** (0.859) (0.187) (0.152) (0.230) (0.116) (0.088) (0.068) (0.082) (0.032) (0.031) Age > *** 0.581** 1.702*** 0.666** *** 0.220** 0.270*** (0.982) (0.204) (0.164) (0.247) (0.124) (0.097) (0.071) (0.083) (0.036) (0.033) Region North (0.865) (0.145) (0.133) (0.222) (0.092) (0.084) (0.053) (0.064) (0.028) (0.024) Region South ** 0.162* (0.802) (0.135) (0.123) (0.199) (0.087) (0.078) (0.047) (0.059) (0.026) (0.023) Region West *** ** ** 0.148* (0.845) (0.151) (0.125) (0.209) (0.089) (0.080) (0.048) (0.060) (0.027) (0.024) Wealth Quintile ** *** 0.315*** 0.245*** 0.192* (1.008) (0.168) (0.143) (0.227) (0.112) (0.084) (0.066) (0.078) (0.029) (0.026) Wealth Quntile *** 0.550*** 0.351*** 0.401*** 0.094** (1.004) (0.158) (0.144) (0.245) (0.114) (0.085) (0.063) (0.075) (0.030) (0.026) Wealth Quintile * *** 0.692*** 0.373*** 0.451*** 0.097** (1.041) (0.167) (0.147) (0.225) (0.115) (0.088) (0.064) (0.075) (0.031) (0.027) Wealth Quintile *** 0.306* 0.743*** 0.771*** 1.158*** 0.570*** 0.690*** 0.107*** 0.02 (1.004) (0.163) (0.144) (0.212) (0.109) (0.096) (0.059) (0.070) (0.031) (0.027) Wave Fixed Effects Y Y Y Y Y Y Y Y Y Y R Squared N 19,478 19,732 19,933 19,933 19,627 19,542 19,663 19,537 20,099 19,920 Note: Column 1 shows coefficients from a regression of portfolio equity shares on beliefs and demographic controls. Columns 2-10 show coefficients of regressions of answers to the various survey questions on demographic controls. Standard errors are clustered at the respondent level. Significance levels: (p<0.10), (p<0.05), (p<0.01). Columns 2-10 of Table A.2 show the coefficients on the control variables from a regression of survey responses on these demographic controls. As highlighted in Section III, the overall predictive power of these controls for beliefs is relatively low, and all regressions have a relatively low R 2. A few interesting and systematic patterns emerge nevertheless. First, in our sample, older individ- A.4
5 uals are marginally more optimistic about expected stock returns and about 3-year GDP growth; their subjective distribution over future stock returns also has a lower standard deviation. Confidence in own beliefs about stock market returns by age has an inverse-u shape. Second, there is no large difference between men and women in terms of their stock market expectations, but men expect both GDP growth and bond returns to be lower. Men also find the questions less difficult, and are more confidence in their answers. Wealthier individuals are more pessimistic across most of their beliefs; this effect is smallest for the 1-year stock market expectations. In addition, wealthier individuals find the questions easier, on average, though they are no more confident in their answers than less wealthy individuals. Across Census regions, there is some evidence that residents from the Western Region are somewhat more pessimistic, both in terms of expected stock returns and expected GDP growth. A.5 VARIANCE DECOMPOSITION OF BELIEFS (RAND) In this Appendix, we repeat the variance decomposition of beliefs from Section III using the RAND survey. As discussed in the main body of the paper, the RAND survey covers a smaller crosssection (4,734 individuals) but a longer time series than the GMS-Vanguard survey, with 1,032 individuals responding at least 50 times. Table A.3: Decomposing Variation in Beliefs: Individual and Time Fixed Effects (RAND) R 2 (%) Reg (4) Reg (5) Reg (6) N Prob. Ret > 0% (1yr) ,475 Prob. Ret > 20% (1yr) ,358 Prob. Ret < 20% (1yr) ,442 Prob. Ret > 0% (10yr, cumul.) ,475 Prob. Ret > 20% (10yr, cumul.) ,052 Prob. Ret < 20% (10yr, cumul.) ,996 Note: Table shows R 2 s corresponding to the three regressions 4, 5, and 6, using the RAND survey. Each row corresponds to a different question in the survey. In Table A.3, we repeat the analysis from Table VII in the text, reporting the share of total variance that is explained by time fixed effects, individual fixed effects, and both. We require that individuals have responded at least 3 times, consistent with Table VII in the text that uses the GMS-Vanguard survey. We perform the analysis using six different questions asked in the RAND survey: the probability that the 1-year return is above 0%, agove 20% or below -20%, and the probability that the cumulative 10-year return is above 0%, above 20%, or below -20%. Table A.4 repeats the robustness exercise from Table VIII, and increases the number of responses required to be included in the analysis from 3 to 50. Both tables show results qualitatively and quantitatively similar to the ones in the GMS-Vanguard survey, with the individual fixed effects robustly explaining 50-60% of the total variation, and the time fixed effects explaining 1-4%. A.5
6 Table A.4: Decomposing Variation in Beliefs: Robustness (RAND) Panel A: R 2 (total, %) #Resp 3 #Resp 4 #Resp 5 #Resp 6 #Resp 10 #Resp 30 #Resp 50 Prob. Ret > 0% (1yr) Prob. Ret > 20% (1yr) Prob. Ret < -20% (1yr) Prob. Ret > 0% (10yr, cumul.) Prob. Ret > 20% (10yr, cumul.) Prob. Ret < -20% (10yr, cumul.) Panel B: N. of obs. #Resp 3 #Resp 4 #Resp 5 #Resp 6 #Resp 10 #Resp 30 #Resp 50 Prob. Ret > 0% (1yr) 3,475 3,349 3,211 3,135 2, Prob. Ret > 20% (1yr) 3,358 3,215 3,067 2,970 2, Prob. Ret < -20% (1yr) 3,442 3,305 3,163 3,077 2, Prob. Ret > 0% (10yr, cumul.) 3,475 3,345 3,205 3,123 2, Prob. Ret > 20% (10yr, cumul.) 3,052 2,836 2,654 2,425 1, Prob. Ret < -20% (10yr, cumul.) 2,996 2,780 2,576 2,348 1, Note: Panel A of the table reports the R 2 statistics corresponding to regression 5. In each column, going from left to right, we increase from 3 to 50 the minimum number of responses for an individual to be included in the sample. Panel B reports the number of observations. Each row corresponds to a different question in the survey. A.6
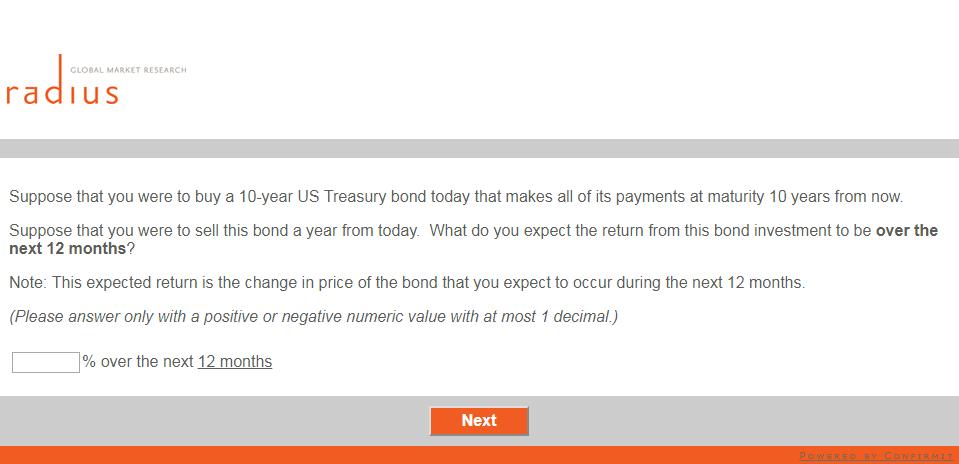
7 B.1 INVITATION AND SURVEY FLOW In this Appendix, we present screenshots of one complete survey flow. In this iteration of the flow, questions about expected stock returns were asked ahead of questions about expected GDP growth; the Printsurvey implementation randomizes across these two blocks of questions. We begin by reviewing the invitation sent to individuals from Vanguard. Print - Close Window Subject: From: To: Date: [TEST]We need your help, Jane Doe Vanguard (vanguard@eonline.e-vanguard.com) oea_test@yahoo.com; Monday, February 13, :58 AM Vanguard would like your input Dear Jane Doe: Vanguard is conducting a study to understand how investors are thinking about the future of the stock market, the economy and interest rates. We are inviting you to provide us with your thoughts by completing a short survey. This survey should take less than ten minutes to complete. This survey is not a test of your knowledge. Rather, it asks only about your beliefs and expectations. Importantly, it does not ask for any personal financial information. The results of the survey will be used for research purposes only. This survey is not sales-related in any way. Your responses will be reported in aggregate with other responses. We plan to publish the results in an article or research report on vanguard.com. To participate in the survey, please click here. Take the survey We'd also like to send you this survey up to six times in the coming year, to see if your beliefs are changing. If you want to be removed from this study, you have the option to click the unsubscribe link below. If you have any questions about this survey, please call and refer to this code: EXP. Thank you for participating, and for sharing your thoughts with Vanguard. Regards, Print Stephen Utkus Principal Vanguard Legal notices Please click here to be removed from this study. 11:01:01 AM] 2017 The Vanguard Group, Inc. All rights reserved. Privacy policy 455 Devon Park Drive Wayne, PA vanguard.com EXP B.1


8 B.2

9 B.3
10 B.4


11 B.5

12 B.6

13 B.7
14 B.8
15 B.9
16 B.10
Data Appendix. A.1. The 2007 survey
 Data Appendix A.1. The 2007 survey The survey data used draw on a sample of Italian clients of a large Italian bank. The survey was conducted between June and September 2007 and elicited detailed financial
Internet Appendix. The survey data relies on a sample of Italian clients of a large Italian bank. The survey,
 Internet Appendix A1. The 2007 survey The survey data relies on a sample of Italian clients of a large Italian bank. The survey, conducted between June and September 2007, provides detailed financial and
Online Appendix of. This appendix complements the evidence shown in the text. 1. Simulations
 Online Appendix of Heterogeneity in Returns to Wealth and the Measurement of Wealth Inequality By ANDREAS FAGERENG, LUIGI GUISO, DAVIDE MALACRINO AND LUIGI PISTAFERRI This appendix complements the evidence
DEPARTMENT OF ECONOMICS. EUI Working Papers ECO 2009/02 DEPARTMENT OF ECONOMICS. A Test of Narrow Framing and Its Origin.
 DEPARTMENT OF ECONOMICS EUI Working Papers ECO 2009/02 DEPARTMENT OF ECONOMICS A Test of Narrow Framing and Its Origin Luigi Guiso EUROPEAN UNIVERSITY INSTITUTE, FLORENCE DEPARTMENT OF ECONOMICS A Test
On-line Appendix: The Mutual Fund Holdings Database
 Unexploited Gains from International Diversification: Patterns of Portfolio Holdings around the World Tatiana Didier, Roberto Rigobon, and Sergio L. Schmukler Review of Economics and Statistics, forthcoming
Bargaining with Grandma: The Impact of the South African Pension on Household Decision Making
 ONLINE APPENDIX for Bargaining with Grandma: The Impact of the South African Pension on Household Decision Making By: Kate Ambler, IFPRI Appendix A: Comparison of NIDS Waves 1, 2, and 3 NIDS is a panel
The Digital Investor Patterns in digital adoption
 The Digital Investor Patterns in digital adoption Vanguard Research July 2017 More than ever, the financial services industry is engaging clients through the digital realm. Entire suites of financial solutions,
Online Appendix: Revisiting the German Wage Structure
 Online Appendix: Revisiting the German Wage Structure Christian Dustmann Johannes Ludsteck Uta Schönberg This Version: July 2008 This appendix consists of three parts. Section 1 compares alternative methods
Public Employees as Politicians: Evidence from Close Elections
 Public Employees as Politicians: Evidence from Close Elections Supporting information (For Online Publication Only) Ari Hyytinen University of Jyväskylä, School of Business and Economics (JSBE) Jaakko
Do Investors Value Dividend Smoothing Stocks Differently? Internet Appendix
 Do Investors Value Dividend Smoothing Stocks Differently? Internet Appendix Yelena Larkin, Mark T. Leary, and Roni Michaely April 2016 Table I.A-I In table I.A-I we perform a simple non-parametric analysis
Appendix A. Additional Results
 Appendix A Additional Results for Intergenerational Transfers and the Prospects for Increasing Wealth Inequality Stephen L. Morgan Cornell University John C. Scott Cornell University Descriptive Results
CEO Attributes, Compensation, and Firm Value: Evidence from a Structural Estimation. Internet Appendix
 CEO Attributes, Compensation, and Firm Value: Evidence from a Structural Estimation Internet Appendix A. Participation constraint In evaluating when the participation constraint binds, we consider three
Web Appendix Figure 1. Operational Steps of Experiment
 Web Appendix Figure 1. Operational Steps of Experiment 57,533 direct mail solicitations with randomly different offer interest rates sent out to former clients. 5,028 clients go to branch and apply for
Cognitive Constraints on Valuing Annuities. Jeffrey R. Brown Arie Kapteyn Erzo F.P. Luttmer Olivia S. Mitchell
 Cognitive Constraints on Valuing Annuities Jeffrey R. Brown Arie Kapteyn Erzo F.P. Luttmer Olivia S. Mitchell Under a wide range of assumptions people should annuitize to guard against length-of-life uncertainty
Firm specific uncertainty around earnings announcements and the cross section of stock returns
 Firm specific uncertainty around earnings announcements and the cross section of stock returns Sergey Gelman International College of Economics and Finance & Laboratory of Financial Economics Higher School
NCSS Statistical Software. Reference Intervals
 Chapter 586 Introduction A reference interval contains the middle 95% of measurements of a substance from a healthy population. It is a type of prediction interval. This procedure calculates one-, and
WORKING PAPER MASSACHUSETTS
 BASEMENT HD28.M414 no. Ibll- Dewey ALFRED P. WORKING PAPER SLOAN SCHOOL OF MANAGEMENT Corporate Investments In Common Stock by Wayne H. Mikkelson University of Oregon Richard S. Ruback Massachusetts
Depression Babies: Do Macroeconomic Experiences Affect Risk-Taking?
 Depression Babies: Do Macroeconomic Experiences Affect Risk-Taking? October 19, 2009 Ulrike Malmendier, UC Berkeley (joint work with Stefan Nagel, Stanford) 1 The Tale of Depression Babies I don t know
Assessing the reliability of regression-based estimates of risk
 Assessing the reliability of regression-based estimates of risk 17 June 2013 Stephen Gray and Jason Hall, SFG Consulting Contents 1. PREPARATION OF THIS REPORT... 1 2. EXECUTIVE SUMMARY... 2 3. INTRODUCTION...
Public-private sector pay differential in UK: A recent update
 Public-private sector pay differential in UK: A recent update by D H Blackaby P D Murphy N C O Leary A V Staneva No. 2013-01 Department of Economics Discussion Paper Series Public-private sector pay differential
Online Appendix to. The Value of Crowdsourced Earnings Forecasts
 Online Appendix to The Value of Crowdsourced Earnings Forecasts This online appendix tabulates and discusses the results of robustness checks and supplementary analyses mentioned in the paper. A1. Estimating
Deviations from Optimal Corporate Cash Holdings and the Valuation from a Shareholder s Perspective
 Deviations from Optimal Corporate Cash Holdings and the Valuation from a Shareholder s Perspective Zhenxu Tong * University of Exeter Abstract The tradeoff theory of corporate cash holdings predicts that
Online Appendix Long-Lasting Effects of Socialist Education
 Online Appendix Long-Lasting Effects of Socialist Education Nicola Fuchs-Schündeln Goethe University Frankfurt, CEPR, and IZA Paolo Masella University of Sussex and IZA December 11, 2015 1 Temporary Disruptions
 TABLE I SUMMARY STATISTICS Panel A: Loan-level Variables (22,176 loans) Variable Mean S.D. Pre-nuclear Test Total Lending (000) 16,479 60,768 Change in Log Lending -0.0028 1.23 Post-nuclear Test Default
High-Frequency Data Analysis and Market Microstructure [Tsay (2005), chapter 5]
![High-Frequency Data Analysis and Market Microstructure [Tsay (2005), chapter 5]](/thumbs/79/79153367.jpg "High-Frequency Data Analysis and Market Microstructure [Tsay (2005), chapter 5]") 1 High-Frequency Data Analysis and Market Microstructure [Tsay (2005), chapter 5] High-frequency data have some unique characteristics that do not appear in lower frequencies. At this class we have: Nonsynchronous
1 High-Frequency Data Analysis and Market Microstructure [Tsay (2005), chapter 5] High-frequency data have some unique characteristics that do not appear in lower frequencies. At this class we have: Nonsynchronous
Heterogeneity in Returns to Wealth and the Measurement of Wealth Inequality 1
 Heterogeneity in Returns to Wealth and the Measurement of Wealth Inequality 1 Andreas Fagereng (Statistics Norway) Luigi Guiso (EIEF) Davide Malacrino (Stanford University) Luigi Pistaferri (Stanford University
Financial liberalization and the relationship-specificity of exports *
 Financial and the relationship-specificity of exports * Fabrice Defever Jens Suedekum a) University of Nottingham Center of Economic Performance (LSE) GEP and CESifo Mercator School of Management University
IMPACT OF THE SOCIAL SECURITY RETIREMENT EARNINGS TEST ON YEAR-OLDS
 #2003-15 December 2003 IMPACT OF THE SOCIAL SECURITY RETIREMENT EARNINGS TEST ON 62-64-YEAR-OLDS Caroline Ratcliffe Jillian Berk Kevin Perese Eric Toder Alison M. Shelton Project Manager The Public Policy
Copyright 2011 Pearson Education, Inc. Publishing as Addison-Wesley.
 Appendix: Statistics in Action Part I Financial Time Series 1. These data show the effects of stock splits. If you investigate further, you ll find that most of these splits (such as in May 1970) are 3-for-1
Risk Analysis. å To change Benchmark tickers:
 Property Sheet will appear. The Return/Statistics page will be displayed. 2. Use the five boxes in the Benchmark section of this page to enter or change the tickers that will appear on the Performance
Stat 101 Exam 1 - Embers Important Formulas and Concepts 1
 1 Chapter 1 1.1 Definitions Stat 101 Exam 1 - Embers Important Formulas and Concepts 1 1. Data Any collection of numbers, characters, images, or other items that provide information about something. 2.
CHAPTER 2 ESTIMATION AND PROJECTION OF LIFETIME EARNINGS
 CHAPTER 2 ESTIMATION AND PROJECTION OF LIFETIME EARNINGS ABSTRACT This chapter describes the estimation and prediction of age-earnings profiles for American men and women born between 1931 and 1960. The
Financial Econometrics Jeffrey R. Russell Midterm 2014
 Name: Financial Econometrics Jeffrey R. Russell Midterm 2014 You have 2 hours to complete the exam. Use can use a calculator and one side of an 8.5x11 cheat sheet. Try to fit all your work in the space
At any time, wages differ dramatically across U.S. workers. Some
 Dissecting Wage Dispersion By San Cannon and José Mustre-del-Río At any time, wages differ dramatically across U.S. workers. Some differences in workers hourly wages may be due to differences in observable
Online Appendix. Consumption Volatility, Marketization, and Expenditure in an Emerging Market Economy. Daniel L. Hicks
 Online Appendix Consumption Volatility, Marketization, and Expenditure in an Emerging Market Economy Daniel L. Hicks Abstract This appendix presents additional results that are referred to in the main
NBER WORKING PAPER SERIES THE GROWTH IN SOCIAL SECURITY BENEFITS AMONG THE RETIREMENT AGE POPULATION FROM INCREASES IN THE CAP ON COVERED EARNINGS
 NBER WORKING PAPER SERIES THE GROWTH IN SOCIAL SECURITY BENEFITS AMONG THE RETIREMENT AGE POPULATION FROM INCREASES IN THE CAP ON COVERED EARNINGS Alan L. Gustman Thomas Steinmeier Nahid Tabatabai Working
Revisiting Idiosyncratic Volatility and Stock Returns. Fatma Sonmez 1
 Revisiting Idiosyncratic Volatility and Stock Returns Fatma Sonmez 1 Abstract This paper s aim is to revisit the relation between idiosyncratic volatility and future stock returns. There are three key
Analyzing the Determinants of Project Success: A Probit Regression Approach
 2016 Annual Evaluation Review, Linked Document D 1 Analyzing the Determinants of Project Success: A Probit Regression Approach 1. This regression analysis aims to ascertain the factors that determine development
Figure 2.1 The Longitudinal Employer-Household Dynamics Program
 Figure 2.1 The Longitudinal Employer-Household Dynamics Program Demographic Surveys Household Record Household-ID Data Integration Record Person-ID Employer-ID Data Economic Censuses and Surveys Census
Big Bad Banks? The Winners and Losers from Bank Deregulation in the United States
 Online Internet Appendix Big Bad Banks? The Winners and Losers from Bank Deregulation in the United States THORSTEN BECK, ROSS LEVINE, AND ALEXEY LEVKOV January 2010 In this appendix, we provide additional
The current study builds on previous research to estimate the regional gap in
 Summary 1 The current study builds on previous research to estimate the regional gap in state funding assistance between municipalities in South NJ compared to similar municipalities in Central and North
Properties of the estimated five-factor model
 Informationin(andnotin)thetermstructure Appendix. Additional results Greg Duffee Johns Hopkins This draft: October 8, Properties of the estimated five-factor model No stationary term structure model is
The Effects of Increasing the Early Retirement Age on Social Security Claims and Job Exits
 The Effects of Increasing the Early Retirement Age on Social Security Claims and Job Exits Day Manoli UCLA Andrea Weber University of Mannheim February 29, 2012 Abstract This paper presents empirical evidence
STATISTICS 4040/23 Paper 2 October/November 2014
 Cambridge International Examinations Cambridge Ordinary Level *9099999814* STATISTICS 4040/23 Paper 2 October/November 2014 Candidates answer on the question paper. Additional Materials: Pair of compasses
The cross section of expected stock returns
 The cross section of expected stock returns Jonathan Lewellen Dartmouth College and NBER This version: March 2013 First draft: October 2010 Tel: 603-646-8650; email: jon.lewellen@dartmouth.edu. I am grateful
Maximum Likelihood Estimates for Alpha and Beta With Zero SAIDI Days
 Maximum Likelihood Estimates for Alpha and Beta With Zero SAIDI Days 1. Introduction Richard D. Christie Department of Electrical Engineering Box 35500 University of Washington Seattle, WA 98195-500 christie@ee.washington.edu
Vanguard Research February 2016
 The Reshaping buck stops participant here: Vanguard outcomes money through market funds reenrollment Vanguard Research February 2016 Cynthia A. Pagliaro, Stephen P. Utkus Executive summary. Reenrollment
Online Appendix for Why Don t the Poor Save More? Evidence from Health Savings Experiments American Economic Review
 Online Appendix for Why Don t the Poor Save More? Evidence from Health Savings Experiments American Economic Review Pascaline Dupas Jonathan Robinson This document contains the following online appendices:
The value of managed account advice
 The value of managed account advice Vanguard Research September 2018 Cynthia A. Pagliaro According to our research, most participants who adopted managed account advice realized value in some form. For
yuimagui: A graphical user interface for the yuima package. User Guide yuimagui v1.0
 yuimagui: A graphical user interface for the yuima package. User Guide yuimagui v1.0 Emanuele Guidotti, Stefano M. Iacus and Lorenzo Mercuri February 21, 2017 Contents 1 yuimagui: Home 3 2 yuimagui: Data
Point-Biserial and Biserial Correlations
 Chapter 302 Point-Biserial and Biserial Correlations Introduction This procedure calculates estimates, confidence intervals, and hypothesis tests for both the point-biserial and the biserial correlations.
Internet Appendix for Heterogeneity and Persistence in Returns to Wealth
 Internet Appendix for Heterogeneity and Persistence in Returns to Wealth Andreas Fagereng ú Luigi Guiso Davide Malacrino Luigi Pistaferri November 2, 2016 In this Internet Appendix we provide supplementary
Liquidity skewness premium
 Liquidity skewness premium Giho Jeong, Jangkoo Kang, and Kyung Yoon Kwon * Abstract Risk-averse investors may dislike decrease of liquidity rather than increase of liquidity, and thus there can be asymmetric
Diploma in Financial Management with Public Finance
 Diploma in Financial Management with Public Finance Cohort: DFM/09/FT Jan Intake Examinations for 2009 Semester II MODULE: STATISTICS FOR FINANCE MODULE CODE: QUAN 1103 Duration: 2 Hours Reading time:
Logistic Regression Analysis
 Revised July 2018 Logistic Regression Analysis This set of notes shows how to use Stata to estimate a logistic regression equation. It assumes that you have set Stata up on your computer (see the Getting
Using the Principia Suite
 Using the Principia Suite Overview - - - - - - - - - - - - - - - - - - - - - - - - - - - - - - - - - - - - - -1 Generating Research Mode Reports........................................... 2 Overview -
The data definition file provided by the authors is reproduced below: Obs: 1500 home sales in Stockton, CA from Oct 1, 1996 to Nov 30, 1998
 Economics 312 Sample Project Report Jeffrey Parker Introduction This project is based on Exercise 2.12 on page 81 of the Hill, Griffiths, and Lim text. It examines how the sale price of houses in Stockton,
Nonlinearities and Robustness in Growth Regressions Jenny Minier
 Nonlinearities and Robustness in Growth Regressions Jenny Minier Much economic growth research has been devoted to determining the explanatory variables that explain cross-country variation in growth rates.
Lecture 5: Fundamentals of Statistical Analysis and Distributions Derived from Normal Distributions
 Lecture 5: Fundamentals of Statistical Analysis and Distributions Derived from Normal Distributions ELE 525: Random Processes in Information Systems Hisashi Kobayashi Department of Electrical Engineering
Assessing Systematic Differences in Industry-Award Rates of Social Security Disability Insurance
 Assessing Systematic Differences in Industry-Award Rates of Social Security Disability Insurance Till von Wachter * University of California Los Angeles and NBER Abstract: Although a large body of literature
On the provision of incentives in finance experiments. Web Appendix
 On the provision of incentives in finance experiments. Daniel Kleinlercher Thomas Stöckl May 29, 2017 Contents Web Appendix 1 Calculation of price efficiency measures 2 2 Additional information for PRICE
Early Retirement Incentives and Student Achievement. Maria D. Fitzpatrick and Michael F. Lovenheim. Online Appendix
 Early Retirement Incentives and Student Achievement Maria D. Fitzpatrick and Michael F. Lovenheim Online Appendix Table A-1. OLS Estimates of the Effect of the Early Retirement Incentive Program on the
Potential Impact of Aging on the Economic Growth of Quebec
 Potential Impact of Aging on the Economic Growth of Quebec Yvan Guillemette C.D. Howe Institute Presentation to the Seminar organized by the Quebec Pension Plan in cooperation with the Actuarial Science
While real incomes in the lower and middle portions of the U.S. income distribution have
 CONSUMPTION CONTAGION: DOES THE CONSUMPTION OF THE RICH DRIVE THE CONSUMPTION OF THE LESS RICH? BY MARIANNE BERTRAND AND ADAIR MORSE (CHICAGO BOOTH) Overview While real incomes in the lower and middle
Long-run Effects of Lottery Wealth on Psychological Well-being. Online Appendix
 Long-run Effects of Lottery Wealth on Psychological Well-being Online Appendix May 2018 Erik Lindqvist Robert Östling David Cesarini 1 Introduction The Analysis Plan described our intention to compare
WEALTH INEQUALITY AND HOUSEHOLD STRUCTURE: US VS. SPAIN. Olympia Bover
 WEALTH INEQUALITY AND HOUSEHOLD STRUCTURE: US VS. SPAIN Olympia Bover 1 Introduction and summary Dierences in wealth distribution across developed countries are large (eg share held by top 1%: 15 to 35%)
B003 Applied Economics Exercises
 B003 Applied Economics Exercises Spring 2005 Starred exercises are to be completed and handed in in advance of classes. Unstarred exercises are to be completed during classes. Ex 3.1 Ex 4.1 Ex 5.1 to be
Internet Appendix to Do the Rich Get Richer in the Stock Market? Evidence from India
 Internet Appendix to Do the Rich Get Richer in the Stock Market? Evidence from India John Y. Campbell, Tarun Ramadorai, and Benjamin Ranish 1 First draft: March 2018 1 Campbell: Department of Economics,
Health Expenditures and Life Expectancy Around the World: a Quantile Regression Approach
 ` DISCUSSION PAPER SERIES Health Expenditures and Life Expectancy Around the World: a Quantile Regression Approach Maksym Obrizan Kyiv School of Economics and Kyiv Economics Institute George L. Wehby University
Online Appendix for Liquidity Constraints and Consumer Bankruptcy: Evidence from Tax Rebates
 Online Appendix for Liquidity Constraints and Consumer Bankruptcy: Evidence from Tax Rebates Tal Gross Matthew J. Notowidigdo Jialan Wang January 2013 1 Alternative Standard Errors In this section we discuss
Memorandum. Human Resources Division
 Memorandum Human Resources Division TO: FROM: RE: Vacellia Clark, Chief Examiner Civil Service Commission Human Resources Staff Establish a Passing Score for Animal Control Officer DATE: October 30, 2013
FIGURE I.1 / Per Capita Gross Domestic Product and Unemployment Rates. Year
 FIGURE I.1 / Per Capita Gross Domestic Product and Unemployment Rates 40,000 12 Real GDP per Capita (Chained 2000 Dollars) 35,000 30,000 25,000 20,000 15,000 10,000 5,000 Real GDP per Capita Unemployment
Gender Differences in the Labor Market Effects of the Dollar
 Gender Differences in the Labor Market Effects of the Dollar Linda Goldberg and Joseph Tracy Federal Reserve Bank of New York and NBER April 2001 Abstract Although the dollar has been shown to influence
Online Appendix for Overpriced Winners
 Online Appendix for Overpriced Winners A Model: Who Gains and Who Loses When Divergence-of-Opinion is Resolved? In the baseline model, the pessimist s gain or loss is equal to her shorting demand times
Does health capital have differential effects on economic growth?
 University of Wollongong Research Online Faculty of Commerce - Papers (Archive) Faculty of Business 2013 Does health capital have differential effects on economic growth? Arusha V. Cooray University of
What You Don t Know Can t Help You: Knowledge and Retirement Decision Making
 VERY PRELIMINARY PLEASE DO NOT QUOTE COMMENTS WELCOME What You Don t Know Can t Help You: Knowledge and Retirement Decision Making February 2003 Sewin Chan Wagner Graduate School of Public Service New
Higher-Order Income Risk and Social Insurance Policy Over the Business Cycle
 Higher-Order Income Risk and Social Insurance Policy Over the Business Cycle Christopher Busch David Domeij Fatih Guvenen Rocio Madera May 11, 2015 Preliminary and Incomplete. Comments Welcome. Abstract
THE IMPACT OF FEMALE LABOR SUPPLY ON THE BRAZILIAN INCOME DISTRIBUTION
 THE IMPACT OF FEMALE LABOR SUPPLY ON THE BRAZILIAN INCOME DISTRIBUTION Luiz Guilherme Scorzafave (lgdsscorzafave@uem.br) (State University of Maringa, Brazil) Naércio Aquino Menezes-Filho (naerciof@usp.br)
Online Appendix from Bönke, Corneo and Lüthen Lifetime Earnings Inequality in Germany
 Online Appendix from Bönke, Corneo and Lüthen Lifetime Earnings Inequality in Germany Contents Appendix I: Data... 2 I.1 Earnings concept... 2 I.2 Imputation of top-coded earnings... 5 I.3 Correction of
institution Top 10 to 20 undergraduate
 Appendix Table A1 Who Responded to the Survey Dynamics of the Gender Gap for Young Professionals in the Financial and Corporate Sectors By Marianne Bertrand, Claudia Goldin, Lawrence F. Katz On-Line Appendix
A Rising Tide Lifts All Boats? IT growth in the US over the last 30 years
 A Rising Tide Lifts All Boats? IT growth in the US over the last 30 years Nicholas Bloom (Stanford) and Nicola Pierri (Stanford)1 March 25 th 2017 1) Executive Summary Using a new survey of IT usage from
Fluctuations in hours of work and employment across age and gender
 Fluctuations in hours of work and employment across age and gender IFS Working Paper W15/03 Guy Laroque Sophie Osotimehin Fluctuations in hours of work and employment across ages and gender Guy Laroque
Caught on Tape: Institutional Trading, Stock Returns, and Earnings Announcements
 Caught on Tape: Institutional Trading, Stock Returns, and Earnings Announcements The Harvard community has made this article openly available. Please share how this access benefits you. Your story matters.
Tutorial. Morningstar DirectSM. Quick Start Guide
 April 2008 Software Tutorial Morningstar DirectSM Quick Start Guide Table of Contents Quick Start Guide Getting Started with Morningstar Direct Defining an Investment Lineup or Watch List Generating a
INSTITUTE AND FACULTY OF ACTUARIES. Curriculum 2019 SPECIMEN EXAMINATION
 INSTITUTE AND FACULTY OF ACTUARIES Curriculum 2019 SPECIMEN EXAMINATION Subject CS1A Actuarial Statistics Time allowed: Three hours and fifteen minutes INSTRUCTIONS TO THE CANDIDATE 1. Enter all the candidate
in-depth Invesco Actively Managed Low Volatility Strategies The Case for
 Invesco in-depth The Case for Actively Managed Low Volatility Strategies We believe that active LVPs offer the best opportunity to achieve a higher risk-adjusted return over the long term. Donna C. Wilson
ELEMENTS OF MONTE CARLO SIMULATION
 APPENDIX B ELEMENTS OF MONTE CARLO SIMULATION B. GENERAL CONCEPT The basic idea of Monte Carlo simulation is to create a series of experimental samples using a random number sequence. According to the
SEX DISCRIMINATION PROBLEM
 SEX DISCRIMINATION PROBLEM 5. Displaying Relationships between Variables In this section we will use scatterplots to examine the relationship between the dependent variable (starting salary) and each of
GGraph. Males Only. Premium. Experience. GGraph. Gender. 1 0: R 2 Linear = : R 2 Linear = Page 1
 GGraph 9 Gender : R Linear =.43 : R Linear =.769 8 7 6 5 4 3 5 5 Males Only GGraph Page R Linear =.43 R Loess 9 8 7 6 5 4 5 5 Explore Case Processing Summary Cases Valid Missing Total N Percent N Percent
Chapter 6 Simple Correlation and
 Contents Chapter 1 Introduction to Statistics Meaning of Statistics... 1 Definition of Statistics... 2 Importance and Scope of Statistics... 2 Application of Statistics... 3 Characteristics of Statistics...
Internet Appendix for. Fund Tradeoffs. ĽUBOŠ PÁSTOR, ROBERT F. STAMBAUGH, and LUCIAN A. TAYLOR
 Internet Appendix for Fund Tradeoffs ĽUBOŠ PÁSTOR, ROBERT F. STAMBAUGH, and LUCIAN A. TAYLOR This Internet Appendix presents additional empirical results, mostly robustness results, complementing the results
ARCH Models and Financial Applications
 Christian Gourieroux ARCH Models and Financial Applications With 26 Figures Springer Contents 1 Introduction 1 1.1 The Development of ARCH Models 1 1.2 Book Content 4 2 Linear and Nonlinear Processes 5
Labor Force Participation and the Wage Gap Detailed Notes and Code Econometrics 113 Spring 2014
 Labor Force Participation and the Wage Gap Detailed Notes and Code Econometrics 113 Spring 2014 In class, Lecture 11, we used a new dataset to examine labor force participation and wages across groups.
THE ISS PAY FOR PERFORMANCE MODEL. By Stephen F. O Byrne, Shareholder Value Advisors, Inc.
 THE ISS PAY FOR PERFORMANCE MODEL By Stephen F. O Byrne, Shareholder Value Advisors, Inc. Institutional Shareholder Services (ISS) announced a new approach to evaluating pay for performance in late 2011
HOW DO FIRMS FORM THEIR EXPECTATIONS? NEW SURVEY EVIDENCE
 HOW DO FIRMS FORM THEIR EXPECTATIONS? NEW SURVEY EVIDENCE Olivier Coibion Yuriy Gorodnichenko Saten Kumar UT Austin UC Berkeley Auckland University & NBER & NBER of Technology EXPECTATIONS AND THE CENTRAL
Copyright 2009 Pearson Education Canada
 Operating Cash Flows: Sales $682,500 $771,750 $868,219 $972,405 $957,211 less expenses $477,750 $540,225 $607,753 $680,684 $670,048 Difference $204,750 $231,525 $260,466 $291,722 $287,163 After-tax (1
SURVEY OF CONSUMER EXPECTATIONS. Housing Survey 2016
 SURVEY OF CONSUMER EXPECTATIONS Housing Survey 2016 Federal Reserve Bank of New York Andreas Fuster and Basit Zafar with Kevin Morris une 2, 2016 SCE ederal Housing Reserve Survey 2016 Bank of New York
 Table I Descriptive Statistics This table shows the breakdown of the eligible funds as at May 2011. AUM refers to assets under management. Panel A: Fund Breakdown Fund Count Vintage count Avg AUM US$ MM
Online Appendix for The Importance of Being. Marginal: Gender Differences in Generosity
 Online Appendix for The Importance of Being Marginal: Gender Differences in Generosity Stefano DellaVigna, John List, Ulrike Malmendier, Gautam Rao January 14, 2013 This appendix describes the structural
Explaining procyclical male female wage gaps B
 Economics Letters 88 (2005) 231 235 www.elsevier.com/locate/econbase Explaining procyclical male female wage gaps B Seonyoung Park, Donggyun ShinT Department of Economics, Hanyang University, Seoul 133-791,