3. Trends & Projections
|
|
|
- Alexandrina Tate
- 5 years ago
- Views:
Transcription
1 CONNECTIONS 2040: The Duluth - Superior Long Range Transportation Plan 3. Trends & Projections This section of Connections 2040 summarizes the trends in demographics, economics, land use and transportation patterns that the Duluth-Superior metropolitan area has experienced in recent years. PAGE 3-2 PAGE 3-3 PAGE 3-13 PAGE 3-20 PAGE 3-30 PAGE 3-38 Introduction Geographic Definitions Population & Demographics Historical Population Trends Population Projections Population Diversity The Economy & Employment The Regional Economy Employment Trends Employment Projections Land Use & Transportation Demand Patterns Land Use Patterns Local Travel Patterns Regional Travel Patterns Modeling Future Travel Demand Comparing Present and Future Conditions Future Deficiencies identified with the Model System Condition Pavement Condition Condition of Area Bridges Condition of Transit Vehicles PAGE 3-42 Conclusion 3-1


, or the individual municipalities that comprise the metropolitan planning organization (MPO).")
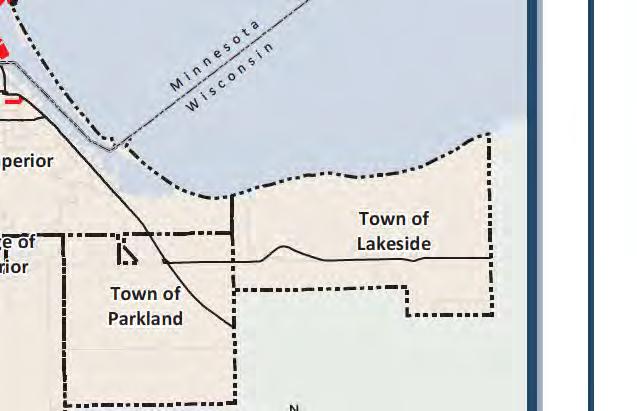
2 Introduction An assessment of the current and future transportation needs in the Duluth-Superior metropolitan area begins with a look at trends in population growth, demographics, employment, land use, and travel behavior. The size, makeup, and characteristics of the population exert different demands throughout the transportation system. Together, these things influence both travel patterns and subsequent decisions in transportation investment. Figure 3.1: The Duluth-Superior MPO boundary Geographic Definitions Trends regarding population, demographics, economics, and other characteristics are tracked using data published by the U.S. Census Bureau and other agencies. For metropolitan areas like Duluth- Superior, such data is collected and delivered according to at least one of three geographic levels: the metropolitan statistical area (MSA), the urbanized area (UZA), or the individual municipalities that comprise the metropolitan planning organization (MPO). Metropolitan Planning Organization (MPO) The Duluth-Superior Metropolitan Interstate Council (MIC) is the federally designated MPO for the area. It is a bi-state MPO comprised of three cities and seven townships on the Minnesota side of the harbor and one city, two villages, and three towns on the Wisconsin side. The boundary of the MPO is depicted in Figure 3.1. Census data regarding population, demographics, and jobs can be assessed in terms of this boundary, but some economic and transportation related data cannot. Throughout Connections 2040, this geographical unit will be referred to as the metropolitan area, metro area, MIC area, or MPO. Figure 3.2: The Duluth-Superior UZA The Duluth-Superior UZA is represented by shaded area in the center. Urbanized Area Boundary (UZA) The Duluth-Superior UZA boundary delineates the portion of the MPO considered to be urban based on the concentration of people and impervious surfaces. This is the smallest unit with which some employment and transportation related data are delivered (Figure 3.2). Figure 3.3: The Duluth-Superior MSA The Duluth-Superior MSA is represented by shaded area in the center. Metropolitan Statistical Area (MSA) The Duluth-Superior MSA is a much larger geography that contains the MPO. It includes all the counties considered to have a close economic tie to the metropolitan area. Trends in population, workforce, and transportation are all available for this geographic area and can be easily compared (Figure 3.3). MIC planning area 3-2

3 Population & Demographics Trend: Modest increases in population have been occurring mostly outside the urban center; aging seniors will continue to represent a larger percentage of the population, and households will likely continue to decrease in size. Historical Population Trends According to data from past decennial censuses, the population of the Duluth-Superior area has remained relatively stable. Modest gains have reversed a downward trend in the 1980 s and 1990 s, and in 2010 the entire MIC area had gained 2,462 more people than in had in 2000 (Table 3.1). Much of the area s growth, however, has been occurring in the cities, villages and townships which surround the urban centers of Duluth and Superior. The City of Hermantown, by far experienced the most growth, increasing by nearly 2,000 people, while the other surrounding communities together grew by 1,273 people. The growth in these communities have been supplanting population losses in the urban core, which signifies a spreading out of the population within the metro area. Pedestrian traffic in Canal Park, Duluth Table 3.1: Historical population trends in the Duluth-Superior metropolitan area (1980 to 2010) Area % Change 2000 % Change 2010 % Change St. Louis Co. 222, , % 200, % 200, % MIC portion (MN ) 116, , % 113, % 115, % Duluth 92,811 85, % 86, % 86, % Hermantown 6,759 6, % 7, % 9, % Proctor 3,180 2, % 2, % 3, % Rice Lake T. 3,861 3, % 4, % 4, % Grand Lake T. 2,166 2, % 2, % 2, % Lakewood T. 1,680 1, % 2, % 2, % Canosia T. 1,562 1, % 1, % 2, % Solway T. 1,665 1, % 1, % 1, % Duluth T. 1,604 1, % 1, % 1, % Midway T. 1,656 1, % 1, % 1, % Douglas Co. 44,421 41, % 43, % 44, % MIC portion (WI) 34,437 31, % 32, % 32, % Superior 29,571 27, % 27, % 27, % T. of Superior 2,065 1, % 2, % 2, % T. of Parkland 1,496 1, % 1, % 1, % T. of Lakeside % % % V. of Superior % % % V. of Oliver % % % TOTAL MIC AREA 151, , % 145, % 147, % Source: US Census Bureau,
.")
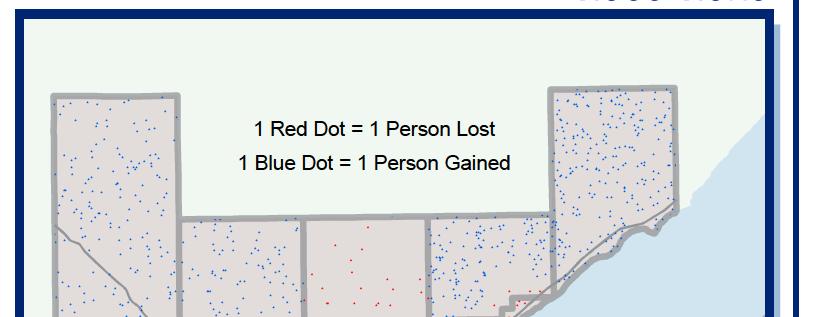
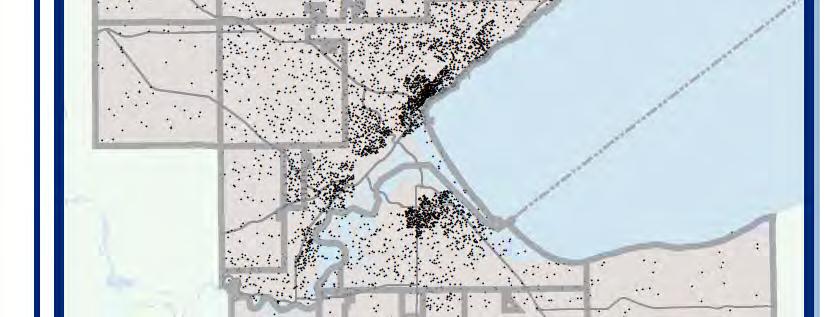
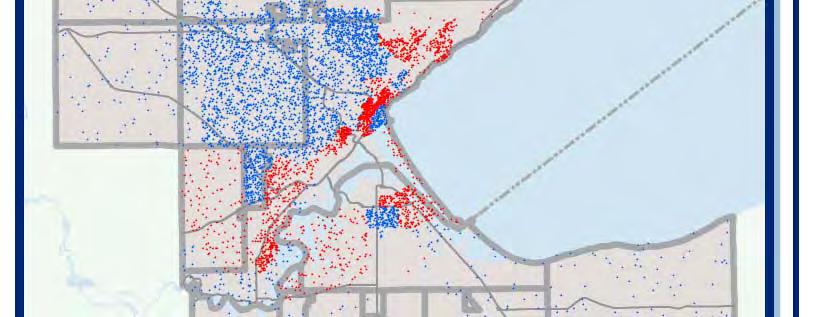
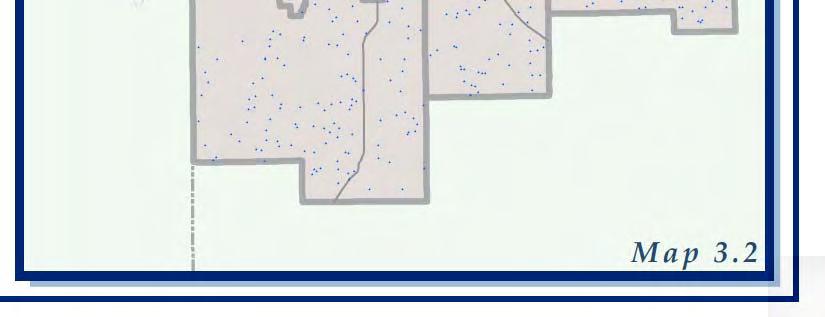
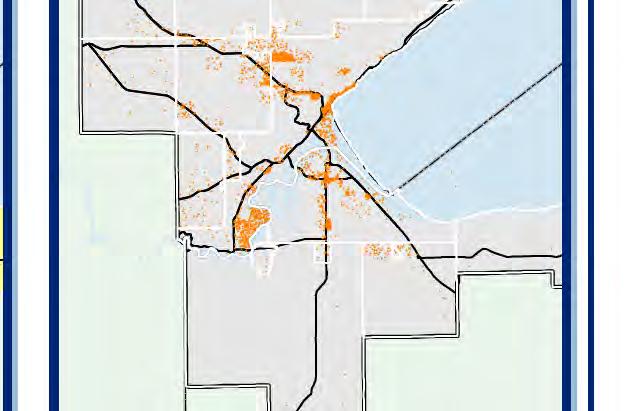
4 Population Density While growth in the metro area appears to be moving further out from the core cities of Duluth and Superior, the adjacent cities of Hermantown and Proctor, as well as the Village of Oliver, and the Village of Superior have all seen significant increases in their population per square mile of available land, or population density (Table 3.2). While the general trends shown in Table 3.2 have implications for the planning, funding, and maintenance of transportation assets, it is an incomplete picture, geographically. Map 3.1 on the following page displays population density at the census block level in 2010 and shows how - despite decreases in population and population density - a substantial portion of the area s residents live along the shore in Downtown Duluth and near Downtown Superior. Examples of large multi-residential units near downtown Duluth. Map 3.2 shows the additions and subtractions of population between the years 2000 and This imagery helps to show that much of the added growth has occurred along the State Highway 53 corridor in Duluth and Hermantown. Table 3.2: Changes in population density in the Duluth-Superior metropolitan area (2000 to 2010) Area Total Area (Square miles) Population Density (people per sq. mi.) Population Density (people per sq. mi.) Change in Pop. Density MIC (MN ) , , Duluth , , Hermantown , , Proctor 3.0 2, ,057 1, Rice Lake T , , Grand Lake T , , Lakewood T , , Canosia T , , Solway T , , Duluth T , , Midway T , , MIC (WI) , , Superior , , T. of Superior , , T. of Parkland , , T. of Lakeside V. of Superior V. of Oliver TOTAL MIC AREA , , Source: US Census Bureau,


5
6 Household Size Data regarding average household size shows shrinking household sizes in each of the MIC area s communities. This is consistent with Minnesota and Wisconsin statewide trends in declining average household sizes. It is also consistent with a progressively aging population in the metro area, as discussed on page 3-8. Figure 3.4: Trends in average household sizes in the Duluth- Superior metropolitan planning area As shown in Table 3.3 below, several of the towns and townships surrounding the Duluth-Superior urbanized area have experienced the largest decreases in average household size. On average, however, the average household size in these areas went from 2.6 persons per household to 2.5 in In contrast, the City of Hermantown went from 2.7 persons to 2.5. When projecting this data out logarithmically to a year-2040 planning horizon, a pattern in which household sizes in the urban area will be around 2.3 persons while it will remain above 2.4 in the surrounding townships (Figure 3.4). Source: U.S Census Bureau (2014). Table 3.3: Changes in average household size in the MIC area (2000 to 2010) Area Average persons per household in 2000 Average persons per household in 2010 % Change MIC (MN side) Duluth % Hermantown % Proctor % Rice Lake T % Grand Lake T % Lakewood T % Canosia T % Solway T % Duluth T % Midway T % MIC (WI side) Superior % T. of Superior % T. of Parkland % T. of Lakeside % V. of Superior % V. of Oliver % Minnesota % Wisconsin % United States % Source: US Census Bureau, SF100%2000; year ACS (2014). 3-6


7 Population Projections For the purposes of long-range planning, two growth scenarios for the Duluth-Superior metropolitan area were compared: a conservative growth estimate and an aggressive growth estimate. Under the conservative estimate, the population of the Duluth-Superior area would be 158,413 by the year The aggressive scenario would exceed this by nearly 15,000 more people. Both scenarios are shown as straight-line projections in Table 3.4 and Figure 3.5 below. These 25-year growth estimates were developed to help anticipate future development patterns and the potential need for certain transportation investments. How these estimates were derived and their implications for planning and policy development are addressed further in the Land Use & Travel Demand Patterns discussion starting on page Table 3.4: Population projections for the Duluth-Superior metropolitan area (2010 to 2040) Source: URS Corp, Figure 3.5: Population trends and projections for the Duluth-Superior metropolitan area (1980 to 2040) 3-7


8 Population Diversity As with the size and density of a population, the age, race, and income profiles of an area also have important implications for transportation planning decisions. Different subsets of a population tend to have different needs when it comes to the provision of transportation services or the design of transportation infrastructure. Changes in these demographic profiles may signal needed shifts in transportation policy and investments. What follows is a summary of trends regarding age, race, and poverty in the Duluth-Superior area. Figure 3.6: Age profile of the MIC area: 2000 and 2010 Age The population of the Duluth-Superior area is characterized by its Baby Boomer and college-aged populations, which can be seen in Figure 3.5 below. The effects of these groups on the area s age profile can be seen in Figure 3.6. As time continues, the large boomer population will be entering their senior years, while the size of college-aged population (identified here as ages 18 to 30) is expected to remain relatively static. These trends have implications for transportation planning. For instance, those identified as Millennials (born between 1980 and 2000) are showing increasing demand for ride-sharing, public transit, and non-motorized options, while the increasing number of seniors may also translate into increased demand for more walkable environments and more transit service. Whatever the preferences may be, an increasing percentage of the area s population will likely be needing transportation assistance in coming years. Projections based on those done by the Minnesota State Demographer s Office for St. Louis County show that those aged 75 and older will approach 20% of the population by the year 2040 (Figure 3.7). Source: U.S. Census Bureau, Figure 3.7: Projected change in age profile: MIC area (2000 to 2040) Source: MIC (2014). Figure 3.5: Duluth-Superior Population Pyramid (2010) Source: U.S. Census Bureau,
, and those identified as Hispanic or Latino represent only 1% of that subset (Figure 3.11). There are signs, however, that the Duluth-Superior metro is becoming more racially diverse.")
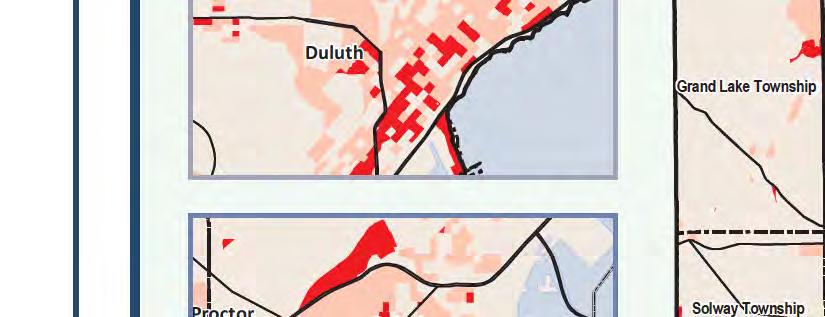
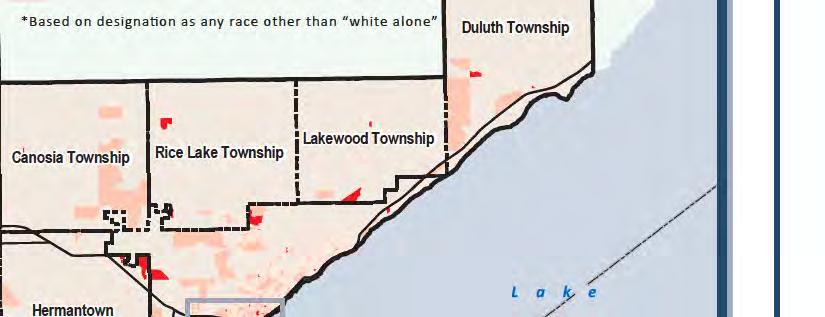
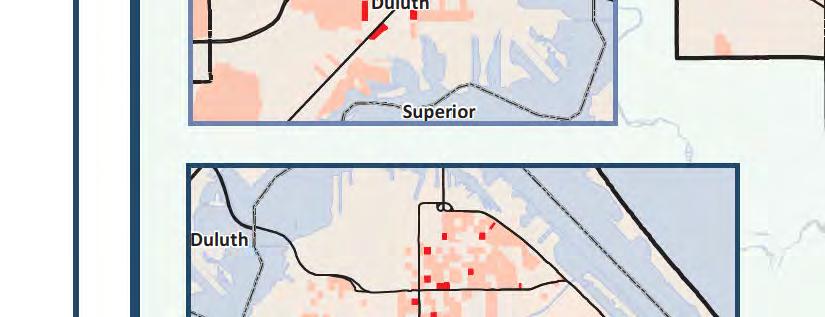
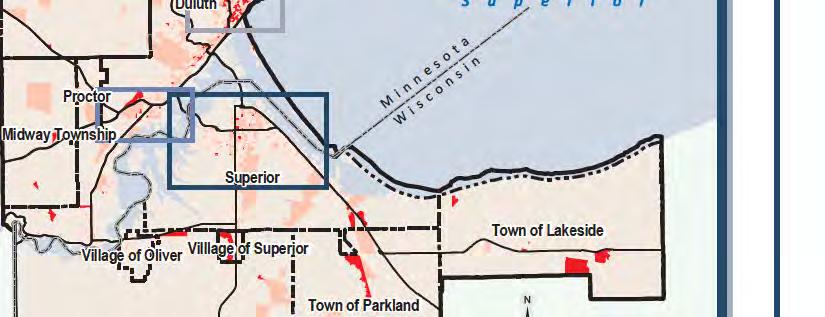
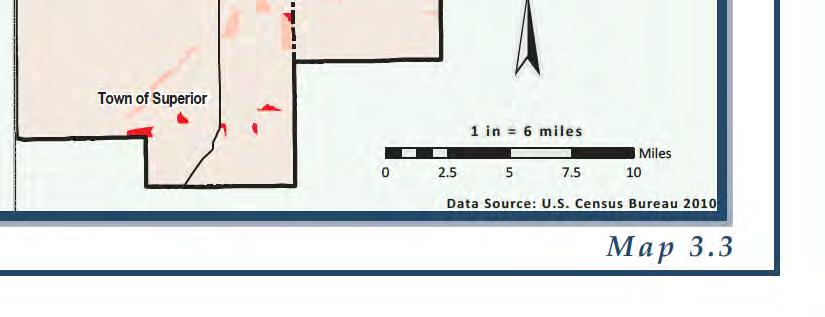
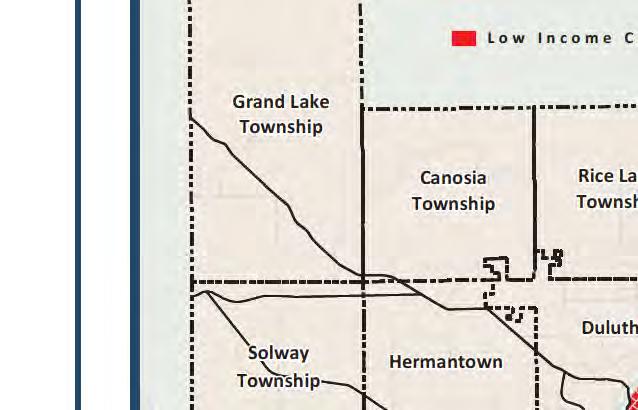
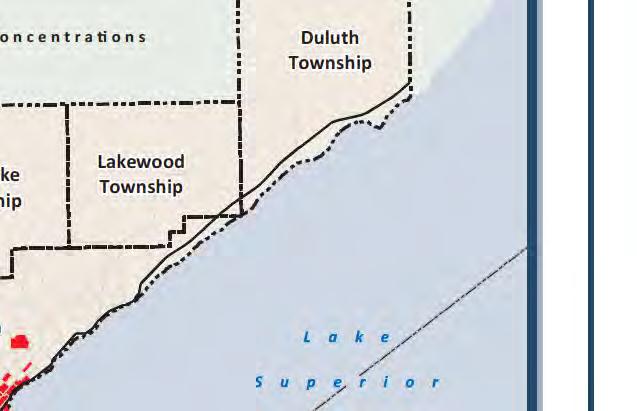
9 Race The Duluth-Superior metropolitan area is not very racially diverse, compared to many other metro areas throughout the country. The area s population is predominately Caucasian (Figure 3.10), and those identified as Hispanic or Latino represent only 1% of that subset (Figure 3.11). There are signs, however, that the Duluth-Superior metro is becoming more racially diverse. For instance, in 2010, Whites represented 92% of the population, as opposed to 94% a decade earlier, while the numbers of African American residents and those of multiple races have been increasing (Table 3.5). In addition, it has been reported that 5% of the area s population speaks a language other than English at home (Figure 3.12). Table 3.5: Changes in % race ( ) Area Population subset 2000 % of Pop. Population subset 2010 % of Pop. Caucasian 136, , Two or more races 2, , African American 1, , American Indian or Alaskan Native 3, , Asian American 1, , Some other race Figure 3.10: Population by Race (2010) Two or more Races 3 % Asian American 1 % Source: U.S. Census Bureau, White 92 % African American 2 % American Indian or Alaskan Native 2 % Figure 3.11: Hispanic or Latino Population (2010) Non-Hispanic or Latino 99 % Sources: U.S. Census Bureau, Considerations of race, ethnicity, and language are important in the planning and provision of transportation services. These populations have historically been underserved by public transportation policy and have had limited or no input into major transportation decisions that have significantly impacted their neighborhoods. These considerations fall under Environmental Justice (EJ), which is the public policy goal of ensuring that low-income or minority populations do not bear disproportionately high, or negative impacts as a result of government activities - which includes publicly funded transportation projects. The transportation projects that are identified in Connections 2040 have undergone a preliminary EJ assessment, which can be found in Chapter 5 of CONNECTIONS Hispanic or or Latino Latino 1 % Source: U.S. Census Bureau, ,317 (0.9%) Figure 3.12: Non-English Speaking Population (2010) English Speaking (5 years or older) 95 % Map 3.3 (following page) shows the census blocks in the MIC area where concentrations of minorities exceed both the metropolitan average of 8.2% and the national average of 27.6% (Census 2010). The largest concentrations exist in Duluth s Central Hillside neighborhood near the downtown, which also represents a high 3-9 Primary language other than English (5 years or older) 5 % Source: U.S. Census Bureau, 2010.


10
.")
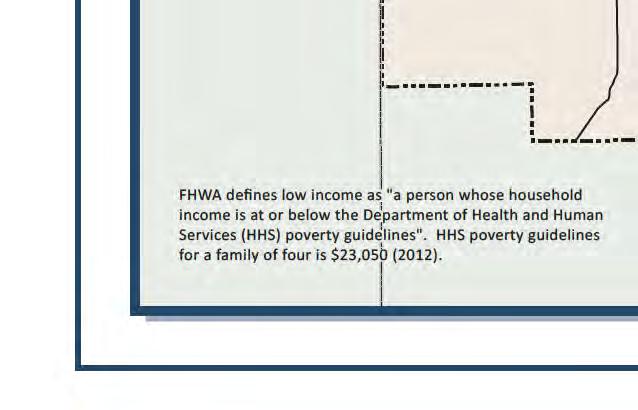
11 concentration of people living below the national poverty line. Poverty The most recent estimates from the U.S. Census Bureau show that 18% of the MIC area s population is living below the national poverty line (Figure 3.13). This represents a four percent increase from the 2000 Census, of which the City of Duluth has experienced the largest addition of those living in poverty (Table 3.6). Figure 3.13: Percent Duluth-Superior Living above the national poverty line 82% Table 3.6: Change in % Poverty in the MIC area ( ) Area * 5-year estimate Individuals in poverty (2000) % of Area Pop. Individuals in poverty 2010 * Sources: U.S. Census Bureau, Census 2000 and Year ACS data (2014) % of Area Pop. Duluth 13, , Superior 3, , Surrounding areas 1, , Residents of surrounding communities in poverty 2% Superior residents in poverty 3% Duluth residents in poverty 13% Source: U.S. Census Bureau, People living in poverty often face transportation challenges. They often lack the means to transport themselves to/from work and other destinations and have difficulty accessing jobs and services. Often they are reliant on public transit or other services that do not always provide the flexibility they need to effectively chain different trips together (work, daycare, medical, shopping, etc.). Areas of concentrated poverty, therefore, are important to consider in the planning and provision of transportation services. Efforts should be made to tailor transportation projects in ways that improve access and mobility for low-income individuals and families. Map 3.4 on the following page shows that the highest concentrations of individuals living in poverty in the area are near the downtown districts of Duluth and Superior, the Central Hillside and Lincoln Park neighborhoods of Duluth, as well as Duluth s university district (full-time students are included in the lowincome subset). It is important to note that significant distances (two miles in Superior, and greater than four in Duluth) exist between these concentrations and the area s major retail centers, which represent the greatest number of low-skilled or entry level employment opportunities in the area. Map 3.4 was also used in the preliminary Environmental Justice (EJ) analysis to determine which of the planned transportation projects on pages 5-12 through 5-30 may impact areas of concentrated poverty in the Duluth-Superior metropolitan area. Is Duluth-Superior s population of those living in poverty bigger than reported? The federal government s method of counting those who are living in poverty is under increasing scrutiny as alternative methods, such as those recently proposed by the National Academy of Sciences (NAS), attempt to factor in rising costs of health care, child care, and transportation, and would suggest an even greater percentage of the MIC area s population is encountering the challenges of poverty on a daily basis. 3-11


12

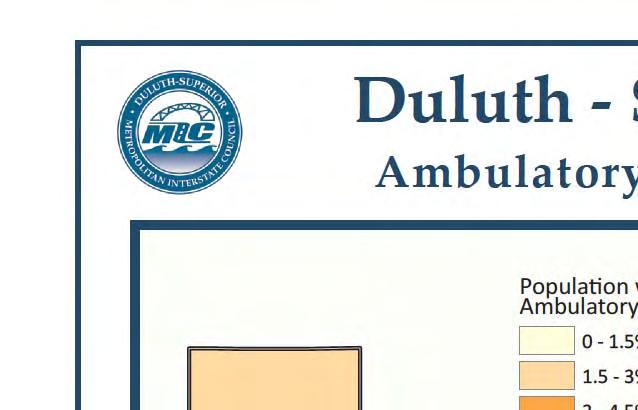
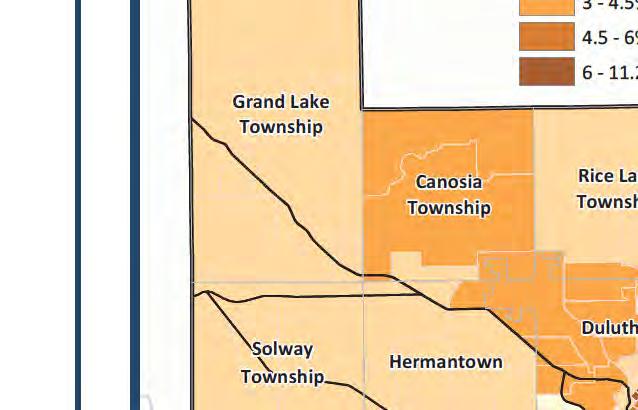
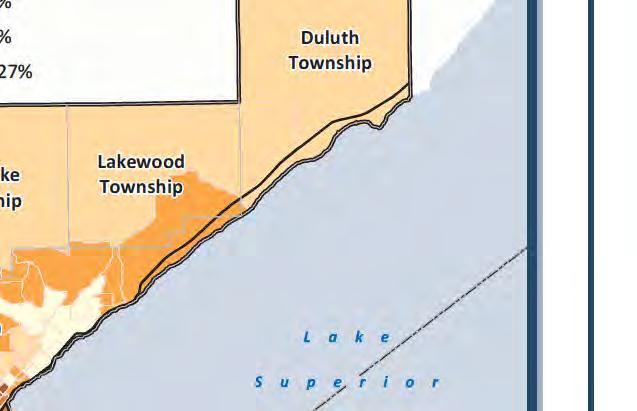
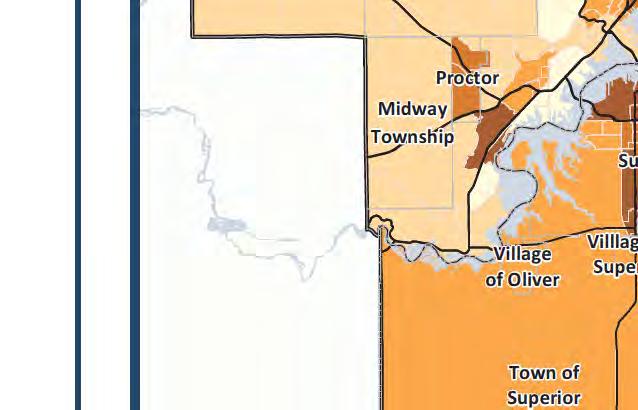
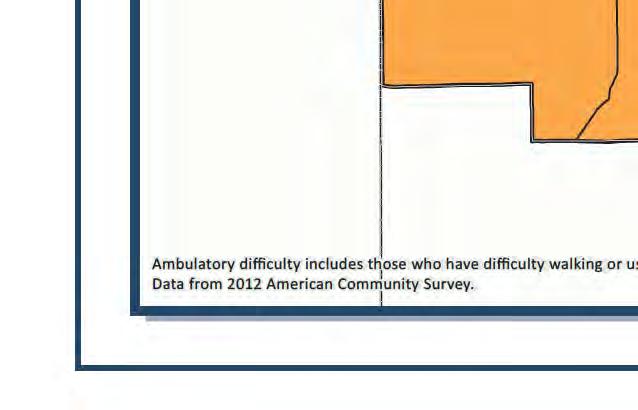
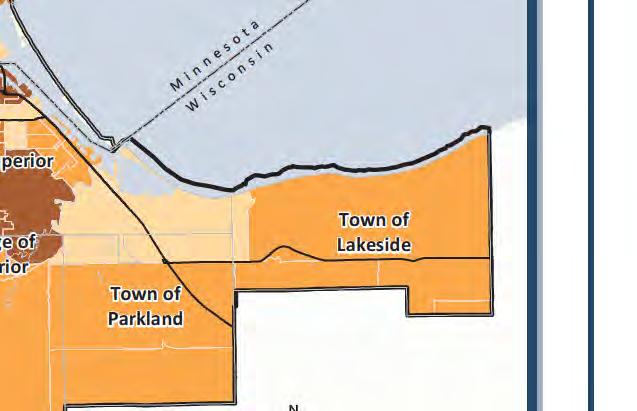
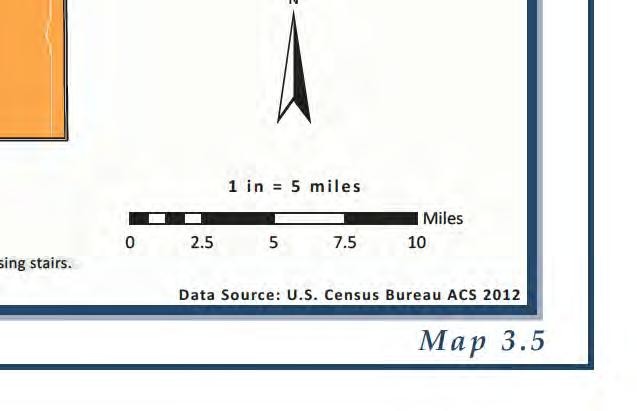
13 Ambulatory Difficulty The U.S. Census Bureau defines ambulatory difficulty as those who have serious difficulty walking or climbing stairs. This subset of the population is important to consider in transportation planning as they represent those with potentially greater mobility needs both in terms of services and infrastructure design. It is estimated that 3% of the MIC area s population have ambulatory difficulty. This is lower than the national average of 3.2%. Some municipalities, however, have estimates that are above the national average (see Table 3.7), and when looking at individual census tracts in the metro, the percent of people with ambulatory difficulty is estimated to be as high as 12% (Map 3.5 on the following page). Members of the population aged 65 and over represent a higher percentage of those with ambulatory difficulty. As people age, their ambulatory abilities begin to decline. As would be expected then, those over age 65 represent a greater percentage of those facing ambulatory difficulty. As Table 3.7 shows, this subset of the Duluth-Superior population has a level of ambulatory difficulty that is nearly 5 times larger than the population overall. Table 3.7: Estimates of those with ambulatory difficulty in the Duluth-Superior metropolitan area Area Population estimate (ages 5 and over) People with an ambulatory difficulty % ambulatory difficulty 3-13 Ages 65 and over Ages 65 and over with ambulatory difficulty % ambulatory difficulty MIC (MN ) 106,255 2, % 21,032 3, % Duluth 79,720 2, % 16,503 2, % Hermantown 8, % 1, % Proctor 2, % % Rice Lake T. 3, % % Grand Lake T. 2, % % Lakewood T. 2, % % Canosia T. 2, % % Solway T. 1, % % Duluth T. 1, % % Midway T. 1, % % MIC (WI) 29,755 1, % 5, % Superior 25,044 1, % 5, % T. of Superior 1, % % T. of Parkland 1, % % T. of Lakeside % % V. of Superior % % V. of Oliver % % TOTAL MIC AREA 136,010 4, % 26,924 3, % Source: US Census Bureau, ACS 5-year estimates ( ), 2014.
14
 for Northeast Minnesota and Northwest Wisconsin.")
15 The Economy & Employment Trend: The Duluth-Superior metropolitan area is expected to grow in its capacity as a regional trade center, with significant job growth anticipated to occur within the cities of Duluth, Hermantown, and Superior. The Regional Economy The Duluth-Superior metropolitan area is the regional trade center (RTC) for Northeast Minnesota and Northwest Wisconsin. It offers a wealth of opportunities for employment, shopping, tourism, trade, education, healthcare and other services. It is also a major transportation hub for the movement of commodities and other freight throughout the region, nation, and internationally - especially because of its port facilities. Because of the concentration of economic activities and transport, the Duluth-Superior metro drives regional productivity. The Blatnik Bridge on US Hwy 53 connects Duluth, MN (foreground) and Superior, WI As Figure 3.12 shows, in terms of real gross domestic product (GDP), the productivity of the MSA has tracked fairly closely with that of the Twin Cities and the State of Minnesota at large. In 2012, however, real GDP for the MSA was $142 million, which contained virtually no growth from the previous year. This appears to be the result of a tightening financial industry in the region, which has been showing decline since the global economic crisis of 2008 and 2009 and is having a dampening effect on the increasing productivity of the region s other prominent industries. This is illustrated in Figure 3.13 on the following page. Figure 3.12: Comparison of GDP trends (All Industries total - indexed) Source: U.S. Bureau of Economic Analysis,


16 Unemployment Rate Figure 3.13: Real GDP of prominent industries in the Duluth-Superior MSA Source: U.S. Bureau of Economic Analysis, As Figure 3.13 shows, despite the decreasing GDP of the area s financial sector, other prominent industries are showing signs of economic vitality. The Education and Health Services industries continue to be the biggest contributors to the area s productivity, while the Trade, Transportation, and Utilities industries have been increasing in productivity. And, as Figure 3.14 shows, these sectors have a potentially more significant impact on employment in the area, employing more people per $100 million in GDP than the finance and insurance sector. The growth of these industries in the region helps to explain an unemployment rate in the Duluth-Superior MSA that is decreasing significantly faster than the national unemployment rate (Figure 3.15). Figure 3.14: Jobs per $1 million in real GDP (average for all MSAs: 2010 to 2012) Education, health care and social services Wholesale and retail trade Transportation and utilities Finance and insurance Employment Trends While the activities of many businesses result in freight traffic on the area s roads, rails, airways, and waterways, the greatest impacts to the transportation system come from the many more numbers of employees and customers that businesses attract. That is why consideration is given in this plan for the numbers and types of jobs that are located throughout the Duluth-Superior metropolitan area. Different types of jobs tend to be associated with different levels of customer activity, and so the types and locations of jobs in an area can also help to understand the patterns of traffic related to shopping and services. According to data available through the Bureau of Labor statistics, total employment in the Duluth-Superior metropolitan statistical area (MSA) was estimated to be 122,000 jobs in More than Source: U.S. Bureau of Labor Statistics, % 10% 8% 6% 4% 2% 0% Figure 3.15: Comparison of unemployment trends US Minnesota Duluth-Superior MSA Year Source: U.S. Bureau of Labor Statistics,

.")
. Together, these sectors account for more than 54,000 employees in the area. Figure 3.")
17 half of these Jobs are within the Duluth-Superior MPO, as is shown in Figure The MPO had accounted for around 58% of the region s jobs between 2007 and 2011, and that approximately 5,000 jobs were added to the region during that time. Of all the jobs in the MPO, 97% are contained within the urbanized area (UZA) of the cities of Duluth, Hermantown, Proctor, and Superior, and the villages of Oliver and Superior. Figures 3.17 and 3.18 below show the employment profile of the Duluth-Superior urbanized area, coded according to the North American Industry Classification System (NAICS). Over 88% of the area s jobs are considered service-producing jobs and include the sectors associated with five of the area s six prominent industries previously discussed (Healthcare and education, Financial activities, trade, Leisure and hospitality, and Transportation and utilities). Together, these sectors account for more than 54,000 employees in the area. Figure 3.16: Total jobs in the Duluth-Superior MSA (2007 to 2011) Source: U.S. Census Bureau, LEHD, Figure 3.17: Service-Providing Employment (Duluth-Superior MPO area) Five of the area s most productive industry sectors (Health care and education, trade, leisure and hospitality, financial activities, transportation and utilities) account for 74% of all the jobs within the MPO area, employing more than 54,000 people. Source: U.S. Census Bureau, LEHD, Figure 3.18: Goods-Producing Employment (Duluth-Superior MPO area) Goods-producing jobs account for about 11% of the Duluth-Superior employment. This equates to more than 8,000 jobs, more than half of which are in manufacturing. Source: U.S. Census Bureau, LEHD,
.")
18 Goods producing jobs account for 11.3% of the jobs within the metro area. These include jobs in Agriculture, forestry, fishing, hunting and mining, as well as construction and manufacturing jobs. Together, these jobs employ approximately 8,300 people in the area. Figure 3.19: Jobs in the Duluth-Superior UZA according to retail, service, and other categories (2012). Traditionally, it has been understood that retail jobs, service jobs, and other types of jobs tend to generate different levels of employee and customer traffic. Thus, the jobs shown in Figure 3.17 and 3.18 on the page 3-17 were further organized according to the categories shown in Table 3.8 below and are represented in Figure 3.19 at right. Between 2007 and 2011, the total number of jobs in the area has remained relatively stable, rebounding from losses it experienced in the global crisis of 2008 and During this time, the three categories remained basically proportional to each other, with the Other category losing approximately 1,000 jobs, but the Service category gaining more than 3,300 jobs. Figure 3.20: Number of jobs by category in the MIC Area ( ) Source: U.S. Census Bureau, LEHD, Table 3.8: Organization of job types by Retail, Service, and Other categories. Job NAICS Category Code Job Types Retail Service Retail Trade 71 Arts, Entertainment, and Recreation 72 Accommodation and Food Service Transportation and Warehousing 51 Information 52 Finance and Insurance 53 Real Estate and Rental Leasing Professional, Scientific, and Technical Services Management of companies and Enterprises Administrative, Support, Waste Management and Remediation Services Source: U.S. Census Bureau, LEHD, Employment Projections The three job categories described above, their relative proportions, and rates of growth were all considered in estimating future employment for the Duluth-Superior area. Two employment projections were developed that correspond to the conservative and aggressive growth scenarios modeled for population growth. The results of these projections are described here, while the process of using them in future travel demand modeling is explained in more detail on pages 3-30 through Other 61 Educational Services 62 Health Care and Social Assistance Other Services [Except Public Administration] Agriculture, Forestry, Fishing and Hunting Mining, Quarrying, and Oil and Gas Extraction 22 Utilities 23 Construction Manufacturing 42 Wholesale Trade 92 Public Administration 3-18
 for the entire northeast region of Minnesota and represents a reasonable")

19 Under the conservative growth scenario, employment in the Duluth- Superior metropolitan area is estimated to grow by 11% to 79,496 jobs. This rate of growth is comparable to that projected by the Minnesota Department of Employment and Economic Development (DEED) for the entire northeast region of Minnesota and represents a reasonable estimate for growth, given the existing demographic and economic trends throughout the region. Figure 3.21: 2040 Job growth scenarios modeled for the MIC area. A rate of growth of 19% was modeled for the aggressive growth scenario. This results in a total of 85,000 jobs in the MIC area by the year 2040, exceeding the conservative projection by 4,580 jobs. The employment projections of both scenarios are displayed in Table 3.7. Once the growth scenarios were developed, staff at the MIC sat down with officials from the various jurisdictions within the area to identify where each municipality was planning future business growth to occur. Table 3.9 shows how the projected job numbers were allocated among the municipalities as the results of this process, and Figure 3.21 illustrates the proportion of jobs distributed between the major cities of Duluth and Superior and the surrounding communities under the two future scenarios. The types of jobs in the area are likely to change in ways that cannot be anticipated at present. However, the relative proportions of those job types are not expected to change dramatically. Figure 3.22 compares the estimated changes in the numbers of service, retail, and other jobs under the different growth scenarios. From that illustration, it can be seen that the growth in retail jobs is estimated to be negligible. This reflects an anticipated continuation of retail sales moving on-line, with those jobs making up 2% less of the area s employment in By contrast, jobs in the other category are expected to make up 4% more of the area s jobs. This reflects a level of growth in manufacturing jobs that the economic development initiatives of a number of the area s municipalities are calling for. Source: MIC Travel demand model (2014). Figure 3.22: Comparison of projected job growth by type in the MIC area. Source: MIC Travel demand model (2014). Table 3.9: Employment projections for the Duluth-Superior metropolitan area (2010 to 2040) Projection Total Change (30 years) Area Conservative Aggressive Cons. % Change Aggr. % Change MIC (MN ) 62,890 68,882 73,462 5, % 10, % Duluth 55,747 60,423 64,075 4, % 8, % Hermantown 4,035 4,949 5, % 1, % Proctor 1,147 1,195 1, % % Townships (MN Side) 1,961 2,315 2, % % MIC (WI) 8,663 10,614 11,771 1, % 3, % Superior 8,320 9,880 10,890 1, % 2, % Villages and towns % % (WI Side) TOTAL MIC AREA 71,553 79,496 85,233 7, % 13, % Source: URS Corp,

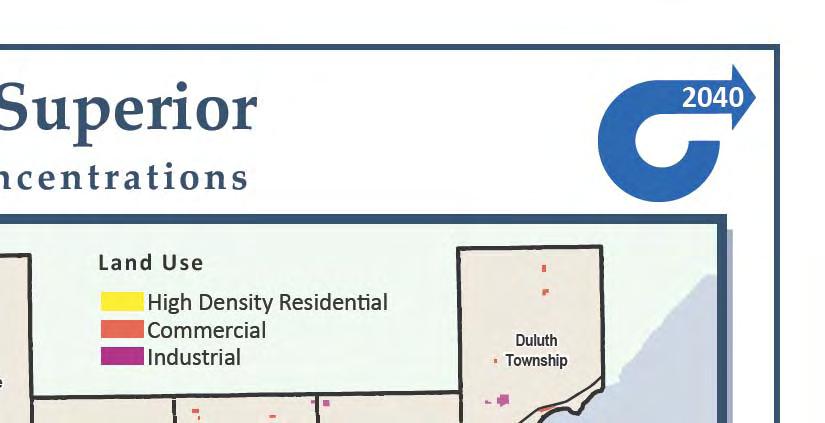
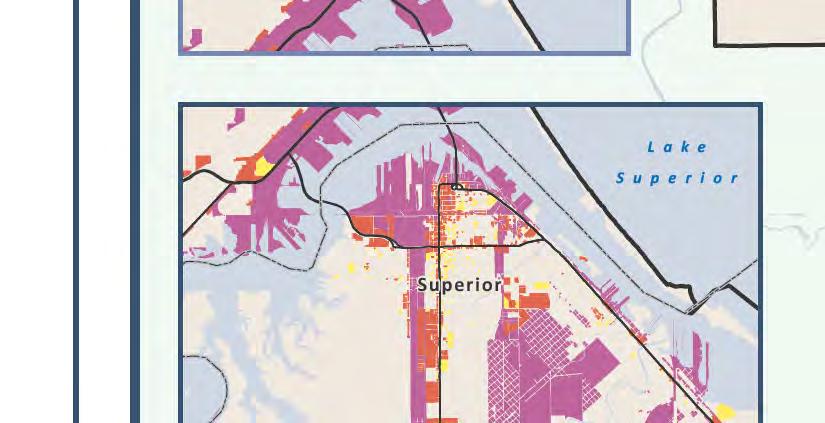
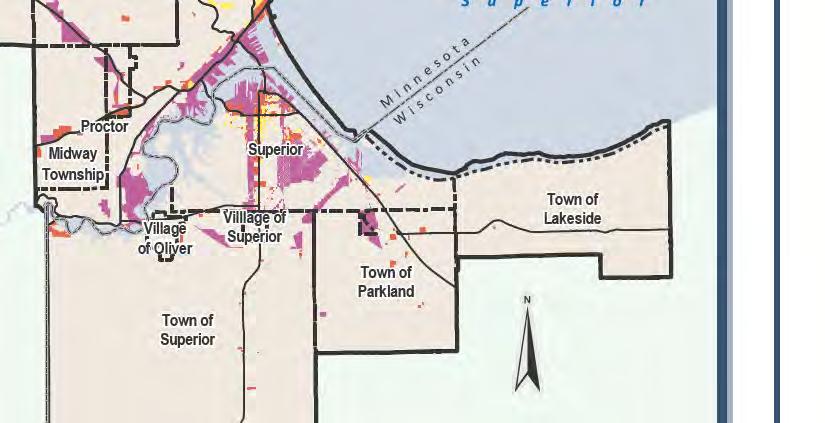
20 L U T D P Trend: More people are moving farther away from the area s concentra ons of employment and commercial ac vi es. The result is that more vehicle miles are being traveled throughout the area. There are some signs of increasing demand for other modes of transporta on. The preceding pages have presented informa on regarding trends in the numbers, types, and densi es of people and jobs within the Duluth-Superior metropolitan planning area. These are important considera ons for transporta on planning for a variety of reasons, but trends in land use and travel behavior are also important to consider. Land use and transporta on are inextricably linked; trends occurring in one generally influence pa erns of the other. The demand for different modes of transporta on can similarly influence the provision of transporta on services and pa erns of land development. This dynamic rela onship makes it necessary to coordinate the planning of transporta on improvements in the metro area with land use planning of the individual municipali es and vice-versa. The following pages describe these trends in the Duluth-Superior area. US Highway 53 in Duluth Travel pa erns influenced by land uses Local travel to jobs, services, and shopping Regional commuter traffic Movements of freight Seasonal traffic (e.g. holidays, tourism) Land Use Pa erns The shape and size of the Duluth-Superior area and its land uses are the result of the economic and industrial activities that have gathered around its harbors over time. The area s patterns of landuse today largely remain that way; industrial activities are still concentrated near the ports, and employment and services are still concentrated in nearby central business districts. Over the past several decades, however, more of the area s population and commercial activities have migrated further from the central cities. As the urban boundary has expanded, large concentrations of commercial activity - such as the Miller Hill Mall - have developed farther away from the largest concentrations of people. Map 3.6 on the following page, shows the concentrations high-density residential areas relative to concentrations of commercial and industrial activities. Development in the Duluth-Superior metro continues to expand beyond the urbanized area. Signs of this can be seen in the population and employment estimates from the U.S. Census Bureau; changes in the number of jobs and employees in the core cities versus the surrounding communities suggest a metropolitan area that is getting larger but becoming less dense (Figure 3.23). Figure 3.23: Changes in Jobs and working-aged People living and working in the MIC area: 2006 to ,000 6,000 4,000 2,000 0 Duluth & Superior Change in Jobs Change in Resident Workers Surrounding Communities Source: US Census Bureau, LED Origin-Des na on Data Base (2014). 3-20


21
. Figure 3.")

22 While the trend of spreading out of development is typical of most metropolitan areas, the pattern seems more noteworthy for the Duluth-Superior area when comparing its population density to those of U.S. metro areas of similar size (Figure 3.24). Figure 3.24: Comparison of urban area population densities 2,500 Persons per Square Mile Being a metro area with lower-than-average density implies accompanying trends of higher-than-average consumption of energy and resources. As the distances between population, commercial centers, jobs, and services become greater, they require greater extensions of infrastructure and service networks, and result in longer travel times. 2,000 1,500 1, All UZAs over 50K (Avg) Similar Sized UZAs (Avg)* Duluth-Superior UZA Local Travel Patterns Travel times have been getting longer in the Duluth-Superior area. This can be seen in the Travel-Time-to-Work data provided by the Census Bureau, which shows that, while the majority of residents have commute times under 20 minutes (Figure 3.25), commute times have been getting longer in the population overall. For example, those with commutes of less than 15 minutes have decreased from 44% to 41% of the population between the years 2000 and 2010 (Figure 3.26). Source: FHWA Statistical Highway Series (2013). * metropolitan areas of similar population size to the Duluth-Superior UZA (range: 110,000 to 130,000 people; n=37). The majority of this increased travel is occurring as additional singleoccupancy automobile trips. It is estimated that 87% of the working population in the Duluth-Superior area drive to work alone, while 9% carpool, and 9% travel to work by some other means (see Figure 3.27 on the following page). Figure 3.25: Travel time to work: Duluth-Superior metropolitan area Source: U.S Census Bureau: Census 2000; ACS. Figure 3.26: Change in metro population s travel times to work (2000 to 2010). 16,000 14,000 12,000 10,000 8,000 6,000 4,000 2, % 80% 60% 40% 20% 0% 44.3% 41.2% 40.5% 42.0% 12.2% 13.0% * Work at home 0 to 15 min. 15 to 30 min. >30 min. Source: U.S Census Bureau: Census 2000; ACS. * ACS 5-Year estimate., 3-22
23 Miles (thousands) It is interesting to note in Figure 3.27 that a slight shift in people s travel choices has also occurred in the area since The percentage of those traveling to work by automobile decreased by 2%, while those working from home or traveling by other means each increased one percentage point. This shift is consistent with trends known to be occurring throughout the country: increased telecommuting and an increased bike commuting. Nevertheless, the majority of travel in the area still occurs in the form of automobile trips, and it is understood that this travel is occurring primarily as two distinct mass movements of vehicles throughout the area - a few hours in the morning and a few hours in the afternoon. These are times when the area s transportation system is most congested and the efficiency of traffic operations at various locations throughout the network are most challenged. The overall amount of automobile travel in the area, however, appears to be holding steady. As Figure 3.28 shows, the number of total miles traveled by vehicles on an average day, or vehicle-milestraveled (VMT), has remained roughly the same over the past decade for both the tri-county MSA and the Duluth-Superior urbanized area. This is consistent with VMT trends observed at both the state and national levels over the same period. When looking more closely at VMT in the urbanized area versus the larger MSA, however, some differences are noticed in their trend lines. Despite being relatively flat, the VMT for both geographies has been increasing slightly. For the MSA, daily travel has been trending upward by 0.1% every year (Figure 3.29), while VMT for the urban area has been averaging a 0.3% increase per year (Figure 3.30). With that said, VMT in the urbanized area has been decreasing consecutively, year after year, since Figure 3.27: Means of travel to work: Duluth-Superior metro 80% 60% 40% 20% 0% 78% 9% Year 2000 Year % 4% 2% 4% Source: U.S Census Bureau: ACS (2014). Figure 3.28: Daily vehicle-miles-traveled (VMT): 2001 to ,000 11,000 9,000 7,000 5,000 3,000 1,000 Duluth-Superior UZA Duluth-Superior MSA Source: FHWA Highway Statistics Series (2104); MnDOT Roadway Data (2014). Figure 3.29: Daily vehicle-miles-traveled (VMT) in the Duluth- Superior MSA: 2002 to 2012 Figure 3.30: Daily vehicle-miles-traveled (VMT) in the Duluth- Superior UZA: 2002 to 2012 Source: MnDOT Roadway Data (2014). Source: FHWA Highway Statistics Series (2104) 3-23

24 Local Demand for Other Modes of Transportation While growth in vehicle travel demand in the area appears modest, there are signs of growing demand for other forms of transportation in the area. The usage of public transit, in particular, has grown by 20% over the recent decade, serving 547,000 more riders in 2013 than in When comparing the most recently available data regarding passenger miles traveled (PMT) with overall vehicle miles traveled (VMT) in the urbanized area, transit usage appears to be increasing in contrast to a decreasing VMT (Figure 3.31 and Figure 3.32). There are signs that the use of other modes in the Duluth-Superior area are on the rise too. Each DTA bus is equipped with front-end bike racks year-round and, as with passengers, the DTA also counts the numbers of bikes it transports. This data can be considered as somewhat of a proxy measure for non-motorized transportation demand in the area. It shows that between the first year of data collection (2006) and 2012, the annual number of bikes on buses increased by more than 14,000 trips an average annual increase of 14% (Figure 3.33). This trend was reversed in 2013, which staff at the DTA has speculated was the result of a combination of a longer-than-average winter, more inclement weather days, and new housing opportunities opening up near college campuses in the area. Figure 3.31: Annual passenger revenue miles (PMT) in the Duluth-Superior UZA: DTA Regular Route service (2007 to 2011) Source: FTA National Transit Database (2014). Figure 3.32: Annual vehicle miles traveled (VMT) in the Duluth-Superior UZA (2007 to 2011) While the demand for walking and biking in the Duluth-Superior area is not something that can presently be measured system wide, there is anecdotal evidence of increasing demand. For instance, cyclists appear to be more present especially in nonsummer months - in and around downtown Duluth and Superior. Source: FHWA Statistical Highway Series (2013). Figure 3.33: Annual bikes transported on DTA buses Cyclist placing bike on DTA bus Source: Duluth Transit Authority (2014). 3-24
, and volunteer driver services")
25 Demand for Transportation Assistance There are members of the Duluth-Superior community that face transportation challenges due to poverty or to mental or physical disabilities. The transportation needs of some of these individuals are being met with a combination of the DTA s regular route bus service, paratransit (aka dial-a-ride service), and volunteer driver services funded through regional agencies. There are some signals that the demand for transportation assistance is increasing in the Duluth-Superior metro. The DTA has reported the number of clients registered to use the DTA s paratransit service, STRIDE, has increased in recent years. While the levels of use the service experiences can vary significantly from year to year, the trend line suggests there has been a 0.3% increase in the use of STRIDE since 2004 (Figure 3.34). Other programs that provide transportation assistance in the area have also experienced increases in usage. The Assisted Transportation program administered by the Arrowhead Agency on Aging (AAA) provides mileage-reimbursement for volunteers who provide rides to seniors, principally for medical appointments. Use of this program has followed a trend line that is equivalent to a 20% annual increase in use since 2003 (Figure 3.35). Though this data is for the entire Arrowhead region, staff at the AAA contend that a similar rate of increased use is occurring in the Duluth area as well. The Arrowhead Economic Opportunity Agency (AEOA) provides a similar mileage-reimbursement program for volunteers for individuals on public assistance in Lake County, Koochiching County, and St. Louis County in Minnesota. This program is the outcome of a recent convergence of smaller programs, and so AEOA does not have data that can fairly outline trends in usage, but AEOA does report providing an average of 3,000 trips per month in these counties. Figure 3.34: Annual DTA ridership: STRIDE service Source: Duluth Transit Authority (2014). Figure 3.35: Increase in annual 1st Quarter trip reimbursements administered by AAA in the Arrowhead Region Source: Arrowhead Agency on Aging (2014). Wheelchair user accessing medical appointment by using the STRIDE service. 3-25


26 Regional Travel Demand Patterns Being the regional trade center (RTC) of Northeast Minnesota and Northwest Wisconsin, the Duluth-Superior area attracts regional traffic related commerce, both in terms of the transfer of freight and the commutes of workers who live beyond its boundaries. Data regarding freight movements is generally proprietary and difficult to track, but data regarding the location of workers homes and jobs shows slight increases in the numbers and distances of people commuting into the area for work. The Census Bureau s Longitudinal Employment-Household Dynamics (LEHD) data is one of the most comprehensive datasets available regarding employment and worker flow. The data is drawn from state unemployment insurance (UI) earnings records that provides a link between home location and job location. In some cases, the UI records may link employees to a payroll location they do not actually commute to. It is for this reason that, upon review, the MIC planning staff estimates the LEHD employee count for the Duluth- Superior area is overrepresented by 12%. Once this is adjusted for, the data shows that 27,000 people are potentially commuting into the area for work on a daily basis, while 11,800 people are commuting outside the area 2011 (see Table 3.10). The LEHD data also shows that employment in the area grew by more than 3,000 jobs between 2002 and 2011 and that nearly twothirds of that growth (1,930) went to people living within the metropolitan boundary. The other 1,704 jobs were additional people commuting into the area. This ratio of new resident to nonresident workers is roughly equivalent to the distribution that already existed in the area, which shows that 37% of the area s jobs are held by people living outside of the Duluth-Superior metro (Figure 3.36). Duluth and Superior attract a significant amount of commercial and employment-related traffic from outside the metro area Figure 3.36: Jobs in the MIC area according to where workers live (2011). Source: U.S Census Bureau, LEHD (2014). Table 3.10: Changes in the numbers of MIC area workers living in inside and outside the MIC area ( ) Person Characteristic 2002 LEHD Count Adjusted 12% % Share 2011 LEHD Count Adjusted 12% % Share Change Employed in the MIC area 78,488 69, % 81,901 72, % 3,003 Employed in the MIC area but living outside 29,488 25, % 30,708 27, % 1,074 Employed and living in the MIC area 49,000 43, % 51,193 45, % 1,930 Living in the MIC area 62,253 54, % 64,658 56, % 2,116 Living in the MIC area but employed outside 13,253 11, % 13,465 11, % 187 Living and employed in the MIC area 49,000 43, % 51,193 45, % 1,930 Source: U.S Census Bureau, LEHD (2014), adjusted by MIC. 3-26

. Figure 3.38 indicates that more people are now traveling longer distances to access jobs in the area.")
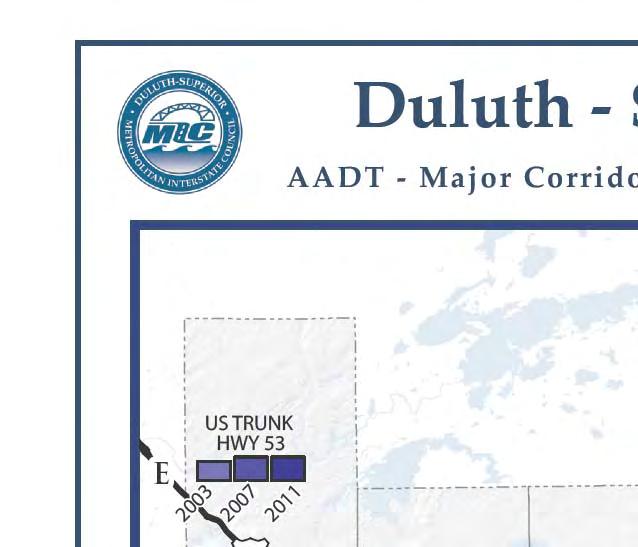
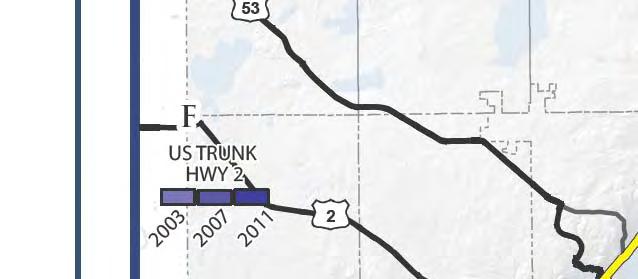
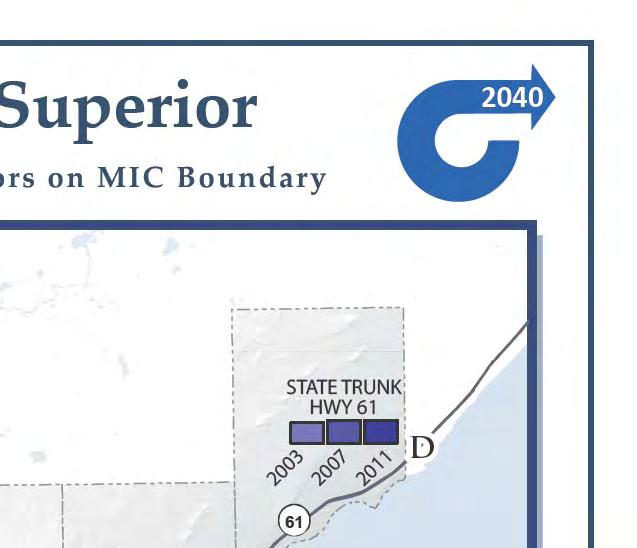
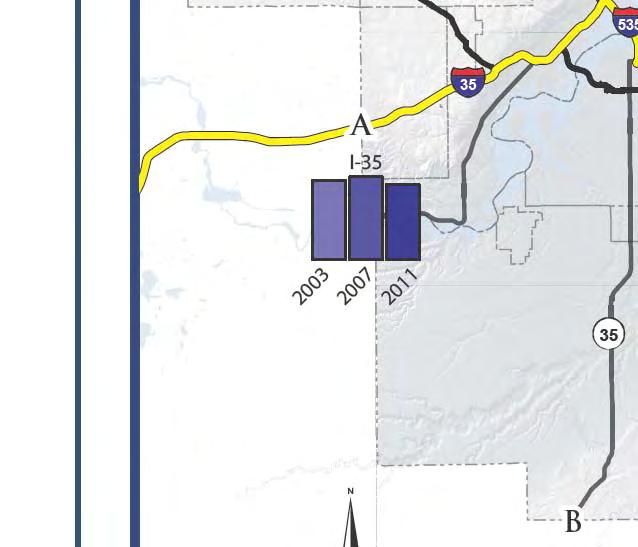
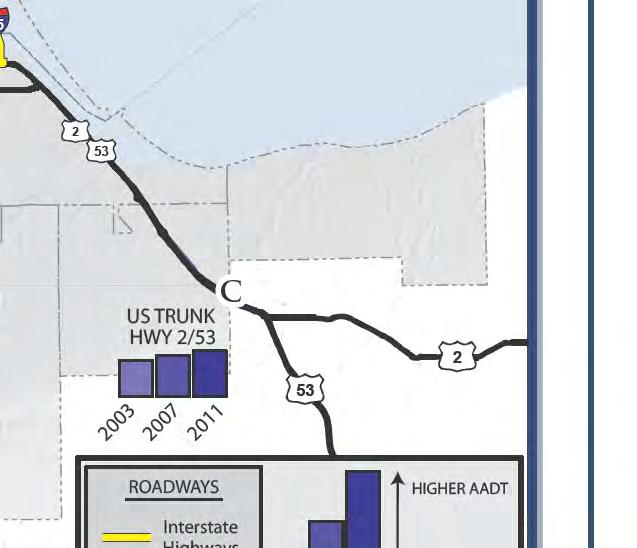
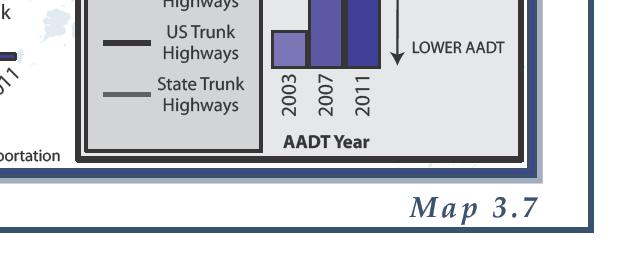
27 The LEHD On the Map web application also shows the proportion of employment-based commuter traffic by distance and direction. From this information, the overall pattern of regional traffic to and from the Duluth-Superior metropolitan area can be seen, and it becomes apparent that much of the long-distance commuting to and from Duluth Superior is moving along the I-35 corridor, followed by travel south into Wisconsin (Figure 3.37). Figure 3.37: Distance and direction of workers travel to/ from the MIC area to their jobs (2002). Figure 3.38 indicates that more people are now traveling longer distances to access jobs in the area. It shows that the number of people commuting between 25 and 50 miles grew by 4.4%, while the number of people traveling more than 50 miles may have grown by as much as 7.5%. It also shows that substantially more commuter traffic is occurring from communities that are 10 to 25 miles west and northwest of the area. This is a pattern that is consistent with population increases in townships adjacent to the MIC planning area and in Carlton County to the west. The increased commuter traffic to the area is consistent with increases in the average annual daily traffic (AADT) on regional corridors at the area s boundary. As seen in Table 3.11 below, many of the key corridors experienced approximately a 10% increase in their annual average daily traffic (AADT) between 2003 and The geographic locations of these increases can be seen in Map 3.7 on the following page. Despite the general increase in traffic at the MIC boundary, one important regional corridor stands out as an exception: Interstate 35. Between 2003 and 2011, I-35 experienced a 12% decrease in daily traffic. This is likely the result of many factors; impacts of the recent economic downturn of 2008 and 2009, increasing gas prices, and large-scale construction projects in 2010 and 2011 likely all suppressed non-work, interregional travel (such as tourism) on I-35. This trend is expected to be reversed in coming years. Source: U.S Census Bureau, LEHD On the Map (2014). Figure 3.38: Distance and direction of workers travel to/ from the MIC area to their jobs (2011). Table 3.11: Increases in daily traffic at MIC boundary ( ) Roadway 2003 AADT* 2007 AADT* 2011 AADT* %Change A. Interstate 35 28,900 27,600 25,400-12% B. WI State Trunk Hwy 35 1,650 1,700 1,800 9% C. US Trunk Hwy 2/53 12,680 13,700 13,900 10% D. US Trunk Hwy 53 7,100 7,900 7,900 11% E. US Trunk Hwy 2 4,750 4,600 5,100 7% F. MN State Trunk Hwy 61 6,900 7,600 7,600 10% Sources: Minnesota Department of Transportation and Wisconsin Department of Transportation, Source: U.S Census Bureau, LEHD On the Map (2014). 3-27

28

29 Demand for Other Modes: Air, Rail, and Water In addition to the regional traffic facilitated by the area s network of highways and roads, Duluth-Superior is also home to major transportation facilities that serve interregional air, rail, and waterborne transportation. The area has three major airports of regional significance for passenger service, freight movements, and recreational flying: the Duluth International Airport (DLH), the Richard I. Bong Municipal Airport (SUW), and Duluth s Sky Harbor Airport (DYT). The SUW and DYT airports facilitate more than 19,000 and 13,000 flight operations a year, and despite facing competition from the larger Minneapolis-St. Paul International Airport (MSP) - DLH served 28,900 more in passengers in 2013 than it did in 2001, trending at an average 0.8% annual increase over that period (Figure 3.39). An extensive network of railways exists in and around Duluth- Superior. More than 40% of rail crossings on the Minnesota side of the MIC area and more than 50% on the Wisconsin side experience more than five train movements per day (Figure 3.40). At present, all such movements are exclusively freight trips, as passenger rail service to the area ended in 1980, but there has been increasing efforts in recent years to study the feasibility and demand potential for creating a high-speed rail connection between Duluth-Superior and St. Paul, Minnesota. A marketing study is currently underway, and MnDOT s Office of Passenger Rail is modeling the potential ridership attraction of a select number of station locations. The Duluth-Superior port is are the largest Great Lakes port for bulk commodities, shipping an average 38 million tons annually. As with the other major ports on the Great Lakes, the Duluth- Superior port has experienced decreases in the amount of freight moving through it; total tonnage decreased 12% between 2001 and Nevertheless, the port has continued to facilitate significantly more tonnage than the other Great Lakes ports (Figure 3.41). Up to 100 foreign ships call on the Duluth-Superior port each year bringing imports such as steel, wind energy components and manufactured heavy equipment and return overseas with grain. On intermittent years, cruise ships carrying passengers have visited the area, and the MIC has worked with the Duluth Port Authority to study the feasibility of establishing a cruise ship docking facility to grow the cruise ship industry while also meeting federal security requirements. Figure 3.39: Annual passenger enplanements at DLH (2001 to 2013) Source: Duluth International Airport (2014). Figure 3.40: Average daily train movements at rail crossings in Duluth-Superior Source: Federal Rail Administration (2014). Figure 3.41: Annual tonnage moving through major Great Lakes ports (2001 and 2011) Source: Federal Rail Administration (2014). 3-29


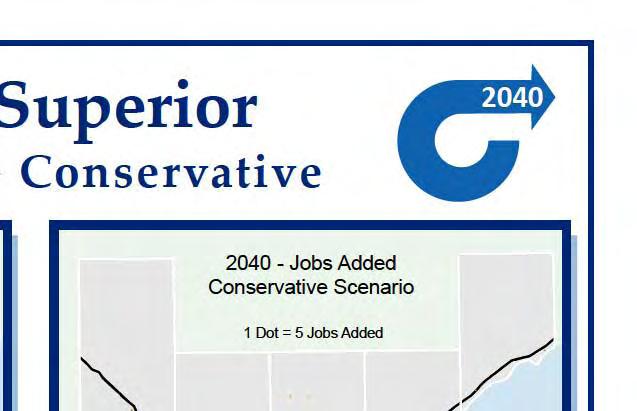
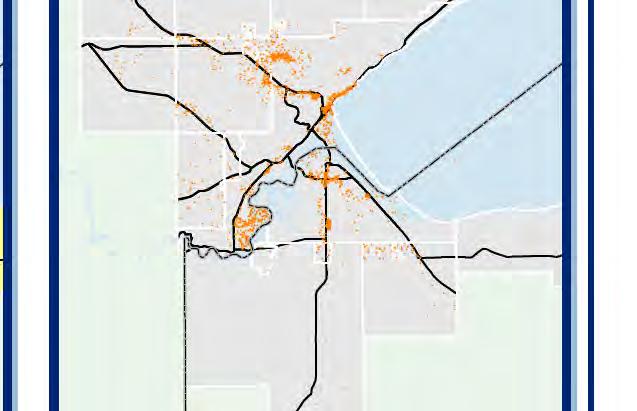
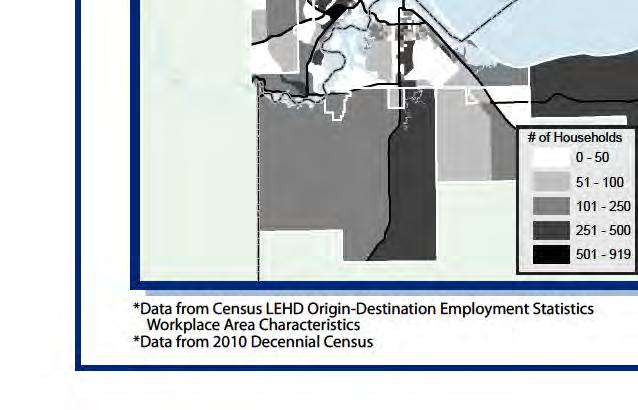
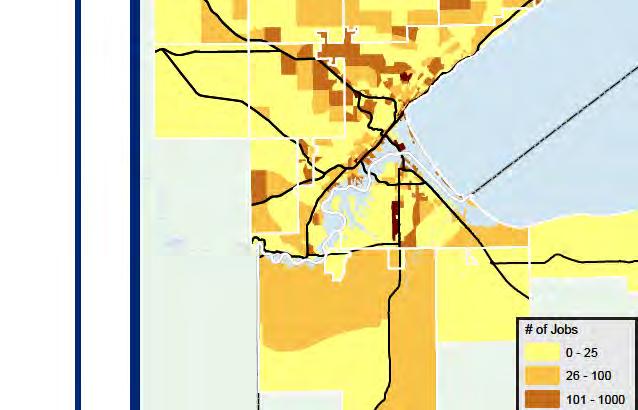
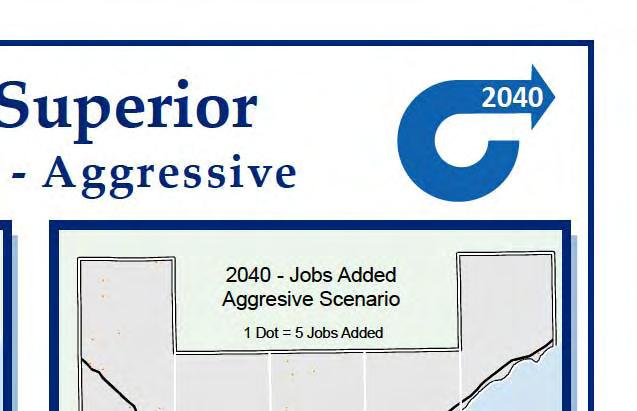
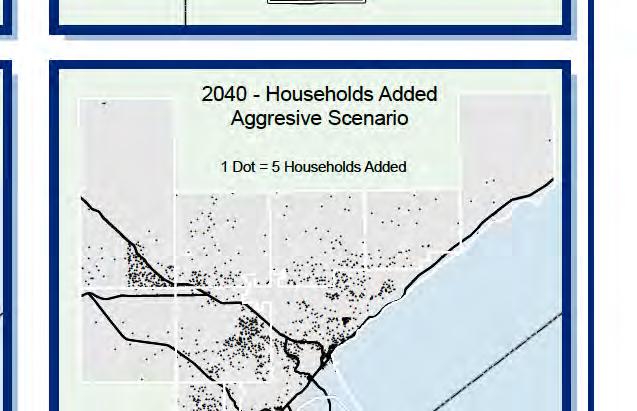
30 Modeling Future Travel Demand Trend: Increases in households and employment are projected to lead to significant increases in traffic in some areas. Some key corridors will approach capacity over the next 25 years and will require planning and investments to mitigate congestion. The MIC models both current and future transportation demand in Duluth-Superior using a mix of traffic volume and socioeconomic data. As part of Connections 2040, the existing model was updated to reflect Census 2010 information as well as changes to the road network that have occurred since This information was then used to model the impacts of the changes in both population and employment as are being projected under the two growth scenarios discussed on pages 3.7 and Levels of population and employment cannot tell the story alone. Information regarding trends in household sizes, job types, and land use patterns were used to help identify where increases in populations and jobs will most likely be occurring in the area. For this purpose, the planning staff at the MIC met with officials from the various municipalities and jurisdictions in the area to help allocate projected population and employment to the different transportation analysis zones (TAZs) in the model. Map 3.8 and Map 3.9 on the following pages illustrate how increases in households and jobs are being allocated under the conservative and aggressive growth scenarios. Traffic on I-35 near downtown Duluth. Modeling the Duluth-Superior Transportation Network based on TAZs: Transportation demand modeling uses a set of computerized processes to predict changes in travel patterns in response to changes in demographics, development patterns, and the transportation network itself. The allocation of future households and jobs, as well as projected school enrollment, were all inputs into the transportation demand model, which was then used to predict the volumes and paths of future traffic on the area s road network under both growth scenarios. The model produced outputs in the form of predicted future volumes, vehicles-to-capacity (V/C) ratios, and estimated levels of service (LOS) for each of the road links represented in the model. LOS is a description of the levels of traffic that one would experience as they are traveling on a certain road (see Figure 3.42). Figure 3.42: Levels of Service Descriptions Describing capacity conditions with LOS: The capacity of a network link is dependent on the assumed level of service (LOS). LOS is a vehicles-to-capacity ratio and is used to estimate the amount of delay on a network link. 3-30
31
32
33 Comparing Present and Future Conditions When comparing the information in maps 3.8 and 3.9 on the previous pages, it is apparent that the majority of the area s households and jobs will continue to be concentrated in the cities of Duluth and Superior. Both future scenarios, however, anticipate an expansion of population and employment into the surrounding communities. As Table 3.12 shows, the City of Duluth is projected to represent 2% to 3% less of the area s jobs while surrounding communities increase a percent. Table 3.13 shows an even greater pattern of dispersion with respect to households. Figures 3.43 and 3.44 below illustrate these trends between 2010 and the 2040 aggressive growth scenario. Table 3.12: Projected Increases in jobs Area 2010 Jobs % Share 2040 Jobs Conservative scenario % Share 2040 Jobs Aggressive scenario % Share Duluth 55, % 60, % 64, % Superior 8, % 9, % 10, % Hermantown 4, % 4, % 5, % Proctor 1, % 1, % 1, % Surrounding communities 2, % 3, % 3, % TOTAL MIC AREA 71, % 79, % 85, % Source: MIC travel demand model (2014). Table 3.13: Projected Increases in households Area 2010 Jobs % Share 2040 Households Conservative scenario % Share 2040 Households Aggressive scenario % Share Duluth 38, % 39, % 42, % Superior 13, % 12, % 13, % Hermantown 3, % 5, % 5, % Proctor 1, % 1, % 1, % Surrounding communities 6, % 11, % 13, % TOTAL MIC AREA 63, % 69, % 75, % Source: MIC travel demand model (2014). Figure 3.43: Distribution of households and jobs model base year Figure 3.44: Distribution of households and jobs Aggressive scenario 3-33

 per day in the area (Figure 3.")
34 The general pattern of concentrating jobs in the urban center and an dispersing households further out from that center translates into greater trip distances and travel times between households, jobs, shopping, etc. The impacts of such land use changes in the MIC area were calculated with the travel demand model. As Table 3.14 demonstrates, every type of trip, with the exception of those between households and schools (due to decreased levels of enrollment) are increasing by 9% under the conservative scenario and 19% under the aggressive growth scenario. This is estimated to amount to an additional 744,000 to 1.1 million vehicle-miles-traveled (VMT) per day in the area (Figure 3.45) and 21,800 to 31,000 more hours of travel (Table 3.15). Each mile, on average, would take approximately 6 seconds longer (conservative growth) to 14 seconds longer (aggressive growth) to travel in An average commute time of 20 minutes, for example, would become more than 24 minutes under the aggressive growth scenario. The increased VMT and VHT would also equate to more fuel consumption and vehicle emissions. The FHWA has estimated an average fuel consumption of 21.4 miles-per-gallon per vehicle, and the EPA has estimated metric tons of greenhouse gases emitted per mile traveled ( Based on these estimates, the MIC area could be consuming 18.6 million more gallons of gasoline and releasing 164,000 more metric tons of greenhouse gases into the atmosphere annually by 2040 (Figure 3.46). Figure 3.45: Daily vehicle-miles-traveled (VMT) estimates under three different modeled scenarios. Source: MIC travel demand model (2014). Figure 3.46: Estimated annual greenhouse gas emissions from vehicles under three different modeled scenarios Table 3.14: Projected Increases in Trip Productions Trip type 2010 daily trips 2040 daily trips Conservative scenario % Change 2040 daily trips Aggressive scenario % Change Home-based work 89,599 97,389 9% 106,212 19% Home-based shopping 90,130 98,133 9% 107,072 19% Home-based School 89,412 86,496-3% 93,014 4% Home-based other 157, ,693 9% 187,277 19% Non home-based 142, ,958 9% 169,082 19% TOTAL 569, ,669 7% 662,657 16% Source: MIC (2014). Source: Trip estimations from Duluth-Superior traffic demand model, Table 3.15: Increase in Daily Miles and Hours Traveled Scenario VMT % Change from 2010 VHT 2010 Base year 3,010,946 67, % Change from Conservative 3,755, % 89, % 2040 Aggressive 4,103, % 98, % * VMT (vehicle miles traveled); VHT (vehicle hours traveled) Source: Trip estimations from Duluth-Superior traffic demand model, 2014.


35 Future Deficiencies Identified in the Traffic Model Where new households and jobs are located can cumulatively result in significant impacts to the operations of a transportation system. The MIC area travel demand model was thus used to identify where such issues might occur under the two growth scenarios being considered as part of this long-range plan. All segments that the model identified as being at or beyond capacity now or in the future are listed in Table 3.16 below and also shown in Map 3.10 and Map 3.11 on the following pages. These are estimates based on basic daily volume parameters that are discussed in more detail in Appendix A of this plan. Conditions specific to each segment would require further study, but the model results do suggest that strategies should be considered for these segments to accommodate the potential future demand. Such strategies may include upgrading parallel facilities, managing demand through access control and other measures, increasing transit services, or even expanding the existing lane capacity, if necessary. Screen shot of the MIC area travel demand model Table 3.16: Projected deficiencies in level of service under three different modeled scenarios (MIC area model) 3-35


36


37


38 System Conditions Trend: The ongoing maintenance of the area s roads, bridges, and public transit vehicles will become an increasingly burdensome challenge as public revenue streams are not keeping pace with the costs of maintaining the system. Transportation assets - roads, bridges, buses, etc - depreciate over time and require ongoing maintenance. The costs of that maintenance is subject to inflation and requires careful planning in terms of how to best manage these assets in the future. The Duluth- Superior area has an extensive network of roads and bridges; and public transit vehicles put on a lot of miles in order to serve that network. The following sections offer a system-wide assessment of the conditions of these assets. Pavement Condition In 2009, the MIC gathered pavement quality data from its jurisdictions and categorized them in an attempt to derive some measure of system condition. It did this again in The resulting information is only a rough estimate of system condition, as it does not sufficiently speak to the integrity of either road substructure or major infrastructure, but it does provide a sketch of the potential extent of the maintenance needs throughout the MIC area. On a whole, the pavement condition of the 720 miles of classified roadways in the MIC area appears to have been improving. The number of miles identified as Good have increased by 76 miles (28%) (Figure 3.47). Today, nearly half of the system s pavement miles are in good condition (Figure 3.48). But when looking at this same data in terms of who owns and maintains those miles, it becomes apparent that the network of local roads is falling into disrepair at a rate substantially disproportionate to local maintenance efforts (Figure 3.49). Figure 3.48: MIC area pavement quality (2014) Surface cracking and pavement deterioration Figure 3.47: Trend in MIC area pavement conditions (2014 vs. 2009) Source: Data provided by MIC area jurisdictions. Figure 3.49: Pavement condition of MIC area roads according to jurisdiction type (2014) Source: Data provided by MIC area jurisdictions. Source: Data provided by MIC area jurisdictions. 3-38

39 As explained in more detail in Chapter 5, the financial demands of maintaining the Duluth-Superior transportation system are expected to outpace jurisdictions abilities to pay for it, if transportation revenues remain at current levels. Even when forecasting the municipalities current levels of funding at a 1% annual rate of inflation over the next 25 years, it would not be enough to bring all the poor miles to a good condition (Figure 3.50). Figure 3.50: Comparison of estimated pavement needs and 25-year revenue projections for local jurisdictions (2014) * Portion of total revenue based on the portion of county road miles within the MIC area. Data sources: Pavement condition ratings as reported by individual jurisdictions (2014); revenue information from the Minnesota Office of the State Auditor and the Wisconsin Department of Revenue (2014). Condition of Area Bridges Bridges represent some of the most critical pieces of infrastructure within an area s transportation system. They also represent some of the most expensive infrastructure with stringent engineering and maintenance requirements, and are thus challenging assets to manage over time. The Blatnik Bridge (I-535) and Bong Bridge (US 2) are the area s two most important and iconic bridges, together facilitating the passage of more than 47,000 vehicles across the Duluth-Superior harbor on an average day. But, the MIC area has more than 300 other bridge structures within its boundaries that also need to be maintained. Among these are many ramps and overpasses found along the interstates and major highways throughout the area. For example, the interchange of I-535, I-35, and US 53 (known locally as the Can of Worms ) contains more than 30 individual bridge structures. MnDOT District 1 has determined that much of the interchange will View of Bong Bridge from Duluth Harbor 3-39


40 require major reconstruction within the next 20 years and anticipates that construction costs will approach $500 million. Data available through the National Bridge Inventory provides information regarding the length and age of the area s bridges, as well as a sufficiency rating for each structure. Together, this information gives some idea of the condition of the area s bridges. The bridge sufficiency ratings are used for the purpose of federal funding. They represent a composite score in which 55% is based on structural condition, 30% on whether elements of its design are obsolete, and 15% on its public importance. The ratings follow a 100 point scale; bridges with ratings lower than 80 are considered eligible for federal repair funding, while bridges with ratings below 50 are considered eligible for funds to help replace them. As of 2012, 56% of the bridges within the MIC area had ratings below 80, and 43% had ratings below 50. While these scores do not exactly indicate the degree of disrepair facing these bridges, it provides some sense of the amount of bridge work facing the area jurisdictions in the coming decades. The ages of bridges may be a further indicator of this. Major bridge structures are typically built and maintained for a lifespan well beyond 50 years. When looking at the age/length profile of bridges within the Duluth-Superior area, it can be seen that almost 80% the bridges and 85% of the total bridge mileage is less than 50 years old (Figure 3.52). While this would suggest that conditions are far from urgent, it should be noted that the majority of the area s bridges are within 25 to 50 years of age. This suggests that the area could become inundated with necessary bridge replacements at some point in the coming decades. And, given signs that jurisdictions will have financial difficulty in merely maintaining their road pavements, this is a daunting prospect. Aerial view of Duluth s Can of Worms Image source: Google Maps, Figure 3.51: Sufficiency ratings of MIC area Bridges (2012) Source: National Bridge Inventory Database (2014) Figure 3.52: Age profile of MIC area bridges (2012) Condition of Transit Vehicles Public transit in Duluth-Superior faces challenges similar to those regarding the area s pavements and bridges. Federal funding has become less available for bus purchases in recent years and, as a result, the Duluth Transit Authority (DTA) is struggling to maintain the standards it has set for its fleets of buses. The DTA has estimated the service life of its Regular-Route buses to be 12 years. Because of this, it has aimed to purchase 10 new buses every other year, in order to maintain an average age of six years across its fleet of 65 regular-route buses. This target helps the DTA ensure the safety and comfort of its passengers, as well as meet the its cost targets regarding the maintenance of its vehicles. Source: National Bridge Inventory Database (2014) 3-40
Chapter 10 Equity and Environmental Justice
 Chapter 10 Equity and Environmental Justice Introduction An important consideration for the 2040 Transportation Policy Plan is its impact on all populations in the Minneapolis-Saint Paul region, particularly
Mid - City Industrial
 Minneapolis neighborhood profile October 2011 Mid - City Industrial About this area The Mid-City Industrial neighborhood is bordered by I- 35W, Highway 280, East Hennepin Avenue, and Winter Street Northeast.
Rifle city Demographic and Economic Profile
 Rifle city Demographic and Economic Profile Community Quick Facts Population (2014) 9,289 Population Change 2010 to 2014 156 Place Median HH Income (ACS 10-14) $52,539 State Median HH Income (ACS 10-14)
2016 Labor Market Profile
 2016 Labor Market Profile Prepared by The Tyler Economic Development Council Tyler Area Sponsor June 2016 The ability to demonstrate a regions availability of talented workers has become a vital tool
Camden Industrial. Minneapolis neighborhood profile. About this area. Trends in the area. Neighborhood in Minneapolis.
 Minneapolis neighborhood profile October 2011 Camden Industrial About this area The Camden Industrial neighborhood is bordered by 48th Avenue North, the Mississippi River, Dowling Avenue North, Washington
Economic Overview. Lawrence, KS MSA
 Economic Overview Lawrence, KS MSA March 5, 2019 DEMOGRAPHIC PROFILE... 3 EMPLOYMENT TRENDS... 5 UNEMPLOYMENT RATE... 5 WAGE TRENDS... 6 COST OF LIVING INDEX... 7 INDUSTRY SNAPSHOT... 8 OCCUPATION SNAPSHOT...
Shingle Creek. Minneapolis neighborhood profile. About this area. Trends in the area. Neighborhood in Minneapolis. October 2011
 neighborhood profile October 2011 About this area The neighborhood is bordered by 53rd Avenue North, Humboldt Avenue North, 49th Avenue North, and Xerxes Avenue North. It is home to Olson Middle School.
Appendix C-5 Environmental Justice and Title VI Analysis Methodology
 Appendix C-5 Environmental Justice and Title VI Analysis Methodology Environmental Justice Analysis SACOG is required by law to conduct an Environmental Justice (EJ) analysis as part of the MTP/SCS, to
Economic Overview New York
 Report created on October 20, 2015 Economic Overview Created using: Contact: Lisa.Montiel@suny.edu DEMOGRAPHIC PROFILE...3 EMPLOYMENT TRENDS...5 UNEMPLOYMENT RATE...5 WAGE TRENDS...6 COST OF LIVING INDEX...6
University of Minnesota
 neighborhood profile October 2011 About this area The University neighborhood is bordered by 11th Avenue Southeast, University Avenue, 15th Avenue Southeast, the railroad tracks, Oak Street, and the Mississippi
Economic Overview Long Island
 Report created on October 20, 2015 Economic Overview Long Island Created using: Contact: Lisa.Montiel@suny.edu DEMOGRAPHIC PROFILE...3 EMPLOYMENT TRENDS...5 UNEMPLOYMENT RATE...5 WAGE TRENDS...6 COST OF
Economic Overview York County, South Carolina. February 14, 2018
 Economic Overview York County, February 14, 2018 DEMOGRAPHIC PROFILE... 3 EMPLOYMENT TRENDS... 5 UNEMPLOYMENT RATE... 5 WAGE TRENDS... 6 COST OF LIVING INDEX... 6 INDUSTRY SNAPSHOT... 7 OCCUPATION SNAPSHOT...
ECONOMIC OVERVIEW DuPage County, Illinois
 ECONOMIC OVERVIEW DuPage County, Illinois DEMOGRAPHIC PROFILE... 3 EMPLOYMENT TRENDS... 5 UNEMPLOYMENT RATE... 5 WAGE TRENDS... 6 COST OF LIVING INDEX... 7 INDUSTRY SNAPSHOT... 8 OCCUPATION SNAPSHOT...
University Link LRT Extension
 (November 2007) The Central Puget Sound Regional Transit Authority, commonly known as Sound Transit, is proposing to implement an extension of the Central Link light rail transit (LRT) Initial Segment
June 9, Economic Overview Billings, MT MSA
 June 9, 2016 Economic Overview Billings, MT MSA DEMOGRAPHIC PROFILE... 3 EMPLOYMENT TRENDS... 5 UNEMPLOYMENT RATE... 5 WAGE TRENDS... 6 COST OF LIVING INDEX... 6 INDUSTRY SNAPSHOT... 7 OCCUPATION SNAPSHOT...
Northeast Minnesota Economic and Business Conditions Report First Quarter 2014
 Northeast Minnesota Economic and Business Conditions Report First Quarter TABLE OF CONTENTS Executive Summary...1 Northeast Minnesota Leading Economic Indicators Index...2 Northeast Minnesota Business
Clay County Comprehensive Plan
 2011-2021 Clay County Comprehensive Plan Chapter 1: Demographic Overview Clay County Comprehensive Plan Demographic Overview Population Trends This section examines historic and current population trends
Economic Overview Loudoun County, Virginia. October 23, 2017
 Economic Overview October 23, 2017 DEMOGRAPHIC PROFILE... 3 EMPLOYMENT TRENDS... 5 UNEMPLOYMENT RATE... 5 WAGE TRENDS... 6 COST OF LIVING INDEX... 6 INDUSTRY SNAPSHOT... 7 OCCUPATION SNAPSHOT... 9 INDUSTRY
Economic Overview Long Island
 Report created on August 29, 2017 Economic Overview Long Island Contact: Lisa.Montiel@suny.edu DEMOGRAPHIC PROFILE... 3 EMPLOYMENT TRENDS... 5 UNEMPLOYMENT RATE... 5 WAGE TRENDS... 6 COST OF LIVING INDEX...
Minnesota Energy Industry
 Energy Industry Jobs Q3 2000 Q3 2001 Q3 2002 Q3 2003 Q3 2004 Q3 2005 Q3 2006 Q3 2007 Q3 2008 Q3 2009 Q3 2010 Q3 2011 Q3 Q3 Q3 Q3 Q3 2016 Minnesota Energy Consortium April 13, 2017 Cameron Macht DEED Labor
Economic Overview Monterey County, California. July 22, 2016
 Economic Overview Monterey July 22, 2016 DEMOGRAPHIC PROFILE... 3 EMPLOYMENT TRENDS... 5 UNEMPLOYMENT RATE... 5 WAGE TRENDS... 6 COST OF LIVING INDEX... 6 INDUSTRY SNAPSHOT... 7 OCCUPATION SNAPSHOT...
Economic Overview Fairfax / Falls Church. October 23, 2017
 Economic Overview Fairfax / Falls Church October 23, 2017 DEMOGRAPHIC PROFILE... 3 EMPLOYMENT TRENDS... 5 UNEMPLOYMENT RATE... 5 WAGE TRENDS... 6 COST OF LIVING INDEX... 6 INDUSTRY SNAPSHOT... 7 OCCUPATION
TECHNICAL REPORT NO. 11 (5 TH EDITION) THE POPULATION OF SOUTHEASTERN WISCONSIN PRELIMINARY DRAFT SOUTHEASTERN WISCONSIN REGIONAL PLANNING COMMISSION
 THE POPULATION OF SOUTHEASTERN WISCONSIN PRELIMINARY DRAFT SOUTHEASTERN WISCONSIN REGIONAL PLANNING COMMISSION") TECHNICAL REPORT NO. 11 (5 TH EDITION) THE POPULATION OF SOUTHEASTERN WISCONSIN PRELIMINARY DRAFT 208903 SOUTHEASTERN WISCONSIN REGIONAL PLANNING COMMISSION KRY/WJS/lgh 12/17/12 203905 SEWRPC Technical
TECHNICAL REPORT NO. 11 (5 TH EDITION) THE POPULATION OF SOUTHEASTERN WISCONSIN PRELIMINARY DRAFT 208903 SOUTHEASTERN WISCONSIN REGIONAL PLANNING COMMISSION KRY/WJS/lgh 12/17/12 203905 SEWRPC Technical
THE ECONOMY AND POPULATION OF THE SOUTHEASTERN WISCONSIN REGION
 THE ECONOMY AND POPULATION OF THE SOUTHEASTERN WISCONSIN REGION NEWSLETTER JANUARY214 The reports were developed under the guidance of the SEWRPC Advisory Committee on Regional Population and Economic
DEMOGRAPHIC PROFILE...3 EMPLOYMENT TRENDS...5 UNEMPLOYMENT RATE...5 WAGE TRENDS...6 COST OF LIVING INDEX...6 INDUSTRY SNAPSHOT...7
 March 14, 2017 DEMOGRAPHIC PROFILE...3 EMPLOYMENT TRENDS...5 UNEMPLOYMENT RATE...5 WAGE TRENDS...6 COST OF LIVING INDEX...6 INDUSTRY SNAPSHOT...7 OCCUPATION SNAPSHOT...9 INDUSTRY CLUSTERS... 12 EDUCATION
Economic Overview Capital District
 August 29, 2017 Economic Overview Capital District Contact: Lisa.Montiel@suny.edu DEMOGRAPHIC PROFILE... 3 EMPLOYMENT TRENDS... 5 UNEMPLOYMENT RATE... 5 WAGE TRENDS... 6 COST OF LIVING INDEX... 6 INDUSTRY
Economic Overview Western New York
 Report created on August 29, 2017 Economic Overview Western New Contact: Lisa.Montiel@suny.edu DEMOGRAPHIC PROFILE... 3 EMPLOYMENT TRENDS... 5 UNEMPLOYMENT RATE... 5 WAGE TRENDS... 6 COST OF LIVING INDEX...
October 28, Economic Overview Yellowstone County, Montana
 October 28, 2016 Economic Overview Yellowstone DEMOGRAPHIC PROFILE...3 EMPLOYMENT TRENDS...5 UNEMPLOYMENT RATE...5 WAGE TRENDS...6 COST OF LIVING INDEX...6 INDUSTRY SNAPSHOT...7 OCCUPATION SNAPSHOT...9
Economic Overview City of Tyler, TX. January 8, 2018
 Economic Overview City of Tyler, TX January 8, 2018 DEMOGRAPHIC PROFILE...3 EMPLOYMENT TRENDS...5 WAGE TRENDS...5 COST OF LIVING INDEX...6 INDUSTRY SNAPSHOT...7 OCCUPATION SNAPSHOT...9 INDUSTRY CLUSTERS...
Economic Overview Prince William/Manassas. October 23, 2017
 Economic Overview Prince William/Manassas October 23, 2017 DEMOGRAPHIC PROFILE... 3 EMPLOYMENT TRENDS... 5 UNEMPLOYMENT RATE... 5 WAGE TRENDS... 6 COST OF LIVING INDEX... 6 INDUSTRY SNAPSHOT... 7 OCCUPATION
Urban Action Agenda Community Profiles COVER TO GO HERE. City of Beacon
 Urban Action Agenda Community Profiles COVER TO GO HERE City of Beacon COMMUNITY OVERVIEW MAP POPULATION & DEMOGRAPHICS Population Basics 2,212 Population (2015) Population Change 2. since 2000 0.5 Square
ONBOARD ORIGIN-DESTINATION STUDY
 REPORT ONBOARD ORIGIN-DESTINATION STUDY 12.23.2014 PREPARED FOR: ANCHORAGE METROPOLITAN AREA TRANSPORTATION SYSTEM (AMATS) 55 Railroad Row White River Junction, VT 05001 802.295.4999 www.rsginc.com SUBMITTED
Draft Environmental Impact Statement. Appendix G Economic Analysis Report
 Draft Environmental Impact Statement Appendix G Economic Analysis Report Appendix G Economic Analysis Report Economic Analyses in Support of Environmental Impact Statement Carolina Crossroads I-20/26/126
Monte Vista Population, ,744 4,651 4,564 4,467 4,458 4,432 4,451
 1 Monte Vista 4,8 4,7 4,6 4,5 4,4 4,3 4,2 4,1 4,61 4,612 4,61 4,676 Monte Vista, 2-213 4,744 4,651 4,564 4,467 4,458 4,432 4,451 4,418 4,412 4,355 2 21 22 23 24 25 26 27 28 29 21 211 212 213 Year Monte
Economic Overview 45-Minute Commute From Airport Park. June 6, 2017
 Economic Overview 45-Minute Commute From Airport Park June 6, 2017 DEMOGRAPHIC PROFILE... 3 EMPLOYMENT TRENDS... 5 WAGE TRENDS... 5 COST OF LIVING INDEX... 6 INDUSTRY SNAPSHOT... 7 OCCUPATION SNAPSHOT...
Economic Overview Marlboro County Labor Shed. June 29, 2016
 Economic Overview Marlboro County Labor June 29, 2016 DEMOGRAPHIC PROFILE...3 EMPLOYMENT TRENDS...5 UNEMPLOYMENT RATE...5 WAGE TRENDS...6 COST OF LIVING INDEX...6 INDUSTRY SNAPSHOT...7 OCCUPATION SNAPSHOT...9
E APPENDIX METHODOLOGY FOR LAND USE PROJECTIONS IN THE BOSTON REGION INTRODUCTION
 E APPENDIX METHODOLOGY FOR LAND USE PROJECTIONS IN THE BOSTON REGION INTRODUCTION The Metropolitan Area Planning Council (MAPC), the region s land use planning agency, is responsible for preparing detailed
Northeast Minnesota Economic and Business Conditions Report Third Quarter 2017
 Northeast Minnesota Economic and Business Conditions Report Third Quarter This issue is part of a series for the six planning areas of Minnesota Central, Northeast, Northwest, Southeast, Southwest, and
REGION 7W DESCRIPTION. Demographics
 REGION 7W DESCRIPTION Demographics is one of the fastest growing areas in the state. The region s close proximity to the Twin Cities Metropolitan Area (TCMA) has spurred growth in. Continued growth will
PUBLIC DISCLOSURE COMMUNITY REINVESTMENT ACT PERFORMANCE EVALUATION
 PUBLIC DISCLOSURE November 19, 2001 Date of Evaluation COMMUNITY REINVESTMENT ACT PERFORMANCE EVALUATION North Shore Bank of Commerce Name of Depository Institution 126553 Institution s Identification
Economic Overview Mohawk Valley
 Report created on August 29, 2017 Economic Overview Mohawk Valley Contact: Lisa.Montiel@suny.edu DEMOGRAPHIC PROFILE... 3 EMPLOYMENT TRENDS... 5 UNEMPLOYMENT RATE... 5 WAGE TRENDS... 6 COST OF LIVING INDEX...
Metropolitan Area Economic and Business Conditions Report First Quarter 2014
 Metropolitan Area Economic and Business Conditions Report First Quarter TABLE OF CONTENTS Executive Summary...1 Twin Cities Leading Economic Indicators Index...2 Twin Cities Business Filings...4 Twin Cities
Community and Economic Development
 192 193 194 195 196 197 198 199 2 21 22 23 24 2-1 Lycoming County Comprehensive Plan Update 218 Community and Economic Development At a Glance Over the last ten years, has experienced a decline in population,
A Profile of Workplaces in Waterloo Region
 A Profile of Workplaces in Waterloo Region March 2010 Overview This report is a reference document for the Region of Waterloo Public Health s workplace health initiative, Project Health (http://www.projecthealth.ca),
CHAPTER 3: GROWTH OF THE REGION
 CHAPTER OVERVIEW Introduction Introduction... 1 Population, household, and employment growth are invariably Residential... 2 expected continue grow in both the incorporated cities Non-Residential (Employment)
Chapter 2: Existing Transportation System. Chapter 3. Socio Economic Profile. Old Town Fort Collins. Image 75 Credit: City of Fort Collins
 Chapter 2: Existing Transportation System Chapter 3 Socio Economic Profile Old Town Fort Collins. Image 75 Credit: City of Fort Collins Chapter 3: Socio-Economic Profile I. Socio-Economic Data In 2013,
Urban Action Agenda Community Profiles COVER TO GO HERE. City of Beacon
 Urban Action Agenda Community Profiles COVER TO GO HERE City of Beacon COMMUNITY OVERVIEW MAP POPULATION & DEMOGRAPHICS Population Basics 27,828 Population (2015) Population Change 9.6% since 2000 5.1
Lake Tahoe Basin Census Trends Report
 Lake Tahoe Basin Census Trends Report 1990-2000-2010 Prepared August 2013 Contents Page Executive Summary 1 Findings 1 Definitions 3 Section 1. Demographics 4 Population 4 Age 6 Race 6 Housing 10 Tenancy
Economic Overview Plant City Region. April 5, 2017
 Economic Overview Plant City Region April 5, 2017 DEMOGRAPHIC PROFILE... 3 EMPLOYMENT TRENDS... 5 WAGE TRENDS... 5 COST OF LIVING INDEX... 6 INDUSTRY SNAPSHOT... 7 OCCUPATION SNAPSHOT... 9 INDUSTRY CLUSTERS...
Regional Economic Impact of Cass County, ND and Clay County, MN
 51 Broadway Suite 500 Fargo, ND 58102 701.364.1900 Fax 701.293.7819 Regional Economic Impact of Cass County, ND and Clay County, MN GFMEDC Mission The mission of the Greater Fargo Moorhead Economic Development
Northeast Minnesota Economic and Business Conditions Report Third Quarter 2015
 Northeast Minnesota Economic and Business Conditions Report Third Quarter TABLE OF CONTENTS Executive Summary...1 Northeast Minnesota Leading Economic Indicators Index...2 Northeast Minnesota Business
SELECTED ECONOMIC CHARACTERISTICS American Community Survey 5-Year Estimates
 DP03 SELECTED ECONOMIC CHARACTERISTICS 2008-2012 American Community Survey 5-Year Estimates Supporting documentation on code lists, subject definitions, data accuracy, and statistical testing can be found
WHO S LEFT TO HIRE? WORKFORCE AND UNEMPLOYMENT ANALYSIS PREPARED BY BENJAMIN FRIEDMAN JANUARY 23, 2019
 JANUARY 23, 2019 WHO S LEFT TO HIRE? WORKFORCE AND UNEMPLOYMENT ANALYSIS PREPARED BY BENJAMIN FRIEDMAN 13805 58TH STREET NORTH CLEARNWATER, FL, 33760 727-464-7332 Executive Summary: Pinellas County s unemployment
10-Year Capital Highway Investment Plan DRAFT
 This document is made available electronically by the Minnesota Legislative Reference Library as part of an ongoing digital archiving project. http://www.leg.state.mn.us/lrl/lrl.asp 10-Year Capital Highway
2. Demographics. Population and Households
 2. Demographics This analysis describes the existing demographics in. It will be used to identify the major demographic trends that may have an effect on public policy in in the next decade. Demographic
TEX Rail Fort Worth, Texas Project Development (Rating Assigned November 2012)
") TEX Rail Fort Worth, Texas Project Development (Rating Assigned November 2012) Summary Description Proposed Project: Commuter Rail 37.6 Miles, 14 Stations (12 new, two existing) Total Capital Cost ($YOE):
TEX Rail Fort Worth, Texas Project Development (Rating Assigned November 2012) Summary Description Proposed Project: Commuter Rail 37.6 Miles, 14 Stations (12 new, two existing) Total Capital Cost ($YOE):
Northeast Minnesota Economic and Business Conditions Report - Third Quarter 2014
 St. Cloud State University therepository at St. Cloud State Northeast Minnesota Economic and Business Conditions Report Minnesota Regional Economic and Business Conditions Report 1-2015 Northeast Minnesota
American Community Survey 5-Year Estimates
 DP03 SELECTED ECONOMIC CHARACTERISTICS 2013-2017 American Community Survey 5-Year Estimates Supporting documentation on code lists, subject definitions, data accuracy, and statistical testing can be found
Utah. Demographic and Economic Profile. Metro and Nonmetro Counties in Utah
 Demographic and Economic Profile Utah Updated July 2006 Metro and Nonmetro Counties in Utah Based on the most recent listing of core based statistical areas by the Office of Management and Budget (December
Tell us what you think. Provide feedback to help make American Community Survey data more useful for you.
 DP03 SELECTED ECONOMIC CHARACTERISTICS 2016 American Community Survey 1-Year Estimates Supporting documentation on code lists, subject definitions, data accuracy, and statistical testing can be found on
American Community Survey 5-Year Estimates
 DP03 SELECTED ECONOMIC CHARACTERISTICS 2012-2016 American Community Survey 5-Year Estimates Supporting documentation on code lists, subject definitions, data accuracy, and statistical testing can be found
American Community Survey 5-Year Estimates
 DP03 SELECTED ECONOMIC CHARACTERISTICS 2012-2016 American Community Survey 5-Year Estimates Supporting documentation on code lists, subject definitions, data accuracy, and statistical testing can be found
American Community Survey 5-Year Estimates
 DP03 SELECTED ECONOMIC CHARACTERISTICS 2012-2016 American Community Survey 5-Year Estimates Supporting documentation on code lists, subject definitions, data accuracy, and statistical testing can be found
American Community Survey 5-Year Estimates
 DP03 SELECTED ECONOMIC CHARACTERISTICS 2012-2016 American Community Survey 5-Year Estimates Supporting documentation on code lists, subject definitions, data accuracy, and statistical testing can be found
American Community Survey 5-Year Estimates
 DP03 SELECTED ECONOMIC CHARACTERISTICS 2012-2016 American Community Survey 5-Year Estimates Supporting documentation on code lists, subject definitions, data accuracy, and statistical testing can be found
American Community Survey 5-Year Estimates
 DP03 SELECTED ECONOMIC CHARACTERISTICS 2012-2016 American Community Survey 5-Year Estimates Supporting documentation on code lists, subject definitions, data accuracy, and statistical testing can be found
American Community Survey 5-Year Estimates
 DP03 SELECTED ECONOMIC CHARACTERISTICS 2012-2016 American Community Survey 5-Year Estimates Supporting documentation on code lists, subject definitions, data accuracy, and statistical testing can be found
American Community Survey 5-Year Estimates
 DP03 SELECTED ECONOMIC CHARACTERISTICS 2012-2016 American Community Survey 5-Year Estimates Supporting documentation on code lists, subject definitions, data accuracy, and statistical testing can be found
American Community Survey 5-Year Estimates
 DP03 SELECTED ECONOMIC CHARACTERISTICS 2012-2016 American Community Survey 5-Year Estimates Supporting documentation on code lists, subject definitions, data accuracy, and statistical testing can be found
American Community Survey 5-Year Estimates
 DP03 SELECTED ECONOMIC CHARACTERISTICS 2012-2016 American Community Survey 5-Year Estimates Supporting documentation on code lists, subject definitions, data accuracy, and statistical testing can be found
American Community Survey 5-Year Estimates
 DP03 SELECTED ECONOMIC CHARACTERISTICS 2012-2016 American Community Survey 5-Year Estimates Supporting documentation on code lists, subject definitions, data accuracy, and statistical testing can be found
American Community Survey 5-Year Estimates
 DP03 SELECTED ECONOMIC CHARACTERISTICS 2012-2016 American Community Survey 5-Year Estimates Supporting documentation on code lists, subject definitions, data accuracy, and statistical testing can be found
American Community Survey 5-Year Estimates
 DP03 SELECTED ECONOMIC CHARACTERISTICS 2012-2016 American Community Survey 5-Year Estimates Supporting documentation on code lists, subject definitions, data accuracy, and statistical testing can be found
American Community Survey 5-Year Estimates
 DP03 SELECTED ECONOMIC CHARACTERISTICS 2012-2016 American Community Survey 5-Year Estimates Supporting documentation on code lists, subject definitions, data accuracy, and statistical testing can be found
American Community Survey 5-Year Estimates
 DP03 SELECTED ECONOMIC CHARACTERISTICS 2012-2016 American Community Survey 5-Year Estimates Supporting documentation on code lists, subject definitions, data accuracy, and statistical testing can be found
American Community Survey 5-Year Estimates
 DP03 SELECTED ECONOMIC CHARACTERISTICS 2012-2016 American Community Survey 5-Year Estimates Supporting documentation on code lists, subject definitions, data accuracy, and statistical testing can be found
American Community Survey 5-Year Estimates
 DP03 SELECTED ECONOMIC CHARACTERISTICS 2012-2016 American Community Survey 5-Year Estimates Supporting documentation on code lists, subject definitions, data accuracy, and statistical testing can be found
American Community Survey 5-Year Estimates
 DP03 SELECTED ECONOMIC CHARACTERISTICS 2012-2016 American Community Survey 5-Year Estimates Supporting documentation on code lists, subject definitions, data accuracy, and statistical testing can be found
American Community Survey 5-Year Estimates
 DP03 SELECTED ECONOMIC CHARACTERISTICS 2012-2016 American Community Survey 5-Year Estimates Supporting documentation on code lists, subject definitions, data accuracy, and statistical testing can be found
American Community Survey 5-Year Estimates
 DP03 SELECTED ECONOMIC CHARACTERISTICS 2012-2016 American Community Survey 5-Year Estimates Supporting documentation on code lists, subject definitions, data accuracy, and statistical testing can be found
American Community Survey 5-Year Estimates
 DP03 SELECTED ECONOMIC CHARACTERISTICS 2012-2016 American Community Survey 5-Year Estimates Supporting documentation on code lists, subject definitions, data accuracy, and statistical testing can be found
American Community Survey 5-Year Estimates
 DP03 SELECTED ECONOMIC CHARACTERISTICS 2012-2016 American Community Survey 5-Year Estimates Supporting documentation on code lists, subject definitions, data accuracy, and statistical testing can be found
American Community Survey 5-Year Estimates
 DP03 SELECTED ECONOMIC CHARACTERISTICS 2012-2016 American Community Survey 5-Year Estimates Supporting documentation on code lists, subject definitions, data accuracy, and statistical testing can be found
American Community Survey 5-Year Estimates
 DP03 SELECTED ECONOMIC CHARACTERISTICS 2012-2016 American Community Survey 5-Year Estimates Supporting documentation on code lists, subject definitions, data accuracy, and statistical testing can be found
American Community Survey 5-Year Estimates
 DP03 SELECTED ECONOMIC CHARACTERISTICS 2012-2016 American Community Survey 5-Year Estimates Supporting documentation on code lists, subject definitions, data accuracy, and statistical testing can be found
American Community Survey 5-Year Estimates
 DP03 SELECTED ECONOMIC CHARACTERISTICS 2012-2016 American Community Survey 5-Year Estimates Supporting documentation on code lists, subject definitions, data accuracy, and statistical testing can be found
Transportation Improvement Program and Incentives for Local Planning
 Capital District November 9, 2004 Transportation Committee Transportation Improvement Program and Incentives for Local Planning CDTC has been successful in funding 36 Linkage Program planning studies since
Economic Overview Charlotte-Concord-Gastonia, NC-SC MSA. October 27, 2017
 Economic Overview Charlotte-Concord-Gastonia, NC-SC MSA October 27, 2017 DEMOGRAPHIC PROFILE...3 EMPLOYMENT TRENDS...5 UNEMPLOYMENT RATE...5 WAGE TRENDS...6 COST OF LIVING INDEX...6 INDUSTRY SNAPSHOT...7
Washington Metropolitan Area Transit Authority Metro Budget Overview
 Washington Metropolitan Area Transit Authority Metro Budget Overview February 2011 Metro 10,877 Employees (10,974 budgeted) 1,491 Buses 588 Escalators and 237 Elevators 106 Miles of Track 92 Traction Power
Economic Profile. Capital Crossroads. a vision forward
 Economic Profile Capital a vision forward This profile was prepared by: Liesl Eathington Department of Economics State University phone: (515) 294 2954 email: leathing@iastate.edu 5/23/2012 Distribution
Twin Cities Area Economic and Business Conditions Report Second Quarter 2018
 Twin Cities Area Economic and Business Conditions Report Second Quarter This issue is part of a series for the six planning areas of Minnesota: Central, Northeast, Northwest, Southeast, Southwest, and
Wake County. People love to be connected. In our cyberspace. transit plan CONNECTING PEOPLE, CONNECTING THE COUNTY
 Wake County transit plan CONNECTING PEOPLE, CONNECTING THE COUNTY EXECUTIVE SUMMARY People love to be connected. In our cyberspace driven world, people can stay connected pretty much all of the time. Connecting
ALL Counties. ALL Districts
 TEXAS TRANSPORTATION COMMISSION ALL Counties rhnute ORDER Page of ALL Districts The Texas Transportation Commission (commission) finds it necessary to propose amendments to. and., relating to Transportation
City of Utica Central Industrial Corridor ReVITALization Plan Appendix A. Socio-Economic Profile
 City of Utica Central Industrial Corridor ReVITALization Plan Appendix A. Socio-Economic Profile Population Graphic 1 City of Utica Population Change: 1960-2010 Since the 1960s, the population of Utica
Environmental Justice Analysis. Appendix 3 to SFY MORPC TIP
 Environmental Justice Analysis Appendix 3 to SFY 2018-2021 MORPC TIP April 28, 2017 Table of Contents I. INTRODUCTION TO ENVIRONMENTAL JUSTICE... 2 A. Definition of Environmental Justice... 2 B. Regulatory
4.12 POPULATION AND HOUSING
 4.12 POPULATION AND HOUSING 4.12.1 INTRODUCTION This section describes the existing socioeconomic conditions, including population, housing, and employment, within the Specific Plan Area and provides an
Northeast Minnesota Economic and Business Conditions Report - First Quarter 2016
 St. Cloud State University therepository at St. Cloud State Northeast Minnesota Economic and Business Conditions Report Minnesota Regional Economic and Business Conditions Report 6- Northeast Minnesota
RIDOA STATEWIDE PLANNING PROGRAM Transportation Planning
 RIDOA STATEWIDE PLANNING PROGRAM Transportation Planning Land & Water Conservation Summit March 10, 2012 Statewide Planning Framework Department of Administration Statewide Planning Program State Planning
Northeast Minnesota Economic and Business Conditions Report First Quarter 2015
 Northeast Minnesota Economic and Business Conditions Report First Quarter TABLE OF CONTENTS Executive Summary...1 Northeast Minnesota Leading Economic Indicators Index...2 Northeast Minnesota Business
Twin Cities Area Economic and Business Conditions Report First Quarter 2018
 Twin Cities Area Economic and Business Conditions Report First Quarter This issue is part of a series for the six planning areas of Minnesota: Central, Northeast, Northwest, Southeast, Southwest, and Twin