Appendix I: Data Sources and Analyses. Appendix II: Pharmacy Benefit Management Tools
|
|
|
- Alexander Berry
- 5 years ago
- Views:
Transcription
1
2 Appendix I: Data Sources and Analyses This brief includes findings from analyses of the Centers for Medicare & Medicaid Services (CMS) State Drug Utilization Data 1 and CMS 64 reports for federal fiscal years 2011 to ,3 The State Drug Utilization Data contains nearly 100% of Medicaid prescriptions and the CMS 64 reports contain all state Medicaid agency program benefit costs and administrative expenses reported to CMS. The analyses of these data sources were conducted by The Menges Group, a leading national firm on Medicaid drug spending, based on research questions developed in collaboration with UnitedHealth Group. The Menges Group ensured that the brief and appendix present the analytical findings accurately. The State Drug Utilization Data includes prescription drug counts by National Drug Code (NDC) along with each NDC s corresponding pre-rebate payment amount for each state. This NDC-level dataset breaks-out volume and expenditures for Medicaid fee-for-service (FFS) and health-plan administered drug programs. In addition, The Menges Group identified the brand or generic categorization of each NDC. The State Drug Utilization Data for federal fiscal years 2011 to 2016 used in this brief come from the May 2017 CMS release and include covered outpatient drugs that are paid for by state Medicaid agencies. The CMS 64 reports include aggregate statutory rebates and supplemental rebates negotiated by each state. The focus of the analyses was net (post-rebate) prescription drug cost and net (post-rebate) savings. Nationally, roughly half of the initial amounts paid to pharmacies for Medicaid prescriptions are refunded to the federal and state governments through Medicaid s rebate program by individual drug manufacturers. Statutory rebates for a given drug are determined through a formula mandated by the Affordable Care Act (ACA). 4 States and Medicaid health plans negotiate additional ( supplemental ) rebates with drug manufacturers. The analyses used aggregate statutory rebates and supplemental rebates drawn from the CMS 64 reports. Appendix II: Pharmacy Benefit Management Tools Pharmacy Benefit Management Tools Utilized in Medicaid Drug Programs Pharmacy Benefit Managers (PBMs) perform many operational and clinical services for Medicaid drug programs. These services leverage PBMs expertise, data analytics capabilities, and negotiating capacities to drive cost savings, while simultaneously improving care quality, safety, and appropriate drug use all of which make PBMs essential to lowering Medicaid drug spending through effective medical and drug management. This Appendix describes the pharmacy benefit management tools used in the model to estimate the Medicaid pharmacy savings generated from 2011 to 2016 and to project the additional savings that could be realized from 2019 to 2028 if all Medicaid programs fully utilize these pharmacy benefit management tools. Preferred Drug List (PDL)/ Drug Mix Management: Typically Medicare and commercial drug benefit plans include a formulary that incentivizes beneficiaries, through variable cost-sharing, to select the lower-cost, clinically effective drug for a condition. In Medicaid, there is limited cost-sharing for drugs and the formulary is replaced with a list of preferred drugs that are covered by Medicaid without restrictions. In addition to establishing the list of covered drugs through the PDL, PBMs sometimes use the PDL to drive use of the highest therapeutic quality, lowest-cost brands and generics and shift utilization from brands to generics to achieve a lower net cost per prescription. 1 The State Drug Utilization Data includes all prescriptions used to calculate the Medicaid drug rebates owed by each manufacturer under the provisions of the ACA. The prescriptions in the dataset do not include those filled for persons dually eligible for Medicare and Medicaid, for which Medicare Part D has primary financial responsibility. 2 Federal fiscal year 2011 is the first full federal fiscal year in which the ACA required Medicaid health plan-paid prescriptions to be eligible for Medicaid rebates. Federal fiscal year 2016 is the most recent full federal fiscal year for which data is available. 3 National average drug price increase data derived from analysis of U.S. Bureau of Labor Statistics data. Consumer Price Index of Prescription Drugs in U.S. City Average, All Urban Consumers, Seasonally Adjusted, 12-Month Percent Change. Accessed October 31, The ACA sets the minimum Medicaid rebate for brand drugs at the greater of either 23.1% of the Average Manufacturer Price (AMP) per unit or the difference between AMP and the best price per unit (which often exceeds 23.1%) and adjusted by the Consumer Price Index-Urban (CPI-U) based on launch date and current quarter AMP. The Medicaid rebate for generic drugs is set at 13% of the AMP per unit. 2
3
4 Utilization Management: PBMs employ various evidence-based clinical programs and practices to promote appropriate utilization of drugs. These practices include, but are not limited to, step therapy, prior authorization, medication therapy management, and drug utilization reviews. These programs and practices not only ensure that members are taking prescription drugs that are safe and effective, and that their medications are supporting their disease management goals, but also reduce unnecessary and wasteful drug spending. Preferred Pharmacy Networks: PBMs establish a network of preferred pharmacies for members covered by their drug benefit. In exchange for a greater volume of plan members channeled to these network pharmacies, PBMs secure drug discounts and lower drug dispensing fees and/or point-of-sale price concessions for plan sponsors and members. Appendix III: Methodology for Retrospective and Future Medicaid Pharmacy Savings Estimates While all of the pharmacy benefit management cost-saving tools described above are available to Medicaid programs, not all states use the breadth of PBM tools to manage their Medicaid prescription drug benefit. Also, various states pay for their Medicaid prescriptions through FFS and Medicaid health plans in different proportions, creating additional opportunity for future savings through better management of the Medicaid drug benefit and spending as described in the Future Savings Estimates Methodology section of this Appendix. Retrospective Savings Methodology: PBM-Driven Medicaid Pharmacy Savings, Nationwide, PBMs saved Medicaid $6 billion in 2016 and $18.6 billion cumulatively for federal fiscal years 2011 to These savings to date represent only a portion of the potential savings achievable if all states were to fully utilize pharmacy benefit management tools and capabilities. The savings realized from 2011 to 2016 were achieved through pharmacy benefit management tools and strategies including, but not limited to, managing the mix of drugs through PDLs; driving evidence-based, clinically appropriate utilization; developing preferred pharmacy networks; and detecting and preventing fraud, waste, and abuse. For each year from 2011 to 2016, the percentage difference in net cost per prescription between PBM-administered, Medicaid health plan-paid drugs and Medicaid FFS-paid drugs was calculated. This savings factor was applied to Medicaid health plan-paid prescriptions to determine PBM-driven drug cost savings. Additionally, two savings factors were applied to account for reductions in Medicaid prescription volume, resulting from PBM efforts to drive appropriate utilization and reduce fraud, waste, and abuse. 7 PBM costs incurred for realizing these savings on Medicaid health plan-paid prescriptions were estimated and offset. 8 State-specific savings estimates are shown in Appendix IV, Exhibit 3. Future Savings Estimates Methodology: Medicaid Pharmacy Savings from Optimal Use of PBM Tools, Considerable opportunities exist to achieve new savings through optimal pharmacy benefit management of Medicaid drug spending. Further, substantial additional savings are achievable in states that do not allow PBMs to fully manage the Medicaid drug benefit. During 2016, while almost 69% of Medicaid prescriptions were paid for by Medicaid health plans, 41% of those prescriptions were filled in states where PBMs do not have strong latitude over developing and implementing the PDL. In addition, cost savings opportunities exist in any state where the generic utilization rate falls below 92.5%. 7 Visante. February Pharmacy Benefit Managers (PBMs): Generating Savings for Plan Sponsors and Consumers. 8 Sood, N. et al. June The Flow of Money Through the Pharmaceutical Distribution System. 4
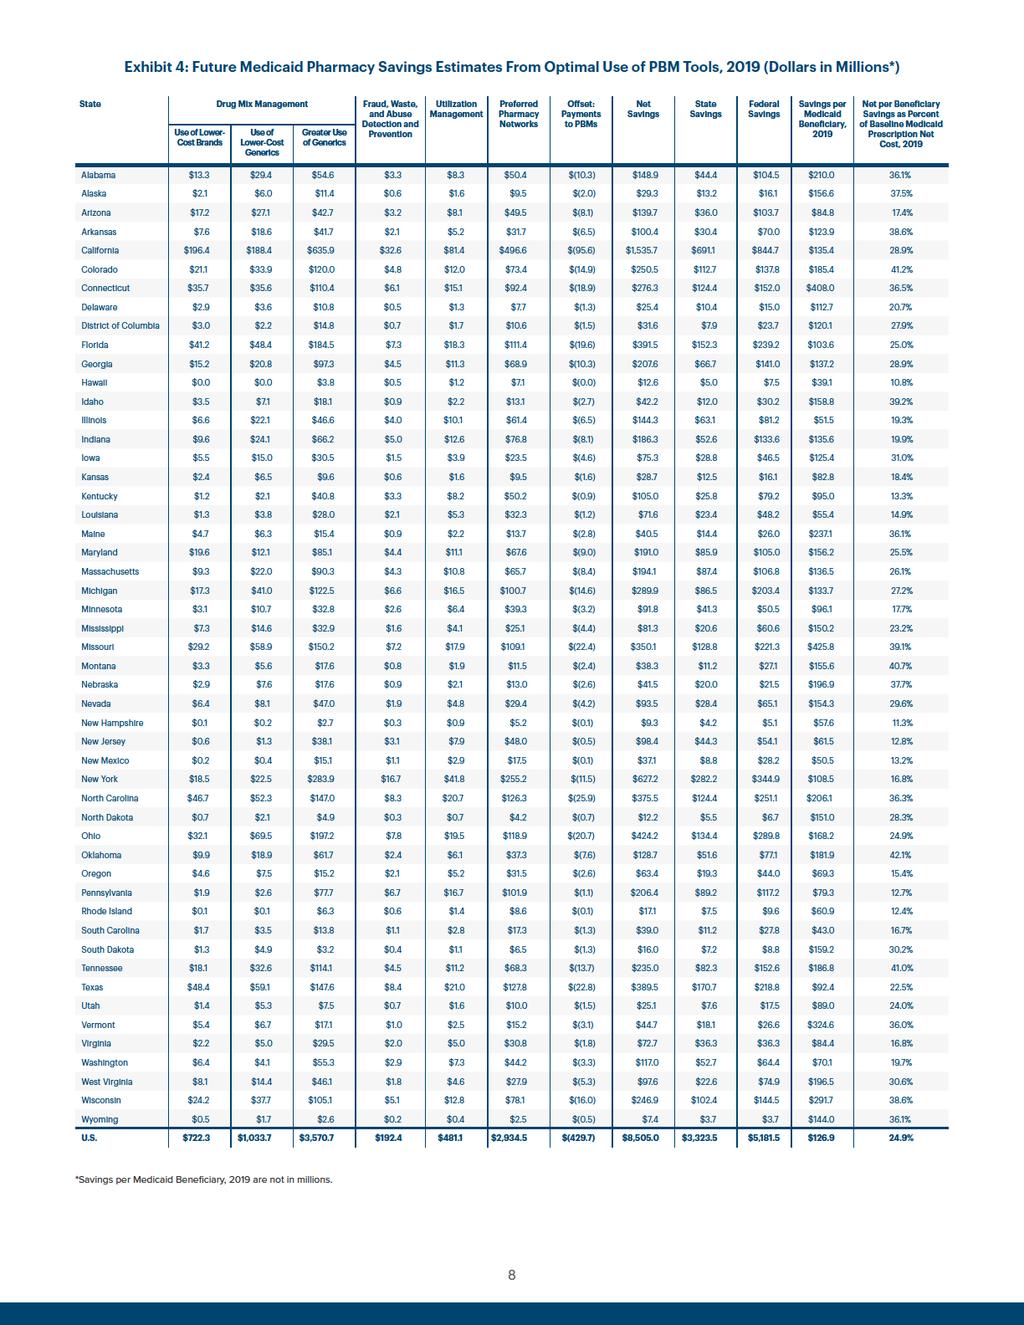
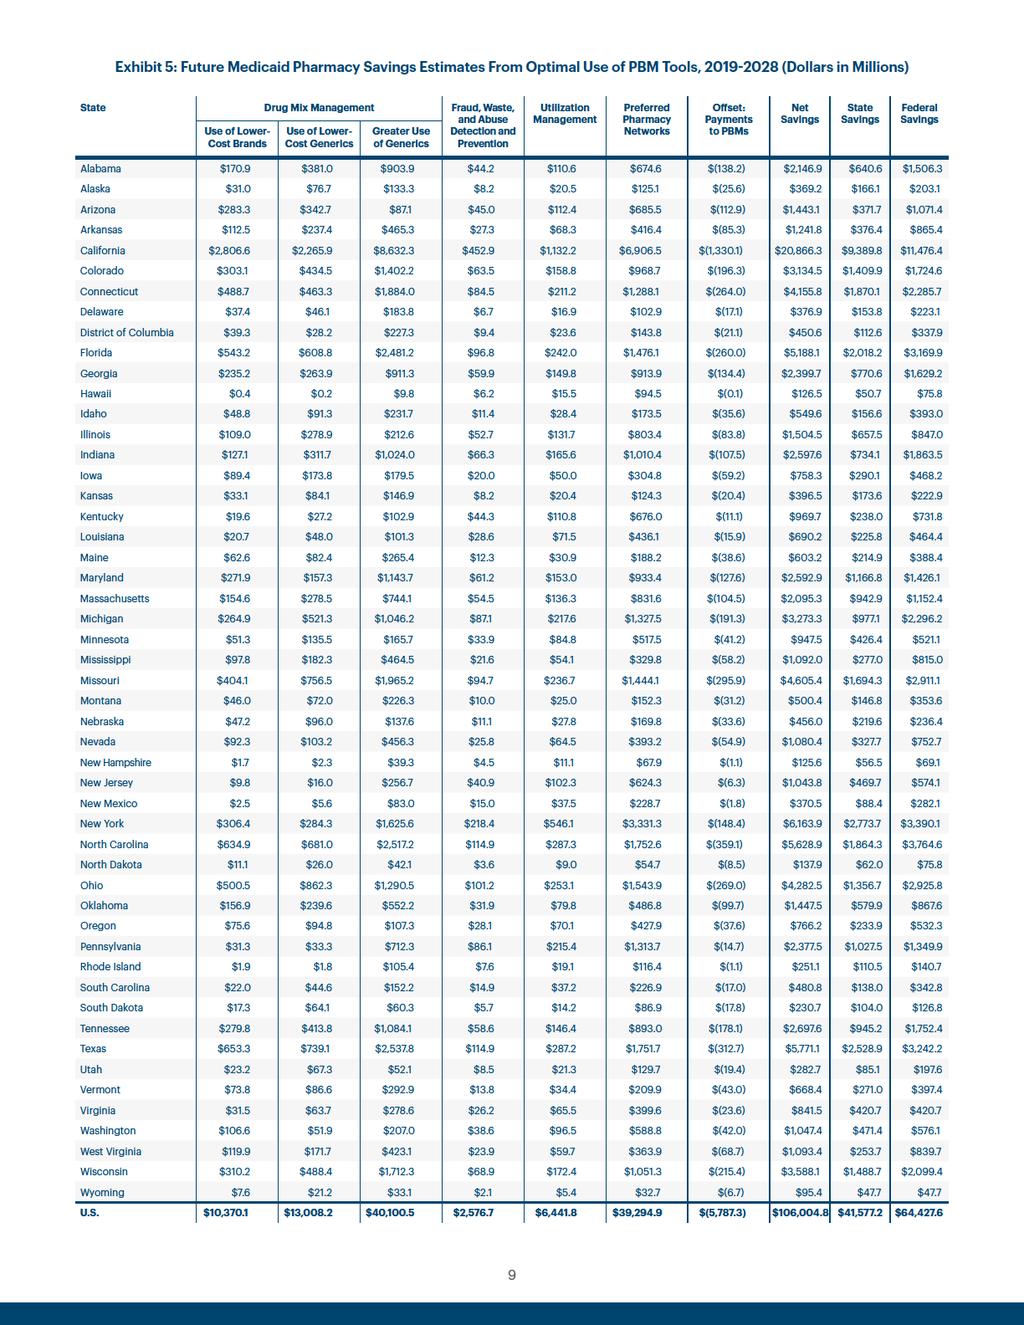
5 The optimal use of all pharmacy benefit management tools for all Medicaid prescriptions would yield additional (new) savings of $8.5 billion in 2019 and $106 billion from 2019 to The $8.5 billion projected savings represents a 24.9% savings in Medicaid drug spending and an average of $127 saved per Medicaid beneficiary in The $106 billion amounts to a 23.2% savings in Medicaid drug spending over 10 years. States would accrue $3.3 billion of the savings in 2019 and $41.6 billion over 10 years, while the federal government would accrue $5.2 billion of the savings in 2019 and $64.4 billion over 10 years. Achieving these savings would require all states to fully utilize PBM tools for all Medicaid prescriptions, effective October 1, 2018 (FFY 2019). Notably, the savings realized to date are not included in these 10-year estimates. All future savings estimates are in addition to what PBMs have already saved and will continue to save Medicaid programs through states existing use of PBM services. Savings from fully utilizing each PBM tool from 2019 to 2028 are outlined below and shown in Exhibit 2. The state-specific savings estimates, including average savings on a per Medicaid beneficiary basis, from fully utilizing each PBM tool in 2019 are shown in Appendix IV, Exhibit 4 and the state-specific savings for 2019 to 2028 are shown in Appendix IV, Exhibit 5. Aggregate Future Medicaid Pharmacy Savings Estimates from Full Use of Each PBM Tool Preferred Drug List/Drug Mix Management: The projections include three components of savings related to drug mix management, enabled by PBM latitude over the PDL: 1) utilizing the lowest-cost brand; 2) utilizing the lowest-cost generic; and 3) shifting utilization from brands to generics. Driving Use of Lowest-Cost Brands By driving use of the lowest-cost brands available, PBM-administered, Medicaid health plan-paid prescriptions achieve a lower average cost within brands when compared to FFS Medicaid programs. Greater use of lower-cost brands will save Medicaid $722.3 million in 2019 and $10.4 billion from 2019 to 2028, representing 9.8% of net prospective savings over 10 years. Driving Use of Lowest-Cost Generics By driving use of the lowest-cost generics available, PBM-administered, Medicaid health plan-paid prescriptions achieve a lower average cost within generics when compared to FFS Medicaid programs. Greater use of lower-cost generics will save Medicaid $1 billion in 2019 and $13 billion from 2019 to 2028, representing 12.3% of net prospective savings over 10 years. Shifting Utilization from Brands to Generics PBMs drive greater generic utilization 88.1% of PBM-administered, Medicaid health plan-paid prescriptions during 2016 were for generics, versus 83.1% of FFS-paid prescriptions. The shift in utilization from brands to generics will save Medicaid $3.6 billion in 2019 and $40.1 billion from 2019 to 2028, representing 37.8% of net prospective savings over 10 years. Detecting and Preventing Fraud, Waste, and Abuse (FWA): PBMs employ data analytics capabilities and staff to detect, prevent, and address FWA activity. Detecting, preventing, and addressing FWA will save Medicaid $192.4 million in 2019 and $2.6 billion from 2019 to 2028, representing 2.4% of net prospective savings over 10 years. 5
6 Employing Utilization Management Practices: PBMs employ evidence-based, clinical programs that promote appropriate and safe use of drugs through a variety of utilization management practices. Utilization management will save Medicaid $481.1 million in 2019 and $6.4 billion from 2019 to 2028, representing 6.1% of net prospective savings over 10 years. Establishing Preferred Pharmacy Networks: PBMs negotiate down drug prices paid to pharmacies by establishing preferred pharmacy networks. Preferred pharmacy networks will save Medicaid $2.9 billion in 2019 and $39.3 billion from 2019 to 2028, representing 37.1% of net prospective savings over 10 years. 9,10 Offsetting Payments to PBMs: Achieving these savings will require states to fully leverage PBM tools and capabilities. PBM services will cost Medicaid $429.7 million in 2019 and $5.8 billion from 2019 to Together, these estimates sum to the $106 billion in savings over ten years ( ). Exhibit 2: Future Medicaid Pharmacy Savings Estimates From Optimal Use of PBM Tools, (Dollars in Millions) $39,295 ($5,787) Net Savings $106,005 $40,100 $2,577 $6,442 State Share: $41,577 $13,008 Federal Share: $64,428 $10,370 Drug Mix Management: Use of Lower-Cost Brands Drug Mix Management: Use of Lower-Cost Generics Drug Mix Management: Shift Use from Brands to Generics Fraud, Waste, and Abuse Detection and Prevention Utilization Management Preferred Pharmacy Networks Offset: Payments to PBMs Net Savings Appendix IV, Exhibit 5 provides state-specific savings estimates for 2019 to Part D Claims Analysis: Negotiated Pricing Between Preferred and Non-Preferred Pharmacy Networks. Downloads/PharmacyNetwork.pdf 10 The analysis limits pharmacy-related savings to drug discounts negotiated by the PBM. Medicaid recently shifted its pharmacy payment formula for FFS-paid drugs to Average Acquisition Cost plus professional dispensing fees however, Medicaid health plans are not required to use the same payment methodology for pharmacies. The variation in pharmacy payment methodology between FFS- and Medicaid health plan-paid drugs disallows accurate estimation of dispensing fee savings realized by PBMs. As a result, the analysis does not include any savings that maybe generated by PBMs through negotiation of lower dispensing fees to pharmacies. 11 Sood, N. et al. June The Flow of Money Through the Pharmaceutical Distribution System. 6
7 Appendix IV: Additional Exhibits Exhibit 3: PBM-Driven Medicaid Pharmacy Savings, (Dollars in Millions) State Net Savings Achieved, 2016 Net Savings Achieved, Alabama $0.0 $0.0 Alaska $0.0 $0.0 Arizona $124.5 $387.7 Arkansas $0.0 $0.0 California $572.6 $1,655.0 Colorado $9.2 $9.2 Connecticut $0.0 $0.0 Delaware $17.9 $31.1 District of Columbia $23.9 $64.4 Florida $213.7 $673.0 Georgia $136.6 $543.0 Hawaii $42.2 $165.2 Idaho $0.0 $0.0 Illinois $184.9 $339.6 Indiana $226.1 $290.1 Iowa $16.7 $17.1 Kansas $23.4 $88.6 Kentucky $273.4 $765.6 Louisiana $159.8 $360.4 Maine $0.0 $0.0 Maryland $178.8 $664.0 Massachusetts $140.4 $452.3 Michigan $258.2 $881.3 Minnesota $144.9 $615.6 Mississippi $45.0 $115.2 Missouri $0.0 $0.0 Montana $0.0 $0.0 Nebraska $0.0 $0.0 Nevada $66.3 $151.3 New Hampshire $27.2 $61.7 New Jersey $267.6 $896.8 New Mexico $98.7 $402.1 New York $1,148.9 $3,872.6 North Carolina $0.0 $0.0 North Dakota $5.7 $11.0 Ohio $230.3 $656.5 Oklahoma $0.0 $0.0 Oregon $111.8 $382.9 Pennsylvania $551.0 $1,820.5 Rhode Island $47.0 $111.2 South Carolina $67.9 $296.1 South Dakota $0.0 $0.0 Tennessee $0.0 $0.0 Texas $226.9 $758.4 Utah $21.2 $63.2 Vermont $0.0 $0.0 Virginia $125.0 $521.1 Washington $186.3 $468.4 West Virginia $30.4 $48.5 Wisconsin $0.0 $0.0 Wyoming $0.0 $0.0 U.S. $6,004.5 $18,
8
9

10
Kentucky , ,349 55,446 95,337 91,006 2,427 1, ,349, ,306,236 5,176,360 2,867,000 1,462
 TABLE B MEMBERSHIP AND BENEFIT OPERATIONS OF STATE-ADMINISTERED EMPLOYEE RETIREMENT SYSTEMS, LAST MONTH OF FISCAL YEAR: MARCH 2003 Beneficiaries receiving periodic benefit payments Periodic benefit payments
State Individual Income Taxes: Personal Exemptions/Credits, 2011
 Individual Income Taxes: Personal Exemptions/s, 2011 Elderly Handicapped Blind Deaf Disabled FEDERAL Exemption $3,700 $7,400 $3,700 $7,400 $0 $3,700 $0 $0 $0 $0 Alabama Exemption $1,500 $3,000 $1,500 $3,000
Income from U.S. Government Obligations
 Baird s ----------------------------------------------------------------------------------------------------------------------------- --------------- Enclosed is the 2017 Tax Form for your account with
Annual Costs Cost of Care. Home Health Care
 2017 Cost of Care Home Health Care USA National $18,304 $47,934 $114,400 3% $18,304 $49,192 $125,748 3% Alaska $33,176 $59,488 $73,216 1% $36,608 $63,492 $73,216 2% Alabama $29,744 $38,553 $52,624 1% $29,744
Checkpoint Payroll Sources All Payroll Sources
 Checkpoint Payroll Sources All Payroll Sources Alabama Alaska Announcements Arizona Arkansas California Colorado Connecticut Source Foreign Account Tax Compliance Act ( FATCA ) Under Chapter 4 of the Code
Nation s Uninsured Rate for Children Drops to Another Historic Low in 2016
 Nation s Rate for Children Drops to Another Historic Low in 2016 by Joan Alker and Olivia Pham The number of uninsured children nationwide dropped to another historic low in 2016 with approximately 250,000
Union Members in New York and New Jersey 2018
 For Release: Friday, March 29, 2019 19-528-NEW NEW YORK NEW JERSEY INFORMATION OFFICE: New York City, N.Y. Technical information: (646) 264-3600 BLSinfoNY@bls.gov www.bls.gov/regions/new-york-new-jersey
Termination Final Pay Requirements
 State Involuntary Termination Voluntary Resignation Vacation Payout Requirement Alabama No specific regulations currently exist. No specific regulations currently exist. if the employer s policy provides
MEDICAID BUY-IN PROGRAMS
 MEDICAID BUY-IN PROGRAMS Under federal law, states have the option of creating Medicaid buy-in programs that enable employed individuals with disabilities who make more than what is allowed under Section
Sales Tax Return Filing Thresholds by State
 Thanks to R&M Consulting for assistance in putting this together Sales Tax Return Filing Thresholds by State State Alabama Alaska Arizona Arkansas California Colorado Connecticut Delaware Filing Thresholds
Pay Frequency and Final Pay Provisions
 Pay Frequency and Final Pay Provisions State Pay Frequency Minimum Final Pay Resign Final Pay Terminated Alabama Bi-weekly or semi-monthly No Provision No Provision Alaska Semi-monthly or monthly Next
The Effect of the Federal Cigarette Tax Increase on State Revenue
 FISCAL April 2009 No. 166 FACT The Effect of the Federal Cigarette Tax Increase on State Revenue By Patrick Fleenor Today the federal cigarette tax will rise from 39 cents to $1.01 per pack. The proceeds
Potential Federal and State-by-State Savings if Medicaid Pharmacy Programs were Optimally Managed
 Potential Federal and State-by-State Savings if Medicaid Pharmacy Programs were Optimally Managed February 2011 Commissioned by the Pharmaceutical Care Management Association Prepared by: Joel Menges Shirley
State Corporate Income Tax Collections Decline Sharply
 Corporate Income Tax Collections Decline Sharply Nicholas W. Jenny and Donald J. Boyd The Rockefeller Institute Fiscal News: Vol. 1, No. 3 July 26, 2001 According to a report from the Congressional Budget
AIG Benefit Solutions Producer Licensing and Appointment Requirements by State
 3600 Route 66, Mail Stop 4J, Neptune, NJ 07754 AIG Benefit Solutions Producer Licensing and Appointment Requirements by State As an industry leader in the group insurance benefits market, AIG is firmly
Undocumented Immigrants are:
 Immigrants are: Current vs. Full Legal Status for All Immigrants Appendix 1: Detailed State and Local Tax Contributions of Total Immigrant Population Current vs. Full Legal Status for All Immigrants
Federal Rates and Limits
 Federal s and Limits FICA Social Security (OASDI) Base $118,500 Medicare (HI) Base No Limit Social Security (OASDI) Percentage 6.20% Medicare (HI) Percentage Maximum Employee Social Security (OASDI) Withholding
2019 Summary of Benefits
 Plus Plan Value Plan S7126 2019 Summary of Benefits January 1, 2019 December 31, 2019 This booklet gives you a summary of what Mutual of Omaha Rx SM (PDP) Plus and Value plans cover and what you pay. It
Summary of Benefits. Express Scripts Medicare. Value Choice S5660 & S5983. January 1, 2016 December 31, 2016
 Express Scripts Medicare Value Choice (a Medicare prescription drug plan (PDP) offered by Medco Containment Life Insurance Company and Medco Containment Insurance Company of New York (for members located
The Costs and Benefits of Half a Loaf: The Economic Effects of Recent Regulation of Debit Card Interchange Fees. Robert J. Shapiro
 The Costs and Benefits of Half a Loaf: The Economic Effects of Recent Regulation of Debit Card Interchange Fees Robert J. Shapiro October 1, 2013 The Costs and Benefits of Half a Loaf: The Economic Effects
The table below reflects state minimum wages in effect for 2014, as well as future increases. State Wage Tied to Federal Minimum Wage *
 State Minimum Wages The table below reflects state minimum wages in effect for 2014, as well as future increases. Summary: As of Jan. 1, 2014, 21 states and D.C. have minimum wages above the federal minimum
State Income Tax Tables
 ALABAMA 1 st $1,000... 2% Next 5,000... 4% Over 6,000... 5% ALASKA... 0% ARIZONA 1 1 st $10,000... 2.87% Next 15,000... 3.2% Next 25,000... 3.74% Next 100,000... 4.72% Over 150,000... 5.04% ARKANSAS 1
Impacts of Prepayment Penalties and Balloon Loans on Foreclosure Starts, in Selected States: Supplemental Tables
 THE UNIVERSITY NORTH CAROLINA at CHAPEL HILL T H E F R A N K H A W K I N S K E N A N I N S T I T U T E DR. MICHAEL A. STEGMAN, DIRECTOR T 919-962-8201 OF PRIVATE ENTERPRISE CENTER FOR COMMUNITY CAPITALISM
Proposed MAC Legislation May Increase Costs Of Affected Generic Drugs By More Than 50 Percent. Prepared for
 Proposed MAC Legislation May Increase Costs Of Affected Generic Drugs By More Than 50 Percent Prepared for April 2014 Executive Summary MAC (Maximum Allowable Cost) is a savings tool used by Medicare,
Motor Vehicle Sales/Use, Tax Reciprocity and Rate Chart-2005
 The following is a Motor Vehicle Sales/Use Tax Reciprocity and Rate Chart which you may find helpful in determining the Sales/Use Tax liability of your customers who either purchase vehicles outside of
Federal Registry. NMLS Federal Registry Quarterly Report Quarter I
 Federal Registry NMLS Federal Registry Quarterly Report 2012 Quarter I Updated June 6, 2012 Conference of State Bank Supervisors 1129 20 th Street, NW, 9 th Floor Washington, D.C. 20036-4307 NMLS Federal
Proposed MAC Legislation May Increase Costs of Affected Generic Drugs By More Than 50 Percent. Prepared for
 Proposed MAC Legislation May Increase Costs of Affected Generic Drugs By More Than 50 Percent Prepared for January 2015 Executive Summary MAC (Maximum Allowable Cost) is a savings tool used by Medicare,
Required Training Completion Date. Asset Protection Reciprocity
 Completion Alabama Alaska Arizona Arkansas California State Certification: must complete initial 16 hours (8 hrs of general LTC CE and 8 hrs of classroom-only CE specifically on the CA for LTC prior to
Ability-to-Repay Statutes
 Ability-to-Repay Statutes FEDERAL ALABAMA ALASKA ARIZONA ARKANSAS CALIFORNIA STATUTE Truth in Lending, Regulation Z Consumer Credit Secure and Fair Enforcement for Bankers, Brokers, and Loan Originators
NOTICE TO MEMBERS CANADIAN DERIVATIVES CORPORATION CANADIENNE DE. Trading by U.S. Residents
 NOTICE TO MEMBERS CANADIAN DERIVATIVES CORPORATION CANADIENNE DE CLEARING CORPORATION COMPENSATION DE PRODUITS DÉRIVÉS NOTICE TO MEMBERS No. 2002-013 January 28, 2002 Trading by U.S. Residents This is
PAY STATEMENT REQUIREMENTS
 PAY MENT 2017 PAY MENT Alabama Alaska Arizona Arkansas California Colorado Connecticut Delaware District of Columbia Florida Georgia No generally applicable wage payment law for private employers. Rate
Residual Income Requirements
 Residual Income Requirements ytzhxrnmwlzh Ch. 4, 9-e: Item 44, Balance Available for Family Support (04/10/09) Enter the appropriate residual income amount from the following tables in the guideline box.
Understanding Oregon s Throwback Rule for Apportioning Corporate Income
 Understanding Oregon s Throwback Rule for Apportioning Corporate Income Senate Interim Committee on Finance and Revenue January 12, 2018 2 Apportioning Corporate Income Apportionment is a method of dividing
Q Homeowner Confidence Survey Results. May 20, 2010
 Q1 2010 Homeowner Confidence Survey Results May 20, 2010 The Zillow Homeowner Confidence Survey is fielded quarterly to determine the confidence level of American homeowners when it comes to the value
ATHENE Performance Elite Series of Fixed Index Annuities
 Rates Effective August 8, 05 ATHE Performance Elite Series of Fixed Index Annuities State Availability Alabama Alaska Arizona Arkansas Product Montana Nebraska Nevada New Hampshire California PE New Jersey
Recourse for Employees Misclassified as Independent Contractors Department for Professional Employees, AFL-CIO
 Recourse for Employees Misclassified as Independent Contractors Department for Professional Employees, AFL-CIO State Relevant Agency Contact Information Online Resources Online Filing Alabama Department
Fingerprint, Biographical Affidavit and Third-Party Verification Reports Requirements
 Updates to the State Specific Information Fingerprint, Biographical Affidavit and Third-Party Verification Reports Requirements State Requirements For Licensure Requirements After Licensure (Non-Domestic)
Forecasting State and Local Government Spending: Model Re-estimation. January Equation
 Forecasting State and Local Government Spending: Model Re-estimation January 2015 Equation The REMI government spending estimation assumes that the state and local government demand is driven by the regional
Figure 1. Medicaid Status of Medicare Beneficiaries, Partial Dual Eligibles (1.0 Million) 3% 15% 83% Medicare Beneficiaries = 38.
 3% 15% 83% Medicare Beneficiaries = 38.") I S S U E P A P E R kaiser commission on medicaid and the uninsured September 2003 A Prescription Drug Benefit in Medicare: Implications for Medicaid and Low- Income Medicare Beneficiaries A prescription
I S S U E P A P E R kaiser commission on medicaid and the uninsured September 2003 A Prescription Drug Benefit in Medicare: Implications for Medicaid and Low- Income Medicare Beneficiaries A prescription
EBRI Databook on Employee Benefits Chapter 6: Employment-Based Retirement Plan Participation
 EBRI Databook on Employee Benefits Chapter 6: Employment-Based Retirement Plan Participation UPDATED July 2014 This chapter looks at the percentage of American workers who work for an employer who sponsors
CRS Report for Congress
 Order Code RS21071 Updated February 15, 2005 CRS Report for Congress Received through the CRS Web Medicaid Expenditures, FY2002 and FY2003 Summary Karen L. Tritz Analyst in Social Legislation Domestic
Account-based medical plans Summary of Benefits and Coverage supplement
 Account-based medical plans Summary of Benefits and Coverage supplement We want you to have tools and resources to help you make informed health care decisions. For each of the medical plans this year,
TA X FACTS NORTHERN FUNDS 2O17
 TA X FACTS 2O17 Northern Funds Tax Facts provides specific information about your Northern Funds investment income and capital gain distributions for 2017. If you have any questions about how to apply
FAPRI Analysis of Dairy Policy Options for the 2002 Farm Bill Conference
 FAPRI Analysis of Dairy Policy Options for the 2002 Farm Bill Conference FAPRI-UMC Report #04-02 April 11, 2002 Food and Agricultural Policy Research Institute University of Missouri 101 South Fifth Street
MINIMUM WAGE WORKERS IN HAWAII 2013
 WEST INFORMATION OFFICE San Francisco, Calif. For release Wednesday, June 25, 2014 14-898-SAN Technical information: (415) 625-2282 BLSInfoSF@bls.gov www.bls.gov/ro9 Media contact: (415) 625-2270 MINIMUM
Aiming. Higher. Results from a Scorecard on State Health System Performance 2015 Edition. Douglas McCarthy, David C. Radley, and Susan L.
 Aiming Higher Results from a Scorecard on State Health System Performance Edition Douglas McCarthy, David C. Radley, and Susan L. Hayes December The COMMONWEALTH FUND overview On most of the indicators,
Budget Uncertainty in Medicaid. Federal Funds Information for States
 Budget Uncertainty in Medicaid Federal Funds Information for States www.ffis.org NCSL Legislative Summit August 2017 CHIP Funding State Flexibility DSH Cuts Uncertainty Block Grant ACA Expansion Per Capita
April 20, and More After That, Center on Budget and Policy Priorities, March 27, First Street NE, Suite 510 Washington, DC 20002
 820 First Street NE, Suite 510 Washington, DC 20002 Tel: 202-408-1080 Fax: 202-408-1056 center@cbpp.org www.cbpp.org April 20, 2012 WHAT IF CHAIRMAN RYAN S MEDICAID BLOCK GRANT HAD TAKEN EFFECT IN 2001?
WikiLeaks Document Release
 WikiLeaks Document Release February 2, 2009 Congressional Research Service Report RS21071 Medicaid Expenditures, FY2003 and FY2004 Karen Tritz, Domestic Social Policy Division January 17, 2006 Abstract.
Fingerprint and Biographical Affidavit Requirements
 Updates to the State-Specific Information Fingerprint and Biographical Affidavit Requirements State Requirements For Licensure Requirements After Licensure (Non-Domestic) Alabama NAIC biographical affidavit
How Much Would a State Earned Income Tax Credit Cost in Fiscal Year 2018?
 820 First Street NE, Suite 510 Washington, DC 20002 Tel: 202-408-1080 Fax: 202-408-1056 center@cbpp.org www.cbpp.org Updated February 8, 2017 How Much Would a State Earned Income Tax Cost in Fiscal Year?
DSH Reduction Allocation Process Flows. DRAFT Based on 5/15/13 NPRM
 DSH Reduction Allocation Process Flows 1 Overview The ACA mandates that the federal share of DSH payments be reduced by a specified dollar amount for each year between 2014 and 2020. The unreduced federal
Media Alert. First American CoreLogic Releases Q3 Negative Equity Data
 Contact Information Below Media Alert First American CoreLogic Releases Q3 Negative Equity Data First American CoreLogic, the first company to develop a national, state and city-level negative equity report,
Mapping the geography of retirement savings
 of savings A comparative analysis of retirement savings data by state based on information gathered from over 60,000 individuals who have used the VoyaCompareMe online tool. Mapping the geography of retirement
A d j u s t e r C r e d i t C E I n f o r m a t i o n S T A T E. DRI Will Submit Credit For You To Your State Agency. (hours ethics included)
") A d j u s t e r C r e d i t C E I n f o r m a t i o n INSURANCE COVERAGE AND CLAIMS INSTITUTE APRIL 3 5, 2019 CHICAGO, IL Delaware Georgia Louisiana Mississippi New Hampshire North Carolina (hours ethics
A d j u s t e r C r e d i t C E I n f o r m a t i o n INSURANCE COVERAGE AND CLAIMS INSTITUTE APRIL 3 5, 2019 CHICAGO, IL Delaware Georgia Louisiana Mississippi New Hampshire North Carolina (hours ethics
2012 RUN Powered by ADP Tax Changes
 2012 RUN Powered by ADP Tax Changes Dear Valued ADP Client, Beginning with your first payroll with checks dated in 2012, you and your employees may notice changes in your paychecks due to updated 2012
Child Care Assistance Spending and Participation in 2016
 Policy solutions that work for low-income people Child Care Assistance Spending and Participation in 2016 i Background The Child Care and Development Block Grant (CCDBG) is the primary federal funding
CHAPTER 6. The Economic Contribution of Hospitals
 CHAPTER 6 The Economic Contribution of Hospitals Chart 6.1: National Health Expenditures as a Percentage of Gross Domestic Product and Breakdown of National Health Expenditures, 2014 U.S. GDP 2014 $3.03
2014 STATE AND FEDERAL MINIMUM WAGES HR COMPLIANCE CENTER
 2014 STATE AND FEDERAL MINIMUM WAGES HR COMPLIANCE CENTER The federal Fair Labor Standards Act (FLSA), which applies to most employers, establishes minimum wage and overtime requirements for the private
Insurer Participation on ACA Marketplaces,
 November 2018 Issue Brief Insurer Participation on ACA Marketplaces, 2014-2019 Rachel Fehr, Cynthia Cox, Larry Levitt Since the Affordable Care Act health insurance marketplaces opened in 2014, there have
By: Adelle Simmons and Laura Skopec ASPE
 ASPE RESEARCH BRIEF 47 MILLION WOMEN WILL HAVE GUARANTEED ACCESS TO WOMEN S PREVENTIVE SERVICES WITH ZERO COST-SHARING UNDER THE AFFORDABLE CARE ACT By: Adelle Simmons and Laura Skopec ASPE The Affordable
THE STATE OF THE STATES IN DEVELOPMENTAL DISABILITIES
 THE STATE OF THE STATES IN DEVELOPMENTAL DISABILITIES Richard Hemp, Mary Kay Rizzolo, Shea Tanis, & David Braddock Universities of Colorado and Illinois-Chicago REINVENTING QUALITY CONFERENCE BALTIMORE,
State Social Security Income Pension Income State computation not based on federal. Social Security benefits excluded from taxable income.
 State Tax Treatment of Social Security, Pension Income The following CCH analysisi provides a general overview of how states treat income from Social Security and pensions for the 2013 tax year unless
S T A T E INSURANCE COVERAGE AND PRACTICE SYMPOSIUM DECEMBER 7 8, 2017 NEW YORK, NY. DRI Will Submit Credit For You To Your State Agency
 A d j u s t e r C r e d i t C E I n f o r m a t i o n INSURANCE COVERAGE AND PRACTICE SYMPOSIUM DECEMBER 7 8, 2017 NEW YORK, NY Delaware Pending Georgia Pending Louisiana Pending Mississippi 12.00 New
Medicaid and CHIP Eligibility, Enrollment, Renewal, and Cost-Sharing Policies as of January
 State Required in Medicaid Table 15 Premium, Enrollment Fee, and Cost-Sharing Requirements for Children January 2016 Premiums/Enrollment Fees Required in CHIP (Total = 36) Lowest Income at Which Premiums
DFA INVESTMENT DIMENSIONS GROUP INC. DIMENSIONAL INVESTMENT GROUP INC. Institutional Class Shares January 2018
 DFA INVESTMENT DIMENSIONS GROUP INC. DIMENSIONAL INVESTMENT GROUP INC. Institutional Class Shares January 2018 Supplementary Tax Information 2017 The following supplementary information may be useful in
ADDITIONAL REQUIRED TRAINING before proceeding. Annuity Carrier Specific Product Training
 Reliance Standard REQUIRED CARRIER SPECIFIC TRAINING (CST) INSTRUCTIONS Annuity Carrier Specific Product Training and state mandated NAIC Annuity Training (see STATE ANNUITY SUITABILITY TRAINING REQUIREMENT
# of Credit Unions As of March 31, 2011
 # of Credit Unions # of Credit Unins # of Credit Unions As of March 31, 2011 8,600 8,400 8,200 8,000 8,478 8,215 7,800 7,909 7,600 7,400 7,651 7,442 7,200 7,000 6,800 # of Credit Unions -Trend By Asset-Based
MINIMUM WAGE WORKERS IN TEXAS 2016
 For release: Thursday, May 4, 2017 17-488-DAL SOUTHWEST INFORMATION OFFICE: Dallas, Texas Contact Information: (972) 850-4800 BLSInfoDallas@bls.gov www.bls.gov/regions/southwest MINIMUM WAGE WORKERS IN
S T A T E TURNING THE TABLES ON PLAINTIFFS IN TRUCKING LITIGATION APRIL 26 27, 2018 CHICAGO, IL. DRI Will Submit Credit For You To Your State Agency
 A d j u s t e r C r e d i t C E I n f o r m a t i o n TURNING THE TABLES ON PLAINTIFFS IN TRUCKING LITIGATION APRIL 26 27, 2018 CHICAGO, IL Delaware Georgia Louisiana Mississippi New Hampshire North Carolina
STATE MINIMUM WAGES 2017 MINIMUM WAGE BY STATE
 STATE MINIMUM WAGES 2017 MINIMUM WAGE BY STATE The table below, created by the National Conference of State Legislatures (NCSL), reflects current state minimum wages in effect as of January 1, 2017, as
STATE AND FEDERAL MINIMUM WAGES
 2017 STATE AND FEDERAL MINIMUM WAGES STATE AND FEDERAL MINIMUM WAGES The federal Fair Labor Standards Act (FLSA) establishes minimum wage and overtime requirements for most employers in the private sector
A d j u s t e r C r e d i t C E I n f o r m a t i o n S T A T E. DRI Will Submit Credit For You To Your State Agency. (hours ethics included)
") A d j u s t e r C r e d i t C E I n f o r m a t i o n STRIKING BACK AGAINST THE REPTILE IN MEDICAL MALPRACTICE AND LONG TERM CARE CASES JUNE 13, 2018 CHICAGO, IL S T A T E Delaware Georgia Louisiana Mississippi
A d j u s t e r C r e d i t C E I n f o r m a t i o n STRIKING BACK AGAINST THE REPTILE IN MEDICAL MALPRACTICE AND LONG TERM CARE CASES JUNE 13, 2018 CHICAGO, IL S T A T E Delaware Georgia Louisiana Mississippi
A d j u s t e r C r e d i t C E I n f o r m a t i o n S T A T E. Pending. DRI Will Submit Credit For You To Your State Agency.
 A d j u s t e r C r e d i t C E I n f o r m a t i o n STRIKING BACK AGAINST THE REPTILE IN MEDICAL MALPRACTICE AND LONG TERM CARE CASES JUNE 13, 2018 CHICAGO, IL P O S T S E M I N A R A C T I O N Delaware
Providing Subprime Consumers with Access to Credit: Helpful or Harmful? James R. Barth Auburn University
 Providing Subprime Consumers with Access to Credit: Helpful or Harmful? James R. Barth Auburn University FICO Scores: Identifying Subprime Consumers Category FICO Score Range Super-prime 740 and Higher
Q309 NATIONAL DELINQUENCY SURVEY FROM THE MORTGAGE BANKERS ASSOCIATION. Data as of September 30, 2009
 NATIONAL DELINQUENCY SURVEY FROM THE MORTGAGE BANKERS ASSOCIATION Q309 Data as of September 30, 2009 2009 Mortgage Bankers Association (MBA). All rights reserved, except as explicitly granted. Data are
A d j u s t e r C r e d i t C E I n f o r m a t i o n S T A T E. DRI Will Submit Credit For You To Your State Agency. (hours ethics included)
") A d j u s t e r C r e d i t C E I n f o r m a t i o n NURSING HOME/ALF LITIGATION SEPTEMBER 13 14, 2018 NEW ORLEANS, LA Delaware Georgia Louisiana Mississippi New Hampshire North Carolina (hours ethics
A d j u s t e r C r e d i t C E I n f o r m a t i o n NURSING HOME/ALF LITIGATION SEPTEMBER 13 14, 2018 NEW ORLEANS, LA Delaware Georgia Louisiana Mississippi New Hampshire North Carolina (hours ethics
Minimum Wage Laws in the States - April 3, 2006
 1 of 15 Wage Laws in the States - April 3, 2006 Note: Where Federal and state law have different minimum wage rates, the higher standard applies. Wage and Overtime Standards Applicable to Nonsupervisory
State Tax Treatment of Social Security, Pension Income
 State Tax Treatment of Social Security, Pension Income The following chart Provides a general overview of how states treat income from Social Security and pensions for the 2016 tax year unless otherwise
Data Note: What if Per Enrollee Medicaid Spending Growth Had Been Limited to CPI-M from ?
 Data Note: What if Per Enrollee Medicaid Spending Growth Had Been Limited to CPI-M from 2001-2011? Rachel Garfield, Robin Rudowitz, and Katherine Young Congress is currently debating the American Health
Aetna Individual Direct Pay Commissions Schedule
 Aetna Individual Direct Pay Commissions Schedule Cards Issued Broker Rate Broker Tier Per Year 1st Yr 2nd Yr 3+ Yrs Levels 11-Jan 4.00% 4.00% 3.00% Bronze 24-Dec 6.00% 4.00% 3.00% Silver 25-49 8.00% 4.00%
White Paper 2018 STATE AND FEDERAL MINIMUM WAGES
 White Paper STATE AND FEDERAL S White Paper STATE AND FEDERAL S The federal Fair Labor Standards Act (FLSA) establishes minimum wage and overtime requirements for most employers in the private sector and
Medicare Advantage 2018 Data Spotlight: First Look
 Medicare Advantage 2018 Data Spotlight: First Look Gretchen Jacobson, Anthony Damico, Tricia Neuman More than 19 million Medicare beneficiaries (33%) are enrolled in Medicare Advantage in 2017, which are
Q209 NATIONAL DELINQUENCY SURVEY FROM THE MORTGAGE BANKERS ASSOCIATION. Data as of June 30, 2009
 NATIONAL DELINQUENCY SURVEY FROM THE MORTGAGE BANKERS ASSOCIATION Q209 Data as of June 30, 2009 2009 Mortgage Bankers Association (MBA). All rights reserved, except as explicitly granted. Data are from
HealthSpring Prescription Drug Plan (PDP) 2013 Summary of Benefits S5932
 2013 Summary of Benefits S5932") HealthSpring Prescription Drug Plan (PDP) 2013 Summary of Benefits S5932 Alabama, Alaska, Arizona, Arkansas, California, Colorado, Connecticut, Delaware, District of Columbia, Florida, Georgia, Hawaii,
HealthSpring Prescription Drug Plan (PDP) 2013 Summary of Benefits S5932 Alabama, Alaska, Arizona, Arkansas, California, Colorado, Connecticut, Delaware, District of Columbia, Florida, Georgia, Hawaii,
IMPORTANT TAX INFORMATION
 IMPORTANT TAX INFORMATION The following information about your enclosed 1099-DIV from s should be used when preparing your 2017 tax return. Form 1099-DIV reports dividends, exempt-interest dividends, capital
Taxes and Economic Competitiveness. Dale Craymer President, Texas Taxpayers and Research Association (512)
") Taxes and Economic Competitiveness Dale Craymer President, Texas Taxpayers and Research Association (512) 472-8838 dcraymer@ttara.org www.ttara.org Presented to the Committee on Economic Competitiveness
Taxes and Economic Competitiveness Dale Craymer President, Texas Taxpayers and Research Association (512) 472-8838 dcraymer@ttara.org www.ttara.org Presented to the Committee on Economic Competitiveness
Table 15 Premium, Enrollment Fee, and Cost Sharing Requirements for Children, January 2017
 State Required in Medicaid Required in CHIP (Total = 36) 1 Lowest Income at Which Premiums Begin (Percent of the FPL) 2 Required in Medicaid Required in CHIP (Total = 36) 1 Lowest Income at Which Cost
DATA AS OF SEPTEMBER 30, 2010
 NATIONAL DELINQUENCY SURVEY Q3 2010 DATA AS OF SEPTEMBER 30, 2010 2010 Mortgage Bankers Association (MBA). All rights reserved, except as explicitly granted. Data are from a proprietary paid subscription
If the foreign survivor of the merger is on the record what do you require?
 Topic: Question by: : Foreign Mergers Tracy M. Sebranek Maine Date: December 17, 2013 Manitoba Corporations Canada Alabama Alaska Arizona We require only a certified copy of the merger documents, as long
SECTION 109 HOST STATE LOAN-TO-DEPOSIT RATIOS. The Board of Governors of the Federal Reserve System, the Federal Deposit Insurance
 SECTION 109 HOST STATE LOAN-TO-DEPOSIT RATIOS The Board of Governors of the Federal Reserve System, the Federal Deposit Insurance Corporation, and the Office of the Comptroller of the Currency (the agencies)
S T A T E MEDICAL LIABILITY AND HEALTH CARE LAW MARCH 2 3, 2017 LAS VEGAS, NV. DRI Will Submit Credit For You To Your State Agency
 A d j u s t e r C r e d i t C E I n f o r m a t i o n MEDICAL LIABILITY AND HEALTH CARE LAW MARCH 2 3, 2017 LAS VEGAS, NV Delaware Pending Georgia 12.00 Louisiana Pending Mississippi 13.00 New Hampshire
Mutual Fund Tax Information
 2008 Mutual Fund Tax Information We have provided this information as a service to our shareholders. Thornburg Investment Management cannot and does not give tax or accounting advice. If you have further
The 2017 CHP Salary Survey
 The 2017 CHP Salary Survey Gary Lauten, CHP, AAHP Niche Analyst Introduction The 2017 certified health physicist (CHP) survey data was collected by having CHPs submit their responses to survey questions
Do you charge an expedite fee for online filings?
 Topic: Expedite Fees and Online Filings Question by: Allison A. DeSantis : Ohio Date: March 14, 2012 Manitoba Corporations Canada Alabama Alaska Arizona Yes. The expedite fee is $35. We currently offer
Mutual Fund Tax Information
 Mutual Fund Tax Information We have provided this information as a service to our shareholders. Thornburg Investment Management cannot and does not give tax or accounting advice. If you have further questions
ADDITIONAL REQUIRED TRAINING before proceeding. Annuity Carrier Specific Product Training
 American Equity REQUIRED CARRIER SPECIFIC TRAINING (CST) INSTRUCTIONS Annuity Carrier Specific Product Training and state mandated NAIC Annuity Training (see STATE ANNUITY SUITABILITY TRAINING REQUIREMENT
What is your New Financing Statement Fee? What is your Amendment Fee (include termination fee if a different amount)?
?") Topic: UCC Filing Fee Information Question By: Tana Gormely Jurisdiction: Montana Date: 03 April 2012 Jurisdiction Alabama Alaska Arizona Arkansas California Question(s) What is your New Financing Statement
Topic: UCC Filing Fee Information Question By: Tana Gormely Jurisdiction: Montana Date: 03 April 2012 Jurisdiction Alabama Alaska Arizona Arkansas California Question(s) What is your New Financing Statement
Chapter D State and Local Governments
 Chapter D State and Local Governments State and Local Governments contains detailed information on the taxes, revenues, and expenditures of states and localities. The public finances of these two levels
# of Credit Unions As of September 30, 2011
 # of Credit Unions # of Credit Unions # of Credit Unions As of September 30, 2011 8,400 8,200 8,000 7,800 7,600 7,400 7,200 8,332 8,065 7,794 7,556 7,325 7,000 6,800 9,000 8,000 7,000 6,000 5,000 4,000