DISTRICT ADMINISTRATIVE OFFICE 6230 SYLVAN ROAD, CITRUS HEIGHTS, CA
|
|
|
- Malcolm Franklin
- 5 years ago
- Views:
Transcription

1 BOARD MEETING AGENDA ANNUAL MEETING OF THE BOARD OF DIRECTORS OF CITRUS HEIGHTS WATER DISTRICT FINANCING CORPORATION JULY 18, 2018 beginning at 6:30 PM DISTRICT ADMINISTRATIVE OFFICE 6230 SYLVAN ROAD, CITRUS HEIGHTS, CA In compliance with the Americans with Disabilities Act, if you have a disability and need a disability-related modification or accommodation to participate in this meeting, please contact the Secretary at (916) Requests must be made as early as possible, and at least one full business day before the start of the meeting. CALL TO ORDER: Upon request, agenda items may be moved to accommodate those in attendance wishing to address that item. Please inform the Secretary. ROLL CALL OF DIRECTORS: VISITORS: PUBLIC COMMENT: The Public shall have the opportunity to directly address the Board on any item of interest to the public before or during the Board s consideration of that item pursuant to Government Code Section Public comment on items of interest within the jurisdiction of the Board is welcome. The Presiding Officer will limit comments to three (3) minutes per speaker. (A) Action Item (D) Discussion Item (I) Information Item CONSENT CALENDAR: (A) All items under the Consent Calendar are considered to be routine and will be approved by one motion. There will be no separate discussion of these items unless a member of the Board, Audience, or Staff request a specific item be removed for separate discussion/action before the motion to approve the Consent Calendar. None BUSINESS: B-1. B-2. Confirmation / Appointment of CHWD Financing Corporation Officers (A) Consider confirmation and appointment of Citrus Heights Water District Financing Corporation Officers. Status of the CHWD Revenue Refunding Certificates of Participation, Series 2010 (I) Review the Annual Report for the CHWD Revenue Refunding Certificates of Participation, Series 2010 and other information related to debt financing by the District.

2 ADJOURNMENT: CERTIFICATION: I do hereby certify that this agenda was posted in a location accessible to the public at 6230 SYLVAN ROAD, CITRUS HEIGHTS, CA at least 72 hours prior to the regular meeting in accordance with Government Code Section Madeline Henry, Management Services Specialist/Deputy Board Clerk Dated: July 12, 2018
3 FINANCING CORPORATION DISTRICT STAFF REPORT TO BOARD OF DIRECTORS OF THE CHWD FINANCING CORPORTATION JULY 18, 2018 ANNUAL MEETING AGENDA ITEM: B-1 SUBJECT : CONFIRMATION / APPOINTMENT OF CHWD FINANCING CORPORATION OFFICERS STATUS : Action Item REPORT DATE : June 28, 2018 PREPARED BY : Susan K. Sohal, Administrative Services Manager OBJECTIVE: Consider confirmation and appointment of Citrus Heights Water District Financing Corporation Officers. BACKGROUND AND ANALYSIS: Existing Officers: President Vice President Director Chief Financial Officer Secretary Caryl F. Sheehan Raymond A. Riehle Allen B. Dains Susan K. Sohal Hilary M. Straus Proposed Officers: President Raymond A. Riehle Appoint as President Vice President Caryl F. Sheehan Appoint as Vice President Director Allen B. Dains Appoint as Director Chief Financial Officer Susan K. Sohal Reconfirm as CFO Secretary Hilary M. Straus Reconfirm as Secretary RECOMMENDATION: Confirm and appoint the following Citrus Heights Water District Financing Corporation Officers: President Raymond A. Riehle Appoint as President Vice President Caryl F. Sheehan Appoint as Vice President Director Allen B. Dains Appoint as Director Chief Financial Officer Susan K. Sohal Reconfirm as CFO Secretary Hilary M. Straus Reconfirm as Secretary
4 Confirmation/Appointment of CHWD Financing Corp Officers AGENDA ITEM: B-1 July 18, Annual Meeting Page 2 ACTION: Moved by Director, Seconded by Director, Carried
5 FINANCING CORPORATION DISTRICT STAFF REPORT TO BOARD OF DIRECTORS OF THE CHWD FINANCING CORPORATION JULY 18, 2018 ANNUAL MEETING AGENDA ITEM: B-2 SUBJECT : STATUS OF THE CITRUS HEIGHTS WATER DISTRICT REVENUE REFUNDING CERTIFICATES OF PARTICIPATION, SERIES 2010 STATUS : Information / Discussion Item REPORT DATE : June 28, 2018 PREPARED BY : Alberto Preciado, Senior Accountant Susan K. Sohal, Administrative Services Manager OBJECTIVE: Review the Annual Report for the Citrus Heights Water District (CHWD) Revenue Refunding Certificates of Participation, Series 2010 and other information related to debt financing by the District. BACKGROUND AND ANALYSIS: 1. The Citrus Heights Water District Financing Corporation (the Corporation) was formed in July 2000 for the purpose of issuing the $7.9 million in Certificates of Participation (COPs) for the financing of water meter installations and well improvements. Section 3.5 of the Bylaws for the Corporation requires that an annual meeting be held each year. In June 2010, the Corporation authorized the refunding of the Series 2000 COPs with the issuance of the Revenue Refunding COPs, Series 2010, in the amount of $5,155,000. The purpose of this meeting is to review information or developments related to the COP financing and to fulfill a legal requirement for California non-profit corporations. Included with Directors' agenda packets is a copy of the Continuing Disclosure Annual Report for the Revenue and Revenue Refunding COPs (Attachment 1). This report is a requirement of the District's COP issuance and is generally required for all publicly-traded securities. It is filed with nationally-recognized Municipal Securities Information Repositories where these reports are made available to the public. The Annual Report shows the status of the principal on the COPs and other financial and operating information about the District as of December 31, The balance outstanding on the COPs at that time was $1,575,000. The District made two installment payments in 2017 on the Series 2010 COPs for a total of $567,400; $485, as repayment of principal on the COPs; and $82, in interest on the debt. The District has five years of payments remaining on this 10-year debt refunding as of December 31, 2017 (Attachment 2) with an outstanding balance of $ million. The District s AA bond rating on its debt was most recently reaffirmed in September 2015 during a review done by S&P every three years. The rating is a continued affirmation of the District s strong financial policies and financial stability. 2. The debt under the San Juan Water District (SJWD)/CHWD COPs, originally issued in 2003, was
6 Status of the CHWD Certificates of Participation, Series 2010 July 18, 2018 CHWD Financing Corporation Annual Meeting Agenda AGENDA ITEM: B-2 Page 2 not issued under the authority of the CHWD Financing Corporation, since it was done under the authority of the San Juan Suburban Water District Financing Corporation. However, staff has typically reported on the status of the SJWD/CHWD debt issuance at the time of the CHWD Financing Corporation Annual Meeting. CHWD participated with SJWD in a refunding of the 2003 Series debt that was completed in May The new debt issuance is identified as the SJWD/CHWD Refunding Revenue Bonds, Series 2012A. This refunding resulted in a savings to SJWD and CHWD over the remaining life of their respective debt. The principal amount outstanding on the Series 2012A bonds as of December 31, 2017 was $1,870,000. CHWD s annual principal and interest payments on the Series 2012A debt ranges from $167, to $175, annually over the remaining life of the debt through its retirement in 2033 with an outstanding balance of $ 1.87 million. Payments on the SJWD/CHWD debt issuance are paid quarterly by CHWD to SJWD coincidental with CHWD s payments to SJWD for wholesale surface water supplies. RECOMMENDATION: Receive and file the Annual Report for the CHWD Revenue Refunding Certificates of Participation, Series ATTACHMENTS: Continuing Disclosure Annual Report 2. Series 2010 COP Debt Service Schedule pg. 6 of the Official Statement, dated: August 17, 2010, prepared by Southwest Securities, Inc.
7 ATTACHMENT Continuing Annual Disclosure Report
 SERIES 2012A CITRUS HEIGHTS WATER DISTRICT 6230 SYLVAN ROAD CITRUS HEIGHTS, CALIFORNIA 95610 00194550")
8 CONTINUING DISCLOSURE ANNUAL REPORT FISCAL YEAR ENDED DECEMBER 31, 2017 CITRUS HEIGHTS WATER DISTRICT REVENUE REFUNDING CERTIFICATES OF PARTICIPATION, SERIES 2010 (BANK QUALIFIED) SAN JUAN WATER DISTRICT REFUNDING REVENUE BONDS (SAN JUAN AND CITRUS HEIGHTS PROJECT) SERIES 2012A CITRUS HEIGHTS WATER DISTRICT 6230 SYLVAN ROAD CITRUS HEIGHTS, CALIFORNIA
9 REVENUE REFUNDING CERTIFICATES OF PARTICIPATION, SERIES 2010 (BANK QUALIFIED) MATURITY DATE (October 1) CUSIP AY AZ BA5 SAN JUAN WATER DISTRICT REVENUE REFUNDING BONDS (SAN JUAN AND CITRUS HEIGHTS PROJECTS) SERIES 2012A MATURITY DATE (February 1) CUSIP* AG AH AJ AK AL AN AM6 CUSIP is a registered trademark of the American Bankers Association. CUSIP Global Services (CGS) is managed on behalf of the American Bankers Association by S&P Capital Global Market Intelligence. Copyright 2018 CUSIP Global Services. All rights reserved. This data is not intended to create a database and does not serve in any way a substitute for the CUSIP Global Services. CUSIP numbers are provided for convenience of reference only. Citrus Heights Water District does not take any responsibility for the accuracy of such numbers.
10 TABLE OF CONTENTS INTRODUCTION... 1 DEFINITIONS... 1 DELIVERY OF THE ANNUAL REPORT... 2 AUDITED FINANCIAL STATEMENTS... 2 PRINCIPAL AMOUNTS OUTSTANDING CERTIFICATES BONDS... 2 RESERVE FUND REQUIREMENTS CERTIFICATES BONDS... 2 FINANCIAL INFORMATION AND OPERATING DATA... 3 WATER DELIVERIES... 3 SERVICE CONNECTIONS... 3 WATER SALES REVENUES... 3 WATER SYSTEM RATES AND CHARGES... 4 OPERATING RESULTS AND DEBT SERVICE COVERAGE... 5 CERTAIN DISCLAIMERS... 6 CONCLUSION...S-1 APPENDIX A AUDITED FINANCIAL STATEMENTS FISCAL YEAR ENDED DECEMBER 31, A-1
11 INTRODUCTION THIS CONTINUING DISCLOSURE ANNUAL REPORT, dated June 28, 2018 (the Annual Report ) has been prepared to satisfy the obligations of the Citrus Heights Water District (the District ). Definitions Unless otherwise required, the following are the defined terms for this Annual Report Certificates Certificates means the Citrus Heights Water District Revenue Refunding Certificates of Participation, Series 2010, executed and delivered on September 1, Disclosure Agreement Disclosure Agreement means that certain Continuing Disclosure Agreement, dated September 1, 2010, executed by the District in connection with the execution and delivery of the 2010 Certificates Bonds Bonds means the San Juan Water District Revenue Refunding Bonds (San Juan and Citrus Heights Project) Series 2012A, issued on May 16, Disclosure Certificate Disclosure Certificate means that certain Amended and Restated Continuing Disclosure Certificate, dated May 16, 2012, executed by the District in connection with the issuance of the 2012 Bonds. Debt Obligations. Debt Obligations means the 2010 Certificates and the 2012 Bonds. Disclosure Documents. Disclosure Documents means the 2010 Disclosure Agreement and the 2012 Disclosure Certificate. EMMA. EMMA means the Electronic Municipal Market Access, a service of the Municipal Securities Rulemaking Board. Fiscal Year. Fiscal Year means the period beginning on January 1 of each year and ending on the last day of December of such year, or any other twelve-month period selected and designated as the official Fiscal Year of the District. Official Statements. Official Statements means that certain Official Statement, dated August 17, 2010, with regards to the 2010 Certificates and that certain Official Statement, dated April 26, 2012 with regards to the 2012 Bonds. Rule. Rule means Rule 15c2-12 of the Securities Exchange Act of 1934, as amended. San Juan. San Juan means the San Juan Water District. 1
12 Delivery of the Annual Report The District has agreed under the Disclosure Documents to provide certain annual financial information and operating data and notices of significant events. These covenants have been made in order to assist the underwriters of the Debt Obligations in complying with the Rule. As provided in Section 3 of the Disclosure Documents, this Annual Report is being prepared for publication with EMMA for the benefit of the owners of the Debt Obligations and the underwriters. Capitalized terms used in the Disclosure Certificates, which are not otherwise defined herein, shall have the respective meaning specified in the Official Statement. The following is information as required under Section 4 of the Disclosure Documents. AUDITED FINANCIAL STATEMENTS The audited financial statements of the District for the Fiscal Year ending December 31, 2017 are attached hereto as Appendix A Certificates PRINCIPAL AMOUNTS OUTSTANDING As of the date of this Annual Report, the outstanding principal amount on the 2010 Certificates is $1,575, Bonds As of the date of this Annual Report, the outstanding principal amount of the 2012 Installment Purchase Agreement attributable to the District in connection with the 2012 Bonds is $1,790, Certificates RESERVE FUND REQUIREMENTS Pursuant to the 2010 Certificates Trust Agreement, the District is required to establish the Reserve Fund (the 2010 Reserve Fund ) in an amount equal to $536,949.37, the 2010 Reserve Fund Requirement. As of the date of this Annual Report, the balance in the 2010 Reserve Fund is $537,139.98, based on federal costs for portions of certain investments Bonds Pursuant to the 2012 Bonds Indenture, there is no debt service reserve fund. 2
13 FINANCIAL INFORMATION AND OPERATING DATA Water Deliveries The following table summarizes water deliveries in acre feet for the last Fiscal Year. Treated Water Deliveries Source: Citrus Heights Water District. Service Connections CITRUS HEIGHTS WATER DISTRICT WATER DELIVERIES (in acre feet) Fiscal Year 2017 Groundwater Deliveries Total Water Deliveries 10, ,623 The following table represents a summary of average service connections to the Water System for the last Fiscal Year. Source: Citrus Heights Water District. CITRUS HEIGHTS WATER DISTRICT SERVICE CONNECTIONS Fiscal Year 2017 Service Connections Percent Increase/(Decrease) 19, % Water Sales Revenues The following table shows annual water sales revenues of the District for the last Fiscal Year. Increased sales in Fiscal Year 2017 are due to increased water sales revenues as well as a 13% rate increase adopted by the Board of Directors at the beginning of Fiscal Year Source: Citrus Heights Water District. CITRUS HEIGHTS WATER DISTRICT WATER SALES REVENUES Fiscal Year 2017 Sales Revenues Percent Increase/(Decrease) $14,043, % 3
14 Water System Rates and Charges The table below lists the annual water system rates and the percentage rate increases approved by the Board of Directors of the District for the last Fiscal Year for single family residences. CITRUS HEIGHTS WATER DISTRICT WATER SYSTEM RATES AND CHARGES SINGLE FAMILY RESIDENCES Fiscal Year Annual Rate Percent Increase 2017 $ % Source: Citrus Heights Water District. 1 meter bi-monthly service charge with 20 units of water consumption. (REMAINDER OF PAGE LEFT INTENTIONALLY BLANK) 4
15 Operating Results and Debt Service Coverage The following table is a summary of operating results for the most recently completed fiscal year. These results have been derived from the District s Financial Statements but exclude certain non-cash items and include certain other adjustments. CITRUS HEIGHTS WATER DISTRICT OPERATING RESULTS FISCAL YEAR ENDED DECEMBER 31, 2017 Revenues Water Sales $13,448,691 Capacity Fees, Other Fees and Charges 594,358 Interest Earnings 63,531 Miscellaneous 77,074 Total Revenues 14,183,654 Operation and Maintenance Expenses Water Purchases 2,692,482 Pumping & Well Maintenance 145,077 Transmission & Distribution 1,963,750 Administrative & General and Conservation 2,733,072 Total Operation and Maintenance Expenses 7,534,381 Net Revenues 6,649,273 Rate Stabilization (RS) Reserve 834,000 Net Revenues & RS Reserve 7,483,273 Parity Debt Service 2010 Installment Purchase Agreement 567, Installment Purchase Agreement 171,338 Total Parity Debt Service $738,738 Total Debt Service Coverage 9.00x Total Debt Service Coverage with RS Reserve 10.13x Citrus Heights Revenues Available for other Purposes $5,910,536 Source: Citrus Heights Water District. (REMAINDER OF PAGE LEFT INTENTIONALLY BLANK) 5
16 CERTAIN DISCLAIMERS The information contained in this Annual Report expresses only the views of the applicable party. An explanation of the significance of any such information may be obtained from the applicable party; provided, however, that no information provided by any party is incorporated in this Annual Report. The District undertakes no responsibility to oppose any revision or withdrawal of such information contained in this Annual Report. To the extent the District provides information in this Annual Report, the District is not obligated to present or update information in future Annual Reports. Investors are advised to refer to the applicable Official Statement for the Debt Obligations for information concerning the initial issuance of and security for the Debt Obligations. By providing the information in this Annual Report, the District does not imply or represent (a) that all information provided in this Annual Report is material to investors decisions regarding investment in the Debt Obligations, (b) the completeness or accuracy of any financial, operational or other information not included herein or in the Official Statements, (c) that no changes, circumstances or events have occurred since the date of this Annual Report (other than as contained herein), or (d) that no other information exists which may have a bearing on the District s financial condition, the security for the Debt Obligations or an investor s decision to buy, sell or hold the Debt Obligations. The information set forth in this Annual Report or incorporated in this Annual Report has been furnished by the District and is believed to be accurate and reliable but is not guaranteed as to accuracy or completeness. Statements contained in or incorporated by this Annual Report which involves estimates, forecasts or other matters of opinion, whether or not expressly so described herein, are intended solely as such and are not to be construed as representations of fact. Further, expressions of opinion contained in this Annual Report or incorporated in this Annual Report are subject to change without notice and the delivery of this Annual Report will not, under any circumstances, create any implication that there has been no change in the affairs of the District. The District is relying upon and has not independently confirmed or verified the accuracy or completeness of information provided by others or other information incorporated by reference therein. No statement contained in this Annual Report should be construed as a prediction or representation about future financial performance of the District. Historical results presented herein may not be indicative of future operating results. 6
17 CONCLUSION The information set forth in this Annual Report has been obtained from sources believed by the District to be reliable and is fairly presented. CITRUS HEIGHTS WATER DISTRICT Hilary M. Straus General Manager S-1
18 APPENDIX A AUDITED FINANCIAL STATEMENTS FISCAL YEAR ENDED DECEMBER 31, 2017 A-1
19 (THIS PAGE INTENTIONALLY LEFT BLANK)
20 BASIC FINANCIAL STATEMENTS FOR THE YEARS ENDED DECEMBER 31, 2017 AND 2016 CITRUS HEIGHTS WATER DISTRICT 6230 Sylvan Rd Citrus Heights, California (916) Prepared by: Susan Sohal, Administrative Services Manager/Treasurer Alberto Preciado, Senior Accountant
21 This Page Left Intentionally Blank
22 FINANCIAL SECTION CITRUS HEIGHTS WATER DISTRICT Basic Financial Statements For the Years Ended December 31, 2017 and 2016 Table of Contents INDEPENDENT AUDITOR S REPORT... 1 MANAGEMENT S DISCUSSION AND ANALYSIS... 3 BASIC FINANCIAL STATEMENTS Balance Sheets...12 Statements of Revenues, Expenses, and Changes in Net Position Statements of Cash Flows...14 Notes to Basic Financial Statements...17 REQUIRED SUPPLEMENTARY INFORMATION Schedule of the Plan s Proportionate Share of the Net Pension Liability and Related Ratios as of the Measurement Date Schedule of Contributions Schedule of Funding Status Other Post-Employment Benefits Obligation... 42
23 This Page Left Intentionally Blank
24 Financial Section
25 This Page Left Intentionally Blank
26 To the Honorable Members of the Board of Directors Citrus Heights Water District Citrus Heights, California Report on the Financial Statements INDEPENDENT AUDITOR S REPORT We have audited the accompanying financial statements of the Citrus Heights Water District (District), California, as of and for the years ended December 31, 2017 and 2016, and the related notes to the financial statements, which collectively comprise the District s basic financial statements as listed in the Table of Contents. Management s Responsibility for the Financial Statements Management is responsible for the preparation and fair presentation of these financial statements in accordance with accounting principles generally accepted in the United States of America; this includes the design, implementation, and maintenance of internal control relevant to the preparation and fair presentation of the financial statements that are free from material misstatement, whether due to fraud or error. Auditor s Responsibility Our responsibility is to express opinions on these financial statements based on our audits. We conducted our audits in accordance with auditing standards generally accepted in the United States of America and the standards applicable to financial audits contained in Government Auditing Standards, issued by the Comptroller General of the United States. Those standards require that we plan and perform the audits to obtain reasonable assurance about whether the financial statements are free from material misstatement. An audit involves performing procedures to obtain audit evidence about the amounts and disclosures in the financial statements. The procedures selected depend on the auditor s judgment, including the assessment of the risks of material misstatement of the financial statements, whether due to fraud or error. In making those risk assessments, the auditor considers internal control relevant to the District s preparation and fair presentation of the financial statements in order to design audit procedures that are appropriate in the circumstances, but not for the purpose of expressing an opinion on the effectiveness of the District s internal control. Accordingly, we express no such opinion. An audit also includes evaluating the appropriateness of accounting policies used and the reasonableness of significant accounting estimates made by management, as well as evaluating the overall presentation of the financial statements. We believe that the audit evidence we have obtained is sufficient and appropriate to provide a basis for our audit opinion. Opinions In our opinion, the financial statements referred to above present fairly, in all material respects, the respective financial position of the District as of December 31, 2017 and 2016, and the respective changes in its financial position and cash flows for the years then ended in accordance with accounting principles generally accepted in the United States of America. 1
27 Change in Accounting Principle Management adopted the provision of the following Governmental Accounting Standards Board Statement which became effective during the year ended December 31, 2017 as discussed in Note 1 to the financial statements: Statement No. 82 Pension Issues An Amendment of GASB Statements No. 67, No. 68, and No.73 The emphasis of this matter does not constitute a modification to our opinions. Other Matters Required Supplementary Information Accounting principles generally accepted in the United States of America require that Management s Discussion and Analysis, and other required supplementary information as listed in the Table of Contents be presented to supplement the basic financial statements. Such information, although not a part of the basic financial statements, is required by the Governmental Accounting Standards Board, who considers it to be an essential part of financial reporting for placing the basic financial statements in an appropriate operational, economic or historical context. We have applied certain limited procedures to the required supplementary information in accordance with auditing standards generally accepted in the United States of America, which consisted of inquiries of management about the methods of preparing the information and comparing the information for consistency with management s responses to our inquiries, the basic financial statements, and other knowledge we obtained during our audit of the basic financial statements. We do not express an opinion or provide any assurance on the information because the limited procedures do not provide us with sufficient evidence to express an opinion or provide any assurance. Other Reporting Required by Government Auditing Standards In accordance with Government Auditing Standards, we have also issued our report dated May 3, 2018, on our consideration of the District s internal control over financial reporting and on our tests of its compliance with certain provisions of laws, regulations, contracts, and grant agreements and other matters. The purpose of that report is to describe the scope of our testing of internal control over financial reporting and compliance and the results of that testing, and not to provide an opinion on internal control over financial reporting or on compliance. That report is an integral part of an audit performed in accordance with Government Auditing Standards in considering the District s internal control over financial reporting and compliance. Pleasant Hill, California May 3,
28 Management s Discussion and Analysis December 31, 2017 The management of the Citrus Heights Water District (District) intends to present this Management Discussion and Analysis to serve as an introduction to the District s Financial Statements and to provide readers with a broad overview of the district s finances and an easier to understand narrative information that may help in interpreting the information presented in the Financial Statements for the year ending December 31, Financial Highlights The following items are, in the opinion of District management, among the most significant in assessing the District s overall financial activities during 2017 and its financial position at the close of the year 2017: The District s assets exceeded its liabilities at the end of year 2017 by $64,769,085. About 83 percent of the District s net position, $53,886,153, is composed of the capital assets of the District the water transmission and distribution system, water production facilities, land, buildings, and equipment belonging to the District. Unrestricted net assets totaled $10,347,199, up from $6,782,716 at the end of year This increase is due primarily to revenue generated from increased water sales in FY2017 as compared with FY2016, and also a 13 percent rate increase levied by the Board of Directors at the beginning of FY2017. Capital improvement spending in year 2017 decreased by $6.9 million as compared with year Capital improvements capitalized in 2017 amounted to $1,696,149. The District s operating revenues for 2017 were $14,043,049. About 95.8 percent of operating revenues, $13,448,691, came from water sales to customers. As previously mentioned, the District adopted a rate increase for FY2017, increasing water rates by 13 percent above water rates that were in place for FY2016. The District s total net long-term liabilities at the end of 2017, including the 2012 Revenue Refunding bonds, the 2010 Revenue Refunding Certificates of Participation, accrued other postemployment benefits, and compensated absences is $9,072,301. The GASB 68 required recording of pension liability and pension related deferred inflows and outflows amounted to $4,155,588. Liabilities from Bond debt service decreased by $599,819 due in large part to a reduction in principal on debt during 2017 resulting from debt service payments during the year. OVERVIEW OF THE FINANCIAL STATEMENTS This annual report consists of two parts: (1) management s discussion and analysis; and (2) the financial statements, including the notes to financial statements and required supplementary information. 3
29 Management s Discussion and Analysis December 31, 2017 The financial statements provide both long-term and short-term information about the District s overall financial status. The financial statements also include notes that explain some of the information in the financial statements and provide more detailed data. The required supplementary information, although not part of the basic financial statements, is required by the Governmental Accounting Standards Board (GASB) to provide more context regarding the financial statements from an appropriate operational, economic, or historical perspective. The District s financial statements are prepared in conformity with accounting principles generally accepted in the United States of America (GAAP) as applied to government units on an accrual basis. Under this basis, revenues are recognized in the period in which they are earned, expenses are recognized in the period in which they are incurred, and depreciation of assets is recognized in the Statement of Revenues, Expenses, and Changes in Net Assets. All assets and liabilities associated with the operation of the District are included in the Balance Sheet. The Balance Sheet presents the financial position of the District on a full accrual historical cost basis and provides information about the nature and amount of resources and obligations at yearend. Balance Sheet As of December 31, 2017, the total net position of the District was $64,769,085. The following table summarizes assets, deferred outflows, liabilities, deferred inflows, and net assets at December 31, 2017, 2016, and 2015: Current assets, unrestricted $ 15,713,090 $ 12,309,889 $ 10,687,841 Restricted cash and cash equivalents 535, , ,350 Capital assets, net 57,038,900 56,078,006 55,206,322 Deferred outflows 1,981, , ,528 Total Assets and Deferred Outflows 75,269,620 69,686,423 66,958,041 Current Liabilities 2,031,682 1,618,896 1,675,151 Non-current liabilities 8,280,325 7,955,992 8,590,592 Deferred Inflows 188, , ,619 Total Liabilities and Deferred Inflows 10,500,535 10,034,682 11,095,362 Net Position Net investment in capital assets 53,886,153 52,335,229 50,895,005 Restricted for debt service 535, , ,350 Unrestricted 10,347,199 6,782,716 4,434,324 Total Net Position $64,769,085 $59,651,741 $55,862,679 The District s net position reflects restrictions imposed as a condition of its Certificates of Participation debt. The remaining net position is unrestricted. 4
30 Management s Discussion and Analysis December 31, 2017 Changes in Net Position The following table summarizes the changes in net position for the fiscal years ended December 31, 2017, 2016, and 2015: Operating revenues $14,043,049 $12,325,057 $10,884,550 Operating expenses: Customer service, administration and general 2,543,736 2,342,957 2,514,087 Water purchases 2,692,482 2,190,061 1,950,627 Transmission and distribution 1,963,750 2,114,019 1,239,387 Pumping and well maintenance 145, , ,842 Water demand management (Conservation) 189, , ,114 Depreciation and amortization 2,345,281 2,203,170 2,098,944 Total operating expenses 9,879,662 9,247,133 8,122,001 Operating income 4,163,377 3,077,924 2,762,549 Net non-operating revenues (expenses) 898,144 (186,265) (120,929) Net income before capital contributions 5,061,521 2,891,659 2,641,620 Capital contributions: Contributed (donated) assets 55, , ,567 Grant Revenue ,431 Total capital contributions 55, ,403 1,048,998 Change in net position 5,117,344 3,789,062 3,690,618 Net position, beginning of year 59,651,741 55,862,679 55,900,828 Prior period adjustment - - (3,728,767) Net position, end of year $ 64,769,085 $59,651,741 $55,862,679 Net position increased $5,117,344, or 8.6 percent from the prior year. Operating revenue that exceeded operating expenses by $4.1 million accounts for the increase in net assets, and most of these funds were expended for the construction of capital improvements or set aside for that purpose. The receipt of $55,813 in donated assets from private developer additions to the District s water distribution system accounted for about 1 percent of the increase in net assets. 5
31 Management s Discussion and Analysis December 31, 2017 Total operating revenues increased by $1.7 million or percent from the prior year. A combination of increased water sales and an increase in water rates accounts for most of this increase. Water consumption by the District customers increased in FY2017 compared with consumption in FY2016 as the state-wide drought conditions lifted. Operating expenses also increased in 2017 by $632,529, or 6.8 percent from prior year, due to increases in operating costs such as GASB 68 CalPERS unfunded liability and cost of materials and supplies used to operate and maintain the District s water distribution system and groundwater production wells. CAPITAL ASSETS AND DEBT ADMINISTRATION Capital Assets As of December 31, 2017, the District s investment in capital assets, net of related debt, was $53,886,153, including: the water transmission and distribution system (underground pipelines, water services, water meters, fire hydrants, and other components), water production facilities (groundwater wells), land, buildings and both mobile and fixed equipment. Replacement of aging pipelines and water service connections throughout the District s system continued to represent the majority of the $3.5 million additions to the District s capital assets in A number of private development projects resulted in the addition of $55,813 in donated capital assets. Additional information on the District s capital assets can be found in Note 3, Capital Assets, of the notes to the basic financial statements. Debt Administration The District continues to meet its debt obligations under its 2010 Refunded Certificates of Participation (COPs) and the 2012 Revenue Refunding bonds. Through scheduled debt service payments during 2017, principal on its collective debt was reduced by $599,819. The District s total debt from its COP and bond issuances now stands at approximately $3.7 million. Total compensated absences (long-term liability and current portion combined), are composed of leave hours earned by employees that are payable upon termination or retirement and are valued at $378,339 at the end of 2017, a decrease from the FY2016 year-end amount of $333,080. This reduction was due primarily to cash payments for accrued leave balances during the year to two departing employees. The accrual for other post-employment benefits increased by $95,772 in 2017 as a result of the annual cost of these benefits exceeding the amounts currently paid for premiums. Additional information on the District s debt activity can be found in Note 4, Long-Term Liabilities, of the notes to the basic financial statements. 6
32 Management s Discussion and Analysis December 31, 2017 ECONOMIC FACTORS AND FUTURE BUDGET CONSIDERATIONS The District continued to exercise fiscal restraint in budgeting for District operations in 2018, with an overall increase of 20 percent compared with the 2017 Operating Budget. This budget includes: Maintaining the current level of services and programs for District customers; An 8% aggregate increase of treated water cost from San Juan Water District due to projected 9% rate increase and anticipated increase in consumption. The projected quantity of water estimated to be purchased is 12,500 AF, which is greater than the projected 2017 total water purchased; Employee benefit net cost increase of about $188,000. A number of factors contributed to the overall increase, including PERS UAL (Unfunded Actuarial Liability), payment of $360,000 as recommended by CalPERS as approved by the Board to fund at the 15-year amortization schedule, an increase in new employees whose CalPERS contribution rates are lower, Board also approved the funding of Other Post-Employment Benefits (OPEB) UAL at a 20-year amortization schedule, lower total healthcare premiums as a result of new employees replacing long-term employees who were at higher premium points, and an increase of 12% in healthcare premium costs; Professional contract services increase of about $475,000 for use towards the Project 2030 Study, as we move forward to plan our mains replacements beyond Additionally, advanced planning for a District-wide meter replacement program and District Easements Study. Includes $435,000 in transfers to the Capital Improvement Reserves, a transfer of $100,000 to replenish the Rate Stabilization Reserve, $100,000 to the Water Supply Reserve, $50,000 to the Water Efficiency Reserve, $1.15 million to the Water Supply Reserve and, $300,000 to the Water Meter Replacement Reserve. A 2018 Operating Budget Summary is included at the conclusion of this Management s Discussion and Analysis to provide an overview of the District s operating budget. The District plans to rebuild its financial reserves to a level that supports a higher level of capital investment from reserves. Total capital improvement expenditures budgeted for FY2018 are about $6.6 million compared with $5.8 million in FY2017. This amount includes about $1.7 million in carry-over projects from prior years, and about $4.9 million in new projects for FY2018. Installation of new fire hydrants as well as replacements and upgrades for $154,500, four water main replacement or installation projects, scheduled to start design, will be undertaken in 2018 with construction targeted for 2019 at a total cost of $1.1 million. Operations equipment replacements and new equipment purchases totaling $145,000 are planned for
33 Management s Discussion and Analysis December 31, 2017 A 2018 Capital Improvement Budget Summary is included at the conclusion of this Management s Discussion and Analysis to provide an overview of the District s capital improvement budget. A significant but declining portion of the District s budget continues to be the repayment of long-term debt financing in the form of Certificates of Participation originally issued in 2000 (refunded in 2010) and Certificates of Participation originally issued in 2003 (refunded as Revenue Refunding Bonds in 2012). The annual debt service for these two issuances is budgeted at $735,936 for FY2018. The District s Board of Directors levied a water rate increase designed to achieve an overall increase in water rate revenues of 3 percent for The District utilized a detailed cost-ofservice and financial plan study set in place in FY2013 to determine the increase, taking into consideration the statewide water mandates, capital improvement program, and water meter reserves. The increase in revenues resulting from the FY2018 water rates will provide additional revenue to offset rising operating costs and the increasing costs of reinvestment in the District s aging water transmission and distribution infrastructure. The District anticipates the need to consider future annual water rate increases to fund replacement of portions of the District s 265 miles of underground water mains, and to pay the continually-rising operating costs of the District, while maintaining financial reserves to comply with debt covenants and to provide funds for emergencies or catastrophic losses. The financial plan adopted by the Board of Directors in FY2013 contemplates water rate increases in the 3 percent range every year through FY2019. However, water rates for years beyond FY2018 have not been adopted by the Board of Directors. 8

34 Management s Discussion and Analysis December 31, 2017 CITRUS HEIGHTS WATER DISTRICT 2018 OPERATING BUDGET SUMMARY Adopted: November 08, 2017 Expense Category 2016 Budget 2016 Actual 2017 Budget 2017 Projected 2018 Proposed Budget % Change 2016 vs Salary & Benefits $ 3,597,333 $ 3,429,887 $ 3,872,783 $ 3,785,539 $ 4,422, % Customer Service & Administration $ 1,113,405 $ 1,181,847 $ 1,119,894 $ 1,097,820 $ 1,712, % Debt Service $ 740,263 $ 189,433 $ 738,738 $ 738,738 $ 735, % Pumping and Well Maintenance $ 266,904 $ 158,893 $ 228,384 $ 169,990 $ 175, % Transmission and Distribution $ 547,960 $ 885,006 $ 841,992 $ 600,461 $ 1,413, % Water Demand Management $ 428,500 $ 210,349 $ 433,905 $ 204,452 $ 616, % Water Purchases $ 2,387,701 $ 2,190,061 $ 2,851,387 $ 2,737,020 $ 3,080, % $ 9,082,066 $ 8,245,477 $ 10,087,082 $ 9,334,020 $ 12,156, % 9

35 Management s Discussion and Analysis December 31, 2017 Citrus Heights Water District 2018 CAPITAL PROJECTS BUDGET SUMMARY Adopted: November 08, 2017 Category 2017 Adopted Budget 2018 Proposed Budget Total Project Budget Distribution Mains - Replacement 87,836 1,249,433 1,328,793 Fleet and Equipment Improvements/Replacements 861, , ,000 Miscellaneous Projects 250, , ,000 Transmission Mains - Replacement 146, , ,895 Water Meters - Emergency Intertie Water Meters 41,995 48,327 48,327 Water Production / Treatment / Storage Facilities 1,005,000 1,127,500 1,247,500 Water Meter Replacements 100, , ,000 Service Replacements 923,000 1,876,243 1,876,243 Grand Total $ 3,416,266 $ 6,204,462 $ 6,625,758 10
36 Basic Financial Statements
37 BALANCE SHEETS DECEMBER 31, 2017 AND 2016 ASSETS CURRENT ASSETS Cash and investments (Note 2) $12,058,984 $9,738,990 Restricted - cash and investments (Note 2) 535, ,796 Accounts receivable, net 2,432,542 2,002,102 Due from other governments 662,991 1,246 Accrued interest receivable 23,519 15,272 Inventory 235, ,637 Prepaid expenses and other deposits 299, ,642 Total current assets 16,248,823 12,843,685 NON-CURRENT ASSETS Non-depreciable capital assets (Note 3) 2,836,183 1,126,441 Depreciable capital assets, net (Note 3) 54,202,717 54,951,565 Total non-current assets 57,038,900 56,078,006 TOTAL ASSETS 73,287,723 68,921,691 DEFERRED OUTFLOWS OF RESOURCES Deferred amount from refunding debt 35,889 48,940 Pension related (Note 7) 1,946, ,792 TOTAL DEFERRED OUTFLOWS OF RESOURCES 1,981, ,732 TOTAL ASSETS AND DEFERRED OUTFLOWS OF RESOURCES $75,269,620 $69,686,423 LIABILITIES CURRENT LIABILITIES Accounts payable $670,330 $368,716 Retentions payable 76,613 21,028 Accrued payroll 65,476 59,301 Accrued interest payable 52,987 57,909 Deposits payable 374, ,011 Current portion of long-term liabilities: Compensated absences (Note 4) 206, ,931 Long-term debt (Note 4) 585, ,000 Total current liabilities 2,031,682 1,618,896 NON-CURRENT LIABILITIES Long-term liabilities - due in more than one year: Compensated absences (Note 4) 171, ,149 Long-term debt (Note 4) 3,112,847 3,732,666 Net pension liability (Note 7) 4,155,588 3,351,422 Net OPEB obligation (Note 8) 840, ,755 Total non-current liabilities 8,280,325 7,955,992 TOTAL LIABILITIES 10,312,007 9,574,888 DEFERRED INFLOWS OF RESOURCES Deferred amount from refunding debt 26,522 27,847 Pension related (Note 7) 162, ,947 TOTAL DEFERRED INFLOWS OF RESOURCES 188, ,794 NET POSITION (Note 6) Net investment in capital assets 53,886,153 52,335,229 Restricted for debt service 535, ,796 Unrestricted 10,347,199 6,782,716 TOTAL NET POSITION 64,769,085 59,651,741 TOTAL LIABILITIES, DEFERRED INFLOWS OF RESOURCES AND NET POSITION $75,269,620 $69,686,423 See accompanying notes to financial statements 12
38 STATEMENTS OF REVENUES, EXPENSES AND CHANGES IN NET POSITION FOR THE YEARS ENDED DECEMBER 31, 2017 AND 2016 OPERATING REVENUES Water sales $13,448,691 $11,602,622 Connection and other fees 594, ,435 Total operating revenues 14,043,049 12,325,057 OPERATING EXPENSES Customer service, administration and general 2,543,736 2,342,957 Water purchases 2,692,482 2,190,061 Transmission and distribution 1,963,750 2,114,019 Pumping and well maintenance 145, ,776 Conservation 189, ,150 Depreciation and amortization 2,345,281 2,203,170 Total operating expenses 9,879,662 9,247,133 OPERATING INCOME 4,163,387 3,077,924 NONOPERATING REVENUES (EXPENSES) Investment income 63,531 38,313 Miscellaneous income 77,074 68,203 Groundwater transfers and sales 1,058,793 - Interest expense (145,911) (155,214) (Loss) gain on disposal of capital assets (155,343) (137,567) Total nonoperating revenues (expenses) 898,144 (186,265) Net income (loss) before capital contributions 5,061,531 2,891,659 CAPITAL CONTRIBUTIONS Grant revenue Capital contributions 55, ,688 Total capital contributions 55, ,403 CHANGES IN NET POSITION 5,117,344 3,789,062 NET POSITION, BEGINNING OF YEAR 59,651,741 55,862,679 NET POSITION, END OF YEAR $64,769,085 $59,651,741 See accompanying notes to financial statements 13
39 STATEMENTS OF CASH FLOWS FOR THE YEARS ENDED DECEMBER 31, 2017 AND CASH FLOWS FROM OPERATING ACTIVITIES Cash receipts from customers $13,668,194 $12,193,259 Cash paid to suppliers for goods and services (5,731,692) (4,071,755) Cash paid to employees for services (2,657,612) (2,875,090) Cash Flows from Operating Activities 5,278,890 5,246,414 CASH FLOWS FROM NONCAPITAL FINANCING ACTIVITIES Receipts from other net operating income 1,135,867 68,203 Cash Flows from Noncapital Financing Activities 1,135,867 68,203 CASH FLOWS FROM CAPITAL AND RELATED FINANCING ACTIVITIES Capital grant revenues 715 Acquisition and construction of capital assets (3,250,362) (2,410,946) Proceeds from sale of capital assets (155,343) 95,213 Principal payments on long-term debt (599,819) (579,820) Interest payments on long-term debt (150,833) (161,564) Cash Flows (used for) Capital and Related Financing Activities (4,156,357) (3,056,402) CASH FLOWS FROM INVESTING ACTIVITIES Interest earnings 63,531 38,313 Groundwater transfers and sales Cash Flows from Investing Activities 63,531 38,313 NET CASH FLOWS 2,321,931 2,296,528 Cash, beginning of year 10,272,786 7,976,258 Cash, end of year $12,594,717 $10,272,786 Reconciliation of cash and cash equivalents to statement of net position: Cash and cash equivalents $12,058,984 $9,738,990 Restricted - cash and cash equivalents 535, ,796 Total cash and cash equivalents $12,594,717 $10,272,786 (Continued) 14
40 STATEMENTS OF CASH FLOWS FOR THE YEARS ENDED DECEMBER 31, 2017 AND 2016 RECONCILIATION OF NET INCOME FROM OPERATIONS TO NET CASH PROVIDED BY OPERATING ACTIVITIES: Net income from operations $4,163,387 $3,077,924 Adjustments to reconcile operating income to net cash provided by operating activities: Depreciation and amortization 2,345,281 2,203,170 Change in assets and liabilities: (Increase) decrease in assets and deferred outflows of resources: Accounts receivable (430,440) (33,213) Inventory 24,170 17,276 Prepaid expenses and other assets (676,937) 689,971 Deferred amount from refunding of debt 13,051 13,051 Increase (decrease) in liabilities and deferred inflows of resources: Accounts payable 301,614 (48,962) Accrued payroll 6,175 13,271 Deposits payable 33,289 3,402 Retentions payable 55,585 (98,585) Accrued other postemployment benefits 95,772 51,942 Compensated absences 45,259 (18,235) Deferred amount from refunding of debt (1,325) (1,325) Net pension liability and related deferred inflows and outflows (695,991) (623,273) Net cash provided by operating activities $5,278,890 $5,246,414 SUPPLEMENTAL DISCLOSURE OF NON-CASH ACTIVITIES Receipt of contributed assets $55,813 $896,688 See accompanying notes to financial statements 15
41 This Page Left Intentionally Blank
42 NOTES TO BASIC FINANCIAL STATEMENTS For the Years Ended December 31, 2017 and 2016 NOTE 1 REPORTING ENTITY AND SUMMARY OF SIGNIFICANT ACCOUNTING POLICIES Reporting Entity: The District was established on October 25, 1920 as an irrigation district under Division 11 of the Act of Legislature of the State of California. The District constructs and maintains waterworks and supplies domestic water in an area of approximately 12 square miles to about 19,600 connections in Sacramento and Placer counties with an estimated population of 66,000. The District is governed by a Board of Directors consisting of three directors elected by residents of the District. The accompanying basic financial statements present the District and its component unit. The component unit discussed below is included in the District s reporting entity because of the significance of its operational and financial relationship with the District. The District has created the Citrus Heights Water District Financing Corporation (the Corporation) to provide assistance to the District in the issuance of debt. Although legally separate from the District, the Corporation is reported as if it were part of the primary government because it shares a common Board of Directors with the District and its sole purpose is to provide financing to the District under the debt issuance documents of the District. Debt issued by the Corporation is reflected as debt of the District in these financial statements. The Corporation has no other transactions and does not issue separate financial statements. Basis of Presentation Fund Accounting: The basic financial statements of the Citrus Heights Water District (District) have been prepared in conformity with generally accepted accounting principles as applied to government units. The Governmental Accounting Standards Board (GASB) is the accepted standard setting body for establishing governmental accounting and financial reporting principles. The District is accounted for as an enterprise fund and applies all applicable GASB pronouncements in its accounting and reporting. The more significant of the District s accounting policies are described below. The District s resources are allocated to and accounted for in these basic financial statements as an enterprise fund type of the proprietary fund group. The enterprise fund is used to account for operations that are financed and operated in a manner similar to private business enterprises, where the intent of the governing body is that the costs (expenses, including depreciation) of providing goods or services to the general public on a continuing basis be financed or recovered primarily through user charges, or where the governing body has decided that periodic determination of revenues earned, expenses incurred, and/or net income is appropriate for capital maintenance, public policy, management control, accountability, or other policies. Net position for the enterprise fund represents the amount available for future operations. Basis of Accounting: The accounting and financial reporting treatment applied to a fund is determined by its measurement focus. The enterprise fund type is accounted for on a flow of economic resources measurement focus. With this measurement focus, all assets, deferred outflows, liabilities, and deferred inflows associated with the operation of this fund are included on the balance sheet. Net position is segregated into amounts invested in capital assets, net of related debt, amounts restricted and amounts unrestricted. Enterprise fund type operating statements present increases (i.e., revenues) and decreases (i.e., expenses) in net total position. The District uses the accrual basis of accounting. Under this method, revenues are recorded when earned and expenses are recorded at the time liabilities are incurred. When such funds are received they are recorded as unearned revenue until earned. Earned but unbilled water services are accrued as revenue. 17
43 NOTES TO BASIC FINANCIAL STATEMENTS For the Years Ended December 31, 2017 and 2016 NOTE 1 REPORTING ENTITY AND SUMMARY OF SIGNIFICANT ACCOUNTING POLICIES (Continued) Water lines are constructed by private developers and then dedicated to the District, which is then responsible for their future maintenance. These lines are recorded as capital contributions when they pass inspection by the District, and the estimated costs are capitalized as donated pipelines. Operating revenues and expenses consist of those revenues and expenses that result from the ongoing principal operations of the District. Operating revenues consist primarily of charges for services. Nonoperating revenues and expenses consist of those revenues and expenses that are related to financing and investing types of activities and result from nonexchange transactions or ancillary activities. When both restricted and unrestricted resources are available for use, it is the District s policy to use restricted resources first, then unrestricted resources as they are needed. Use of Estimates: The preparation of financial statements in conformity with generally accepted accounting principles requires management to make estimates and assumptions that affect the reported amounts of assets and liabilities and disclosure of contingent assets and liabilities at the date of the financial statements and the reported amounts of revenues and expenses during the reporting period. Actual results could differ from those estimates. Fair Value Measurements: Fair value is defined as the price that would be received to sell an asset or paid to transfer a liability in an orderly transaction between market participants at the measurement date. The District categorizes its fair value measurements within the fair value hierarchy established by generally accepted accounting principles. The fair value hierarchy categorizes the inputs to valuation techniques used to measure fair value into three levels based on the extent to which inputs used in measuring fair value are observable in the market. Level 1 inputs are quoted prices (unadjusted) in active markets for identical assets or liabilities. Level 2 inputs are inputs other than quoted prices included within level 1 that are observable for an asset or liability, either directly or indirectly. Level 3 inputs are unobservable inputs for an asset or liability. If the fair value of an asset or liability is measured using inputs from more than one level of the fair value hierarchy, the measurement is considered to be based on the lowest priority level input that is significant to the entire measurement. Cash and Cash Equivalents: For purposes of the statement of cash flows, the District considers all highly liquid debt instruments purchased with a maturity of three months or less to be cash equivalents. Cash and cash equivalents held include bank deposits and restricted and unrestricted investments in money market mutual funds and LAIF. Restricted Assets: Certain proceeds of the District s long-term debt are classified as restricted investments on the balance sheet because their use is limited by applicable debt covenants. Investments: Investments are stated at their fair value, which represents the quoted or stated market value. Investments that are not traded on a market, such as investments in external pools, are valued based on the stated fair value as represented by the external pool. 18
44 NOTES TO BASIC FINANCIAL STATEMENTS For the Years Ended December 31, 2017 and 2016 NOTE 1 REPORTING ENTITY AND SUMMARY OF SIGNIFICANT ACCOUNTING POLICIES (Continued) Inventory: Inventory consists primarily of materials used in the construction and maintenance of the water distribution facilities and is valued on a first-in, first-out basis. Prepaids: Prepaids consist primarily of insurance, maintenance agreements and other prepaid assets. Capital Assets: Capital assets are recorded at historical cost. Donated assets are valued at estimated fair value on the date received. Self-constructed assets are recorded based on the amount of direct labor, material, and certain overhead charged to the asset construction. Depreciation is calculated using the straight-line method over the following estimated useful lives: Description Pipeline and infrastructure Equipment and machinery Buildings Well improvements Donated pipelines Improvements Useful Life years 5-10 years years 40 years 40 years 40 years Depreciation expense aggregated $2,334,743 and $2,187,515 for the years ended December 31, 2017 and 2016, respectively, and is included with depreciation and amortization expense. Maintenance and repairs are charged to operations when incurred. It is the District s policy to capitalize all capital assets with a cost of more than $1,000 for tangible personal property and $3,000 for infrastructure, building or improvements. Costs of assets sold or retired (and the related amounts of accumulated depreciation) are eliminated from the balance sheet in the year of sale or retirement, and the resulting gain or loss is recognized in operations. Bond Premiums and Bond Issuance Costs: Bond premiums are deferred and amortized over the lives of the bonds. Long-term liabilities are reported net of the applicable bond premiums. Bond issuance costs are recognized as an expense in the period incurred. Deferred Amount from Refunding Debt: The difference between the reacquisition price of refunded debt and the net carrying amount of the previously outstanding debt is deferred and reported as either a deferred outflow or deferred inflow on the balance sheet. These amounts are amortized over the shorter of the term of the old debt or the new debt. Deferred Outflows: In addition to assets, the balance sheet reports a separate section for deferred outflows of resources. This separate financial statement element, deferred outflows of resources, represents a consumption of net position or fund balance that applies to a future period(s) and so will not be recognized as an outflow of resources (expense/expenditure) until then. Deferred Inflows: In addition to liabilities, the balance sheet reports a separate section for deferred inflows of resources. This separate financial statement element, deferred inflows of resources, represents an acquisition of net position or fund balance that applies to a future period(s) and so will not be recognized as an inflow of resources (revenue) until that time. 19
45 NOTES TO BASIC FINANCIAL STATEMENTS For the Years Ended December 31, 2017 and 2016 NOTE 1 REPORTING ENTITY AND SUMMARY OF SIGNIFICANT ACCOUNTING POLICIES (Continued) Compensated Absences: The District s policy allows employees to accumulate earned but unused annual leave, management leave and compensatory time-off which will be paid to employees upon separation from service to the District. The cost of annual leave, management leave and compensatory time-off is recognized in the period earned. Upon death while employed by the District or retirement from the District, employees are paid one-third of their accumulated sick leave time. This amount is also recognized in the period earned. New Pronouncements: Management adopted the provisions of the following Governmental Accounting Standards Board (GASB) Statements, which became effective during the year ended December 31, 2017: GASB Statement No. 80 Blending requirements for Certain Component Units an amendment of GASB Statement No. 14 The objective of this statement is to improve financial reporting by clarifying the financial statement presentation requirements for certain component units of all states and local governments. This Statement amends the blending requirements established in paragraph 53 of Statement No. 14, The Financial Reporting Entity, as amended. The additional criterion requires blending of a component unit incorporated as a not-for-profit corporation in which the primary government is the sole corporate member. This statement had no effect on the financial statements. GASB Statement No. 82 Pension Issues an amendment of GASB Statements No. 67, No. 68, and No. 73 The objective of this Statement is to address certain issues that have been raised with respect to Statements No. 67, Financial Reporting for Pension Plans, No. 68, Accounting and Financial Reporting for Pensions and Related Assets That Are Not within the Scope of GASB Statement 68, and Amendments to Certain Provisions of GASB Statements 67 and 68. Specifically, this Statement addresses issues regarding (1) the presentation of payroll-related measures in required supplementary information (2) the selection of assumptions and the treatment of deviations from the guidance in an Actuarial Standard of Practice for financial reporting purposes, and (3) the classification of payments made by employers to satisfy employee (plan member) contribution requirements. This Statement had no effect on the financial statements. NOTE 2 CASH AND INVESTMENTS Cash and investments as of December 31 are classified in the accompanying financial statements as follows: Cash and investments $12,058,984 $9,738,990 Restricted cash and investments 535, ,796 Total cash and investments $12,594,717 $10,272,786 20
46 NOTES TO BASIC FINANCIAL STATEMENTS For the Years Ended December 31, 2017 and 2016 NOTE 2 CASH AND INVESTMENTS (Continued) Cash and investments as of December 31 consisted of the following: Cash on hand $550 $550 Deposits with financial institutions 5,948,171 3,669,028 Total cash 5,948,721 3,669,578 Investments in Local Agency Investment Fund (LAIF) 6,110,263 6,069,412 Held by fiscal agent: Money market mutual fund 535, ,796 Total investments 6,645,996 6,603,208 Total cash and investments $12,594,717 $10,272,786 Investment Policy: California statutes authorize districts to invest idle, surplus, or reserve funds in a variety of credit instruments as provided for in the California Government Code, Section The table below identifies the investment types that are authorized for the District by the California Government Code (or the District s investment policy, where more restrictive) that address interest rate risk, credit risk, and concentration of credit risk. This table does not address investments of debt proceeds held by the bond trustee that are governed by the provisions of debt agreements of the District, rather than the general provisions of the California Government Code or the District s investment policy. During the year ended December 31, 2017, the District s permissible investments included the following instruments: Maximum Maximum Maximum Percentage Investment Authorized Investment Type Maturity of Portfolio* In One Issuer Local Agency Investment Program 5 years None None U.S. Treasury Obligations 5 years None None U.S. Agency Securities 5 years None None State of California Obligations 5 years None None Bankers Acceptances 180 days 40% 30% Commercial Paper 270 days 40% 10% Negotiable Certificates of Deposits 5 years 30% None Medium Term Corporate Notes 5 years 30% None Money Market Mutual Funds N/A 20% 10% Mortgage Pass-through Securities 5 years 20% No Limit LAIF N/A None No Limit Passbook Deposits 45 days None None Supranationals 5 years 30% None * Excluding amounts held by the bond trustee that are not subject to California Government Code restrictions The District complied with the provisions of the California Government Code (or the District s investment policy, where more restrictive) pertaining to the types of investments held, the institutions in which deposits were made, and the security requirements. The District will continue to monitor compliance with applicable statutes pertaining to public deposits and investments. 21
47 NOTES TO BASIC FINANCIAL STATEMENTS For the Years Ended December 31, 2017 and 2016 NOTE 2 CASH AND INVESTMENTS (Continued) Investments Authorized by Debt Agreements: Investment of debt proceeds held by the bond trustee are governed by provisions of the debt agreements, rather than the general provisions of the California Government Code or the District s investment policy. The Certificates of Participation debt agreements contain certain provisions that address interest rate risk and credit risk, but not concentration of credit risk. Maximum Maximum Maximum Percentage Investment Authorized Investment Type Maturity of Portfolio in One Issuer Local Agency Investment Program None None None U.S. Treasury Obligations None None None U.S. Agency Securities None None None Bankers Acceptances 1 year None None Commercial Paper None None None Negotiable Certificates of Deposits None None None Investment Agreements None None None Repurchase Agreements None None None Money Market Mutual Funds N/A None None LAIF N/A None None Fair Value Hierarchy: The District categorizes its fair value measurements within the fair value hierarchy established by generally accepted accounting principles. The hierarchy is based on the valuation inputs used to measure fair value of the assets. Level 1 inputs are quoted prices in an active market for identical assets; Level 2 inputs are significant other observable inputs; and Level 3 inputs are significant unobservable inputs. The following is a summary of the fair value hierarchy of the fair value of investments of the District as of December 31, 2017: Level 1 Total Investments by Fair Value Level: Money Market Mutual Fund $535,733 $535,733 Total Investments $535, ,733 Investments Measured at Amortized Cost: Money Market Mutual Fund 530,717 Cash in banks and on hand 5,418,004 Total Cash and Investments subject to Fair Value Hierarchy 6,484,454 Investments not subject to Fair Value Hierarchy California Local Agency Investment Fund (LAIF) 6,110,263 Total Cash and Investments $12,594,717 22
48 NOTES TO BASIC FINANCIAL STATEMENTS For the Years Ended December 31, 2017 and 2016 NOTE 2 CASH AND INVESTMENTS (Continued) The following is a summary of the fair value hierarchy of the fair value of investments of the District as of December 31, 2016: Level 1 Total Investments by Fair Value Level: Money Market Mutual Fund $533,796 $533,796 Total Investments $533, ,796 Investments Measured at Amortized Cost: Money Market Mutual Fund 530,488 Cash in banks and on hand 3,139,090 Total Cash and Investments subject to Fair Value Hierarchy 4,203,374 Investments not subject to Fair Value Hierarchy California Local Agency Investment Fund (LAIF) 6,069,412 Total Cash and Investments $10,272,786 Interest Rate Risk: Interest rate risk is the risk that changes in market interest rates will adversely affect the fair value of an investment. Generally, the longer the maturity of an investment, the greater the sensitivity of its fair value to changes in market interest rates. One of the ways the District manages its exposure to interest rate risk is by purchasing a combination of shorter term and longer term investments, and by timing cash flows from maturities so that a portion of the portfolio is maturing, or coming close to maturity, evenly over time, as necessary to provide the cash flow and liquidity needed for operations. All of the District s investments mature in 12 months or less. Credit Risk: Generally, credit risk is the risk that an issuer of an investment will not fulfill its obligation to the holder of the investment. This is measured by the assignment of a rating by a nationally recognized statistical rating organization. Presented below is the minimum rating required by (where applicable) the California Government Code, the District s investment policy, or debt agreements, and the actual rating as of year-end for each investment type for the year ended December 31, Minimum Ratings as Legal of Year End Rating AAAm Not Rated Total LAIF N/A $6,110,263 $6,110,263 Held by bond trustee: Money market mutual funds AAAm $535, ,733 $535,733 $6,110,263 $6,645,996 23
49 NOTES TO BASIC FINANCIAL STATEMENTS For the Years Ended December 31, 2017 and 2016 NOTE 2 CASH AND INVESTMENTS (Continued) The following is a summary of the minimum rating required by (where applicable) the California Government Code, the District s investment policy, or debt agreements, and the actual rating as of yearend for each investment type for the year ended December 31, Minimum Ratings as Legal of Year End Rating AAAm Not Rated Total LAIF N/A $6,069,412 $6,069,412 Held by bond trustee: Money market mutual funds AAAm $533, ,796 $533,796 $6,069,412 $6,603,208 Concentration of Credit Risk: The investment policy of the District limits the amount that can be invested in any one issuer to the lesser of the amount stipulated by the California Government Code or 5% of total investments, with the exception of U.S. Treasury obligations, U.S. Agency Securities, and LAIF. There are no investments in any one issuer (other than mutual funds and external investment pools) that represent 5% or more of total District investments. Custodial Credit Risk: Custodial credit risk for deposits is the risk that, in the event of the failure of a depository financial institution, the District will not be able to recover its deposits or will not be able to recover collateral securities that are in the possession of an outside party. Under California Government Code Section 53651, depending on specific types of eligible securities, a bank must deposit eligible securities posted as collateral with its Agent having a fair value of 105% to 150% of the District s cash on deposit. All of the District s deposits are either insured by the Federal Depository Insurance Corporation (FDIC) or collateralized with pledged securities held in the trust department of the financial institutions in the District s name. Investment in LAIF: The District is a voluntary participant in the Local Agency Investment Fund (LAIF) that is regulated by California Government Code Section under the oversight of the Treasurer of the State of California. The District reports its investment in LAIF at the fair value amount provided by LAIF. The balance available for withdrawal is based on the accounting records maintained by LAIF, which are recorded on an amortized cost basis. Included in LAIF s investment portfolio are collateralized mortgage obligations, mortgage-backed securities, other asset-backed securities, loans to certain state funds, and floating rate securities issued by federal agencies, government-sponsored enterprises, and corporations. At December 31, 2017 and 2016, respectively, these investments matured in an average of 186 and 171 days. 24
50 NOTES TO BASIC FINANCIAL STATEMENTS For the Years Ended December 31, 2017 and 2016 NOTE 3 CAPITAL ASSETS Capital asset activity for the years ended December 31, 2017 and 2016 are as follows: Balance Balance December 31, 2016 Additions Retirements Transfers December 31, 2017 Capital assets not being depreciated: Land $955,683 $955,683 Right of ways 26,080 26,080 Construction in progress 144,678 $3,419,838 ($13,947) ($1,696,149) 1,854,420 Total capital assets not being depreciated 1,126,441 3,419,838 (13,947) (1,696,149) 2,836,183 Capital assets being depreciated: Improvements 55,847 55,847 Pipelines and infrastructure 58,852,269 (1,355,041) 1,381,268 58,878,496 Equipment and machinery 3,185,591 9,213 (94,019) 313,157 3,413,942 Buildings and improvements 2,776,214 1,724 2,777,938 Well improvements 7,604,268 7,604,268 Donated pipelines 17,380,532 55,813 (219) 17,436,126 Total capital assets being depreciated 89,854,721 65,026 (1,449,279) 1,696,149 90,166,617 Less accumulated depreciation for: Improvements (37,874) (783) (38,657) Pipelines and infrastructure (20,479,755) (1,452,783) 1,223,936 (20,708,602) Equipment and machinery (2,488,814) (171,500) 49,844 (2,610,470) Buildings and improvements (810,660) (71,455) (882,115) Well improvements (1,420,742) (189,869) (1,610,611) Donated pipelines (9,665,311) (448,353) 219 (10,113,445) Total accumulated depreciation (34,903,156) (2,334,743) 1,273,999 (35,963,900) Total capital assets being depreciated, net 54,951,565 (2,269,717) (175,280) 1,696,149 54,202,717 Capital Assets, net $56,078,006 $1,150,121 ($189,227) $57,038,900 25
51 NOTES TO BASIC FINANCIAL STATEMENTS For the Years Ended December 31, 2017 and 2016 NOTE 3 CAPITAL ASSETS (Continued) Balance Balance December 31, 2015 Additions Retirements Transfers December 31, 2016 Capital assets not being depreciated: Land $955,683 $955,683 Right of ways 26,080 26,080 Construction in progress 6,382,577 $2,410,946 ($79,222) ($8,569,623) 144,678 Total capital assets not being depreciated 7,364,340 2,410,946 (79,222) (8,569,623) 1,126,441 Capital assets being depreciated: Improvements 55,847 55,847 Pipelines and infrastructure 55,492,371 ($1,015,826) 4,375,724 58,852,269 Equipment and machinery 3,049,855 (2,744) 138,480 3,185,591 Buildings and improvements 1,466,585 1,309,629 2,776,214 Well improvements 4,858,478 2,745,790 7,604,268 Donated pipelines 16,502, ,688 (19,010) 17,380,532 Total capital assets being depreciated 81,425, ,688 (1,037,580) 8,569,623 89,854,721 Less accumulated depreciation for: Improvements (37,092) (782) (37,874) Pipelines and infrastructure (19,955,970) (1,379,953) 856,168 (20,479,755) Equipment and machinery (2,313,889) (177,669) 2,744 (2,488,814) Buildings and improvements (738,205) (72,455) (810,660) Well improvements (1,292,086) (128,656) (1,420,742) Donated pipelines (9,246,766) (428,000) 9,455 (9,665,311) Total accumulated depreciation (33,584,008) (2,187,515) 868,367 (34,903,156) Total capital assets being depreciated, net 47,841,982 (1,290,827) ($169,213) 8,569,623 54,951,565 Capital Assets, net $55,206,322 $1,120,119 ($248,435) $56,078,006 Capacity Entitlements: From 1993 through 1998, the District participated with four other water agencies in a cooperative transmission pipeline project for the construction of additional transmission pipeline facilities. The District s share of these pipeline costs totaled $5,636,711. The Capacity Entitlements asset represents the capacity rights the District has purchased in the cooperative transmission pipeline project owned by San Juan Water District. The asset is being amortized over the pipeline s estimated useful life of forty years. NOTE 4 LONG-TERM LIABILITIES Long-term liabilities consist of the following: 2010 Certificates of Participation: In 2010, the District issued $5,155,000 of Revenue Certificates of Participation (Certificates) with an interest rate of 4.00%. These 2010 Certificates were issued to retire the 2000 Certificates of Participation, which were issued to finance certain capital improvements to the District s water system. The District is required to collect rates and charges from its water system that will be sufficient to yield net revenues equal to 110% of debt service payments on any future debt issued, and to deposit the net revenues in a revenue fund pledged for such future debt service payments. Annual principal payments, ranging from $450,000 to $545,000 are due on September 28 through September 28, 2020 and semi-annual interest payments, ranging from $10,900 to $59,600 are due on March 28 and September 28 through September 28,
52 NOTES TO BASIC FINANCIAL STATEMENTS For the Years Ended December 31, 2017 and 2016 NOTE 4 LONG-TERM LIABILITIES (Continued) 2012 Revenue Refunding Bonds: In April 2012, the District issued $2,275,000 of Revenue Refunding Bonds with interest rates ranging from 3.00% to 5.25%. These 2012 Revenue Refunding Bonds were issued to retire the 2003 Certificates of Participation, which were issued to finance the cost of certain capital improvements to the District s water system. The District is required to collect rates and charges from its water system that will be sufficient to yield net revenues equal to 110% of debt service payments on any future debt issued, and to deposit the net revenues in a revenue fund pledged for such future debt service payments. Annual principal payments, ranging from $70,000 to $160,000 are due on February 1 through February 1, 2033, and semi-annual interest payments, ranging from $4,200 to $48,600 are due on February 1 and August 1, through February 1, The activity of the District s long-term liabilities during the years ended December 31, 2017 and 2016 was as follows: Balance Balance Current December 31, 2016 Additions Retirements December 31, 2017 Portion 2010 Certificates of Participation $2,060,000 ($485,000) $1,575,000 $505,000 4%, due 9/28/ Revenue Refunding Bonds 1,950,000 (80,000) 1,870,000 80, %, due 2/1/33 Less: Unamortized premiums 287,666 (34,819) 252,847 4,297,666 (599,819) 3,697, ,000 Net pension liability 3,351,422 $804,166 4,155,588 Net OPEB obligation 744, ,000 (42,228) 840,527 Compensated absences 333, ,536 (188,277) 378, ,976 Total Long-Term Liabilities $8,726,923 $1,175,702 ($830,324) $9,072,301 $791,976 Balance Balance Current December 31, 2015 Additions Retirements December 31, 2016 Portion 2010 Certificates of Participation $2,530,000 ($470,000) $2,060,000 $485,000 4%, due 9/28/ Revenue Refunding Bonds 2,025,000 (75,000) 1,950,000 80, %, due 2/1/33 Less: Unamortized premiums 322,486 (34,820) 287,666 4,877,486 (579,820) 4,297, ,000 Net pension liability 3,358,940 (7,518) 3,351,422 Net OPEB obligation 692,813 $101,648 (49,706) 744,755 Compensated absences 351,315 71,172 (89,407) 333, ,931 Total Long-Term Liabilities $9,280,554 $172,820 ($726,451) $8,726,923 $770,931 27
53 NOTES TO BASIC FINANCIAL STATEMENTS For the Years Ended December 31, 2017 and 2016 NOTE 4 LONG-TERM LIABILITIES (Continued) The annual requirements to amortize the outstanding debt as of December 31, 2017 are as follows: 2010 Certificates of Participation 2012 Revenue Refunding Bonds Fiscal Year Ending December 31, Principal Interest Total Principal Interest Total 2018 $505,000 $63,000 $568,000 $80,000 $89,738 $169, ,000 42, ,800 85,000 86, , ,000 21, ,800 90,000 83, , ,000 79, , ,000 74, , , , , , , , ,000 8, ,400 Total $1,575,000 $127,600 $1,702,600 $1,870,000 $880,100 $2,750,100 Pledged Revenue: The District pledged future water system revenues, net of specified expenses, to repay the 2012 Revenue Refunding Bonds in an original amount of $2,275,000. Proceeds of the Revenue Refunding Bonds were used to refund the 2003 Certificates of Participation to finance capital improvements to the District s water system. The Revenue Refunding Bonds are payable solely from water customer net revenues, and are payable through February, Annual principal and interest payments on the Bonds are expected to require less than 80% of net revenues. Total principal and interest remaining to be paid on the Revenue Refunding Bonds was $2,750,100 and $2,923,038 at December 31, 2017 and 2016, respectively. The District pledged future water system revenues, net of specified expenses, to repay the 2010 Certificates of Participation in the original amount of $5,155,000. Proceeds of the Certificates of Participation funded the acquisition and construction of certain facilities, as indicated above. The Certificates of Participation are payable solely from water customer net revenues and are payable through September Annual principal and interest payments on the Certificates of Participation are expected to require less than 80% of net revenues. Total principal and interest remaining to be paid on the Certificates of Participation was $1,702,600 and $2,270,000 at December 31, 2017 and 2016, respectively. Total principal and interest paid on all debt payable from net revenues was $740,388 and $734,433 and the total water system net revenues were $5,905,941 and $5,261,062 for the years ended December 31, 2017 and 2016, respectively. At December 31, 2017 and 2016, the District s net revenues were 798% and 709% of debt service payments, respectively. NOTE 5 ARBITRAGE REBATE LIABILITY Section 148(f) of the Internal Revenue Code requires issuers of tax-exempt state and local bonds to remit to the federal government amounts equal to (a) the excess of the actual amounts earned on all Nonpurpose Investments allocable to Gross Proceeds of an issue of municipal obligations less the amount that would have been earned if the investments bore a rate equal to the amount that would have been earned if the investments bore a rate equal to the yield on the issue, plus (b) all income attributable to the excess. Issuers must make rebate payments at least once every five years and upon final retirement or redemption of the bonds. There was no arbitrage liability at December 31, 2017 and
54 NOTES TO BASIC FINANCIAL STATEMENTS For the Years Ended December 31, 2017 and 2016 NOTE 6 - NET POSITION Restrictions: Restricted net position consist of constraints placed on net asset use through external requirements imposed by creditors (such as through debt covenants), grantors, contributors, or laws and regulations of other governments or constraints by law through constitutional provisions or enabling legislation. Restricted net position at December 31, 2017 and 2016 consisted of the debt service reserve on the 2010 Certificates of Participation. The restrictions represent debt service and other reserves required by the related debt covenants. Designations: Designations of unrestricted net position may be imposed by the Board of Directors to reflect future spending plans or concerns about the availability of future resources. Designations may be modified, amended or removed by Board action. The designations are for the following: Designated for rate stabilization represents the amount to be used to ensure financial and customer rate stability in responding to certain conditions. Designated for operating reserve is maintained for operating funds collected in advance for the following year, accrued leave reserve, self-insurance reserve, unanticipated operating expenses, unanticipated economic shortfall, and unallocated funds. Designated for depreciation reserve represents amounts set aside to replace or rehabilitate capital facilities at the end of their useful life. Designated for capital improvement reserve represents amounts set aside for use in evaluating and constructing new capital facilities to benefit existing District customers. This reserve had a negative balance in past years due to large capital expenditures, including the meter retrofit program and well construction. Designated for fleet equipment reserve represents amounts set aside to replace fleet equipment at the end of its useful life. Designated for employment-related benefits reserve represents amounts set aside to pay the costs of employment-related benefits for existing and retired District employees. NOTE 7 DEFINED BENEFIT PENSION PLAN For purposes of measuring the net pension liability and deferred outflows/inflows of resources related to pensions, and pension expense, information about the fiduciary net position of the Plans and additions to/deductions from the Plans fiduciary net position have been determined on the same basis as they are reported by the CalPERS Financial Office. For this purpose, benefit payments (including refunds of employee contributions) are recognized when currently due and payable in accordance with the benefit terms. Investments are reported at fair value. 29
55 NOTES TO BASIC FINANCIAL STATEMENTS For the Years Ended December 31, 2017 and 2016 NOTE 7 DEFINED BENEFIT PENSION PLAN (Continued) A. General Information about the Pension Plans Plan Description and Summary of Balances by Plan All qualified permanent and probationary employees are eligible to participate in the District s Miscellaneous (all other) Employee Pension Rate Plan. The District s Miscellaneous Rate Plan is part of the public agency cost-sharing multiple-employer defined benefit pension plan (PERF C), which is administered by the California Public Employees Retirement System (CalPERS). PERF C consists of a miscellaneous pool and a safety pool (also referred to as risk pools ), which are comprised of individual employer miscellaneous and safety rate plans, respectively. Individual employers may sponsor more than one miscellaneous and safety rate plan. The employer participates in one cost-sharing multiple-employer defined benefit pension plan regardless of the number of rate plans the employer sponsors. The District sponsors one rate plan (miscellaneous). Benefit provisions under the Plan are established by State statute and District resolution. CalPERS issues publicly available reports that include a full description of the pension plan regarding benefit provisions, assumptions and membership information that can be found on the CalPERS website. Below is a summary of the deferred outflows of resources, net pension liabilities, and deferred inflows of resources by Plan for the year ended December 31, 2017: Net Pension Liability/ Deferred Proportionate Deferred Outflows Share of Net Inflows of Resources Pension Liability of Resources Miscellaneous $1,946,008 $4,155,588 $162,006 Benefits Provided CalPERS provides service retirement and disability benefits, annual cost of living adjustments and death benefits to plan members, who must be public employees and beneficiaries. Benefits are based on years of credited service, equal to one year of full time employment. All members are eligible for non-duty disability benefits after 10 years of service. The death benefit is one of the following: the Basic Death Benefit, the 1957 Survivor Benefit, or the Optional Settlement 2W Death Benefit. The cost of living adjustments for each plan are applied as specified by the Public Employees Retirement Law. The Pension Reform Act of 2013 (PEPRA), Assembly Bill 340, is applicable to employees new to CalPERS and hired after December 31, The Plans provisions and benefits in effect at December 31, 2017, are summarized as follows: Miscellaneous Miscellaneous Miscellaneous Tier 1 Tier 2 PEPRA Hire date Prior to January 1, 2013 Prior to January 1, 2013 On or after January 1, 2013 Benefit formula Benefit vesting schedule 5 years service 5 years service 5 years service Benefit payments monthly for life monthly for life monthly for life Retirement age Monthly benefits, as a % of eligible compensation 1.43% to 2.42% 1.43% to 2.42% 1.0% to 2.5% Required employee contribution rates 6.9% 6.9% 6.3% Required employer contribution rates 8.9% 8.4% 6.5% 30
56 NOTES TO BASIC FINANCIAL STATEMENTS For the Years Ended December 31, 2017 and 2016 NOTE 7 DEFINED BENEFIT PENSION PLAN (Continued) Beginning in fiscal year 2017, CalPERS collects employer contributions for the cost-sharing plan as a percentage of payroll for the normal cost portion as noted in the rates above and as a dollar amount for contributions toward the unfunded liability and side fund. The dollar amounts are billed on a monthly basis. The District s required contribution for the unfunded liability was $294,195 in fiscal year Contributions Section 20814(c) of the California Public Employees Retirement Law requires that the employer contribution rates for all public employers be determined on an annual basis by the actuary and shall be effective on the July 1 following notice of a change in the rate. Funding contributions for the Plan are determined annually on an actuarial basis as of June 30 by CalPERS. The actuarially determined rate is the estimated amount necessary to finance the costs of benefits earned by employees during the year, with an additional amount to finance any unfunded accrued liability. The District is required to contribute the difference between the actuarially determined rate and the contribution rate of employees. For the year ended December 31, 2017, the District s contributions to the Plan were as follows: Miscellaneous Tier I Tier II PEPRA Contributions - employer $431,307 $68,092 $18,299 B. Pension Liabilities, Pension Expenses and Deferred Outflows/Inflows of Resources Related to Pensions As of December 31, 2017 the District reported $4,155,588 in net pension liabilities for its proportionate shares of the net pension liability of the Plan. The District s net pension liability for the Plan is measured as the proportionate share of the net pension liability. The net pension liability of the Plan is measured as of June 30, 2017, and the total pension liability for the Plan used to calculate the net pension liability was determined by an actuarial valuation as of June 30, 2016 rolled forward to June 30, 2017 using standard update procedures. The District s proportion of the net pension liability was based on a projection of the District s long-term share of contributions to the pension plan relative to the projected contributions of all participating employers, actuarially determined. The District s proportionate share of the net pension liability for the Plan as of June 30, 2016 and 2017 was as follows: Miscellaneous Proportion - June 30, % Proportion - June 30, % Change - Increase (Decrease) % 31
57 NOTES TO BASIC FINANCIAL STATEMENTS For the Years Ended December 31, 2017 and 2016 NOTE 7 DEFINED BENEFIT PENSION PLAN (Continued) For the year ended December 31, 2017, the District recognized negative pension expense of $695,991. At December 31, 2017, the District reported deferred outflows of resources and deferred inflows of resources related to pensions from the following sources: Deferred Outflows Deferred Inflows of Resources of Resources Pension contributions subsequent to measurement date $517,698 Differences between actual and expected experience 16,687 ($3,824) Changes in assumptions (157,879) Change in employer's proportion and differences between the employer s contributions and the employer s proportionate share of contributions 589,914 (303) Net differences between projected and actual earnings on plan investments 821,709 Total $1,946,008 ($162,006) The $517,698 reported as deferred outflows of resources related to contributions subsequent to the measurement date will be recognized as a reduction of the net pension liability in the year ended December 31, Other amounts reported as deferred outflows of resources and deferred inflows of resources related to pensions will be recognized as pension expense as follows: Year Ended Annual June 30 Amortization 2018 $266, , , ,832 Sensitivity of the Proportionate Share of the Net Pension Liability to Changes in the Discount Rate The following presents the District s proportionate share of the net pension liability for the Plan, calculated using the discount rate for the Plan, as well as what the District s proportionate share of the net pension liability would be if it were calculated using a discount rate that is 1-percentage point lower or 1- percentage point higher than the current rate: Miscellaneous 1% Decrease 6.65% Net Pension Liability $6,379,825 Current Discount Rate 7.65% Net Pension Liability/(Asset) $4,155,588 1% Increase 8.65% Net Pension Liability/(Asset) $2,317,367 32
58 NOTES TO BASIC FINANCIAL STATEMENTS For the Years Ended December 31, 2017 and 2016 NOTE 7 DEFINED BENEFIT PENSION PLAN (Continued) Actuarial Assumptions For the measurement period ended June 30, 2017, the total pension liabilities were determined by rolling forward the June 30, 2016 total pension liability. The June 30, 2016 and June 30, 2017 total pension liabilities were based on the following actuarial methods and assumptions: Valuation Date Measurement Date Actuarial Cost Method Actuarial Assumptions: Discount Rate Inflation Projected Salary Increase Investment Rate of Return Post Retirement Benefit Increase Mortality Miscellaneous June 30, 2015 June 30, 2016 Entry-Age Normal Cost Method 7.65% 2.75% Varies by Entry Age and Service 7.5% (1) Contract COLA up to 2.75% until Purchasing Power Protection Allowance Floor on Purchasing Power applies, 2.75% thereafter Derived using CalPers Membership Data for all Funds (2) (1) Net of pension plan investment and administrative expenses, including inflation. (2) The mortality table used was developed based on CalPERS specific data. The table includes 20 years of mortality improvements using Society of Actuaries Scale BB. For more details on this table, please refer to the CalPERS 2014 experience study report available on CalPERS' website. All other actuarial assumptions used in the June 30, 2015 valuation were based on the results of a January 2014 actuarial experience study for the period 1997 to Further details of the Experience Study can be found on the CalPERS website under Forms and Publications. Change of Assumptions GASB 68, paragraph 68 states that the long-term expected rate of return should be determined net of pension plan investment expense, but without reduction for pension plan administrative expense. The discount rate of 7.65% used for the June 30, 2016 measurement date was net of administrative expenses. The discount rate of 7.65% used for the June 30, 2015 measurement date is without reduction of pension plan administrative expense. All other assumptions for the June 30, 2015 measurement date were the same as those used for the June 30, 2016 measurement date. Discount Rate The discount rate used to measure the total pension liability was 7.65% for the Plan. To determine whether the municipal bond rate should be used in the calculation of a discount rate for the plan, CalPERS stress tested plans that would most likely result in a discount rate that would be different from the actuarially assumed discount rate. Based on the testing, none of the tested plans run out of assets. Therefore, the current 7.65% discount rate is adequate and the use of the municipal bond rate calculation is not necessary. The long term expected discount rate of 7.65% will be applied to all plans in the Public Employees Retirement Fund (PERF). The stress test results are presented in a detailed report that can be obtained from the CalPERS website. 33
59 NOTES TO BASIC FINANCIAL STATEMENTS For the Years Ended December 31, 2017 and 2016 NOTE 7 DEFINED BENEFIT PENSION PLAN (Continued) The long-term expected rate of return on pension plan investments was determined using a building-block method in which best-estimate ranges of expected future real rates of return (expected returns, net of pension plan investment expense and inflation) are developed for each major asset class. In determining the long-term expected rate of return, CalPERS took into account both short-term and long-term market return expectations as well as the expected pension fund cash flows. Such cash flows were developed assuming that both members and employers will make their required contributions on time and as scheduled in all future years. Using historical returns of all the funds asset classes, expected compound (geometric) returns were calculated over the short-term (first 10 years) and the long-term (11-60 years) using a building-block approach. Using the expected nominal returns for both short-term and long-term, the present value of benefits was calculated for each fund. The expected rate of return was set by calculating the single equivalent expected return that arrived at the same present value of benefits for cash flows as the one calculated using both short-term and long-term returns. The expected rate of return was then set equivalent to the single equivalent rate calculated above and rounded down to the nearest one quarter of one percent. The table below reflects the long-term expected real rate of return by asset class. The rate of return was calculated using the capital market assumptions applied to determine the discount rate and asset allocation. These geometric rates of return are net of administrative expenses. Asset Class Current Target Allocation Real Return Years 1-10(a) Real Return Years 11+(b) Global Equity 51.0% 5.25% 5.71% Global Fixed Income 20.0% 0.99% 2.43% Inflation Sensitive 6.0% 0.45% 3.36% Private Equity 10.0% 6.83% 6.95% Real Estate 10.0% 4.50% 5.13% Infrastructure and Forestland 2.0% 4.50% 5.09% Liquidity 1.0% -0.55% -1.05% Total 100% (a) An expected inflation of 2.5% used for this period. (b) An expected inflation of 3.0% used for this period. Pension Plan Fiduciary Net Position Detailed information about each pension plan s fiduciary net position is available in the separately issued CalPERS financial reports. NOTE 8 OTHER POST-RETIREMENT BENEFITS Plan Description: The District has a single-employer defined benefit other postemployment healthcare (OPEB) plan providing health plan coverage to eligible retired employees and their eligible dependents. The District offers retirees the option to obtain coverage under the same medical plans as its active employees if such coverage is offered by the health insurer. Employees become eligible to retire and receive healthcare benefits with at least 20 years of service to the District. The OPEB Plan does not issue a publicly available financial report. 34
60 NOTES TO BASIC FINANCIAL STATEMENTS For the Years Ended December 31, 2017 and 2016 NOTE 8 OTHER POST-RETIREMENT BENEFITS (Continued) Funding Policy: The contribution requirements of plan members and the District are established and may be amended by the Board of Directors. The required contribution is based on projected pay-as-you-go financing requirements. For 2017 and 2016, the District contributed $41,228 and $37,365 respectively, to the plan. Annual OPEB Cost and Net OPEB Obligation: The District s annual OPEB cost (expense) is calculated based on the annual required contribution of the employer (ARC), an amount actuarially determined in accordance with the parameters of GASB Statement No. 45. The ARC represents a level of funding that, if paid on an ongoing basis, is projected to cover normal costs each year and amortize any unfunded actuarial liabilities (or funding excess) over a period not to exceed thirty years. The following table shows the components of the District s annual OPEB cost for 2017 and 2016, the amount actually contributed to the plan, and changes in the District s net OPEB obligation to the OPEB plan: Normal Cost $59,000 $40,342 Amortization of unfunded AAL 79,000 61,306 Annual required contribution 138, ,648 Interest and amortization of net OPEB obligation (1,000) (12,341) Contributions made (premium payments made) (41,228) (37,365) Change in net OPEB obligation 95,772 51,942 Net OPEB obligation, beginning of year 744, ,813 Net OPEB obligation, end of year $840,527 $744,755 The District s annual OPEB cost, the percentage of annual OPEB cost contributed to the plan, and the net OPEB obligation for 2017, 2016, and 2015 were as follows: Percentage of Net Annual Annual OPEB OPEB Year Ended OPEB Cost Contributed Obligation December 31, 2015 $101, % $692,813 December 31, , % 744,755 December 31, , % 840,527 The schedule of funding progress presents trend information about whether the actuarial value of plan assets is increasing or decreasing over time relative to the unfunded actuarial accrued liability (UAAL) for benefits. Information as of December 31, 2017 is presented below: Actuarial Accrued UAAL as a Actuarial Liability (AAL)- Unfunded Percentage Actuarial Value of Simplified AAL Funded Covered of/covered Valuation Assets Entry Age (Uaal) Ratio Payroll Payroll Date (A) (B) (B - A) (A/B) (C) ((B-A)/C) December 31, 2016 $0 $2,152,000 $2,152,000 $0 $2,576, % 35
61 NOTES TO BASIC FINANCIAL STATEMENTS For the Years Ended December 31, 2017 and 2016 NOTE 8 OTHER POST-RETIREMENT BENEFITS (Continued) Actuarial valuations of an ongoing plan involve estimates of the value of reported amounts and assumptions about the probability of occurrence of events far into the future. Examples include assumptions about future employment, mortality, and the healthcare cost trend. Amounts determined regarding the funded status of the plan and the annual required contributions of the employer are subject to continual revision as actual results are compared with past expectations and new estimates are made about the future. The schedule of funding progress, presented as required supplementary information below, presents multi-year trend information about whether the actuarial value of plan assets is increasing or decreasing over time relative to the actuarial accrued liabilities for benefits. Actuarial Methods and Assumptions: Projections of benefits for financial reporting purposes are based on the substantive plan (the plan as understood by the employer and the plan members) and include the types of benefits provided at the time of each valuation and the historical pattern of sharing of benefit costs between the employer and plan members to that point. The actuarial methods and assumptions used include techniques that are designed to reduce the effects of short-term volatility in actuarial accrued liabilities and the actuarial value of assets consistent with the long-term perspective of the calculations. NOTE 9 COMMITMENTS AND CONTINGENCIES Various claims have been filed against the District. In the opinion of the District s management and legal counsel, the claims will not have a material impact on the basic financial statements. The District has capital project commitments as of December 31, 2017 and 2016 totaling $3,848,217 and $2,197,621, respectively, related to construction work. NOTE 10 ECONOMIC DEPENDENCY During 2017 and 2016, the District purchased 99.05% and 95.61%, respectively, of its water supply from the San Juan Water District (SJWD). Total purchases for the year ended December 31, 2017 and 2016 was $2,692,482 and $2,190,061, respectively. In addition, the District owns water transmission capacity entitlements through the cooperative transmission pipeline project owned and operated by SJWD. NOTE 11 INSURANCE The District participates in the Association of California Water Agencies Joint Powers Insurance Authority (ACWA/JPIA) a public entity risk pool of California water agencies, for general and auto liability, public officials liability, property damage, fidelity insurance and workers compensation liability. ACWA/JPIA provides insurance through the pool up to a certain level, beyond which group purchased commercial excess insurance is obtained. The District pays an annual premium to ACWA/JPIA that includes its pro-rata share of excess insurance premiums, charges for the pooled risk, claims adjusting and legal costs, and administrative and other costs to operate the ACWA/JPIA. The District s deductibles and maximum coverage are as follows: 36
62 NOTES TO BASIC FINANCIAL STATEMENTS For the Years Ended December 31, 2017 and 2016 NOTE 11 INSURANCE (Continued) Type of Coverage (Deductible) ACWA/ JPIA Commercial Insurance Deductible General and Auto Liability $5,000,000 Statutory None (Includes Public Officials Liability) Property Damage 100, ,000,000 2,500-5,000 Crime 100,000 None 1,000 Workers Compensation Liability 2,000,000 Statutory None Employers Liability 2,000,000 Statutory None The District continues to carry commercial insurance for all other risks of loss to cover all claims for risk of loss to which the District is exposed. Settled claims resulting from these risks have not exceeded commercial insurance coverage in any of the past three fiscal years. NOTE 12 SUBSEQUENT EVENTS DISCLOSURE In December 2016, CalPERS Board of Directors voted to lower the discount rate from 7.5% to 7.0% over the next three fiscal years, beginning in fiscal year The change in the discount rate will affect the contribution rates beginning in fiscal year 2019 and result in increases to the normal costs and unfunded actuarial liabilities. 37
63 This Page Left Intentionally Blank
64 Required Supplementary Information
65 REQUIRED SUPPLEMENTAL INFORMATION For the Years Ended December 31, 2017 and 2016 Citrus Heights Water District, a Cost-Sharing Defined Pension Plan As of fiscal year ending December 31, 2017 Schedule of the Plan's Proportionate Share of the Net Pension Liability and Related Ratios as of the Measurement Date** Last 10 Years* 6/30/2014 6/30/2015 6/30/2016 Plan's Proportion of the Net Pension Liability/Asset % % % Plan's Proportionate Share of the Net Pension Liability/(Asset) $3,358,940 $3,351,422 $4,155,588 Plan's Covered-Employee Payroll $2,259,371 $2,129,887 $2,362,614 Plan's Proportionate Share of the Net Pension Liability/(Asset) as a Percentage of its Covered-Employee Payroll % % % Plan's Proportionate Share of the Net Pension Liability/(Asset) as a Percentage of the Plan's Total Pension Liability 77.44% 78.40% 87.28% * Fiscal year 2015 was the 1st year of implementation. ** Calpers provides the information based on a June 30 fiscal year end. 40
66 REQUIRED SUPPLEMENTAL INFORMATION For the Years Ended December 31, 2017 and 2016 Citrus Heights Water District, a Cost-Sharing Defined Pension Plan As of fiscal year ending December 31, 2017 SCHEDULE OF CONTRIBUTIONS Last 10 Years* Actuarially determined contribution $ 437,239 $ 612,009 $ 517,698 Contributions in relation to the actuarially determined contributions (437,239) (612,009) (517,698) Contribution deficiency (excess) $ - $ - $ - Covered-employee payroll $ 2,129,887 $ 2,362,614 $ 2,667,190 Contributions as a percentage of covered-employee payroll 20.53% 25.90% 19.41% * Fiscal year 2015 was the 1st year of implementation. 41
67 REQUIRED SUPPLEMENTAL INFORMATION For the Years Ended December 31, 2017 and 2016 Schedule of Funding Status Other Post-Employment Benefits Obligation Funded Status and Funding Progress of the Plan Actuarial Accrued UAAL as a Actuarial Liability (AAL)- Unfunded Percentage Actuarial Value of Simplified AAL Funded Covered of/covered Valuation Assets Entry Age (Uaal) Ratio Payroll Payroll Date (A) (B) (B - A) (A/B) (C) ((B-A)/C) December 31, 2012 $0 $1,414,800 $1,414,800 $0 $2,266, % January 1, ,060,112 1,060, ,659, % December 31, ,152,000 2,152, ,576, % In the December 31, 2016 actuarial valuation, the projected unit credit actuarial method was used. The actuarial assumptions included a 3.75% investment rate of return (net of administrative expenses), which is based on the District s own investments. The annual healthcare-cost trend rates are 7.0%-5.0% for 2018 through respectively. The UAAL is being amortized as a level dollar amount on an open basis. The remaining amortization period at December 31, 2017, was 28 years. Actuarial Methods and Assumptions Actuarial valuations involve estimates of the value of reported amounts and assumptions about the probability of events far into the future. Actuarially determined amounts are subject to continual revision as actual results are compared to past expectations and new estimates are made about the future. Calculations are based on the types of benefits provided under the terms of the substantive plan at the time of each valuation and the pattern of sharing of costs between the employer and plan members to that point. Consistent with the long-term perspective of actuarial calculations, actuarial methods and assumptions used include techniques that are designed to reduce short-term volatility in actuarial accrued liabilities for benefits. The following is a summary of the actuarial assumptions and methods: Valuation date December 31, 2016 Actuarial cost method Projected unit credit method Amortization method Level percent of payroll amortization Remaining amortization period 30 years as of the valuation date Actuarial assumptions: Investment rate of return 3.75% Projected salary increase 3.00% Inflation rate 2.75% Health care cost trend rates 7.00% % 42
68 ATTACHMENT 2 Series 2010 COP Debt Service Schedule
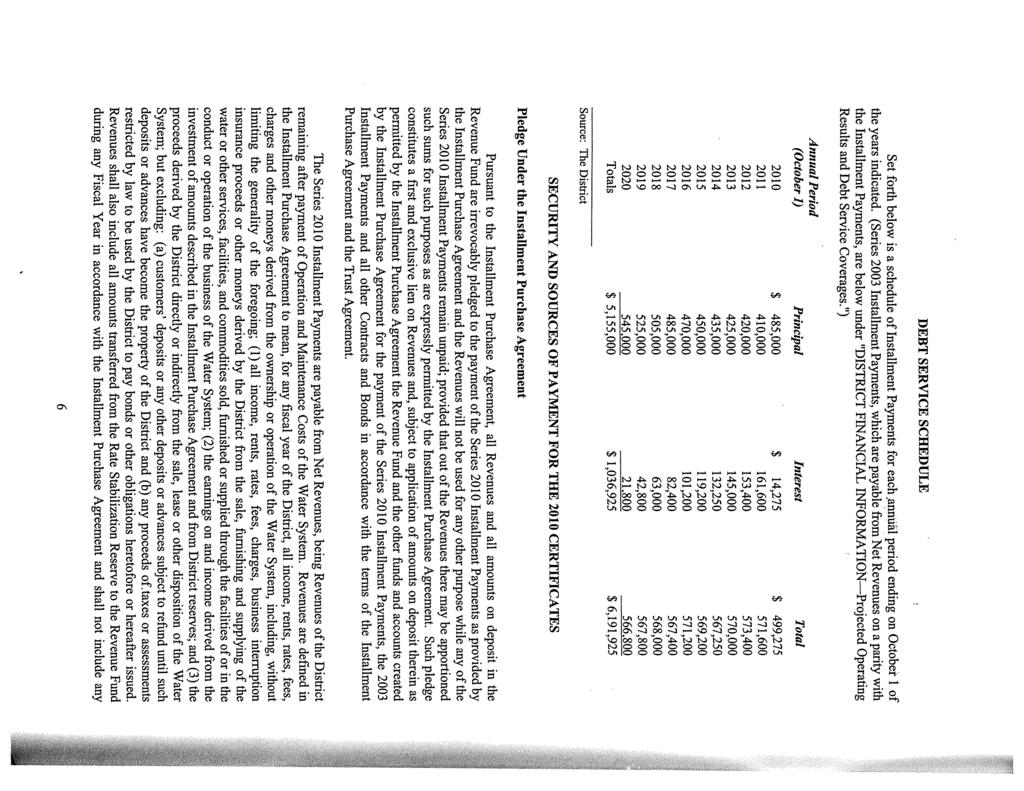
69
CITRUS HEIGHTS WATER DISTRICT BOARD OF DIRECTORS SPECIAL MEETING MINUTES December 5, 2018
 CITRUS HEIGHTS WATER DISTRICT BOARD OF DIRECTORS SPECIAL MEETING MINUTES December 5, 2018 The Special Meeting of the Board of Directors was called to order at 6:30 p.m. by President Riehle and roll was
CITY OF ANAHEIM WATER UTILITY FUND. Financial Statements. June 30, 2016 and (With Independent Auditors Report Thereon)
") Financial Statements (With Independent Auditors Report Thereon) Table of Contents Page Independent Auditors Report 1 Management s Discussion and Analysis (Unaudited) 3 Financial Statements: Statement of
Financial Statements (With Independent Auditors Report Thereon) Table of Contents Page Independent Auditors Report 1 Management s Discussion and Analysis (Unaudited) 3 Financial Statements: Statement of
Ramona Municipal Water District Financial Statements June 30, 2016
 Ramona Municipal Water District Financial Statements INDEX TO FINANCIAL STATEMENTS Independent Auditor s Report... 2 Management s Discussion and Analysis... 5 Statement of Net Position... 12 Statement
COASTSIDE COUNTY WATER DISTRICT BASIC FINANCIAL STATEMENTS AND SUPPLEMENTARY SCHEDULES JUNE 30, 2016
 COASTSIDE COUNTY WATER DISTRICT BASIC FINANCIAL STATEMENTS AND SUPPLEMENTARY SCHEDULES JUNE 30, 2016 This page intentionally left blank. Table of Contents Elected Officials and Administrative Personnel...
RAMONA MUNICIPAL WATER DISTRICT
 A. Opening of Meeting RAMONA MUNICIPAL WATER DISTRICT Regular Meeting of the Board of Directors Ramona Community Center 434 Aqua Lane, Ramona, CA 92065 Tuesday, January 8, 2019 2:00 P.M. AGENDA A.1. A.2.
Marin Municipal Water District
 Marin Municipal Water District Corte Madera, California Basic Financial Statements And Independent Auditors Report For the years ended June 30, 2012 and 2011 Basic Financial Statements Table of Contents
Jersey Shore Area School District
 Financial Statements and Supplementary Information Table of Contents Independent Auditors Report 1 Management s Discussion and Analysis (Unaudited) 4 Basic Financial Statements: Government-Wide Financial
Los Angeles Community College District
 Los Angeles Community College District Basic Financial Statements and Supplemental Information June 30, 2016 and 2015 (With Independent Auditors Report Thereon) June 30, 2016 and 2015 Los Angeles County,
GLENN-COLUSA IRRIGATION DISTRICT AUDITED FINANCIAL STATEMENTS. September 30, 2017 and 2016
 AUDITED FINANCIAL STATEMENTS September 30, 2017 and 2016 AUDITED FINANCIAL STATEMENTS September 30, 2017 and 2016 TABLE OF CONTENTS Independent Auditor s Report... 1 Management s Discussion and Analysis...
BROWARD COUNTY, FLORIDA WATER AND WASTEWATER FUND A Major Fund of Broward County, Florida
 BROWARD COUNTY, FLORIDA WATER AND WASTEWATER FUND A Major Fund of Broward County, Florida Financial Statements For the Years Ended BROWARD COUNTY, FLORIDA WATER AND WASTEWATER FUND FINANCIAL STATEMENTS
DEDHAM-WESTWOOD WATER DISTRICT Financial Statements For the Year Ended December 31, 2017 (With Independent Auditors Report Thereon)
") DEDHAM-WESTWOOD WATER DISTRICT Financial Statements For the Year Ended December 31, 2017 (With Independent Auditors Report Thereon) Dedham-Westwood Water District TABLE OF CONTENTS PAGE INDEPENDENT AUDITORS
DEDHAM-WESTWOOD WATER DISTRICT Financial Statements For the Year Ended December 31, 2017 (With Independent Auditors Report Thereon) Dedham-Westwood Water District TABLE OF CONTENTS PAGE INDEPENDENT AUDITORS
MILLBRAE SCHOOL DISTRICT COUNTY OF SAN MATEO MILLBRAE, CALIFORNIA AUDIT REPORT. June 30, 2016
 MILLBRAE SCHOOL DISTRICT COUNTY OF SAN MATEO MILLBRAE, CALIFORNIA AUDIT REPORT June 30, 2016 CHAVAN & ASSOCIATES, LLP CERTIFIED PUBLIC ACCOUNTANTS 1475 SARATOGA AVE., SUITE 180 SAN JOSE, CA 95129 This
CITY OF MONTE VISTA, COLORADO
 FINANCIAL STATEMENTS TABLE OF CONTENTS Independent Auditor s Report Management s Discussion and Analysis a - c i - xi Basic Financial Statements Statement of Net Position 1 Statement of Activities 2 Balance
Village of Sauk Village, Illinois
 Village of Sauk Village, Illinois Annual Financial Report Year Ended ANNUAL FINANCIAL REPORT Year Ended TABLE OF CONTENTS Page Table of Contents i - iii Independent Auditors Report 1-4 Basic Financial
CITY OF SPRINGFIELD, ILLINOIS. WATER FUND (An Enterprise Fund of the City of Springfield, Illinois)
") CITY OF WATER FUND (An Enterprise Fund of the City of Springfield, Illinois) For the Years Ended February 29, 2016 and February 28, 2015 TABLE OF CONTENTS Page(s) Independent Auditor s Report... 1-2 Financial
CITY OF WATER FUND (An Enterprise Fund of the City of Springfield, Illinois) For the Years Ended February 29, 2016 and February 28, 2015 TABLE OF CONTENTS Page(s) Independent Auditor s Report... 1-2 Financial
Montour School District
 Montour School District Single Audit June 30, 2015 TABLE OF CONTENTS Independent Auditor's Report Management s Discussion and Analysis i Financial Statements: Government-Wide Financial Statements: Statement
MARIPOSA COUNTY TRANSIT FUND, CALIFORNIA
 MARIPOSA COUNTY TRANSIT FUND, CALIFORNIA FINANCIAL STATEMENTS TOGETHER WITH INDEPENDENT AUDITOR S REPORT FOR THE YEAR ENDED JUNE 30, 2015 THIS PAGE INTENTIONALLY LEFT BLANK MARIPOSA COUNTY TRANSIT FUND
Hinds County, Mississippi. Audited Financial Statements and Special Reports. For the Year Ended September 30, 2015
 Hinds County, Mississippi Audited Financial Statements and Special Reports TABLE OF CONTENTS Independent Auditor s Report 3 Management s Discussion and Analysis 5 Financial Statements: Statement of Net
City of Merced, California
 For the Fiscal Year Ended June 30, 2015 Basic Financial Statements, California Merced, California Annual Financial Report For the year ended June 30, 2015 This page intentionally left blank Annual Financial
CAMPBELL, RAPPOLD & YURASITS LLP Certified Public Accountants 1033 South Cedar Crest Boulevard Allentown, PA 18103
 NORTHAMPTON BOROUGH MUNICIPAL AUTHORITY - WATER PROJECT Financial Statements, Independent Auditor's Report and Supplementary Information March 31, 2017 and 2016 CAMPBELL, RAPPOLD & YURASITS LLP Certified
SACRAMENTO AREA FLOOD CONTROL AGENCY. For the Fiscal Year Ended June 30, 2013
 Independent Auditors Reports, Management's Discussion and Analysis, Basic Financial Statements, Required Supplementary Information, Supplemental Information and Other Reports For the Fiscal Year Ended
Basic Financial Statements and Report of Independent Certified Public Accountants City of Dallas, Texas Dallas Water Utilities (An Enterprise Fund of
 Basic Financial Statements and Report of Independent Certified Public Accountants City of Dallas, Texas September 30, 2016 FINANCIAL STATEMENTS For Fiscal Year Ended September 30, 2016 TABLE OF CONTENTS
Diablo Water District
 Diablo Water District Oakley, California Annual Financiall Report For the Years Endedd June 30, 2016 and 2015 For the Year Ended June 30, 2016 BOARD OF DIRECTORS Howard Hobbs Kenneth L. Crockett Enrico
MARK TWAIN UNION ELEMENTARY SCHOOL DISTRICT ANNUAL FINANCIAL REPORT FOR THE YEAR ENDED JUNE 30, 2018
 MARK TWAIN UNION ELEMENTARY SCHOOL DISTRICT ANNUAL FINANCIAL REPORT FOR THE YEAR ENDED This page left blank intentionally. TABLE OF CONTENTS FOR THE YEAR ENDED FINANCIAL SECTION Independent Auditor's Report
Hinds County, Mississippi. Audited Financial Statements and Special Reports. For the Year Ended September 30, 2016
 Hinds County, Mississippi Audited Financial Statements and Special Reports TABLE OF CONTENTS Independent Auditor s Report 3 Management s Discussion and Analysis 5 Financial Statements: Statement of Net
CITY DEPARTM DIVISIO REPORT ON
 CITY OF CLE EVELAND, OHIO DEPARTM MENT OF PUBLIC UTILITIES DIVISIO N OF WATER REPORT ON AUDIT OF FINANCIAL STATEMENTS For the year ended December 31, 2016 This page intentionally left blank. TABLE OF CONTENTS
COASTSIDE COUNTY WATER DISTRICT BASIC FINANCIAL STATEMENTS AND SUPPLEMENTARY SCHEDULES JUNE 30, 2010
 COASTSIDE COUNTY WATER DISTRICT BASIC FINANCIAL STATEMENTS AND SUPPLEMENTARY SCHEDULES JUNE 30, 2010 Table of Contents Page Elected Officials and Administrative Personnel... i Independent Auditors Report...
CITY OF INKSTER, MICHIGAN. Year Ended June 30, Financial Statements and Single Audit Compliance Act
 CITY OF INKSTER, MICHIGAN Year Ended June 30, 2016 Financial Statements and Single Audit Compliance Act This page intentionally left blank. Table of Contents Independent Auditors Report 1 Management s
ELECTRIC UTILITY ENTERPRISE FUND (SILICON VALLEY POWER) FINANCIAL STATEMENTS
 FINANCIAL STATEMENTS") CITY OF SANTA CLARA ELECTRIC UTILITY ENTERPRISE FUND FINANCIAL STATEMENTS FOR THE YEARS ENDED JUNE 30, 2017 AND 2016 CITY OF SANTA CLARA, CALIFORNIA 1500 WARBURTON AVENUE SANTA CLARA, CA 95050-3796 PREPARED
CITY OF SANTA CLARA ELECTRIC UTILITY ENTERPRISE FUND FINANCIAL STATEMENTS FOR THE YEARS ENDED JUNE 30, 2017 AND 2016 CITY OF SANTA CLARA, CALIFORNIA 1500 WARBURTON AVENUE SANTA CLARA, CA 95050-3796 PREPARED
MID-PENINSULA WATER DISTRICT FINANCIAL STATEMENTS WITH INDEPENDENT AUDITOR'S REPORT FOR THE FISCAL YEARS ENDED JUNE 30, 2018 AND 2017
 FINANCIAL STATEMENTS WITH INDEPENDENT AUDITOR'S REPORT FOR THE FISCAL YEARS ENDED JAMES MARTA & COMPANY LLP CERTIFIED PUBLIC ACCOUNTANTS 701 HOWE AVENUE, E3 SACRAMENTO, CA (916) 993-9494 (916) 993-9489
CITY OF ANAHEIM WATER UTILITY FUND. Financial Statements. June 30, 2014 and (With Independent Auditors Report Thereon)
") Financial Statements (With Independent Auditors Report Thereon) Table of Contents Page Independent Auditors Report 1 Management s Discussion and Analysis (Unaudited) 3 Financial Statements: Statements
Financial Statements (With Independent Auditors Report Thereon) Table of Contents Page Independent Auditors Report 1 Management s Discussion and Analysis (Unaudited) 3 Financial Statements: Statements
Board of Directors as of June 30, 2018
 McKinleyville, California Annual Financial Report For the Fiscal Year Ended Board of Directors as of Elected/ Current Name Title Appointed Term David Couch President Elected 09/2008-12/2018 George Wheeler
BAKERSFIELD CITY SCHOOL DISTRICT ANNUAL FINANCIAL REPORT JUNE 30, 2017
 ANNUAL FINANCIAL REPORT TABLE OF CONTENTS FINANCIAL SECTION Independent Auditor's Report 2 Management's Discussion and Analysis 5 Basic Financial Statements Government-Wide Financial Statements Statement
SUFFOLK COUNTY WATER AUTHORITY. Financial Statements and Required Supplementary Information. May 31, 2017 and 2016
 Financial Statements and Required Supplementary Information (With Independent Auditors Reports Thereon) Table of Contents Independent Auditors Report 1 Management s Discussion and Analysis (Unaudited)
Basic Financial Statements
 2018 Basic Financial Statements For the Fiscal Year Ended June 30, 2018 San Diego, CA 4705 9/18 San Diego Association of Governments San Diego, California Basic Financial Statements and Independent Auditor
STONEYBROOK COMMUNITY DEVELOPMENT DISTRICT
 STONEYBROOK COMMUNITY DEVELOPMENT DISTRICT REGULAR MEETING AGENDA April 24, 2018 Stoneybrook Community Development District OFFICE OF THE DISTRICT MANAGER 2300 Glades Road, Suite 410W Boca Raton, Florida
Roosevelt City Corporation Duchesne County, Utah
 Duchesne County, Utah ANNUAL FINANCIAL REPORT For the Year Ended TABLE OF CONTENTS Beginning on page INDEPENDENT AUDITORS' REPORT 1 MANAGEMENT'S DISCUSSION AND ANALYSIS 3 BASIC FINANCIAL STATEMENTS 13
VILLAGE OF RICHMOND, ILLINOIS ANNUAL FINANCIAL REPORT
 VILLAGE OF RICHMOND, ILLINOIS ANNUAL FINANCIAL REPORT FOR THE FISCAL YEAR ENDED APRIL 30, 2015 VILLAGE OF RICHMOND TABLE OF CONTENTS APRIL 30, 2015 PAGE INDEPENDENT AUDITOR S REPORT 1 REQUIRED SUPPLEMENTARY
CITY OF ROLLING HILLS, CALIFORNIA FINANCIAL STATEMENTS FOR THE FISCAL YEAR ENDED JUNE 30, 2017
 , CALIFORNIA FINANCIAL STATEMENTS FOR THE FISCAL YEAR ENDED JUNE 30, 2017 PREPARED BY: THE CITY OF ROLLING HILLS, CALIFORNIA FINANCIAL SERVICES DEPARTMENT THIS PAGE INTENTIONALLY LEFT BLANK FINANCIAL STATEMENTS
Interurban Transit Partnership
 Single Audit Report Years Ended September 30, 2016 and 2015 The report accompanying these financial statements was issued by BDO USA, LLP, a Delaware limited liability partnership and the U.S. member of
CITY OF RIPON CALIFORNIA
 CALIFORNIA FINANCIAL STATEMENTS AND INDEPENDENT AUDITOR S REPORT FOR THE YEAR ENDED CALIFORNIA TABLE OF CONTENTS Page Independent Auditor s Report... 1 Management s Discussion and Analysis... 3 Basic Financial
City of Tombstone, Arizona Financial Statements. Year Ended June 30, 2016
 City of Tombstone, Arizona Financial Statements Year Ended June 30, 2016 CONTENTS Page INDEPENDENT AUDITOR S REPORT 1 MANAGEMENT S DISCUSSION AND ANALYSIS (MD&A) (Required Supplementary Information) 5
BLOOMINGTON-NORMAL AIRPORT AUTHORITY OF MCLEAN COUNTY, ILLINOIS FINANCIAL STATEMENTS AND INDEPENDENT AUDITOR S REPORT.
 OF MCLEAN COUNTY, ILLINOIS FINANCIAL STATEMENTS AND INDEPENDENT AUDITOR S REPORT April 30, 2015 OF MCLEAN COUNTY, ILLINOIS TABLE OF CONTENTS Page(s) INDEPENDENT AUDITOR S REPORT... 1-3 MANAGEMENT S DISCUSSION
CITY OF SANTA MONICA, CALIFORNIA Big Blue Bus Fund (An Enterprise Fund of the City of Santa Monica) Financial Statements and Supplementary
 Financial Statements and Supplementary") Financial Statements and Supplementary Information Fiscal Years Ended June 30, 2018 and 2017 (With Independent Auditors Reports Thereon) Fiscal Years Ended June 30, 2018 and 2017 Table of Contents Page
Financial Statements and Supplementary Information Fiscal Years Ended June 30, 2018 and 2017 (With Independent Auditors Reports Thereon) Fiscal Years Ended June 30, 2018 and 2017 Table of Contents Page
TOWNS COUNTY WATER AND SEWERAGE AUTHORITY YOUNG HARRIS, GEORGIA FINANCIAL STATEMENTS AS OF JUNE 30, 2016 AND INDEPENDENT AUDITOR S REPORT
 TOWNS COUNTY WATER AND SEWERAGE AUTHORITY YOUNG HARRIS, GEORGIA FINANCIAL STATEMENTS AS OF JUNE 30, 2016 AND INDEPENDENT AUDITOR S REPORT TOWNS COUNTY WATER AND SEWERAGE AUTHORITY CONTENTS Financial Section
DENMARK-OLAR SCHOOL DISTRICT NO. TWO BAMBERG COUNTY, S. C. BASIC FINANCIAL STATEMENTS AND SUPPLEMENTAL INFORMATION JUNE 30, 2015
 DENMARK-OLAR SCHOOL DISTRICT NO. TWO BAMBERG COUNTY, S. C. BASIC FINANCIAL STATEMENTS AND SUPPLEMENTAL INFORMATION JUNE 30, 2015 THIS PAGE IS INTENTIONALLY LEFT BLANK DENMARK-OLAR SCHOOL DISTRICT NO. TWO
CLINTON CITY BASIC FINANCIAL STATEMENTS AND REQUIRED SUPPLEMENTARY INFORMATION WITH INDEPENDENT AUDITOR'S REPORTS YEAR ENDED JUNE 30, 2018
 BASIC FINANCIAL STATEMENTS AND REQUIRED SUPPLEMENTARY INFORMATION WITH INDEPENDENT AUDITOR'S REPORTS YEAR ENDED TABLE OF CONTENTS Independent Auditors Report... 1-2 Management s Discussion and Analysis...
LEBANON SCHOOL DISTRICT LEBANON, PENNSYLVANIA AUDIT REPORT
 LEBANON, PENNSYLVANIA AUDIT REPORT JUNE 30, 2016 TABLE OF CONTENTS PAGE INDEPENDENT AUDITOR S REPORT 1-3 MANAGEMENT S DISCUSSION AND ANALYSIS 4-12 BASIC FINANCIAL STATEMENTS Entity-wide Financial Statements:
MONROE COUNTY WATER AUTHORITY (A Discretely Presented Component Unit of the County of Monroe, New York)
") MONROE COUNTY WATER AUTHORITY (A Discretely Presented Component Unit of the County of Monroe, New York) Financial Statements as of December 31, 2017 Together with Independent Auditor s Report MONROE COUNTY
MONROE COUNTY WATER AUTHORITY (A Discretely Presented Component Unit of the County of Monroe, New York) Financial Statements as of December 31, 2017 Together with Independent Auditor s Report MONROE COUNTY
Kent County, Michigan. Annual Financial Report
 Kent County, Michigan Annual Financial Report For the year ended June 30, 2018 Table of Contents For the year ended June 30, 2018 Financial Section Independent Auditor s Report... 1 Management s Discussion
TOWNSHIP OF LOWER MUNICIPAL UTILITIES AUTHORITY REPORT ON AUDIT OF FINANCIAL STATEMENTS YEARS ENDED NOVEMBER 30, 2013 AND 2012
 TOWNSHIP OF LOWER MUNICIPAL UTILITIES AUTHORITY REPORT ON AUDIT OF FINANCIAL STATEMENTS YEARS ENDED NOVEMBER 30, 2013 AND 2012 TABLE OF CONTENTS FINANCIAL SECTION Page Independent Auditor's Report 1-3
Report of Independent Auditors and Financial Statements for. Imperial Irrigation District
 Report of Independent Auditors and Financial Statements for Imperial Irrigation District December 31, 2014 and 2013 CONTENTS REPORT OF INDEPENDENT AUDITORS 1 2 PAGE MANAGEMENT S DISCUSSION AND ANALYSIS
CITY OF CHEYENNE FINANCIAL & COMPLIANCE REPORT
 CITY OF CHEYENNE FINANCIAL & COMPLIANCE REPORT Cheyenne, Wyoming Year Ended Prepared by City Treasurer s Office This page is intentionally left blank 2 City of Cheyenne Financial and Compliance Report
City of Elko, Nevada FINANCIAL STATEMENTS FISCAL YEAR ENDED JUNE 30, 2018
 City of Elko, Nevada FINANCIAL STATEMENTS FISCAL YEAR ENDED JUNE 30, 2018 Table of Contents Page FINANCIAL SECTION Independent Auditors Report... 1 Management s Discussion and Analysis... 4 Basic Financial
City of Grand Ledge. FINANCIAL STATEMENTS (With Required Supplementary Information) June 30, 2018
 June 30, 2018") FINANCIAL STATEMENTS (With Required Supplementary Information) TABLE OF CONTENTS Page INDEPENDENT AUDITOR S REPORT MANAGEMENT S DISCUSSION AND ANALYSIS i-iii iv-x BASIC FINANCIAL STATEMENTS Government-wide
FINANCIAL STATEMENTS (With Required Supplementary Information) TABLE OF CONTENTS Page INDEPENDENT AUDITOR S REPORT MANAGEMENT S DISCUSSION AND ANALYSIS i-iii iv-x BASIC FINANCIAL STATEMENTS Government-wide
CITY OF CLEVELAND, OHIO DEPARTMENT OF PUBLIC UTILITIES DIVISION OF WATER
 REPORT ON AUDITS OF FINANCIAL STATEMENTS For the years ended December 31, 2007 and 2006 TABLE OF CONTENTS Independent Accountants' Report... 1-2 Page Management s Discussion and Analysis... 3-13 Balance
SALEM CITY CORPORATION FINANCIAL STATEMENTS
 FINANCIAL STATEMENTS FOR THE YEAR ENDED JUNE 30, 2016 ii Table of Contents Introductory Section Page Letter of transmittal... 3 Financial Section Independent Auditors Report... 7 Management Discussion
WILLIAM S. HART UNION HIGH SCHOOL DISTRICT ANNUAL FINANCIAL REPORT JUNE 30, 2017
 WILLIAM S. HART UNION HIGH SCHOOL DISTRICT ANNUAL FINANCIAL REPORT JUNE 30, 2017 TABLE OF CONTENTS JUNE 30, 2017 FINANCIAL SECTION Independent Auditor's Report 2 Management's Discussion and Analysis 5
Mojave Basin Area Watermaster A Component Unit of the Mojave Water Agency. Annual Financial Report. For the Fiscal Years Ended June 30, 2015 and 2014
 A Component Unit of the Mojave Water Agency Annual Financial Report Annual Financial Report Table of Contents Page No. Table of Contents i Financial Section Independent Auditor s Report 1-2 Management
PORTAGE, PENNSYLVANIA. Single Audit Reporting Package
 PORTAGE, PENNSYLVANIA Single Audit Reporting Package For The Fiscal Year Ended June 30, 2018 PORTAGE AREA SCHOOL DISTRICT SINGLE AUDIT REPORTING PACKAGE JUNE 30, 2018 TABLE OF CONTENTS Page Management
CITY OF HEMPHILL, TEXAS ANNUAL FINANCIAL REPORT FOR THE YEAR ENDED JUNE 30, 2015
 ANNUAL FINANCIAL REPORT FOR THE YEAR ENDED JUNE 30, 2015 Annual Financial Report For the Year Ended June 30, 2015 Table of Contents Page FINANCIAL SECTION Independent Auditor s Report... 1-3 Management
MARINWOOD COMMUNITY SERVICES DISTRICT SAN RAFAEL, CALIFORNIA BASIC FINANCIAL STATEMENTS
 MARINWOOD COMMUNITY SERVICES DISTRICT SAN RAFAEL, CALIFORNIA BASIC FINANCIAL STATEMENTS JUNE 30, 2018 TABLE OF CONTENTS Independent Auditors Report 1-2 Management s Discussion and Analysis 3-7 Basic Financial
WILLIAMSVILLE CENTRAL SCHOOL DISTRICT, NEW YORK Basic Financial Statements, Required Supplementary Information, Supplementary Information and Federal
 WILLIAMSVILLE CENTRAL SCHOOL DISTRICT, NEW YORK Basic Financial Statements, Required Supplementary Information, Supplementary Information and Federal Awards Information for the Year Ended June 30, 2017
MILLCREEK TOWNSHIP SCHOOL DISTRICT
 ERIE, PENNSYLVANIA FINANCIAL STATEMENTS YEAR ENDED YEAR ENDED CONTENTS Independent Auditor s Report 1-2 Page Management s Discussion and Analysis 3-14 Basic Financial Statements Government-wide Financial
BOARD MEETING AGENDA SPECIAL MEETING OF THE BOARD OF DIRECTORS OF CITRUS HEIGHTS WATER DISTRICT (CHWD) DECEMBER 5, 2018 beginning at 6:30 PM
 DECEMBER 5, 2018 beginning at 6:30 PM") BOARD MEETING AGENDA SPECIAL MEETING OF THE BOARD OF DIRECTORS OF CITRUS HEIGHTS WATER DISTRICT (CHWD) DECEMBER 5, 2018 beginning at 6:30 PM RUSCH PARK COMMUNITY CENTER SUNRISE/PATIO ROOM 7801 AUBURN BOULEVARD,
BOARD MEETING AGENDA SPECIAL MEETING OF THE BOARD OF DIRECTORS OF CITRUS HEIGHTS WATER DISTRICT (CHWD) DECEMBER 5, 2018 beginning at 6:30 PM RUSCH PARK COMMUNITY CENTER SUNRISE/PATIO ROOM 7801 AUBURN BOULEVARD,
TOWN OF NEW SHOREHAM, RHODE ISLAND FINANCIAL STATEMENTS YEAR ENDED JUNE 30, 2015
 FINANCIAL STATEMENTS YEAR ENDED JUNE 30, 2015 Hague, Sahady & Co., Certified Public Accountants P.C. Committed to Excellence Table of Contents Independent Auditors' Report... 1 Management s Discussion
SYLVAN CEMETERY DISTRICT. Annual Financial Report With Independent Auditor s Report Thereon. June 30, 2016
 Annual Financial Report With Independent Auditor s Report Thereon June 30, 2016 Annual Financial Report June 30, 2016 CONTENTS Page Independent Auditor s Report... 1-2 Management s Discussion and Analysis...
CHEROKEE COUNTY WATER AND SEWERAGE AUTHORITY FINANCIAL REPORT FOR THE FISCAL YEAR ENDING AUGUST 31, 2012
 CHEROKEE COUNTY WATER AND SEWERAGE AUTHORITY FINANCIAL REPORT FOR THE FISCAL YEAR ENDING AUGUST 31, 2012 CHEROKEE COUNTY WATER AND SEWERAGE AUTHORITY FINANCIAL REPORT FOR THE FISCAL YEAR ENDED AUGUST 31,
COMPREHENSIVE ANNUAL FINANCIAL REPORT
 C COMPREHENSIVE ANNUAL FINANCIAL REPORT FOR THE FISCAL YEAR ENDED JUNE 30, 2018 Mesa Water District Costa Mesa, California MesaWater.org Dedicated to Satisfying our Community s Water Needs Mesa Water
ARIZONA POWER AUTHORITY (A BODY, CORPORATE AND POLITIC, OF THE STATE OF ARIZONA) PHOENIX, ARIZONA FINANCIAL STATEMENTS SEPTEMBER 30, 2015
 PHOENIX, ARIZONA FINANCIAL STATEMENTS SEPTEMBER 30, 2015") (A BODY, CORPORATE AND POLITIC, OF THE STATE OF ARIZONA) PHOENIX, ARIZONA FINANCIAL STATEMENTS TABLE OF CONTENTS INDEPENDENT AUDITORS' REPORT 1 MANAGEMENT S DISCUSSION AND ANALYSIS 3 FINANCIAL STATEMENTS
(A BODY, CORPORATE AND POLITIC, OF THE STATE OF ARIZONA) PHOENIX, ARIZONA FINANCIAL STATEMENTS TABLE OF CONTENTS INDEPENDENT AUDITORS' REPORT 1 MANAGEMENT S DISCUSSION AND ANALYSIS 3 FINANCIAL STATEMENTS
Marina Coast Water District Marina, California
 Marina Coast Water District Marina, California Comprehensive Annual Financial Report For The Fiscal Year Ended June 30, 2015 11 Reservation Road, Marina California 93933 Marina Coast Water District Marina,
CITY OF FLORENCE, ALABAMA ELECTRICITY, GAS, AND WATER AND WASTEWATER DEPARTMENTS. FINANCIAL STATEMENTS JUNE 30, 2017 and 2016
 ELECTRICITY, GAS, AND WATER AND WASTEWATER DEPARTMENTS FINANCIAL STATEMENTS JUNE 30, 2017 and 2016 ELECTRICITY, GAS, AND WATER AND WASTEWATER DEPARTMENTS T ABLE OF C ONTENTS PAGE Independent Auditor s
ANAHEIM UNION HIGH SCHOOL DISTRICT ANNUAL FINANCIAL REPORT JUNE 30, 2015
 ANAHEIM UNION HIGH SCHOOL DISTRICT ANNUAL FINANCIAL REPORT TABLE OF CONTENTS FINANCIAL SECTION Independent Auditor's Report 2 Management's Discussion and Analysis 5 Basic Financial Statements Government-Wide
CITY OF SPRINGFIELD, ILLINOIS
 CITY OF WATER FUND (An Enterprise Fund of the City of Springfield, Illinois) For the Years Ended February 28, 2018 and February 28, 2017 TABLE OF CONTENTS Page(s) Independent Auditor s Report... 1-2 Financial
BOARD MEETING AGENDA SPECIAL MEETING OF THE BOARD OF DIRECTORS OF CITRUS HEIGHTS WATER DISTRICT (CHWD) NOVEMBER 8, 2017 beginning at 6:30 PM
 NOVEMBER 8, 2017 beginning at 6:30 PM") BOARD MEETING AGENDA SPECIAL MEETING OF THE BOARD OF DIRECTORS OF CITRUS HEIGHTS WATER DISTRICT (CHWD) NOVEMBER 8, 2017 beginning at 6:30 PM RUSCH PARK COMMUNITY CENTER SUNRISE/PATIO ROOM 7801 AUBURN BOULEVARD,
BOARD MEETING AGENDA SPECIAL MEETING OF THE BOARD OF DIRECTORS OF CITRUS HEIGHTS WATER DISTRICT (CHWD) NOVEMBER 8, 2017 beginning at 6:30 PM RUSCH PARK COMMUNITY CENTER SUNRISE/PATIO ROOM 7801 AUBURN BOULEVARD,
City of Park Rapids Hubbard County, Minnesota. Financial Statements. December 31, 2016
 Hubbard County, Minnesota Financial Statements December 31, 2016 Table of Contents Elected Officials and Administration 1 Independent Auditor's Report 2 Management's Discussion and Analysis 5 Basic Financial
BROWARD COUNTY, FLORIDA WATER AND WASTEWATER FUND A Major Fund of Broward County, Florida
 BROWARD COUNTY, FLORIDA WATER AND WASTEWATER FUND A Major Fund of Broward County, Florida Special Purpose Financial Statements Years Ended September 30, 2012 and 2011 BROWARD COUNTY, FLORIDA WATER AND
City of Placerville. Placerville, California. Basic Financial Statements And Independent Auditors Report
 City of Placerville Placerville, California Basic Financial Statements And Independent Auditors Report For the year ended June 30, 2011 CITY OF PLACERVILLE Basic Financial Statements For the year ended
SALEM CITY CORPORATION FINANCIAL STATEMENTS
 FINANCIAL STATEMENTS FOR THE YEAR ENDED JUNE 30, 2017 Allred Jackson, PC 50 East 2500 North, Suite 200 North Logan, UT 84341 (P) 435.752.6441 (F) 435.752.6451 www.allredjackson.com ii Table of Contents
CITY OF SANTA PAULA FINANCIAL STATEMENTS
 CITY OF SANTA PAULA FINANCIAL STATEMENTS Year Ended Financial Statements Year Ended TABLE OF CONTENTS Page Independent Auditor s Report Management s Discussion and Analysis i - iii iv - xii Basic Financial
CITY OF CLEVELAND, OHIO DEPARTMENT OF PUBLIC UTILITIES DIVISION OF WATER
 REPORT ON AUDITS OF FINANCIAL STATEMENTS For the years ended December 31, 2004 and 2003 TABLE OF CONTENTS Independent Accountants' Report... 1 Page Management s Discussion and Analysis... 3-15 Balance
The Building Blocks of Our Community. City of Huntsville Electric, Natural Gas, and Water Systems. Component Unit Financial Statements
 Huntsville Utilities: Appendix A The Building Blocks of Our Community City of Huntsville Electric, Natural Gas, and Water Systems Component Unit Financial Statements September 30, 2007 and 2006 Huntsville
PULASKI COUNTY PUBLIC SERVICE AUTHORITY (A COMPONENT UNIT OF PULASKI COUNTY, VIRGINIA)
") PULASKI COUNTY PUBLIC SERVICE AUTHORITY (A COMPONENT UNIT OF PULASKI COUNTY, VIRGINIA) FINANCIAL REPORT YEAR ENDED JUNE 30, 2016 Pulaski County Public Service Authority (A Component Unit of Pulaski County,
PULASKI COUNTY PUBLIC SERVICE AUTHORITY (A COMPONENT UNIT OF PULASKI COUNTY, VIRGINIA) FINANCIAL REPORT YEAR ENDED JUNE 30, 2016 Pulaski County Public Service Authority (A Component Unit of Pulaski County,
I. INTRODUCTORY SECTION
 Spartanburg Water System Spartanburg, South Carolina Comprehensive Annual Financial Report For the Years Ended June 30, 2018 and 2017 I. INTRODUCTORY SECTION SPARTANBURG WATER SYSTEM SPARTANBURG, SOUTH
WISCONSIN INDIANHEAD TECHNICAL COLLEGE
 WISCONSIN INDIANHEAD TECHNICAL COLLEGE Annual Audited Financial Statements for fiscal year ending, June 30, 2017 Wisconsin Indianhead Technical College District Shell Lake, WI Financial Statements With
EL DORADO COUNTY OFFICE OF EDUCATION COUNTY OF EL DORADO PLACERVILLE, CALIFORNIA ANNUAL FINANCIAL REPORT JUNE 30, 2016
 COUNTY OF EL DORADO PLACERVILLE, CALIFORNIA ANNUAL FINANCIAL REPORT JUNE 30, 2016 JUNE 30, 2016 TABLE OF CONTENTS FINANCIAL SECTION Page Independent Auditor's Report 1 Management s Discussion and Analysis
Town of Fairmont, North Carolina. Audited Financial Statements. For the Year Ended June 30, 2018
 Audited Financial Statements For the Year Ended Audited Financial Statements For the Year Ended Charles Townsend, Mayor Board of Town Commissioners Terry Evans Casandra Gaddy Charles Kemp Monte McCallum
SWEETWATER COUNTY, WYOMING
 FINANCIAL AND COMPLIANCE REPORT JUNE 30, 2017 CONTENTS INDEPENDENT AUDITOR S REPORT 1 and 2 MANAGEMENT S DISCUSSION AND ANALYSIS 3-11 (Required Supplementary Information) BASIC FINANCIAL STATEMENTS Government-Wide
City of Chicago Department of Water Management Water Fund Comprehensive Annual Financial Report For the Years Ended December 31, 2016 and 2015
 City of Chicago Department of Water Management Water Fund Comprehensive Annual Financial Report For the Years Ended December 31, 2016 and 2015 Rahm Emanuel, Mayor Carole L. Brown, Chief Financial Officer
Moapa Valley Water District
 Moapa Valley Water District ANNUAL FINANCIAL REPORT For the Year Ended June 30, 2018 Beginning on page INDEPENDENT AUDITOR'S REPORT 1 MANAGEMENT DISCUSSION AND ANALYSIS 3 BASIC FINANCIAL STATEMENTS 9
Our Mission Statement
 Our Mission Statement The is a public agency whose goal is the protection of the Chino Groundwater Basin in order to guarantee that current and future water needs will be met. The Basin is protected by
City of Le Sueur Le Sueur County, Minnesota. Financial Statements. December 31, 2016
 Le Sueur County, Minnesota Financial Statements December 31, 2016 Table of Contents Page Elected Officials and Administration 1 Independent Auditor's Report 3 Management's Discussion and Analysis 7 Basic
MILLCREEK TOWNSHIP SCHOOL DISTRICT
 ERIE, PENNSYLVANIA FINANCIAL STATEMENTS YEAR ENDED YEAR ENDED CONTENTS Independent Auditor s Report 1-2 Page Management s Discussion and Analysis 3-14 Basic Financial Statements Government-wide Financial
Southwestern Community College District
 Southwestern Community College District Chula Vista, California Basic Financial Statements, Single Audit, State Compliance and Other Supplementary Information with Independent Auditors Reports Table of
The following document was not prepared by the Office of the State Auditor, but was prepared by and submitted to the Office of the State Auditor by a
 The following document was not prepared by the Office of the State Auditor, but was prepared by and submitted to the Office of the State Auditor by a private CPA firm. The document was placed on this web
CITY OF CLARKSVILLE, TENNESSEE
 GAS, WATER AND Wastewater DEPARTMENTS AUDITED FINANCIAL STATEMENTS AND OTHER INFORMATION JUNE 30, 2018 AND 2017 JUNE 30, 2018 AND 2017 TABLE OF CONTENTS Financial Section Independent Auditor s Report 1
BROWARD COUNTY, FLORIDA WATER AND WASTEWATER FUND A Major Fund of Broward County, Florida
 BROWARD COUNTY, FLORIDA WATER AND WASTEWATER FUND A Major Fund of Broward County, Florida Financial Statements For the Years Ended September 30, 2013 and 2012 BROWARD COUNTY, FLORIDA WATER AND WASTEWATER
STAPLES-MOTLEY SCHOOL DISTRICT INDEPENDENT SCHOOL DISTRICT NO FINANCIAL STATEMENTS AND SUPPLEMENTARY INFORMATION YEAR ENDED JUNE 30, 2016
 FINANCIAL STATEMENTS AND SUPPLEMENTARY INFORMATION YEAR ENDED JUNE 30, 2016 TABLE OF CONTENTS (CONTINUED) JUNE 30, 2016 INTRODUCTORY SECTION 4 BOARD OF EDUCATION AND ADMINISTRATION 1 FINANCIAL SECTION
GENESEE COMMUNITY COLLEGE SINGLE AUDIT REPORTS AUGUST 31, 2016
 GENESEE COMMUNITY COLLEGE SINGLE AUDIT REPORTS AUGUST 31, 2016 GENESEE COMMUNITY COLLEGE (A Component Unit of the County of Genesee, New York) Table of Contents August 31, 2016 Independent Auditors Report
MAMMOTH COMMUNITY WATER DISTRICT FINANCIAL STATEMENTS. Year Ended March 31, 2014
 MAMMOTH COMMUNITY WATER DISTRICT FINANCIAL STATEMENTS Year Ended March 31, 2014 Financial Statements Year Ended March 31, 2014 TABLE OF CONTENTS I. INDEPENDENT AUDITORS REPORT i - ii PAGE II. MANAGEMENT