Family Resources Survey and related series
|
|
|
- Thomas Sherman
- 5 years ago
- Views:
Transcription
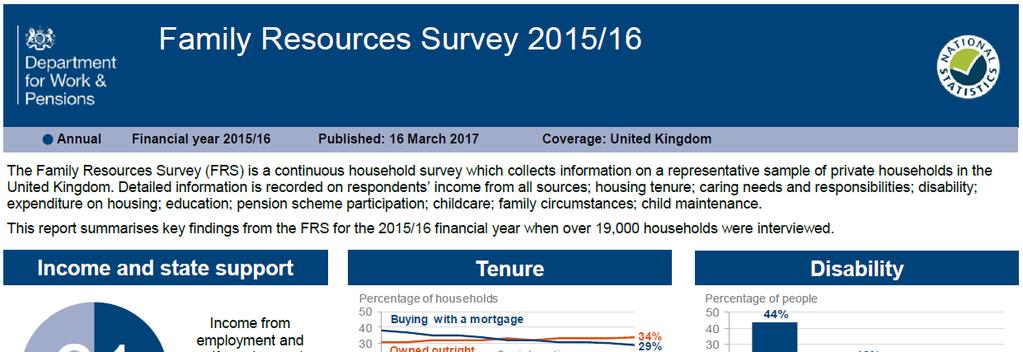
1 Family Resources Survey and related series Don Burke Family Resources Survey Surveys Branch Department for Work and Pensions
2 What we are going to cover The Family Resources Survey Overview Users and uses Quality assurance Improving timeliness Challenges and opportunities What s new on the FRS FRS derived series Households Below Average Income New approach to measuring uncertainty Pensioners Incomes Series Income-Related Benefits: Estimates of Take-Up Latest results 2
3 The Family Resources Survey 3
4 Family Resources Survey overview Cross-sectional survey of income and living conditions running since 1992 Designed for DWP policy needs In-depth face to face interviews with a target 20,000 households across the UK All adults (around 34k) are interviewed and average interview time is around 70 minutes Stratified, clustered, probability sampling (GB) Continuous fieldwork across each financial year (April- March) with annual questionnaire review Fieldwork carried out by ONS and NatCen in GB and NISRA in NI 4
5 Key strengths of the FRS Breath and depth of information which is not available in combination (or at all) from administrative or other survey sources High quality data much more detailed editing and quality assurance of income and benefits data compared to other surveys Large sample size allowing analysis at regional level and for particular subgroups Stable design and long time series 5
6 FRS contains detailed information on: Household composition and circumstances Individual income from all sources including benefits, tax credits, investments and pensions Housing tenure and housing costs Caring needs and responsibilities Disability Education Childcare Child Maintenance Material deprivation Well-being 6
7 Who uses the FRS? Outside Government International Eurostat EU-SILC (up to 2016) Pensions Policy Institute New Policy Institute Institute for Fiscal Studies ( IFS ) University of East Anglia ( UEA ) UK Data Service ( UKDS ) University of York London School of Economics ( LSE ) HMRC ONS Northern Ireland (Dept. for Communities) Scottish Government Welsh Government Institute for Social and Economic Research ( ISER ) NHS Scotland DCLG DfE Home Office MOJ HMT Households Below Average Income Pensioners Incomes Take-Up Statistics Policy Simulation GLA Housing Policy Disability Policy Pensions policy Government (OGD) Children, families and disadvantage DWP Family Resources Survey 7
8 The FRS is the single most critical DWP research project Social welfare expenditure : DWP 175bln + HMRC (Tax Credits 29bln + Child Benefit 11bln)) = 215bln 33% of all UK Government expenditure FRS is a key input for DWP Policy Simulation Model DWP Pensim2 estimating the effects of pension reform IGOTM - Treasury and HM Revenue modelling of the effects of tax and welfare changes on households 8
9 What decisions has the FRS influenced? Universal Credit Personal Independence Payments Benefit uprating policy Spare Room Subsidy Workplace pension reform Single tier and workplace pension reforms HMT and HMRC costing and assessment of policies including High Income Child Benefit Charge and the Tax- Free Childcare Scheme. Assessing the impact of policies on particular groups e.g. disabled, ethnic minorities, pensioners etc. 9
10 FRS microdata quality is key for policy simulation purposes Quality has always been prioritised over timeliness Focus in face to face interviews on capturing detailed accurate, unbiased information data on income, tax and benefits and household characteristics With respondents encouraged to consult payslips, bills etc. as much as possible Focus on detailed editing of benefits data, income, savings, investments and other monetary amounts For many years it has taken 15 months from the end of fieldwork to publication 10
11 FRS end-to-end process Annual questionnaire development and testing Fieldwork Post interview checks: in Blaise (ONS/NatCen) Initial SAS-based editing (ONS) Data loading and validation on DWP systems Benefit editing Period codes Outliers Credibility checks Derived variables and imputation Further Benefit editing Mop ups Re run derived variables Further credibility checks Re run derived variables Final data checks Comparisons FRS data quality assurance Initial FRS dataset HBAI production and QA Final FRS and HBAI datasets 11
12 FRS production timetable Consortium FRS Team FRS Users Jun-13 Jul-13 Questionnaire Questionnaire Questionnaire Aug-13 Development Development Development Sep-13 Oct-13 Programme Nov-13 changes to Dec-13 questionnaire Jan-14 Feb-14 Questionnaire Questionnaire Mar-14 Testing Testing Apr-14 May-14 Jun-14 Jul-14 Aug-14 Sep-14 Questionnaire Oct-14 in the field Nov-14 Dec-14 Jan-15 Feb-15 Data converted Mar-15 and delivered Apr-15 to DWP May-15 Jun-15 Jul-15 Process data Aug-15 6 month data QA Sep-15 Oct-15 Nov-15 Dec month data QA Jan-16 Feb-16 Mar-16 Production of reports Production of reports Apr-16 May-16 Jun-16 Report / dataset release Report / dataset release 12
13 Improving timeliness processing review FRS end to end processing review was carried out, starting in 2014, using Lean Six Sigma process improvement methodology Lean Six Sigma combines the Lean focus on reducing waste and improving process flow with the Six Sigma focus on improving quality through reducing error and getting things right first time LSS provided a systematic approach to analysing FRS processes using the DMAIC review framework: Define, Measure, Analyse, Improve, Control Benefits have come through this year with FRS, HBAI and PI publications brought forward by 3 months Potential for further improvements in the next few years by continuing the LSS review cycle 13
14 Improving timeliness sources of improvement Ending fieldwork slightly early (no March cases reissued in April) Scheduling processing work as early as possible after fieldwork ends at ONS and scheduling work in quarterly batches at DWP Adding questionnaire checks to reduce post interview editing; Eliminating redundant checks Deciding on the optimal place for editing to be carried out (ONS or DWP) and reorganising work accordingly Improvements to SAS checking programmes and improvements to the DWP SAS interface functionality (improving speed) 14
15 FRS production timetable Consortium FRS Team FRS Users Jun-14 Jul-14 Questionnaire Questionnaire Questionnaire Aug-14 Development Development Development Sep-14 Oct-14 Programme Nov-14 changes to Dec-14 questionnaire Jan-15 Feb-15 Questionnaire Questionnaire Mar-15 Testing Testing Apr-15 May-15 Jun-15 Jul-15 Aug-15 Sep-15 Questionnaire Oct-15 in the field Nov-15 Dec-15 Jan-16 Feb-16 Data converted Mar-16 and delivered 6 month data QA Apr-16 to DWP May-16 Jun-16 Jul-16 Process data Aug-16 Sep month data QA Oct-16 Nov-16 Dec-16 Jan-17 Production of reports Production of reports Feb-17 Mar-17 Report / dataset release Report / dataset release Apr-17 May-17 Jun-17 15
16 Challenges and opportunities Challenges: - Falling response rates (60% in to 54% in ) means we are struggling to achieve the target of 20,000 participating households - New incentive strategy was introduced in , with a 10 unconditional Post Office voucher included with the advance letter to respondents, replacing the long-standing book of 6 First Class stamps - With response rates still falling, we are considering trialling alternatives - From the start of 2016 we have increased the issued sample - Opportunities: - We are currently developing plans for research into the potential for making use of administrative data to enhance the FRS both DWP benefits data and HMRC tax return data particularly data from the new Real Time Information systems. 16
17 What s new on the FRS FRS (published March 2017) - A set of questions on social and cultural participation replacing additional questions on material deprivation (to meet UK requirements for EU-SILC) - New questions on hourly rates of pay - Question on how pension wealth is drawn down during retirement. - Improvements to questions on the High Income Child Benefit Charge FRS (for Feb-March 2018 publication) - A section on access to services (replacing social and cultural participation) - Questions probing reasons for pay rates below the NMW/NLW - Improvements to the capture of child maintenance arrangements 17
18 What s new on the FRS FRS (for Feb-March 2019 publication) - Most questions specifically added for EU-SILC purposes since 2012 removed (178 items in total) - Revisions to childcare section, harmonising with CEYSP, covering 30 hours free childcare and tax-free childcare initiatives. - Extensive revisions to pensions section, to cover pension wealth drawdown - Self-employment duration - Experimental questions on expenditure (following the example of USoc innovation panel capturing expenditure with a one shot question) Numerous other minor updates and changes to the questionnaire are made each year to reflect changing categories, definitions etc. and in response to interviewer and processor feedback 18
19 FRS derived series Households Below Average Income Pensioners Incomes Series Income-Related Benefits: Estimates of Take-Up 19
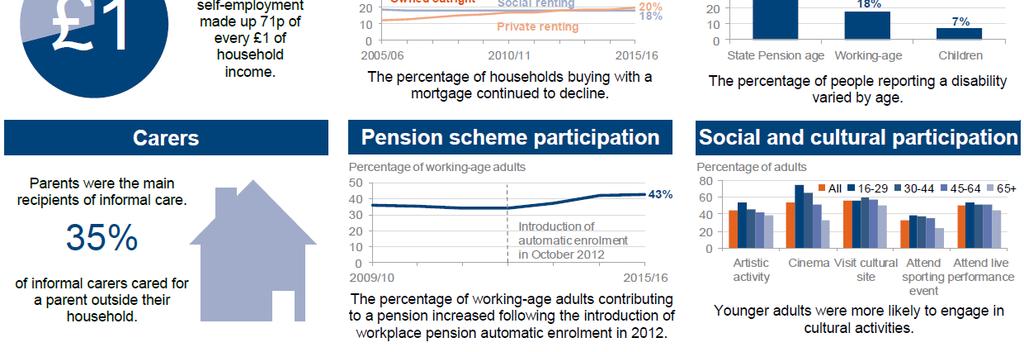
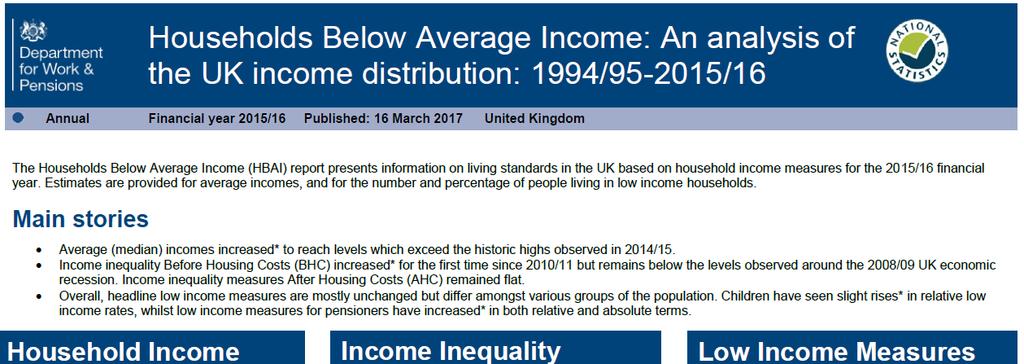
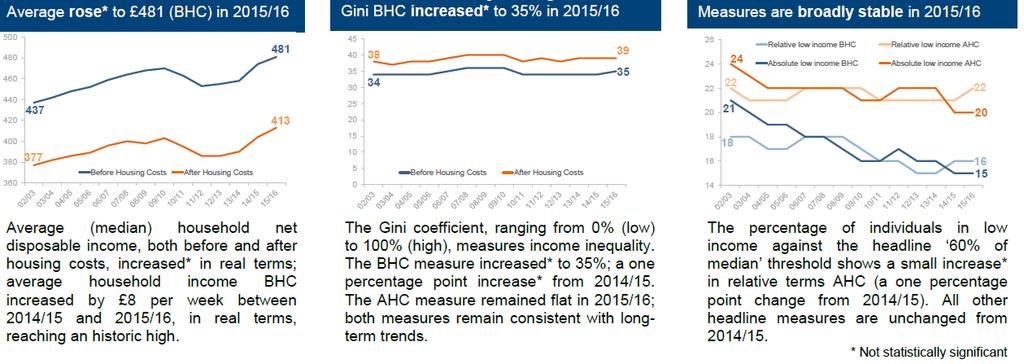
20 Households Below Average Income (HBAI) HBAI uses FRS data to measure the income distribution Income is measured as total weekly household income from all sources (including child income) after tax, national insurance and other deductions Adjustments are made to take account of inflation and problems with measuring the high-end of the distribution Income is equivalised i.e. adjusted to make it comparable across households of different size and composition. For example, equivalisation adjusts the income of a single person upwards, so their income can be compared directly to the standard of living for a couple 20
21 Measuring uncertainty for HBAI estimates Up to confidence intervals for HBAI estimates were calculated using an estimating function approach. From to , bootstrapping techniques have been used. The Institute for Fiscal Studies (IFS) were commissioned to develop the DWP methodology further to account as fully as possible for the specific features of the FRS sampling design and grossing. This new refined approach has been used for the HBAI estimates 21
22 Measuring uncertainty for HBAI estimates The new methodology produces: GB resamples simulating the FRS stratified, cluster sampling of GB households. NI resamples simulating the FRS stratified sampling of NI households. A unique set of grossing factors for each GB and NI resample, replicating the original HBAI grossing process, to produce lower and upper confidence intervals. Accounting for: Cluster sampling widens confidence intervals for most estimates, reflecting that this feature makes survey estimates less precise. Post-sample grossing to population totals narrows confidence intervals for estimates sensitive to incomes towards the very top of the income distribution, as specific control totals are set for high income individuals. 22
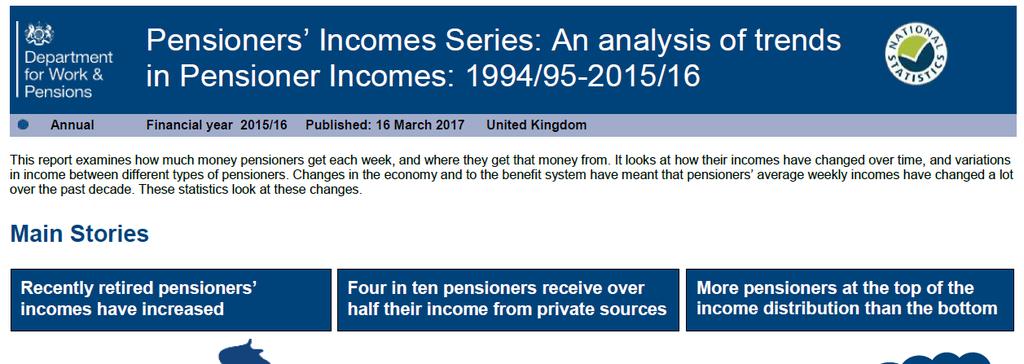
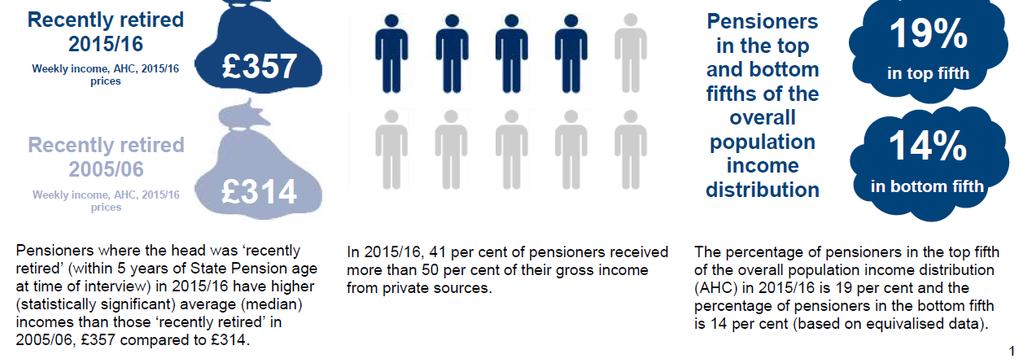
23 Pensioner Income Series (PI) PI uses HBAI data to analyse pensioner incomes by source and over time Examines how pensioners incomes differ from those of working age and variations in income between different types of pensioners. Changes in the economy and to the benefit system have meant that pensioners average weekly incomes have changed a lot over the past two decades. These statistics look at these changes 23
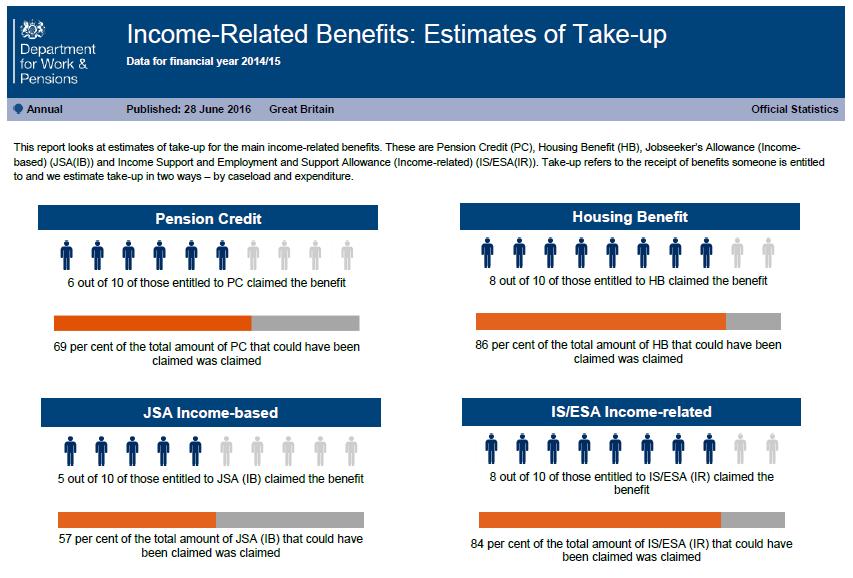
24 Income-Related Benefits: Estimates of Takeup Uses FRS data matched to administrative records to produce estimates of take-up for the main incomerelated benefits: Pension Credit Housing Benefit Jobseeker s Allowance (Income-based) and Income Support and Employment and Support Allowance (Income-related) Take-up refers to the receipt of benefits someone is entitled to and we estimate take-up in two ways by caseload and expenditure 24
25 Publication of 2015/16 data and results FRS, HBAI and PI results for were published on Thursday 16 March are available here: The datasets are available on UKDS website: Estimates of take-up for are due later this year We welcome all feedback 25
26 26
27 27
28 28
29 29
30 Welfare Reform and Work Act 2016 DWP is required under the act to by the end of each financial year on four income-related measures, three of which are reported in HBAI: Children living in households with equivalised net income less than 60% of median equivalised household income; Children living in households with equivalised net income less than 70% of median equivalised household income and who experience material deprivation; Children living in households with equivalised net income less than 60% of median equivalised household income, adjusted to take account of changes in the value of money since 2010/11; The fourth measure required under the act is: Children living in households where equivalised net income has been less than 60% of median equivalised net household income in at least 3 of the last 4 survey periods. We published experimental estimates of this measure using USoc data at the same time as the FRS, HBAI and PI last March. 30
31 Thank you 31
Family Resources Survey and related series update. Surveys Branch Department for Work and Pensions
 Family Resources Survey and related series update Surveys Branch Department for Work and Pensions Family Resources Survey Donncha Burke Households Below Average Income John Shale Pensioners Incomes Series
Introduction to the Family Resources Survey
 UK Data Archive Study Number 7753 - Family Resources Survey, 2013-2014 Introduction to the Family Resources Survey Updated June 2015 Contents Section 1: General... 2 1.1 Background... 2 1.2 Uses of Family
Living Costs and Food Survey and Household Finance Survey Update and developments
 Living Costs and Food Survey and Household Finance Survey Update and developments Jo Bulman, LCF Survey Manager Steven Dunstan, HFS Transformation Lead Social Survey Division Claudia Wells, Head of Household
Introduction to the Family Resources Survey
 UK Data Archive Study Number 6886 - Family Resources Survey, 2009-2010 Introduction to the Family Resources Survey Updated May 2011 Contents Section 1: General...2 1.1 Background...2 1.2 Uses of Family
Poverty and Income Inequality in Scotland: 2013/14 A National Statistics publication for Scotland
 Poverty and Income Inequality in Scotland: 2013/14 A National Statistics publication for Scotland EQUALITY, POVERTY AND SOCIAL SECURITY This publication presents annual estimates of the percentage and
Pensioners Incomes Series: An analysis of trends in Pensioner Incomes: 1994/ /16
 Pensioners Incomes Series: An analysis of trends in Pensioner Incomes: 1994/95-215/16 Annual Financial year 215/16 Published: 16 March 217 United Kingdom This report examines how much money pensioners
The Money Statistics. December.
 The Money Statistics December 2018 Welcome to the December 2018 edition of The Money Statistics, The Money Charity s monthly roundup of statistics about how we use money in the UK. If you have any questions,
Households Below Average Income (HBAI) Quality and Methodology Information Report
 Quality and Methodology Information Report") UK Data Archive Study Number 7196 - Family Resources Survey and Households Below Average Income: Safe Room Access Households Below Average Income (HBAI) Quality and Methodology Information Report 2016/17
UK Data Archive Study Number 7196 - Family Resources Survey and Households Below Average Income: Safe Room Access Households Below Average Income (HBAI) Quality and Methodology Information Report 2016/17
Local Child Poverty Measurement Frequently Asked Questions
 Local Child Poverty Measurement Frequently Asked Questions Measurement of child poverty... 2 1. How does the Government measure child poverty at a national level?... 2 2. How is local child poverty measured?...
Fraser of Allander Institute & Scottish Centre for Employment Research Scottish Labour Market Trends
 Fraser of Allander Institute & Scottish Centre for Employment Research Scottish Vol 2 No 3 The Fraser of Allander Institute (FAI) is a leading economic research institute with over 40 years of experience
FRS update and developments. Don Burke Principal Statistician Family Resources Survey Team
 FRS update and developments Don Burke Principal Statistician Family Resources Survey Team Contents Latest FRS and related publications National Statistics FRS quality review Reviews and revision projects
Poverty and income inequality in Scotland:
 A National Statistics Publication for Scotland Poverty and income inequality in Scotland: 2008-09 20 May 2010 This publication presents annual estimates of the proportion and number of children, working
Modelling the impact of policy interventions on income in Scotland
 Modelling the impact of policy interventions on income in Scotland Richard Marsh, Anouk Berthier and Thomas Kane, 4-consulting December 2017 This resource may also be made available on request in the following
RESTRICTED: STATISTICS
 Households Below Average Income 2008/09 Peter Matejic (DWP) HBAI Publication Private households in United Kingdom Main source DWP Family Resources Survey Measurement of living standards as determined by
Effects of taxes and benefits on UK household income: financial year ending 2017
 Statistical bulletin Effects of taxes and benefits on UK household income: financial year ending 2017 Analysis of how household incomes in the UK are affected by direct and indirect taxes and benefits
Household disposable income and inequality in the UK: financial year ending 2017
 Statistical bulletin Household disposable income and inequality in the UK: financial year ending 2017 Initial insight into main estimates of household incomes and inequality in the UK, along with analysis
Impact on households: distributional analysis to accompany Budget 2018
 Impact on households: distributional analysis to accompany Budget 2018 October 2018 Impact on households: distributional analysis to accompany Budget 2018 October 2018 Crown copyright 2018 This publication
Household Income Trends: August 2012 Issued September 2012
 Household Income Trends: August 2012 Issued September 2012 Gordon Green and John Coder Sentier Research, LLC For Immediate Release on Tuesday, September 25, 2012 Household Income Trends: August 2012 Copyright
Measuring Unemployment Some Key Terms
 Measuring Unemployment Some Key Terms Claimant Count (JSA) Labour Force Survey (LFS) The number of people officially claiming unemployment- related benefits must be actively seeking work All those actively
TERMS OF REFERENCE FOR THE INVESTMENT COMMITTEE
 I. PURPOSE The purpose of the Investment Committee (the Committee ) is to recommend to the Board the investment policy, including the asset mix policy and the appropriate benchmark for both ICBC and any
Child and working-age poverty from 2010 to 2020
 Child and working-age poverty from 2010 to 2020 Mike Brewer, Professor of Economics, ISER, University of Essex and Research Fellow, Institute for Fiscal Studies (drawing on work by James Browne, Rowena
Autumn 2017 Budget: Options for easing the squeeze
 Autumn 2017 Budget: Options for easing the squeeze Carl Emmerson and Thomas Pope Presentation at the Institute of Chartered Accountants in England and Wales London, 30 th October 2017 The March Budget
Quarterly Summary Report
 Quarterly Summary Report Produced by: Edition 11 March 2018 Connect Agent Hosted Dinner Thursday 21st June 18:00-21:30 Rockcliffe Hall, Darlington Join the mia, directors and booking staff from a selection
Equality and Human Rights Commission Research report 94 RESEARCH REPORT #94
 Equality and Human Rights Commission Research report 94 RESEARCH REPORT #94 Cumulative Impact Assessment: A Research Report by Landman Economics and the National Institute of Economic and Social Research
XML Publisher Balance Sheet Vision Operations (USA) Feb-02
 Feb-02") Page:1 Apr-01 May-01 Jun-01 Jul-01 ASSETS Current Assets Cash and Short Term Investments 15,862,304 51,998,607 9,198,226 Accounts Receivable - Net of Allowance 2,560,786
Page:1 Apr-01 May-01 Jun-01 Jul-01 ASSETS Current Assets Cash and Short Term Investments 15,862,304 51,998,607 9,198,226 Accounts Receivable - Net of Allowance 2,560,786
The British Household Panel Survey (BHPS) and its successor, Understanding Society (US)
 and its successor, Understanding Society (US)") The British Household Panel Survey (BHPS) and its successor, Understanding Society (US) Professor Karl Taylor Department of Economics 25 th March 2014 OUTLINE 1. Background BHPS 2. Sampling 3. Waves and
The British Household Panel Survey (BHPS) and its successor, Understanding Society (US) Professor Karl Taylor Department of Economics 25 th March 2014 OUTLINE 1. Background BHPS 2. Sampling 3. Waves and
Essential phases of register-based survey processing concerning timeliness
 Essential phases of register-based survey processing concerning timeliness EU-SILC workshop on best practices for EU-SILC revision: timeliness Marie Reijo, Senior Researcher E-mail: marie.reijo@stat.fi
Review of Registered Charites Compliance Rates with Annual Reporting Requirements 2016
 Review of Registered Charites Compliance Rates with Annual Reporting Requirements 2016 October 2017 The Charities Regulator, in accordance with the provisions of section 14 of the Charities Act 2009, carried
Household Income Trends: February 2012
 Household Income Trends: February 2012 Issued March 2012 Gordon Green and John Coder Sentier Research, LLC Household Income Trends: February 2012 Copyright 2012 by Sentier Research, LLC Summary of Findings
Contract Certainty Subscription Market Progress Update for FSA
 Programme Office Contract Certainty Subscription Market Progress Update for FSA 19th September 2006 Dane Douetil, Chair Market Reform Group The Market is making progress in line with expectations 100%
Factor Leave Accruals. Accruing Vacation and Sick Leave
 Factor Leave Accruals Accruing Vacation and Sick Leave Factor Leave Accruals As part of the transition of non-exempt employees to biweekly pay, the UC Office of the President also requires standardization
1.2 The purpose of the Finance Committee is to assist the Board in fulfilling its oversight responsibilities related to:
 Category: BOARD PROCESS Title: Terms of Reference for the Finance Committee Reference Number: AB-331 Last Approved: February 22, 2018 Last Reviewed: February 22, 2018 1. PURPOSE 1.1 Primary responsibility
The effects of changes to housing benefit in the private rented sector
 The effects of changes to housing benefit in the private rented sector Robert Joyce, Institute for Fiscal Studies Presentation at ESRI, Dublin 5 th March 2015 From joint work with Mike Brewer, James Browne,
Employment Support in the UK: Key statistics briefing
 Employment Support in the UK: Key statistics briefing This paper aims to give a brief overview of the UK employment picture in figures. For more information on any of the statistics below, contact ERSA
Spheria Australian Smaller Companies Fund
 29-Jun-18 $ 2.7686 $ 2.7603 $ 2.7520 28-Jun-18 $ 2.7764 $ 2.7681 $ 2.7598 27-Jun-18 $ 2.7804 $ 2.7721 $ 2.7638 26-Jun-18 $ 2.7857 $ 2.7774 $ 2.7690 25-Jun-18 $ 2.7931 $ 2.7848 $ 2.7764 22-Jun-18 $ 2.7771
SAS Forum UK 2015 Using SAS to model the distributional impact of government policies
 SAS Forum UK 2015 Using SAS to model the distributional impact of government policies Will Bryce Labour Markets and Distributional Analysis, HM Treasury 10 June 2015 About us Labour Markets and Distributional
Introduction to the UK Economy
 Introduction to the UK Economy What are the key objectives of macroeconomic policy? Price Stability (CPI Inflation of 2%) Growth of Real GDP (National Output) Falling Unemployment / Raising Employment
The Growth of In-Work Housing Benefit Claimants: Evidence and policy implications
 bshf The Growth of In-Work Housing Benefit Claimants: Evidence and policy implications The Growth of In-Work Housing Benefit Claimants: Evidence and policy implications Ben Pattison March 2012 Building
Chartered Society of Physiotherapy. CSP Membership (as at 1 st March 2018) & NHS Data (2009 to 2017) UK/England /N Ireland/Scotland/Wales
 & NHS Data (2009 to 2017) UK/England /N Ireland/Scotland/Wales") Chartered Society of Physiotherapy CSP Membership (as at 1 st March 2018) & NHS Data (2009 to 2017) UK/England /N Ireland/Scotland/Wales Summary 1. CSP Members by Country 2. CSP Total Members from 2014
Chartered Society of Physiotherapy CSP Membership (as at 1 st March 2018) & NHS Data (2009 to 2017) UK/England /N Ireland/Scotland/Wales Summary 1. CSP Members by Country 2. CSP Total Members from 2014
Business & Financial Services December 2017
 Business & Financial Services December 217 Completed Procurement Transactions by Month 2 4 175 15 125 1 75 5 2 1 Business Days to Complete 25 Jan Feb Mar Apr May Jun Jul Aug Sep Oct Nov Dec 217 Procurement
The Northern Ireland labour market is characterised by relatively. population of working age are not active in the labour market at
 INTRODUCTION The Northern Ireland labour market is characterised by relatively high levels of economic inactivity. Around 28 per cent of the population of working age are not active in the labour market
CYPRUS FINAL QUALITY REPORT
 CYPRUS FINAL QUALITY REPORT STATISTICS ON INCOME AND LIVING CONDITIONS 2009 CONTENTS Page PREFACE... 6 1. COMMON LONGITUDINAL EUROPEAN UNION INDICATORS 1.1. Common longitudinal EU indicators based on the
Housing and Welfare Reform
 Housing and Welfare Reform CIH South East Conference, Brighton 6 th March 2013 Andrew Parfitt Deputy Director of Housing Policy Andrew.parfitt@dwp.gsi.gov.uk Summary of reforms in relation to Housing (1)
CYPRUS FINAL QUALITY REPORT
 CYPRUS FINAL QUALITY REPORT STATISTICS ON INCOME AND LIVING CONDITIONS 2010 CONTENTS Page PREFACE... 6 1. COMMON LONGITUDINAL EUROPEAN UNION INDICATORS 1.1. Common longitudinal EU indicators based on the
The effect of changes to Local Housing Allowance on rent levels
 The effect of changes to Local Housing Allowance on rent levels Andrew Hood, Institute for Fiscal Studies Presentation at CASE Welfare Policy and Analysis seminar, LSE 21 st January 2015 From joint work
Great Britain (Numbers) All People 138,500 6,168,400 64,169,400 Males 69,400 3,040,300 31,661,600 Females 69,000 3,128,100 32,507,800
 All People 138,500 6,168,400 64,169,400 Males 69,400 3,040,300 31,661,600 Females 69,000 3,128,100 32,507,800") Labour Market Profile - The profile brings together data from several sources. Details about these and related terminology are given in the definitions section. Resident Population Total population (2017)
Labour Market Profile - The profile brings together data from several sources. Details about these and related terminology are given in the definitions section. Resident Population Total population (2017)
Performance Report October 2018
 Structured Investments Indicative Report October 2018 This report illustrates the indicative performance of all Structured Investment Strategies from inception to 31 October 2018 Matured Investment Strategies
Great Britain (Numbers) All People 176,200 6,168,400 64,169,400 Males 87,200 3,040,300 31,661,600 Females 89,000 3,128,100 32,507,800
 All People 176,200 6,168,400 64,169,400 Males 87,200 3,040,300 31,661,600 Females 89,000 3,128,100 32,507,800") Labour Market Profile - The profile brings together data from several sources. Details about these and related terminology are given in the definitions section. Resident Population Total population (2017)
Labour Market Profile - The profile brings together data from several sources. Details about these and related terminology are given in the definitions section. Resident Population Total population (2017)
All People 437,100 5,450,100 64,169,400 Males 216,700 2,690,500 31,661,600 Females 220,500 2,759,600 32,507,800. Kirklees (Numbers)
") Labour Market Profile - The profile brings together data from several sources. Details about these and related terminology are given in the definitions section. Resident Population Total population (2017)
Labour Market Profile - The profile brings together data from several sources. Details about these and related terminology are given in the definitions section. Resident Population Total population (2017)
FOR RELEASE: MONDAY, MARCH 21 AT 4 PM
 Interviews with 1,012 adult Americans conducted by telephone by Opinion Research Corporation on March 18-20, 2011. The margin of sampling error for results based on the total sample is plus or minus 3
All People 130,700 3,125,200 64,169,400 Males 63,500 1,540,200 31,661,600 Females 67,200 1,585,000 32,507,800. Vale Of Glamorgan (Numbers)
") Labour Market Profile - The profile brings together data from several sources. Details about these and related terminology are given in the definitions section. Resident Population Total population (2017)
Labour Market Profile - The profile brings together data from several sources. Details about these and related terminology are given in the definitions section. Resident Population Total population (2017)
Brighton And Hove (Numbers) All People 288,200 9,080,800 64,169,400 Males 144,800 4,474,400 31,661,600 Females 143,400 4,606,400 32,507,800
 All People 288,200 9,080,800 64,169,400 Males 144,800 4,474,400 31,661,600 Females 143,400 4,606,400 32,507,800") Labour Market Profile - The profile brings together data from several sources. Details about these and related terminology are given in the definitions section. Resident Population Total population (2017)
Labour Market Profile - The profile brings together data from several sources. Details about these and related terminology are given in the definitions section. Resident Population Total population (2017)
Benefit units in receipt of at least one income related benefit or tax credit, and the number of individuals within those benefit units, Great
 Benefit units in receipt of at least one income related benefit or tax credit, and the number of individuals within those benefit units, Great Britain July 2012 1 Background This analysis has been carried
Tonbridge And Malling (Numbers) All People 128,900 9,080,800 64,169,400 Males 63,100 4,474,400 31,661,600 Females 65,800 4,606,400 32,507,800
 All People 128,900 9,080,800 64,169,400 Males 63,100 4,474,400 31,661,600 Females 65,800 4,606,400 32,507,800") Labour Market Profile - The profile brings together data from several sources. Details about these and related terminology are given in the definitions section. Resident Population Total population (2017)
Labour Market Profile - The profile brings together data from several sources. Details about these and related terminology are given in the definitions section. Resident Population Total population (2017)
Great Britain (Numbers) All People 141,000 9,080,800 64,169,400 Males 68,900 4,474,400 31,661,600 Females 72,100 4,606,400 32,507,800
 All People 141,000 9,080,800 64,169,400 Males 68,900 4,474,400 31,661,600 Females 72,100 4,606,400 32,507,800") Labour Market Profile - The profile brings together data from several sources. Details about these and related terminology are given in the definitions section. Resident Population Total population (2017)
Labour Market Profile - The profile brings together data from several sources. Details about these and related terminology are given in the definitions section. Resident Population Total population (2017)
WESTWOOD LUTHERAN CHURCH Summary Financial Statement YEAR TO DATE - February 28, Over(Under) Budget WECC Fund Actual Budget
 Budget WECC Fund Actual Budget") WESTWOOD LUTHERAN CHURCH Summary Financial Statement YEAR TO DATE - February 28, 2018 General Fund Actual A B C D E F WECC Fund Actual Revenue Revenue - Faith Giving 1 $ 213 $ 234 $ (22) - Tuition $ 226
WESTWOOD LUTHERAN CHURCH Summary Financial Statement YEAR TO DATE - February 28, 2018 General Fund Actual A B C D E F WECC Fund Actual Revenue Revenue - Faith Giving 1 $ 213 $ 234 $ (22) - Tuition $ 226
January 2019 Data Release
 Mar-11 Apr-11 May-11 Jun-11 Jul-11 Aug-11 Sep-11 Oct-11 Nov-11 Dec-11 Jan-12 Feb-12 Mar-12 Apr-12 May-12 Jun-12 Jul-12 Aug-12 Sep-12 Oct-12 Nov-12 Dec-12 Jan-13 Feb-13 Mar-13 Apr-13 May-13 Jun-13 Jul-13
PPI PENSIONS POLICY INSTITUTE. Pension Facts May 2017
 PPI Pension Facts May 2017 The PPI has collected this data from a variety of sources, reflecting the latest available information. The PPI cannot confirm the accuracy of primary source data. Pension Facts
Too Big to Fail: Discussion of Quantifying Subsidies for SIFIs. Philip E. Strahan, Boston College & NBER. Minneapolis Fed.
 Too Big to Fail: Discussion of Quantifying Subsidies for SIFIs Philip E. Strahan, Boston College & NBER Minneapolis Fed November 13 Distortions for TBTF borrowers Debt is too cheap for TBTF firms and not
Common stock prices 1. New York Stock Exchange indexes (Dec. 31,1965=50)2. Transportation. Utility 3. Finance
2. Transportation. Utility 3. Finance") Digitized for FRASER http://fraser.stlouisfed.org/ Federal Reserve Bank of St. Louis 000 97 98 99 I90 9 9 9 9 9 9 97 98 99 970 97 97 ""..".'..'.."... 97 97 97 97 977 978 979 980 98 98 98 98 98 98 987 988
Digitized for FRASER http://fraser.stlouisfed.org/ Federal Reserve Bank of St. Louis 000 97 98 99 I90 9 9 9 9 9 9 97 98 99 970 97 97 ""..".'..'.."... 97 97 97 97 977 978 979 980 98 98 98 98 98 98 987 988
A NEW POVERTY BENCHMARK FOR BASIC INCOME SCHEMES by ANNIE MILLER
 ABSTRACT A NEW POVERTY BENCHMARK FOR BASIC INCOME SCHEMES by ANNIE MILLER (AnnieMillerBI@gmail.com) The official EU poverty benchmark, defined as 0.6 median household equivalised income, (with two versions
PPI PENSIONS POLICY INSTITUTE. The Pensions Primer: A guide to the UK pensions system. Historical Annex
 PPI The Pensions Primer: A guide to the UK pensions system Historical Annex The Pensions Primer: a guide to the UK pensions system Historical Annex Introduction 1 First tier: Eligibility for Basic State
The introduction of new methods for price observations in the Consumer Price Index (CPI) New methods for airline tickets and package holidays
 New methods for airline tickets and package holidays") Statistics Netherlands Economics, Enterprises and NA Government Finance and Consumer Prices P.O.Box 24500 2490 HA Den Haag The Netherlands The introduction of new methods for price observations in the
Statistics Netherlands Economics, Enterprises and NA Government Finance and Consumer Prices P.O.Box 24500 2490 HA Den Haag The Netherlands The introduction of new methods for price observations in the
Great Britain (Numbers) All People 7,700 8,825,000 64,169,400 Males 4,200 4,398,800 31,661,600 Females 3,500 4,426,200 32,507,800
 All People 7,700 8,825,000 64,169,400 Males 4,200 4,398,800 31,661,600 Females 3,500 4,426,200 32,507,800") Labour Market Profile - The profile brings together data from several sources. Details about these and related terminology are given in the definitions section. Resident Population Total population (2017)
Labour Market Profile - The profile brings together data from several sources. Details about these and related terminology are given in the definitions section. Resident Population Total population (2017)
Great Britain (Numbers) All People 348,000 8,825,000 64,169,400 Males 184,000 4,398,800 31,661,600 Females 164,000 4,426,200 32,507,800
 All People 348,000 8,825,000 64,169,400 Males 184,000 4,398,800 31,661,600 Females 164,000 4,426,200 32,507,800") Labour Market Profile - The profile brings together data from several sources. Details about these and related terminology are given in the definitions section. Resident Population Total population (2017)
Labour Market Profile - The profile brings together data from several sources. Details about these and related terminology are given in the definitions section. Resident Population Total population (2017)
Survey under-coverage of top incomes and estimation of inequality: what is the role of the UK s SPI adjustment?
 8 Survey under-coverage of top incomes and estimation of inequality: what is the role of the UK s SPI adjustment? Richard V. Burkhauser University of Texas-Austin, University of Melbourne, and Cornell
Income inequality and mobility in Australia over the last decade
 Income inequality and mobility in Australia over the last decade Roger Wilkins Meeting of National Economic Research Organisations, OECD Headquarters, 18 June 2012 1993-94 1994-95 1995-96 1996-97 1997-98
Credit crunched: Single parents, universal credit and the struggle to make work pay
 1. Introduction Credit crunched: Single parents, universal credit and the struggle to make work pay Professor Mike Brewer, Dr Paola DeAgostini Institute of Social and Economic Research, Essex University
FAMILY RESOURCES SURVEY URBAN RURAL REPORT NORTHERN IRELAND
 FAMILY RESOURCES SURVEY URBAN RURAL REPORT NORTHERN IRELAND 2012-13 Published 5 th March 2015 Crown Copyright 2015 Published by: Analytical Services Unit ISBN 978-1-904105-86-2 ISSN ISSN 1746-4641 (Print)
Great Britain (Numbers) All People 186,600 6,130,500 63,785,900 Males 92,600 3,021,700 31,462,500 Females 94,000 3,108,900 32,323,500
 All People 186,600 6,130,500 63,785,900 Males 92,600 3,021,700 31,462,500 Females 94,000 3,108,900 32,323,500") Labour Market Profile - The profile brings together data from several sources. Details about these and related terminology are given in the definitions section. Resident Population Total population (2016)
Labour Market Profile - The profile brings together data from several sources. Details about these and related terminology are given in the definitions section. Resident Population Total population (2016)
Great Britain (Numbers) All People 267,500 9,080,800 64,169,400 Males 132,500 4,474,400 31,661,600 Females 135,000 4,606,400 32,507,800
 All People 267,500 9,080,800 64,169,400 Males 132,500 4,474,400 31,661,600 Females 135,000 4,606,400 32,507,800") Labour Market Profile - The profile brings together data from several sources. Details about these and related terminology are given in the definitions section. Resident Population Total population (2017)
Labour Market Profile - The profile brings together data from several sources. Details about these and related terminology are given in the definitions section. Resident Population Total population (2017)
Great Britain (Numbers) All People 325,300 4,724,400 63,785,900 Males 164,500 2,335,000 31,462,500 Females 160,800 2,389,400 32,323,500
 All People 325,300 4,724,400 63,785,900 Males 164,500 2,335,000 31,462,500 Females 160,800 2,389,400 32,323,500") Labour Market Profile - The profile brings together data from several sources. Details about these and related terminology are given in the definitions section. Resident Population Total population (2016)
Labour Market Profile - The profile brings together data from several sources. Details about these and related terminology are given in the definitions section. Resident Population Total population (2016)
Great Britain (Numbers) All People 49,600 5,559,300 64,169,400 Males 24,000 2,734,200 31,661,600 Females 25,700 2,825,100 32,507,800
 All People 49,600 5,559,300 64,169,400 Males 24,000 2,734,200 31,661,600 Females 25,700 2,825,100 32,507,800") Labour Market Profile - The profile brings together data from several sources. Details about these and related terminology are given in the definitions section. Resident Population Total population (2017)
Labour Market Profile - The profile brings together data from several sources. Details about these and related terminology are given in the definitions section. Resident Population Total population (2017)
Great Britain (Numbers) All People 140,700 9,026,300 63,785,900 Males 68,100 4,447,200 31,462,500 Females 72,600 4,579,100 32,323,500
 All People 140,700 9,026,300 63,785,900 Males 68,100 4,447,200 31,462,500 Females 72,600 4,579,100 32,323,500") Labour Market Profile - The profile brings together data from several sources. Details about these and related terminology are given in the definitions section. Resident Population Total population (2016)
Labour Market Profile - The profile brings together data from several sources. Details about these and related terminology are given in the definitions section. Resident Population Total population (2016)
All People 280,000 6,168,400 64,169,400 Males 138,200 3,040,300 31,661,600 Females 141,800 3,128,100 32,507,800. Central Bedfordshire (Numbers)
") Labour Market Profile - The profile brings together data from several sources. Details about these and related terminology are given in the definitions section. Resident Population Total population (2017)
Labour Market Profile - The profile brings together data from several sources. Details about these and related terminology are given in the definitions section. Resident Population Total population (2017)
Hammersmith And Fulham (Numbers) All People 183,000 8,825,000 64,169,400 Males 90,400 4,398,800 31,661,600 Females 92,600 4,426,200 32,507,800
 All People 183,000 8,825,000 64,169,400 Males 90,400 4,398,800 31,661,600 Females 92,600 4,426,200 32,507,800") Labour Market Profile - The profile brings together data from several sources. Details about these and related terminology are given in the definitions section. Resident Population Total population (2017)
Labour Market Profile - The profile brings together data from several sources. Details about these and related terminology are given in the definitions section. Resident Population Total population (2017)
Great Britain (Numbers) All People 283,500 7,224,000 63,785,900 Males 140,400 3,563,200 31,462,500 Females 143,100 3,660,800 32,323,500
 All People 283,500 7,224,000 63,785,900 Males 140,400 3,563,200 31,462,500 Females 143,100 3,660,800 32,323,500") Labour Market Profile - The profile brings together data from several sources. Details about these and related terminology are given in the definitions section. Resident Population Total population (2016)
Labour Market Profile - The profile brings together data from several sources. Details about these and related terminology are given in the definitions section. Resident Population Total population (2016)
North West Leicestershire (Numbers) All People 98,600 4,724,400 63,785,900 Males 48,900 2,335,000 31,462,500 Females 49,800 2,389,400 32,323,500
 All People 98,600 4,724,400 63,785,900 Males 48,900 2,335,000 31,462,500 Females 49,800 2,389,400 32,323,500") Labour Market Profile - The profile brings together data from several sources. Details about these and related terminology are given in the definitions section. Resident Population Total population (2016)
Labour Market Profile - The profile brings together data from several sources. Details about these and related terminology are given in the definitions section. Resident Population Total population (2016)
Great Britain (Numbers) All People 64,000 6,168,400 64,169,400 Males 31,500 3,040,300 31,661,600 Females 32,500 3,128,100 32,507,800
 All People 64,000 6,168,400 64,169,400 Males 31,500 3,040,300 31,661,600 Females 32,500 3,128,100 32,507,800") Labour Market Profile - The profile brings together data from several sources. Details about these and related terminology are given in the definitions section. Resident Population Total population (2017)
Labour Market Profile - The profile brings together data from several sources. Details about these and related terminology are given in the definitions section. Resident Population Total population (2017)
All People 263,400 5,450,100 64,169,400 Males 129,400 2,690,500 31,661,600 Females 134,000 2,759,600 32,507,800. Rotherham (Numbers)
") Labour Market Profile - The profile brings together data from several sources. Details about these and related terminology are given in the definitions section. Resident Population Total population (2017)
Labour Market Profile - The profile brings together data from several sources. Details about these and related terminology are given in the definitions section. Resident Population Total population (2017)
All People 175,800 5,860,700 64,169,400 Males 87,400 2,904,300 31,661,600 Females 88,400 2,956,400 32,507,800. Telford And Wrekin (Numbers)
") Labour Market Profile - The profile brings together data from several sources. Details about these and related terminology are given in the definitions section. Resident Population Total population (2017)
Labour Market Profile - The profile brings together data from several sources. Details about these and related terminology are given in the definitions section. Resident Population Total population (2017)
Consumer confidence and economic climate indicators continue to increase
 %/3mma Business and Consumer Surveys July 2017 28 July 2017 Consumer confidence and economic climate indicators continue to increase The Consumer confidence indicator increased in July, resuming the positive
TAX CREDITS MOVING ON TO UNIVERSAL CREDIT
 TAX CREDITS MOVING ON TO UNIVERSAL CREDIT Child Poverty Action Group works on behalf of the one in four children in Scotland growing up in poverty. It doesn t have to be like this. We use our understanding
4 Distribution of Income, Earnings and Wealth
 NERI Quarterly Economic Facts Autumn 2014 4 Distribution of Income, Earnings and Wealth Indicator 4.1 Indicator 4.2a Indicator 4.2b Indicator 4.3a Indicator 4.3b Indicator 4.4 Indicator 4.5a Indicator
Stockton-On- Tees (Numbers) All People 196,500 2,644,700 64,169,400 Males 96,800 1,297,900 31,661,600 Females 99,700 1,346,800 32,507,800
 All People 196,500 2,644,700 64,169,400 Males 96,800 1,297,900 31,661,600 Females 99,700 1,346,800 32,507,800") Labour Market Profile - The profile brings together data from several sources. Details about these and related terminology are given in the definitions section. Resident Population Total population (2017)
Labour Market Profile - The profile brings together data from several sources. Details about these and related terminology are given in the definitions section. Resident Population Total population (2017)
All People 295,800 2,644,700 64,169,400 Males 149,400 1,297,900 31,661,600 Females 146,400 1,346,800 32,507,800. Newcastle Upon Tyne (Numbers)
") Labour Market Profile - The profile brings together data from several sources. Details about these and related terminology are given in the definitions section. Resident Population Total population (2017)
Labour Market Profile - The profile brings together data from several sources. Details about these and related terminology are given in the definitions section. Resident Population Total population (2017)
UK Statistics. December Contents
 UK Statistics December 2014 Contents Retail Prices Index (RPI) 3 RPI Annual Inflation () 3 Consumer Prices Index (CPI) 4 CPI Annual Inflation () 4 Average Earnings Index 5 Average Weekly Earnings 6 AVC
Great Britain (Numbers) All People 2,300 5,517,000 63,785,900 Males 1,200 2,712,300 31,462,500 Females 1,100 2,804,600 32,323,500
 All People 2,300 5,517,000 63,785,900 Males 1,200 2,712,300 31,462,500 Females 1,100 2,804,600 32,323,500") Labour Market Profile - The profile brings together data from several sources. Details about these and related terminology are given in the definitions section. Resident Population Total population (2016)
Labour Market Profile - The profile brings together data from several sources. Details about these and related terminology are given in the definitions section. Resident Population Total population (2016)
Consumer confidence and economic climate indicators increase
 %/3mma Business and Consumer Surveys March 2017 March, 30 th 2017 Consumer confidence and economic climate indicators increase The Consumer confidence indicator increased between September and March, resuming
Great Britain (Numbers) All People 259,900 5,860,700 64,169,400 Males 128,900 2,904,300 31,661,600 Females 131,000 2,956,400 32,507,800
 All People 259,900 5,860,700 64,169,400 Males 128,900 2,904,300 31,661,600 Females 131,000 2,956,400 32,507,800") Labour Market Profile - Wolverhampton The profile brings together data from several sources. Details about these and related terminology are given in the definitions section. Resident Population Total
Labour Market Profile - Wolverhampton The profile brings together data from several sources. Details about these and related terminology are given in the definitions section. Resident Population Total
Poverty Fact Book. Data, Information and Analysis for Leeds. Financial Inclusion Team
 Poverty Fact Book Data, Information and Analysis for Leeds Financial Inclusion Team March 2018 About the Poverty Fact Book The Poverty Fact Book was developed to be a useful document to share widely across
April 2018 Data Release
 April 2018 Data Release The Home Purchase Sentiment Index (HPSI) is a composite index designed to track consumers housing-related attitudes, intentions, and perceptions, using six questions from the National
Poverty. David Phillips, p, IFS May 21 st, Institute for Fiscal Studies
 Poverty David Phillips, p, IFS May 21 st, 2010 Poverty: the story under Labour After poverty rose between 2004/5 and 2007/8 200,000000 for each of pensioners and children 200,000 for working age adults
OTHER DEPOSITS FINANCIAL INSTITUTIONS DEPOSIT BARKAT SAVING ACCOUNT
 WEIGHTAGES JAN FEB MAR APR MAY JUN JUL AUG SEPT OCT NOV DEC ANNOUNCEMENT DATE 19.Dez.14 27.Jän.15 24.Feb.15 26.Mär.15 27.Apr.15 26.Mai.15 25.Jun.15 28.Jul.15 26.Aug.15 23.Sep.15 27.Okt.15 25.Nov.15 MUDARIB
Consumer Price Index (Base year 2014) Consumer Price Index
 Consumer Price Index") Consumer Price Index December 2017 (Base year 2014) Consumer Price Index 1 Release Date: January 2018 Detailed by: Expenditure groups Household welfare levels Household type Regions Briefing This publication
Consumer Price Index December 2017 (Base year 2014) Consumer Price Index 1 Release Date: January 2018 Detailed by: Expenditure groups Household welfare levels Household type Regions Briefing This publication
Using projections to manage your programs
 Using projections to manage your programs To project total provider reimbursements To do what ifs based on caseloads or other metrics To project amounts of admin & support available for spending Based
2015 SURVEY OF ISRAEL HEDGE FUNDS
 2015 SURVEY OF ISRAEL HEDGE FUNDS JUNE 2015 INTRODUCTION We are pleased to release the third annual comprehensive survey of the Israeli hedge fund industry. The survey highlights many encouraging trends
The cumulative impact of tax and welfare reforms
 The cumulative impact of tax and welfare reforms Jonathan Portes, Aubergine Analysis and King s College London Howard Reed, Landman Economics 2018 Equality and Human Rights Commission First published March