Evaluating continuous training programs using the generalized propensity score
|
|
|
- Oscar Rice
- 5 years ago
- Views:
Transcription
1 Evaluating continuous training programs using the generalized propensity score Jochen Kluve RWI Essen and IZA Bonn Hilmar Schneider IZA Bonn Arne Uhlendorff IZA Bonn and DIW Berlin Zhong Zhao Renmin University of China and IZA Bonn 23 June 2009 Abstract. This paper assesses the dynamics of treatment effects arising from variation in the duration of training. We use German administrative data that have the extraordinary feature that the amount of treatment varies continuously from 10 days to 395 days (i.e. 13 months). This feature allows us to estimate a continuous dose-response function that relates each value of the dose, i.e. days of training, to the individual post-treatment employment probability (the response). The dose-response function is estimated after adjusting for covariate imbalance using the generalized propensity score, a recently developed method for covariate adjustment under continuous treatment regimes. Our data have the advantage that we can consider both the actual and planned training durations as treatment variables: If only actual durations are observed, treatment effect estimates may be biased because of endogenous exits. Our results indicate an increasing dose-response function for treatments of up to 100 days, which then flattens out. That is, longer training programs do not seem to add an additional treatment effect. JEL Codes: C21, J68 Keywords: Training, program evaluation, continuous treatment, generalized propensity score. Word Count: 9,370 words We would like to thank Deborah Cobb-Clark, Dan Hamermesh, Oscar Mitnik, Peter Mueser, Donald Parsons, Ulf Rinne, Gerard van den Berg, participants of the VfS Conference in Munich, the COST meeting in St. Gallen, and seminars at the George Washington University, Renmin University of China, the World Bank and the Washington Statistical Society for valuable discussions and helpful comments and Jan Stuhler for excellent research assistance. Arne Uhlendorff also thanks DIW DC, where part of this research was pursued during his stay in fall The usual disclaimer applies. Correspondence: kluve@rwi-essen.de, schneider@iza.org, uhlendorff@iza.org, mr.zhong.zhao@gmail.com
2 1. Introduction Over recent years there has been an increasing amount of research on the effectiveness of labor market training programs in many countries. Training programs represent the "classic" type of so-called active labor market programs, due to their objective of enhancing participants' employment prospects by increasing their human capital. While the evidence on early training programs in the 1970s and 1980s showed relatively optimistic results, the more recent research from the 1990s and 2000s generally based on much better data and advanced econometric methods points to the result that training programs seem to be modestly effective at best (Heckman, LaLonde and Smith 1999, Kluve 2006). Adding to this general finding, one recent line of research shows that positive treatment effects may only materialize in the long run, and that program effectiveness can show a considerable dynamic ranging from often severe short-term locking-in effects to long-term gains in employment prospects (e.g. Lechner, Miquel and Wunsch 2004). In this paper we contribute to the literature on training programs by focusing on the dynamics inherent to the provision of training, i.e. we study the treatment effects that arise from variation in the treatment duration. We implement this analysis on the basis of data on training programs in Germany. The key feature of the data is the fact that the treatment duration varies almost continuously from approximately 1 week duration up to approximately 13 months. We focus on programs in which no specific degree is acquired as part of the program requirements this is the majority of training programs in Germany (about 70% in 2000, for instance). 1 Participants in these programs learn specific skills required for a certain vocation, like computer aided design for technicians, or receive qualifications that are of general vocational use, like general computer skills. In this paper we compare the impact of being trained within the same program type, but with different durations on the subsequent employment probability. The evaluation question that corresponds to the continuous administering of training is how effective (relative to each other) are training programs with different durations? This assessment of the dynamics of treatment duration essentially amounts to estimating a doseresponse function as proposed in Hirano and Imbens (2004). In this paper we therefore estimate the responses i.e. the employment probability that correspond to specific values of continuous doses i.e. training of a particular length. In a setting in which doses are not 1 Training programs leading to the acquisition of a degree are not considered, since the degree requirement generates discontinuities in the distribution of treatment durations, and the objective of the analysis in this paper is to estimate the employment outcomes associated with each level of a continuous treatment
3 administered under experimental conditions, estimation of a dose-response function is possible using the generalized propensity score (GPS). The GPS for continuous treatments is a straightforward extension of the well-established and widely used propensity score methodology for binary treatments (Rosenbaum and Rubin 1983) and multi-valued treatments (Imbens 2000, Lechner 2001). The GPS methodology is developed in Hirano and Imbens (2004) and Imai and van Dyk (2004). Similar to the binary and multi-valued treatment propensity score methods it is assumed that conditional on observable characteristics the level of treatment received can be considered as random. Hirano and Imbens (2004) show that the GPS has a balancing property similar to the balancing property of the "classic" propensity score. This implies that individuals within the same strata of the GPS should look identical in terms of their observable characteristics, independent of their level of treatment. Compared to propensity score methods for multi-valued treatments, the GPS has the advantage that we do not have to discretize the continuously distributed training duration, and are thus able to make use of more comprehensive information. To our knowledge, our paper along with parallel work by Flores-Lagunes, Gonzalez and Neuman (2007) constitute the first applications of the GPS in the context of evaluating active labor market policy. In implementing the GPS approach, our data have the advantage that we can consider both the actual and planned training durations as treatment variables: If only actual durations are observed, treatment effect estimates may be biased because of endogenous exits. This could be the case, for instance, if observed durations are shorter than the initially planned durations, because people exit from the program early if they find a job. The bias could also point the other way, if a substantial fraction of program participants drops out early. We investigate these issues by taking into account both the actual and planned durations of individual program participants. Our results indicate that in some settings standard regression-type adjustments may not be sufficient to remove all observable bias and may lead to different conclusions than the proposed GPS approach. The availability of planned training duration variable also allows us to test the exogeneity of observed training duration, since planned training duration was determined before the start of treatment, and can be used as an instrumental variable for observed training duration in order to deal with endogenous exits. This approach does not help to control for potential selection into planned program duration based on unobservables. However, it seems plausible that the planned duration is exogenous once we control for the detailed observed characteristics including previous labor market history. Potential endogeneity could mainly occur due to - 2 -
4 reverse causality, i.e., participants leave the program because they received a job offer, or due to the fact that some individuals leave the program because they expect no further benefits from continuing the program. The paper is organized as follows. Section 2 describes the methodology of estimating a doseresponse function to evaluate a continuous policy measure, adjusting for the generalized propensity score. Section 3 gives details on the data and the treatment we study. The fourth section contains the empirical implementation. It discusses the plausibility of the unconfoundedness assumption, it details the GPS estimation, the balancing of covariates and the common support condition, and it presents the results from estimating the dose-response function. Section 5 contains several robustness checks. Section 6 concludes. 2. Bias removal using the Generalized Propensity Score Research in program evaluation in recent years has made comprehensive use of matching methods 2. In the absence of experimental data, which is largely the case, the popularity of matching is due to its intuitively appealing technique of mimicking an experiment ex post. The standard case, which is also appropriate for the majority of applications, considers a binary treatment. One of the key results that have made matching such an attractive empirical tool is developed in Rosenbaum and Rubin (1983), who show that, rather than conditioning on the full set of covariates, conditioning on the propensity score i.e. the probability of receiving the treatment given the covariates is sufficient to balance treatment and comparison groups. Subsequently, the literature has extended propensity score methods to the cases of multivalued treatments (Imbens 2000, Lechner 2001) and, more recently, continuous treatments (Imbens 2000, Behrmann, Cheng and Todd 2004, Hirano and Imbens 2004, Imai and van Dyk 2004). In this paper, we build on the approach developed by Hirano and Imbens (2004) who propose estimating the entire dose-response function (DRF) of a continuous treatment. This approach fits perfectly with the objective of our paper, since we are interested in the response i.e. the post-treatment employment probability associated with each value of the continuous dose, i.e. the days spent in training. Alternatively we could discretize the 2 Cf. inter alia the overview given in Augurzky and Kluve (2007) and articles in a recent symposium on the econometrics of matching in The Review of Economics and Statistics (2004, Vol. 86, No. 1, pp ), in particular the survey article by Imbens (2004)
5 continuously distributed treatment variable and apply propensity score methods for multivalued treatments. The GPS, though, has the advantage that it makes use of the entire information contained in the distribution of treatment duration. 2.1 The GPS methodology Hirano and Imbens (2004) develop the GPS methodology in the context of the potential outcomes model for estimation of causal effects of treatments. In what follows we closely follow their presentation. Suppose we have a random sample of units, indexed by i=1,,n. For each unit i there exists a set of potential outcomes Y i (t) for t I, referred to as the unitlevel dose-response function. In the continuous case, I is an interval [t 0, t 1 ], whereas in the binary case it would be I = {0,1 }. Our objective is to estimate the average dose-response function (ADRF) μ ( t) = E[ Y ( t)]. For each unit i, we observe a vector of covariates X i, the i level T i of the treatment that unit i actually receives, with T t 0, t i ], and the potential [ 1 outcome corresponding to the level of treatment received, Y = Y T ). In the remainder of this section the subscript i will be omitted to simplify notation. i i ( i The key assumption of Hirano and Imbens (2004) generalizes the unconfoundedness assumption for binary treatments made by Rosenbaum and Rubin (1983) to the continuous case: (1) Y ( t) T X for all t I. Hirano and Imbens (2004) refer to this as weak unconfoundedness, since it only requires conditional independence to hold for each value of the treatment, rather than joint independence of all potential outcomes. Calling r( t, x) = f ( t x) the conditional density of the treatment given the covariates, the Generalized Propensity Score (GPS) is defined as T X (2) R = r( T, X ). The GPS has a balancing property similar to the balancing property of the propensity score for binary treatments. Within strata with the same value of r ( t, X ) the probability that T=t does not depend on the value of X, i.e. the GPS has the property that X 1 { T = t} r( t, X ). Hirano and Imbens (2004) emphasize that this is a mechanical implication of the definition of the GPS and does not require unconfoundedness. In combination with unconfoundedness, - 4 -
6 however, it implies that assignment to treatment is unconfounded given the GPS. That is, Hirano and Imbens (2004) prove that, if assignment to treatment is weakly unconfounded given covariates X, then it is also weakly unconfounded given the Generalized Propensity Score. Given this result, it is possible to use the GPS to remove bias associated with differences in covariates in two steps. The first step is to estimate the conditional expectation of the outcome as a function of two scalar variables, the treatment level T and the GPS R, i.e. (3) β ( t, r) = E[ Y T = t, R = r]. The second step is to estimate the DRF at each particular level of the treatment. This is implemented by averaging the conditional expectation function over the GPS at that particular level of the treatment, (4) μ ( t) = E[ β ( t, r( t, X ))]. The procedure does not average over the GPS R=r(T,X), but instead it averages over the score evaluated at the treatment level of interest r(t,x). Hirano and Imbens (2004) also emphasize that the regression function β ( t, r) does not have a causal interpretation, but that μ (t) corresponds to the value of the DRF for treatment value t, which compared to another treatment level t' does have a causal interpretation. 2.2 Implementation In the practical implementation of the methodology outlined in the previous section, we use a normal distribution for the treatment given the covariates (5) T X ~ N( β + β ' X,?, i i 0 1 i σ which we estimate by ordinary least squares regression (OLS). It is possible to assume other distributions than the normal distribution, and estimate the GPS by other methods such as maximum likelihood. The key point here, however, is to make sure that the covariates are balanced after adjusting for the GPS: As long as sufficient covariate balance is achieved, the - 5 -
7 exact procedure of estimating the GPS is of secondary importance. 3 The estimated GPS is calculated as 1 1 (6) Rˆ ( ˆ ˆ i = exp( Ti β 0 β1' X i )?. 2πσˆ ² 2 ˆ σ ² In the second stage we calculate the conditional expectation function of Y i given T i and R i as a flexible function of its two arguments. Our empirical approach uses the following polynomial approximation. In addition to the specification in equation (7) we also implement several other specifications in order to allow for sufficiently flexible functional forms and to test whether our results are robust with respect to a higher degree of flexibility. (7) EY [ T, R] = α + αt + α T膊 + α T + α R + α R + α R + α TR + α T R + α TR i i i 0 1 i 2 i 3 i 4 i 5 i 6 i 7 i i 8 i i 9 i i For each individual the observed T i and estimated GPS Rˆ i is used, and the equation is estimated by OLS. Given the estimated parameters in the second stage, we estimate the average potential outcome at treatment level t as (8) N 1 E[ˆ Y ( t)] = ( ˆ α ˆ ˆ ² ˆ 0 + α1t + α 2t + α 3t N + ˆ α trˆ( t, X 7 i= 1 i ) + ˆ α t 8 2 rˆ( t, X i 3 + ˆ α rˆ( t, X ) + ˆ α trˆ( t, X 9 4 i ) 2 ) i ) + ˆ α rˆ( t, X 5 i ) 2 + ˆ α rˆ( t, X 6 i ) 3. The entire dose-response function can then be obtained by estimating this average potential outcome for each level of the treatment. In our application, we use bootstrap methods to obtain standard errors that take into account estimation of the GPS and the α parameters. 2.3 Testing for balancing of covariates, unconfoundedness assumption and common support condition Just as in the case of a binary treatment, in the continuous case it is crucial to evaluate how well adjustment for the GPS works in balancing the covariates, i.e. if the specification for estimation of expression (5) is adequate. Whereas in the binary case the typical approach is to compare the covariate means for the treated and control units before and after matching, 3 We alternatively estimated the GPS based on the logarithm of the duration as a robustness check, but using duration instead of the logarithm of the duration turned out to be superior in finding GPS specifications that balance the covariates in our sample
8 testing for covariate balance is more difficult with continuous treatments. Hirano and Imbens (2004) propose blocking on both the treatment variable, i.e. length of training in our case, and on the estimated GPS. We implement this by first dividing the sample into three groups according to the distribution of treatment length, cutting at the 30 th and 70 th percentile of the distribution. Within each group we evaluate the GPS at the median of the treatment variable. Then, in a second step we divide each group into five blocks by the quintiles of the GPS evaluated at the median, considering only the GPS distribution of individuals in that particular group. Within each of these blocks we calculate the difference-in-means of covariates with respect to individuals that have a GPS such that they belong to that block, but have a treatment level different from the one being evaluated. This procedure tests if for each of these blocks the covariate means of individuals belonging to the particular treatment-level group are significantly different from those of individuals with a different treatment level, but similar GPS. A weighted average over the five blocks in each treatment-level group can be used to calculate the t-statistic of the differences-in-means between the particular treatment-level group and all other groups. The procedure needs to be repeated for each treatment-level group and for each covariate. If adjustment for the GPS properly balances the covariates, we would expect all those differences-in-means to not be statistically different from zero. The key assumption for the GPS is the weak unconfoundedness assumption, also known as the assumption of selection on observables. As an identifying assumption, it is not statistically testable. One typical case of violating this assumption is the possibility that treatment duration is endogenous. In our data, besides the actual training duration, we also know the planned training duration. The planned duration is determined prior to the program, which is arguably exogenous once we condition on detailed observed characteristics including previous labor market history. We can use the information on the planned duration to test the endogeneity of the actual treatment duration. If we assume that the planned duration is exogenous, this allows us to take potential endogeneity into account which may occur due to reverse causality - participants may leave the program because they got a job offer - or due to the fact that some individuals leave the program because they expect no further benefits from continuing the program. Besides using planned training duration as an instrumental variable to test the endogeneity of - 7 -
9 observed training duration, we also follow the framework of Heckman and Hotz (1989) testing whether our GPS method produces comparable samples. In this analysis, we focus on pre-training employment status, since employment status is the main outcome variable in our paper. For empirical implementation, we follow the above outlined balancing test approach to adjust the pre-training employment status. Pre-training employment status is not directly controlled in our GPS, but if the GPS estimator is valid in our sample, we would expect that the differences-in-means of pre-training employment status should not be statistically different from zero after we adjust for the GPS properly since nobody received treatment before the start of training program. Mueser, Troske and Gorislavsky (2007) apply a similar approach in the context of binary treatment. Similar to standard propensity matching methods, common support is also a concern in the GPS application. We propose to test the common support condition as follows 4 : First, following the procedure for testing for the balancing of covariates, we divide the sample into three groups according to the distribution of treatment length, cutting at the 30 th and 70 th percentile of the distribution. Then we evaluate the GPS at the group median of the treatment duration variable. For example, we evaluate the GPS for the whole sample at the median treatment duration of group 1, and after that we plot the distribution of the evaluated GPS for group 1 vs. the distribution of the GPS for the rest of the sample. Like in the case of binary propensity score matching, by inspecting the overlap of these two distributions we are able to examine the common support condition graphically. In the same fashion, we can test the common support condition of groups 2 and 3 vs. the rest of the sample. 3. Institutional setting and Data 3.1 Public Training Programs in Germany The most important German government labor market policy relevant to our paper is the Social Code III (Sozialgesetzbuch III) enacted in The focus group of the Social Code III consists of people who are unemployed or under threat of unemployment. The code has emphasized the use of Active Labor Market Policy (ALMP), and aims to reduce unemployment. The Federal Employment Agency through its 10 regional directorates and 180 local employment agencies (with around 660 branch offices) is responsible for implementation of the federal labor market policy at national, regional and local level. See 4 We thank Peter Mueser for suggesting this approach. At a later stage we found out that Flores-Lagunes, Gonzalez and Neuman (2007) independently proposed a similar approach in their paper
10 Wunsch (2005) for a detailed description of German labor market policy and related institutions. Training programs are one of the most important components of ALMP in Germany with an annual budget of around 7 billion Euros (2002 figures, see Eichhorst and Zimmermann 2007). Access to training programs is not a legal entitlement, but based on the decision of the caseworker. If a caseworker has decided that her client needs to go through a training program, the caseworker also specifies the type, the content and the duration of the training and refers the client to a designated training provider. During the process, the factors that the caseworker takes into consideration include the aptitude of her client for a certain job, the likelihood to succeed in a specific training program, the local labor market condition, the cost of training, and to some extent the available training slots in the contracted training institutions. 5 It is thus reasonable to assume that once we condition on the large set of observable characteristics, including previous labor market outcomes, the decision about the length of the program is independent of the future labor market outcomes of the participants. In principle, one can distinguish two main types of training programs, programs in which no specific degree is acquired and programs leading to the acquisition of a degree. The latter are not considered here, since the degree requirement generates discontinuities in the distribution of treatment durations, and the objective of the analysis in this paper is to estimate the employment outcomes associated with each level of a continuous treatment. Among the programs considered here one can distinguish between classroom oriented training programs (type 1) and more practically oriented programs with only a few theoretical parts (type 2). However, the duration as well as the effectiveness of both types is very similar and therefore we pool both programs to increase our sample size. 6 Training participants in the programs we consider learn specific skills required for a certain vocation (e.g. computer-aided design for a technician/tracer) or receive qualifications that are of general vocational use (e.g. MS Office, computer skills). Numerically, these program types constitute the most important ones among all publicly financed training programs: In 2000, roughly 70% of all participants in training programs were assigned to this type (Schneider and Uhlendorff 2006; IZA, DIW and infas 2007). 5 Since 2003, the matching process between trainees and trainers has changed, and the government introduced training vouchers. 6 There exists another program type not leading to the acquisition of a degree, training in a practice firm, which mainly consists of working in a simulated firm. We do not take this program into account because this type of training differs fundamentally from the types considered here
11 3.2 Data In this paper we use a sample of a particularly rich administrative data set, the Integrated Employment Biographies (IEB) of the German Federal Employment Agency FEA (Bundesagentur für Arbeit). The data contain detailed daily information on employment subject to social security contributions, including occupational and sectoral information, receipt of transfer payments during periods of unemployment, job search activity, and participation in different programs of ALMP. Furthermore, the IEB comprise a large variety of covariates like age, education, disability, nationality and regional indicators. Our sample of participants consists of about 265 male unemployed persons per quarter entering the program during the years 2000, 2001, and 2002, i.e. we observe approximately 3180 program participants. The system of publicly financed training in Germany underwent several alterations during labor policy reforms in 2003 (see Jacobi and Kluve 2007). We therefore restrict our analysis on pre-reform training programs to avoid possible distortions in measuring program effectiveness. 7 The data allow us to draw conclusions on the average participant starting a program during this time period. The programs comprise both occupation-specific training programs ("berufsbezogene Weiterbildung") and general training programs ("berufsübergreifende Weiterbildung"). The core feature of these training programs is the fact that treatment provision is a continuous variable, since the elapsed duration of training varies from approx. 1 week up to 13 months. We exclusively focus on programs that do not lead to the acquisition of a degree, as the degree requirement would likely create discontinuities in the distribution of the treatment duration. For all participants we know the initial length of the treatment they were assigned to (i.e. the planned duration), as well as how long they actually stayed in the treatment (i.e. the actual duration). 8 We discard observations with treatment duration below 10 days, since such short durations arguably do not imply a serious attempt at finishing the program. Durations above 395 days are also discarded, since only very few observations are available. We do not consider durations of length zero, i.e. no non-treated individuals are included. Instead, we focus on the 7 The data originate from a research project for the German government evaluating the labor policy reforms. In order to capture trends over time and to separate this from the reform effect in 2003, the original sample consists of entry cohorts over time with stable cohort size per quarter. 8 However, we must admit that there is one caveat that we do not have information on the training content, though we restrict our analysis on relatively homogeneous two types of training programs, we cannot rule out that training content could vary with the training duration. Our estimates may reflect the composite effect of training duration and training content. Nonetheless, our paper still has strong policy implications and reflects the reality that training content and training duration are usually offered together as a bundle to the program applicants
12 average responses of those individuals that did receive some treatment. Figure 1 shows the distribution of treatment durations, both for the actual and planned durations. Both distributions cover the full range of training durations, and for both distributions two peaks exist at durations of 180 days and 360 days, respectively. Figure 1 also shows that actual durations tend to be slightly shorter than planned durations. [Figure 1 about here] The responses, i.e. the outcome variables of interest are (i) the employment probability at time 1 year after exit from the program, and (ii) the employment probability at time 2 years after entry into the program. Table 1 presents summary statistics of the two outcome variables and the covariates, for the full sample (columns 1 and 2) as well as for three subsamples, early exits (i.e. actual duration < planned duration, columns 3 and 4), late exits (i.e. actual duration > planned duration, columns 5 and 6), and exits as planned (i.e. actual duration = planned duration, columns 7 and 8). The share of individuals who stayed in the program exactly as long as planned is quite high (68.7%). In the case in which actual and planned durations differ, early exits are much more common than late exits (22.1% and 9.2% of observations, respectively), a pattern already observed in Figure 1 above. As Table 1 shows, the data contain a large number of covariates. In particular, we can use information on numerous variables that have been identified in the program evaluation literature to be important determinants of selection into a program: This comprises detailed data on citizenship and educational background, including vocational education. Moreover, we have detailed information on pre-treatment employment histories, covering the number of days spent in employment and unemployment during the four years preceding treatment, as well as regional indicators. When using nonexperimental estimators, previous studies, e.g. Heckman, Ichimura, Smith and Todd (1998), Diaz and Handa (2006) and Mueser, Troske and Gorislavsky (2007), emphasize the importance of having treated and comparison groups from the same local labor market, applying the same survey instrument for both groups, and having rich information on individuals' recent labor market history. First, given that our data come from one administrative source, the requirement of a homogenous survey instrument is certainly satisfied. Second, the richness of the covariates makes the unconfoundedness assumption entirely plausible. Third, our sample is a random sample of participants from West Germany, such that, in order to control for local labor market conditions, we condition on the local unemployment rate and the regional type, reflecting the general performance of
13 the regional labor market (for a description of the different regional types see Blien et al. 2004). This and the fact that we analyze a national program ensure that different effects of different program lengths are not driven by different regional administrations or different local labor market conditions. [Table 1 about here] Table 1 also shows that the covariate distributions are very similar across all (sub-) samples. Looking at the full sample, the participants are on average 37 years old, around 9% of them are handicapped and 12% do not have the German citizenship. The participants are on average relatively low-skilled: more than 60% did not get further than the first stage of secondary level education, around 35% do not have any vocational degree, and only a minority (7%) has obtained a university degree. Before entering training the participants were on average unemployed for 9 months, and their previous employment lasted for about 21 months. The individuals for whom we observe a wage for their last employment earned around 50 Euros per day. For the previous employment history we construct eight variables describing the share of time spent in employment and unemployment, respectively, during each of the four years before entering the program. There is a clearly increasing trend in the average probability of being unemployed over time as the individuals move closer to enrolment in the program. Looking at the two outcome variables, both two years after program entry and one year after the program ended around 35% of the participants are employed. Figure 2 contains six panels plotting unadjusted outcomes i.e. the employment probability two years after program entry as well as the employment probability one year after program exit against the three treatment variables, i.e. actual, planned, and actual=planned durations. The figures generally show an increasing trend: After an initial dip in employment probability during the first month in the program, employment rates seem to increase with the length of participation. [Figure 2 about here]
14 4. Empirical results 4.1 Estimates from a Linear Probability Model As mentioned in Section 3, in this paper we consider two outcome variables: one is the employment probability at the point in time 2 years after the participants entered into the program, and the second one is the employment probability at the point in time 1 year after the participants exited from the program. Before presenting results for the GPS, we explore first the relationship between post-treatment employment probability and the duration of treatment using a linear probability model (LPM). Table 2, parts a) and b), investigate the relationship between the employment probability at 2 years after entering into the program (part a) and 1 year after exit from the program (part b), respectively, with the treatment duration. [Tables 2a and 2b about here] First, the two parts of Table 2 show that there is a positive correlation between employment probability and treatment duration, and a negative correlation between employment probability and the square of the treatment duration with or without controlling for additional variables. However, the estimated coefficients of the treatment duration are small, and the explanatory power of the treatment duration is low. 9 These suggest that the impact of treatment duration on the employment probability is small or negligible. However, it is worth noting that a regression type analysis such as the LPM models may rely on extrapolation, compare incomparable observations, and have greater risk of mis-specifying the model. All of these could potentially bias the estimates. Propensity score methods can alleviate these potential problems to some extent. For a discussion of the advantages of matching methods compared to parametric regressions see e.g. Ho et al. (2007). 4.2 Unconfoundedness assumption The key assumption for the GPS is the weak unconfoundedness assumption, also known as the assumption of selection on observables. As an identifying assumption, it is not statistically testable. In the training program context, there are two types of endogeneity. One is that the decision to participate in training or not can be endogenous. The other is that among the participants, the length of training also can be endogenous, e.g. endogenous attrition from the program. In our paper, we focus on training participants, and investigate the treatment effect 9 Cf. the low adjusted R-squared in Panel A of Tables 2a and 2b
15 of training duration. So our main concern is the possibility that treatment duration is endogenous. In our data, besides the actual training duration, we also know the planned training duration. The planned duration is determined prior to the program, which is arguably exogenous, and is free from the endogenous attrition problem. We can use the information on the planned duration to test the endogeneity of the actual treatment duration. Tables 3a and 3b are instrumental variables (IV) estimates using planned duration as IV. Comparing these IV estimates to the OLS estimates in Tables 2a and 2b, we find that they are in 15 out of 16 specifications not significantly different (see the results of the Hausman test in Tables 3a and 3b). This suggests that the actual training duration may not suffer strongly from endogeneity. [Tables 3a and 3b about here] Another test for the unconfoundedness assumption is based on the approached proposed in Heckman and Hotz (1989). This approach is successfully applied in Mueser, Troske and Gorislavsky (2007) in a binary matching context. In our data, we have pre-training employment status back to more than 3 years ago. In our GPS adjustment process, though we control for pre-training labor market variables, we do not control for the pre-training employment status explicitly. If the GPS estimator is valid, then after adjustment for the GPS, the pre-training employment status should be similar across groups with different training durations since nobody received treatment before the start of the training program. 10 Figure 3 shows the t-statistics following the approach outlined in 2.3 for the actual and the planned duration and for a subsample of individuals with equal planned and actual durations. Before adjustment for the GPS, a large portion of t-statistics for testing equality of means are outside the interval of [-1.96, 1.96]. After adjustment for the GPS, almost all of these t-statistics fall into the interval of [-1, 1], which corresponds to a significance level of about 30%. For example, before adjusting for the GPS, the difference between individuals with a long training duration (group 3) and individuals with shorter training (less than 248 days) is significantly different 20 weeks before entering the program. This significance disappears once we adjust for the GPS. These results strongly suggest that adjustment for the GPS not only balances those covariates directly entering into the estimation of the GPS, but also balances the pretraining employment status, which is not explicitly controlled by our GPS approach. [Figures 3a, 3b and 3c about here] 10 This is similar to the binary matching case. If the matching estimator is valid, the pre-treatment outcome variable should not be significantly different between the matched treated and comparison groups, as discussed in Mueser, Troske and Gorislavsky (2007)
16 4.3 GPS estimation, covariate balance, and common support Our implementation of the generalized propensity score follows the procedure outlined in Hirano and Imbens (2004) and adapted to our context as presented in sections 2 above. We first estimate the conditional distribution of the length of the training program (treatment) by applying OLS. Table 4 contains the results for the actual and the planned duration and for the subsample with equal planned and actual durations. [Table 4 about here] To assess the balancing property of the GPS (cf. section 2.3) we compare the distribution of covariates between three groups, which are defined by cutting the distribution of treatment duration at the 30 th and 70 th percentiles. We implement this for both the actual and planned durations. For actual durations, group 1 includes individuals with a treatment level between 11 and 137 days, group 2 ranges from 138 to 247 days and group 3 from 248 to 395 days. For planned durations, group 1 includes individuals with a treatment level between 11 and 167 days, group 2 ranges from 168 to 271 days and group 3 from 272 to 395 days. The groups therefore reflect the fact that on average actual durations are shorter than planned durations. The subsample of individuals with equal planned and actual durations the distribution is very similar to the planned duration of the whole sample (group1: 11 to 170, group 2: 171 to 271, group 3: 272 to 395 days). For each of the covariates we test whether the difference in means of one group compared to the other two groups is significantly different. In the left part of each of the Tables 5, 6 and 7 the corresponding t-statistics are reported. Without adjustment the clear majority of t-statistics are greater than 1.96, indicating a clearly unbalanced distribution of covariates. For example, individuals with longer training programs trained between 248 and 395 days are significantly older than the participants who are trained shorter than 248 days 11. Individuals with shorter training programs (11 to 137 days) are significantly younger than individuals who are trained more than 137 days. Moreover, the share of disabled unemployed is significantly higher among the longer trained, individuals with the highest schooling degree and individuals with a university degree are more often in the group with short or medium training duration than among the group with longer treatment, and the regional unemployment 11 The t-value of describes the difference between the individuals with a training duration of below and above 248 days
17 rate tends to go along with a longer training duration. These examples underline the importance of correcting for differences in observables. [Tables 5, 6 and 7 about here] In the second step, we calculate the corresponding t-statistics for the GPS-adjusted sample. To do this, we evaluate the GPS for each individual at the median of the three groups, i.e. at the lengths of 84 days, 180 days, and 332 days for the actual duration, at the lengths of 117 days, 184 days, and 348 days for the planned duration, and at the lengths of 117, 187 and 357 days for the subsample of individuals with equal planned and actual training durations. For each of the three groups, we discretize the GPS by using five blocks, evaluated by the quintiles of the GPS within each group. In other words, we calculate for the first group for the actual duration, consisting of individuals with an actual treatment ranging from 11 to 137 days, the GPS evaluated at the median of this group (84 days). The distribution of the GPS r(84, X i ) is then discretized into five blocks using the quintiles of the distribution. For the first group, this leads to the intervals [ , ], [0.0017, ], [0.0025, ], [0.0030, ] and [0.0035, ]. 12 To assess the balancing of the adjusted sample, members of the first group with a GPS in the first range are compared with individuals who are not member of the first group, i.e. who have a different level of treatment, but who have a GPS r(84, X i ) lying in the first interval as well. For each group, this implies five mean differences and five standard errors. The t-statistics reported on the right hand side of each of the Tables 5, 6 and 7 correspond to the mean difference for each group. To calculate these mean t-statistics, the corresponding differences and standard errors of the five blocks are weighted by the number of observations. In contrast to the unadjusted sample, we observe no t-statistics larger than 1.96 for the planned duration and for the subsample with equal planned and actual durations (Tables 6 and 7) and only one t-statistic larger than 1.96 for the actual duration (Table 5). These results indicate that the balance of the covariates is clearly improved by adjustment for the GPS. To test the common support condition for the actual duration, following the approach outlined in section 2.3, we divide the sample into the same three groups that we have used above when 12 If we specify the GPS based on the logarithm of the training duration the corresponding values are higher and comparable to other studies applying the GPS, e.g. Flores-Lagunes, Gonzalez and Neuman (2007)
18 testing for covariate balance. We then first evaluate the GPS of the whole sample at the median actual treatment duration of group 1, i.e. 84 days. After that we plot the distribution of this GPS (i.e. evaluated at the median actual duration of the first group) for group 1 and for the other two groups taken together, a procedure which results in the top left panel of Figure 4. We repeat the same procedure for group 2 and group 3, which gives us the top center and the top right panels of Figure 4. Moreover, this common support test is also conducted for the planned duration (the three middle panels) and for the subsample with equal actual and planned durations (the three bottom panels). The figures show that, with the exception of very few cases in the low tail of the second panel, the common support condition is satisfied. The results are very similar for the actual duration, the planned duration, and the subsample with equal planned and actual durations, i.e. common support is given. [Figure 4 about here] 4.4 Results from estimating the dose-response function The final step of our empirical analysis consists in estimating the GPS-adjusted dose-response function. Table 8 contains the estimation results for the dose-response function. Our main results for both outcome variables are presented in Figure 5 (employment probability at time 2 years after entry into the program) and Figure 6 (employment probability at time 1 year after exit from the program), where each figure consists of three parts showing results for a) the actual duration, b) the planned duration, and c) for the subsample of individuals for which actual duration equals planned duration. With respect to observable characteristics, this subsample is very similar to the complete sample, see rows 1 and 7 in Table 1. The Figures also include the non-participant employment probability baseline 13, which indicates that training effects are generally positive, a finding in line with Rinne, Schneider and Uhlendorff (2007) who also use the IEB data. In addition to the graphs we calculate the pairwise differences in employment probabilities between different durations of training and bootstrap standard errors from 2,000 replications. For example, we calculate the difference in our outcome variables between 18 days of training and 39 days of training, between 18 days of training and 60 days of training etc. This allows us to test whether the impact of different 13 Given the richness of our data set we estimate this covariate-adjusted baseline from standard binary propensity score matching methods, i.e. the employment probability of the matched non-participants
19 training durations is significantly different from zero 14. [Table 8 about here] [Figures 5, 6 about here] As the figures show, the dose-response functions for both outcome variables considered have similar shapes for all specifications. They generally vary depending on the treatment variable considered: specifications based on the actual duration are rather flat, showing little variation of the outcome with respect to different durations. According to this, we do not find any significant difference in employment probabilities between the different levels of training durations. Specifications based on the planned durations show an increase in employment probability for the short durations of up to around 100 days, a slight dip for durations of about 200 to 250 days, and a final decrease for durations longer than 330 days (where confidence bands, however, are quite large). If we look at the outcome two years after entry into the program (Figure 5), this pattern is supported by the pairwise comparisons of different levels of treatment intensity. We find significant differences between a duration of 18 days and longer training duration up to around 120 days, and these differences are again significant for a training duration between around 270 and 350 days. There is no significant difference between durations of around 100 days and durations of around 300 days. In the alternative specification with the outcome measured one year after program exit we do not find any significant increase in the first 250 training days, and training durations around 300 days lead to significantly higher employment probabilities than shorter training. However, the planned duration is not a real treatment and therefore the Figures 5b and 6b are hard to interpret. The subsample of individuals for which actual duration equals planned duration does not suffer from potentially endogeneous exits from the program. The general profile of the results for the observed durations is confirmed (panels c in Figures 5 and 6, respectively): while it is generally flatter for the long durations, it further emphasizes the increase in the treatment effect for durations of up to 100 days if we look at the employment probability two years after entry into program. We find a significant increase until around 100 days of training, and no further significant increases beyond 100 days. However, for the treatment effect one year after exit, we do not find significant differences between the different levels of treatment intensity. 14 The detailed Tables are not reported here but available on request
20 The GPS-adjusted analysis of the relationship between a continuous training program and the corresponding employment probability of participants thus shows a very interesting pattern. While during the first 100 days of exposure to treatment increasing the dose yields increasing returns in terms of employment prospects two years after entry into the program, further increasing the dose beyond 100 days appears to bring about no additional treatment effect. That is, the human capital enhancing features of training are effective during the beginning period (i.e. the initial doses work), but effectiveness fades out after approximately three months of participation. We observe the initial increase in the employment probability only for the planned and not for the actual duration, see Figure 5. This result may be driven by individuals who leave the program early because they received a job offer. Controlling for early exits by using the planned instead of the actual duration leads to a positive impact at least on the point estimate of the first 100 days of training duration. These results are confirmed if we use the sample for which actual duration equals planned duration. Our findings add interesting additional insights into the effectiveness of training programs for the unemployed in Germany. There exist several papers analyzing effect heterogeneity of training programs with respect to observable characteristics, see e.g. Rinne, Schneider and Uhlendorff (2007). They find only weak evidence for heterogeneous effects with respect to skill levels and age. Other research exploits the difference of long versus short training programs by discretizing the length of training, see e.g. Lechner, Miquel and Wunsch (2004). They show that longer programs have a larger and more sustainable positive impact on subsequent employment prospects. However, in their case the longer duration goes along with a different type of program - substantive training programs leading to a vocational degree are compared with shorter programs not leading to a degree. In this paper, we use the GPS framework to exploit the effect heterogeneity of different levels of training duration within program types not leading to a vocational degree. Our results suggest that an increased duration of training does not automatically go along with higher subsequent employment probabilities, and that after around 3 months of training, additional time spent in programs does not have an impact on subsequent employment prospects. These results indicate that learning specific skills required for a certain vocation (e.g. computer-aided design for a technician/tracer) or receiving qualifications that are of general vocational use (e.g. MS Office, computer skills) that is, the contents of the programs analyzed here have positive expected returns compared to job search without training only up to a certain duration
21 5. Robustness In this section, we carry out several sensitivity checks for our main specification. The first check is that we further restrict our sample to the people who went through a training program exactly once. In the second check, we try different specifications for the dose-response functions, and also present estimates from LPM and probit models. Finally, we use planned duration as an instrumental variable for actual treatment duration, and estimate the local average treatment effect (LATE) as developed in Imbens and Angrist (1994). Figures 5 and 6 above include dose-response functions for a subsample of our data (labeled dose-response for subsample in the graphs). The original data contain information on whether a training participant, after having taken part in the course which we analyze here, participated in another training course at some point in time. These are about 7% of individuals in our sample. We therefore include results for the subsample of observations that participated in exactly the one course for which we have data on planned and actual durations. 15 Regarding the shape of the dose-response functions, results for the subsample are very similar to the full sample. It is worth noting though, that the employment probabilities of the matched non-participants are consistently larger for the subsample, and thus the treatment effects are smaller. In particular, the estimated average response of the non-participants is up to 3 percentage points higher, while the response of the participants remains almost the same (cf. Figure 6a). Our main estimation is based on a cubic specification for the dose-response function. Figures 7 and 8 plot results for the dose-response function for the full sample for quadratic and 4 th degree polynomial specifications as well. Like Figures 5 and 6, Figures 7 and 8 consider the two outcome variables and are structured in three panels each, reflecting actual, planned, and actual=planned durations. All six figures show that the general shapes and trends of the doseresponse functions remain relatively unchanged under different specifications, though there are some differences in detail. Our central finding that the main body of the dose-response functions is flat, i.e. longer training programs do not seem to add an additional treatment effect, is robust. This main result holds true also if we use the logarithm of the duration as the dependent variable for our GPS (see the thin solid lines in Figures 7 and 8) The balancing of the covariates is very similar for these subsamples and the corresponding tables are available upon request. 16 The corresponding balancing properties are available upon request. We mainly present results based on the linear specification because the corresponding balancing properties are better
22 It is also interesting to compare the results from the GPS with the ones obtained directly from LPM and probit models. In Figure 7, both sets of results are quite similar, but in Figure 8, results from the GPS are rather different from the ones that would be estimated using an LPM and a probit model. This suggests that in the case of Figure 8, a regression-type adjustment may not be sufficient to remove all observable bias, and the GPS provides a valuable alternative approach to control for differences in observables. [Figures 7, 8 about here] As we stated earlier, one of the paper s main findings is that longer training programs do not seem to add an additional treatment effect. We carry out another sensitivity check for this statement using an instrumental variable approach. In our data, for about 31% of participants the actual treatment duration differs from their planned duration. It is possible that the actual treatment duration could be endogenously determined by the participants, either, for instance, by dropping out of the program or by finding a job while still in training. Fortunately, in our data, we also have information on the planned treatment duration, and this variable is decided prior the program, so we can use it as an instrumental variable to control for the possible endogeneity of the actual treatment duration. 17 To apply the approach in Imbens and Angrist (1994), first we discretize both actual and planned treatment duration variables into dummy variables according to the length of treatment. The indicator 1 means that the participants have a shorter duration (actual or planned), and 0 means otherwise. If the treatment duration has little impact on the outcome variables, the IV estimates should not significantly differ from zero, i.e. participants with shorter treatment durations have similar outcomes to the participants with longer treatment duration. In our empirical implementation, we use 5 different cutoff points, respectively, to define the two groups with the shorter vs. the longer treatment duration; i.e. we cut at the 15%, 30%, 50%, 70% and 85% percentiles of the distribution of the actual treatment duration. The same cutoff points are applied to both actual as well as planned treatment duration variables to create dummy variables. After that, we use the dummy variable created from planned 17 In section 3, we also use planned duration as an instrumental variable, but the objective there differs from here. The one in section 3 is to test the endogeneity of the actual training duration, and the one here is to estimate the effect of training duration on the outcome variable, employment probability
23 treatment duration as an instrument for the dummy variable created from the actual treatment duration. [Table 9 about here] Table 9 presents the results from this instrumental variable approach, with and without controlling for additional variables. The different models 1 to 5 correspond to the different cutoff points described above, ranging from the 15% percentile to the 85% percentile. The majority of these estimates are insignificant, except for some cases in which the lower cutoff points are used. 18 This provides additional evidence to support our finding from the GPS results that, if treatment duration has an impact at all, it is a weak impact during the first months, and longer durations seem to have no additional impact on the labor market outcomes of the participants. 6. Conclusions In this paper, we study the effect of continuous training programs on the post-treatment employment probability, using a particular data set that contains information on training duration in days for a period of about 1 week to 13 months. In particular, we are interested in estimating the dose-response function at all possible treatment durations. We implement this using the recently developed generalized propensity score for continuous treatments. Extensive diagnostics on covariate balance, common support, and the unconfoundedness assumption validate the approach. Moreover, we are able to consider both the planned and actual durations as treatment variables, thus avoiding a potential bias in estimating the doseresponse function from endogenous exits, which may play a role if only actual durations are observed. We conduct various robustness checks in order to further solidify our results. Our findings indicate that the dose-response function that relates continuous training to the corresponding employment probability has a relatively flat shape after an initial increase during the first 100 days of training. Indeed, the first three months of a training program appear to be the most effective period to improve the employment probability and bring about the generally positive effect relative to the non-participant baseline. In the lower segment of the distribution of training durations, additional doses seem to bring about increases in post- 18 For these cases the estimates are negative, i.e. a shorter treatment duration relates to a lower outcome. This is also consistent with our GPS finding that the dose-responses are upward sloping in the lower treatment duration segment
24 training employment prospects. After approximately 100 days, however, further participation in the program does not seem to lead to an increase in the treatment effect, as the dose-response function is basically flat for higher doses. Whether the effect actually even starts to decrease again for the very long durations (330 days +) cannot be said with certainty, as large confidence bands due to small number of observations exacerbate a precise estimation of this effect. Based on our assessment of the dynamics of the individual employment probability brought about by continuous increases in program duration, there seems to be little justification for training programs in Germany to last longer than about three months
25 References Augurzky, B. and J. Kluve (2007), "Assessing the performance of matching algorithms when selection into treatment is strong", Journal of Applied Econometrics 22, Behrman, J., Y. Cheng and P. Todd (2004), "Evaluating Preschool Programs When Length of Exposure to the Program Varies: A Nonparametric Approach", Review of Economics and Statistics 86, Blien, U., F. Hirschenauer, M. Arendt, H.J. Braun, D.M. Gunst, S. Kilcioglu, H. Kleinschmidt, M. Musati, H. Roß, D. Vollkommer, J. Wein, (2004): "Typisierung von Bezirken der Agenturen für Arbeit", Zeitschrift für ArbeitsmarktForschung, 37, Diaz, J.J. and S. Handa (2006), "An Assessment of Propensity Score Matching as a Nonexperimental Impact Estimator: Evidence from Mexico s PROGRESA", Journal of Human Resources 41, Eichhorst, W. and K.F. Zimmermann (2007): And Then There Were Four How Many (And Which) Measures of Active Labor Market Policy Do We Still Need?, Applied Economics Quarterly, 53, Flores-Lagunes, A., A. Gonzalez and T.C. Neuman (2007), "Estimating the Effects of Length of Exposure to a Training Program: The Case of Job Corps", IZA Discussion Paper Heckman, J.J. and V. J. Hotz (1989), "Choosing Among Alternative Nonexperimental Methods for Estimating the Impact of Social Programs: The Case of Manpower Training", Journal of American Statistical Association 84, Heckman, J.J., H. Ichimura, J. Smith abd P. Todd (1998), "Characterizing Selection Bias Using Experimental Data", Econometrica 66, Heckman, J.J., R.J. LaLonde and J.A. Smith (1999), "The economics and econometrics of active labour market programs", in O. Ashenfelter and D. Card (eds.), Handbook of Labor Economics 3, Elsevier, Amsterdam. Hirano, K. and G.W. Imbens (2004), "The Propensity Score with Continuous Treatments", in A. Gelman and X. Meng (eds.), Applied Bayesian Modeling and Causal Inference from Incomplete-Data Perspectives, Wiley. Ho, D.E., K. Imai, G. King, E.A. Stewart (2007), "Matching as Nonparametric Preprocessing for Reducing Model Dependence in Parametric Causal Inference", Political Analysis 15, Imai K. and D.A. van Dyk (2004), "Causal Inference with General Treatment Regimes: Generalizing the Propensity Score", Journal of the American Statistical Association 99, Imbens, G.W. (2000), "The Role of the Propensity Score in Estimating Dose-Response Functions", Biometrika 87, Imbens, G.W. (2004), "Nonparametric Estimation of Average Treatment Effects Under Exogeneity: A Review", Review of Economics and Statistics 86,
26 Imbens, G.W. and J.D. Angrist., Identification and Estimation of Local Average Treatment Effects, Econometrica 62, IZA, DIW, infas (2007), Evaluation der Maßnahmen zur Umsetzung der Vorschläge der Hartz-Kommission Modul 1b: Förderung beruflicher Weiterbildung und Transferleistungen, Endbericht. BMAS Forschungsbericht (Research report of the Federal Ministry for Labour and Social Affairs). Jacobi, L. and J. Kluve (2007), "Before and After the Hartz Reforms: The Performance of Active Labour Market Policy in Germany", Journal for Labour Market Research 40, Kluve, J. (2006), "The effectiveness of European Active Labour Market Policy", IZA Discussion paper Lechner, M. (2001), "Identification and Estimation of Causal Effects of Multiple Treatments under the Conditional Independence Assumption", in M. Lechner and F. Pfeiffer (eds.), Econometric Evaluation of Labour Market Policies, Physica, Heidelberg. Lechner, M., R. Miquel and C. Wunsch (2004), "Long-Run Effects of Public Sector Sponsored Training in West Germany", IZA Discussion paper Mueser P. R., K. R. Troske and A. Gorislavsky (2007), "Using State Administrative Data to Measure Program Performance," The Review of Economics and Statistics 89, Rinne, U., M. Schneider and A. Uhlendorff (2007), "Too Bad to Benefit? Effect Heterogeneity of Public Training Programs", IZA Discussion Paper Rosenbaum, P.R. and D.B. Rubin (1983), "The Central Role of the Propensity Score in Observational Studies for Causal Effects", Biometrika 70, Schneider, H. and A. Uhlendorff (2006), "Die Wirkungen der Hartz-Reform im Bereich der beruflichen Weiterbildung", Journal for Labour Market Research 39, Wunsch, C. (2005), "Labour Market Policy in Germany: Institutions, Instruments and Reforms since Unification," Discussion Paper No , Department of Economics, University of St. Gallen
27 Table 1. Summary Statistics (1) (2) (3) (4) (5) (6) (7) (8) Full Sample Early Exits Late Exits Exits as plan. Mean SD Mean SD Mean SD Mean SD Age Disability Disability low degree Disability medium degree Disability high degree Citizenship Foreigner EU Foreigner Non-EU Educational Attainment No graduation First stage of secondary level Second stage of secondary level Advanced tech. college entrance qualification General qualification for university entrance Vocational Attainment No vocational degree In-plant training Off-the-job training, voc. school, tech. school University, advanced technical college Employment history Previous Unemployment Duration in months Duration of last employment in months Log(wage) of last employment No last employment observed Share of days in emp., 1 st year before program Share of days in emp., 2 nd year before program Share of days in emp., 3 rd year before program Share of days in emp., 4 th year before program Share of days in unemp., 1 st year before program Share of days in unemp., 2 nd year before program Share of days in unemp., 3 rd year before program Share of days in unemp., 4 th year before program Outcome variables Employment two years after program entry Employment one year after program exit Number of Observations
28 Table 2a. Estimated Effect of Treatment Duration on Employment Probability from Linear Probability Model Dependent Variable: Employment status at time 2 years after entry into the program (1) (2) (3) (4) (5) (6) (7) (8) Variables Coefficient Std. Error Coefficient Std. Error Coefficient Std. Error Coefficient Std. Error Panel A: Only Control for Treatment Duration Constant Treatment Duration Square of Treatment Duration -1.11E E E E E E-05 Cube of Treatment Duration 9.89E E E E-08 Fourth Power of Treatment Duration 1.87E E-10 Adjusted R Squared Number of Observations Panel B: Control for Treatment Duration and Other Variables Constant Treatment Duration 3.72E Square of Treatment Duration -1.52E E E E E E-05 Cube of Treatment Duration 9.82E E E E-08 Fourth Power of Treatment Duration 5.02E E-10 Other Control Variables: See Table 1 Adjusted R Squared Number of Observations Table 2b. Estimated Effect of Treatment Duration on Employment Probability from Linear Probability Model Dependent Variable: Employment status at time 1 year after exit from the program (1) (2) (3) (4) (5) (6) (7) (8) Variables Coefficient Std. Error Coefficient Std. Error Coefficient Std. Error Coefficient Std. Error Panel A: Only Control for Treatment Duration Constant Treatment Duration Square of Treatment Duration -4.25E E E E E E-05 Cube of Treatment Duration -8.30E E E E-08 Fourth Power of Treatment Duration 1.77E E-10 Adjusted R Squared Number of Observations Panel B: Control for Treatment Duration and Other Variables Constant Treatment Duration Square of Treatment Duration -7.53E E E E E E-05 Cube of Treatment Duration 5.17E E E E-08 Fourth Power of Treatment Duration 5.49E E-10 Other Control Variables: See Table 1 Adjusted R Squared Number of Observations
29 Table 3a. IV Estimation of Effect of Treatment Duration on Employment Probability from Linear Probability Model Dependent Variable: Employment status at time 2 years after entry into the program (1) (2) (3) (4) (5) (6) (7) (8) Variables Coefficient Std. Error Coefficient Std. Error Coefficient Std. Error Coefficient Std. Error Panel A: Only Control for Treatment Duration Constant Treatment Duration Square of Treatment Duration -4.93E E E E E E-05 Cube of Treatment Duration -3.27E E E E-07 Fourth Power of Treatment Duration -4.40E E-10 Adjusted R Squared Number of Observations Hausman Test: Chi-Squared Probablity>Chi-Squared Panel B: Control for Treatment Duration and Other Variables Constant Treatment Duration 1.87E Square of Treatment Duration -2.82E E E E E E-05 Cube of Treatment Duration 1.67E E E E-07 Fourth Power of Treatment Duration -3.21E E-10 Other Control Variables: See Table 1 Adjusted R Squared Number of Observations Hausman Test: Chi-Squared Probablity>Chi-Squared Table 3b. IV Estimation of Effect of Treatment Duration on Employment Probability from Linear Probability Model Dependent Variable: Employment status at time 1 year after exit from the program (1) (2) (3) (4) (5) (6) (7) (8) Variables Coefficient Std. Error Coefficient Std. Error Coefficient Std. Error Coefficient Std. Error Panel A: Only Control for Treatment Duration Constant Treatment Duration Square of Treatment Duration -6.27E E E E E E-05 Cube of Treatment Duration -1.11E E E E-07 Fourth Power of Treatment Duration -1.80E E-10 Adjusted R Squared Number of Observations Hausman Test: Chi-Squared Probablity>Chi-Squared Panel B: Control for Treatment Duration and Other Variables Constant Treatment Duration Square of Treatment Duration -2.62E E E E E E-05 Cube of Treatment Duration 5.58E E E E-07 Fourth Power of Treatment Duration -5.71E E-10 Other Control Variables: See Table 1 Adjusted R Squared Number of Observations Hausman Test: Chi-Squared Probablity>Chi-Squared
30 Table 4. Estimated GPS: Linear Regression of Treatment Level on Covariates (1) (2) (3) (4) (5) (6) Actual Duration Planned Duration Actual=Planned Duration Coeff. Std. Error Coeff. Std. Error Coeff. Std. Error Previous unemployment duration in months Age Age squared Age cubic Duration of last employment No information about last employment No wage of last employment observed Log(wage) of last employment Educational Attainment Educational Attainment Educational Attainment Educational Attainment Vocational Attainment Vocational Attainment Vocational Attainment Foreigner EU Foreigner Non-EU Share of days in emp., 1 st year before program Share of days in emp., 2 nd year before program Share of days in emp., 3 rd year before program Share of days in emp., 4 th year before program Share of days in unemp., 1 st year before Share of days in unemp., 2 nd year before Share of days in unemp., 3 rd year before Share of days in unemp., 4 th year before Disability low degree Disability medium degree Disability high degree Number of children Youngest Child < 4 years Youngest Child < 14 years Regional unemployment rate Regional type Regional type Regional type Regional type Educational Attainment 2 * age Educational Attainment 3 * age Educational Attainment 4 * age Educational Attainment 5 * age Educational Attainment 2 * age squared Educational Attainment 3 * age squared Educational Attainment 4 * age squared Educational Attainment 5 * age squared Vocational Attainment 2 * age Vocational education 3 * age Vocational education 4 * age Vocational Attainment 2 * age squared Vocational education 3 * age squared Vocational education 4 * age squared Constant Adjusted R Squared Number of Observations
31 Table 5. Balance in Covariates with and without Adjustment Based on Actual Duration: t-statistics for Equality of Means (1) (2) (3) (4) (5) (6) Unadjusted Adjusted Covariate [11, 137] [138,247] [248,395] [11, 137] [138,247] [248,395] Age Disability No disability Disability low degree Disability medium degree Disability high degree Citizenship German Foreigner EU Foreigner Non-EU Educational Attainment No graduation (1) First stage of secondary level (2) Second stage of secondary level (3) Advanced technical college entrance qualification (4) General qualification for university entrance (5) Vocational Attainment No vocational degree (1) In-plant training (2) Off-the-job training, vocational school, technical school (3) University, advanced technical college (4) Employment History Previous Unemployment Duration Duration of last employment Log(wage) of last employment No last employment observed Share of days in emp., 1 st year before program Share of days in emp., 2 nd year before program Share of days in emp., 3 rd year before program Share of days in emp., 4 th year before program Share of days in unemp., 1 st year before program Share of days in unemp., 2 nd year before program Share of days in unemp., 3 rd year before program Share of days in unemp., 4 th year before program Regional indicators Regional type Regional type Regional type Regional type Regional type Regional unemployment rate Bold numbers indicate significance at the 5% level
32 Table 6. Balance in Covariates with and without Adjustment Based on Planned Duration: t-statistics for Equality of Means (1) (2) (3) (4) (5) (6) Unadjusted Adjusted Covariate [11, 167] [168,271] [272,395] [11, 167] [168,271] [272,395] Age Disability No disability Disability low degree Disability medium degree Disability high degree Citizenship German Foreigner EU Foreigner Non-EU Educational Attainment No graduation (1) First stage of secondary level (2) Second stage of secondary level (3) Advanced technical college entrance qualification (4) General qualification for university entrance (5) Vocational Attainment No vocational degree (1) In-plant training (2) Off-the-job training, vocational school, technical school (3) University, advanced technical college (4) Employment History Previous Unemployment Duration Duration of last employment Log(wage) of last employment No last employment observed Share of days in emp., 1 st year before program Share of days in emp., 2 nd year before program Share of days in emp., 3 rd year before program Share of days in emp., 4 th year before program Share of days in unemp., 1 st year before program Share of days in unemp., 2 nd year before program Share of days in unemp., 3 rd year before program Share of days in unemp., 4 th year before program Regional indicators Regional type Regional type Regional type Regional type Regional type Regional unemployment rate Bold numbers indicate significance at the 5% level
33 Table 7. Balance in Covariates with and without Adjustment Based on Planned=Actual Duration: t-statistics for Equality of Means (1) (2) (3) (4) (5) (6) Unadjusted Adjusted Covariate [11, 170] [171, 271] [272,395] [11, 170] [171, 271] [272,395] Age Disability No disability Disability low degree Disability medium degree Disability high degree Citizenship German Foreigner EU Foreigner Non-EU Educational Attainment No graduation (1) First stage of secondary level (2) Second stage of secondary level (3) Advanced technical college entrance qualification (4) General qualification for university entrance (5) Vocational Attainment No vocational degree (1) In-plant training (2) Off-the-job training, vocational school, technical school (3) University, advanced technical college (4) Employment History Previous Unemployment Duration Duration of last employment Log(wage) of last employment No last employment observed Share of days in emp., 1 st year before program Share of days in emp., 2 nd year before program Share of days in emp., 3 rd year before program Share of days in emp., 4 th year before program Share of days in unemp., 1 st year before program Share of days in unemp., 2 nd year before program Share of days in unemp., 3 rd year before program Share of days in unemp., 4 th year before program Regional indicators Regional type Regional type Regional type Regional type Regional type Regional unemployment rate Bold numbers indicate significance at the 5% level
34 Table 8. Estimated Dose Response Functions (1) (2) (3) (4) (5) (6) Actual Duration Planned Duration Planned=Actual Duration Coeff. Std. Error Coeff. Std. Error Coeff. Std. Error Panel A: Outcome Variable: Employment status at time 2 years after entry into the program GPS GPS GPS Program Duration E E-03 Program Duration E E E E E E-05 Program Duration E E E E E E-08 GPS*Program Duration GPS 2 *Program Duration GPS*Program Duration Constant Adjusted R Squared Number of Observations Panel B: Outcome Variable: Employment status at time 1 year after exit from the program GPS GPS GPS Program Duration E Program Duration E E E E E E-05 Program Duration E E E E E E-08 GPS*Program Duration GPS 2 *Program Duration GPS*Program Duration Constant Adjusted R Squared Number of Observations
35 Table 9. Instrumental Variable Estimations (1) (2) (3) (4) Linear Probability Model Probit Model Treatment Effect Std. Error Treatment Effect Std. Error Panel A: Outcome Variable: Employment status at time 2 years after entry into the program Model Model Model Model Model (Without Other Control Variables) Panel B: Outcome Variable: Employment status at time 1 year after exit from the program Model Model Model Model Model (Without Other Control Variables) Panel C: Outcome Variable: Employment status at time 2 years after entry into the program Model Model Model Model Model (With Other Control Variables: See Table 1) Panel D: Outcome Variable: Employment status at time 1 year after exit from the program Model Model Model Model Model (With Other Control Variables: See Table 1) Bold numbers indicate significance at the 5% level Note: we use 5 different cutoff points, respectively, to define the two groups with the shorter vs. the longer treatment duration. The different models 1 to 5 correspond to different cutoff points, from the 15% percentile to the 85% percentile

36 - 35 -
37 Figure 2a. Unadjusted Employment Probability at Time 2 Years after Entry Figure 2b. Unadjusted Employment Probability at Time 2 Years after Entry into the Program Based on Actual Training Duration into the Program Based on Planned Training Duration Figure 2c. Unadjusted Employment Probability at Time 2 Years after Entry into the Program Based on Subsample with Actual Training Duration Equal to Planned Duration Figure 2d. Unadjusted Employment Probability at Time 1 Years after Exit from the Program Based on Actual Training Duration Figure 2e. Unadjusted Employment Probability at Time 1 Years after Exit from the Program Based on Planned Training Duration Figure 2f. Unadjusted Employment Probability at Time 1 Years after Exit from the Program Based on Subsample with Actual Training Duration Equal to Planned Duration
38 Figure 3a. t-statistics for Equality of Means of Pre-training Employment Status before and After Adjustment for GPS Based on Observed Training Duration t-statistics Group1:Before Group1: After Group2:Before Group2: After Group3:Before Group3: After Weeks Before Start of Training Figure 3b. t-statistics for Equality of Means of Pre-training Employment Status before and After Adjustment for GPS Based on Planned Training Duration 3 2 t-statistics Group1:Before Group1: After Group2:Before Group2: After Group3:Before Group3: After Weeks Before Start of Training Figure 3c. t-statistics for Equality of Means of Pre-training Employment Status before and After Adjustment for GPS Based on Actual Training Duration Equal to Planned Duration 3 2 t-statistics Group1:Before Group1: After Group2:Before Group2: After Group3:Before Group3: After Weeks Before Start of Training

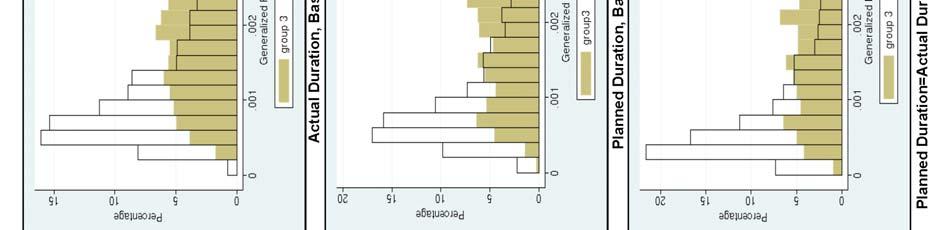
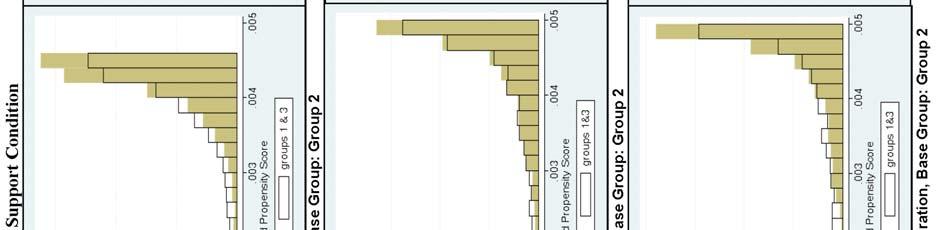
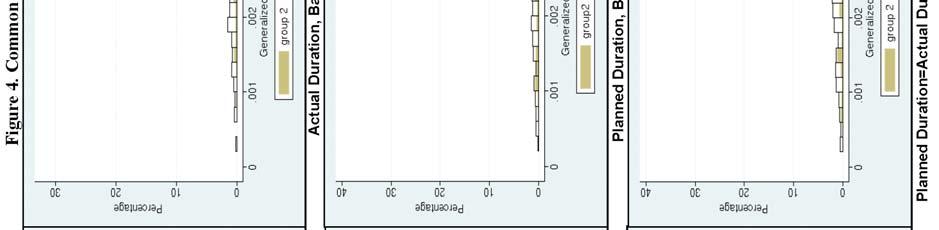

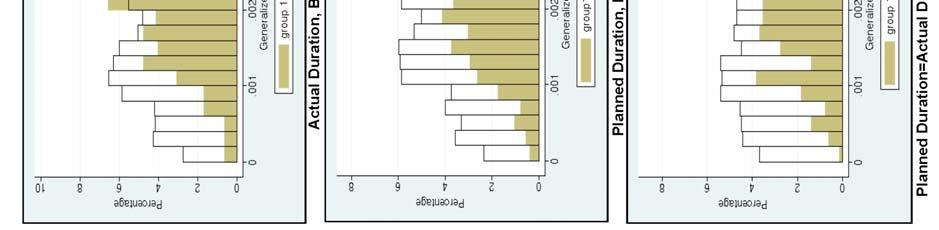
39 - 38 -
2. Temporary work as an active labour market policy: Evaluating an innovative activation programme for disadvantaged youths
 2. Temporary work as an active labour market policy: Evaluating an innovative activation programme for disadvantaged youths Joint work with Jochen Kluve (Humboldt-University Berlin, RWI and IZA) and Sandra
Online Appendix from Bönke, Corneo and Lüthen Lifetime Earnings Inequality in Germany
 Online Appendix from Bönke, Corneo and Lüthen Lifetime Earnings Inequality in Germany Contents Appendix I: Data... 2 I.1 Earnings concept... 2 I.2 Imputation of top-coded earnings... 5 I.3 Correction of
Dynamic Evaluation of Job Search Training
 Dynamic Evaluation of Job Search Training Stephen Kastoryano Bas van der Klaauw September 20, 2010 Abstract This paper evaluates job search training for unemployment insurance recipients. We use a unique
Cross Atlantic Differences in Estimating Dynamic Training Effects
 Cross Atlantic Differences in Estimating Dynamic Training Effects John C. Ham, University of Maryland, National University of Singapore, IFAU, IFS, IZA and IRP Per Johannson, Uppsala University, IFAU,
Active Labor Market Policy Evaluations: A Meta-analysis. David Card UC Berkeley. Jochen Kluve RWI - Essen. Andrea Weber UC Berkeley and RWI-Essen
 Active Labor Market Policy Evaluations: A Meta-analysis David Card UC Berkeley Jochen Kluve RWI - Essen Andrea Weber UC Berkeley and RWI-Essen March 2010 ` *We thank the authors who responded to our survey
research paper series
 research paper series China and the World Economy Research Paper 2008/04 The Effects of Foreign Acquisition on Domestic and Exports Markets Dynamics in China by Jun Du and Sourafel Girma The Centre acknowledges
Get Training or Wait? Long Run Employment Effects of Training Programs for the Unemployed in West Germany
 Get Training or Wait? Long Run Employment Effects of Training Programs for the Unemployed in West Germany BERND FITZENBERGER, Goethe University Frankfurt, ZEW, IZA, IFS Ronke Osikominu, Robert Völter,
Benefit Duration, Unemployment Duration and Job Match Quality: A Regression-Discontinuity Approach
 DISCUSSION PAPER SERIES IZA DP No. 4670 Benefit Duration, Unemployment Duration and Job Match Quality: A Regression-Discontinuity Approach Marco Caliendo Konstantinos Tatsiramos Arne Uhlendorff December
Dynamic Evaluation of Job Search Assistance
 DISCUSSION PAPER SERIES IZA DP No. 5424 Dynamic Evaluation of Job Search Assistance Stephen Kastoryano Bas van der Klaauw January 2011 Forschungsinstitut zur Zukunft der Arbeit Institute for the Study
Correcting for Survival Effects in Cross Section Wage Equations Using NBA Data
 Correcting for Survival Effects in Cross Section Wage Equations Using NBA Data by Peter A Groothuis Professor Appalachian State University Boone, NC and James Richard Hill Professor Central Michigan University
Employment and Earnings Effects of Awarding Training Vouchers
 Employment and Earnings Effects of Awarding Training Vouchers Annabelle Doerr University of Freiburg IAB, Nuremberg Bernd Fitzenberger University of Freiburg IFS, IZA, ROA, ZEW Thomas Kruppe IAB, Nuremberg
The Effects of Increasing the Early Retirement Age on Social Security Claims and Job Exits
 The Effects of Increasing the Early Retirement Age on Social Security Claims and Job Exits Day Manoli UCLA Andrea Weber University of Mannheim February 29, 2012 Abstract This paper presents empirical evidence
Additional Evidence and Replication Code for Analyzing the Effects of Minimum Wage Increases Enacted During the Great Recession
 ESSPRI Working Paper Series Paper #20173 Additional Evidence and Replication Code for Analyzing the Effects of Minimum Wage Increases Enacted During the Great Recession Economic Self-Sufficiency Policy
BEAUTIFUL SERBIA. Holger Bonin (IZA Bonn) and Ulf Rinne* (IZA Bonn) Draft Version February 17, 2006 ABSTRACT
 and Ulf Rinne* (IZA Bonn) Draft Version February 17, 2006 ABSTRACT") BEAUTIFUL SERBIA Holger Bonin (IZA Bonn) and Ulf Rinne* (IZA Bonn) Draft Version February 17, 2006 ABSTRACT This paper evaluates Beautiful Serbia, an active labor market program operating in Serbia and
BEAUTIFUL SERBIA Holger Bonin (IZA Bonn) and Ulf Rinne* (IZA Bonn) Draft Version February 17, 2006 ABSTRACT This paper evaluates Beautiful Serbia, an active labor market program operating in Serbia and
Which Program for Whom? Evidence on the Comparative Effectiveness of Public Sponsored Training Programs in Germany
 DISCUSSION PAPER SERIES IZA DP No. 2885 Which Program for Whom? Evidence on the Comparative Effectiveness of Public Sponsored Training Programs in Germany Martin Biewen Bernd Fitzenberger Aderonke Osikominu
Evaluating Search Periods for Welfare Applicants: Evidence from a Social Experiment
 Evaluating Search Periods for Welfare Applicants: Evidence from a Social Experiment Jonneke Bolhaar, Nadine Ketel, Bas van der Klaauw ===== FIRST DRAFT, PRELIMINARY ===== Abstract We investigate the implications
Discussion Paper Series
 Discussion Paper Series IZA DP No. 10531 Comparing Econometric Methods to Empirically Evaluate Job-Search Assistance Paul Muller Bas van der Klaauw Arjan Heyma january 2017 Discussion Paper Series IZA
Training Program Impacts and the. Onset of the Great Recession
 Training Program Impacts and the Onset of the Great Recession Carolyn J. Heinrich Lyndon B. Johnson School of Public Affairs and the Center for Health and Social Policy, University of Texas at Austin Peter
Evaluation of Swedish youth labour market programmes
 Evaluation of Swedish youth labour market programmes by Laura Larsson Uppsala University & Office of Labour Market Policy Evaluation April 11, 2 Abstract: This paper evaluates and compares the direct effects
Unemployment Benefits, Unemployment Duration, and Post-Unemployment Jobs: A Regression Discontinuity Approach
 Unemployment Benefits, Unemployment Duration, and Post-Unemployment Jobs: A Regression Discontinuity Approach By Rafael Lalive* Structural unemployment appears to be strongly correlated with the potential
Online Appendices Practical Procedures to Deal with Common Support Problems in Matching Estimation
 Online Appendices Practical Procedures to Deal with Common Support Problems in Matching Estimation Michael Lechner Anthony Strittmatter April 30, 2014 Abstract This paper assesses the performance of common
The Effects of Reducing the Entitlement Period to Unemployment Insurance
 The Effects of Reducing the Entitlement Period to Unemployment Insurance Benefits Nynke de Groot Bas van der Klaauw July 14, 2014 Abstract This paper exploits a substantial reform of the Dutch UI law to
Assignment Mechanisms, Selection Criteria, and the Effectiveness of Training Programmes
 Assignment Mechanisms, Selection Criteria, and the Effectiveness of Training Programmes Annabelle Doerr Albert-Ludwigs-University Freiburg Anthony Strittmatter University of St. Gallen October 4, 2016
Do Firms Benefit from Active Labour Market Policies?
 DISCUSSION PAPER SERIES IZA DP No. 7614 Do Firms Benefit from Active Labour Market Policies? Michael Lechner Conny Wunsch Patrycja Scioch September 2013 Forschungsinstitut zur Zukunft der Arbeit Institute
Appendix A. Additional Results
 Appendix A Additional Results for Intergenerational Transfers and the Prospects for Increasing Wealth Inequality Stephen L. Morgan Cornell University John C. Scott Cornell University Descriptive Results
Risk-Adjusted Futures and Intermeeting Moves
 issn 1936-5330 Risk-Adjusted Futures and Intermeeting Moves Brent Bundick Federal Reserve Bank of Kansas City First Version: October 2007 This Version: June 2008 RWP 07-08 Abstract Piazzesi and Swanson
Acemoglu, et al (2008) cast doubt on the robustness of the cross-country empirical relationship between income and democracy. They demonstrate that
 cast doubt on the robustness of the cross-country empirical relationship between income and democracy. They demonstrate that") Acemoglu, et al (2008) cast doubt on the robustness of the cross-country empirical relationship between income and democracy. They demonstrate that the strong positive correlation between income and democracy
Acemoglu, et al (2008) cast doubt on the robustness of the cross-country empirical relationship between income and democracy. They demonstrate that the strong positive correlation between income and democracy
Long-Run Effects of Training Programs for the Unemployed in East Germany
 DISCUSSION PAPER SERIES IZA DP No. 2630 Long-Run Effects of Training Programs for the Unemployed in East Germany Bernd Fitzenberger Robert Völter February 2007 Forschungsinstitut zur Zukunft der Arbeit
How do women with a partner respond to activation policies? Household roles and employment effects of training and workfare in Germany
 How do women with a partner respond to activation policies? Household roles and employment effects of training and workfare in Germany Eva Kopf and Cordula Zabel Preliminary version -Please do not cite
In Debt and Approaching Retirement: Claim Social Security or Work Longer?
 AEA Papers and Proceedings 2018, 108: 401 406 https://doi.org/10.1257/pandp.20181116 In Debt and Approaching Retirement: Claim Social Security or Work Longer? By Barbara A. Butrica and Nadia S. Karamcheva*
The Effects of Reducing the Entitlement Period to Unemployment Insurance
 The Effects of Reducing the Entitlement Period to Unemployment Insurance Benefits Nynke de Groot Bas van der Klaauw February 6, 2019 Abstract This paper uses a difference-in-differences approach exploiting
How Changes in Unemployment Benefit Duration Affect the Inflow into Unemployment
 DISCUSSION PAPER SERIES IZA DP No. 4691 How Changes in Unemployment Benefit Duration Affect the Inflow into Unemployment Jan C. van Ours Sander Tuit January 2010 Forschungsinstitut zur Zukunft der Arbeit
Strengthening Enforcement in Unemployment Insurance: A Natural Experiment
 Strengthening Enforcement in Unemployment Insurance: A Natural Experiment Patrick Arni Amelie Schiprowski April 2017 Abstract Enforcing the compliance with rules through the threat of financial penalties
Effects of Tax-Based Saving Incentives on Contribution Behavior: Lessons from the Introduction of the Riester Scheme in Germany
 Modern Economy, 2016, 7, 1198-1222 http://www.scirp.org/journal/me ISSN Online: 2152-7261 ISSN Print: 2152-7245 Effects of Tax-Based Saving Incentives on Contribution Behavior: Lessons from the Introduction
LABOR SUPPLY RESPONSES TO TAXES AND TRANSFERS: PART I (BASIC APPROACHES) Henrik Jacobsen Kleven London School of Economics
 Henrik Jacobsen Kleven London School of Economics") LABOR SUPPLY RESPONSES TO TAXES AND TRANSFERS: PART I (BASIC APPROACHES) Henrik Jacobsen Kleven London School of Economics Lecture Notes for MSc Public Finance (EC426): Lent 2013 AGENDA Efficiency cost
LABOR SUPPLY RESPONSES TO TAXES AND TRANSFERS: PART I (BASIC APPROACHES) Henrik Jacobsen Kleven London School of Economics Lecture Notes for MSc Public Finance (EC426): Lent 2013 AGENDA Efficiency cost
The Persistent Effect of Temporary Affirmative Action: Online Appendix
 The Persistent Effect of Temporary Affirmative Action: Online Appendix Conrad Miller Contents A Extensions and Robustness Checks 2 A. Heterogeneity by Employer Size.............................. 2 A.2
The Effectiveness of Qualification Measures for Employed Workers An Evaluation Study for Saxony
 DISCUSSION PAPER SERIES IZA DP No. 1205 The Effectiveness of Qualification Measures for Employed Workers An Evaluation Study for Saxony Michael Fertig July 2004 Forschungsinstitut zur Zukunft der Arbeit
The Relative Effectiveness of Selected Active Labour Market Programmes and the Common Support Problem
 DISCUSSION PAPER SERIES IZA DP No. 3767 The Relative Effectiveness of Selected Active Labour Market Programmes and the Common Support Problem Gesine Stephan André Pahnke October 2008 Forschungsinstitut
PARAMETRIC AND NON-PARAMETRIC BOOTSTRAP: A SIMULATION STUDY FOR A LINEAR REGRESSION WITH RESIDUALS FROM A MIXTURE OF LAPLACE DISTRIBUTIONS
 PARAMETRIC AND NON-PARAMETRIC BOOTSTRAP: A SIMULATION STUDY FOR A LINEAR REGRESSION WITH RESIDUALS FROM A MIXTURE OF LAPLACE DISTRIBUTIONS Melfi Alrasheedi School of Business, King Faisal University, Saudi
Empirical Methods for Corporate Finance. Regression Discontinuity Design
 Empirical Methods for Corporate Finance Regression Discontinuity Design Basic Idea of RDD Observations (e.g. firms, individuals, ) are treated based on cutoff rules that are known ex ante For instance,
Evaluating Monitoring Unemployed Workers Using Experiment. Controlled Social Experiment. Gerard J. van den Berg
 Evaluating the Monitoring of Unemployed Workers Using a Controlled Social Experiment (Alexander von Humboldt Professor, Mannheim) AIM: study effects of C&M on individual outcomes: exit rate to work, outcomes
Effects of working part-time and full-time on physical and mental health in old age in Europe
 Effects of working part-time and full-time on physical and mental health in old age in Europe Tunga Kantarcı Ingo Kolodziej Tilburg University and Netspar RWI - Leibniz Institute for Economic Research
Bonus Impacts on Receipt of Unemployment Insurance
 Upjohn Press Book Chapters Upjohn Research home page 2001 Bonus Impacts on Receipt of Unemployment Insurance Paul T. Decker Mathematica Policy Research Christopher J. O'Leary W.E. Upjohn Institute, oleary@upjohn.org
DIFFERENCE DIFFERENCES
 DIFFERENCE IN DIFFERENCES & PANEL DATA Technical Track Session III Céline Ferré The World Bank Structure of this session 1 When do we use Differences-in- Differences? (Diff-in-Diff or DD) 2 Estimation
Closing routes to retirement: how do people respond? Johannes Geyer, Clara Welteke
 Closing routes to retirement: how do people respond? Johannes Geyer, Clara Welteke DIW Berlin & IZA Research Affiliate, cwelteke@diw.de NETSPAR Workshop, January 20, 2017 Motivation: decreasing labor force
Economic conditions at school-leaving and self-employment
 Economic conditions at school-leaving and self-employment Keshar Mani Ghimire Department of Economics Temple University Johanna Catherine Maclean Department of Economics Temple University Department of
Volume 29, Issue 2. A note on finance, inflation, and economic growth
 Volume 29, Issue 2 A note on finance, inflation, and economic growth Daniel Giedeman Grand Valley State University Ryan Compton University of Manitoba Abstract This paper examines the impact of inflation
Assignment Mechanisms, Selection Criteria, and the Effectiveness of Training Programs
 Assignment Mechanisms, Selection Criteria, and the Effectiveness of Training Programs Annabelle Doerr, Anthony Strittmatter August 2014 Discussion Paper no. 2014-21 School of Economics and Political Science,
Institutional Reforms and an Incredible Rise in Old Age Employment
 DISCUSSION PAPER SERIES IZA DP No. 11931 Institutional Reforms and an Incredible Rise in Old Age Employment Regina T. Riphahn Rebecca Schrader OCTOBER 2018 DISCUSSION PAPER SERIES IZA DP No. 11931 Institutional
Evaluation of Subsidized Employment Programs for Long-Term Unemployment in Bulgaria A Matching Approach
 Emil Mihaylov Evaluation of Subsidized Employment Programs for Long-Term Unemployment in Bulgaria A Matching Approach MSc Thesis 2009 Evaluation of Subsidized Employment Programs for Long- Term Unemployed
HOUSEHOLDS INDEBTEDNESS: A MICROECONOMIC ANALYSIS BASED ON THE RESULTS OF THE HOUSEHOLDS FINANCIAL AND CONSUMPTION SURVEY*
 HOUSEHOLDS INDEBTEDNESS: A MICROECONOMIC ANALYSIS BASED ON THE RESULTS OF THE HOUSEHOLDS FINANCIAL AND CONSUMPTION SURVEY* Sónia Costa** Luísa Farinha** 133 Abstract The analysis of the Portuguese households
Capital allocation in Indian business groups
 Capital allocation in Indian business groups Remco van der Molen Department of Finance University of Groningen The Netherlands This version: June 2004 Abstract The within-group reallocation of capital
Evaluating Active Labor Market Programs in Romania
 DISCUSSION PAPER SERIES IZA DP No. 2464 Evaluating Active Labor Market Programs in Romania Nuria Rodriguez-Planas Jacob Benus November 2006 Forschungsinstitut zur Zukunft der Arbeit Institute for the Study
The Impact of a $15 Minimum Wage on Hunger in America
 The Impact of a $15 Minimum Wage on Hunger in America Appendix A: Theoretical Model SEPTEMBER 1, 2016 WILLIAM M. RODGERS III Since I only observe the outcome of whether the household nutritional level
New Evidence on the Effects of Job Creation Schemes in Germany - A Matching Approach with Threefold Heterogeneity
 New Evidence on the Effects of Job Creation Schemes in Germany - A Matching Approach with Threefold Heterogeneity Reinhard Hujer J.W.Goethe-University, Frankfurt, and IZA, Bonn Marco Caliendo J.W.Goethe-University,
THE PERSISTENCE OF UNEMPLOYMENT AMONG AUSTRALIAN MALES
 THE PERSISTENCE OF UNEMPLOYMENT AMONG AUSTRALIAN MALES Abstract The persistence of unemployment for Australian men is investigated using the Household Income and Labour Dynamics Australia panel data for
Journal of Economic Studies. Quantile Treatment Effect and Double Robust estimators: an appraisal on the Italian job market.
 Journal of Economic Studies Quantile Treatment Effect and Double Robust estimators: an appraisal on the Italian job market. Journal: Journal of Economic Studies Manuscript ID JES-0--00 Manuscript Type:
Kids or Courses? Gender Differences in the Effects of Active Labor Market Policies
 DISCUSSION PAPER SERIES IZA DP No. 274 Kids or Courses? Gender Differences in the Effects of Active Labor Market Policies Michael Lechner Stephan Wiehler April 27 Forschungsinstitut zur Zukunft der Arbeit
Applied Economics. Quasi-experiments: Instrumental Variables and Regresion Discontinuity. Department of Economics Universidad Carlos III de Madrid
 Applied Economics Quasi-experiments: Instrumental Variables and Regresion Discontinuity Department of Economics Universidad Carlos III de Madrid Policy evaluation with quasi-experiments In a quasi-experiment
Wage Determinants Analysis by Quantile Regression Tree
 Communications of the Korean Statistical Society 2012, Vol. 19, No. 2, 293 301 DOI: http://dx.doi.org/10.5351/ckss.2012.19.2.293 Wage Determinants Analysis by Quantile Regression Tree Youngjae Chang 1,a
SOCIAL SECURITY AND SAVING: NEW TIME SERIES EVIDENCE MARTIN FELDSTEIN *
 SOCIAL SECURITY AND SAVING SOCIAL SECURITY AND SAVING: NEW TIME SERIES EVIDENCE MARTIN FELDSTEIN * Abstract - This paper reexamines the results of my 1974 paper on Social Security and saving with the help
For Online Publication Additional results
 For Online Publication Additional results This appendix reports additional results that are briefly discussed but not reported in the published paper. We start by reporting results on the potential costs
Analyzing the Anticipation of Treatments using Data on Notification Dates
 Analyzing the Anticipation of Treatments using Data on Notification Dates Bruno Crépon Marc Ferracci Grégory Jolivet Gerard van den Berg CREST-INSEE University of Marne-la-Vallée University of Bristol
AN ANALYSIS OF THE DEGREE OF DIVERSIFICATION AND FIRM PERFORMANCE Zheng-Feng Guo, Vanderbilt University Lingyan Cao, University of Maryland
 The International Journal of Business and Finance Research Volume 6 Number 2 2012 AN ANALYSIS OF THE DEGREE OF DIVERSIFICATION AND FIRM PERFORMANCE Zheng-Feng Guo, Vanderbilt University Lingyan Cao, University
Identifying Effect Heterogeneity to Improve the Efficiency of Job Creation Schemes in Germany
 Identifying Effect Heterogeneity to Improve the Efficiency of Job Creation Schemes in Germany Marco Caliendo, Reinhard Hujer and Stephan L. Thomsen DIW, Berlin and IZA, Bonn J.W.Goethe-University, Frankfurt/Main,
Career Progression and Formal versus on the Job Training
 Career Progression and Formal versus on the Job Training J. Adda, C. Dustmann,C.Meghir, J.-M. Robin February 14, 2003 VERY PRELIMINARY AND INCOMPLETE Abstract This paper evaluates the return to formal
Long-Term Effects of Job-Search Assistance: Experimental Evidence Using Administrative Tax Data *
 Long-Term Effects of Job-Search Assistance: Experimental Evidence Using Administrative Tax Data * Day Manoli Marios Michaelides Ankur Patel UT-Austin and NBER University of Cyprus and US Treasury IMPAQ
THE ECONOMIC IMPACT OF RISING THE RETIREMENT AGE: LESSONS FROM THE SEPTEMBER 1993 LAW*
 THE ECONOMIC IMPACT OF RISING THE RETIREMENT AGE: LESSONS FROM THE SEPTEMBER 1993 LAW* Pedro Martins** Álvaro Novo*** Pedro Portugal*** 1. INTRODUCTION In most developed countries, pension systems have
Labor Economics Field Exam Spring 2014
 Labor Economics Field Exam Spring 2014 Instructions You have 4 hours to complete this exam. This is a closed book examination. No written materials are allowed. You can use a calculator. THE EXAM IS COMPOSED
Mobile Financial Services for Women in Indonesia: A Baseline Survey Analysis
 Mobile Financial Services for Women in Indonesia: A Baseline Survey Analysis James C. Knowles Abstract This report presents analysis of baseline data on 4,828 business owners (2,852 females and 1.976 males)
Does labor force participation rates of youth vary within the business cycle? Evidence from Germany and Poland
 Does labor force participation rates of youth vary within the business cycle? Evidence from Germany and Poland Sophie Dunsch European University Viadrina Frankfurt (Oder) Department of Business Administration
Déjà Vu? Short Term Training in Germany and
 DISCUSSION PAPER SERIES IZA DP No. 3540 Déjà Vu? Short Term Training in Germany 1980 1992 and 00 03 Bernd Fitzenberger Olga Orlyanskaya Aderonke Osikominu Marie Waller June 08 Forschungsinstitut zur Zukunft
Center for Demography and Ecology
 Center for Demography and Ecology University of Wisconsin-Madison Money Matters: Returns to School Quality Throughout a Career Craig A. Olson Deena Ackerman CDE Working Paper No. 2004-19 Money Matters:
Does Work for the Dole work?*
 Does Work for the Dole work?* Jeff Borland (University of Melbourne) and Yi-Ping Tseng (University of Melbourne) July 2004 Abstract This study examines the effect of a community-based work experience program
Assignment Mechanisms, Selection Criteria, and the Effectiveness of Training Programs
 Assignment Mechanisms, Selection Criteria, and the Effectiveness of Training Programs Annabelle Doerr Albert-Ludwigs-University Freiburg IAB Nuremberg Anthony Strittmatter Albert-Ludwigs-University Freiburg
Worker adaptation and workplace accommodations after the onset of an illness
 Høgelund and Holm IZA Journal of Labor Policy 2014, 3:17 ORIGINAL ARTICLE Worker adaptation and workplace accommodations after the onset of an illness Jan Høgelund 1 and Anders Holm 1,2,3* Open Access
ETLA Working Papers. The Effects of an Education-Leave Program on Educational Attainment and Labor-Market Outcomes. No. 56.
 ETLA Working Papers No. 56 14 February 2018 Antti Kauhanen The Effects of an Education-Leave Program on Educational Attainment and Labor-Market Outcomes Suggested citation: Kauhanen, Antti (14.2.2018).
Marginal Employment : Stepping Stone or Dead End?
 Marginal Employment : Stepping Stone or Dead End? Evaluating the German Experience Ronny Freier Stockholm School of Economics, DIW Berlin Email: Ronny.Freier@hhs.se Viktor Steiner Free University Berlin,
GMM for Discrete Choice Models: A Capital Accumulation Application
 GMM for Discrete Choice Models: A Capital Accumulation Application Russell Cooper, John Haltiwanger and Jonathan Willis January 2005 Abstract This paper studies capital adjustment costs. Our goal here
State Dependence in a Multinominal-State Labor Force Participation of Married Women in Japan 1
 State Dependence in a Multinominal-State Labor Force Participation of Married Women in Japan 1 Kazuaki Okamura 2 Nizamul Islam 3 Abstract In this paper we analyze the multiniminal-state labor force participation
Average Earnings and Long-Term Mortality: Evidence from Administrative Data
 American Economic Review: Papers & Proceedings 2009, 99:2, 133 138 http://www.aeaweb.org/articles.php?doi=10.1257/aer.99.2.133 Average Earnings and Long-Term Mortality: Evidence from Administrative Data
Labor supply of mothers with young children: Validating a structural model using a natural experiment
 Labor supply of mothers with young children: Validating a structural model using a natural experiment Johannes Geyer, Peter Haan, Katharina Wrohlich February 29, 2012 In this paper we estimate an intertemporal
Turning Unemployment into Self-Employment: Effectiveness and Efficiency of Two Start-Up Programmes
 Turning Unemployment into Self-Employment: Effectiveness and Efficiency of Two Start-Up Programmes Hans J. Baumgartner Marco Caliendo DIW Berlin Working Paper This draft: May 31, 2007 Abstract Turning
Evaluation of the Active Labour. Severance to Job. Aleksandra Nojković, Sunčica VUJIĆ & Mihail Arandarenko Brussels, December 14-15, 2010
 Evaluation of the Active Labour Market Policy in Serbia: Severance to Job Aleksandra Nojković, Sunčica VUJIĆ & Mihail Arandarenko Brussels, December 14-15, 2010 1 Summary The paper evaluates the treatment
Does the Sophistication of Use of Unemployment Insurance Evolve with Experience?
 Does the Sophistication of Use of Unemployment Insurance Evolve with Experience? David Gray University of Ottawa Ted McDonald University of New Brunswick For presentation at the OECD June 2011 Topic: repeat
The Impact of Foreign Direct Investment on the Export Performance: Empirical Evidence for Western Balkan Countries
 Abstract The Impact of Foreign Direct Investment on the Export Performance: Empirical Evidence for Western Balkan Countries Nasir Selimi, Kushtrim Reçi, Luljeta Sadiku Recently there are many authors that
Exports and Profitability: First Evidence for German Manufacturing Firms
 DISCUSSION PAPER SERIES IZA DP No. 3798 Exports and Profitability: First Evidence for German Manufacturing Firms Helmut Fryges Joachim Wagner October 2008 Forschungsinstitut zur Zukunft der Arbeit Institute
Time Invariant and Time Varying Inefficiency: Airlines Panel Data
 Time Invariant and Time Varying Inefficiency: Airlines Panel Data These data are from the pre-deregulation days of the U.S. domestic airline industry. The data are an extension of Caves, Christensen, and
1 Introduction. Domonkos F Vamossy. Whitworth University, United States
 Proceedings of FIKUSZ 14 Symposium for Young Researchers, 2014, 285-292 pp The Author(s). Conference Proceedings compilation Obuda University Keleti Faculty of Business and Management 2014. Published by
The impact of active labor market programs on the duration of unemployment
 Research Collection Working Paper The impact of active labor market programs on the duration of unemployment Author(s): Lalive, Rafael; Ours, J. C. ; Zweimüller, Josef Publication Date: 2002 Permanent
Benefit-Entitlement Effects and the Duration of Unemployment: An Ex-Ante Evaluation of Recent Labour Market Reforms in Germany
 DISCUSSION PAPER SERIES IZA DP No. 2681 Benefit-Entitlement Effects and the Duration of Unemployment: An Ex-Ante Evaluation of Recent Labour Market Reforms in Germany Hendrik Schmitz Viktor Steiner March
Discussion Paper Series
 Discussion Paper Series IZA DP No. 10730 Under Heavy Pressure: Intense Monitoring and Accumulation of Sanctions for Young Welfare Recipients in Germany Gerard van den Berg Arne Uhlendorff Joachim Wolff
**BEGINNING OF EXAMINATION** A random sample of five observations from a population is:
 **BEGINNING OF EXAMINATION** 1. You are given: (i) A random sample of five observations from a population is: 0.2 0.7 0.9 1.1 1.3 (ii) You use the Kolmogorov-Smirnov test for testing the null hypothesis,
Investment Platforms Market Study Interim Report: Annex 7 Fund Discounts and Promotions
 MS17/1.2: Annex 7 Market Study Investment Platforms Market Study Interim Report: Annex 7 Fund Discounts and Promotions July 2018 Annex 7: Introduction 1. There are several ways in which investment platforms
Methodologies to assess the overall effectiveness of EU cohesion policy: a critical appraisal
 7th European Commission Evaluation Conference The Result Orientation: Cohesion Policy at Work Methodologies to assess the overall effectiveness of EU cohesion policy: a critical appraisal and (Sapienza,
Overseas unspanned factors and domestic bond returns
 Overseas unspanned factors and domestic bond returns Andrew Meldrum Bank of England Marek Raczko Bank of England 9 October 2015 Peter Spencer University of York PRELIMINARY AND INCOMPLETE Abstract Using
New Evidence on the Demand for Advice within Retirement Plans
 Research Dialogue Issue no. 139 December 2017 New Evidence on the Demand for Advice within Retirement Plans Abstract Jonathan Reuter, Boston College and NBER, TIAA Institute Fellow David P. Richardson
Disability Pensions and Labor Supply
 BGPE Discussion Paper No. 86 Disability Pensions and Labor Supply Barbara Hanel January 2010 ISSN 1863-5733 Editor: Prof. Regina T. Riphahn, Ph.D. Friedrich-Alexander-University Erlangen-Nuremberg Barbara
Window Width Selection for L 2 Adjusted Quantile Regression
 Window Width Selection for L 2 Adjusted Quantile Regression Yoonsuh Jung, The Ohio State University Steven N. MacEachern, The Ohio State University Yoonkyung Lee, The Ohio State University Technical Report
Copyright 2011 Pearson Education, Inc. Publishing as Addison-Wesley.
 Appendix: Statistics in Action Part I Financial Time Series 1. These data show the effects of stock splits. If you investigate further, you ll find that most of these splits (such as in May 1970) are 3-for-1