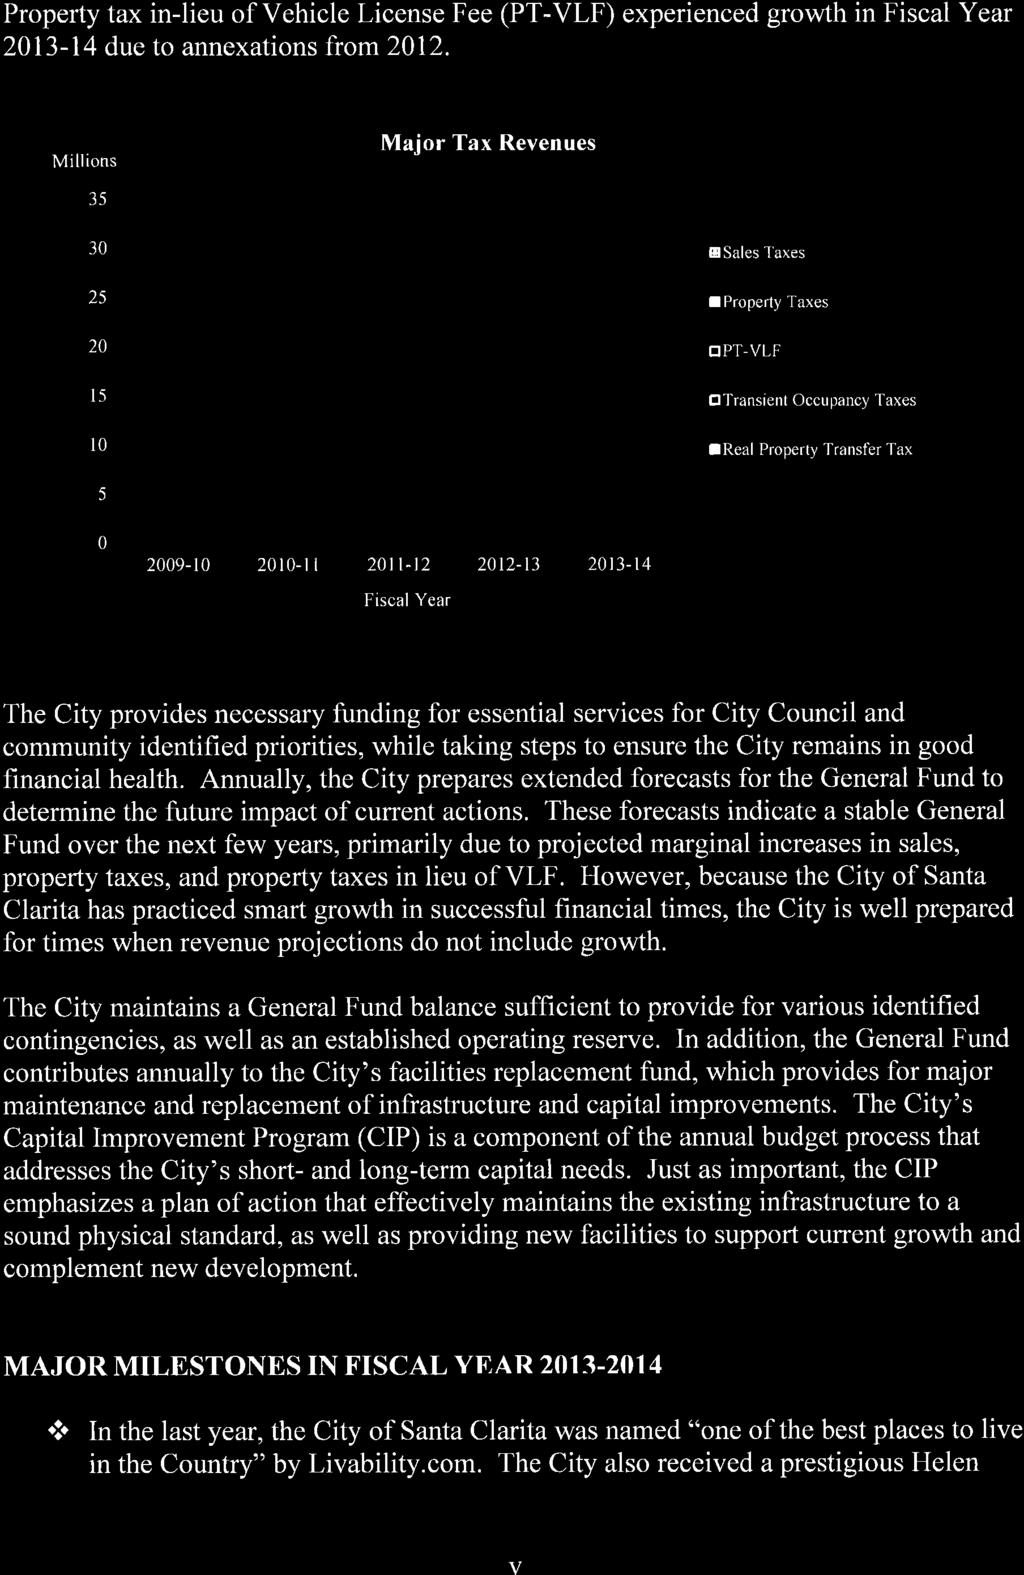
Comprehensive Annual Financial Report
|
|
|
- Francis Phelps
- 5 years ago
- Views:
Transcription

1 City of SANTA CLARITA, California Comprehensive Annual Financial Report Fiscal Year ended June 30, 2014 F i s c a l Ye a r
2
3 , California Comprehensive Annual Financial Report For the Fiscal Year Ended June 30, 2014 PREPARED BY THE DEPARTMENT OF ADMINISTRATIVE SERVICES CITY OF SANTA CLARITA, CALIFORNIA
4
5 Comprehensive Annual Financial Report Table of Contents INTRODUCTORY SECTION Page Letter of Transmittal... i GFOA Certificate of Achievement for Excellence in Financial Reporting... ix Officials of the City of Santa Clarita... x Organization Chart... xi Map of the City of Santa Clarita... xii FINANCIAL SECTION Independent Auditor s Report... 1 Management s Discussion and Analysis (Unaudited)... 3 Basic Financial Statements: Government-wide Financial Statements: Statement of Net Position Statement of Activities Fund Financial Statements: Governmental Fund Financial Statements: Balance Sheet Reconciliation of the Governmental Funds Balance Sheet to the Statement of Net Position Statement of Revenues, Expenditures and Changes in Fund Balances Reconciliation of the Governmental Funds Statement of Revenues, Expenditures and Changes in Fund Balances to the Statement of Activities Proprietary Fund Financial Statements: Statement of Net Position Statement of Revenues, Expenses and Changes in Net Position Statement of Cash Flows Fiduciary Fund Financial Statements: Statement of Net Position (Deficit) Statement of Changes in Net Position (Deficit) Notes to Financial Statements... 31
6 Comprehensive Annual Financial Report Table of Contents FINANCIAL SECTION (Continued) Page Required Supplementary Information (Unaudited) Schedules of Revenues, Expenditures and Changes in Fund Balance Budget and Actual: General Fund Bridge and Thoroughfare Special Revenue Fund Public Library Special Revenue Fund Landscape Maintenance District #1 Special Revenue Fund Schedule of Funding Progress Notes to Required Supplementary Information Supplementary Information: Non-Major Governmental Funds: Description of Nonmajor Governmental Funds Combining Balance Sheet Combining Statement of Revenues, Expenditures and Changes in Fund Balances Schedules of Revenues, Expenditures and Changes in Fund Balance Budget and Actual: Developer Fees Special Revenue Fund Bikeway Special Revenue Fund Gas Tax Special Revenue Fund Proposition A Special Revenue Fund Special Assessment Special Revenue Fund State Park Special Revenue Fund TDA Special Revenue Fund Traffic Safety Special Revenue Fund CDBG Special Revenue Fund AQMD Special Revenue Fund Stormwater Special Revenue Fund Surface Transportation Program Special Revenue Fund BJA Law Enforcement Special Revenue Fund Supplemental Law Grant Special Revenue Fund HOME Special Revenue Fund Library Facilities Fees Special Revenue Fund Public Education and Government Special Revenue Fund Proposition C Special Revenue Fund Federal Grants Special Revenue Fund Measure R Special Revenue Fund Tourism Marketing District Special Revenue Fund OSPD Special Revenue Fund Miscellaneous Grants Special Revenue Fund Park Dedication Special Revenue Fund Housing Successor Agency Special Revenue Fund Tourism Marketing Bureau Special Revenue Fund General Capital Projects Fund
7 Comprehensive Annual Financial Report Table of Contents FINANCIAL SECTION (Continued) Page Public Financing Authority Capital Projects Fund Public Financing Authority Debt Service Fund Internal Service Funds: Description of Internal Service Funds Combining Statement of Net Position Combining Statement of Revenues, Expenses and Changes in Net Position Combining Statement of Cash Flows Fiduciary Funds: Description of Fiduciary Funds Combining Statement of Assets and Liabilities Agency Funds Combining Statement of Changes in Assets and Liabilities Agency Funds STATISTICAL SECTION (Unaudited) Table of Contents Net Position by Component Changes in Net Position Fund Balances of Governmental Funds Changes in Fund Balances of Governmental Funds Assessed Values and Actual Values of Taxable Property Assessed Values and Actual Values of Taxable Property Redevelopment Agency Assessed Values Taxable Property Assessed Values Use Category Summary Direct and Overlapping Property Tax Rates Principal Property Taxpayers Property Tax Levies, Tax Collections and Delinquencies Top Property Owners Based on Net Values Successor Agency Project Area Assessment Appeals Summary and Tax Collection History Successor Agency Charge Detail Report for CFD (Valencia Town Center) Successor Agency Ratio of Outstanding Debt by Type Ratio of General Bonded Debt Outstanding Direct and Overlapping Bonded Debt Legal Debt Margin Information Pledged Revenue Coverage Demographic and Economic Statistics Principal Employers Full-Time and Part-Time City Employees by Function Operating Indicators by Function Capital Asset Statistics by Function
8
9
10
11
12
13
14
15

16
17 ix
18 OFFICIALS OF THE CITY OF SANTA CLARITA As of June 30, 2014 City Council Laurene Weste Marsha McLean Bob Kellar TimBen Boydston Dante Acosta MAYOR MAYOR PRO TEM COUNCILMEMBER COUNCILMEMBER COUNCILMEMBER City Officials Ken Striplin Frank Oviedo Darren Hernández Joseph Montes Tom Cole Richard Gould Robert Newman CITY MANAGER ASSISTANT CITY MANAGER DEPUTY CITY MANAGER CITY ATTORNEY DIRECTOR OF COMMUNITY DEVELOPMENT DIRECTOR OF PARKS, RECREATION & COMMUNITY SERVICES DIRECTOR OF PUBLIC WORKS/CITY ENGINEER x
19 ORGANIZATION CHART As of June 30, 2014 Santa Clarita Residents City Council City Manager Administrative Community Public Parks, Recreation & City Manager's Services Development Works Community Services Office Finance Planning Engineering Recreation Sheriff's Department Technology Services Community Preservation Traffic Engineering Parks Fire Protection Special Districts Redevelopment Building & Safety Community Services Human Resources Transit Community Dev. Block Grant General Services Parks Planning & Open Space Purchasing Public Library Economic Development Environmental Services Risk Management Urban Forestry City Clerk xi
20 xii
21 Independent Auditor s Report To the Honorable Mayor and Members of the City Council of the City of Santa Clarita Santa Clarita, CA Report on the Financial Statements We have audited the accompanying financial statements of the governmental activities, the business-type activities, each major fund and the aggregate remaining fund information of the City of Santa Clarita, California (the City) as of and for the year ended June 30, 2014, and the related notes to the financial statements, which collectively comprise the City s basic financial statements as listed in the table of contents. Management s Responsibility for the Financial Statements Management is responsible for the preparation and fair presentation of these financial statements in accordance with accounting principles generally accepted in the United States of America; this includes the design, implementation and maintenance of internal control relevant to the preparation and fair presentation of financial statements that are free from material misstatement, whether due to fraud or error. Auditor s Responsibility Our responsibility is to express opinions on these financial statements based on our audit. We conducted our audit in accordance with auditing standards generally accepted in the United States of America. Those standards require that we plan and perform the audit to obtain reasonable assurance about whether the financial statements are free from material misstatement. An audit involves performing procedures to obtain audit evidence about the amounts and disclosures in the financial statements. The procedures selected depend on the auditor s judgment, including the assessment of the risks of material misstatement of the financial statements, whether due to fraud or error. In making those risk assessments, the auditor considers internal control relevant to the City s preparation and fair presentation of the financial statements in order to design audit procedures that are appropriate in the circumstances, but not for the purpose of expressing an opinion on the effectiveness of the City s internal control. Accordingly, we express no such opinion. An audit also includes evaluating the appropriateness of accounting policies used and the reasonableness of significant accounting estimates made by management, as well as evaluating the overall presentation of the financial statements. We believe that the audit evidence we have obtained is sufficient and appropriate to provide a basis for our audit opinions. Opinions In our opinion, the financial statements referred to above present fairly, in all material respects, the respective financial position of the governmental activities, the business-type activities, each major fund and the aggregate remaining fund information of the City as of June 30, 2014, and the respective changes in financial position and, where applicable, cash flows thereof for the year then ended, in accordance with accounting principles generally accepted in the United States of America. 1
22 Emphasis of Matter As discussed in Note 12 to the financial statements, the beginning net position of the governmental activities has been restated to correct misstatements as of June 30, We also audited the adjustments described in Note 12 that were applied to restate the 2013 financial statements. In our opinion, such adjustments are appropriate and have been properly applied. Our opinion is not modified with respect to this matter. Other Matters Required Supplementary Information Accounting principles generally accepted in the United States of America require that the management s discussion and analysis, budgetary comparison information and schedules of funding progress be presented to supplement the basic financial statements. Such information, although not a part of the basic financial statements, is required by the Governmental Accounting Standards Board, which considers it to be an essential part of financial reporting for placing the basic financial statements in an appropriate operational, economic or historical context. We have applied certain limited procedures to the required supplementary information in accordance with auditing standards generally accepted in the United States of America, which consisted of inquiries of management about the methods of preparing the information and comparing the information for consistency with management s responses to our inquiries, the basic financial statements and other knowledge we obtained during our audit of the basic financial statements. We do not express an opinion or provide any assurance on the information because the limited procedures do not provide us with sufficient evidence to express an opinion or provide any assurance. Other Information Our audit was conducted for the purpose of forming opinions on the financial statements that collectively comprise the City s basic financial statements. The combining non-major fund financial statements and schedules, and other information such as the introductory and statistical sections, are presented for purposes of additional analysis and are not a required part of the basic financial statements. The combining non-major fund financial statements and schedules are the responsibility of management and were derived from and relate directly to the underlying accounting and other records used to prepare the basic financial statements. Such information has been subjected to the auditing procedures applied in the audit of the basic financial statements and certain additional procedures, including comparing and reconciling such information directly to the underlying accounting and other records used to prepare the basic financial statements or to the basic financial statements themselves, and other additional procedures in accordance with auditing standards generally accepted in the United States of America. In our opinion, the combining non-major fund financial statements and schedules are fairly stated, in all material respects, in relation to the basic financial statements as a whole. The introductory and statistical sections have not been subjected to the auditing procedures applied in the audit of the basic financial statements, and accordingly, we do not express an opinion or provide any assurance on them. Irvine, CA December 22,
23 MANAGEMENT S DISCUSSION AND ANALYSIS Fiscal Year Ended June 30, 2014 This discussion and analysis of the City of Santa Clarita s (the City) financial performance provides an overview of the financial activities of the City for the fiscal year ended June 30, Our analysis includes information regarding the City s overall financial position and results of operations to assist users in evaluating the City s financial position, a discussion of significant changes that occurred in funds, and information regarding significant budget variances. In addition, it describes the activities during the year for capital assets and long-term debt. We end our discussion and analysis with a description of currently known facts, decisions and conditions that are expected to have a significant effect on the financial position or results of operations. Please read it in conjunction with the accompanying transmittal letter, the basic financial statements and the accompanying notes to those financial statements. FINANCIAL HIGHLIGHTS The assets of the City exceeded its liabilities at the close of the most recent fiscal year by $1.04 billion. Of this amount, $86.2 million represents unrestricted net position that may be used to meet the City s ongoing obligations to citizens and creditors (Table 1). The City s total net position increased by $40.4 million, net of prior year restatements. Net position of the business-type activities increased by $6.2 million, or 7.8 percent, and the net position of the governmental activities increased by $34.2 million, net of prior year restatements (Table 2). The net capital assets of the City s governmental activities increased by $60.8 million, or 7.9 percent, over last fiscal year. The increase was in part due to a restatement totaling $47.8 million for capital assets. This included $48.5 million for infrastructure, land and site improvements that were annexed from Los Angeles County; a reduction of $8.2 million for duplication of capital assets; and an increase of $7.5 million for storm drain infrastructure not recorded at Governmental Accounting Standards Board (GASB) Statement No. 34 implementation. See Note 12 to the financial statements for additional information on the restatement. As of the close of the current fiscal year, the City s governmental funds reported combined ending fund balances of $188.5 million. This represents an increase of $30.0 million as compared to the prior year. Within governmental funds, the General Fund reported a fund balance of $108.9 million, an increase of $14.6 million over the prior year. USING THIS ANNUAL REPORT The financial statements presented herein include all of the activities of the City of Santa Clarita and its component unit using the integrated approach as prescribed by GASB 34. The three components of the basic financial statements are as follows: 1) Government-Wide Financial Statements The Government-Wide Financial Statements present the financial picture of the City from the economic resources measurement focus using the accrual basis of accounting in a manner similar to a private-sector business. These statements include all assets of the City (including infrastructure) as well as all liabilities (including long-term debt). See independent auditor s report. 3
24 USING THIS ANNUAL REPORT (CONTINUED) 2) Fund Financial Statements The Fund Financial Statements include statements for each of the three categories of activities: governmental, proprietary and fiduciary. For governmental activities, these fund statements tell how these services were financed in the short term, as well as what remains for future spending. Fund financial statements also report the City s operations in more detail than the government-wide statements by providing information about the City s most significant funds and other funds. 3) Notes to the Basic Financial Statements The notes provide additional information necessary to enable the user to fully understand the various financial statements. In addition to the basic financial statements and notes, this report contains other supplementary information. REPORTING THE CITY AS A WHOLE GOVERNMENT-WIDE FINANCIAL STATEMENTS The Statement of Net Position and the Statement of Activities One of the most important questions asked about the City s finances is, Is the City as a whole better or worse off as a result of the year s activities? The Statement of Net Position and the Statement of Activities report information about the City as a whole, and its activities, in a way to answer this question. These statements include all assets and liabilities of the City using the accrual basis of accounting, which is similar to the accounting used by most private-sector companies. All of the current year s revenues and expenses are taken into account, regardless of when cash is received or paid. The Statement of Net Position reports all of the City s assets and liabilities, with the difference between the two reported as net position. Net position is one way to measure the City s financial health or financial position. Over time, increases or decreases in the City s net position is an indication of whether its financial health is improving or deteriorating. Other things to consider are non-financial factors, such as changes in the economy due to external factors that would cause an increase or decrease in consumer spending. The Statement of Activities presents information relating to how the City s net position changed during the fiscal year. All activities resulting in changes in net position are reported when earned or incurred, regardless of the receipt or disbursement of the related transaction s cash flows. Some of the revenues and expenses reported in this statement will result in future fiscal period cash flows, such as the receipt of uncollected taxes and the payment of interest expense or compensated absences. In the Statement of Net Position and the Statement of Activities, we separate the City s activities as follows: Governmental Activities Most of the City s basic services are reported in this category, including general administration (City Manager, City Clerk, Finance, etc.), public safety, public works, parks, recreation and community services, and community development (planning and engineering). These activities are distinguished due to the use of property taxes, sales tax, transient occupancy tax, user fees, interest income, franchise fees, state and federal grants, contributions from other agencies, and other revenues to finance these activities. Business-Type Activities City functions that are intended to be primarily self-supporting through the imposition of user fees and charges are reported in the business-type activity category. Business-type activities for the City consist of transit activities related to the operation of the City s local public transportation system. See independent auditor s report. 4
25 REPORTING THE CITY AS A WHOLE GOVERNMENT-WIDE FINANCIAL STATEMENTS (CONTINUED) Component Unit Activities The City of Santa Clarita is the primary government unit to one legally separate entity. The financial activity and data of the Santa Clarita Public Financing Authority has been accounted for within the funds of the City, and therefore, separate component unit financial information is not presented within the financial statements. REPORTING THE CITY S MOST SIGNIFICANT FUNDS FUND FINANCIAL STATEMENTS A fund is a grouping of related accounts used to account for and accumulate financial information related to a specific activity or objective. Some funds are required to be established by State law and bond covenants; however, management established many other funds to help it control and manage money for particular purposes or to show that it is meeting legal responsibilities for using certain taxes, grants and other resources. The fund financial statements provide detailed information about the most significant funds and other funds not the City as a whole. The City s three types of funds are governmental, proprietary and fiduciary. Governmental Funds Most of the City s basic services are reported in governmental funds. Governmental fund financial statements focus on how money flows in and out of those funds and the balances left at year-end that are available for spending. These funds are reported using an accounting method called modified accrual accounting, which measures cash and all other financial assets that can readily be converted to cash. The governmental fund statements provide a detailed short-term view of the City s general government operations and the basic services it provides. Governmental fund information helps determine whether there are more or fewer financial resources that can be spent in the near future to finance the City s programs. Since the focus of the governmental funds is narrower than that of the government-wide financial statements, it is useful to compare the information presented for the governmental funds with similar information presented for the governmental activities in the governmentwide financial statements. Reconciliation of the Fund Financial Statements to the Government-Wide Financial Statements is provided to explain the differences created by this integrated approach. The City reports governmental fund financial information within 33 governmental funds. The General Fund, Bridge and Thoroughfare Fund, Public Library Fund and Landscape Maintenance District Fund are presented separately as major funds in the governmental fund balance sheet and in the Governmental Fund Statement of Revenues, Expenditures and Changes in Fund Balances. Financial data for the remaining 29 governmental funds are combined into a single, aggregated presentation. Supporting financial information on each of the other governmental funds is also provided within the report. Proprietary Funds The City maintains two different types of proprietary funds. When the City charges customers for the services it provides, these services are generally reported in a type of proprietary fund known as an enterprise fund. Enterprise funds are used to report the same functions presented as business-type activities in the government-wide financial statements, but the proprietary fund statements provide more detail and additional information, such as a statement of cash flows. The City uses the Transit Enterprise Fund to account for the activities related to transit operations. Internal service funds are an accounting device used to accumulate and allocate costs internally among the City s various functions. The City uses three internal service funds to account for costs related to selfinsurance, computer replacement and vehicle-equipment replacement. Proprietary funds are reported in the same way all activities are reported in the Statement of Net Position and the Statement of Activities. The proprietary fund financial statements provide separate information for the Transit Enterprise Fund, which is considered to be a major fund of the City. All of the internal service funds are combined into a single, aggregated presentation in the proprietary fund financial statements. Individual fund data for the internal service funds is provided in the form of combining statements in the Supplementary Information section of this report. See independent auditor s report. 5
26 THE CITY AS TRUSTEE FIDUCIARY FUND STATEMENTS Reporting the City s Fiduciary Responsibilities The City is the trustee, or fiduciary, for certain funds held for the benefit of other parties outside of the City. The City s fiduciary activities are reported in a separate Statement of Net Position (Deficit) and a Statement of Changes in Net Position (Deficit). These activities were excluded from the City s other financial statements because the City cannot use these assets to finance its operations. The City is responsible for ensuring that the assets reported in these funds are used for their intended purposes. NOTES TO THE BASIC FINANCIAL STATEMENTS The notes provide additional information that is essential to a full understanding of the data provided in the government-wide and fund financial statements. OTHER INFORMATION In addition to the basic financial statements and accompanying notes, this report also presents certain required supplementary information concerning the comparison of budget and actual results for the major governmental funds and pension and other post-employment benefits schedule of funding progress. This section is located after the Notes to Financial Statements. The combining statements referred to earlier in connection with the other governmental funds, internal service funds and fiduciary funds are presented immediately following the required supplementary information described in the previous paragraph in the Supplementary Information section. THE CITY AS A WHOLE The analysis below focuses on the net position (Table 1) and changes in net position (Table 2) of the City s governmental and business-type activities. The City s net position may be analyzed and used as an indicator of the City s overall financial condition. The City s combined net position increased by $88.2 million, increasing from $952.9 million to $1.04 billion inclusive of prior year restatements. See independent auditor s report. 6
27 THE CITY AS A WHOLE (CONTINUED) TABLE 1 CITY OF SANTA CLARITA S NET POSITION Governmental Activities Business-Type Activities Total ASSETS: Current and Other Assets $ 210,971,600 $ 182,284,566 $ 6,300,981 $ 7,628,301 $ 217,272,581 $ 189,912,867 Capital Assets, net 830,373, ,323,716 83,296,545 76,561, ,669, ,885,123 Noncurrent Assets 21,254,919 15,561, ,254,919 15,561,487 TOTAL ASSETS 1,062,599,528 1,015,169,769 89,597,526 84,189,708 1,152,197,054 1,099,359,477 LIABILITIES: Noncurrent Liabilities 82,004,957 72,211,285 26,714-82,031,671 72,211,285 Other Liabilities 26,169,470 22,704,246 2,920,056 3,792,985 29,089,526 26,497,231 TOTAL LIABILITIES 108,174,427 94,915,531 2,946,770 3,792, ,121,197 98,708,516 NET POSITION: Net Investment in Capital Assets Restricted 799,926,613 71,643, ,025,874 68,521,940 83,296,545-76,561, ,223,158 71,643, ,587,281 68,521,940 Unrestricted 82,854,775 65,706,424 3,354,211 3,835,316 86,208,986 69,541,740 TOTAL NET POSITION $ 954,425,101 $ 920,254,238 $ 86,650,756 $ 80,396,723 $ 1,041,075,857 $ 1,000,650,961 The City s net position is made up of three components: Net Investment in Capital Assets, Restricted Net Position and Unrestricted Net Position. As of June 30, 2014, assets exceeded liabilities by $1.04 billion. The largest component of the City s net position, 84.8 percent, is represented by its $883.2 million net investment in capital assets, less accumulated depreciation and any related outstanding debt used to acquire the capital assets. These capital assets are used to provide services to the citizens, and therefore are not available to finance future operations. In addition, resources necessary to repay the related debt must be provided by sources other than the capital assets, as the assets themselves cannot be used to satisfy these liabilities. An additional portion of the City s net position, 6.9 percent, represents resources subject to external restrictions on how they may be used. The remaining 8.3 percent of unrestricted net position, $86.2 million, may be used to meet the City s ongoing obligations to citizens and creditors. Consistent with the prior year, at the end of the current fiscal year, the City is able to report positive balances in both categories of governmental and business-type net position. Net position for governmental activities increased by $81.9 million over the prior year. The increase was in part due to a restatement totaling $47.8 million for capital assets. This included $48.5 million for infrastructure, land and site improvements that were annexed from Los Angeles County; a reduction of $8.2 million for duplication of capital assets; and an increase of $7.5 million for storm drain infrastructure not recorded at GASB 34 implementation. The net result was an increase of $34.2 million to net position. The unrestricted net position of the business-type activities decreased by $481,105. See independent auditor s report. 7
28 THE CITY AS A WHOLE (CONTINUED) Governmental Activities Revenues from governmental activities increased by $17.9 million, or 11.2 percent, due in part to an increase in charges for services of $10.1 million, an increase in property tax revenues of $3.3 million, a $2.1 million increase in investment income, and a $1.4 million increase in sales tax revenue. The cost of all governmental activities this year was $138.4 million, an increase of 5.9 percent over the past year. As shown in the Statement of Activities, the governmental activities expenditures were ultimately financed in part by the taxpayers, as $52.6 million in revenues were generated by service revenues received from the performance of these activities; another $19.4 million was received from government agencies and other organizations that subsidized certain programs with operating grants and contributions; and another $22.5 million in revenues was generated from capital grants and contributions. Overall, the City s governmental program and general revenues amounted to $178.2 million, which funded the expenditures and resulted in a $34.2 million increase in net position excluding restatements. TABLE 2 CITY OF SANTA CLARITA S CHANGES IN NET POSITION Governmental Activities Business-Type Activities Total Program Revenues: Charges for services $ 52,632,526 $ 42,533,447 $ 7,587,497 $ 6,863,086 $ 60,220,023 $ 49,396,533 Operating grants and contributions 19,421,199 9,061,950 8,984,127 8,579,209 28,405,326 17,641,159 Capital grants and contributions 22,530,841 33,585,797 10,804,747 8,513,238 33,335,588 42,099,035 General Revenues: Taxes: Property taxes 35,652,080 32,341, ,652,080 32,341,369 Other taxes 45,092,120 42,553, ,092,120 42,553,327 Other: 2,890, ,806 4,791 29,660 2,895, ,466 Total Revenues 178,219, ,303,696 27,381,162 23,985, ,600, ,288,889 General government 41,807,284 35,921, ,807,284 35,921,943 Public safety 22,187,434 19,940, ,187,434 19,940,098 Public works 26,183,862 28,651, ,183,862 28,651,261 Parks, recreation and community services 22,550,301 21,809, ,550,301 21,809,820 Community development 6,193,101 7,214, ,193,101 7,214,293 Unallocated infrastructure depreciation 17,561,539 15,163, ,561,539 15,163,864 Interest and fiscal charges 1,872,832 1,992, ,872,832 1,992,574 Transit ,819,161 25,653,753 26,819,161 25,653,753 Total Expenses 138,356, ,693,853 26,819,161 25,653, ,175, ,347,606 Increase/Decrease in Net Position Before Transfers 39,862,895 29,609, ,001 (1,668,560) 40,424,896 27,941,283 Transfers (5,692,032) (5,187,224) 5,692,032 5,187, Changes in Net Position 34,170,863 24,422,619 6,254,033 3,518,664 40,424,896 27,941,283 Net Position Beginning of Year 920,254, ,614,046 80,396,723 76,878,059 1,000,650, ,492,105 Restatements - (18,052,147) (18,052,147) Net Position Beginning of Year, as restated 920,254, ,561,899 80,396,723 76,878,059 1,000,650, ,439,958 Net Position End of Year 954,425, ,984,518 86,650,756 80,396,723 1,041,075, ,381,241 Restatements - 41,269, ,269,720 Net Position End of Year, as restated $ 954,425,101 $ 920,254,238 $ 86,650,756 $ 80,396,723 $ 1,041,075,857 $ 1,000,650,961 Business-Type Activities Business-type activities increased the City s net position by $6.3 million for the current year. Business-type activities revenues increased by $3.4 million during the year for a total of $27.4 million in revenues, not including the $5.7 million of transfers in from other governmental activities. The increased revenue was largely due to an increase in capital grants and contributions. Federal Transit Administration grant funds for the purchase of buses totaled $7 million. Related transit activity expenses increased by $1.2 million. See independent auditor s report. 8
29 THE CITY S FUNDS The governmental funds reported a combined fund balance at the end of the current fiscal year of $188.5 million, an increase of $30 million over the prior year. Approximately $84.3 million is restricted and already committed for specific restricted purposes. The total governmental fund balance includes the general fund balance of $108.9 million, which increased by $14.6 million over the prior year. The General Fund is the chief operating fund of the City of Santa Clarita. The fund balance increase of $14.6 million is due in part to an increase in tax revenues of $5.5 million. The unassigned fund balance of $45.7 million is available for spending at the City s discretion. More detailed information about the City s classification of fund balances are presented in Note 12 to the financial statements. Other major fund balance changes are noted below: The Bridge and Thoroughfare Fund has realized a decrease of $3 million from the prior year due primarily to a decrease in the issuance of Bridge and Thoroughfare credits to developers of $3.3 million. The Public Library Fund has realized an increase of $58,267 in its fund balance from the prior year. The Landscape Maintenance District s fund balance increased $2.4 million from the prior year due in part to an increase in assessment revenues of $3.4 million. In addition to the major funds, the fund balances for the other governmental funds experienced an aggregate increase of $15.9 million. The Housing Successor Agency fund received a transfer of $5 million in bond proceeds from the Successor Agency to the City s former redevelopment agency as approved by the Department of Finance. The fund balance in the Transportation Development Act fund increased by $5.2 million due to reimbursements for prior year project expenditures. The City s proprietary funds provide the same type of information found in the government-wide financial statements, but in more detail. The total net position for the Transit Enterprise Fund increased over the prior year by $6.3 million, or 7.8 percent. The unrestricted portion of the business-type activities net position decreased by $481,105 from the prior year. The Internal Service Funds net position increased by $492,173, or 6.1 percent. The ending fund balance for Internal Service Funds is $8.6 million, of which $8 million is unrestricted. General Fund Budgetary Highlights Comparison of the fiscal year original (adopted) general fund budgeted expenditures and transfers of $81.6 million to the final budgeted expenditures of $86.3 million results in a net increase of $4.7 million. Included in this net increase is $408,447 in committed purchase orders and contracts from the prior June 30 balance, as well as $417,454 of prior fiscal year operating and capital improvement projects approved for carryover into fiscal year The resulting beginning budget balance was equal to $82.4 million. Original Cont. Encumbrances Beg. Supplemental Final Budget + Appropriations + = Balance + Changes = Budget $81,602,536 + $417,454 + $408,447 = $82,428,437 + $3,875,490 = $86,303,927 See independent auditor s report. 9
30 THE CITY S FUNDS (CONTINUED) Comparing the beginning budget of $82.4 million with the final budget of $86.3 million indicates the General Fund had supplemental budgetary appropriations of $3.9 million during the fiscal year. Included in the supplemental appropriations are the results of this year s budget review. During the mid-year budget review, budgeted General Fund revenue had a net increase of $4,049,776. Included in the net increase are a $1,500,000 increase in sales tax, $900,000 increase in development revenues, $500,000 increase in property tax, $118,000 increase in Franchise Fees, and $100,000 in real property tax transfers revenue. At year-end, the City s actual revenues were $2.7 million more than the final budgetary estimates. Actual expenditures were less than the final budgetary estimates by $8.3 million. CAPITAL ASSETS AND DEBT ADMINISTRATION Capital Assets The City had $913.7 million (net of accumulated depreciation) invested in a broad range of capital assets. This investment in capital assets includes land, buildings and related improvements, vehicles and equipment, and infrastructure (including infrastructure placed in service prior to July 1, 2002), such as streets, bridges, traffic signals, medians, sidewalks, trails, sewers, curbs and gutters, and drainage systems (see Table 3). TABLE 3 CITY OF SANTA CLARITA S CAPITAL ASSETS (net of depreciation) Governmental Activities Business-Type Activities Total Land $ 125,250,547 $ 125,250,547 $ 15,087,880 $ 15,087,880 $ 140,338,427 $ 140,338,427 Construction in progress 13,438,221 5,474,307 83,252 2,145,290 13,521,473 7,619,597 Infrastructure, net 609,950, ,144, ,950, ,144,548 Depreciable site improvements, net 26,079,903 26,242,465 10,570,218 6,297,027 36,650,121 32,539,492 Depreciable buildings and improvements, net 52,365,869 53,713,714 32,208,106 33,091,453 84,573,975 86,805,167 Depreciable equipment, net 3,287,475 2,498,135 25,347,089 19,939,757 28,634,564 22,437,892 TOTALS $ 830,373,009 $ 817,323,716 $ 83,296,545 $ 76,561,407 $ 913,669,554 $ 893,885,123 Major capital asset events during the year included: Infrastructure additions totaling $24.8 million that included $11.4 million for pavement projects and $6.3 million for median construction and refurbishments. A restatement of $47.8 million in governmental activities capital assets. More detailed information about the restatement of capital assets is presented in Note 12 to the financial statements. Equipment additions in the Transit Enterprise Fund of $8.9 million for buses. Additional information on the City s capital assets can be found in Note 7 to the financial statements. See independent auditor s report. 10
31 CAPITAL ASSETS AND DEBT ADMINISTRATION (CONTINUED) Debt Administration At year-end, the City s total debt amounted to $42.7 million in bonds, notes, capital leases, contracts, claims payable and compensated absences as shown in Table 4. A summary of debt activity for the year follows. TABLE 4 CITY OF SANTA CLARITA S OUTSTANDING DEBT Governmental Activities Business-Type Activities Total Refunding Certificates of Participation, net $ 9,323,138 $ 10,480,549 $ - $ - $ 9,323,138 $ 10,480,549 Certificates of Participation 15,291,374 15,379, ,291,374 15,379,349 Lease Revenue Bonds 12,002,622 12,316, ,002,622 12,316,280 Contract and Leases 154, , , ,879 Loans 580, , , ,000 Compensated Absences 3,197,040 2,864,131 66,390 62,032 3,263,429 2,926,163 Claims Payable 2,157,763 1,114, ,157,763 1,114,117 TOTAL $ 42,706,642 $ 43,166,305 $ 66,390 $ 62,032 $ 42,773,031 $ 43,228,337 The City s governmental activities had $42.8 million in debt at year-end. Governmental activities long-term debt decreased overall by $459,663 during the year. Principal payments totaled $1.8 million. The increase in claims payable to $2.2 million is in part due to a pending settlement of litigation and an increase in workers compensation claims. No new debt related to business-type activities was issued or refinanced during the current fiscal year. During the fiscal year ended June 30, 2014, the City was able to meet its current year debt obligation in a timely manner. State statutes limit the amount of general obligation debt a governmental entity may issue to 15 percent of its adjusted assessed valuation. The debt limitation for the City as of June 30, 2014 was $926,176,818. The calculation of the debt limitation is included in the statistical section. Additional information on the City s debt can be found in Note 8 to the financial statements. See independent auditor s report. 11
32 ECONOMIC FACTORS AND NEXT YEAR S BUDGETS Our long history of conservative and strategic budget practices has allowed the City to maintain a balanced budget during every year of the Great Recession without layoffs or drastic cuts in services. We continue to see signs of recovery in the economy, such as a declining unemployment rate, an increase in sales tax revenue, and a recovering housing market. General Fund revenues are back at pre-recession levels; however, it will take more time to recover our cumulative losses in revenues since the recession hit. General Fund sales tax revenue continues to be the largest revenue source to operate general governmental functions, accounting for percent, or $33.5 million, as projected in the budget. This is 1.3 percent higher than receipts. Property tax revenues account for 30.7 percent of the General Fund budget, or $29 million, in The County Assessor s office makes changes to the City s property tax roll daily to reflect transfers in ownership, new construction, assessment appeals, parcel splits and other dynamic changes. Budgeted General Fund revenues for fiscal year are $90.3 million, and operating and capital expenditures are budgeted at $90.5 million. The City s operating and capital budget for all funds is $223 million. The City remains dedicated to service excellence, teamwork and creativity. City staff continues to do more with less, find creative ways to maintain services revered by our community and provide awardwinning programs. The budget remains to be a reflection of the City s commitment to the residents of Santa Clarita. This is consistent with the City s long tradition of ensuring that programming for Santa Clarita s youth and children is a priority to help promote growth and curb teen crimes. A copy of the City s budget can be obtained by contacting the City Finance Division or visiting the web at See independent auditor s report. 12
33 Statement of Net Position June 30, 2014 Governmental Business-Type Activities Activities Total Assets Current assets Cash and investments $ 194,127,835 $ 1,837,412 $ 195,965,247 Receivables: Accounts, net 626, ,924 Interest 461,370 4, ,888 Taxes 8,661,773-8,661,773 Prepaid costs 568, , ,992 Due from other governments 6,524,804 4,217,953 10,742,757 Total current assets 210,971,600 6,300, ,272,581 Noncurrent assets Restricted assets: Cash and investments 9,278,190-9,278,190 Cash and investments with fiscal agents 2,147,853-2,147,853 Loans receivable 2,424,977-2,424,977 Land held for resale 1,188,969-1,188,969 Notes to RDA Successor Agency 13,393,468-13,393,468 Allowance for doubtful accounts (13,393,468) - (13,393,468) Other post-employment benefits asset 6,214,930-6,214,930 Capital assets: Nondepreciable assets 138,688,768 15,171, ,859,900 Depreciable assets, net 691,684,241 68,125, ,809,654 Total noncurrent assets 851,627,928 83,296, ,924,473 Total assets 1,062,599,528 89,597,526 1,152,197,054 Liabilities Current liabilities Accounts payable and accrued liabilities 16,988,769 2,880,380 19,869,149 Interest payable 483, ,290 Deposits payable 3,168,883-3,168,883 Unearned revenues 603, ,859 Compensated absences 1,605,764 39,676 1,645,440 Claims and judgments 1,349,876-1,349,876 Bonds, loans and capital leases 1,969,029-1,969,029 Total current liabilities 26,169,470 2,920,056 29,089,526 Noncurrent liabilities Compensated absences 1,591,276 26,714 1,617,990 Claims and judgments 807, ,887 Bonds, loans and capital leases 35,382,810-35,382,810 Developer credits 44,222,984-44,222,984 Total noncurrent liabilities 82,004,957 26,714 82,031,671 Total liabilities 108,174,427 2,946, ,121,197 Net position Net investment in capital assets 799,926,613 83,296, ,223,158 Restricted 71,643,713-71,643,713 Unrestricted 82,854,775 3,354,211 86,208,986 Total net position $ 954,425,101 $ 86,650,756 $ 1,041,075,857 See Notes to Financial Statements. 13
34 Statement of Activities Program Revenues Operating Capital Charges for Contributions Contributions Functions/Programs Expenses Services and Grants and Grants Governmental Activities: General government $ 41,807,284 $ 31,970,148 $ 6,172,495 $ - Public safety 22,187,434 1,847, , ,710 Parks, recreation and community service 22,550,301 4,390, ,482 26,928 Public works 26,183,862 12,463,046 6,417,931 22,098,718 Community development 6,193,101 1,961,243 6,089, ,485 Unallocated infrastructure depreciation 17,561, Interest and fiscal charges 1,872, Total governmental activities 138,356,353 52,632,526 19,421,199 22,530,841 Business-Type Activities: Transit Enterprise 26,819,161 7,587,497 8,984,127 10,804,747 Total business-type activities 26,819,161 7,587,497 8,984,127 10,804,747 Total $ 165,175,514 $ 60,220,023 $ 28,405,326 $ 33,335,588 General revenues Taxes: Property taxes Sales taxes Franchise taxes Transient occupancy taxes Property transfer tax Motor vehicle in lieu - unrestricted Investment income Miscellaneous Gain on sale of capital asset Transfers Total general revenues and transfers Change in net position Net position, beginning of year, as restated Net position, end of year See Notes to Financial Statements. 14
35 Net (Expense) Revenue and Changes in Net Position Governmental Business-Type Activities Activities Total $ (3,664,641) $ - $ (3,664,641) (19,585,881) - (19,585,881) (17,944,205) - (17,944,205) 14,795,833-14,795,833 2,061,478-2,061,478 (17,561,539) - (17,561,539) (1,872,832) - (1,872,832) (43,771,787) - (43,771,787) - 557, , , ,210 (43,771,787) 557,210 (43,214,577) 35,652,080-35,652,080 33,480,522-33,480,522 7,796,070-7,796,070 2,781,527-2,781, , ,470 86,531-86,531 2,090,322 4,791 2,095, , ,986 18,174-18,174 (5,692,032) 5,692,032-77,942,650 5,696,823 83,639,473 34,170,863 6,254,033 40,424, ,254,238 80,396,723 1,000,650,961 $ 954,425,101 $ 86,650,756 $ 1,041,075,857 15
36 Balance Sheet Governmental Funds June 30, 2014 Special Revenue Funds Bridge and Public General Thoroughfare Library Assets Cash and investments $ 98,311,598 $ 11,466,395 $ 765,929 Receivables: Accounts, net 488,495 13,440 - Interest 253,201 25,996 1,738 Taxes 7,931,716-99,554 Loans Notes to RDA Successor Agency 7,903, Allowance for doubtful accounts (7,903,770) - - Prepaid costs 91,630-59,465 Due from other governments 1,234, Due from other funds 2,274, Advances to other funds 11,427, Land held for resale Restricted assets: Cash and investments ,383 Cash and investments with fiscal agents 825, Total assets $ 122,838,644 $ 11,505,831 $ 1,503,069 Liabilities, deferred inflows of resources and fund balances (deficit) Liabilities Accounts payable and accrued liabilities $ 7,627,130 $ 597,686 $ 669,060 Deposits payable 3,168, Unearned revenues 603, Due to other funds Advances from other funds - 1,599,643 9,945,693 Total liabilities 11,399,872 2,197,329 10,614,753 Deferred inflows of resources Unavailable revenues 2,546, Total deferred inflows of resources 2,546, Fund balances (deficit) Nonspendable 11,519, Restricted - 9,308,502 - Committed Assigned 51,718, Unassigned 45,654,640 - (9,111,684) Total fund balances (deficit) 108,891,879 9,308,502 (9,111,684) Total liabilities, deferred inflow of resources and fund balances (deficit) $ 122,838,644 $ 11,505,831 $ 1,503,069 See Notes to Financial Statements. 16
37 Balance Sheet Governmental Funds June 30, 2014 Special Revenue Funds Landscape Non-Major Total Maintenance Governmental Governmental District #1 Funds Funds Assets Cash and investments $ 30,456,752 $ 42,803,428 $ 183,804,102 Receivables: Accounts, net 46,173 75, ,513 Interest 69,432 87, ,154 Taxes 210, ,537 8,661,773 Loans - 2,424,977 2,424,977 Notes to RDA Successor Agency - 5,489,698 13,393,468 Allowance for doubtful accounts - (5,489,698) (13,393,468) Prepaid costs 336,882 20, ,581 Due from other governments - 5,290,058 6,524,804 Due from other funds - - 2,274,080 Advances to other funds - 117,823 11,545,336 Land held for resale - 1,188,969 1,188,969 Restricted assets: Cash and investments - 8,701,807 9,278,190 Cash and investments with fiscal agents - 1,322,188 2,147,853 Total assets $ 31,120,205 $ 62,452,583 $ 229,420,332 Liabilities, deferred inflows of resources and fund balances (deficit) Liabilities Accounts payable and accrued liabilities $ 2,765,765 $ 5,083,445 $ 16,743,086 Deposits payable - - 3,168,883 Unearned revenues ,859 Due to other funds - 2,274,080 2,274,080 Advances from other funds ,545,336 Total liabilities 2,765,765 7,357,525 34,335,244 Deferred inflows of resources Unavailable revenues - 4,046,291 6,593,184 Total deferred inflows of resources - 4,046,291 6,593,184 Fund balances (deficit) Nonspendable 336, ,114 12,126,139 Restricted 28,017,558 46,942,660 84,268,720 Committed - 612, ,829 Assigned - 3,412,127 55,130,223 Unassigned - (188,963) 36,353,993 Total fund balances (deficit) 28,354,440 51,048, ,491,904 Total liabilities, deferred inflow of resources and fund balances (deficit) $ 31,120,205 $ 62,452,583 $ 229,420,332 See Notes to Financial Statements. 17
38 18
39 Reconciliation of the Governmental Funds Balance Sheet to the Statement of Net Position June 30, 2014 Fund balances of governmental funds $ 188,491,904 Amounts reported for governmental activities in the Statement of Net Position are different because: Capital assets used in governmental activities are not financial resources and therefore are not reported in the governmental funds. Those capital assets consist of: Nondepreciable assets $ 138,688,768 Depreciable assets, net of accumulated depreciation 691,073, ,761,795 Revenues reported as deferred inflows in the governmental funds do not provide current financial resources and are recognized in the Statement of Activities. 6,593,184 Other post-employment benefit assets are not available to pay for current-period expenditures and therefore are not reported in the governmental funds. 6,214,930 Long-term liabilities are not due and payable in the current period and therefore are not reported in the governmental funds. Those long-term liabilities consist of: Lease revenue bonds (12,002,622) Certificates of participation bonds (24,614,512) Capital leases (154,705) Loans payable (580,000) Compensated absences (3,194,786) Bridge and Thoroughfare developer payables (44,222,984) (84,769,609) Accrued interest payable on long-term liabilities do not require the use of current financial resources and therefore are not reported in the governmental funds. (483,290) Internal service funds are used by management to charge the costs of certain activities, such as insurance, and vehicle and computer replacement, to individual funds. These assets and liabilities of the internal service funds are included in governmental activities in the Statement of Net Position. 8,616,187 Net position of governmental activities $ 954,425,101 See Notes to Financial Statements. 19
40 Statement of Revenues, Expenditures and Changes in Fund Balances Governmental Funds Special Revenue Funds Bridge and Public General Thoroughfare Library Revenues Taxes $ 73,832,592 $ - $ 5,143,664 Special assessments Licenses and permits 5,366, Intergovernmental 208, Charges for services 8,801,042-75,000 Investment income 1,018, ,294 4,613 Fines and forfeitures 545, Developer fees Other revenue 134, ,516 Total revenues 89,907, ,294 5,401,793 Expenditures Current: General government 14,211,854-4,680,637 Public safety 20,419, Parks, recreation and community service 20,319, Public works 11,566, ,262 - Community development 5,461, Capital outlay 1,666,884 14,154, ,225 Debt service: Principal retirement ,174 Interest and fiscal charges - 171,598 95,352 Total expenditures 73,645,625 14,505,353 5,338,388 Excess (deficiency) of revenues over (under) expenditures 16,262,349 (14,173,059) 63,405 Other financing sources (uses) Transfers in 2,647, Transfers out (4,355,191) (75,807) (5,138) Issuance of district credits - 11,297,334 - Total other financing sources (uses) (1,707,771) 11,221,527 (5,138) Net change in fund balances 14,554,578 (2,951,532) 58,267 Fund balances (deficit), beginning of year 94,337,301 12,260,034 (9,169,951) Fund balances (deficit), end of year $ 108,891,879 $ 9,308,502 $ (9,111,684) See Notes to Financial Statements. 20
41 Statement of Revenues, Expenditures and Changes in Fund Balances Governmental Funds Special Revenue Funds Landscape Non-Major Total Maintenance Governmental Governmental District #1 Funds Funds Revenues Taxes $ 837,266 $ 472,138 $ 80,285,660 Special assessments 22,690,306 10,062,299 32,752,605 Licenses and permits - - 5,366,972 Intergovernmental - 34,147,421 34,355,734 Charges for services - 527,935 9,403,977 Investment income 305, ,212 1,911,491 Fines and forfeitures - 1,115,174 1,661,157 Developer fees - 2,600,997 2,600,997 Other revenue - 5,630,097 5,943,608 Total revenues 23,832,867 54,807, ,282,201 Expenditures Current: General government 12,765,907 4,635,807 36,294,205 Public safety - 1,717,618 22,137,338 Parks, recreation and community service - 178,914 20,498,108 Public works - 12,639,986 24,385,865 Community development - 723,907 6,185,263 Capital outlay 8,447,530 11,796,457 36,580,589 Debt service: Principal retirement - 1,790,000 1,837,174 Interest and fiscal charges - 1,618,596 1,885,546 Total expenditures 21,213,437 35,101, ,804,088 Excess (deficiency) of revenues over (under) expenditures 2,619,430 19,705,988 24,478,113 Other financing sources (uses) Transfers in - 7,110,027 9,757,447 Transfers out (204,113) (10,884,249) (15,524,498) Issuance of district credits ,297,334 Total other financing sources (uses) (204,113) (3,774,222) 5,530,283 Net change in fund balances 2,415,317 15,931,766 30,008,396 Fund balances (deficit), beginning of year 25,939,123 35,117, ,483,508 Fund balances (deficit), end of year $ 28,354,440 $ 51,048,767 $ 188,491,904 See Notes to Financial Statements. 21
42 22
43 Reconciliation of the Governmental Funds Statement of Revenues, Expenditures and Changes in Fund Balances to the Statement of Activities Net change in fund balances - total governmental funds $ 30,008,396 Amounts reported for governmental activities in the Statement of Activities are different because: Governmental funds report capital outlay as expenditures. However, in the Statement of Activities, the costs of those assets is allocated over the estimated useful lives as depreciation expense. The following were the amounts of capital outlay and depreciation expense in the current period: Capital outlay $ 35,588,300 Depreciation expense (20,969,353) Disposal of capital assets (1,802,495) 12,816,452 Revenues in the Statement of Activities that do not provide current financial resources are not reported as revenues in the governmental funds. 646,892 Bond proceeds provide current financial resources to governmental funds, but issuing debt increases long-term liabilities in the Statement of Net Position. Repayment of bond principal is an expenditure in the governmental funds, but the repayment reduces long-term liabilities in the Statement of Net Position. Also, governmental funds report the effect of premiums and discounts when debt is first issued, whereas these amounts are deferred and amortized in the Statement of Activities. There have been no issuances of debt in the current period, and the following were the amounts of repayment of long-term liabilities: Changes in compensated absences (336,604) Lease revenue bonds 310,000 Certificates of participation bonds 1,250,000 Capital leases 47,174 Loans payable 230,000 Amortization of premiums of long-term liabilities 3,658 Amortization of discounts of long-term liabilities (4,614) 1,499,614 The issuance of Bridge and Thoroughfare district credits provide current financial resources to governmental funds, but increases long-term liabilities in the Statement of Net Position. Redemptions of district credits is an expenditure in the governmental funds, but reduces long-term liabilities in the Statement of Net Position. Issuance of district credits (11,297,334) Some expenses reported in the Statement of Activities do not require the use of current financial resources and therefore are not reported as expenditures in governmental funds. These expenses consist of the following: Changes in interest payable for long-term liabilities 13,670 Changes and amortization of other post-employment benefit asset (9,000) 4,670 Internal service funds are used by management to charge the costs of certain activities, such as insurance, and vehicle and computer replacement, to individual funds. The net revenue (expense) of the internal service funds is reported with governmental activities. 492,173 Change in net position of governmental activities $ 34,170,863 See Notes to Financial Statements. 23
44 Statement of Net Position Proprietary Funds June 30, 2014 Business-Type Activities Transit Enterprise Assets Current assets Cash and investments 1,837,412 Governmental Activities Internal Service Funds $ $ 10,323,733 Receivables: Accounts - 3,411 Interest 4,518 23,216 Prepaid costs 241,098 60,313 Due from other governments 4,217,953 - Total current assets 6,300,981 10,410,673 Noncurrent assets Capital assets: Land 15,087,880 - Construction in progress 83,252 - Site improvements, net of accumulated depreciation 10,570,218 - Building and improvements, net of accumulated depreciation 32,208,106 - Equipment, net of accumulated depreciation 25,347, ,214 Total noncurrent assets 83,296, ,214 Total assets 89,597,526 11,021,887 Liabilities Current liabilities Accounts payable and accrued liabilities 2,880, ,683 Compensated absences 39,676 2,254 Claims and judgments - 1,349,876 Total current liabilities 2,920,056 1,597,813 Noncurrent liabilities Compensated absences payable 26,714 - Claims and judgments - 807,887 Total noncurrent liabilities 26, ,887 Total liabilities 2,946,770 2,405,700 Net position Net investment in capital assets 83,296, ,214 Unrestricted 3,354,211 8,004,973 Total net position $ 86,650,756 $ 8,616,187 See Notes to Financial Statements. 24
45 Statement of Revenues, Expenses and Changes in Net Position Proprietary Funds Business-Type Governmental Activities Activities Transit Internal Enterprise Service Funds Operating revenues Charge for services $ 6,780,221 $ 3,105,691 Other revenues 807,276 - Total operating revenues 7,587,497 3,105,691 Operating expenses Administration and personnel services 1,812, ,388 Transportation services 17,655,898 - Services and supplies 2,156,401 2,369,477 Depreciation expense 5,101, ,136 Total operating expenses 26,727,176 2,873,001 Operating income (loss) (19,139,679) 232,690 Nonoperating revenues (expenses) Intergovernmental revenue 8,984,127 - Investment income 4, ,290 Gain (loss) on disposal of capital assets (91,985) 18,174 Total nonoperating revenues (expenses) 8,896, ,464 Income (loss) before transfers and capital contributions (10,242,746) 417,154 Transfers and capital contributions Transfers in 5,917,750 92,430 Transfers out (225,718) (17,411) Capital contributions 10,804,747 - Total transfers and capital contributions 16,496,779 75,019 Changes in net position 6,254, ,173 Net position Net position, beginning of year 80,396,723 8,124,014 Net position, end of year $ 86,650,756 $ 8,616,187 See Notes to Financial Statements. 25
46 Statement of Cash Flows Proprietary Funds Business-Type Governmental Activities Activities Transit Internal Enterprise Service Funds Cash flows from operating activities Cash received from customers and users $ 6,780,221 $ 3,102,280 Cash paid to suppliers for goods and services (21,348,841) (2,469,844) Cash paid to employees for services (1,123,414) 905,873 Cash received from other sources 807,276 - Net cash provided by (used in) operating activities (14,884,758) 1,538,309 Cash flows from non-capital financing activities Cash transfers out (225,718) (17,411) Cash transfers in 5,917,750 92,430 Payment made to other funds (1,738,468) - Intergovernmental revenues 8,481,126 - Net cash provided by non-capital financing activities 12,434,690 75,019 Cash flows from capital and related financing activities Capital contributions 16,216,303 - Acquisition and construction of capital assets (11,929,096) (381,803) Net cash provided by (used in) capital and related financing activities 4,287,207 (381,803) Cash flows from investing activities Interest received ,281 Net cash provided by investing activities ,281 Net increase in cash and cash equivalents 1,837,412 1,413,806 Cash and cash equivalents at beginning of year - 8,909,927 Cash and cash equivalents at end of year $ 1,837,412 $ 10,323,733 Reconciliation of operating income (loss) to net cash provided by (used in) operating activities Operating income (loss) $ (19,139,679) $ 232,690 Adjustments to reconcile operating income (loss) to net cash provided by (used in) operating activities: Depreciation 5,101, ,136 (Increase) in accounts receivable - (3,411) (Increase) in prepaid expense (837) (60,313) Increase (decrease) in accounts payable (850,573) 162,256 Increase in claims and judgments - 1,043,646 Increase (decrease) in compensated absences 4,358 (3,695) Total adjustments 4,254,921 1,305,619 Net cash provided by (used in) operating activities $ (14,884,758) $ 1,538,309 Non-cash investing, capital and financing activities Disposal of capital assets $ (91,985) $ 167,136 See Notes to Financial Statements. 26
47 27
48 Statement of Net Position (Deficit) Fiduciary Funds June 30, 2014 Private- Purpose Trust Fund Agency RDA Successor Funds Agency Assets Cash and investments $ 1,000,192 $ 1,612,236 Receivables: Interest 2,191 3,588 Taxes 1,595 - Due from other governments 715,000 - Land held for resale - 1,011,031 Restricted assets: Cash and investments - 3,494 Cash and investments with fiscal agents 1,761,828 1,165,418 Capital assets: Land 9,937, ,878 Site improvements, net of accumulated depreciation - 99,279 Building and improvements, net of accumulated depreciation 90,300 - Infrastructure, net of accumulated depreciation - 3,977,737 Total assets $ 13,509,082 8,405,661 Liabilities Accounts payable $ - 4,743 Interest payable - 418,524 Due to external parties 13,509,082 - Bonds, due within one year - 629,470 Bonds and notes, due in more than one year - 48,521,272 Total liabilities $ 13,509,082 49,574,009 Net Position (Deficit) Trust deficit (41,168,348) Total net position (deficit) $ (41,168,348) 28
49 Statement of Changes in Net Position (Deficit) Fiduciary Funds Private- Purpose Trust Fund RDA Successor Agency Additions Property taxes $ 2,226,306 Investment income 11,758 Total additions 2,238,064 Deductions Administrative expenses 79,605 Contractual services 10,109 Interest expense 1,732,199 Depreciation expense 90,160 Contributions to other governments 5,056,509 Total deductions 6,968,582 Changes in net position (4,730,518) Net Position (Deficit) Trust deficit, beginning of year (36,437,830) Trust deficit, end of year $ (41,168,348) 29
50 30
51 Notes to Financial Statements 1. SUMMARY OF SIGNIFICANT ACCOUNTING POLICIES A. Financial Reporting Entity These financial statements present the financial results of the City of Santa Clarita, California (the City) and its component unit as required by accounting principles generally accepted (GAAP) in the United States of America. Component units are legally separate entities for which the primary government is financially accountable. The City has one component unit, the Santa Clarita Public Financing Authority (the Authority). The City is considered to be financially accountable for the Authority, which is governed by the City Council, which serves as the Board of the Authority. Therefore, the entity is reported as a blended component unit with the City s comprehensive annual financial report (CAFR). The City and the component unit have a June 30 year-end. The City was incorporated on December 15, 1987 as a general law city. The City operates under a council-manager form of government and provides its citizens with a full range of municipal services, either directly or under contract with the County of Los Angeles. Such services include public safety (police and fire protection), building permit/plan approval, planning, community development, recreation, animal control and street maintenance. Component Unit The Santa Clarita Public Financing Authority was established in July 1991 as a joint powers of authority between the City and the former redevelopment agency for the purpose of providing financing and funding of public capital improvements and the acquisition of property. The Authority s financial data and activity are reported within the debt service and capital projects fund types of the City. Separate financial statements for the Authority are not prepared. B. Government-Wide and Fund Financial Statements The City s government-wide financial statements (i.e., the Statement of Net Position and the Statement of Activities) report information on all the activities of the City. The effect of interfund activity has been removed from these statements, except for the interfund services provided and used. Governmental activities, which normally are supported by taxes and intergovernmental revenues, are reported separately from business-type activities, which rely to a significant extent on fees and charges for support. Fiduciary activities of the City are not included in these statements. The Statement of Activities demonstrates the degree to which the direct expenses of a given function are offset by program revenues. Direct expenses are those that are clearly identifiable with a specific function. Program revenues include 1) charges to customers or applicants who purchase, use or directly benefit from goods, services or privileges provided by a given function, and 2) grants and contributions that are restricted to meeting the operational or capital requirements of a particular function. Taxes and other items not included among program revenues are reported as general revenues. Separate financial statements are provided for governmental funds, proprietary funds and fiduciary funds, even though the latter are excluded from the government-wide financial statements. Major individual governmental funds are reported as separate columns in the fund financial statements. 31
52 Notes to Financial Statements 1. SUMMARY OF SIGNIFICANT ACCOUNTING POLICIES (Continued) C. Basis of Accounting and Measurement Focus The government-wide financial statements are presented on an economic resources measurement focus and the accrual basis of accounting. Accordingly, all of the City s assets and liabilities, including capital assets, as well as infrastructure assets, and long-term liabilities, and deferred inflows and deferred outflows of resources are included in the accompanying Statement of Net Position. The Statement of Activities presents changes in net position. Under the accrual basis of accounting, revenues are recognized in the period in which they are earned, while expenses are recognized in the period in which the liability is incurred. Certain types of transactions are reported as program revenues for the City in three categories: Charges for services Operating grants and contributions Capital grants and contributions Certain eliminations have been made as prescribed by Governmental Accounting Standards Board (GASB) Statement No. 34 in regard to interfund activities. All internal balances in the Statement of Net Position have been eliminated, except those representing balances between the governmental activities and the business-type activities, which are presented as internal balances and eliminated in the total primary government column. In the Statement of Activities, internal service fund transactions have been eliminated; however, those transactions between governmental and business-type activities have not been eliminated. The following interfund activities have been eliminated: Due to and from other funds Advances to and from other funds Transfers in and out The City has conformed to the pronouncements of the GASB, which are acknowledged as the primary authoritative statements of GAAP in the United States of America applicable to state and local governments. Governmental Fund Financial Statements Governmental fund financial statements are reported using the current financial resources measurement focus and the modified accrual basis of accounting. Revenues are recognized as soon as they are both measurable and available. Revenues are considered to be available when they are collectible within the current period or soon enough thereafter to pay liabilities of the current period. For this purpose, the City considers revenues to be available if they are collected within 60 days of the end of the current fiscal period for property and sales tax, and 90 days for all other revenues. Expenditures generally are recorded when a liability is incurred, as underaccrual accounting. However, debt service expenditures, as well as expenditures related to compensated absences, pension and other post-employment benefits, and the redemption of district credits are recorded only when payment is due. 32
53 Notes to Financial Statements 1. SUMMARY OF SIGNIFICANT ACCOUNTING POLICIES (Continued) C. Basis of Accounting and Measurement Focus (Continued) Property taxes when levied for, taxpayer-assessed tax revenues (e.g., franchise taxes, sales taxes, motor vehicle fees, etc.), net of estimated refunds and uncollectible amounts, intergovernmental revenues when eligibility requirements are met, charges for services and interest associated with the current fiscal period are all considered susceptible to accrual and so have been recognized as revenues of the current fiscal period. All other revenue items are considered measurable only when cash is received by the City. The City reports the following major governmental funds: The General Fund is the primary operating fund of the City. It is used to account for all financial resources of the City that are not required to be accounted for in another fund. The Bridge and Thoroughfare Special Revenue Fund is used to account for restricted district fees received from developers as set by the State Subdivision Law and the Los Angeles County and City of Santa Clarita, which are used for the construction of street, highway, bridge and other thoroughfare in the Bouquet Canyon, Eastside Canyon, Via Princessa and Valencia districts. This fund also accounts for the issuance and redemption of district credits associated with the contribution of infrastructure. At June 30, 2014, the Bridge and Thoroughfare Special Revenue Fund was elected as a major fund. The Public Library Special Revenue Fund is used to account for property tax receipts and disbursements associated with the operation of the City of Santa Clarita Public Library. The Landscape Maintenance District #1 Special Revenue Fund is used to account for property tax receipts and disbursements related to the landscape maintenance district. Proprietary Fund Financial Statements Proprietary funds are accounted for using the economic resources measurement focus and the accrual basis of accounting. Accordingly, all assets and liabilities (whether current or noncurrent) and deferred inflows and deferred outflows of resources are included in the Statement of Net Position. The Statement of Revenues, Expenses and Changes in Net Position presents increases (revenues) and decreases (expenses) in total net position. Under the accrual basis of accounting, revenues are recognized in the period in which they are earned, while expenses are recognized in the period in which the liability is incurred. Operating revenues and expenses result from the operating and maintenance of the local public transit services. The operating revenues consist of charges to customers for the service provided. Operating expenses include the costs of providing these services, administrative expenses and depreciation expense. All revenues and expenses not meeting these definitions and which are not capital in nature are reported as non-operating revenues and expenses. The City reports the following major enterprise fund: The Transit Enterprise Fund is used to account for the operation of the City s local public transit bus system. 33
54 Notes to Financial Statements 1. SUMMARY OF SIGNIFICANT ACCOUNTING POLICIES (Continued) C. Basis of Accounting and Measurement Focus (Continued) Fiduciary Fund Financial Statements Fiduciary fund financial statements include a Statement of Net Position (Deficit) and a Statement of Changes in Net Position (Deficit). The fiduciary funds represent a private-purpose trust fund and agency funds. Fiduciary fund types are accounted for according to the nature of the fund. Agency funds are reported on the accrual basis of accounting and are custodial in nature (assets equal liabilities) and do not involve measurement of results of operations. Private-purpose trust funds are reported using the economic resources measurement focus and the accrual basis of accounting. The RDA Successor Agency Private Purpose Trust Fund is used to account for monies received from the L.A. County Auditor Controller for the repayment of the enforceable obligations of the former Santa Clarita Redevelopment Agency. These funds are restricted for the sole purpose of payment of items on an approved Recognized Payment Obligation Schedule (ROPS). The City reports the following agency funds: The Assessment District No Fund is used to account for assets and liabilities held by the City as an agent and related to the debt service activity on no-commitment special assessment debt. The Assessment District No Fund is used to account for assets and liabilities held by the City as an agent and related to the debt service activity on no-commitment special assessment debt. The Community Facilities District No Fund is used to account for assets and liabilities held by the City as an agent and related to the debt service activity on no-commitment special assessment debt. The Santa Clarita Watershed Recreation and Conservancy Authority is used to account for assets and liabilities held by the City as an agent and related to the park and open space lands for the Santa Clarita Watershed Recreation and Conservancy Authority (the Watershed Authority). The Santa Clarita Public Television Authority is used to account for assets and liabilities held by the City as an agent and related to the operations of the Santa Clarita Public Television Authority (the SCPTA). Fund Types Reported by the City Additionally, the City reports the following fund types: The Special Revenue Funds are used to account for the proceeds of specific revenue sources that are legally restricted or committed to expenditures for specified purposes. The Debt Service Funds are used to account for the accumulation of resources for, and payment of, interest and principal on long-term debt. The Capital Projects Funds are used to account for financial resources used for the acquisition or construction of major capital facilities (other than those financed by the proprietary funds). 34
55 Notes to Financial Statements 1. SUMMARY OF SIGNIFICANT ACCOUNTING POLICIES (Continued) C. Basis of Accounting and Measurement Focus (Continued) The Internal Service Funds are used to account for the financing of special activities that provide services within the City. Such activities include self-insurance, computer replacement and vehicle replacement. D. Cash and Cash Equivalents and Investments The City pools its available cash for investment purposes. The City s cash and cash equivalents are considered to be cash on hand, demand deposits, and short-term investments with original maturity of three months or less from the date of acquisition. Cash and cash equivalents are combined with investments and displayed as cash and investments. For purposes of the statement of cash flows of the proprietary fund types, cash and cash equivalents include all investments, as the City operates an internal cash management pool that maintains the general characteristics of a demand deposit account. In accordance with GASB Statement No. 31, Accounting and Financial Reporting for Certain Investments and for External Investment Pools, highly liquid market investments with maturities of one year or less at time of purchase are stated at amortized cost. All other investments are stated at fair value. Fair value is the amount at which an investment could be exchanged in a current transaction between willing parties, other than a forced or liquidation sale. The unexpended bond proceeds of the District s bonds are classified as restricted assets because their use is completely restricted to the purpose for which the bonds were originally issued. The City s cash and investments held by fiscal agents are pledged to the payment or security of certain longterm debt issuances. The California Government Code provides that these monies, in the absence of specific statutory provisions governing the issuance of the bonds, may be invested in accordance with the ordinance, resolutions or indentures specifying the types of investments its trustees or fiscal agents may make. The City also participates in the Los Angeles County Pooled Investment Fund. In accordance with GASB Statement No. 40, Deposit and Investment Risk Disclosures (an amendment of GASB Statement No. 3), certain disclosure requirements, if applicable, are provided for deposit and investment risk in the following areas: Interest Rate Risk Credit Risk - Overall - Custodial Credit Risk - Concentration of Credit Risk Foreign Currency Risk E. Land Held for Resale Land parcels held for resale are recorded at the lower of cost or fair value. The cost of the land includes all costs incurred that are directly associated with the acquisition of the land, including purchase price, escrow costs, clearing land for use costs, demolition costs, etc. 35
56 Notes to Financial Statements 1. SUMMARY OF SIGNIFICANT ACCOUNTING POLICIES (Continued) F. Interfund Transactions Activity between funds that are representative of lending/borrowing arrangements outstanding at the end of the fiscal year are referred to as due to/from other funds (i.e., current portion of interfund loans) or advances from/to other funds (i.e., noncurrent portion of interfund loans). Any residual balances outstanding between the governmental activities and business-type activities are reported in the government-wide financial statements as internal balances. During the course of operations, numerous transactions occur between individual funds involving goods provided or services rendered. There are also transfers of revenues from funds authorized to receive the revenue to funds authorized to expend it. Any residual balances outstanding between governmental and business-type activities are reported in the government-wide financial statements as transfers. G. Property Taxes Property taxes and special assessment taxes are attached as enforceable liens on real property on July 1, the beginning of the fiscal year, and are due in two installments on November 1 and February 1; however, no penalties or interest are assessed until December 10 and April 10, respectively. These taxes are determined annually based on property values, subject to limits based on Proposition 13, as of January 1 of the levy year, which is prior to the end of the previous fiscal year. The County of Los Angeles bills and collects these taxes for the City and are remitted on a monthly basis. Remittance of property taxes to the City is accounted for in the City s General Fund and Public Library Special Revenue Fund. Property taxes on certain registered motor vehicles are assessed and collected throughout the year. H. Allowances for Uncollectible Accounts Allowances for uncollectible accounts are maintained on customer and other trade receivables that historically experience uncollectible amounts. Allowances are based on collection experience and management s evaluation of the current status of existing receivables. I. Prepaid Costs Certain payments to vendors reflect costs applicable to future accounting periods and are recorded as prepaid items in both the government-wide and fund financial statements. These are accounted for using the consumption method, and accordingly, the expenditure is recorded in the period in which the goods or services are received. 36
57 Notes to Financial Statements 1. SUMMARY OF SIGNIFICANT ACCOUNTING POLICIES (Continued) J. Capital Assets Government-Wide Financial Statements, Proprietary Funds and Fiduciary Funds Capital assets, which include land, site improvements, buildings and improvements, equipment and infrastructure assets, are reported in the applicable governmental or business-type activities columns in the government-wide financial statements and in the proprietary funds and fiduciary funds. General infrastructure assets consist of roads, curbs and gutters, sidewalks, medians, street trees, street signs, bus shelters, bridges, trails, traffic signals and storm drains/catch basins. Capital assets are defined by the City as assets with an initial cost of more than $5,000 ($25,000 for site improvements and building improvements, and $100,000 for infrastructure) and an estimated useful life in excess of one year. Such assets are recorded at historical cost or estimated historical cost if purchased or constructed. Donated capital assets are recorded at estimated fair value at the date of donation. The costs of normal maintenance and repairs that do not add to the value of the asset or materially extend asset lives are not capitalized. Capital assets are depreciated using the straight-line method over the following estimated useful lives: Site Improvements Buildings and Improvements Equipment Infrastructure 5-25 years 5-50 years 5-25 years years Governmental Fund Financial Statements The governmental fund financial statements do not present capital assets. Instead, capital assets purchases are reported as capital outlay expenditures. As such, capital assets are shown as a reconciling item in the Reconciliation of the Governmental Funds Balance Sheet to the Statement of Net Position. K. Long-Term Debt Government-Wide Financial Statements, Proprietary Funds and Fiduciary Funds Long-term debt and other financed obligations, such as developer district credits, are reported as liabilities in the government-wide, proprietary fund and fiduciary fund financial statements. Bond premiums, discounts, and deferred gains and losses on refundings are deferred and amortized over the life of the bonds using the effective interest method. Bonds payable are reported net of the applicable premium or discount. Deferred gains and losses on refundings are reported as a deferred inflow or deferred outflow of resources. 37
58 Notes to Financial Statements 1. SUMMARY OF SIGNIFICANT ACCOUNTING POLICIES (Continued) K. Long-Term Debt (Continued) Governmental Fund Financial Statements The governmental fund financial statements do not present long-term debt and other financed obligations. Governmental funds recognize bond premiums and discounts during the period issued. The face amount of debt issued is reported as other financing sources. Principal payments and reductions in the obligation are reported as debt service expenditures. As such, long-term debt and other financed obligations are shown as reconciling items in the Reconciliation of the Governmental Funds Balance Sheet to the Statement of Net Position. L. Compensated Absences It is the City s policy to permit employees to accumulate earned but unused vacation (compensated absences). For proprietary fund types and governmental activities, this accumulation is recorded as an expense and liability of the appropriate fund in the fiscal year earned. For the governmental funds, the amount of accumulated unpaid vacation, which is payable from available resources, is recorded as a liability of the fund when it has matured (i.e., when due and payable). M. Claims and Judgments When it is probable that a claim liability has been incurred at year-end and the amount of the loss can be reasonably estimated, the City records the estimated loss, net of any insurance coverage, under its self-insurance program. Claims payable, which include an estimate for incurred but not reported (IBNR) claims, is recorded in the Self-Insurance Internal Service Fund. N. Net Position and Fund Balances Government-Wide Financial Statements, Proprietary Funds and Fiduciary Funds Net position represents the difference between assets and deferred outflows and liabilities and deferred inflows, and is classified into three categories: Net Investment in Capital Assets This amount consists of capital assets, net of accumulated depreciation, reduced by the outstanding balances of any borrowings used for the acquisition, construction or improvement of those assets, and excludes unspent debt proceeds. Deferred outflows of resources and deferred inflows of resources that are attributable to the acquisition, construction or improvement of those assets or related debt also should be included in this component of net position. Restricted This amount represents the net position that is not accessible for general use because its use is subject to restrictions enforceable by third parties and enabling legislation, reduced by liabilities and deferred inflows of resources related to those assets. Unrestricted This amount represents the residual of amounts not classified in the other two categories and represents the net equity available for the City. 38
59 Notes to Financial Statements 1. SUMMARY OF SIGNIFICANT ACCOUNTING POLICIES (Continued) N. Net Position and Fund Balances (Continued) Governmental Fund Financial Statements In the governmental fund financial statements, fund balances are classified in the following categories: Nonspendable Items that cannot be spent because they are not in spendable form, such as prepaid items and inventories; advances, which are long-term interfund borrowings; and items that are legally or contractually required to be maintained intact, such as principal of an endowment or revolving loan funds. Restricted Restricted fund balances encompass the portion of net fund resources subject to externally enforceable legal restrictions. This includes externally imposed restrictions by creditors, such as through debt covenants, grantors, contributors, laws or regulations of other governments, as well as restrictions imposed by law through constitutional provisions or enabling legislation. Committed Committed fund balances encompass the portion of net fund resources, the use of which is constrained by limitations that the government imposes upon itself at its highest level of decision making, City Council through Council Resolution, and that remain binding unless removed in the same manner. The City Council is considered the highest authority for the City. Assigned Assigned fund balances encompass the portion of net fund resources reflecting the government s intended use of resources. Assignment of resources can be done by the highest level of decision making or by a committee or official designated for that purpose. The Deputy City Manager authorizes assigned amounts for specific purposes pursuant to the policy-making powers granted to him through a resolution adopted by the City Council. Unassigned This includes the excess residual amounts in the General Fund, and the residual deficit of all other governmental funds, which have not been restricted, committed or assigned to specific purposes. The City Council has approved an operating reserve to be used for one-time unanticipated expenditure requirements and local disaster. This reserve did not meet the qualifications of a stabilization arrangement. At June 30, 2014, the balance totaled $13,100,000, which is included in the unassigned fund balance in the General Fund. O. Spending Policy Government-Wide Financial Statements and Proprietary Fund Financial Statements When an expense is incurred for purposes for which both restricted and unrestricted resources are available, the City s policy is to apply restricted resources first. 39
60 Notes to Financial Statements 1. SUMMARY OF SIGNIFICANT ACCOUNTING POLICIES (Continued) O. Spending Policy (Continued) Governmental Fund Financial Statements When expenditures are incurred for purposes for which all restricted, committed, assigned and unassigned fund balances are available, the City s policy is to apply in the following order, except for instances wherein an ordinance specifies the fund balance: Restricted Committed Assigned Unassigned P. Estimates The preparation of the basic financial statements in conformity with GAAP requires management to make estimates and assumptions that affect the reported amounts of certain assets and liabilities and the disclosure of contingent assets and liabilities at the date of the basic financial statements and the related reported amounts of revenues and expenses during the reporting period. Actual results could differ from those estimates. Management believes that the estimates are reasonable. Q. Deferred Inflows of Unavailable Revenue and Unearned Revenue Government-Wide Financial Statements Unearned revenue represents money received during the current or previous years that has not been earned because certain performance criteria have not been met. Fund Financial Statements In addition to unearned revenue, deferred inflows of resources represent funds that have been earned but have not been received within the availability period. This does not provide an available financial resource in the current period; therefore, recognition is deferred until these criteria have been met. R. Pronouncements Issued But Not Yet Adopted The GASB has issued pronouncements that have an effective date subsequent to June 30, 2014, which may impact future financial presentations. Except as noted below, management has not currently determined what, if any, impact implementation of the following Statements may have on future financial statements of the City: GASB Statement No. 68, Accounting and Financial Reporting for Pensions: Effective for the City s fiscal year ending June 30, Management believes that there will be a significant impact on liabilities and net position when this Statement is implemented; however, the amount of the impact has not yet been determined. GASB Statement No. 69, Government Combinations and Disposals of Government Operations: Effective for the City s fiscal year ending June 30,
61 Notes to Financial Statements 1. SUMMARY OF SIGNIFICANT ACCOUNTING POLICIES (Continued) R. Pronouncements Issued But Not Yet Adopted (Continued) GASB Statement No. 71, Pension Transition for Contributions Made Subsequent to the Measurement Date, an amendment to GASB Statement No. 68: Effective simultaneously with GASB Statement No CASH AND INVESTMENTS A. Cash and Investments Cash and investments at June 30, 2014 are classified in the accompanying financial statements as follows: Governmental Business-Type Activities Activities Fiduciary Funds Total Cash and investments $ 194,127,835 $ 1,837,412 $ 2,612,428 $ 198,577,675 Restricted: Cash and investments 9,278,190-3,494 9,281,684 Cash and investments with fiscal agent 2,147,853-2,927,246 5,075,099 Total $ 205,553,878 $ 1,837,412 $ 5,543,168 $ 212,934,458 41
62 Notes to Financial Statements 2. CASH AND INVESTMENTS (Continued) A. Cash and Investments (Continued) Cash and investments consisted of the following at June 30, 2014: Cash on hand and deposits: Cash on hand $ 4,715 Deposits with financial institutions 421,409 Certificates of deposit 999,998 Total cash on hand and deposits 1,426,122 Investments: U.S. Treasury Securities 31,505,217 U.S. Government-Sponsored Enterprise Securities 71,578,161 Commercial Paper 9,198,901 Medium-Term Notes 38,167,951 Money Market Funds 1,606,088 State of California Local Agency Investment Fund (LAIF) 43,599,682 L.A. County Pooled Investment Fund (LACPIF) 1,495,553 Total investments 197,151,553 Restricted investments: Money Market Funds 9,281,684 Total restricted investments 9,281,684 Restricted investments with fiscal agent: Money Market Funds 5,075,099 Total investments with fiscal agent 5,075,099 Total cash and investments $ 212,934,458 The carrying amounts of the City s deposits were $1,426,122 at June 30, Bank balances before reconciling items were $1,776,049 at that date, the total amount of which was collateralized or insured with securities held by the pledging financial institutions in the City s name. 42
63 Notes to Financial Statements 2. CASH AND INVESTMENTS (Continued) B. Investments Authorized by the California Government Code and the City s Investment Policy The following table identifies the investment types that are authorized for the City by the California Government Code (or the City s investment policy, where more restrictive). The table also identifies certain provisions of the California Government Code (or the City s investment policy, where more restrictive) that address interest rate risk, credit risk and concentration of credit risk. This table does not address investments of debt proceeds held by bond trustees that are governed by the provisions of debt agreements of the City, rather than the general provisions of the California Government Code or the City s investment policy. Maximum Percentage or Maximum Maximum Amount of Investment in Authorized Investment Type Maturity Portfolio* One Issuer ** Local Agency Bonds 5 years No Limit No Limit U.S. Treasury Obligations 5 years No Limit No Limit State of California Obligations 5 years No Limit No Limit California Local Agency Obligations 5 years No Limit No Limit U.S. Government-Sponsored Enterprise Securities 5 years No Limit No Limit Banker s Acceptances 180 days 40% 30% Commercial Paper 270 days 25% 10% Negotiable Certificates of Deposit 5 years 30% No Limit Repurchase Agreements 1 year No Limit No Limit Medium-Term Notes 5 years 30% No Limit Money Market Funds 5 years 15% 10% Mortgage Pass-Through Securities 5 years 20% No Limit Los Angeles County Pooled Investment Fund (LACPIF) Not Applicable No Limit No Limit State of California Local Agency Investment Fund (LAIF) Not Applicable $ 50,000,000 No Limit * Excluding amounts held by bond trustees that are not subject to California Government Code restrictions. ** Banker s acceptances may have no more than 30 percent in any one commercial bank, commercial paper may not represent more than 10 percent of the City s surplus funds for any single issuer, and money market mutual funds may have no more than 10 percent invested in any one mutual fund. 43
64 Notes to Financial Statements 2. CASH AND INVESTMENTS (Continued) C. Investments Authorized by Debt Agreements Investments of debt proceeds held by bond trustees are governed by provisions of the debt agreements, rather than the general provisions of the California Government Code or the City s investment policy. The table below identifies the investment types that are authorized for investments held by bond trustees. The table also identifies certain provisions of these debt agreements that address interest rate risk, credit risk and concentration of credit risk. Maximum Percentage or Maximum Maximum Amount of Investment in Authorized Investment Type Maturity Portfolio* One Issuer U.S. Treasury Obligations 5 years No Limit No Limit U.S. Government-Sponsored Enterprise Securities 5 years No Limit No Limit Money Market Funds 5 years 15% 10% State of California Local Agency Investment Fund (LAIF) Not Applicable $ 50,000,000 No Limit * Excluding amounts held by bond trustees that are not subject to California Government Code restrictions. D. Disclosures Relating to Interest Rate Risk As a means of limiting its exposure to fair value losses arising from rising interest rates, the City s investment policy limits investments to a maximum maturity of five years from the date of purchase. Interest rate risk is the risk that changes in market interest rates will adversely affect the fair value of an investment. Generally, the longer the maturity of an investment, the greater the sensitivity of its fair value to changes in market interest rates. One of the ways that the City manages its exposure to interest rate risk is by purchasing a combination of shorter-term and longer-term investments and by timing cash flows from maturities so that a portion of the portfolio is maturing or coming close to maturity evenly over time, as necessary, to provide the cash flow and liquidity needed for operations. 44
65 Notes to Financial Statements 2. CASH AND INVESTMENTS (Continued) D. Disclosures Relating to Interest Rate Risk (Continued) At June 30, 2014, the City had the following investment maturities: Investment Maturities (In Years) Investment Type Fair Value Less Than 1 1 to 2 2 to 3 3 to 4 4 to 5 Investments: U.S. Treasury Securities $ 31,505,217 $ 1,443,041 $ 3,784,977 $ 11,685,793 $ 7,910,725 $ 6,680,681 U.S. Government-Sponsored Enterprise Securities 71,578,161 16,931,602 13,583,620 14,122,489 15,510,744 11,429,706 Commercial Paper 9,198,901 9,198, Medium-Term Notes 38,167,951 8,192,058 2,436,050 8,406,168 10,825,682 8,307,993 Money Market Funds 1,606,088 1,606, LAIF 43,599,682 43,599, LACPIF 1,495,553 1,495, Total investments 197,151,553 82,466,925 19,804,647 34,214,450 34,247,151 26,418,380 Restricted Investments: Money Market Funds 9,281,684 9,281, Total restricted investments 9,281,684 9,281, Restricted Investments With Fiscal Agent: Money Market Funds 5,075,099 5,075, Total restricted investments with fiscal agent 5,075,099 5,075, Total investments subject to interest rate risk $ 211,508,336 $ 96,823,708 $ 19,804,647 $ 34,214,450 $ 34,247,151 $ 26,418,380 E. Disclosures Relating to Credit Risk Generally, credit risk is the risk that an issuer of an investment will not fulfill its obligation to the holder of the investment. This is measured by the assignment of a rating by a nationally recognized statistical rating organization. Presented below is the actual rating, as reported by Standard & Poor s, as of year-end for each investment type: Minimum Credit Ratings Investment Type Rating Fair Value AAA AA A A-1 Unrated Investments: U.S. Treasury Securities None $ 31,505,217 $ - $ 31,505,217 $ - $ - $ - U.S. Government-Sponsored Enterprise Securities None 71,578,161-69,078,786 2,499, Commercial Paper A-1 9,198, ,198, Money Market Funds None 1,606,088 1,606, Medium-Term Notes* A 38,167,951 6,871,832 9,698,556 11,770,682-9,826,881 LAIF None 43,599, ,599,682 LACPIF None 1,495, ,495,553 Total investments 197,151,553 8,477, ,282,559 23,468,958-54,922,116 Restricted Investments: Money Market Funds None 9,281, ,281,684 Total restricted investments 9,281, ,281,684 Restricted Investments with Fiscal Agent: Money Market Funds None 5,075, ,075,099 Total restricted investments with fiscal agent 5,075, ,075,099 Total investments subject to credit rate risk $ 211,508,336 $ 8,477,920 $ 110,282,559 $ 23,468,958 $ - $ 69,278,899 45
66 Notes to Financial Statements 2. CASH AND INVESTMENTS (Continued) E. Disclosures Relating to Credit Risk (Continued) * Included in the medium-term notes is an investment in Lehman Brothers, which is not rated as of June 30, Lehman Brothers filed for Chapter 11 bankruptcy protection on September 15, 2008, and the company s assets are still in the process of being liquidated. The value of the investment reported is the amount the City estimates it will receive when the investment is redeemed. As of June 30, 2014, this amount is $0.25 per $1.00 of the original investment. F. Concentration of Credit Risk The investment policy of the City contains no limitations on the amount that can be invested in any one issuer beyond that stipulated by the California Government Code. Investments in any one issuer that represent 5 percent or more of the City s total investments are as follows: Issuer Investment Type Amount % of Total Investments Federal National Mortgage U.S. Government-Sponsored Association Enterprise Securities $ 17,979, % Federal Home Loan Bank U.S. Government-Sponsored Enterprise Securities $ 17,660, % Federal Home Loan Mortgage U.S. Government-Sponsored Corporation Enterprise Securities $ 11,439, % Federal Farm Credit Bank U.S. Government-Sponsored Enterprise Securities $ 9,494, % G. Custodial Credit Risk Custodial credit risk for deposits is the risk that, in the event of the failure of a depository financial institution, a government will not be able to recover its deposits or will not be able to recover collateral securities that are in the possession of an outside party. The custodial credit risk for investments is the risk associated with investments that are uninsured, are not in the name of the City, or are held by counterparty or counterparty s trust department or agent but not in the City s name. In the event of the failure of the counterparty (e.g., broker-dealer) to a transaction, the counterparty is then unable to deliver securities that are in the possession of another party. As of June 30, 2014, none of the City s deposits or investments were exposed to custodial credit risk. 46
67 Notes to Financial Statements 2. CASH AND INVESTMENTS (Continued) H. Investment in State Investment Pool The City is a participant in LAIF, which is regulated by California Government Code Section under the oversight of the Treasurer of the State of California. Each City may invest up to $50,000,000 and may also invest without limitation in special bond proceeds accounts. Investments in LAIF are highly liquid, as deposits can be converted to cash within 24 hours without loss of interest. The City s investments with LAIF at June 30, 2014 included a portion of the pool funds invested in structured notes and asset-backed securities: Structured Notes Debt securities (other than asset-backed securities) whose cash flow characteristics (coupon rate, redemption amount or stated maturity) depend upon one or more indices and/or that have embedded forwards or options. Asset-Backed Securities Generally mortgage-backed securities that entitle their purchasers to receive a share of the cash flows from a pool of assets such as principal and interest repayments from a pool of mortgages (for example, collateralized mortgage obligations) or credit card receivables. As of June 30, 2014, the City had $43,599,682 invested in LAIF, which had invested 1.86 percent of the pool investment funds in structured notes and asset-backed securities. The LAIF fair value factor of was used to calculate the fair value of the investments in LAIF from their amortized cost basis. LAIF is overseen by the Local Agency Investment Advisory Board, which consists of five members, in accordance with State statute. I. Investment in County Investment Pool The LACPIF is a pooled investment fund program governed by the Los Angeles County Board of Supervisors and administered by the Los Angeles County Treasurer and Tax Collector. Investments in the LACPIF are highly liquid, as deposits and withdrawals can be made at any time without penalty. The LACPIF does not impose any maximum investment limit. The fair value of the City s investment in this pool is reported in the accompanying financial statements at amounts based upon the City s prorated share of the fair value provided by the LACPIF for the entire LACPIF portfolio (in relation to the amortized cost of that portfolio). The balance available for withdrawal is based on the accounting records maintained by the LACPIF, which are recorded on an amortized cost basis. As of June 30, 2014, the City had $1,495,553 invested in the LACPIF. The LACPIF fair value factor of was used to calculate the fair value of the investments in the LACPIF from their amortized cost basis. 3. LAND HELD FOR RESALE As of June 30, 2014, the City had $1,188,969 of land held for resale, which is reported at fair value. There were no changes in fair value during the current year. 47
68 Notes to Financial Statements 4. ACCOUNTS RECEIVABLE Accounts receivable as of June 30, 2014, including allowances for uncollectible accounts, is as follows: Landscape Non-Major General Bridge and Maintenance Governmental Fund Thoroughfare District #1 Funds Total Gross receivables $ 990,770 $ 13,440 $ 125,235 $ 152,301 $ 1,281,746 Less: allowance for uncollectibles 502,275-79,062 76, ,233 Net total receivables $ 488,495 $ 13,440 $ 46,173 $ 75,405 $ 623, LOANS RECEIVABLE The City has provided deferred-payment rehabilitation loans to qualified homeowners in connection with CDBG and HOME rehabilitation programs. In the governmental funds, the loans receivable balance totaling $2,424,977 at June 30, 2014 has been offset by deferred inflows of intergovernmental revenue in the non-major governmental funds, since these loans are not available to finance current expenditures. 6. NOTES TO RDA SUCCESSOR AGENCY Prior to the dissolution of the former redevelopment agency, the General Fund and Developer Fees Special Revenue Fund advanced the former redevelopment agency $7,884,071 and $5,476,016, respectively, to provide funding for various redevelopment activities. These advances were made in the form of promissory notes and were transferred to the RDA Successor Agency upon dissolution. Due to the uncertainty of the collectability of the notes, an allowance for doubtful accounts has been recorded as of June 30, These allowances will remain in place until the State of California Department of Finance makes further determinations regarding the allowability of these items as enforceable obligations. The unpaid accrued interest of these notes is $890,974 and $169,812, respectively. 48
69 Notes to Financial Statements 7. CAPITAL ASSETS A. Governmental Activities The following is a summary of changes in the capital assets for governmental activities during the fiscal year ended June 30, 2014: Governmental Activities Balance Balance July 1, 2013 Adjustments* Additions Deletions Transfers June 30, 2014 Governmental activities: Non-depreciable assets: Land $ 116,387,179 $ 8,863,368 $ - $ - $ - $ 125,250,547 Construction in progress 5,474,307-17,875,316 (224,422) (9,686,980) 13,438,221 Total non-depreciable assets 121,861,486 8,863,368 17,875,316 (224,422) (9,686,980) 138,688,768 Depreciable assets: Site improvements 29,970,688 7,208, ,553 (165,018) 869,925 38,252,932 Building and improvements 68,312,313-18, ,971 68,464,638 Equipment 12,975,233-1,600,601 (1,953,241) - 12,622,593 Infrastructure 837,210,574 35,247,546 16,125,453 (1,914,393) 8,683, ,352,264 Total depreciable assets 948,468,808 42,456,330 18,112,961 (4,032,652) 9,686,980 1,014,692,427 Less accumulated depreciation: Site improvements (10,423,525) (513,482) (1,269,026) 33,004 - (12,173,029) Building and improvements (14,598,599) - (1,500,170) - - (16,098,769) Equipment (10,477,098) - (805,754) 1,947,734 - (9,335,118) Infrastructure (265,261,948) (3,051,624) (17,561,539) 473,841 - (285,401,270) Total accumulated depreciation (300,761,170) (3,565,106) (21,136,489) 2,454,579 - (323,008,186) Total depreciable assets, net 647,707,638 38,891,224 (3,023,528) (1,578,073) 9,686, ,684,241 Total capital assets, net $ 769,569,124 $ 47,754,592 $ 14,851,788 $ (1,802,495) $ - $ 830,373,009 * Adjustments were to restate capital assets as of June 30, 2013 (see Note 12). Depreciation expense was charged to functions/programs of governmental activities for the fiscal year ended June 30, 2014, as follows: Governmental Activities: General government $ 1,008,027 Public safety 50,096 Public works 184,543 Parks, recreation and community service 2,159,993 Community development 5,155 Internal service funds depreciation 167,136 Allocated depreciation 3,574,950 Unallocated infrastructure depreciation 17,561,539 Total depreciation expense $ 21,136,489 49
70 Notes to Financial Statements 7. CAPITAL ASSETS (Continued) B. Business-Type Activities The following is a summary of changes in the capital assets for business-type activities during the fiscal year ended June 30, 2014: Business-Type Activities Balance Balance July 1, 2013 Additions Deletions Transfers June 30, 2014 Business-type activities: Non-depreciable assets: Land $ 15,087,880 $ - $ - $ - $ 15,087,880 Construction in progress 2,145,290 2,765,626 - (4,827,664) 83,252 Total non-depreciable assets 17,233,170 2,765,626 - (4,827,664) 15,171,132 Depreciable assets: Site improvements 7,413, ,747,181 12,160,382 Building and improvements 41,483, ,483,799 Equipment 45,109,127 9,163,470 (5,472,777) 80,483 48,880,303 Total depreciable assets 94,006,127 9,163,470 (5,472,777) 4,827, ,524,484 Less accumulated depreciation: Site improvements (1,116,174) (473,990) - - (1,590,164) Building and improvements (8,392,346) (883,347) - - (9,275,693) Equipment (25,169,370) (3,744,636) 5,380,792 - (23,533,214) Total accumulated depreciation (34,677,890) (5,101,973) 5,380,792 - (34,399,071) Total depreciable assets, net 59,328,237 4,061,497 (91,985) 4,827,664 68,125,413 Capital assets, net $ 76,561,407 $ 6,827,123 $ (91,985) $ - $ 83,296,545 Depreciation expense for business-type activities for the fiscal year ended June 30, 2014 was charged as follows: Business-Type Activities: Transit Enterprise $ 5,101,973 Total depreciation expense $ 5,101,973 50
71 Notes to Financial Statements 8. LONG-TERM DEBT A. Governmental Activities The following is a summary of long-term debt transactions of the City for the year ended June 30, 2014: Classification Balance Balance Due Within Due More July 1, 2013 Additions Deletions June 30, 2014 One Year Than One Year Lease Revenue Bonds: Series 2007 $ 12,230,000 $ - $ (310,000) $ 11,920,000 $ 325,000 $ 11,595,000 Plus deferred amount for issuance premium 86,280 - (3,658) 82,622 3,658 78,964 Total Lease Revenue Bonds 12,316,280 - (313,658) 12,002, ,658 11,673,964 Certificates of Participation: Refunding, Series ,485,000 - (1,160,000) 9,325,000 1,195,000 8,130,000 Series ,430,000 - (90,000) 15,340, ,000 15,220,000 Less deferred amount for issuance discount (55,102) - 4,614 (50,488) (4,614) (45,874) Total Certificates of Participation 25,859,898 - (1,245,386) 24,614,512 1,310,386 23,304,126 Capital leases 201,879 - (47,174) 154,705 49, ,720 Loans 810,000 - (230,000) 580, , ,000 Compensated absences 2,864,131 1,936,420 (1,603,511) 3,197,040 1,605,764 1,591,276 Claims and judgments 1,114,117 1,613,412 (569,766) 2,157,763 1,349, ,887 Total $ 43,166,305 $ 3,549,832 $ (4,009,495) $ 42,706,642 $ 4,924,669 $ 37,781,973 Lease Revenue Bonds Series 2007 On January 16, 2007, the Authority issued $13,785,000 Lease Revenue Bonds, Series The bonds were issued by the Authority for the purpose of financing the costs of acquiring right-of-way for a portion of Golden Valley Road in connection with the payment of a judicial order by the City. Concurrent with this bond issuance, the Authority entered into a lease and lease-back arrangement with the City, whereby the Authority used the proceeds of the bond issuance to make a lump-sum lease payment to the City. In return, the City will make lease-back payments to the Authority sufficient to cover the principal and interest due on the Series 2007 Bonds. The property subject to the lease and lease-back arrangement is City Hall. Principal amounts on serial bonds mature annually each February 1 in the years 2008 through 2018 and bear interest at rates ranging from 4.0 percent to 5.0 percent. Term bonds totaling $2,495,000 mature on February 1, 2033 and bear interest at 4.3 percent. Term bonds totaling $2,965,000 mature in February 2037 and bear interest at percent. Interest is payable semi-annually on February 1 and August 1 of each year. The term bonds maturing on February 1, 2033 are subject to mandatory redemption commencing on February 1, The term bonds maturing on February 1, 2037 are subject to mandatory redemption commencing on February 1, Bonds maturing on or after February 1, 2018 are subject to optional redemption on or after February 1, The total principal and interest remaining to be paid on the bonds is $18,924,425 as of June 30, For the current year, principal and interest paid on the bonds was $823,054 and was equal to the base lease payments as required to be paid to the Authority. The outstanding balance of the bonds was $11,920,000 at June 30,
72 Notes to Financial Statements 8. LONG-TERM DEBT (Continued) A. Governmental Activities (Continued) The annual debt service requirements on these bonds are as follows: Year Ending June 30, Principal Interest Total 2015 $ 325,000 $ 500,654 $ 825, , , , , , , , , , , , , ,125,000 1,990,069 4,115, ,585,000 1,521,913 4,106, ,190, ,504 4,112, ,270, ,469 2,471,469 Total $ 11,920,000 $ 7,004,425 $ 18,924,425 Refunding Certificates of Participation Series 2005 On July 12, 2005, the Authority issued $17,700,000 in Certificates of Participation, with an average interest rate of 3.4 percent, to advance refund $17,640,000 of outstanding 1997 Series certificates with an average interest rate of 4.9 percent. The defeased 1997 Series certificates have since been retired. The certificates are backed by lease payments to be made by the City to the Authority for the use and occupancy of certain real property. Principal amounts mature annually each October 1 in the years 2006 through 2020 and bear interest at rates ranging from 3.0 percent to 4.0 percent. Interest is payable semi-annually on April 1 and October 1. The certificates maturing on or after October 1, 2016 are subject to optional prepayment on any date on or after October 1, 2015, at a price equal to the principal amount plus accrued interest to the prepayment date, without premium. The total principal and interest remaining to be paid on the bonds is $10,640,375 as of June 30, For the current year, principal and interest paid on the bonds was $1,528,085 and was equal to the base lease payments as required to be paid to the Authority. The outstanding balance of the bonds was $9,325,000 at June 30,
73 Notes to Financial Statements 8. LONG-TERM DEBT (Continued) A. Governmental Activities (Continued) The annual debt service requirements on these bonds are as follows: Year Ending June 30, Principal Interest Total 2015 $ 1,195,000 $ 329,359 $ 1,524, ,235, ,581 1,522, ,280, ,769 1,522, ,325, ,725 1,519, ,375, ,241 1,518, ,915, ,700 3,032,700 Total $ 9,325,000 $ 1,315,375 $ 10,640,375 Certificates of Participation Series 2007 On December 12, 2007, the Authority issued $15,525,000 in Certificates of Participation to provide financing for the costs of acquiring open-space lands, parks and parkland in accordance with the City s open space, park and parkland programs, purchase a reserve fund surety and fund the costs of delivery of the certificates. The certificates are secured by a pledge of special assessment revenues received by the City. Additionally, there is a backed-up pledge of lease payments to be made by the City to the Authority for the use and occupancy of the Aquatic Center and Sports Complex. This issuance is composed of $6,000,000 serial certificates maturing annually on October 1 from 2011 to 2028 and two term certificates (totaling $9,525,000) maturing on October 1, 2033 and October 1, 2037 that are payable in annual sinking fund installments commencing October 1, Interest on the certificates is payable semi-annually on October 1 and April 1 at rates ranging from 4.00 percent to 4.60 percent for the serial certificates and 4.75 percent for the term certificates. The City has pledged the future special assessment revenues received to repay the Certificates. The Certificates are payable solely from all or a portion of the annual special assessment collected for the District. The total principal and interest remaining to be paid on the certificates is $26,845,448 as of June 30, For the current year, principal and interest paid on the certificates was $798,051 and total special assessment revenues were $2,143,520. The outstanding balance of the certificates was $15,340,000 at June 30,
74 Notes to Financial Statements 8. LONG-TERM DEBT (Continued) A. Governmental Activities (Continued) The annual debt service requirements on these certificates are as follows: Year Ending June 30, Principal Interest Total 2015 $ 120,000 $ 703,851 $ 823, , , , , , , , , , , , , ,855,000 3,170,164 5,025, ,030,000 2,633,710 5,663, ,535,000 1,755,956 6,290, ,990, ,763 5,483,763 Total $ 15,340,000 $ 11,505,448 $ 26,845,448 Loans Balance Balance Due Within Due in More July 1, 2013 Additions Deletions June 30, 2014 One Year Than One Year HUD Loans: 1999 West Newhall $ 310,000 $ - $ (130,000) $ 180,000 $ 180,000 $ - Boys & Girls Club 120,000 - (23,000) 97,000 23,000 74,000 Scherzinger Lane 380,000 - (77,000) 303,000 77, ,000 Total loans $ 810,000 $ - $ (230,000) $ 580,000 $ 280,000 $ 300,000 In December 1999, the City entered into a loan agreement with the Secretary of Housing and Urban Development in the amount of $2,000,000. The purpose of this loan was to provide financing for the installation of curbs, gutters and sidewalks in the West Newhall area. Payments are due semiannually, commencing on August 1, 2001, and continuing through August 1, Future CDBG grant funding will be used to repay the loan. The interest rate on this loan is fixed at 7.49 percent. The amount outstanding at June 30, 2014 is $180,000. In August 2002, the City entered into a loan agreement with the Secretary of Housing and Urban Development in the amount of $350,000. The purpose of this loan was to assist the Boys & Girls Club in financing the construction of a new gymnasium. Payments are due semi-annually, commencing on February 1, 2003 and continuing through August 1, Future CDBG grant funding will be used to repay the loan. The interest rate on this loan is fixed at 0.56 percent. The amount outstanding at June 30, 2014 is $97,000. In August 2002, the City entered into a loan agreement with the Secretary of Housing and Urban Development in the amount of $1,150,000. The purpose of this loan was to provide financing for the construction of improvements to Scherzinger Lane. Payments are due semi-annually, commencing on February 1, 2003 and continuing through August 1, Future CDBG grant funding will be used to repay the loan. The interest rate on this loan is fixed at 0.56 percent. The amount outstanding at June 30, 2014 is $303,
75 Notes to Financial Statements 8. LONG-TERM DEBT (Continued) A. Governmental Activities (Continued) Future payment requirements for the loans are combined as follows: Year Ending June 30, Principal Interest Total 2015 $ 280,000 $ 29,186 $ 309, ,000 21, , ,000 14, , ,000 8, ,605 Total $ 580,000 $ 73,346 $ 653,346 Capital Lease On February 28, 2012, the City Council approved a lease-purchase agreement with One Source Financial Corp. for two seven-bin sorters for the Canyon Country and Valencia Library branches in the amount of $251,455. The lease agreement has 60 monthly payments of $4,825 with an interest rate of 6 percent. The final payment is due May 15, The lease was assigned by One Source Financial Corp. to Bank of the West. The assets acquired through the capital lease are as follows: Equipment $ 252,068 Less: Accumulated depreciation (109,229) Total $ 142,839 Future capital lease payment requirements are as follows: Year Ending June 30, Total 2015 $ 57, , ,425 Net minimum lease payments 159,225 Less: amount representing interest 4,520 Present value of net minimum lease payments $ 154,705 Compensated Absences The City s liability for accrued and unpaid compensated absences in the governmental activities totaled $3,197,040 at June 30, The majority of compensated absences are liquidated through the General Fund. 55
76 Notes to Financial Statements 8. LONG-TERM DEBT (Continued) A. Governmental Activities (Continued) Claims and Judgments The City s liability for outstanding claims and judgments is $2,157,763 at June 30, 2014 (see Note 17). B. Business-Type Activities Compensated Absences The City s liability for accrued and unpaid compensated absences in the business-type activities at June 30, 2014 is as follows: Balance Balance Due Within Due in More July 1, 2013 Additions Deletions June 30, 2014 One Year Than One Year Compensated absences $ 62,032 $ 44,034 $ (39,676) $ 66,390 $ 39,676 $ 26,714 Total $ 62,032 $ 44,034 $ (39,676) $ 66,390 $ 39,676 $ 26, DEPOSITS PAYABLE The City collects deposits for a) improvements within the City; b) donations received for specified services; and c) deposits received in advance for recreation programs or other department services. These balances represent amounts that have been collected, for which the eligibility requirements for revenue recognition have not been met. As of June 30, 2014, deposits payable were as follows: General Fund: Deposits from developers $ 2,869,449 Other deposits payable 299,434 Total deposits payable $ 3,168, DEVELOPER CREDITS The City and the County of Los Angeles have established the Santa Clarita Valley Bridge and Major Thoroughfare Districts to accommodate the needs of future development anticipated by the County of Los Angeles and the City of Santa Clarita General Plans. Included in the formation documents are provisions for district fees to be paid by developers, which are to be used to assist the City in constructing and maintaining the infrastructure within the areas of benefit. In lieu of paying the district fees, developers are allowed to donate infrastructure (roadways, bridges, intersections and interchanges) necessary for the future development of the districts. In certain cases, the developer may donate infrastructure with a value that exceeds the district fees required. If this occurs, the developer can receive a credit toward future district fees or can request a cash withdrawal of the excess amount, subject to City approval if funding is determined to be available. 56
77 Notes to Financial Statements 10. DEVELOPER CREDITS (Continued) As of June 30, 2014, the City accrued a liability of $44,222,984 for the value of infrastructure donated in excess of the district fees that were owed. There is no maturity schedule for the developer payables, and it has been determined that current financial resources will not be used to repay the liability; therefore, the liability has been recorded as a long-term obligation in the governmental activities in the Statement of Net Position. The following is a summary of developer credits by district for the year ended June 30, 2014: Balance Balance July 1, 2013 Additions Deletions June 30, 2014 Bridge and Thoroughfare Districts: Bouquet District $ 13,280,489 $ - $ - $ 13,280,489 Eastside District 4,139,246 11,232,074 (200,000) 15,171,320 Via Princessa District - 200, ,000 Valencia District 15,505,915 65,260-15,571,175 Total $ 32,925,650 $ 11,497,334 $ (200,000) $ 44,222, INTERFUND TRANSACTIONS A. Due To/Due From At June 30, 2014, the City had the following short-term interfund receivables and payables: Due From Other Funds General Due To Other Funds: Non-Major Governmental Funds $ 2,274,080 Total $ 2,274,080 The interfund payables balance represents routine temporary cash flow assistance until the amounts receivable from other governments are collected to reimburse eligible expenditures. 57
78 Notes to Financial Statements 11. INTERFUND TRANSACTIONS (Continued) B. Advances At June 30, 2014, the City had the following interfund advances: Advances To Other Funds Non-Major Governmental General Funds Total Advances From Other Funds: Major Governmental Funds: Bridge and Thoroughfare $ 1,481,820 $ 117,823 $ 1,599,643 Public Library 9,945,693-9,945,693 Total $ 11,427,513 $ 117,823 $ 11,545,336 In March 2006, the General Fund advanced the Bridge and Thoroughfare Special Revenue Fund $430,000 for acquisition of land. The advance accrues interest at a rate equal to the yield of the average monthly investment portfolio and will be repaid with future available resources of the Bridge and Thoroughfare Special Revenue Fund. There is no fixed repayment schedule. At June 30, 2014, the amount of the advance outstanding is $538,214. In December 2007, the General Fund advanced the Bridge and Thoroughfare Special Revenue Fund $3,000,000 to pay outstanding developer payables at the time. The advance accrues interest at a rate equal to the yield of the average monthly investment portfolio and will be repaid with future available resources of the Bridge and Thoroughfare Special Revenue Fund. There is no fixed repayment schedule. At June 30, 2014, the amount of the advance outstanding is $943,606. In July 2010, the Developer Fees Special Revenue Fund advanced the Bridge and Thoroughfare Special Revenue Fund $111,242 for the design and construction costs of the Newhall Avenue Pedestrian, Facilities and Sidewalk project. The advance accrues interest at a rate equal to the yield of the average monthly investment portfolio and will be repaid with future available resources of the Bridge and Thoroughfare Special Revenue Fund. There is no fixed repayment schedule. At June 30, 2014, the amount of the advance outstanding is $117,823. The General Fund advanced the Public Library Special Revenue Fund a total of $10,356,245, which consists of the following individual advances: In November 2010, the General Fund advanced the Public Library Special Revenue Fund $622,600 for the completion of the expansion of the Canyon Country Jo Anne Darcy Library. The advance accrues interest at a rate equal to the rate of return on investments and shall be repaid with future available resources of the Public Library Special Revenue Fund. At June 30, 2014, the principal amount of the advance of $44,734 is outstanding. In January 2011, the General Fund advanced the Public Library Special Revenue Fund $93,040 for the purchase and installation of the integrated library system software. The advance accrues interest at a rate equal to the rate of return on investments and shall be repaid with future available resources of the Public Library Special Revenue Fund. At June 30, 2014, the principal amount of the advance of $93,040 is outstanding. 58
79 Notes to Financial Statements 11. INTERFUND TRANSACTIONS (Continued) B. Advances (Continued) C. Transfers In March 2011, the General Fund advanced the Public Library Special Revenue Fund $1,348,000 for the acquisition of opening-day library materials and library furnishings and equipment. The advance accrues interest at a rate equal to the rate of return on investments and shall be repaid with future available resources of the Public Library Special Revenue Fund. At June 30, 2014, the principal amount of the advance of $1,348,000 is outstanding. In May 2011, the General Fund advanced the Public Library Special Revenue Fund $8,071,596 for the acquisition of library facilities, real property, personal property and collections from the County of Los Angeles. The advance accrues interest at a rate equal to the rate of return on investments and shall be repaid with future available resources of the Public Library Special Revenue Fund. At June 30, 2014, the principal amount of the advance of $8,071,596 is outstanding. In August 2011, the General Fund advanced the Public Library Special Revenue Fund $388,323 for the acquisition of a radio frequency identification system and related software for the Santa Clarita Public Library. The advance accrues interest at a rate equal to the rate of return on investments and shall be repaid with future available resources of the Public Library Special Revenue Fund. At June 30, 2014, the principal amount of the advance of $388,323 is outstanding. At June 30, 2014, the City had the following transfers: Transfers Out Landscape Non-Major Transit Internal General Bridge and Public Maintenance Governmental Enterprise Service Fund Thoroughfare Library District #1 Funds Fund Funds Total Transfers In: General Fund $ - $ 7,080 $ 5,138 $ 101,113 $ 2,294,650 $ 222,028 $ 17,411 $ 2,647,420 Non-Major Governmental Funds 4,262,761 68, ,000 2,671,849 3,690-7,110,027 Transit Enterprise ,917, ,917,750 Internal Service Funds 92, ,430 Total $ 4,355,191 $ 75,807 $ 5,138 $ 204,113 $ 10,884,249 $ 225,718 $ 17,411 $ 15,767,627 The General Fund made transfers to non-major governmental funds for operating and capital improvement projects for $1,911,622 and current year debt service payments for $2,351,139, totaling $4,262,761. Transfers from the General Fund to the Self-Insurance Internal Service Fund of $92,430 were for an insurance-related settlement. The Bridge and Thoroughfare, Public Library, and Landscape Maintenance District #1 Special Revenue Funds, non-major governmental funds, Transit Enterprise Fund and Self-Insurance Internal Service Fund made transfers to the General Fund for current year post-employment benefits, totaling $356,280. The Bridge and Thoroughfare Special Revenue Fund made transfers to non-major governmental funds for operating and replacement costs for $68,
80 Notes to Financial Statements 11. INTERFUND TRANSACTIONS (Continued) C. Transfers (Continued) The Landscape Maintenance District #1 Special Revenue Fund made transfers to the General Fund and the non-major governmental funds for operating and replacement costs for $40,000 and $103,000, respectively. The non-major governmental funds made transfers to the General Fund for operating and replacement costs for $2,101,140. Transfers from the non-major governmental funds to the Transit Enterprise Fund totaling $5,917,750 were to transfer Proposition A and Proposition C non-operating revenues in the current year. The Transit Enterprise Fund made transfers to the General Fund for $150,000 to support senior center transit operations. Transfers to non-major governmental funds for $3,690 were for the proportional share of Metrolink station maintenance. 60
81 Notes to Financial Statements 12. FUND BALANCES AND NET POSITION A. Fund Balance Classification The details of fund balance of the governmental funds as of June 30, 2014 are presented below: Major Governmental Funds Landscape Non-Major General Bridge and Public Maintenance Governmental Fund Thoroughfare Library District #1 Funds Total Nonspendable: Prepaid items $ 91,630 $ - $ - $ 336,882 $ 20,604 $ 449,116 Property held for resale , ,510 Advances to other funds 11,427, ,427,513 Total nonspendable 11,519, , ,114 12,126,139 Restricted: Landscape maintenance ,017,558 4,351,403 32,368,961 Capital improvements - 9,308, ,369,597 12,678,099 Transportation ,817,352 13,817,352 Open space preservation ,880,177 11,880,177 Public safety , ,434 Public library , ,301 Air quality improvement , ,816 Stormwater ,957,999 5,957,999 Public education and government ,114,017 1,114,017 Tourism marketing , ,720 Low- and moderate-income housing ,945,844 4,945,844 Total restricted - 9,308,502-28,017,558 46,942,660 84,268,720 Committed: Capital improvements , ,829 Total committed , ,829 Assigned: Sewer infrastructure ,353 2,353 Capital projects 15,500, ,409,774 18,909,774 Claims and settlements 13,350, ,350,328 Public facilities replacement 22,867, ,867,768 Total assigned 51,718, ,412,127 55,130,223 Unassigned 45,654,640 - (9,111,684) - (188,963) 36,353,993 Total fund balances $ 108,891,879 $ 9,308,502 $ (9,111,684) $ 28,354,440 $ 51,048,767 $ 188,491,904 61
82 Notes to Financial Statements 12. FUND BALANCES AND NET POSITION (Continued) B. Restricted Net Position The detail of restricted net position of the governmental activities as of June 30, 2014 is presented below: Governmental Activities Restricted net position: Landscape maintenance $ 32,368,961 Transportation 13,817,352 Open space preservation 11,880,177 Public safety 652,431 Public library 157,301 Community development 52,095 Air quality improvement 267,816 Stormwater 5,957,999 Public education and government 1,114,017 Tourism marketing 429,720 Low- and moderate-income 4,945,844 Total restricted net position $ 71,643,713 C. Net Position Restatements Net position in the City s previously issued June 30, 2013 financial statements has been restated by $47,754,592 due to adjustments to capital assets. The following corrections are the net result of capital assets that had not been properly reported at June 30, Beginning net position in the governmental activities has been restated as follows: Governmental Activities Net position, as previously reported at June 30, 2013 $ 872,499,646 Restate for duplication of capital assets from 2006 and 2007 (8,176,907) Restate for storm drain infrastructure contributed to other agencies prior to 2013 and to record infrastructure not recorded at GASB 34 implementation 7,461,940 Restate for capital assets from annexations not recorded between 1991 and ,469,559 Net position, as restated at June 30, 2013 $ 920,254,238 These changes had the effect of increasing the change in net position of the governmental activities by $41,269,720 for the year ended June 30, 2013, as compared to the amount previously reported. 62
83 Notes to Financial Statements 13. DEFINED BENEFIT PENSION PLAN A. Plan Description The City contributes to the California Public Employees Retirement System (CalPERS), an agent multiple-employer public employee defined benefit pension plan. CalPERS provides retirement and disability benefits, annual cost-of-living adjustments, and death benefits to plan members and beneficiaries. CalPERS acts as a common investment and administrative agent for participating public entities within the State of California. Benefit provisions and all other requirements are established by state statute and city ordinance. Copies of CalPERS annual financial report may be obtained from its executive office: 400 P Street, Sacramento, CA B. Funding Policy Participants hired before April 9, 2011 are required to contribute 8 percent of their annual covered salary. All participants in this tier make 3 percent of the required contributions, and the City makes 5 percent of the contributions required of City employees on their behalf and for their account. Participants hired on or after April 9, 2011, and before January 1, 2013, are required to contribute 7 percent of their annual covered salary. The employee makes the contributions required for their account. Participants hired on or after January 1, 2013 are required to contribute 6.25 percent of their annual covered salary. The employee makes the contributions required for their account. The City is required to contribute at an actuarially determined rate; the rate for the year ended June 30, 2014 was 13.3 percent for miscellaneous employees. The contribution requirements of plan members and the City are established and may be amended by CalPERS. C. Annual Pension Cost For 2014, the City s annual pension cost of $4,812,658 for CalPERS was equal to the City s required and actual contribution. The required contribution was determined as part of the June 30, 2011 actuarial valuation using the entry age normal actuarial cost method. The contributions were determined as a level percent of payroll over an average remaining period of 23 years from the valuation date. The actuarial assumptions included (a) a 7.50 percent investment rate of return (net of administrative expenses); (b) projected annual salary increases of 3.30 percent to percent, depending on age, service and type of employment; (c) an inflation rate of 2.75 percent; and (d) a payroll growth rate of 3.00 percent. The actuarial value of CalPERS assets was determined using techniques that smooth the effect of short-term volatility in the market value of investments over a 15-year period (smoothed market value). Initial unfunded liabilities are amortized over a closed period that depends on the plan s date of entry into CalPERS. Subsequent plan amendments are amortized as a level percentage of pay over a closed 20-year period. Gains and losses that occur in the operation of the plan are amortized over a rolling period, which results in an amortization of 6 percent of unamortized gains and losses each year. If the plan s accrued liability exceeds the actuarial value of plan assets, then the amortization payment on the total unfunded liability may not be lower than the payment calculated over a 30-year amortization period. Annual Percentage Pension Cost of APC Net Pension Fiscal Year (APC) Contributed Obligation 6/30/2012 $ 5,186, % $ - 6/30/2013 4,825, % - 6/30/2014 4,812, % - 63
84 Notes to Financial Statements 13. DEFINED BENEFIT PENSION PLAN (Continued) D. Funded Status and Funding Progress As of June 30, 2013, the most recent actuarial valuation date available, the plan was percent funded. The actuarial accrued liability for benefits was $120.5 million, and the actuarial value of assets was $91.5 million, resulting in an unfunded actuarial accrued liability (UAAL) of $29 million. The covered payroll (annual payroll of active employees covered by the plan) was $26.7 million, and the ratio of the UAAL to the covered payroll was percent. The schedule of funding progress, presented as required supplementary information following the notes to financial statements, presents multiyear trend information that shows whether the actuarial value of plan assets is increasing or decreasing over time relative to the actuarial accrued liabilities for benefits. 14. POST-EMPLOYMENT HEALTH BENEFITS A. Plan Description The City has elected through resolution to provide healthcare benefits as a single-employer defined benefit plan to retirees, spouses and eligible dependents of the City. This plan provides postemployment medical insurance benefits through the CalPERS Health Plan (the Plan). A separate financial report is not issued. B. Eligibility City employees who have a service retirement from the City at age 50 with five or more years of City service are eligible to receive post-employment medical benefits. Employees who have a disability retirement are also eligible. Employees hired after January 1, 2008 are eligible for the PERS minimum. The City implemented a vesting schedule for employees who were hired before January 1, 2008, as follows: Years of Service Vested Benefit Less than 5 years PERS minimum 5 to 9 years 50% of Employee +1 rate 10 to 14 years 75% of Employee +1 rate 15 years and greater 100% of Employee +1 rate As of June 30, 2014, the total participants in the Plan are as follows: Participants Total Active employees 334 Retirees 67 Total
85 Notes to Financial Statements 14. POST-EMPLOYMENT HEALTH BENEFITS (Continued) C. Funding Policy The City pays an allowance toward the healthcare benefits paid to retirees, spouses and eligible dependents under a City resolution that can be amended by the City Council. During fiscal year , the City contributed $2,303,000 to the irrevocable OPEB Trust fund. The City conducted an actuarial valuation to determine the City s obligation to fund other postemployment benefits (OPEB) and determined that it served the City s interests to prefund those benefits. In December 2011, the City Council approved Resolution adopting the Public Agencies Post-Retirement Health Care Plan Document and Trust Agreement. The OPEB Trust is a tax-qualified irrevocable trust, organized under Internal Revenue Code (IRC) Section 115, established to pre-fund OPEB as described in GASB Statement No. 45. The Plan Trustee is U.S. Bank, and Public Agencies Retirement Services (PARS) is the Trust Administrator. The City elected a discretionary investment approach with a blended investment objective strategy. The primary objective is to maximize total Plan return, subject to the risk and quality constraints established. The Plan s targeted rate of return is 7.0 percent. The asset allocation ranges for this objective are 0 percent to 20 percent cash source, 30 percent to 50 percent fixed income, and 50 percent to 70 percent equity. For fiscal year , the City contributed, on an individual basis, for employees and retirees up to the following amounts: 65 Retirees Unrepresented $ 12,199 SEIU Local ,199 D. Annual OPEB Cost and Net OPEB Obligation The City s annual OPEB cost (expense) is calculated based on the annual required contribution of the employer (ARC), an amount actuarially determined in accordance with the parameters of GASB Statement No. 45. The ARC represents a level of funding that, if paid on an ongoing basis, is projected to cover normal cost each year and amortize any unfunded actuarial liabilities (or funding excesses) over a period not to exceed 30 years. The following table shows the components of the City s annual OPEB cost for the year, the amount actually contributed to the Plan, and changes in the City s OPEB asset for the Plan: Annual required contribution $ 2,273,000 Interest on OPEB asset (389,000) Adjustment to annual required contribution 428,000 Annual OPEB cost (expense) 2,312,000 Contributions made outside of a trust 2,303,000 Decrease in OPEB asset (9,000) OPEB asset - beginning of year 6,223,930 OPEB asset - end of year $ 6,214,930 Total
86 Notes to Financial Statements 14. POST-EMPLOYMENT HEALTH BENEFITS (Continued) D. Annual OPEB Cost and Net OPEB Obligation (Continued) The City s annual OPEB cost, the percentage of annual OPEB cost contributed to the Plan, and the net OPEB asset as of June 30, 2014 were as follows: % of Annual Annual OPEB OPEB OPEB Annual Cost Asset Fiscal Year Ended Cost Contribution Contributed (Obligation) 6/30/2012 $ 2,979,000 $ 20,343, % $ 5,169,930 6/30/2013 1,625,000 2,679, % 6,223,930 6/30/2014 2,312,000 2,303, % 6,214,930 E. Funded Status and Funding Progress As of the most recent actuarial valuation date on July 1, 2012, the Plan was percent funded. The actuarial accrued liability for benefits was $30.9 million, and the actuarial value of assets was $19.9 million, resulting in a UAAL of $10.9 million. The covered payroll (annual payroll of active employees covered by the Plan) was $23.9 million, and the ratio of UAAL to the covered payroll was percent. The schedule of funding progress, presented as required supplementary information following the notes to financial statements, presents multi-year trend information that shows whether the actuarial value of Plan assets is increasing or decreasing over time relative to the actuarial accrued liabilities for benefits. F. Actuarial Methods and Assumptions Actuarial valuations of an ongoing plan involve estimates of the value of reported amounts and assumptions about the probability of occurrence of events far into the future. Examples include assumptions about future employment, mortality and the healthcare cost trend rate. Amounts determined regarding the funded status of the Plan and the ARC are subject to continual revision, as actual results are compared with past expectations, and new estimates are made about the future. In the July 1, 2012 actuarial valuation, the entry-age actuarial cost method was used. The actuarial assumptions include a 6.25 percent investment rate of return, which is based on the expected return on funds invested by PARS, and an annual healthcare cost trend rate of 8.70 percent initially and reduced by decrements of 0.6 percent to an ultimate rate of 5.0 percent thereafter. The actuarial assumption for inflation was 3.00 percent, and the aggregate payroll increase was 3.25 percent used in the actuarial valuation. The actuarial value of assets was determined using techniques that spread the effects of short-term volatility in the market value of investments over a five-year period. The UAAL is being amortized as a level percentage of projected payroll on an open basis. The remaining amortization period at July 1, 2012 was 26 years. 66
87 Notes to Financial Statements 15. INDIVIDUAL FUND DISCLOSURES A. Deficit Fund Balances and Net Position Funds that have a deficit fund balance at June 30, 2014 are as follows: Deficit Fund Fund Balance Major Funds: Public Library Special Revenue Fund $ (9,111,684) Non-Major Governmental Funds: Proposition A (6) BJA Law Enforcement Special Revenue Fund (846) Miscellaneous Grants Special Revenue Fund (188,111) The City plans to eliminate the deficit in the Public Library Special Revenue Fund with future property tax receipts. The non-major governmental fund deficits will be eliminated when the intergovernmental receivables are collected in future periods. B. Expenditures in Excess of Appropriations For the year ended June 30, 2014, expenditures exceeded appropriations in the following programs/functions (legal level of budgetary control) of the respective funds: Excess Expenditures Over Funds Appropriations Expenditures Appropriations Non-Major Governmental Funds: Miscellaneous Grants Special Revenue Fund: Capital outlay $ 529,852 $ 732,059 $ (202,207) Public Financing Authority Debt Service Fund: Interest and fiscal charges 1,589,192 1,589,277 (85) 16. DEFERRED COMPENSATION PLAN/DEFINED CONTRIBUTION PLAN The City has established deferred compensation/defined contribution plans for certain classifications of management under IRC Section 401(a). City participation in contributions to the plans is mandatory. The City is obligated to contribute amounts ranging from $2,000 to $17,500 per participant per year. Employee contributions to certain plans are voluntary. During the year ended June 30, 2014, there were 759 participants in the plans. The City s contributions totaled $185,939, and employees contributions totaled $1,962,
88 Notes to Financial Statements 17. SELF-INSURANCE The City is exposed to various risks of loss related to torts; theft of, damage to and destruction of assets; errors and omissions; injuries to employees; and natural disasters. The City joined Special Districts Risk Management Authority (SDRMA) in the fall of SDRMA is a self-insurance risk pool that serves as a not-for-profit public agency to its members. Through SDRMA, the City currently holds a $500 general liability deductible. All general liability claims above $500 and up to a limit of $10,000,000 are handled by SDRMA. The City s workers compensation coverage is also administered by SDRMA. The City is self-insured for workers compensation up to $250,000, but has purchased coverage through SDRMA for individual claims exceeding $250,000 up to a maximum of $5,000,000. The annual member contribution is $564,719 for the property/liability program and the workers compensation program (based on estimated wages). Members are subject to dividends and assessments, but no such dividends have been declared, nor have any assessments been levied for the year ended June 30, Additionally, there are no known refunds or credits due to SDRMA. At June 30, 2014, $50,000 was accrued by the City for general liability claims, and $2,107,763 was accrued for workers compensation claims and judgments. These accruals represent estimates of amounts to be paid for incurred and reported claims, as well as IBNR claims based upon past experience and modified for current trends and information. Changes in the reported claims liability since June 30, 2012 resulted in the following: Claims liability as of June 30, 2012 $ 140,545 Claims and changes in estimates during the year ended June 30, ,460,834 Claims and payments during the year ended June 30, 2013 (487,262) Claims liability as of June 30, ,114,117 Claims and changes in estimates during the year ended June 30, ,613,412 Claims and payments during the year ended June 30, 2014 (569,766) Claims liability as of June 30, 2014 $ 2,157,763 Settled claims have not exceeded any of these coverage amounts in any of the last three fiscal years, and there were no reductions in the City s insurance coverage during the year ended June 30, SDRMA has published its own financial report for the year ended June 30, 2013, which can be obtained from SDRMA, 1112 I Street, Suite 300, Sacramento, California NON-COMMITMENT DEBT A Act Limited Obligation Improvements Bonds On July 24, 1996, $879,432 of 1915 Act Limited Obligation Improvement Bonds (1915 Golden Valley Road Bonds) for the Golden Valley Road Improvement Assessment District (the Golden Valley Assessment District) were issued. The 1915 Golden Valley Road Bonds are not a general obligation of the City, and neither the faith and credit nor the taxing power of the City is pledged to the payment of the bonds. The source of the debt service is from the property assessments within the Golden Valley Assessment District. The principal amount of debt outstanding at June 30, 2014 was $385,
89 Notes to Financial Statements 18. NON-COMMITMENT DEBT (Continued) B Act Limited Obligation Improvements Bonds On January 27, 2000, $790,000 of 1915 Act Limited Obligation Improvement Bonds (1915 Vermont Drive/Everett Drive Bonds) for the Vermont Drive/Everett Drive Improvement Assessment District (the Vermont/Everett Assessment District) were issued. The 1915 Vermont Drive/Everett Drive Bonds are not a general obligation of the City, and neither the faith and credit nor the taxing power of the City is pledged to the payment of the bonds. The source of the debt service is from the property assessments within the Vermont/Everett Assessment District. The principal amount of the debt outstanding at June 30, 2014 was $470,000. C. Community Facilities District No Special Tax Bonds On October 29, 2002, $17,370,000 of Special Tax bonds were issued for Community Facilities District No (the Community Facilities District). On October 12, 2012, these bonds were refunded with the issuance of Community Facilities District No (Valencia Town Center) Special Tax Refunding bonds for $16,485,000. The Special Tax Refunding bonds are not a general obligation of the City, and neither the faith and credit nor the taxing power of the City is pledged to the payment of the bonds. The source of the debt service is from the property assessments within the Community Facilities District. The principal amount of the debt outstanding at June 30, 2014 was $16,210, SANTA CLARITA WATERSHED RECREATION AND CONSERVANCY AUTHORITY In June 1992, the City entered into a joint powers agreement with the Santa Monica Mountains Conservancy (the Conservancy) to create the Watershed Authority. The purpose of the Watershed Authority is to acquire, develop and conserve additional park and open space lands, including wateroriented recreation and conservation projects. The governing board consists of two representatives from the Conservancy and two from the City. The City performs administrative functions for the Watershed Authority. As a result, the Watershed Authority is reported as an agency fund in these financial statements. The Watershed Authority may request the City to make annual contributions. For the year ended June 30, 2014, the City did not make any contributions. Separate financial statements for the Santa Clarita Watershed Recreation and Conservancy Authority can be obtained from the City s administrative offices at Valencia Boulevard, Santa Clarita, CA SANTA CLARITA PUBLIC TELEVISION AUTHORITY In July 2009, the City entered into a joint powers agreement with the William S. Hart School District (the District) to create the SCPTA. As a result, the SCPTA is reported as an Agency fund in these financial statements. The purpose of the SCPTA is to provide a forum for public, educational and governmental television programs by the members, individuals and organizations in the community. The governing board consists of one representative from the District and one from the City. The City performs administrative functions for the SCPTA, and may, at the SCPTA s request, make annual contributions. For the year ended June 30, 2014, the City contributed $110,000. Separate financial statements for the Santa Clarita Public Television Authority are prepared biannually and can be obtained from the City s administrative offices at Valencia Boulevard, Santa Clarita, CA
90 Notes to Financial Statements 21. COMMITMENTS AND CONTINGENCIES A. Construction Commitments The City has active construction projects as of June 30, At year-end, the City s commitments with contractors for infrastructure projects are as follows: Expenditures Contract to Date as of Remaining Project Amount June 30, 2014 Commitments Pavement $ 946,886 $ 576,786 $ 370,100 Bridges 11,626,157 6,803,260 4,822,897 Sidewalk 269, , ,686 Medians 516, , ,566 B. Encumbrances The City utilizes encumbrance accounting as a means of controlling expenditures. Under this method, funds are encumbered when purchase orders, contracts and other commitments are signed or approved by authorized City officials. Such outstanding commitments at year-end do not constitute expenditures or liabilities. GASB Statement No. 54 provides additional guidance on the classification within the fund balances section of amounts that have been encumbered. Encumbrances of balances within the governmental funds are classified as either restricted or assigned and are included in the respective categories. These encumbrances are not separately classified in the financial statements and are summarized at June 30, 2014 as follows: Amount General Fund $ 378,989 Other governmental funds 16,149,008 C. Contingencies The City has received Federal grants for specific purposes that are subject to review and audit by the Federal government. Although such audits could result in expenditure disallowance under grant terms, any required reimbursements are not expected to be material. In addition, the City is a defendant in certain other legal actions arising in the normal course of operations. In June 2013, a lawsuit was filed against the City alleging voting rights dilution and the City has settled the dispute with the plaintiff. The maximum exposure to liability is $800,000, and management and the City s legal counsel have reasonably estimated a $600,000 liability for plaintiff attorney fees. This has been accrued in the Self Insurance Internal Service Fund at June 30, In the opinion of management and legal counsel, there are no other liabilities that would have a substantial adverse effect on the financial position of the City as of June 30,
91 Notes to Financial Statements 21. COMMITMENTS AND CONTINGENCIES (Continued) D. Repayment of Advances to Successor Agency On April 20, 2012, pursuant to Health and Safety Code Section , the California State Controller issued an order to cities, counties and agencies, directly or indirectly receiving assets from a redevelopment agency after January 1, 2011, to reverse the transfer and return assets to successor agencies. In August 2012, the California State Controller started to specifically review and audit cities, counties and public agencies to ensure that all applicable asset transfers have been reversed. The purpose of this review would be to determine if any asset transfers made after January 1, 2011, including, but not limited to, real and personal property, cash funds, accounts receivable, deeds of trust and mortgages, contract rights, and rights to payment of any kind, were unallowable. In March 2011, the former redevelopment agency transferred $14.8 million of cash and other assets to the City that are under review by the California State Controller s Office. While the City s management believes that the transfers of these assets were valid, management is aware that it is possible that some, or all, of the transfers will need to be repaid to the successor agency. Since management is unable to determine what, if any, of the $14.8 million will need to be repaid to the successor agency, the City has not reported a liability in the fund statements or entitywide statements as of June 30, SUCCESSOR AGENCY TRUST FOR ASSETS OF FORMER REDEVELOPMENT AGENCY On December 29, 2011, the California Supreme Court upheld Assembly Bill 1X 27 (the Bill), which provides for the dissolution of all redevelopment agencies in the State of California. This action impacted the reporting entity of the City that had previously reported a redevelopment agency within the reporting entity of the City as a blended component unit. The Bill provides that upon dissolution of a redevelopment agency, either the city or another unit of local government will agree to serve as the successor agency to hold the assets until they are distributed to other units of state and local government. On January 24, 2012, the City Council elected to become the Successor Agency for the former redevelopment agency in accordance with the Bill as part of the City Resolution No Each year, successor agencies will only be allocated revenue in the amount that is necessary to pay the estimated annual installment payments on enforceable obligations of the former redevelopment agency until all enforceable obligations of the prior redevelopment agency have been paid in full and all assets have been liquidated. 71
92 Notes to Financial Statements 22. SUCCESSOR AGENCY TRUST FOR ASSETS OF FORMER REDEVELOPMENT AGENCY (Continued) A. Cash and Investments The balance of cash and investments at June 30, 2014 is classified in the accompanying financial statements as follows: RDA Successor Agency Cash and investments pooled with City $ 1,612,236 Restricted: Cash and investments 3,494 Cash and investments with fiscal agent 1,165,418 Total $ 2,781,148 B. Land Held for Resale As of June 30, 2014, the City has $1,011,031 of land held for resale, which is reported at fair value. There were no changes in fair value during the current year. C. Capital Assets Balance Balance July 1, 2013 Additions Deletions Transfers June 30, 2014 RDA Successor Agency: Non-depreciable assets: Land $ 532,878 $ - $ - $ - $ 532,878 Construction in progress 393, (393,341) - Total non-depreciable assets 926, (393,341) 532,878 Depreciable assets: Site improvements 110, ,310 Infrastructure 3,894, ,341 4,287,341 Total depreciable assets 4,004, ,341 4,397,651 Less accumulated depreciation: Site improvements (6,618) (4,413) - - (11,031) Infrastructure (223,857) (85,747) - - (309,604) Total accumulated depreciation (230,475) (90,160) - - (320,635) Total depreciable assets, net 3,773,835 (90,160) - 393,341 4,077,016 Total capital assets, net $ 4,700,054 $ (90,160) $ - $ - $ 4,609,894 The total depreciation expense charged to the RDA Successor Agency as of June 30, 2014 was $90,
93 Notes to Financial Statements 22. SUCCESSOR AGENCY TRUST FOR ASSETS OF FORMER REDEVELOPMENT AGENCY (Continued) D. Long-Term Debt Classification Balance Balance Due Within Due More July 1, 2013 Additions Deletions June 30, 2014 One Year Than One Year RDA Successor Agency: Loans from the City of Santa Clarita $ 13,360,087 $ 33,381 $ - $ 13,393,468 $ - $ 13,393,468 Tax Allocation Bonds: Series ,155,000 - (470,000) 27,685, ,000 27,195,000 Housing Set-Aside 8,345,000 - (140,000) 8,205, ,000 8,060,000 Less deferred amounts for issuance discounts (138,256) 5,530 - (132,726) (5,530) (127,196) Total Tax Allocation Bonds 36,361,744 5,530 (610,000) 35,757, ,470 35,127,804 Total $ 49,721,831 $ 38,911 $ (610,000) $ 49,150,742 $ 629,470 $ 48,521,272 Loans from the City of Santa Clarita The City of Santa Clarita advanced the former redevelopment agency a total of $13,360,087. As part of the dissolution of the former redevelopment agency, the outstanding advances from the City were required to be revalued using LAIF interest rates. At June 30, 2014, there are various promissory notes outstanding between the City and the former redevelopment agency entered into between the periods of July 1996 and June These consist of notes outstanding from the General Fund and the Developer Fees Special Revenue Fund accumulated to $7,903,770 and $5,489,698, respectively. The unpaid accrued interest of these notes is $890,974 and $169,812, respectively. Payments on these notes have been suspended pursuant to the State legislation AB Tax Allocation Bonds The former redevelopment agency issued Tax Allocation Bonds, which are special obligations of the Successor Agency secured by pledged property tax revenues. The bonds are not a debt of the City and are not payable out of any funds or properties other than those of the Successor Agency. Tax Allocation Bonds Series 2008 On June 12, 2008, the former redevelopment agency issued the Santa Clarita Redevelopment Agency Tax Allocation Bonds, Series 2008, in the amount of $29,860,000. Proceeds of the bonds were used to finance certain projects of the former redevelopment agency, fund a debt service reserve account, and pay for costs of the bond issuance. The bonds were issued at a net discount of $165,906, which will be amortized and recognized as interest expense over the life of the debt on a straight-line basis. This bond issue comprises $12,065,000 serial bonds maturing annually, commencing on October 1, 2011, through 2028, and three term bonds (totaling $17,795,000) maturing on October 1, 2032, October 1, 2037 and October 1, 2042, that are payable in annual sinking fund installments commencing on October 1, Interest on the bonds is payable semiannually on October 1 and April 1 at rates ranging from 4.00 percent to 4.75 percent for the serial bonds and from 4.75 percent to 5.00 percent for the term bonds. 73
94 Notes to Financial Statements 22. SUCCESSOR AGENCY TRUST FOR ASSETS OF FORMER REDEVELOPMENT AGENCY (Continued) D. Long-Term Debt (Continued) The annual debt service requirements on these bonds are as follows: Year Ending June 30, Principal Interest Total 2015 $ 490,000 $ 1,291,348 $ 1,781, ,000 1,271,348 1,781, ,000 1,250,548 1,780, ,000 1,228,948 1,778, ,000 1,206,448 1,781, ,230,000 5,651,066 8,881, ,005,000 4,849,191 8,854, ,050,000 3,783,053 8,833, ,395,000 2,404,775 8,799, ,350, ,250 7,004,250 Total $ 27,685,000 $ 23,590,975 $ 51,275,975 Tax Allocation Bonds Housing Set-Aside On June 12, 2008, the former redevelopment agency issued the Santa Clarita Redevelopment Agency Housing Set-Aside Tax Allocation Bonds, Series 2008, in the amount of $8,850,000. Proceeds of the bonds were used to finance low- and moderate-income housing projects and programs, fund a reserve fund, and pay for costs of the bond issuance. The bond issue comprises $3,550,000 serial bonds maturing annually on October 1 through 2028, and three term bonds (totaling $5,300,000), maturing on October 1, 2032, October 1, 2037 and October 1, 2042, that are payable in annual sinking fund installments commencing on October 1, Interest on the bonds is payable semi-annually on October 1 and April 1 at rates ranging from 4.00 percent to percent for the serial bonds and at 5.00 percent for the term bonds. 74
95 Notes to Financial Statements 22. SUCCESSOR AGENCY TRUST FOR ASSETS OF FORMER REDEVELOPMENT AGENCY (Continued) D. Long-Term Debt (Continued) The annual debt service requirements on these bonds are as follows: Year Ending June 30, Principal Interest Total 2015 $ 145,000 $ 388,856 $ 533, , , , , , , , , , , , , ,000 1,707,825 2,652, ,180,000 1,471,122 2,651, ,500,000 1,145,000 2,645, ,905, ,375 2,626, ,895, ,375 2,090,375 Total $ 8,205,000 $ 7,123,877 $ 15,328,877 E. Deficit Net Position As of June 30, 2014, the RDA Successor Agency Private-Purpose Trust Fund had a deficit net position of $41,168,348. This will be reduced with future receipt of distributions from the Redevelopment Property Tax Trust Fund from the County and potential asset sales. 75
96 76
97 Schedule of Revenues, Expenditures and Changes in Fund Balance Budget and Actual General Fund Variance From Final Budget Original Final Positive/ Budget Budget Actual (Negative) Revenues Taxes $ 67,520,934 $ 69,765,855 $ 73,746,061 $ 3,980,206 Licenses and permits 3,618,826 4,340,251 5,366,972 1,026,721 Intergovernmental 244, , ,844 (426,950) Charges for services 6,880,110 7,261,325 8,801,042 1,539,717 Investment income 1,814,094 1,027,458 1,018,077 (9,381) Fines and forfeitures 519, , ,983 (28,017) Other revenue 45,000 46, ,995 88,995 Overhead reimbursement 3,550,200 3,550,200 - (3,550,200) Total revenues 84,192,264 87,286,883 89,907,974 2,621,091 Expenditures Current: General government 15,327,489 17,615,329 14,211,854 3,403,475 Public safety 21,039,625 21,039,429 20,419, ,709 Parks, recreation and community service 20,697,152 21,040,180 20,319, ,986 Public works 13,223,354 14,389,118 11,566,617 2,822,501 Community development 5,819,794 5,969,023 5,461, ,667 Capital outlay 1,281,683 1,895,657 1,666, ,773 Total expenditures 77,389,097 81,948,736 73,645,625 8,303,111 Excess (deficiency) of revenues over (under) expenditures 6,803,167 5,338,147 16,262,349 10,924,202 Other financing sources (uses) Transfers in 2,167,287 2,582,196 2,647,420 65,224 Transfers out (4,213,439) (4,355,191) (4,355,191) - Total other financing sources (uses) (2,046,152) (1,772,995) (1,707,771) 65,224 Net change in fund balances $ 4,757,015 $ 3,565,152 14,554,578 $ 10,989,426 Fund balances, beginning of year 94,337,301 Fund balances, end of year $ 108,891,879 77
98 Schedule of Revenues, Expenditures and Changes in Fund Balance Budget and Actual Bridge and Thoroughfare Special Revenue Fund Variance From Final Budget Original Final Positive/ Budget Budget Actual (Negative) Revenues Investment income $ 321,258 $ 321,258 $ 332,294 $ 11,036 Developer fees 860,000 1,314,744 - (1,314,744) Total revenues 1,181,258 1,636, ,294 (1,303,708) Expenditures Current: Public works 199, , ,262 21,706 Capital outlay 4,519,239 15,006,053 14,154, ,560 Debt service: Interest and fiscal charges 241, , ,598 69,721 Total expenditures 4,960,402 15,448,340 14,505, ,987 Excess (deficiency) of revenues over (under) expenditures (3,779,144) (13,812,338) (14,173,059) (360,721) Other financing sources (uses) Transfers out (7,080) (75,807) (75,807) - Issuance of district credits - 5,014,275 11,297,334 6,283,059 Total other financing sources (uses) (7,080) 4,938,468 11,221,527 6,283,059 Net change in fund balances $ (3,786,224) $ (8,873,870) (2,951,532) $ 5,922,338 Fund balances, beginning of year 12,260,034 Fund balances, end of year $ 9,308,502 78
99 Schedule of Revenues, Expenditures and Changes in Fund Balance Budget and Actual Public Library Special Revenue Fund Variance From Final Budget Original Final Positive/ Budget Budget Actual (Negative) Revenues Taxes $ 5,454,474 $ 5,454,474 $ 5,143,664 $ (310,810) Charges for services 80,000 80,000 75,000 (5,000) Investment income - - 4,613 4,613 Other revenue 175, , ,516 3,516 Total revenues 5,709,474 5,709,474 5,401,793 (307,681) Expenditures Current: General government 4,804,983 4,804,888 4,680, ,251 Capital outlay - 662, , ,733 Debt service: Principal retirement 452, ,959 47, ,785 Interest and fiscal charges 104, ,945 95,352 9,593 Total expenditures 5,362,887 6,025,750 5,338, ,362 Excess (deficiency) of revenues over (under) expenditures 346,587 (316,276) 63, ,681 Other financing sources (uses) Transfers out (5,138) (5,138) (5,138) - Total other financing sources (uses) (5,138) (5,138) (5,138) - Net change in fund balances $ 341,449 $ (321,414) 58,267 $ 379,681 Fund balances (deficit), beginning of year (9,169,951) Fund balances (deficit), end of year $ (9,111,684) 79
100 Schedule of Revenues, Expenditures and Changes in Fund Balance Budget and Actual Landscape Maintenance District #1 Special Revenue Fund Variance From Final Budget Original Final Positive/ Budget Budget Actual (Negative) Revenues Taxes $ 768,043 $ 768,043 $ 837,266 $ 69,223 Special assessments 20,804,616 20,804,616 22,690,306 1,885,690 Investment income 157, , , ,125 Total revenues 21,729,829 21,729,829 23,832,867 2,103,038 Expenditures Current: General government 14,180,081 14,308,180 12,765,907 1,542,273 Capital outlay 8,840,317 14,676,500 8,447,530 6,228,970 Total expenditures 23,020,398 28,984,680 21,213,437 7,771,243 Excess (deficiency) of revenues over (under) expenditures (1,290,569) (7,254,851) 2,619,430 9,874,281 Other financing sources (uses) Transfers out (204,113) (204,113) (204,113) - Total other financing sources (uses) (204,113) (204,113) (204,113) - Net change in fund balances $ (1,494,682) $ (7,458,964) 2,415,317 $ 9,874,281 Fund balances, beginning of year 25,939,123 Fund balances, end of year $ 28,354,440 80
101 Schedule of Funding Progress The schedule of funding progress presents multiyear trend information that shows whether the actuarial value of plan assets is increasing or decreasing over time relative to the actuarial accrued liabilities for benefits. A. Defined Benefit Pension Plan The funded status of the City s defined benefit pension plan for the miscellaneous employees is as follows (in thousands): (A) (B) (C) (D) (E) (F) (Unfunded) (Unfunded) Actuarial Entry Age Actuarial Liability as Actuarial Actuarial Actuarial Accrued Funded Annual Percentage of Valuation Value of Accrued Liability Ratio Covered Covered Payroll Date* Assets (AVA) Liability [(B)-(A)] [(A)/(B)] Payroll [(C)/(E)] 6/30/2011 $ 82,323 $ 99,379 $ 17, % $ 25, % 6/30/ , ,652 17, % 24, % 6/30/ , ,474 29, % 26, % * Based on most recent actuarial valuation available. B. Other Post-Employment Benefits The funded status of the City s other post-employment benefits plan is as follows (in thousands): (A) (B) (C) (D) (E) (F) (Unfunded) (Unfunded) Actuarial Actuarial Actuarial Liability as Actuarial Actuarial Accrued Accrued Funded Percentage of Valuation Asset Liability Liability Ratio Covered Covered Payroll Date* Value Entry Age [(B)-(A)] [(A)/(B)] Payroll [(C)/(E)] 7/1/2006 $ - $ 24,046 $ (24,046) 0.00% $ 21, % 7/1/ ,425 (41,425) 0.00% 25, % 7/1/ ,928 30,879 (10,951) 64.54% 23, % * Based on most recent actuarial valuation available. 81
102 Notes to Required Supplementary Information BUDGETARY INFORMATION Annual budgets are legally adopted on a basis consistent with generally accepted accounting principles in the United States of America for the General Fund and each of the special revenue funds. All annual appropriations lapse at fiscal year-end. On or before the last day in January of each year, all operational units submit requests for appropriations to the city manager for budget preparation purposes. Before April 30, the proposed budget is presented to the City Council for review. The City Council holds public hearings and a final budget must be prepared and adopted no later than June 30. The appropriated budget is prepared by fund, function and department. The City s department heads, with approval of the city manager, may make transfers of appropriations within a department and between functions within a fund. The legal level of budgetary control (i.e., the level at which expenditures may not legally exceed appropriations) is the fund level. Under encumbrance accounting, purchase orders, contracts and other commitments for expenditures are recorded to reserve that portion of the applicable appropriation. Encumbrance accounting is employed as an extension of formal budgetary accounting. Since encumbrances do not yet constitute expenditures or liabilities, encumbrances outstanding at year-end are classified as either restricted, committed or assigned fund balances. Unexpended appropriations lapse at year-end. 82
103 Non-Major Governmental Funds As of and for the Year Ended June 30, 2014 The Special Revenue Funds are used to account for the proceeds of specific revenue sources that are legally restricted to expenditures for specific purposes. Developer Fees To account for monies received from developers restricted to fund specific projects and infrastructure maintenance throughout the City. Bikeway To account for monies received from the State of California restricted for bicycle and pedestrian facilities available under Article 3 of the Transportation Development Act (SB821). Gas Tax To account for monies received and expended from the state and county gas tax allocation restricted to fund various street highway improvements, including maintenance. Proposition A To account for the City s share of the one-half percent (0.5 percent) increased sales tax in Los Angeles County as a result of Proposition A. This revenue is to be used for transportationrelated purposes. Special Assessment To account for special assessments received for small assessment districts. These funds may be used for maintenance expenses within the districts. State Park To account for grant monies received from the State of California Department of Parks and Recreation for construction or improvements of parkland within the City. TDA (Transportation Development Act) To account for monies received from the State of California under Article 8 of the TDA. These funds may be used for local streets and road expenditures when the City s unmet transportation needs have been satisfied. Traffic Safety To account for monies received from vehicle code fines. This fund is used to finance law enforcement expenditures. CDBG (Community Development Block Grant) To account for Federal entitlements under the Housing and Community Development Act of 1974, as amended. The City Council annually allocates CDBG funds to various programs. AQMD (Air Quality Management District) To account for revenues and expenditures for Air Quality Management. Stormwater To account for monies received from assessments restricted for the use of the stormwater and run-off programs. Surface Transportation Program To account for receipts and disbursements associated with the Surface Transportation Program restricted for construction, reconstruction and improvement of highways and bridges on eligible Federal-Aid highway routes. BJA Law Enforcement To account for receipts and disbursements for the BJA law enforcement grant restricted for police department programs. Supplemental Law Grant To account for receipts and disbursements for the supplemental law grant restricted for police department programs. HOME To account for receipts and disbursements for the activity for the HOME grant program restricted to expand the supply of affordable housing for very low- and low-income families. 83
104 Non-Major Governmental Funds As of and for the Year Ended June 30, 2014 Special Revenue Funds (Continued) Library Facilities Fees To account for monies received from the library facilities developer fees, which are restricted for use on library facilities. Public Education and Government To account for the 1 percent PEG Capital Grant funds received from video service providers pursuant to the Digital Infrastructure and Video Competition Act of Proposition C To account for the City s share of the one-half percent (0.5 percent) increased sales tax in Los Angeles County as a result of Proposition C. This revenue is to be used for transportationrelated purposes. Federal Grants To account for receipts and disbursements of miscellaneous federal grant monies not accounted for in other funds. These receipts are restricted for planning, design, improvements and maintenance of streets, roads and bridges, facility construction and improvements, transit operations and other transit-related expenditures. Measure R To account for the half-cent sales tax revenues that Los Angeles County voters approved in November 2008 to meet the transportation needs of Los Angeles County. Tourism Marketing District To account for receipts and disbursements associated with promoting local businesses and tourism in the City of Santa Clarita through the Tourism Marketing District. The Tourism Marketing District was formed to provide financing for public programs to attract tourist visits to areas where tourism is economically important and desired. The Tourism Marketing District was established and is levied pursuant to the Parking and Business Improvement Area Law of 1989, Part 6 of Division 18 of the California Streets and Highways Code (the 1989 Law) and the provisions of the California Constitution Article XIIID (Proposition 218). OPSD (Open Space Preservation District) To account for monies received from special assessments for the costs of acquiring open space lands, parks and parkland in accordance with the City s programs. Miscellaneous Grants To account for receipts and disbursements of non-federal miscellaneous grants, which are restricted for planning, design, improvements and maintenance of streets, roads and bridges, facility construction and improvements, transit operations and other transit-related expenditures. Park Dedication This fund accounts for monies received from developers restricted to finance the acquisition and develop new parkland space. These monies are restricted under the Quimby Act by ordinance and require the dedication of land or impose a requirement of the payment of fee in lieu. Housing Successor Agency To account for the transactions of the Housing Successor Agency for the continuation of the low- and moderate-income programs of the former redevelopment agency. Tourism Marketing Bureau To account for monies received from local and regional tourism-related organizations restricted for tourism and business development within the City s boundaries. 84
105 Non-Major Governmental Funds As of and for the Year Ended June 30, 2014 The Capital Projects Funds are used to account for the acquisition or construction of the City s major capital facilities, other than those financed by proprietary funds. General Capital Projects To account for major capital improvement projects not accounted for in other funds. Public Financing Authority To account for the construction of all capital projects that utilize public financing authority funds. The Debt Service Funds are used to account for the accumulation of resources for, and payment of, interest and principal on general long-term debt. Public Financing Authority To account for principal and interest payments for obligations issued by the Santa Clarita Public Financing Authority. 85
106 Combining Balance Sheet Non-Major Governmental Funds June 30, 2014 Special Revenue Funds Developer Fees Bikeway Gas Tax Proposition A Assets Cash and investments $ 5,094,335 $ 116,527 $ 2,807,787 $ 902 Receivables: Accounts, net ,614 - Interest 11, ,039 2 Taxes Loans Notes to RDA Successor Agency 5,489, Allowance for doubtful accounts (5,489,698) Prepaid costs Due from other governments ,796 - Advances to other funds 117, Land held for resale 249, Restricted assets: Cash and investments Cash and investments with fiscal agents Total assets $ 5,473,227 $ 116,791 $ 3,428,236 $ 904 Liabilities, deferred inflows of resources and fund balances Liabilities Accounts payable and accrued liabilities $ 1,368,940 $ 39,248 $ 280,892 $ 910 Due to other funds Total liabilities 1,368,940 39, , Deferred inflows of resources Unavailable revenues 117, Total deferred inflows of resources 117, Fund balances (deficit) Nonspendable 249, Restricted 3,121,772 77,543 3,147,344 - Committed 612, Assigned 2, Unassigned (6) Total fund balances (deficit) 3,986,464 77,543 3,147,344 (6) Total liabilities, deferred inflow of resources and fund balances $ 5,473,227 $ 116,791 $ 3,428,236 $
107 Combining Balance Sheet Non-Major Governmental Funds June 30, 2014 Special Revenue Funds Special Assessment State Park TDA Traffic Safety Assets Cash and investments $ 5,348,758 $ - $ 7,366,813 $ - Receivables: Accounts, net 14, Interest 12,971-16,716 - Taxes 84, ,983 Loans Notes to RDA Successor Agency Allowance for doubtful accounts Prepaid costs 20, Due from other governments - 314, ,225 - Advances to other funds Land held for resale Restricted assets: Cash and investments Cash and investments with fiscal agents Total assets $ 5,481,579 $ 314,902 $ 7,926,754 $ 73,983 Liabilities, deferred inflows of resources and fund balances Liabilities Accounts payable and accrued liabilities $ 442,932 $ 6,976 $ 742,892 $ - Due to other funds - 307,926-73,513 Total liabilities 442, , ,892 73,513 Deferred inflows of resources Unavailable revenues Total deferred inflows of resources Fund balances (deficit) Nonspendable 20, Restricted 5,018,043-7,183, Committed Assigned Unassigned Total fund balances (deficit) 5,038,647-7,183, Total liabilities, deferred inflow of resources and fund balances $ 5,481,579 $ 314,902 $ 7,926,754 $ 73,983 (Continued) 87
108 Combining Balance Sheet Non-Major Governmental Funds June 30, 2014 Special Revenue Funds Surface Transportation CDBG AQMD Stormwater Program Assets Cash and investments $ - $ 201,531 $ 5,842,327 $ - Receivables: Accounts, net ,405 - Interest ,211 - Taxes ,378 - Loans 149, Notes to RDA Successor Agency Allowance for doubtful accounts Prepaid costs Due from other governments 164,980 66, ,495 18,271 Advances to other funds Land held for resale Restricted assets: Cash and investments Cash and investments with fiscal agents Total assets $ 314,214 $ 268,015 $ 6,244,816 $ 18,271 Liabilities, deferred inflows of resources and fund balances Liabilities Accounts payable and accrued liabilities $ 110,612 $ 199 $ 286,818 $ 16,672 Due to other funds 54, ,599 Total liabilities 164, ,818 18,271 Deferred inflows of resources Unavailable revenues 149, Total deferred inflows of resources 149, Fund balances (deficit) Nonspendable Restricted - 267,816 5,957,998 - Committed Assigned Unassigned Total fund balances (deficit) - 267,816 5,957,998 - Total liabilities, deferred inflow of resources and fund balances $ 314,214 $ 268,015 $ 6,244,816 $ 18,271 88
109 Combining Balance Sheet Non-Major Governmental Funds June 30, 2014 Special Revenue Funds BJA Law Supplemental Library Enforcement Law Grant HOME Facilities Fees Assets Cash and investments $ - $ - $ - $ 156,945 Receivables: Accounts, net Interest Taxes Loans - - 2,275,743 - Notes to RDA Successor Agency Allowance for doubtful accounts Prepaid costs Due from other governments 8, , Advances to other funds Land held for resale Restricted assets: Cash and investments Cash and investments with fiscal agents Total assets $ 8,697 $ 105,582 $ 2,275,743 $ 157,301 Liabilities, deferred inflows of resources and fund balances Liabilities Accounts payable and accrued liabilities $ 3,213 $ 7,059 $ - $ - Due to other funds 6,330 80, Total liabilities 9,543 87, Deferred inflows of resources Unavailable revenues - - 2,275,743 - Total deferred inflows of resources - - 2,275,743 - Fund balances (deficit) Nonspendable Restricted - 18, ,301 Committed Assigned Unassigned (846) Total fund balances (deficit) (846) 18, ,301 Total liabilities, deferred inflow of resources and fund balances $ 8,697 $ 105,582 $ 2,275,743 $ 157,301 (Continued) 89
110 Combining Balance Sheet Non-Major Governmental Funds June 30, 2014 Special Revenue Funds Public Education and Government Proposition C Federal Grants Measure R Assets Cash and investments $ 992,701 $ 2,170,070 $ 137,254 $ 2,309,392 Receivables: Accounts, net Interest 2,252 4,924-5,240 Taxes 122, Loans Notes to RDA Successor Agency Allowance for doubtful accounts Prepaid costs Due from other governments - 1,880, ,058 - Advances to other funds Land held for resale Restricted assets: Cash and investments Cash and investments with fiscal agents Total assets $ 1,117,718 $ 4,055,754 $ 909,312 $ 2,314,632 Liabilities, deferred inflows of resources and fund balances Liabilities Accounts payable and accrued liabilities $ 3,701 $ 348,516 $ 466,952 $ - Due to other funds - 1,532, Total liabilities 3,701 1,880, ,952 - Deferred inflows of resources Unavailable revenues - 1,003, ,528 - Total deferred inflows of resources - 1,003, ,528 - Fund balances (deficit) Nonspendable Restricted 1,114,017 1,171, ,832 2,314,632 Committed Assigned Unassigned Total fund balances (deficit) 1,114,017 1,171, ,832 2,314,632 Total liabilities, deferred inflow of resources and fund balances $ 1,117,718 $ 4,055,754 $ 909,312 $ 2,314,632 90
111 Combining Balance Sheet Non-Major Governmental Funds June 30, 2014 Special Revenue Funds Tourism Marketing Miscellaneous Park District OSPD Grants Dedication Assets Cash and investments $ 337,227 $ 5,685,237 $ - $ 56,493 Receivables: Accounts, net - 6, Interest , Taxes 64,264 25, Loans Notes to RDA Successor Agency Allowance for doubtful accounts Prepaid costs Due from other governments ,265 - Advances to other funds Land held for resale Restricted assets: Cash and investments - 4,695, Cash and investments with fiscal agents - 1,322, Total assets $ 402,256 $ 11,747,762 $ 514,265 $ 56,621 Liabilities, deferred inflows of resources and fund balances Liabilities Accounts payable and accrued liabilities $ 12,238 $ 38,424 $ 167,438 $ 9,072 Due to other funds ,923 - Total liabilities 12,238 38, ,361 9,072 Deferred inflows of resources Unavailable revenues ,015 - Total deferred inflows of resources ,015 - Fund balances (deficit) Nonspendable Restricted 390,018 11,709,338-47,549 Committed Assigned Unassigned - - (188,111) - Total fund balances (deficit) 390,018 11,709,338 (188,111) 47,549 Total liabilities, deferred inflow of resources and fund balances $ 402,256 $ 11,747,762 $ 514,265 $ 56,621 (Continued) 91
112 Combining Balance Sheet Non-Major Governmental Funds June 30, 2014 Special Revenue Funds Capital Projects Funds Housing Tourism General Public Successor Marketing Capital Financing Agency Bureau Projects Authority Assets Cash and investments $ - $ 39,612 $ 4,139,505 $ 10 Receivables: Accounts, net Interest Taxes Loans Notes to RDA Successor Agency Allowance for doubtful accounts Prepaid costs Due from other governments Advances to other funds Land held for resale 939, Restricted assets: Cash and investments 4,006, Cash and investments with fiscal agents Total assets $ 4,945,845 $ 39,702 $ 4,139,505 $ 10 Liabilities, deferred inflows of resources and fund balances Liabilities Accounts payable and accrued liabilities $ - $ - $ 729,741 $ - Due to other funds Total liabilities ,741 - Deferred inflows of resources Unavailable revenues Total deferred inflows of resources Fund balances (deficit) Nonspendable Restricted 4,945,845 39, Committed Assigned - - 3,409, Unassigned Total fund balances (deficit) 4,945,845 39,702 3,409, Total liabilities, deferred inflow of resources and fund balances $ 4,945,845 $ 39,702 $ 4,139,505 $ 10 92
113 Combining Balance Sheet Non-Major Governmental Funds June 30, 2014 Debt Service Funds Public Total Financing Governmental Authority Funds Assets Cash and investments $ 2 $ 42,803,428 Receivables: Accounts, net - 75,405 Interest - 87,787 Taxes - 419,537 Loans - 2,424,977 Notes to RDA Successor Agency - 5,489,698 Allowance for doubtful accounts - (5,489,698) Prepaid costs - 20,604 Due from other governments - 5,290,058 Advances to other funds - 117,823 Land held for resale - 1,188,969 Restricted assets: Cash and investments - 8,701,807 Cash and investments with fiscal agents 184 1,322,188 Total assets $ 186 $ 62,452,583 Liabilities, deferred inflows of resources and fund balances Liabilities Accounts payable and accrued liabilities $ - $ 5,083,445 Due to other funds - 2,274,080 Total liabilities - 7,357,525 Deferred inflows of resources Unavailable revenues - 4,046,291 Total deferred inflows of resources - 4,046,291 Fund balances (deficit) Nonspendable - 270,114 Restricted ,942,660 Committed - 612,829 Assigned - 3,412,127 Unassigned - (188,963) Total fund balances (deficit) ,048,767 Total liabilities, deferred inflow of resources and fund balances $ 186 $ 62,452,583 93
114 Combining Statement of Revenues, Expenditures and Changes in Fund Balances Non-Major Governmental Funds Special Revenue Funds Developer Fees Bikeway Gas Tax Proposition A Revenues Taxes $ - $ - $ - $ - Special assessments Intergovernmental - 118,093 6,318,767 3,478,386 Charges for services Investment income (loss) 20, ,971 4,691 Fines and forfeitures Developer fees 2,335, Other revenue ,810 - Total revenues 2,355, ,573 6,357,548 3,483,077 Expenditures Current: General government Public safety 1,311, Parks, recreation and community service Public works - - 4,026,807 34,034 Community development Capital outlay 327, , ,172 94,014 Debt service: Principal Interest and fiscal charges Total expenditures 1,638, ,964 4,718, ,048 Excess (deficiency) of revenues over (under) expenditures 716,955 (5,391) 1,638,569 3,355,029 Other financing sources (uses) Transfers in 125, ,070 - Transfers out (187,440) - (191,948) (4,177,523) Total other financing sources (uses) (61,937) - 41,122 (4,177,523) Net change in fund balances 655,018 (5,391) 1,679,691 (822,494) Fund balances (deficit), beginning of year 3,331,446 82,934 1,467, ,488 Fund balances (deficit), end of year $ 3,986,464 $ 77,543 $ 3,147,344 $ (6) 94
115 Combining Statement of Revenues, Expenditures and Changes in Fund Balances Non-Major Governmental Funds Special Revenue Funds Special Assessment State Park TDA Traffic Safety Revenues Taxes $ - $ - $ - $ - Special assessments 4,978, Intergovernmental - 170,914 9,957,849 - Charges for services Investment income (loss) 60,629-15, Fines and forfeitures ,115,174 Developer fees Other revenue 69, Total revenues 5,108, ,914 9,973,209 1,115,644 Expenditures Current: General government 3,221, Public safety Parks, recreation and community service - 170, Public works 1,129,650-4,382,765 - Community development Capital outlay 37, ,456 - Debt service: Principal Interest and fiscal charges Total expenditures 4,388, ,914 4,772,221 - Excess (deficiency) of revenues over (under) expenditures 719,775-5,200,988 1,115,644 Other financing sources (uses) Transfers in 109,919 4, Transfers out (635,604) (5,666) - (1,115,174) Total other financing sources (uses) (525,685) (689) - (1,115,174) Net change in fund balances 194,090 (689) 5,200, Fund balances (deficit), beginning of year 4,844, ,982,874 - Fund balances (deficit), end of year $ 5,038,647 $ - $ 7,183,862 $ 470 (Continued) 95
116 Combining Statement of Revenues, Expenditures and Changes in Fund Balances Non-Major Governmental Funds Special Revenue Funds Surface Transportation CDBG AQMD Stormwater Program Revenues Taxes $ - $ - $ - $ - Special assessments - - 2,940,538 - Intergovernmental 977, , ,485 Charges for services Investment income (loss) ,924 - Fines and forfeitures Developer fees Other revenue ,065 - Total revenues 977, ,430 3,316, ,485 Expenditures Current: General government - - 3,909 - Public safety Parks, recreation and community service Public works - 18,287 2,904,828 - Community development 719, Capital outlay - 49, ,163 78,773 Debt service: Principal 230, Interest and fiscal charges 29, Total expenditures 979,010 67,947 3,786,900 78,773 Excess (deficiency) of revenues over (under) expenditures (1,809) 188,483 (470,373) 124,712 Other financing sources (uses) Transfers in ,420 - Transfers out - - (63,888) - Total other financing sources (uses) - - (40,468) - Net change in fund balances (1,809) 188,483 (510,841) 124,712 Fund balances (deficit), beginning of year 1,809 79,333 6,468,839 (124,712) Fund balances (deficit), end of year $ - $ 267,816 $ 5,957,998 $ - 96
117 Combining Statement of Revenues, Expenditures and Changes in Fund Balances Non-Major Governmental Funds Special Revenue Funds BJA Law Supplemental Library Enforcement Law Grant HOME Facilities Fees Revenues Taxes $ - $ - $ - $ - Special assessments Intergovernmental 19, ,380 4,046 - Charges for services Investment income (loss) (237) Fines and forfeitures Developer fees ,503 Other revenue Total revenues 19, ,380 4, ,266 Expenditures Current: General government Public safety 19, , Parks, recreation and community service Public works Community development - - 4,083 - Capital outlay Debt service: Principal Interest and fiscal charges Total expenditures 19, ,000 4,083 - Excess (deficiency) of revenues over (under) expenditures - 31,380 (37) 265,266 Other financing sources (uses) Transfers in Transfers out (109,731) Total other financing sources (uses) (109,731) Net change in fund balances - 31,380 (37) 155,535 Fund balances (deficit), beginning of year (846) (13,034) 37 1,766 Fund balances (deficit), end of year $ (846) $ 18,346 $ - $ 157,301 (Continued) 97
118 Combining Statement of Revenues, Expenditures and Changes in Fund Balances Non-Major Governmental Funds Special Revenue Funds Public Education and Federal Government Proposition C Grants Measure R Revenues Taxes $ 472,138 $ - $ - $ - Special assessments Intergovernmental - 5,716,298 2,789,477 2,153,225 Charges for services Investment income (loss) 8,978 (3,458) - (821) Fines and forfeitures Developer fees Other revenue Total revenues 481,116 5,712,840 2,789,477 2,152,404 Expenditures Current: General government 240, Public safety Parks, recreation and community service Public works - 1, Community development Capital outlay - 3,095,459 2,643,548 - Debt service: Principal Interest and fiscal charges Total expenditures 240,770 3,097,109 2,643,675 - Excess (deficiency) of revenues over (under) expenditures 240,346 2,615, ,802 2,152,404 Other financing sources (uses) Transfers in - - 1,050,123 - Transfers out - (1,740,227) - - Total other financing sources (uses) - (1,740,227) 1,050,123 - Net change in fund balances 240, ,504 1,195,925 2,152,404 Fund balances (deficit), beginning of year 873, ,542 (936,093) 162,228 Fund balances (deficit), end of year $ 1,114,017 $ 1,171,046 $ 259,832 $ 2,314,632 98
119 Combining Statement of Revenues, Expenditures and Changes in Fund Balances Non-Major Governmental Funds Special Revenue Funds Tourism Marketing Miscellaneous Park District OSPD Grants Dedication Revenues Taxes $ - $ - $ - $ - Special assessments - 2,143, Intergovernmental - - 1,626,238 - Charges for services 514, Investment income (loss) 2,241 50,624-1,977 Fines and forfeitures Developer fees Other revenue - 10, Total revenues 517,147 2,204,144 1,626,238 1,977 Expenditures Current: General government 312, , ,547 - Public safety ,897 - Parks, recreation and community service - - 8,000 - Public works ,965 - Community development Capital outlay - 34, , ,893 Debt service: Principal Interest and fiscal charges Total expenditures 312, ,591 1,393, ,893 Excess (deficiency) of revenues over (under) expenditures 205,091 1,818, ,770 (115,916) Other financing sources (uses) Transfers in - 40, Transfers out - (808,628) - - Total other financing sources (uses) - (768,146) - - Net change in fund balances 205,091 1,050, ,770 (115,916) Fund balances (deficit), beginning of year 184,927 10,658,931 (420,881) 163,465 Fund balances (deficit), end of year $ 390,018 $ 11,709,338 $ (188,111) $ 47,549 (Continued) 99
120 Combining Statement of Revenues, Expenditures and Changes in Fund Balances Non-Major Governmental Funds Special Revenue Funds Capital Projects Funds Housing Tourism General Public Successor Marketing Capital Financing Agency Bureau Projects Authority Revenues Taxes $ - $ - $ - $ - Special assessments Intergovernmental Charges for services - 13, Investment income (loss) Fines and forfeitures Developer fees Other revenue 5,056,509 81,614 86,634 - Total revenues 5,056,509 94,737 86,634 - Expenditures Current: General government - 55, Public safety Parks, recreation and community service Public works Community development Capital outlay - - 2,501,659 - Debt service: Principal Interest and fiscal charges Total expenditures - 55,035 2,501,659 - Excess (deficiency) of revenues over (under) expenditures 5,056,509 39,702 (2,415,025) - Other financing sources (uses) Transfers in - - 1,575, ,033 Transfers out (1,050,123) - - (798,297) Total other financing sources (uses) (1,050,123) - 1,575,064 (264) Net change in fund balances 4,006,386 39,702 (839,961) (264) Fund balances (deficit), beginning of year 939,459-4,249, Fund balances (deficit), end of year $ 4,945,845 $ 39,702 $ 3,409,764 $
121 Combining Statement of Revenues, Expenditures and Changes in Fund Balances Non-Major Governmental Funds Debt Service Funds Public Total Financing Governmental Authority Funds Revenues Taxes $ - $ 472,138 Special assessments - 10,062,299 Intergovernmental - 34,147,421 Charges for services - 527,935 Investment income (loss) ,212 Fines and forfeitures - 1,115,174 Developer fees - 2,600,997 Other revenue - 5,630,097 Total revenues ,807,273 Expenditures Current: General government - 4,635,807 Public safety - 1,717,618 Parks, recreation and community service - 178,914 Public works - 12,639,986 Community development - 723,907 Capital outlay - 11,796,457 Debt service: Principal 1,560,000 1,790,000 Interest and fiscal charges 1,589,277 1,618,596 Total expenditures 3,149,277 35,101,285 Excess (deficiency) of revenues over (under) expenditures (3,149,170) 19,705,988 Other financing sources (uses) Transfers in 3,149,436 7,110,027 Transfers out - (10,884,249) Total other financing sources (uses) 3,149,436 (3,774,222) Net change in fund balances ,931,766 Fund balances (deficit), beginning of year (80) 35,117,001 Fund balances (deficit), end of year $ 186 $ 51,048,
122 Schedule of Revenues, Expenditures and Changes in Fund Balance Budget and Actual Developer Fees Special Revenue Fund Variance From Final Budget Original Final Positive/ Budget Budget Actual (Negative) Revenues Investment income $ 10,549 $ 10,549 $ 20,329 $ 9,780 Developer fees 1,627,000 1,637,000 2,335, ,494 Total revenues 1,637,549 1,647,549 2,355, ,274 Expenditures Current: Public safety - 1,311,109 1,311,109 - Capital outlay 2,328,000 2,611, ,759 2,284,137 Total expenditures 2,328,000 3,923,005 1,638,868 2,284,137 Excess (deficiency) of revenues over (under) expenditures (690,451) (2,275,456) 716,955 2,992,411 Other financing sources (uses) Transfers in - 125, ,503 - Transfers out (16,000) (187,440) (187,440) - Total other financing sources (uses) (16,000) (61,937) (61,937) - Net change in fund balances $ (706,451) $ (2,337,393) 655,018 $ 2,992,411 Fund balances, beginning of year 3,331,446 Fund balances, end of year $ 3,986,
123 Schedule of Revenues, Expenditures and Changes in Fund Balance Budget and Actual Bikeway Special Revenue Fund Variance From Final Budget Original Final Positive/ Budget Budget Actual (Negative) Revenues Intergovernmental $ 134,541 $ 134,541 $ 118,093 $ (16,448) Investment income Total revenues 134, , ,573 (16,349) Expenditures Capital outlay 134, , ,964 87,584 Total expenditures 134, , ,964 87,584 Excess (deficiency) of revenues over (under) expenditures 381 (76,626) (5,391) 71,235 Net change in fund balances $ 381 $ (76,626) (5,391) $ 71,235 Fund balances, beginning of year 82,934 Fund balances, end of year $ 77,
124 Schedule of Revenues, Expenditures and Changes in Fund Balance Budget and Actual Gas Tax Special Revenue Fund Variance From Final Budget Original Final Positive/ Budget Budget Actual (Negative) Revenues Intergovernmental $ 5,320,189 $ 5,320,189 $ 6,318,767 $ 998,578 Investment income 14,628 14,628 11,971 (2,657) Other revenue ,810 26,810 Total revenues 5,334,817 5,334,817 6,357,548 1,022,731 Expenditures Current: Public works 4,021,355 4,067,774 4,026,807 40,967 Capital outlay 1,787,409 2,374, ,172 1,682,033 Total expenditures 5,808,764 6,441,979 4,718,979 1,723,000 Excess (deficiency) of revenues over (under) expenditures (473,947) (1,107,162) 1,638,569 2,745,731 Other financing sources (uses) Transfers in 233, , ,070 - Transfers out (411,358) (191,948) (191,948) - Total other financing sources (uses) (178,288) 41,122 41,122 - Net change in fund balances $ (652,235) $ (1,066,040) 1,679,691 $ 2,745,731 Fund balances, beginning of year 1,467,653 Fund balances, end of year $ 3,147,
125 Schedule of Revenues, Expenditures and Changes in Fund Balance Budget and Actual Proposition A Special Revenue Fund Variance From Final Budget Original Final Positive/ Budget Budget Actual (Negative) Revenues Intergovernmental $ 3,020,268 $ 3,462,710 $ 3,478,386 $ 15,676 Investment income - - 4,691 4,691 Total revenues 3,020,268 3,462,710 3,483,077 20,367 Expenditures Current: Public works 35,170 35,170 34,034 1,136 Capital outlay 93, ,174 94,014 18,160 Total expenditures 128, , ,048 19,296 Excess (deficiency) of revenues over (under) expenditures 2,891,830 3,315,366 3,355,029 39,663 Other financing sources (uses) Transfers out (2,891,830) (4,144,746) (4,177,523) (32,777) Total other financing sources (uses) (2,891,830) (4,144,746) (4,177,523) (32,777) Net change in fund balances $ - $ (829,380) (822,494) $ 6,886 Fund balances, beginning of year 822,488 Fund balances (deficit), end of year $ (6) 105
126 Schedule of Revenues, Expenditures and Changes in Fund Balance Budget and Actual Special Assessment Special Revenue Fund Variance From Final Budget Original Final Positive/ Budget Budget Actual (Negative) Revenues Special assessments $ 4,824,283 $ 4,824,283 $ 4,978,241 $ 153,958 Charges for services 5, ,000 - (165,000) Investment income 25,946 25,946 60,629 34,683 Other revenue ,465 69,465 Total revenues 4,855,229 5,015,229 5,108,335 93,106 Expenditures Current: General government 3,911,110 3,913,747 3,221, ,715 Public works 1,414,810 1,388,278 1,129, ,628 Capital outlay 4, ,413 37,878 81,535 Total expenditures 5,329,920 5,421,438 4,388,560 1,032,878 Excess (deficiency) of revenues over (under) expenditures (474,691) (406,209) 719,775 1,125,984 Other financing sources (uses) Transfers in 106, , ,919 - Transfers out (17,179) (635,554) (635,604) (50) Total other financing sources (uses) 89,241 (525,635) (525,685) (50) Net change in fund balances $ (385,450) $ (931,844) 194,090 $ 1,125,934 Fund balances, beginning of year 4,844,557 Fund balances, end of year $ 5,038,
127 Schedule of Revenues, Expenditures and Changes in Fund Balance Budget and Actual State Park Special Revenue Fund Variance From Final Budget Original Final Positive/ Budget Budget Actual (Negative) Revenues Intergovernmental $ 180,401 $ 183,682 $ 170,914 $ (12,768) Total revenues 180, , ,914 (12,768) Expenditures Current: Parks, recreation and community service 180, , , Total expenditures 180, , , Excess (deficiency) of revenues over (under) expenditures - 11,843 - (11,843) Other financing sources (uses) Transfers in - 4,977 4,977 - Transfers out - (5,666) (5,666) - Total other financing sources (uses) - (689) (689) - Net change in fund balances $ - $ 11,154 (689) $ (11,843) Fund balances, beginning of year 689 Fund balances, end of year $ - 107
128 Schedule of Revenues, Expenditures and Changes in Fund Balance Budget and Actual TDA Special Revenue Fund Variance From Final Budget Original Final Positive/ Budget Budget Actual (Negative) Revenues Intergovernmental $ 7,175,422 $ 10,597,117 $ 9,957,849 $ (639,268) Investment income ,360 15,360 Total revenues 7,175,422 10,597,117 9,973,209 (623,908) Expenditures Current: Public works 1,910 4,491,577 4,382, ,812 Capital outlay 6,946,600 8,088, ,456 7,698,957 Total expenditures 6,948,510 12,579,990 4,772,221 7,807,769 Excess (deficiency) of revenues over (under) expenditures 226,912 (1,982,873) 5,200,988 7,183,861 Other financing sources (uses) Transfers out (228,822) Total other financing sources (uses) (228,822) Net change in fund balances $ (1,910) $ (1,982,873) 5,200,988 $ 7,183,861 Fund balances, beginning of year 1,982,874 Fund balances, end of year $ 7,183,
129 Schedule of Revenues, Expenditures and Changes in Fund Balance Budget and Actual Traffic Safety Special Revenue Fund Variance From Final Budget Original Final Positive/ Budget Budget Actual (Negative) Revenues Investment income $ 377 $ 377 $ 470 $ 93 Fines and forfeitures 1,275,000 1,275,000 1,115,174 (159,826) Total revenues 1,275,377 1,275,377 1,115,644 (159,733) Other financing sources (uses) Transfers out (1,275,377) (1,050,000) (1,115,174) (65,174) Total other financing sources (uses) (1,275,377) (1,050,000) (1,115,174) (65,174) Net change in fund balances $ - $ 225, $ (224,907) Fund balances, beginning of year - Fund balances, end of year $
130 Schedule of Revenues, Expenditures and Changes in Fund Balance Budget and Actual CDBG Special Revenue Fund Variance From Final Budget Original Final Positive/ Budget Budget Actual (Negative) Revenues Intergovernmental $ 671,029 $ 1,187,180 $ 977,201 $ (209,979) Total revenues 671,029 1,187, ,201 (209,979) Expenditures Current: Community development 411, , , ,148 Debt service: Principal retirement 230, , ,000 - Interest and fiscal charges 29,186 29,186 29,186 - Total expenditures 671,029 1,215, , ,148 Excess (deficiency) of revenues over (under) expenditures - (27,978) (1,809) 26,169 Net change in fund balances $ - $ (27,978) (1,809) $ 26,169 Fund balances, beginning of year 1,809 Fund balances, end of year $ - 110
131 Schedule of Revenues, Expenditures and Changes in Fund Balance Budget and Actual AQMD Special Revenue Fund Variance From Final Budget Original Final Positive/ Budget Budget Actual (Negative) Revenues Intergovernmental $ 206,367 $ 206,367 $ 255,577 $ 49,210 Investment income Total revenues 206, , ,430 49,605 Expenditures Current: Public works 32,370 33,996 18,287 15,709 Capital outlay 19,000 49,660 49,660 - Total expenditures 51,370 83,656 67,947 15,709 Excess (deficiency) of revenues over (under) expenditures 155, , ,483 65,314 Other financing sources (uses) Transfers out (155,455) Total other financing sources (uses) (155,455) Net change in fund balances $ - $ 123, ,483 $ 65,314 Fund balances, beginning of year 79,333 Fund balances, end of year $ 267,
132 Schedule of Revenues, Expenditures and Changes in Fund Balance Budget and Actual Stormwater Special Revenue Fund Variance From Final Budget Original Final Positive/ Budget Budget Actual (Negative) Revenues Special assessments $ 3,139,500 $ 3,139,500 $ 2,940,538 $ (198,962) Investment income 97,255 97,255 76,924 (20,331) Other revenue - 199, , ,002 Total revenues 3,236,755 3,435,818 3,316,527 (119,291) Expenditures Current: General government 12,000 12,000 3,909 8,091 Public works 2,539,640 3,478,095 2,904, ,267 Capital outlay 511,000 1,128, , ,173 Total expenditures 3,062,640 4,618,431 3,786, ,531 Excess (deficiency) of revenues over (under) expenditures 174,115 (1,182,613) (470,373) 712,240 Other financing sources (uses) Transfers in 32,660 23,420 23,420 - Transfers out (68,738) (63,888) (63,888) - Total other financing sources (uses) (36,078) (40,468) (40,468) - Net change in fund balances $ 138,037 $ (1,223,081) (510,841) $ 712,240 Fund balances, beginning of year 6,468,839 Fund balances, end of year $ 5,957,
133 Schedule of Revenues, Expenditures and Changes in Fund Balance Budget and Actual Surface Transportation Program Special Revenue Fund Variance From Final Budget Original Final Positive/ Budget Budget Actual (Negative) Revenues Intergovernmental $ 535,400 $ 595,902 $ 203,485 $ (392,417) Total revenues 535, , ,485 (392,417) Expenditures Capital outlay 535,400 2,129,221 78,773 2,050,448 Total expenditures 535,400 2,129,221 78,773 2,050,448 Excess (deficiency) of revenues over (under) expenditures - (1,533,319) 124,712 1,658,031 Net change in fund balances $ - $ (1,533,319) 124,712 $ 1,658,031 Fund balances (deficit), beginning of year (124,712) Fund balances, end of year $ - 113
134 Schedule of Revenues, Expenditures and Changes in Fund Balance Budget and Actual BJA Law Enforcement Special Revenue Fund Variance From Final Budget Original Final Positive/ Budget Budget Actual (Negative) Revenues Intergovernmental $ - $ 70,209 $ 19,485 $ (50,724) Total revenues - 70,209 19,485 (50,724) Expenditures Current: Public safety - 70,209 19,485 50,724 Total expenditures - 70,209 19,485 50,724 Excess (deficiency) of revenues over (under) expenditures Net change in fund balances $ - $ - - $ - Fund balances (deficit), beginning of year (846) Fund balances (deficit), end of year $ (846) 114
135 Schedule of Revenues, Expenditures and Changes in Fund Balance Budget and Actual Supplemental Law Grant Special Revenue Fund Variance From Final Budget Original Final Positive/ Budget Budget Actual (Negative) Revenues Intergovernmental $ - $ 354,291 $ 358,380 $ 4,089 Total revenues - 354, ,380 4,089 Expenditures Current: Public safety - 341, ,000 14,257 Total expenditures - 341, ,000 14,257 Excess (deficiency) of revenues over (under) expenditures - 13,034 31,380 18,346 Net change in fund balances $ - $ 13,034 31,380 $ 18,346 Fund balances (deficit), beginning of year (13,034) Fund balances, end of year $ 18,
136 Schedule of Revenues, Expenditures and Changes in Fund Balance Budget and Actual HOME Special Revenue Fund Variance From Final Budget Original Final Positive/ Budget Budget Actual (Negative) Revenues Intergovernmental $ - $ 498,698 $ 4,046 $ (494,652) Total revenues - 498,698 4,046 (494,652) Expenditures Current: Community development 23, ,823 4, ,740 Total expenditures 23, ,823 4, ,740 Excess (deficiency) of revenues over (under) expenditures (23,823) (10,125) (37) 10,088 Net change in fund balances $ (23,823) $ (10,125) (37) $ 10,088 Fund balances, beginning of year 37 Fund balances, end of year $ - 116
137 Schedule of Revenues, Expenditures and Changes in Fund Balance Budget and Actual Library Facilities Fees Special Revenue Fund Variance From Final Budget Original Final Positive/ Budget Budget Actual (Negative) Revenues Investment income $ - $ - $ (237) $ (237) Developer fees 35,000 35, , ,503 Total revenues 35,000 35, , ,266 Other financing sources (uses) Transfers out (35,000) (109,731) (109,731) - Total other financing sources (uses) (35,000) (109,731) (109,731) - Net change in fund balances $ - $ (74,731) 155,535 $ 230,266 Fund balances, beginning of year 1,766 Fund balances, end of year $ 157,
138 Schedule of Revenues, Expenditures and Changes in Fund Balance Budget and Actual Public Education and Government Special Revenue Fund Variance From Final Budget Original Final Positive/ Budget Budget Actual (Negative) Revenues Taxes $ 450,000 $ 450,000 $ 472,138 $ 22,138 Investment income 7,200 7,200 8,978 1,778 Total revenues 457, , ,116 23,916 Expenditures Current: General government 254, , ,770 13,739 Total expenditures 254, , ,770 13,739 Excess (deficiency) of revenues over (under) expenditures 202, , ,346 37,655 Net change in fund balances $ 202,691 $ 202, ,346 $ 37,655 Fund balances, beginning of year 873,671 Fund balances, end of year $ 1,114,
139 Schedule of Revenues, Expenditures and Changes in Fund Balance Budget and Actual Proposition C Special Revenue Fund Variance From Final Budget Original Final Positive/ Budget Budget Actual (Negative) Revenues Intergovernmental $ 6,424,681 $ 11,290,061 $ 5,716,298 $ (5,573,763) Investment income - - (3,458) (3,458) Total revenues 6,424,681 11,290,061 5,712,840 (5,577,221) Expenditures Current: Public works 1,650 1,650 1,650 - Capital outlay 3,919,448 8,464,650 3,095,459 5,369,191 Total expenditures 3,921,098 8,466,300 3,097,109 5,369,191 Excess (deficiency) of revenues over (under) expenditures 2,503,583 2,823,761 2,615,731 (208,030) Other financing sources (uses) Transfers out (2,503,583) (2,895,808) (1,740,227) 1,155,581 Total other financing sources (uses) (2,503,583) (2,895,808) (1,740,227) 1,155,581 Net change in fund balances $ - $ (72,047) 875,504 $ 947,551 Fund balances, beginning of year 295,542 Fund balances, end of year $ 1,171,
140 Schedule of Revenues, Expenditures and Changes in Fund Balance Budget and Actual Federal Grants Special Revenue Fund Variance From Final Budget Original Final Positive/ Budget Budget Actual (Negative) Revenues Intergovernmental $ 3,724,056 $ 7,434,703 $ 2,789,477 $ (4,645,226) Total revenues 3,724,056 7,434,703 2,789,477 (4,645,226) Expenditures Current: Public safety - 10, ,178 Capital outlay 3,724,056 7,439,976 2,643,548 4,796,428 Total expenditures 3,724,056 7,450,281 2,643,675 4,806,606 Excess (deficiency) of revenues over (under) expenditures - (15,578) 145, ,380 Other financing sources (uses) Transfers in - 1,050,123 1,050,123 - Total other financing sources (uses) - 1,050,123 1,050,123 - Net change in fund balances $ - $ 1,034,545 1,195,925 $ 161,380 Fund balances, beginning of year (936,093) Fund balances, end of year $ 259,
141 Schedule of Revenues, Expenditures and Changes in Fund Balance Budget and Actual Measure R Special Revenue Fund Variance From Final Budget Original Final Positive/ Budget Budget Actual (Negative) Revenues Intergovernmental $ 1,878,921 $ 2,154,166 $ 2,153,225 $ (941) Investment income - - (821) (821) Total revenues 1,878,921 2,154,166 2,152,404 (1,762) Other financing sources (uses) Transfers out (1,878,921) Total other financing sources (uses) (1,878,921) Net change in fund balances $ - $ 2,154,166 2,152,404 $ (1,762) Fund balances, beginning of year 162,228 Fund balances, end of year $ 2,314,
142 Schedule of Revenues, Expenditures and Changes in Fund Balance Budget and Actual Tourism Marketing District Special Revenue Fund Variance From Final Budget Original Final Positive/ Budget Budget Actual (Negative) Revenues Charges for services $ 462,000 $ 496,350 $ 514,906 $ 18,556 Investment income 1,837 1,837 2, Total revenues 463, , ,147 18,960 Expenditures Current: General government 408, , ,056 90,894 Total expenditures 408, , ,056 90,894 Excess (deficiency) of revenues over (under) expenditures 55,573 95, , ,854 Net change in fund balances $ 55,573 $ 95, ,091 $ 109,854 Fund balances, beginning of year 184,927 Fund balances, end of year $ 390,
143 Schedule of Revenues, Expenditures and Changes in Fund Balance Budget and Actual OSPD Special Revenue Fund Variance From Final Budget Original Final Positive/ Budget Budget Actual (Negative) Revenues Special assessments $ 2,098,000 $ 2,098,000 $ 2,143,520 $ 45,520 Investment income 26,065 26,065 50,624 24,559 Other revenue ,000 10,000 Total revenues 2,124,065 2,124,065 2,204,144 80,079 Expenditures Current: General government 433, , , ,604 Capital outlay - 2,752,630 34,000 2,718,630 Total expenditures 433,890 3,207, ,591 2,822,101 Excess (deficiency) of revenues over (under) expenditures 1,690,175 (1,083,627) 1,818,553 2,902,180 Other financing sources (uses) Transfers out (808,647) (808,647) (808,628) 19 Total other financing sources (uses) (808,647) (768,165) (768,146) 19 Net change in fund balances $ 881,528 $ (1,851,792) 1,050,407 $ 2,902,199 Fund balances, beginning of year 10,658,931 Fund balances, end of year $ 11,709,
144 Schedule of Revenues, Expenditures and Changes in Fund Balance Budget and Actual Miscellaneous Grants Special Revenue Fund Variance From Final Budget Original Final Positive/ Budget Budget Actual (Negative) Revenues Intergovernmental $ 1,580,285 $ 1,120,667 $ 1,626,238 $ 505,571 Total revenues 1,580,285 1,120,667 1,626, ,571 Expenditures Current: General government 350, , ,547 42,155 Public safety - 102,104 59,897 42,207 Parks, recreation and community service 9,730 8,000 8,000 - Public works 45, , ,965 61,588 Capital outlay 1,129, , ,059 (202,207) Total expenditures 1,534,285 1,337,211 1,393,468 (56,257) Excess (deficiency) of revenues over (under) expenditures 46,000 (216,544) 232, ,314 Net change in fund balances $ 46,000 $ (216,544) 232,770 $ 449,314 Fund balances (deficit), beginning of year (420,881) Fund balances (deficit), end of year $ (188,111) 124
145 Schedule of Revenues, Expenditures and Changes in Fund Balance Budget and Actual Park Dedication Special Revenue Fund Variance From Final Budget Original Final Positive/ Budget Budget Actual (Negative) Revenues Investment income $ 1,505 $ 1,505 $ 1,977 $ 472 Total revenues 1,505 1,505 1, Expenditures Capital outlay - 118, ,893 1,032 Total expenditures - 118, ,893 1,032 Excess (deficiency) of revenues over (under) expenditures 1,505 (117,420) (115,916) 1,504 Net change in fund balances $ 1,505 $ (117,420) (115,916) $ 1,504 Fund balances, beginning of year 163,465 Fund balances, end of year $ 47,
146 Schedule of Revenues, Expenditures and Changes in Fund Balance Budget and Actual Housing Successor Agency Special Revenue Fund Variance From Final Budget Original Final Positive/ Budget Budget Actual (Negative) Revenues Other revenue $ 5,056,509 $ 5,056,509 $ 5,056,509 $ - Total revenues 5,056,509 5,056,509 5,056,509 - Other financing sources (uses) Transfers out (1,050,123) (1,050,123) (1,050,123) - Total other financing sources (uses) (1,050,123) (1,050,123) (1,050,123) - Net change in fund balances $ 4,006,386 $ 4,006,386 4,006,386 $ - Fund balances, beginning of year 939,459 Fund balances, end of year $ 4,945,
147 Schedule of Revenues, Expenditures and Changes in Fund Balance Budget and Actual Tourism Marketing Bureau Special Revenue Fund Variance From Final Budget Original Final Positive/ Budget Budget Actual (Negative) Revenues Charges for services $ 12,987 $ 15,400 $ 13,029 $ (2,371) Investment income Other revenue 81,614 99,401 81,614 (17,787) Total revenues 94, ,801 94,737 (20,064) Expenditures Current: General government 9,703 56,000 55, Total expenditures 9,703 56,000 55, Excess (deficiency) of revenues over (under) expenditures 85,098 58,801 39,702 (19,099) Net change in fund balances $ 85,098 $ 58,801 39,702 $ (19,099) Fund balances, beginning of year - Fund balances, end of year $ 39,
148 Schedule of Revenues, Expenditures and Changes in Fund Balance Budget and Actual General Capital Projects Fund Variance From Final Budget Original Final Positive/ Budget Budget Actual (Negative) Revenues Other revenue $ 85,000 $ 85,000 $ 86,634 $ 1,634 Total revenues 85,000 85,000 86,634 1,634 Expenditures Capital outlay 1,025,909 4,477,932 2,501,659 1,976,273 Total expenditures 1,025,909 4,477,932 2,501,659 1,976,273 Excess (deficiency) of revenues over (under) expenditures (940,909) (4,392,932) (2,415,025) 1,977,907 Other Financing Sources (Uses) Transfers in - 1,575,064 1,575,064 - Total other financing sources (uses) - 1,575,064 1,575,064 - Net change in fund balances $ (940,909) $ (2,817,868) (839,961) $ 1,977,907 Fund balances, beginning of year 4,249,725 Fund balances, end of year $ 3,409,
149 Schedule of Revenues, Expenditures and Changes in Fund Balance Budget and Actual Public Financing Authority Capital Projects Fund Variance From Final Budget Original Final Positive/ Budget Budget Actual (Negative) Other Financing Sources (Uses) Transfers in $ 798,033 $ 798,052 $ 798,033 $ (19) Transfers out (798,297) (798,052) (798,297) (245) Total other financing sources (uses) (264) - (264) (264) Net change in fund balances $ (264) $ - (264) $ (264) Fund balances, beginning of year 274 Fund balances, end of year $
150 Schedule of Revenues, Expenditures and Changes in Fund Balance Budget and Actual Public Financing Authority Debt Service Fund Variance From Final Budget Original Final Positive/ Budget Budget Actual (Negative) Revenues Investment income $ 65 $ - $ 107 $ 107 Total revenues Expenditures Debt service: Principal retirement 1,560,000 1,560,000 1,560,000 - Interest and fiscal charges 1,589,256 1,589,192 1,589,277 (85) Total expenditures 3,149,256 3,149,192 3,149,277 (85) Excess (deficiency) of revenues over (under) expenditures (3,149,191) (3,149,192) (3,149,170) 22 Other Financing Sources (Uses) Transfers in 3,149,436 3,149,192 3,149, Total other financing sources (uses) 3,149,436 3,149,192 3,149, Net change in fund balances $ 245 $ $ 266 Fund balances, beginning of year (80) Fund balances (deficit), end of year $
151 Internal Service Funds As of and for the Year Ended June 30, 2014 The Internal Service Funds are used to account for goods or services provided by a central service department to other City departments. Self-Insurance To account for the City s self-insurance program. Computer Replacement To account for the financing of the replacement of the City s computer equipment. Vehicle Replacement To account for the financing of the replacement of the City s automotive equipment. 131
152 Combining Statement of Net Position Internal Service Funds June 30, 2014 Self- Computer Vehicle Insurance Replacement Replacement Totals Assets Current assets Cash and investments $ 3,729,970 $ 2,177,512 $ 4,416,251 $ 10,323,733 Receivables: Accounts - - 3,411 3,411 Interest 8,254 4,941 10,021 23,216 Prepaid costs - 60,313-60,313 Total current assets 3,738,224 2,242,766 4,429,683 10,410,673 Noncurrent assets Capital assets: Equipment, net of accumulated depreciation - 189, , ,214 Total noncurrent assets - 189, , ,214 Total assets 3,738,224 2,432,175 4,851,488 11,021,887 Liabilities Current liabilities Accounts payable and accrued liabilities 114, , ,683 Compensated absences 2, ,254 Claims and judgments 1,349, ,349,876 Total current liabilities 1,466, , ,597,813 Noncurrent liabilities Claims and judgments 807, ,887 Total noncurrent liabilities 807, ,887 Total liabilities 2,274, , ,405,700 Net position Net investment in capital assets - 189, , ,214 Unrestricted 1,464,007 2,111,565 4,429,401 8,004,973 Total net position $ 1,464,007 $ 2,300,974 $ 4,851,206 $ 8,616,
153 Combining Statement of Revenues, Expenses and Changes in Net Position Internal Service Funds Self- Computer Vehicle Insurance Replacement Replacement Totals Operating revenues Charge for services $ 2,471,221 $ 410,070 $ 224,400 $ 3,105,691 Total operating revenues 2,471, , ,400 3,105,691 Operating expenses Administration and personnel services 330,938 1,960 3, ,388 Services and supplies 2,176, ,309-2,369,477 Depreciation expense - 58, , ,136 Total operating expenses 2,507, , ,977 2,873,001 Operating income (loss) (35,885) 156, , ,690 Nonoperating revenues (expenses) Investment income 88,171 24,530 53, ,290 Gain on disposal of fixed assets ,174 18,174 Total nonoperating revenues (expenses) 88,171 24,530 71, ,464 Income (loss) before transfers 52, , , ,154 Transfers Transfers in 92, ,430 Transfers out (17,411) - - (17,411) Total transfers 75, ,019 Changes in net position 127, , , ,173 Net position Net position, beginning of year 1,336,702 2,120,292 4,667,020 8,124,014 Net position, end of year $ 1,464,007 $ 2,300,974 $ 4,851,206 $ 8,616,
154 Combining Statement of Cash Flows Internal Service Funds Self- Computer Vehicle Insurance Replacement Replacement Totals Cash flows from operating activities Cash received from customers and users $ 2,471,221 $ 410,070 $ 220,989 $ 3,102,280 Cash paid to suppliers for goods and services (2,299,434) (165,998) (4,412) (2,469,844) Cash paid to employees for services 905, ,873 Net cash provided by operating activities 1,077, , ,577 1,538,309 Cash flows from non-capital financing activities Cash transfers out (17,411) - - (17,411) Cash transfers in 92, ,430 Net cash provided by non-capital financing activities 75, ,019 Cash flows from capital and related financing activities Acquisition and construction of capital assets - (100,894) (280,909) (381,803) Net cash (used in) capital and related financing activities - (100,894) (280,909) (381,803) Cash flows from investing activities Interest received 101,165 25,197 55, ,281 Net cash provided by investing activities 101,165 25,197 55, ,281 Net increase (decrease) in cash and cash equivalents 1,253, ,375 (8,413) 1,413,806 Cash and cash equivalents at beginning of year 2,476,126 2,009,137 4,424,664 8,909,927 Cash and cash equivalents at end of year $ 3,729,970 $ 2,177,512 $ 4,416,251 $ 10,323,733 Reconciliation of operating income to net cash provided by operating activities Operating income $ (35,885) $ 156,152 $ 112,423 $ 232,690 Adjustments to reconcile operating income to net cash provided by operating activities: Depreciation - 58, , ,136 (Increase) in accounts receivable - - (3,411) (3,411) Increase (decrease) in accounts payable 73,594 89,584 (922) 162,256 Increase in claims and judgments 1,043, ,043,646 (Decrease) in compensated absences (3,695) - - (3,695) Total adjustments 1,113,545 87, ,154 1,305,619 Net cash provided by operating activities $ 1,077,660 $ 244,072 $ 216,577 $ 1,538,309 Non-cash investing, capital and financing activities Disposal of capital assets $ - $ - $ (18,174) $ (18,174) 134
155 Fiduciary Funds As of June 30, 2014 Agency Funds are used to account for assets held by the City as an agency for individuals. Assessment District No To account for monies held to account for debt service requirements of Assessment District No Assessment District No To account for monies held to account for debt service requirements of Assessment District No Community Facilities District No To account for monies held to account for debt service requirements of Community Facilities District No Santa Clarita Watershed and Recreation Conservancy Authority To account for monies held for the operations of the Watershed Authority, for which the City performs administrative functions. Santa Clarita Public Television Authority To account for monies held for the operations of the SCPTA, for which the City performs administrative functions. 135
156 Combining Statement of Assets and Liabilities Agency Funds June 30, 2014 Community Assessment Assessment Facilities District District District No No No Assets Cash and investments $ 113,314 $ 85,416 $ 768,335 Receivables: Interest ,740 Taxes 408 1,187 - Due from other governments Restricted assets: Cash and investments with fiscal agents 58,697 59,712 1,643,419 Capital assets: Land Building, net of accumulated depreciation Total assets $ 172,676 $ 146,509 $ 2,413,494 Liabilities Due to external parties $ 172,676 $ 146,509 $ 2,413,494 Total liabilities $ 172,676 $ 146,509 $ 2,413,
157 Combining Statement of Assets and Liabilities Agency Funds June 30, 2014 Santa Clarita Watershed and Santa Clarita Recreation Public Conservancy Television Authority Authority Totals Assets Cash and investments $ 33,119 $ 8 $ 1,000,192 Receivables: Interest - - 2,191 Taxes - - 1,595 Due from other governments 715, ,000 Restricted assets: Cash and investments with fiscal agents - - 1,761,828 Capital assets: Land 9,937,976-9,937,976 Building, net of accumulated depreciation 90,300-90,300 Total assets $ 10,776,395 $ 8 $ 13,509,082 Liabilities Due to external parties $ 10,776,395 $ 8 $ 13,509,082 Total liabilities $ 10,776,395 $ 8 $ 13,509,
158 Combining Statement of Changes in Assets and Liabilities Agency Funds Balance Balance July 1, 2013 Additions Deductions June 30, 2014 Assessment District No Assets Cash and investments $ 97,826 $ 184,767 $ 169,279 $ 113,314 Receivables: Taxes 1, , Interest Restricted assets: Cash and investments with fiscal agents 58, ,697 Total assets $ 158,481 $ 185,432 $ 171,237 $ 172,676 Liabilities Accounts payable $ 15 $ 6,367 $ 6,382 $ - Due to external parties 158, , , ,676 Total liabilities $ 158,481 $ 185,432 $ 171,237 $ 172,676 Assessment District 99-1 Assets Cash and investments $ 71,498 $ 143,968 $ 130,050 $ 85,416 Receivables: Taxes 590 1, ,187 Interest Restricted assets: Cash and investments with fiscal agents 57,106 2,606-59,712 Total assets $ 129,394 $ 147,955 $ 130,840 $ 146,509 Liabilities Accounts payable $ 201 $ 3,491 $ 3,692 $ - Due to external parties 129, , , ,509 Total liabilities $ 129,394 $ 147,955 $ 130,840 $ 146,
159 Combining Statement of Changes in Assets and Liabilities Agency Funds Balance Balance July 1, 2013 Additions Deductions June 30, 2014 Community Facilities District No Assets Cash and investments $ 647,353 $ 395,741 $ 274,759 $ 768,335 Receivables: Accounts 2,000-2,000 - Interest 1,803 1,740 1,803 1,740 Restricted assets: Cash and investments with fiscal agents 1,651,579 1,769,210 1,777,370 1,643,419 Total assets $ 2,302,735 $ 2,166,691 $ 2,055,932 $ 2,413,494 Liabilities Accounts payable $ - $ 520 $ 520 $ - Due to external parties 2,302,735 2,166,171 2,055,412 2,413,494 Total liabilities $ 2,302,735 $ 2,166,691 $ 2,055,932 $ 2,413,494 Santa Clarita Watershed and Recreation Conservancy Authority Assets Cash and investments $ 270,259 $ 102 $ 237,242 $ 33,119 Due from other governments 715, ,000 Capital assets: Land 9,738, ,769-9,937,976 Building, net of accumulated depreciation 94,062-3,762 90,300 Total assets $ 10,817,528 $ 199,871 $ 241,004 $ 10,776,395 Liabilities Due to external parties $ 10,817,528 $ 199,871 $ 241,004 $ 10,776,395 Total liabilities $ 10,817,528 $ 199,871 $ 241,004 $ 10,776,
160 Combining Statement of Changes in Assets and Liabilities Agency Funds Balance Balance July 1, 2013 Additions Deductions June 30, 2014 Santa Clarita Public Television Authority Assets Cash and investments $ 4 $ 142,924 $ 142,920 $ 8 Total assets $ 4 $ 142,924 $ 142,920 $ 8 Liabilities Accounts payable $ - $ 13,807 $ 13,807 $ - Due to external parties 4 129, ,113 8 Total liabilities $ 4 $ 142,924 $ 142,920 $ 8 Total Agency Funds Assets Cash and investments $ 1,086,940 $ 867,502 $ 954,250 $ 1,000,192 Receivables: Accounts 2,000-2,000 - Taxes 2,275 1,595 2,275 1,595 Interest 2,276 2,191 2,276 2,191 Due from other governments 715, ,000 Restricted assets: Cash and investments with fiscal agents 1,767,382 1,771,816 1,777,370 1,761,828 Capital assets: Land 9,738, ,769-9,937,976 Building, net of accumulated depreciation 94,062-3,762 90,300 Total assets $ 13,408,142 $ 2,842,873 $ 2,741,933 $ 13,509,082 Liabilities Accounts payable $ 216 $ 24,185 $ 24,401 $ - Due to external parties 13,407,926 2,818,688 2,717,532 13,509,082 Total liabilities $ 13,408,142 $ 2,842,873 $ 2,741,933 $ 13,509,
161 This part of the City of Santa Clarita s comprehensive annual financial report presents detailed information as a context for understanding what the information in the financial statements, note disclosures and required supplementary information say about the government s overall financial health. CONTENTS PAGE Financial Trends These tables contain trend information that may assist the reader in the City s current financial performance by placing it in historical perspective Revenue Capacity These tables contain information that may help in assessing the viability of the City s most significant revenue sources, the property and sales tax Debt Capacity These tables present information that may assist the reader in analyzing the affordability of the City s current levels of outstanding debt and the City s ability to issue additional debt in the future Demographic and Economic Information These tables offer demographic and economic indicators to help the reader understand the environment within which the City s financial activities take place Operating Information These tables contain service and infrastructure indicators that can inform one s understanding of how the information in the City s financial statements relates to the services the City provides and the activities it performs
162 Net Position by Component (1) Last Nine Fiscal Years Ended June 30, 2014 (2) (accrual basis of accounting) FISCAL YEAR Governmental Activities Investment in capital assets, net of related debt $ 799,926,613 $ 738,271,282 $ 743,281,558 $ 717,613,095 Restricted for: Capital projects - 14,292,447 3,275,312 3,452,815 Debt service Specific projects and programs 71,643,713 54,229,493 46,915,965 30,201,655 Total restricted 71,643,713 68,521,940 50,191,277 33,654,470 Unrestricted 82,854,775 65,706,424 79,141,211 67,397,688 Total governmental activities net position $ 954,425,101 $ 872,499,646 $ 872,614,046 $ 818,665,253 Business-Type Activities Investment in capital assets, net of related debt $ 83,296,545 $ 76,561,407 $ 73,778,640 $ 75,416,868 Unrestricted 3,354,211 3,835,316 3,099, ,446 Total business-type activities net position $ 86,650,756 $ 80,396,723 $ 76,878,059 $ 75,920,314 Primary Government Net investment in capital assets $ 883,223,158 $ 814,832,689 $ 817,060,198 $ 793,029,963 Restricted 71,643,713 68,521,940 50,191,277 33,654,470 Unrestricted 86,208,986 69,541,740 82,240,630 67,901,134 Total primary government net position $ 1,041,075,857 $ 952,896,369 $ 949,492,105 $ 894,585,567 Note: (1) Accounting standards require that net position be reported in three components in the financial statements: net investment in capital assets, restricted and unrestricted. Net position is considered restricted only when (a) an external party, such as the State of California or the federal government, places a restriction on how the revenues may be used, or (b) enabling legislation is enacted by the City. (2) The City implemented GASB 44 for the fiscal year ended June 30, 2006; therefore, only nine years of data is (3) The City implemented the GASB 34 reporting module for the fiscal year ended June 30, The fiscal year balance was restated as a result of the City s valuation of the estimated historical cost of infrastructure placed in service prior to July 1, Source: City of Santa Clarita, Administrative Services Department - Finance Division 142
163 FISCAL YEAR (3) As Restated $ 657,644,168 $ 629,621,720 $ 672,306,820 $ 661,210,117 $ 614,300,517 4,769,573 4,769,573 45,993,804 18,134,924 32,030, , ,028 85,895,468 92,644,739 61,018,399 34,441,539 30,547,345 90,665,041 97,414, ,644,883 52,576,463 62,752,301 63,218,255 98,512,704 66,249,901 87,737,817 71,001,423 $ 811,527,464 $ 825,548,736 $ 846,201,604 $ 801,524,397 $ 748,054,241 $ 67,911,725 $ 66,478,547 $ 63,526,242 $ 62,246,621 $ 63,741,429 (176,196) 3,603,396 2,957,611 1,553,088 (406,224) $ 67,735,529 $ 70,081,943 $ 66,483,853 $ 63,799,709 $ 63,335,205 $ 725,555,893 $ 696,100,267 $ 735,833,062 $ 723,456,738 $ 678,041,946 90,665,041 97,414, ,644,883 52,576,463 62,752,301 63,042, ,116,100 69,207,512 89,290,905 70,595,199 $ 879,262,993 $ 895,630,679 $ 912,685,457 $ 865,324,106 $ 811,389,
164 Changes in Net Position (1) Last Nine Fiscal Years Ended June 30, 2014 (2) (accrual basis of accounting) FISCAL YEAR Expenses Governmental Activities General government $ 41,807,284 $ 35,921,943 $ 33,664,470 $ 47,048,462 Public safety 22,187,434 19,940,098 27,391,075 21,280,904 Public works 26,183,862 28,651,261 30,623,718 25,799,166 Parks, recreation and community service 22,550,301 21,809,820 19,282,538 11,281,552 Community development 6,193,101 7,214,293 5,896,640 11,547,650 Unallocated infrastructure depreciation 17,561,539 15,163,864 16,844,238 16,392,901 Interest on long-term debt 1,872,832 1,992,574 3,391,058 4,650,566 Total governmental activities expenses 138,356, ,693, ,093, ,001,201 Business-Type Activities Transit 26,819,161 25,653,753 24,930,635 24,127,043 Total business-type activities expenses 26,819,161 25,653,753 24,930,635 24,127,043 Total primary government expenses $ 165,175,514 $ 156,347,606 $ 162,024,372 $ 162,128,244 Program Revenues Governmental Activities Charges for services: General government $ 31,970,148 $ 24,323,027 $ 13,719,117 $ 398,181 Public safety 1,847,403 2,284,334 2,079,109 2,305,608 Public works 12,463,046 9,943,014 7,209,724 4,929,602 Parks, recreation and community service 4,390,686 4,371,888 4,156,386 4,220,977 Community development 1,961,243 1,611,184 5,152,484 12,059,509 Operating grants and contributions 19,421,199 9,061,950 16,032,433 14,090,686 Capital grants and contributions 22,530,841 33,585,797 28,616,388 31,325,725 Total governmental activities program revenu 94,584,566 85,181,194 76,965,641 69,330,288 Business-Type Activities Charges for services: Transit 7,587,497 6,863,086 6,616,778 6,573,879 Operating grants and contributions 8,984,127 8,579,209 7,385,264 6,913,534 Capital grants and contributions 10,804,747 8,513,238 5,041,992 13,043,418 Total business-type activities program revenu 27,376,371 23,955,533 19,044,034 26,530,831 Total primary government revenues $ 121,960,937 $ 109,136,727 $ 96,009,675 $ 95,861,119 Note: (1) The City implemented the GASB 34 reporting module for the fiscal year ended June 30, (2) The City implemented GASB 44 for the fiscal year ended June 30, 2006; therefore, only nine years of data is presented. Source: City of Santa Clarita, Administrative Services Department - Finance Division 144
165 FISCAL YEAR $ 32,116,335 $ 30,094,380 $ 27,488,731 $ 26,029,070 $ 24,225,414 17,912,704 17,489,870 16,482,917 14,398,408 13,821,626 26,758,527 48,514,645 30,549,888 19,273,980 6,417,841 27,835,763 32,747,618 21,817,251 20,573,077 20,988,533 13,831,341 9,761,681 9,257,881 8,985,449 16,939,976 15,545,626 14,405,047 13,128,617 12,920,310 1,268,939 5,476,918 5,786,174 3,127,998 2,087,949 1,669, ,477, ,799, ,853, ,268,243 85,332,030 23,348,708 22,299,379 21,506,317 18,315,106 16,508,457 23,348,708 22,299,379 21,506,317 18,315,106 16,508,457 $ 162,825,922 $ 181,098,794 $ 143,359,600 $ 122,583,349 $ 101,840,487 $ 396,651 $ 621,624 $ 2,737,355 $ 302,075 $ 186,171 2,194,038 1,898,022 2,291,100 2,131,060 2,032,652 3,162, , ,817 3,575,546 2,512,093 3,956,933 3,849,699 3,875,539 3,895,422 3,794,662 15,937,913 35,138,334 26,341,684 20,182,722 19,068,982 16,224,269 9,931,109 22,600,793 26,641,145 23,465,852 15,249,634 38,785,576 39,003,536 24,770,306 60,971,404 57,121,490 90,484,888 97,205,824 81,498, ,031,816 3,181,614 3,299,263 3,216,239 5,827,778 4,950,584 10,260,579 13,653,177 11,876,720 12,616,641 3,351, , ,200-13,442,193 16,952,440 15,710,380 19,194,619 8,302,525 $ 70,563,683 $ 107,437,328 $ 112,916,204 $ 100,692,895 $ 120,334,341 (Continued) 145
166 Changes in Net Position (1) Last Nine Fiscal Years Ended June 30, 2014 (2) (accrual basis of accounting) FISCAL YEAR Net Revenues (expenses): Governmental activities $ (43,771,787) $ (45,512,659) $ (60,128,096) $ (68,670,913) Business-type activities 557,210 (1,698,220) (5,886,601) 2,403,788 Total net revenues (expenses) $ (43,214,577) $ (47,210,879) $ (66,014,697) $ (66,267,125) General Revenue and Other Changes in Net Position Governmental activities Taxes: Sales taxes $ 33,480,522 $ 32,057,358 $ 28,828,139 $ 27,701,757 Property taxes 35,652,080 32,341,369 34,818,426 24,996,219 Franchise taxes 7,796,070 7,141,953 6,920,244 6,697,241 Real property transfer taxes 947, , ,474 3,082,456 Transient occupancy taxes 2,781,527 2,556,774 2,380,547 2,106,521 Unrestricted revenue in lieu of motor vehicle taxes 86,531 91, Unrestricted revenue in lieu of sales taxes ,316,058 Grants and contributions not restricted to specific programs , ,475 Unrestricted investment earnings 2,090,322 (82,870) 1,509,201 3,756,112 Miscellaneous revenue 781, ,676 5,372,890 9,148,163 Gain on sale of capital asset 18, Transfers (5,692,032) (5,187,224) (6,844,199) (5,808,300) Total governmental activities 77,942,650 69,935,278 73,663,605 75,808,702 Business-type activities Unrestricted investment earnings 4,791 29, (27,303) Miscellaneous revenue Transfers 5,692,032 5,187,224 6,844,199 5,808,300 Total business-type activities 5,696,823 5,216,884 6,844,346 5,780,997 Total primary government $ 83,639,473 $ 75,152,162 $ 80,507,951 $ 81,589,699 Extraordinary Item Gain from dissolution of former redevelopment agency of the City of Santa Clarita $ - $ - $ 40,413,284 $ - Change in Net Position Governmental activities $ 34,170,863 $ 24,422,619 $ 53,948,793 $ 7,137,789 Business-type activities 6,254,033 3,518, ,745 8,184,785 Total primary government $ 40,424,896 $ 27,941,283 $ 54,906,538 $ 15,322,574 Note: (1) The City implemented the GASB 34 reporting module for the fiscal year ended June 30, (2) The City implemented GASB 44 for the fiscal year ended June 30, 2006; therefore, only nine years of data is Source: City of Santa Clarita, Administrative Services Department - Finance Division 146
167 FISCAL YEAR $ (82,355,724) $ (68,314,527) $ (24,647,459) $ (22,769,967) $ 26,699,786 (9,906,515) (5,346,939) (5,795,937) 879,513 (8,205,932) $ (92,262,239) $ (73,661,466) $ (30,443,396) $ (21,890,454) $ 18,493,854 $ 24,511,238 $ 27,751,506 $ 29,076,388 $ 23,790,825 $ 22,204,192 25,126,278 26,820,068 24,482,930 27,891,202 23,106,806 6,407,923 6,704,074 6,028,903 6,248,912 5,560,153 4,564,687 4,816, ,824 1,073,774 1,544,534 2,050,857 2,260,708 2,433,651 1,804,923 1,824, ,990 3,221,498 3,083,353 8,490,865 8,156,017 6,965, ,708 1,015,413 1,252,281 1,862, ,241 4,871,133 6,020,940 4,566,884 4,970,193 1,891,292 4,161,677 3,193, (7,477,547) (8,006,128) (8,431,120) 441,376 (12,054,795) 68,334,452 73,659,993 68,737,606 76,240,123 51,869,328 82,554-48,961 26,367 1, , ,615 7,477,547 8,006,128 8,431,120 (441,376) 12,054,795 7,560,101 8,945,029 8,480,081 (415,009) 12,939,460 $ 75,894,553 $ 82,605,022 $ 77,217,687 $ 75,825,114 $ 64,808,788 $ - $ - $ - $ - $ - $ (14,021,272) $ 5,345,466 $ 44,090,147 $ 53,470,156 $ 78,569,114 (2,346,414) 3,598,090 2,684, ,504 4,733,528 $ (16,367,686) $ 8,943,556 $ 46,774,291 $ 53,934,660 $ 83,302,
168 Fund Balances of Governmental Funds Last Ten Fiscal Years Ended June 30, 2014 (modified accrual basis of accounting) FISCAL YEAR General Fund Reserved $ - $ - $ - $ - $ 19,546,015 Unreserved ,211,508 Nonspendable 11,519,143 11,910,059 18,902,350 23,845,861 - Restricted Committed ,257 12,356,339 - Assigned 51,718,096 47,106, , ,781 - Unassigned 45,654,640 35,320,706 50,664,338 46,915,238 - Total general fund $ 108,891,879 $ 94,337,301 $ 69,942,023 $ 83,690,219 $ 77,757,523 All Other Governmental Funds Reserved $ - $ - $ - $ - $ 51,195,454 Unreserved: Special revenue funds ,109,198 Debt service fund (24,048,962) Capital projects fund ,725,531 Nonspendable 606, ,612 28,885,983 28,813,152 - Restricted 84,268,720 68,957,999 46,915,965 57,205,072 - Committed 612, , Assigned 3,412,127 4,466,367 3,275,312 3,637,410 - Unassigned (9,300,647) (10,665,597) (56,718,519) (72,692,440) - Total all other governmental funds $ 79,600,025 $ 64,146,207 $ 22,358,741 $ 16,963,194 $ 62,981,221 FUND BALANCES Fiscal Year Ended June 30, All Other Governmental Funds 42.23% General Fund 57.77% Note: (1) Balance as restated; see financial statements for the applicable year. Source: City of Santa Clarita, Administrative Services Department - Finance Division 148
169 FISCAL YEAR (1) $ 32,617,139 $ 34,920,547 $ 34,699,034 $ 20,786,040 $ 15,638,513 41,674,470 31,153,879 28,500,824 18,232,779 30,780, $ 74,291,609 $ 66,074,426 $ 63,199,858 $ 39,018,819 $ 46,419,452 $ 70,667,494 $ 51,972,970 $ 48,303,588 $ 80,399,389 $ 30,388,825 (7,048,095) 28,377,796 3,827,570 (7,159,062) 2,843,589 (17,004,471) (15,873,835) (10,461,382) (4,743,697) (4,402,225) 34,502,270 38,050,255 4,592,332 (249,111) (698,632) $ 81,117,198 $ 102,527,186 $ 46,262,108 $ 68,247,519 $ 28,131,557 FUND BALANCES ALL OTHER GOVERNMENTAL FUNDS Last Ten Fiscal Years $68.24 $81.12 $62.98 $64.14 $79.60 (in Millions) $28.13 $46.26 $33.28 $16.96 $ Fiscal Year 149
170 Changes in Fund Balances of Governmental Funds Last Ten Fiscal Years Ended June 30, 2014 (modified accrual basis of accounting) Revenues: Taxes $ 80,285,660 $ 73,972,006 $ 73,625,713 $ 72,474,882 Licenses and permits 5,366,972 4,246,957 4,097,709 3,675,424 Developer fees 2,600,997 15,828,388 7,181, ,776 Investment income 1,911,491 1,702,006 2,739,794 3,798,498 Intergovernmental 34,355,734 27,452,216 28,375,142 19,780,700 Fines and forfeitures 1,661,157 2,114,166 1,674,085 1,891,500 Service charges 42,156,582 36,311,324 28,145,012 23,608,272 Other revenues 5,943, ,146 6,425,792 7,685,141 Total Revenues 174,282, ,959, ,265, ,197,193 Expenditures: Current: General government 36,294,205 35,433,288 50,816,449 42,213,597 Public safety 22,137,338 19,894,859 25,412,420 21,230,594 Public works 24,385,865 27,968,407 20,753,607 34,210,327 Parks and recreation 20,498,108 19,824,550 19,523,584 21,853,319 Community development 6,185,263 7,252,424 5,923,872 11,575,365 Capital outlay 36,580,589 23,837,533 27,403,439 21,311,885 Debt service: Principal 1,837,174 1,750,538 2,338,787 2,246,218 Interest, professional services and fiscal charges 1,885,546 2,039,144 3,743,134 4,796,695 Redemption of district credits - 14,368, Total Expenditures 149,804, ,369, ,915, ,438,000 Excess of Revenues Over (Under) Expenditures 24,478,113 9,590,047 (3,650,059) (26,240,807) Other Financing Sources (Uses) Revenue bonds issued/issuance premium Proceeds of long-term debt Escrow payment, costs of bonds issuance and others Proceeds from capital lease ,068 - Transfers in 9,757,447 9,069,495 16,538,674 50,869,852 Transfers out (15,524,498) (14,256,719) (29,810,448) (64,714,376) Issuance of district credits 11,297,334 12,270, Total Other Financing Sources (Uses) 5,530,283 7,083,111 (13,019,706) (13,844,524) Extraordinary Item: Dissolution of Santa Clarita Redevelopment Agency - - 8,317,116 - Net change in fund balances 30,008,396 16,673,158 (8,352,649) (40,085,331) Fund balances - Beginning of Year, as restated 158,483, ,810, ,653, ,738,744 Fund balances - End of Year $ 188,491,904 $ 158,483,508 $ 92,300,764 $ 100,653,413 Debt service as percentage of noncapital expenditures 3.01% 2.95% 4.40% 5.96% Source: City of Santa Clarita, Administrative Services Department - Finance Division FISCAL YEAR 150
171 FISCAL YEAR $ 80,714,829 $ 87,659,599 $ 88,088,786 $ 70,576,755 $ 66,164,485 $ 53,763,779 4,093,250 3,697,218 5,256,748 4,203,933 6,907,826 5,127,705 3,053,363 15,763,070 22,290,808 6,747,767 28,028,933 11,963,054 5,485,925 10,749,728 8,287,441 7,926,763 2,881,133 3,148,731 33,881,145 28,882,884 24,247,611 37,300,213 38,526,364 33,089,887 1,936,318 1,759,371 2,121,570 1,918,954 1,904,273 1,803,686 10,812,521 8,375,771 9,931,041 13,463,673 13,081,649 13,339,462 7,234,923 5,077,400 3,368,879 4,356,961 12,651,674 2,408, ,212, ,965, ,592, ,495, ,146, ,644,767 27,951,510 27,250,056 25,965,196 23,411,750 24,668,150 11,217,783 17,862,129 17,439,295 16,342,979 14,347,833 13,658,723 12,429,192 20,594,575 42,937,168 25,977,763 19,511,097 6,802,081 8,901,359 20,048,430 20,126,412 20,156,343 18,943,146 17,376,609 15,964,949 10,849,942 7,095,386 7,583,236 9,051,652 17,164,505 22,531,795 46,183,268 41,826,511 44,906,802 57,926,955 49,435,744 35,096,683 2,611,372 2,072,341 1,927,198 2,374,870 1,367,359 2,060,319 5,411,152 5,279,549 4,632,979 2,298,974 2,878,536 1,570, ,512, ,026, ,492, ,866, ,351, ,772,661 (4,300,104) (2,061,677) 16,100,388 (1,371,258) 36,794,630 14,872, ,894, ,235,000-17,700, (226,682) - (17,225,304) ,953,115 12,150,426 43,112,541 27,468,089 7,865,612 8,157,999 (28,930,662) (23,281,554) (54,668,661) (29,881,193) (19,409,716) (20,282,188) (9,977,547) (11,131,128) 42,452,198 11,481,648 (11,069,408) (12,124,189) (14,277,651) (13,192,805) 58,552,586 10,110,390 25,725,222 2,747, ,016, ,601, ,049,026 99,351,576 74,551,009 71,803,092 $ 140,738,744 $ 155,408,807 $ 168,601,612 $ 109,461,966 $ 100,276,231 $ 74,551, % 5.54% 5.16% 4.27% 4.85% 4.57% 151
 $ 12,892,636,265 2005-06")
 16,266,238,305 2007-08 2,156,981 8,312,011 197,013 10,666,005 8,556,960,792 9,766,997,767 104,509,489 (253,946,364) 18,174,521,684 2008-09 1,515,305 6,727,866-8,243,171 9,899,005,161")
172 Assessed Values (1) and Actual Values of Taxable Property Last Ten Fiscal Years STATE ASSESSED LOCALLY ASSESSED SECURED (UTILITY) SECURED Fiscal IMPROVE- PERSONAL IMPROVE- PERSONAL OTHER Year LAND MENTS PROPERTY TOTAL LAND MENTS PROPERTY EXEMPTIONS TOTAL $ 5,301,621 $ 43,969,100 $ 205,876 $ 49,476,597 $ 5,312,201,652 $ 7,688,524,882 $ 79,538,536 $ (187,628,805) $ 12,892,636, ,420,327 11,091, ,894 16,768,755 6,068,433,252 8,136,867,187 73,449,031 (194,782,110) 14,083,967, ,098,608 10,833, ,620 13,172,185 7,440,682,741 8,947,087,936 89,939,825 (211,472,197) 16,266,238, ,156,981 8,312, ,013 10,666,005 8,556,960,792 9,766,997, ,509,489 (253,946,364) 18,174,521, ,515,305 6,727,866-8,243,171 9,899,005,161 10,912,016,138 98,107,607 (214,371,451) 20,694,757, ,750,395 2,264,780-4,015,175 9,416,163,697 11,115,441, ,296,475 (323,630,904) 20,313,270, ,750,395 2,264,780-4,015,175 9,160,567,699 11,280,024, ,335,544 (330,372,395) 20,222,555, ,431,971 2,264,780-3,696,751 9,097,382,703 11,485,773, ,089,927 (372,583,638) 20,317,662, ,431,971 2,264,780-3,696,751 8,882,930,332 11,516,988, ,202,431 (400,045,608) 20,111,075, ,431,971 2,264,780-3,696,751 9,989,545,816 13,726,755, ,166,367 (412,668,046) 23,410,799,283 PERSONAL PROPERTY 2.63% ASSESSED VALUATION by CATEGORIES (Total Secured and Unsecured) Fiscal Year Ended June 30, 2014 LAND 40.45% IMPROVEMENTS 56.92% Note: (1) Assessed valuation is based on 100% of full value in accordance with Section 135 of the California Revenue and Taxation Code. (2) Direct Rate includes Redevelopment Agency areas. Source: HdL Coren & Cone, County of Los Angeles, Auditor-Controller Office, Combined Tax Rolls
173 LOCALLY ASSESSED TOTALS HOME- UNSECURED BEFORE TAXABLE % TOTAL OWNER IMPROVE- PERSONAL OTHER OTHER ASSESSED INCR. DIRECT PROPERTY MENTS PROPERTY EXEMPTIONS TOTAL EXEMPTIONS VALUE (DECR.) RATE (2) TAX RELIEF $ 254,085,173 $ 411,805,661 $ (1,135,000) $ 664,755,834 $ 13,795,632,501 $ 13,606,868, % % $ 199,643, ,047, ,549,912 (76,000) 641,521,760 14,937,115,985 14,742,257, % % 205,852, ,098, ,406,084 (9,513,134) 659,990,996 17,160,386,817 16,939,401, % % 206,658, ,417, ,574,856 (7,299,585) 730,693,104 19,177,126,742 18,915,880, % % 206,464, ,708, ,804,055 (32,916,267) 790,596,511 21,740,884,855 21,493,597, % % 220,192, ,543, ,420,921 (15,127,698) 944,836,476 21,600,880,848 21,262,122, % % 224,731, ,874, ,829,644 (13,331,377) 887,372,458 21,457,646,707 21,113,942, % % 223,277, ,286, ,430,090 (15,137,342) 847,579,230 21,556,659,612 21,168,938, % % 220,496, ,415, ,947,944 (13,693,787) 870,669,758 21,399,181,358 20,985,441, % % 216,163, ,350, ,533,568 (15,907,716) 854,976,697 24,698,048,493 24,269,472, % % 236,577,388 30,000 TOTAL ASSESSED VALUATION (Taxable Values) Last Ten Fiscal Years 25,000 $24,269 $21,494 $21,262 $21,114 $21,169 $20,985 (in Millions) 20,000 15,000 10,000 $13,607 $14,742 $16,939 $18,916 5, Fiscal Year 153
174 Redevelopment Agency (1) Assessed Values (2) and Actual Values of Taxable Property Last Ten Fiscal Years STATE ASSESSED LOCALLY ASSESSED SECURED (UTILITY) SECURED FISCAL IMPROVE- PERSONAL IMPROVE- PERSONAL OTHER YEAR LAND MENTS PROPERTY TOTAL LAND MENTS PROPERTY EXEMPTIONS TOTAL ,404 49,101 28, , ,810, ,935,237 2,314,234 (5,083,826) 344,976, ,007 45,801 26, , ,260, ,564,344 2,435,378 (4,859,824) 447,400, ,158 37,657 21, , ,792, ,299,271 2,545,972 (5,085,710) 478,552, ,974, ,086,767 2,346,546 (4,630,171) 538,777, ,100, ,393,278 2,064,527 (3,754,719) 563,803, ,043, ,695,279 1,775,246 (3,779,814) 555,733, ,869, ,093,295 1,850,279 (3,196,475) 531,616, ,803, ,686,716 1,933,165 (7,016,751) 532,406, N/A N/A N/A N/A N/A N/A N/A N/A N/A N/A N/A N/A N/A N/A N/A N/A N/A N/A (1) The Redevelopment Agency of the City was established on November 28, 1989, pursuant to the State of California and Safety Code, Section However, the Agency was not active until fiscal year and the Base Year was calculated in fiscal year , which included the Homeowners Tax Relief of that year. Redevelopment agencies were dissolved by the State of California effective February 1, (2) Assessed valuation is based on 100% of full value in accordance with Section 135 of the California Revenue and Taxation Code. Source: County of Los Angeles, Auditor-Controller/Tax Division 154
175 LOCALLY ASSESSED TOTALS HOME- UNSECURED TOTALS TAXABLE OWNER IMPROVE- PERSONAL OTHER BEFORE ASSESSED VALUE PROPERTY MENTS PROPERTY EXEMPTIONS TOTAL BASE YEAR BASE YEAR VALUE GROWTH TAX RELIEF 6,326,173 22,151,970 (33,000) 28,445, ,564,307 (266,351,517) 107,212,790 27,718,426 2,161,147 5,901,959 23,034,914 (91,000) 28,845, ,378,928 (266,351,517) 210,027, ,814,621 2,053,943 26,593,269 25,569,962 (16,300) 52,146, ,808,304 (266,351,517) 264,456,787 54,429,376 1,971,567 28,204,577 48,299,529 (217,300) 76,286, ,064,595 (266,351,517) 348,713,078 84,256,291 2,034,432 39,771,667 48,437,084 (77,000) 88,131, ,935,348 (266,351,517) 385,583,831 36,870,753 2,002,848 34,102,838 46,361,945 (84,500) 80,380, ,114,144 (266,351,517) 369,762,627 (15,821,204) 1,921,661 21,240,432 62,307,206 (84,500) 83,463, ,079,251 (266,351,517) 348,727,734 (21,034,893) 1,871,456 34,353,633 46,665,422 (102,000) 80,917, ,323,930 (266,351,517) 346,972,413 (1,755,321) 1,865,922 N/A N/A N/A N/A N/A N/A N/A N/A N/A N/A N/A N/A N/A N/A N/A N/A N/A N/A 155

176 Assessed Values Taxable Property Last Ten Fiscal Years FISCAL YEAR CATEGORY Residential $ 18,138,258,224 $ 14,971,655,728 $ 15,212,586,674 $ 15,239,936,469 $ 15,093,632,637 Commercial 2,847,760,176 2,794,405,083 2,748,247,727 2,820,296,027 2,729,669,423 Industrial 1,561,091,316 1,413,623,056 1,455,126,754 1,463,696,151 1,451,053,867 Irrigated 2,827,311 2,796,388 3,016,072 3,004,749 3,630,743 Dry farm Recreational 100,138, ,981, ,506, ,791, ,511,353 Institutional 136,824, ,119, ,982, ,363, ,868,861 Government 215, , , , ,850 Miscellaneous 1,017, , , , ,038 Vacant land 509,125, ,117, ,608, ,820, ,182,476 SBE Nonunitary 3,696,751 3,696,751 3,696,751 4,015,175 4,015,175 Possessory Int. 113,541, ,301, ,534, ,599, ,671,347 Unsecured 854,976, ,669, ,579, ,372, ,836,476 Unknown TOTALS: $ 24,269,472,731 $ 20,985,441,963 $ 21,168,938,632 $ 21,113,942,935 $ 21,262,122,246 20,000 18,000 ASSESSED VALUE - TAXABLE PROPERTY Last Ten Fiscal Years (in Millions) 16,000 14,000 12,000 10,000 8,000 6,000 4,000 2,000 Residential Commercial Industrial Vacant Land All Others Fiscal Year 156
177 FISCAL YEAR $ 16,165,919,271 $ 13,962,275,972 $ 12,569,640,999 $ 11,097,987,787 $ 11,097,987,787 2,081,576,763 1,836,340,797 1,588,835,810 1,258,389,787 1,258,389,787 1,293,080,539 1,148,469, ,395, ,455, ,455,573 3,489,768 29,374,674 28,272,540 4,351,050 4,351,050-49,088,244 48,512,253 45,145,241 45,145, ,868,032 90,435,287 94,916,719 84,727,948 84,727, ,907,129 94,705,673 91,312,643 80,606,769 80,606, , , , , , , , , ,792, ,660, ,551, ,215, ,215,418 8,243,171 10,666,005 13,172,185 16,768,755 16,768, ,115, ,654, ,526, ,323, ,323, ,596, ,697, ,990, ,526, ,526,760-83,525, ,303,882 36,994,610 36,994,610 $ 21,493,597,137 $ 18,915,885,493 $ 16,939,401,486 $ 14,742,257,875 $ 14,742,257,875 Notes: In 1978 the voters of the State of California passed Proposition 13, which limited taxes to a total maximum rate of 1% based upon the assessed value of the property being taxed. Each year, the assessed value of property may be increased by an inflation factor (limited to a maximum of 2%). With few exceptions, property is only reassessed as a result of new construction activity or at the time it is sold to a new owner. At that point, the property is reassessed based upon the added value of the construction or at the purchase price (market value) or economic value of the property sold. The assessed valuation data shown above represents the only data currently available with respect to the actual market value of taxable property and is subject to the limitation just mentioned. 157
178 Assessed Values Use Category Summary Fiscal Year NET ASSESSED TAXABLE CATEGORY PARCELS VALUE PERCENT EXEMPTIONS VALUE PERCENT Residential 54,973 $ 18,197,034, % $ 58,776,732 $ 18,138,258, % Commercial 909 2,971,838, % 124,078,149 2,847,760, % Industrial 714 1,563,845, % 2,754,452 1,561,091, % Irrigated 6 2,827, % - 2,827, % Recreational ,071, % 2,932, ,138, % Institutional ,482, % 222,658, ,824, % Government 5 216, % 1, , % Miscellaneous 14 1,017, % - 1,017, % Vacant land 3, ,876, % 751, ,125, % SBE Nonunitary (11) 3,696, % - 3,696, % Possessory Int. (2,191) 114,257, % 715, ,541, % Unsecured (6,218) 870,884, % 15,907, ,976, % Unknown % % TOTALS: 52,217 $ 24,698,048, % $ 428,575,762 $ 24,269,472, % ASSESSED VALUE by USE CATEGORY Fiscal Year Industrial 6.33% All Others 7.96% NET TAXABLE VALUE by USE CATEGORY Fiscal Year Industrial 6.43% All Others 7.10% Commercia l 12.03% Residential 73.68% Commercial 11.73% Residential 74.74% Source: HdL Coren & Cone, Los Angeles County Assessor 2013/14 Combined Tax Rolls. 158
179 159
180 Direct and Overlapping Property Tax Rates (rate per $100 of assessed value) Last Ten Fiscal Years CASTAIC LOS LAKE COUNTY COUNTY Fiscal ANGELES WATER SCHOOL SANITATION FLOOD Year GENERAL COUNTY AGENCY DISTRICTS DISTRICTS CONTROL TOTAL DIRECT and OVERLAPPING PROPERTY TAX RATES Fiscal Year GENERAL LA COUNTY CASTAIC LAKE WATER AGENCY SCHOOL DISTRICTS SANITATION DISTRICTS FLOOD CONTROL Source: HdL Coren & Cone, Los Angeles County Assessor Tax Rate Table 160
181 Direct and Overlapping Property Tax Rates (rate per $100 of assessed value) One Year Detail of Rates Producing Revenue for City and Associated Redevelopment Agencies City General Fund Direct Rates RDA Incremental Rate Total Direct Rate City Share Prop. 13 of 1% Total City plus applicable Roll Year per Prop. 13 Debt Rates Rates voter-approved debt % % Agency City of Santa Clarita Tax District 1 (249.01) Notes: General fund tax rates are Castaic Lake Water Agency (302.01) representative and based upon the direct Children's Institutional Tuition Fund (400.21) and overlapping rates for the largest Consolidated Fire Protection District of LA Co. (007.30) General Fund tax rates area (TRA) by net County School Service Fund Newhall (581.06) taxable value. Total Direct Rate is the County School Service Hart William S. Hart (757.06) weighted average of all individual direct County School Services (400.15) rates applied by the government preparing Development Center Handicapped Minor Newhall (581.07) the statistical section information. Educational Augmentation Fund Impound (400.01) The percentages presented in the columns Educational Revenue Augmentation Fund (ERAF) (400.00) above do not sum across rows. In 1978 Greater LA Co. Vector Control (061.80) California voters passed Proposition 13, LA County Library (003.01) which set the property tax at a 1.00% fixed LA County Fire - Ffw (007.31) amount. This 1.00% is shared by all the LA County Flood Control Improvement District (030.10) taxing agencies for which the subject LA County Flood Control Maintenance (030.70) property resides within. In addition to the LA County General (001.05) % fixed amount, property owners are LA County Accum Cap Outlay (001.20) charged taxes as a percentage of assessed Newhall School District (581.01) property values for the payment of any Santa Clarita Community College (814.04) voter-approved bonds. Santa Clarita Street Light Maintenance #2 (249.32) Santa Clarita Valley Sanitation Dist. LA Co Valencia Areawide Landscape T1A S.C William S. Hart Elementary School Fund (757.07) William S. Hart Union High (757.02) Total Prop. 13 Rate: Castaic Lake Water Agency (302.01) Newhall Elementary School District Debt Services 1999 Ser. B (581.53) Newhall Elementary School District Debt Services 1999 Ser. A (581.52) Santa Clarita Community College Debt Services 2001 Ser (814.54) Santa Clarita Community College Debt Services 2006 Ser (814.55) Santa Clarita Community College Debt Services 2005 Refunding Bonds ( Santa Clarita Community College Debt Services 2001 Ser (814.52) Santa Clarita Community College Debt Services 2006 Ser William S. Hart Un.Hsd Debt Services (757.51) William S. Hart Un.Hsd Debt Services 2008 Ser. B William S. Hart Un.Hsd Debt Services 2008 Ser. C William S. Hart Unified Debt Services 2001 Ser. B (757.52) William S. Hart Unified Debt Services 2008 Ser. A (757.53) Total Tax Rate Source: HdL Coren & Cone, Los Angeles County Assessor 2013/14 Tax Rate Table 161
182 Principal Property Taxpayers Current Fiscal Year and Nine Fiscal Years Ago FISCAL YEAR FISCAL YEAR PERCENT of PERCENT of Number TOTAL TOTAL CITY Number TOTAL TOTAL CITY of ASSESSED ASSESSED of ASSESSED ASSESSED OWNER/TAXPAYER Parcels VALUE VALUE OWNER/TAXPAYER Parcels VALUE VALUE Valencia Town Center 17 $ 358,378, % Valencia Town Center Venture 30 $ 129,100, % Saugus Colony Limited ,548, Thomas Properties Group LLC 15 58,294, VTC Business Center LLC 9 138,852, EQR Valencia LLC ,813, Park Sierra Properties ,889, EQR Essex Place Financing 2 48,863, EQR Valencia LLC ,997, Palmer Saugus Ltd 22 48,120, Packard Humanities Institute 1 97,350, Town Center Apartments Inc 1 47,204, EQR The Oaks LLC 28 96,921, Westcreek Properties Ltd ,835, Walmart/Sam s 5 78,157, Newhall Land and Farming Co ,213, RREEF America Reit II Corporation 2 75,033, F and F WC Americana Canyon Assoc LP ,368, Time Warner Cable 4 65,264, EQR Town Center LLC 3 33,460, Total 319 1,281,394, % ,274, % All Others 22,988,078, ,071,594, Total Assessed Valuation $ 24,269,472, % $ 13,606,868, % NOTE: The amounts shown above include assessed value data for both the City and the Redevelopment Agency. Source: HdL Coren & Cone, LA County Assessor 2013/14 Combined Tax Rolls 162

183 Property Tax Levies, Tax Collections and Delinquencies Last Ten Fiscal Years COLLECTIONS TOTAL PERCENT FISCAL TAXES PERCENT IN SUBSEQUENT COLLECTIONS COLLECTIONS YEAR LEVIED COLLECTIONS COLLECTIONS YEARS TO DATE TO DATE ,118,983 9,878, % - 9,878, % ,593,852 11,292, % 20,076 11,312, % ,804,630 12,317, % 2,689 12,320, % ,483,825 13,754, % 32,577 13,786, % ,925,285 11,361, % 16,722 11,378, % ,202,626 13,711, % - 13,711, % ,172,030 13,829, % 50,605 13,880, % ,299,999 13,999, % 49,862 14,049, % ,634,850 18,297, % - 18,297, % ,446,963 21,128, % - 21,128, % 25,000,000 TAX COLLECTIONS & DELINQUENCY - LAST TEN FISCAL YEARS 20,000,000 15,000,000 10,000,000 5,000, FISCALYEAR LEVIES COLLECTIONS DELINQUENT AMOUNT NOTES: Article XIII-A of the Constitution of the State of California, adopted by the electorate in June 1978, precludes the City from a local property tax levy. All general-purpose property taxes are levied by the County and allocated to other governmental entities on a predetermined formula. The above figures include secured property taxes only. Prior to the implementation of GASB 44 in FY 2006, collections in subsequent years were not required to be reported by tax year. Beginning in FY 2007, collections in subsequent years are included. Source: County of Los Angeles, Department of Auditor-Controller 163
184 Successor Agency Top Property Owners Based on Net Values Fiscal Year Secured Unsecured Combined Owner Parcels Value % of Net AV Parcels Values % of Net AV Value % of Net AV Primary Use 1) Casden Santa Clarita LLC (Pending Appeals On Parcels) 24 $ 61,764, % $ 61,764, % Vacant 2) Time Warner Cable 5 $ 41,384, % 41,384, % Unsecured 3) Saugus Station LLC 6 17,554, % 17,554, % Industrial 4) Lyons Properties Limited (Pending Appeals On Parcels) 5) Peter and Barbara Coeler, et. al. (Pending Appeals On Parcels) 1 3 9,100,000 8,817, % 1.62% 1 10, % 9,100,000 8,827, % 1.43% Commercial Residential 6) David Weiswasser Trust 7) San Fernando LLC 8) RFT Sprouts LLC, et. al. 9) San Fernando Road Landco LLC 10) Daiciaber Ccommercial Development Top Ten Total 2 7,908, % 7,908, % Residential 1 7,887, % 7,887, % Commercial 3 7,551, % 7,551, % Residential 1 7,129, % 7,129, % Institutional 2 6,363, % 6,363, % Commercial ,076, % 6 41,394, % 175,471, % Agency Total Incremental Net AV Total 545,046,409 71,468, ,515,402 $ 298,871, % $ 53,537, % $ 352,409, % 164
185 Successor Agency Project Area Assessment Appeals Summary and Tax Collection History Fiscal Years Through Total No. of Appeals No. of Resolved Appeals Project Area Assessment Appeals Summary FY No. of Successful Appeals Average Reduction No. & Value of Appeals Pending Estimated No. of Appeals Allowed Reduction on Pending Appeals Allowed % $ 79,834,505 $ 208,855,587 Tax Collection History For Fiscal Years Through Year Tax Levy Current Year Collection Prior Year Collection Total Current Year Collection Percentage Total Collection Percentage $ 3,978,489 $ 3,773,188 $ 229,455 $ 4,002,642 95% 101% ,068,572 3,885,719 42,260 3,927,979 96% 97% ,618,835 2,744,263 (204,741) 2,539,523 76% 70% (1) 3,762,457 2,934, ,094 3,152,998 78% 84% (1) 3,485,808 2,786, ,290 3,062,081 80% 88% (1) 3,498,271 2,828, ,124 3,643,619 81% 104% Source: Los Angeles County Auditor/Controller, Disbursement/Tax Division CRA Remittance Advice from Fiscal Years through , and for Fiscal Year , November 2011 through January (1) Sources: Ledgers and special reports from Los Angeles County Auditor-Controller commencing February 2012 pursuant to AB X
186 Successor Agency Charge Detail Report for CFD (Valencia Town Center) Fiscal Year ASSESSOR S PARCEL NUMBER PROPERTY OWNER LAND ASSESSED VALUES ($) STRUCTURE ASSESSED VALUES ($) TOTAL ASSESSED VALUES ($) TAXABLE ACREAGE Valencia Town Center Venture LP $ 1,188,547 $ 181,110 $ 1,369, Valencia Town Center Venture LP 3,294,460 17,127,213 20,421, Valencia Town Center Venture LP 26,034,983 3,208,239 29,243, Valencia Town Center Venture LP 829,364 82, , Valencia Town Center Venture LP 4,478, ,043 4,861, Valencia Town Center Venture LP 15,144, ,135, ,279, Valencia Town Center Venture LP 3,124,188 9,055,625 12,179, Valencia Town Center Venture LP 407, , , Totals: $ 54,501,542 $ 190,376,492 $ 244,878,
187 CLASS MAX TAX RATE ($) MAX TAX APPLIED RATE ($) CHARGE ($) 1 $ 33,575 $ 28,341 $ 24,919 $ 21, , ,495 24, , , ,521 24, , ,575 39,753 24,919 29, , ,951 24, ,954 1 & 2 33,575 & 226, ,526 24, , ,575 68,828 24,919 51, ,575 11,013 24,919 8,173 $ 1,144,
188 Ratio of Outstanding Debt by Type Last Ten Fiscal Years GOVERNMENTAL ACTIVITIES FISCAL CERTIFICATES TAX ALLOCATION CAPITAL YEAR OF PARTICIPATION (1) (3) LOANS BONDS (2) BONDS (4) LEASES TOTAL $ 17,640,000 $ 1,390,000 $ 5,698,192 $ - $ - $ - $ 23,798 $ 24,751, ,700, ,000 5,029, ,211 23,451, ,760,000-4,328,207 13,785, ,401 34,909, ,790,000 15,525,000 3,593,734 13,575,000 29,860,000 8,850,000 23,676 87,217, ,790,000 15,525,000 2,823,907 13,330,000 29,860,000 8,850,000 11,370 85,190, ,760,000 15,525,000 2,017,793 13,075,000 29,460,000 8,730,000 1,624 82,569, ,700,000 15,525,000 1,413,786 12,805,000 29,040,000 8,605,000-80,088, ,610,000 15,490,000 1,040,000 12,525, ,417 40,907, ,480,549 15,379, ,000 12,316, ,880 39,188, ,323,138 15,291, ,000 12,002, ,705 37,351,839 NOTES: (1) In 1991 the Santa Clarita Public Financing Authority issued $22,940,000 aggregate principal amount of Local Agency (Redevelopment) Revenue Bonds Series Simultaneously with the receipt of the Bond proceeds, the Authority acquired $22,940,000 Certificates of Participation issued by the Santa Clarita Redevelopment Agency, of which the proceeds were transferred to the City to finance and/or refinance the design, acquisition, improvement or construction of land, the City Hall Building and certain road improvements, and to refinance certain debt. The Agency leased back the facilities to the City for lease payments to be made by the City to the Authority equal to the principal and interest due on the revenue bonds. At this point in time, the Agency is not active. -The 1991 Series certificates were later refunded in fiscal year by the Certificates of Participation Series 1997 of $19,670,000. As a result, the 1991 Series certificates are considered to be defeased and the liability for those certificates was removed from the general long-term debt. -On July 1, 2005, the Santa Clarita Public Financing Authority issued $17,700,000 in Certificates of Participation to advance refund $17,640,000 of outstanding 1997 Series certificates. As a result, the 1997 Series were considered defeased and the liability for those certificates was removed from the long-term liability. -In November 2001, the Santa Clarita Public Financing Authority issued $3,200,000 in Certificates of Participation for the acquisition of parkland. In 2006 the COP Series 2001 were considered defeased and the liability for those certificates was removed from the general long-term debt. (2) On January 16, 2007, the Santa Clarita Public Financing Authority issued $13,785,000 Lease Revenue Bonds, Series 2007 for the acquisition of right-of-way. (3) On December 1, 2007, the Santa Clarita Public Financing Authority issued $15,525,000 in Certificates of Participation for the acquisition of open space and parkland. (4) On June 1, 2008, the Santa Clarita Redevelopment Agency issued $29,860,000 in Non-Housing Tax Allocation Bonds and $8,850,000 in Low/Mod Housing Tax Allocations Bonds to fund certain redevelopment projects within the Newhall Redevelopment Project area. Upon the dissolution of redevelopment agencies in the State of California effective February 1, 2012, the bonds were transferred to the RDA Successor Agency. Sources: City of Santa Clarita, Administrative Services Department - Finance Division 168
189 BUSINESS-TYPE ACTIVITIES PERCENTAGE OF OUTSTANDING TOTAL TAXABLE DEBT DEBT TO LEASE PRIMARY ASSESSED PER PERSONAL PAYABLE TOTAL GOVERNMENT VALUE CAPITA INCOME $ 1,919,312 $ 1,919,312 $ 26,671, % $ 160 3% 1,586,319 1,586,319 25,037, % 150 2% 1,236,869 1,236,869 36,146, % 206 3% 870, ,149 88,087, % 500 6% 485, ,304 85,675, % 484 5% 248, ,304 82,817, % 466 5% ,088, % 454 N/A ,907, % 231 N/A ,188, % 191 N/A ,351, % 179 N/A OUTSTANDING DEBT PER CAPITA Last Ten Fiscal Years $500 $454 $484 $ $206 $231 $191 $ $160 $ Fiscal Year 169
190 Ratio of General Bonded Debt Outstanding Last Ten Fiscal Years PERCENTAGE OUTSTANDING GENERAL BONDED DEBT OF TAXABLE DEBT FISCAL REVENUE CERTIFICATES OF ASSESSED PER YEAR POPULATION (1) BONDS PARTICIPATION TOTAL VALUE CAPITA ,958 $ - $ 19,030,000 $ 19,030, % $ ,412-18,410,000 18,410, % ,676 13,893,228 16,760,000 30,653, % ,030 13,575,000 31,315,000 44,890, % ,150 13,330,000 30,315,000 43,645, % ,641 13,075,000 29,285,000 42,360, % ,320 12,805,000 28,225,000 41,030, % ,445 12,525,000 27,100,000 39,625, % ,951 12,316,280 25,859,898 38,176, % ,130 12,002,622 24,614,512 36,617, % $114 $110 GENERAL BONDED DEBT OUTSTANDING PER CAPITA Last Ten Fiscal Years $174 $255 $246 $238 $233 $223 $ $175 Fiscal Year Source: (1) State of California, Finance Department 170
191 Direct and Overlapping Bonded Debt June 30, Assessed Valuation: $24,269,472,731 (Net of Redevelopment Agency Incremental Value of $352,409,188) Population: 209,130 Percent City s Share Total Debt Applicable of Debt 06/30/2014 To City (1) 06/30/2014 OVERLAPPING TAX AND OVERLAPPING BONDED DEBT: Los Angeles County Flood Control District $ 17,480, % $ 375,470 Santa Clarita Community College District 169,298, ,667,297 William S. Hart Union High School District 388,858, ,116,454 William S. Hart Union High School District - Community Facilities District No , ,000 William S. Hart Union High School District - Community Facilities District No ,405, ,405,000 William S. Hart Union High School District - Community Facilities District No , ,000 William S. Hart Union High School District - Community Facilities District No , ,000 Los Angeles County Community College and Unified School Districts 14,176,520, ,418 Castaic Union School District 16,168, ,416,980 Newhall School District 20,490, ,396,450 Newhall School District School Facilities Improvement District No ,992, ,565,200 Saugus Union School District 40,227, ,202,037 Saugus Union School District Community Facilities District No , Improvement Area N 7,900, ,900,000 Sulphur Springs Union School District 18,506, ,973,505 City of Santa Clarita Open Space and Parkland Assessment District 15,340, ,340,000 City of Santa Clarita Community Facilities District No ,210, ,210,000 City of Santa Clarita 1915 Act Bonds 855, ,000 Los Angeles County Regional Park and Open Space Assessment District 113,615, ,421,136 Total Overlapping Tax and Assessment Debt $ 546,260,947 DIRECT AND OVERLAPPING GENERAL FUND DEBT: Los Angeles County General Fund Obligations $ 1,835,420, % $ 39,112,801 Los Angeles County Superintendent of Schools - Certificates of Participation 9,529, ,082 Los Angeles County Sanitation District No. 23 Authority 2,396, ,301 Los Angeles County Sanitation District No. 32 Authority 21,527, ,839,641 Santa Clarita Community College District - Certificates of Participation 18,750, ,364,063 William S. Hart Union High School District - Certificates of Participation 6,000, ,275,840 Castaic Union School District - Certificates of Participation 3,960, ,081,832 Saugus Union School District - Certificates of Participation 27,365, ,265,997 Sulphur Springs Union School District - Certificates of Participation 24,272, ,261,273 Los Angeles Unified School District - Certificates of Participation 365,858, City of Santa Clarita Certificates of Participation 21,979, ,979,705 (2) Total Gross Direct and Overlapping General Fund Debt $ 141,386,572 Less: Los Angeles County General Fund Obligations supported by landfill revenues 107,301 Total Net Direct and Overlapping General Fund Debt $ 141,279,271 OVERLAPPING TAX INCREMENT DEBT (Successor Agency): 35,890, % 35,890,000 Total Direct Debt $ 37,319,705 Gross Overlapping Debt 686,217,814 Total Gross Direct and Overlapping Debt $ 723,537,519 (3) Net Total Overlapping Debt $ 686,110,513 Net Combined Total Debt $ 723,430,218 (1) Percentage of overlapping agency s assessed valuation located within boundaries of the City. (2) Includes $154,705 Capital Lease obligations and $580,000 CDBG Loan. (3) Excludes tax and revenue anticipation notes, enterprise revenue, mortgage revenue, and tax allocation bonds and non-bonded capital lease obligations. Ratios to Adjusted Assessed Valuation Per Capita Total Direct Debt ($15,340,000) 0.06% $ 2, Gross Combined Total Debt 2.98% Net Combined Total Debt 2.98% $ 3, Source: Muniservices STATE SCHOOL BUILDING AID REPAYABLE AS OF 6/30/2014: $0 171
192 Legal Debt Margin Information Last Ten Fiscal Years FISCAL YEAR Assessed valuation $ 24,698,048,493 $ 21,399,181,358 $ 21,556,659,612 $ 21,457,646,707 $ 21,600,880,848 Conversion percentage 25% 25% 25% 25% 25% Adjusted assessed valuation 6,174,512,123 5,349,795,340 5,381,596,232 5,364,411,752 5,400,220,212 Debt limit percentage 15% 15% 15% 15% 15% Debt limit 926,176, ,469, ,239, ,661, ,033,032 Total net debt applicable to limit: General obligation bonds Legal debt margin $ 926,176,818 $ 802,469,301 $ 807,239,435 $ 804,661,752 $ 810,033,032 Total debt applicable to the limit as a percentage of debt limit 0% 0% 0% 0% 0% Section of the Government Code of the State of California provides for a legal debt limit of 15% of gross assessed valuation. However, this provision was enacted when assessed valuation was based upon 25% market value. Effective with the fiscal year, each parcel is now assessed at 100% of market value (as of the most recent change in ownership for that parcel). The computations shown above reflect a conversion of assessed valuation data for each fiscal year from current full valuation perspective to the 25% level that was in effect at the time the legal debt margin was enacted by the State of California for local governments located within the State. Source: City of Santa Clarita, Administrative Services Department - Finance Division 172
193 FISCAL YEAR $ 21,740,884,855 $ 19,177,126,742 $ 17,160,386,817 $ 14,937,115,985 $ 13,795,632,501 25% 25% 25% 25% 25% 5,435,221,214 4,794,281,686 4,290,096,704 3,734,278,996 3,448,908,125 15% 15% 15% 15% 15% 815,283, ,142, ,514, ,141, ,336, $ 815,283,182 $ 719,142,253 $ 643,514,506 $ 560,141,849 $ 517,336,219 0% 0% 0% 0% 0% 1, LEGAL DEBT MARGIN Last Ten Fiscal Years (in Millions) FISCAL YEAR 173
194 Pledged Revenue Coverage Last Ten Fiscal Years TRANSIT LESS NET Fiscal TRANSIT OPERATING AVAILABLE DEBT SERVICE Year REVENUES (1) EXPENSES (2) REVENUES Principal Interest COVERAGE $ 35,677,983 $ 14,037,109 $ 21,640,874 $ 317,312 $ 102, % ,041,436 17,242,035 4,799, ,993 86, % ,468,288 19,033, , ,449 69, % ,888,921 22,204,777 2,684, ,720 60, % ,612,418 23,014,324 3,598, ,846 42, % ,179,438 23,525,855 (2,346,417) 236,999 23, % ,507,582 24,270,533 8,237, ,304 11, % ,133,433 25,175, , % ,420,486 25,901,822 3,518, ,298,907 27,044,874 6,254, NOTE: (1) Includes Other revenues, Transfers in and Capital contributions (2) Includes Transfers out and Other expenses 174
195 Demographic and Economic Statistics Last Ten Calendar Years AVERAGE AVERAGE PER CITY OF ANNUAL LOS ANGELES ANNUAL CAPITA TOTAL SANTA CLARITA PERCENTAGE COUNTY PERCENTAGE PERSONAL PERSONAL UNEMPLOYMENT YEAR POPULATION (1) INCREASE POPULATION (1) INCREASE INCOME (2) INCOME (2) RATE (3) , % 9,806, % $ 33,179 $ 338,209, % , % 9,816, % 35, ,193, % , % 9,798, % 36, ,732, % , % 9,780, % 39, ,107, % , % 9,785, % 44, ,707, % , % 9,801, % 43, ,832, % , % 9,822, % 43, ,365, % , % 9,818, % 44, ,044, % , % 9,884, % 46, ,831, % , % 9,958, % N/A N/A 6.60% , % 10,041, % N/A N/A 4.70% 17.00% 15.00% 13.00% 11.00% 9.00% 7.00% 5.00% 3.00% 1.00% -1.00% 15.50% 5.29% 1.25% -0.11% 0.22% 0.43% 0.54% 0.15% 0.64% 2.04% YEAR Sources: (1) State of California, Finance Department, as of 1/1/2014 (2) U.S. Department of Commerce, Bureau of Economic Analysis (BEA) Personal Income and Unemployment rates are for the regional area, Los Angeles. The City s related information is not available. Information lags two years. (3) State of California, Department of Employment Development (EDD) 175
196 Principal Employers Current Fiscal Year and Nine Fiscal Years Ago 2014* 2005 PERCENT PERCENT NUMBER of NUMBER of of TOTAL of TOTAL EMPLOYER EMPLOYEESEMPLOYMENT EMPLOYER EMPLOYEESEMPLOYMENT Six Flags Magic Mountain 4, % Vons Grocery Company % Princess Cruises 1, % Home Depot % Henry Mayo Newhall Memorial Hospital 1, % Robinsons May % Quest Diagnostics (formerly Speciality % Shield Health Care Center % The Master's College % Costco Wholesale % Boston Scientific % Target Stores % Woodward HRT (formerly HR Textron) % Frontier Toyota % Cal Arts % JC Penney % Walmart % Lowe s % Aerospace Dynamics % Best Buy % Largest firms (1) 12, % Largest firms (1) 2, % All others 5, % All others N/A N/A Grand total 18, % Grand total 2, % * As of March 2014 NOTE: (1) Non-governmental employers Source: 2013, 2010 Santa Clarita Valley - Real Estate and Economic Outlook 176
 - - - - - - - - - - Public works 125.00 129.00 126.00 127.00 128.00 135.50 136.50 133.50 115.00 146.00 Community development 41.00 32.00 30.50 33.")
197 Full-Time and Part-Time City Employees by Function Last Ten Fiscal Years FISCAL YEAR Function General government Public safety (1) Public works Community development Parks and Recreation Transit Totals CITY OF SANTA CLARITA - EMPLOYEES Last Ten Fiscal Years Fiscal Year (1) Police and Fire services have been provided by the County Source: City of Santa Clarita, Administrative Services Department - Finance Division 177
CITY OF GOLETA Comprehensive Annual Financial Report for Fiscal Year Ending June 30, 2014
 Comprehensive Annual Financial Report for Fiscal Year Ending June 30, 2014 , CALIFORNIA COMPREHENSIVE ANNUAL FINANCIAL REPORT WITH REPORT ON AUDIT BY INDEPENDENT CERTIFIED PUBLIC ACCOUNTANTS YEAR ENDED
CITY OF SOUTH GATE, CALIFORNIA COMPREHENSIVE ANNUAL FINANCIAL REPORT JUNE 30, 2012
 , CALIFORNIA COMPREHENSIVE ANNUAL FINANCIAL REPORT JUNE 30, 2012 , CALIFORNIA COMPREHENSIVE ANNUAL FINANCIAL REPORT JUNE 30, 2012 PREPARED BY: DEPARTMENT OF FINANCE COMPREHENSIVE ANNUAL FINANCIAL REPORT
CITY OF LAGUNA BEACH, CALIFORNIA. Comprehensive Annual Financial Report. For the Fiscal Year Ended June 30, 2015
 CITY OF LAGUNA BEACH, CALIFORNIA Comprehensive Annual Financial Report For the Fiscal Year Ended June 30, 2015 CITY OF LAGUNA BEACH, CALIFORNIA COMPREHENSIVE ANNUAL FINANCIAL REPORT FOR THE FISCAL YEAR
CAFR COMPREHENSIVE ANNUAL FINANCIAL REPORT
 C I T Y OF LY N WO OD FISCAL YEAR 2014-2015 CAFR COMPREHENSIVE ANNUAL FINANCIAL REPORT Y E A R E N DING J U N E 3 0, 2 0 1 5 Comprehensive Annual Financial Report City of Lynwood, California with Report
CITY OF SOUTH GATE, CALIFORNIA COMPREHENSIVE ANNUAL FINANCIAL REPORT JUNE 30, 2014
 , CALIFORNIA COMPREHENSIVE ANNUAL FINANCIAL REPORT JUNE 30, 2014 , CALIFORNIA COMPREHENSIVE ANNUAL FINANCIAL REPORT JUNE 30, 2014 PREPARED BY: DEPARTMENT OF FINANCE THIS PAGE INTENTIONALLY LEFT BLANK COMPREHENSIVE
This page intentionally left blank.
 This page intentionally left blank. , CALIFORNIA COMPREHENSIVE ANNUAL FINANCIAL REPORT FOR THE FISCAL YEAR ENDED JUNE 30, 2017 Prepared By Finance Department This page intentionally left blank. COMPREHENSIVE
CITY OF COMPTON STATE OF CALIFORNIA. Comprehensive Annual Financial Report. Fiscal Year Ended June 30, 2009
 STATE OF CALIFORNIA Comprehensive Annual Financial Report Fiscal Year Ended Comprehensive Annual Financial Report Table of Contents Page(s) Independent Auditor s Report... 1 Management s Discussion and
CITY OF ROLLING HILLS, CALIFORNIA FINANCIAL STATEMENTS FOR THE FISCAL YEAR ENDED JUNE 30, 2017
 , CALIFORNIA FINANCIAL STATEMENTS FOR THE FISCAL YEAR ENDED JUNE 30, 2017 PREPARED BY: THE CITY OF ROLLING HILLS, CALIFORNIA FINANCIAL SERVICES DEPARTMENT THIS PAGE INTENTIONALLY LEFT BLANK FINANCIAL STATEMENTS
CITY OF ATWATER, CALIFORNIA ANNUAL FINANCIAL REPORT FOR THE FISCAL YEAR ENDED JUNE 30, 2016
 CITY OF ATWATER, CALIFORNIA ANNUAL FINANCIAL REPORT FOR THE FISCAL YEAR ENDED JUNE 30, 2016 Prepared by: Finance Department This page intentionally left blank. Basic Financial Statements Table of Contents
CITY OF WATERTOWN Watertown, Wisconsin
 Watertown, Wisconsin FINANCIAL STATEMENTS Including Independent Auditors Report TABLE OF CONTENTS Independent Auditors' Report i ii Required Supplementary Information Management s Discussion and Analysis
YEO & YEO CPAs & BUSINESS CONSULTANTS
 , Michigan Comprehensive Annual Financial Report For the Year Ended June 30, 2017 YEO & YEO CPAs & BUSINESS CONSULTANTS Comprehensive Annual Financial Report County of Washtenaw State of Michigan Fiscal
CITY OF BANNING, CALIFORNIA FINANCIAL STATEMENTS FOR THE FISCAL YEAR ENDED JUNE 30, 2017
 , CALIFORNIA FINANCIAL STATEMENTS FOR THE FISCAL YEAR ENDED JUNE 30, 2017 THIS PAGE INTENTIONALLY LEFT BLANK FINANCIAL STATEMENTS FOR THE FISCAL YEAR ENDED JUNE 30, 2017 TABLE OF CONTENTS Page Number INDEPENDENT
City of Alhambra California. Comprehensive Annual Financial Report
 City of Alhambra California Comprehensive Annual Financial Report For the year ended June 30, 2013 On the Cover: Almansor Park Playground The City opened the newly renovated playground in Almansor Park
CITY OF INGLEWOOD BASIC FINANCIAL STATEMENTS AND SUPPLEMENTAL INFORMATION FOR THE YEAR ENDED SEPTEMBER 30, 2015
 BASIC FINANCIAL STATEMENTS AND SUPPLEMENTAL INFORMATION FOR THE YEAR ENDED SEPTEMBER 30, 2015 BASIC FINANCIAL STATEMENTS AND SUPPLEMENTAL INFORMATION FOR THE YEAR ENDED SEPTEMBER 30, 2015 THIS PAGE INTENTIONALLY
CITY OF WEST BEND West Bend, Wisconsin
 West Bend, Wisconsin FINANCIAL STATEMENTS Including Independent Auditors Report TABLE OF CONTENTS Page Independent Auditors Report i ii Required Supplementary Information Management s Discussion and Analysis
CITY OF BANNING, CALIFORNIA FINANCIAL STATEMENTS FOR THE FISCAL YEAR ENDED JUNE 30, 2016
 , CALIFORNIA FINANCIAL STATEMENTS FOR THE FISCAL YEAR ENDED JUNE 30, 2016 , CALIFORNIA FINANCIAL STATEMENTS FOR THE FISCAL YEAR ENDED JUNE 30, 2016 THIS PAGE INTENTIONALLY LEFT BLANK FINANCIAL STATEMENTS
Celebrating 25 Years of Excellence
 Celebrating 25 Years of Excellence Comprehensive Annual Financial Report Fiscal Year Ended June 30, 2017 Chino Hills, California , CALIFORNIA COMPREHENSIVE ANNUAL FINANCIAL REPORT FISCAL YEAR ENDED JUNE
Town of Wellington, Colorado. Financial Statements and Supplementary Information For the Year Ended December 31, 2017
 , Colorado Financial Statements and Supplementary Information For the Year Ended December 31, 2017 < Contents Independent Auditor s Report 1-2 Management s Discussion and Analysis 3-15 Basic Financial
CITY OF HEALDSBURG HEALDSBURG, CALIFORNIA COMPREHENSIVE ANNUAL FINANCIAL REPORT WITH REPORT ON AUDIT BY INDEPENDENT CERTIFIED PUBLIC ACCOUNTANTS
 HEALDSBURG, CALIFORNIA COMPREHENSIVE ANNUAL FINANCIAL REPORT WITH REPORT ON AUDIT BY INDEPENDENT CERTIFIED PUBLIC ACCOUNTANTS FISCAL YEAR ENDED JUNE 30, 2008 Prepared by the Finance Department COMPREHENSIVE
Town of Wellington, Colorado. Financial Statements and Supplementary Information For the Year Ended December 31, 2016
 , Colorado Financial Statements and Supplementary Information For the Year Ended December 31, 2016 Contents Independent Auditor s Report 1-2 Management s Discussion and Analysis 3-15 Basic Financial Statements:
City of Merced, California
 For the Fiscal Year Ended June 30, 2015 Basic Financial Statements, California Merced, California Annual Financial Report For the year ended June 30, 2015 This page intentionally left blank Annual Financial
CITY OF SANTA PAULA FINANCIAL STATEMENTS
 CITY OF SANTA PAULA FINANCIAL STATEMENTS Year Ended Financial Statements Year Ended TABLE OF CONTENTS Page Independent Auditor s Report Management s Discussion and Analysis i - iii iv - xii Basic Financial
FINANCIAL STATEMENTS FOR THE FISCAL YEAR ENDED JUNE 30, With Report of. Certified Public Accountants
 FINANCIAL STATEMENTS FOR THE FISCAL YEAR ENDED JUNE 30, 2018 With Report of Certified Public Accountants Table of Contents Independent Auditor s Report... 1 Management s Discussion and Analysis... 5 Basic
VILLAGE OF GOLF, FLORIDA COMPREHENSIVE ANNUAL FINANCIAL REPORT FOR THE FISCAL YEAR ENDED SEPTEMBER 30, 2014
 VILLAGE OF GOLF, FLORIDA COMPREHENSIVE ANNUAL FINANCIAL REPORT FOR THE FISCAL YEAR ENDED SEPTEMBER 30, 2014 Prepared by: Finance Department VILLAGE OF GOLF, FLORIDA TABLE OF CONTENTS INTRODUCTORY SECTION
COMPREHENSIVE ANNUAL FINANCIAL REPORT Fiscal Year Ended June 30, 2016
 COMPREHENSIVE ANNUAL FINANCIAL REPORT Fiscal Year Ended June 30, 2016 This page intentionally left blank. CITY OF SONOMA, CALIFORNIA COMPREHENSIVE ANNUAL FINANCIAL REPORT FOR THE FISCAL YEAR ENDED JUNE
CITY OF UNIVERSITY CITY, MISSOURI COMPREHENSIVE ANNUAL FINANCIAL REPORT FOR THE FISCAL YEAR ENDED JUNE 30, 2017
 COMPREHENSIVE ANNUAL FINANCIAL REPORT FOR THE FISCAL YEAR ENDED JUNE 30, 2017 Report prepared and submitted by the Department Of Finance Tina Charumilind Director of Finance Contents Section I - Introductory
TOWN OF MEDLEY, FLORIDA Financial Section, Required Supplementary Information, Combining Fund Statements, and Supplementary Financial Reports
 TOWN OF MEDLEY, FLORIDA Financial Section, Required Supplementary Information, Combining Fund Statements, and Supplementary Financial Reports Compliance Section With Independent Auditors Report TABLE OF
TOWN OF MEDLEY, FLORIDA FINANCIAL SECTION, REQUIRED SUPPLEMENTARY INFORMATION, COMBINING FUND STATEMENTS, AND SUPPLEMENTARY FINANCIAL REPORTS
 FINANCIAL SECTION, REQUIRED SUPPLEMENTARY INFORMATION, COMBINING FUND STATEMENTS, AND SUPPLEMENTARY FINANCIAL REPORTS COMPLIANCE SECTION Year Ended CONTENTS Independent Auditors Report 1 Financial Section:
CITY OF NEDERLAND, TEXAS. Comprehensive Annual Financial Report
 Comprehensive Annual Financial Report For the Year Ended September 30, 2014 Prepared by the Finance Department INTRODUCTORY SECTION Comprehensive Annual Financial Report September 30, 2014 Table of Contents
City of La Mesa La Mesa, California. Basic Financial Statements and Independent Auditor s Report
 City of La Mesa La Mesa, California Basic Financial Statements and Independent Auditor s Report This page left intentionally blank. Basic Financial Statements Table of Contents Page Independent Auditor's
City of Princeton, Illinois. Annual Financial Report. For the Fiscal Year Ended April 30, 2015
 Annual Financial Report For the Fiscal Year Ended TABLE OF CONTENTS Page Management s Discussion and Analysis... 4 Independent Auditors Report... 9 Basic Financial Statements: Statement of Net Position...
TOWN OF MEDLEY, FLORIDA Financial Section, Required Supplementary Information, Combining Fund Statements, and Supplementary Financial Reports
 TOWN OF MEDLEY, FLORIDA Financial Section, Required Supplementary Information, Combining Fund Statements, and Supplementary Financial Reports Compliance Section With Independent Auditors Report TABLE OF
City of Beaumont. Beaumont, California. Annual Financial Report and Independent Auditors Report
 Beaumont, California Annual Financial Report and Independent Auditors Report , California ANNUAL FINANCIAL REPORT For the fiscal year ended June 30, 2018 Prepared by the Finance Department Melana Taylor,
SPRINGVILLE CITY CORPORATION. Financial Statements and Independent Auditors Report. Year Ended June 30, 2017
 Financial Statements and Independent Auditors Report Year Ended June 30, 2017 Financial Statements and Independent Auditors Report Year Ended June 30, 2017 Table of Contents Page FINANCIAL SECTION Report
Comprehensive Annual Financial Report. City of Medford Oregon
 Comprehensive Annual Financial Report City of Medford Oregon For the Fiscal Year Ended June 30, 2015 , OREGON COMPREHENSIVE ANNUAL FINANCIAL REPORT FOR THE FISCAL YEAR ENDED JUNE 30, 2015 Prepared by:
Annual Financial Report. County of Stanislaus, California
 Annual Financial Report County of Stanislaus, California Fiscal Year Ended June 30, 2013 Annual Financial Report County of Stanislaus, California Fiscal Year Ended June 30, 2013 Prepared By Stanislaus
CITY OF MONTE VISTA, COLORADO
 FINANCIAL STATEMENTS TABLE OF CONTENTS Independent Auditor s Report Management s Discussion and Analysis a - c i - xi Basic Financial Statements Statement of Net Position 1 Statement of Activities 2 Balance
City of Tombstone, Arizona Financial Statements. Year Ended June 30, 2016
 City of Tombstone, Arizona Financial Statements Year Ended June 30, 2016 CONTENTS Page INDEPENDENT AUDITOR S REPORT 1 MANAGEMENT S DISCUSSION AND ANALYSIS (MD&A) (Required Supplementary Information) 5
CITY OF COATESVILLE COATESVILLE, PENNSYLVANIA
 COATESVILLE, PENNSYLVANIA BASIC FINANCIAL STATEMENTS WITH SUPPLEMENTARY INFORMATION DECEMBER 31, 2014 TABLE OF CONTENTS PAGE INDEPENDENT AUDITOR S REPORT 1-3 MANAGEMENT S DISCUSSION AND ANALYSIS 4-12 BASIC
City of Murphy, Texas
 Comprehensive Annual Financial Report Fiscal Year Ended September 30, 2018 Prepared by: Finance Department This Page Left Intentionally Blank Comprehensive Annual Financial Report For the Fiscal Year Ended
City of Waukee, Iowa INDEPENDENT AUDITOR'S REPORTS BASIC FINANCIAL STATEMENTS AND SUPPLEMENTARY INFORMATION SCHEDULE OF FINDINGS.
 INDEPENDENT AUDITOR'S REPORTS BASIC FINANCIAL STATEMENTS AND SUPPLEMENTARY INFORMATION SCHEDULE OF FINDINGS June 30, 2015 TABLE OF CONTENTS Page OFFICIALS 3 INDEPENDENT AUDITOR'S REPORT 4-5 MANAGEMENT'S
TOWN OF MAMMOTH LAKES California. Annual Financial Report June 30, 2016
 California Annual Financial Report Table of Contents INDEPENDENT AUDITOR S REPORT... 2-3 MANAGEMENT S DISCUSSION AND ANALYSIS (unaudited) Required Supplementary Information, as prepared by management...
TOWN OF FAIR HAVEN, VERMONT AUDIT REPORT
 AUDIT REPORT FOR THE YEAR ENDED JUNE 30, 2018 FOR THE YEAR ENDED JUNE 30, 2018 TABLE OF CONTENTS Independent Auditor s Report 1-2 Management s Discussion and Analysis 3-9 Basic Financial Statements: Government-Wide
On the Cover: Spring Eggstravaganza Almansor Park
 On the Cover: Spring Eggstravaganza Almansor Park The City celebrated its annual Spring Eggstravaganza on Saturday, April 19, 2014, with a helicopter drop of thousands of candy-filled eggs to a delighted
CITY OF DEERFIELD BEACH, FLORIDA
 COMPREHENSIVE ANNUAL FINANCIAL REPORT FOR THE FISCAL YEAR ENDED SEPTEMBER 30, 2014 Prepared by the Department of Financial Services Director of Finance, Hugh B. Dunkley Assistant Director of Finance, Sophia
Borough of East Stroudsburg East Stroudsburg, Pennsylvania Monroe County. Financial Statements Year Ended December 31, 2015
 Borough of East Stroudsburg East Stroudsburg, Pennsylvania Monroe County Financial Statements Year Ended CONTENTS INDEPENDENT AUDITOR'S REPORT 1 MANAGEMENT S DISCUSSION AND ANALYSIS 3 BASIC FINANCIAL STATEMENTS
City of Sartell Stearns and Benton Counties, Minnesota. Financial Statements. December 31, 2018
 Stearns and Benton Counties, Minnesota Financial Statements December 31, 2018 Table of Contents Elected Officials and Administration 1 Independent Auditor's Report 2 Management's Discussion and Analysis
CITY OF COATESVILLE COATESVILLE, PENNSYLVANIA
 COATESVILLE, PENNSYLVANIA BASIC FINANCIAL STATEMENTS WITH SUPPLEMENTARY INFORMATION DECEMBER 31, 2015 TABLE OF CONTENTS INDEPENDENT AUDITOR S REPORT 1-3 PAGE MANAGEMENT S DISCUSSION AND ANALYSIS 4-13 BASIC
SAUGUS UNION SCHOOL DISTRICT
 SAUGUS UNION SCHOOL DISTRICT Excellence in Elementary Education ANNUAL FINANCIAL REPORT TABLE OF CONTENTS FINANCIAL SECTION Independent Auditor's Report 2 Management's Discussion and Analysis 5 Basic Financial
CITY OF ROSEBUD, TEXAS FINANCIAL STATEMENTS AS OF
 FINANCIAL STATEMENTS AS OF SEPTEMBER 30, 2013 TOGETHER WITH INDEPENDENT AUDITORS REPORT THEREON AND SUPPLEMENTARY INFORMATION Prepared by: Donald L. Allman, CPA Certified Public Accountant 205 E. University
TOWN OF MEDLEY, FLORIDA FINANCIAL SECTION, REQUIRED SUPPLEMENTARY INFORMATION, COMBINING FUND STATEMENTS, AND SUPPLEMENTARY FINANCIAL REPORTS
 FINANCIAL SECTION, REQUIRED SUPPLEMENTARY INFORMATION, COMBINING FUND STATEMENTS, AND SUPPLEMENTARY FINANCIAL REPORTS COMPLIANCE SECTION Year Ended September 30, 2011 CONTENTS Independent Auditors Report
TOWN OF SHELBURNE, VERMONT AUDIT REPORT JUNE 30, 2017
 AUDIT REPORT AUDIT REPORT TABLE OF CONTENTS Page # Independent Auditor s Report 1-3 Management s Discussion and Analysis 4-12 Basic Financial Statements: Statement of Net Position Exhibit A 13 Statement
TOWN OF YARMOUTH, MAINE. Annual Financial Report. For the year ended June 30, 2017
 Annual Financial Report For the year ended June 30, 2017 Annual Financial Report Year ended June 30, 2017 Table of Contents Statement Page Independent Auditor's Report 1-3 Management s Discussion and Analysis
Prepared by Department of Finance
 COMPREHENSIVE ANNUAL FINANCIAL REPORT Year Ended September 30, 2016 Prepared by Department of Finance THIS PAGE INTENTIONALLY LEFT BLANK COMPREHENSIVE ANNUAL FINANCIAL REPORT TABLE OF CONTENTS Year Ended
Comprehensive Annual Financial Report. Fiscal Year Ended June 30, 2017
 Comprehensive Annual Financial Report Fiscal Year Ended June 30, 2017 CITY OF COVINGTON, GEORGIA COMPREHENSIVE ANNUAL FINANCIAL REPORT FOR THE FISCAL YEAR ENDED JUNE 30, 2017 Prepared by: Randy Smith,
CITY OF MAYWOOD ANNUAL FINANCIAL REPORT. Year Ended June 30, 2015
 CITY OF MAYWOOD ANNUAL FINANCIAL REPORT Annual Financial Report Table of Contents Independent Auditor s Report 1-3 Basic Financial Statements: Government-wide Financial Statements Statement of Net Position
Independent Auditors Report. To the Board of Finance Town of East Haddam, Connecticut. Report on the Financial Statements
 29 South Main Street P.O. Box 272000 West Hartford, CT 06127-2000 Tel 860.561.4000 Fax 860.521.9241 blumshapiro.com Independent Auditors Report To the Board of Finance Town of East Haddam, Connecticut
Town of Waterford, Connecticut. Annual Financial Report
 Town of Waterford, Connecticut Annual Financial Report Fiscal Year Ended June 30, 2017 Town of Waterford, Connecticut Annual Financial Report Fiscal Year Ended June 30, 2017 Finance Department Contents
CITY OF WAYNE, MICHIGAN
 FINANCIAL REPORT WITH SUPPLEMENTAL INFORMATION TABLE OF CONTENTS Independent Auditor's Report 1 Management s Discussion and Analysis 4 Financial Statements Government-wide Financial Statements Statement
CITY OF RACINE. Racine, Wisconsin FINANCIAL STATEMENTS. Including Independent Auditors' Report. As of and for the Year Ended December 31, 2013
 Racine, Wisconsin FINANCIAL STATEMENTS Including Independent Auditors' Report As of and for the Year Ended December 31, 2013 TABLE OF CONTENTS As of and for the Year Ended December 31, 2013 Independent
City of Clinton, Iowa. Financial and Compliance Report Year Ended June 30, 2014
 Financial and Compliance Report Year Ended June 30, 2014 Table of Contents Introductory Section Table of contents City officials Organizational chart i ii iii iv Financial Section Independent auditor
City of Grand Ledge. FINANCIAL STATEMENTS (With Required Supplementary Information) June 30, 2018
 June 30, 2018") FINANCIAL STATEMENTS (With Required Supplementary Information) TABLE OF CONTENTS Page INDEPENDENT AUDITOR S REPORT MANAGEMENT S DISCUSSION AND ANALYSIS i-iii iv-x BASIC FINANCIAL STATEMENTS Government-wide
FINANCIAL STATEMENTS (With Required Supplementary Information) TABLE OF CONTENTS Page INDEPENDENT AUDITOR S REPORT MANAGEMENT S DISCUSSION AND ANALYSIS i-iii iv-x BASIC FINANCIAL STATEMENTS Government-wide
CITY OF BARNESVILLE, MINNESOTA BASIC FINANCIAL STATEMENTS AND SUPPLEMENTARY INFORMATION YEAR ENDED DECEMBER 31, 2015
 BASIC FINANCIAL STATEMENTS AND SUPPLEMENTARY INFORMATION YEAR ENDED DECEMBER 31, 2015 TABLE OF CONTENTS DECEMBER 31, 2015 INTRODUCTORY SECTION PRINCIPAL CITY OFFICIALS 1 FINANCIAL SECTION INDEPENDENT
CITY OF JAMESTOWN, NEW YORK TABLE OF CONTENTS. Independent Report of Auditor 1. Management s Discussion and Analysis 3. Statement of Net Assets 12
 TABLE OF CONTENTS Independent Report of Auditor 1 Management s Discussion and Analysis 3 Basic Financial Statements: Statement of Net Assets 12 Statement of Activities 13 Balance Sheet - Governmental Funds
CITY OF CHEYENNE FINANCIAL & COMPLIANCE REPORT
 CITY OF CHEYENNE FINANCIAL & COMPLIANCE REPORT Cheyenne, Wyoming Year Ended Prepared by City Treasurer s Office This page is intentionally left blank 2 City of Cheyenne Financial and Compliance Report
City of Park Rapids Hubbard County, Minnesota. Financial Statements. December 31, 2016
 Hubbard County, Minnesota Financial Statements December 31, 2016 Table of Contents Elected Officials and Administration 1 Independent Auditor's Report 2 Management's Discussion and Analysis 5 Basic Financial
EASTLAND COUNTY, TEXAS FINANCIAL STATEMENTS AND INDEPENDENT AUDITORS REPORT. September 30, 2016
 EASTLAND COUNTY, TEXAS FINANCIAL STATEMENTS AND INDEPENDENT AUDITORS REPORT September 30, 2016 EASTLAND COUNTY, TEXAS CONTENTS September 30, 2016 Independent Auditors Report 1 Management s Discussion and
Clay County, Florida. County Audit Report September 30, 2014
 Clay County, Florida County Audit Report September 30, 2014 Clay County, Florida County Audit Report September 30, 2014 Table of Contents Section Financial Report 1 County-Wide 3 Clerk of the Circuit Court
WILLIAM S. HART UNION HIGH SCHOOL DISTRICT ANNUAL FINANCIAL REPORT JUNE 30, 2017
 WILLIAM S. HART UNION HIGH SCHOOL DISTRICT ANNUAL FINANCIAL REPORT JUNE 30, 2017 TABLE OF CONTENTS JUNE 30, 2017 FINANCIAL SECTION Independent Auditor's Report 2 Management's Discussion and Analysis 5
DEL MAR UNION SCHOOL DISTRICT COUNTY OF SAN DIEGO SAN DIEGO, CALIFORNIA ANNUAL FINANCIAL REPORT JUNE 30, 2016
 COUNTY OF SAN DIEGO SAN DIEGO, CALIFORNIA ANNUAL FINANCIAL REPORT JUNE 30, 2016 Wilkinson Hadley King & Co. LLP CPA's and Advisors 218 W. Douglas Ave. El Cajon, California Introductory Section Del Mar
Township of Byron Kent County, Michigan FINANCIAL STATEMENTS Year ended March 31, 2014
 Kent County, Michigan FINANCIAL STATEMENTS Year ended March 31, 2014 CONTENTS Page INDEPENDENT AUDITOR S REPORT 3-4 MANAGEMENT S DISCUSSION AND ANALYSIS 5-11 BASIC FINANCIAL STATEMENTS Government-wide
CITY OF ST. PAUL PARK FINANCIAL STATEMENTS FOR THE FISCAL YEAR ENDED DECEMBER 31, 2014
 FINANCIAL STATEMENTS FOR THE FISCAL YEAR ENDED DECEMBER 31, 2014 FINANCIAL STATEMENTS For the Fiscal Year Ended December 31, 2014 TABLE OF CONTENTS INTRODUCTORY SECTION Elected and Appointed Officials
TOWN OF MAMMOTH LAKES California. Annual Financial Report June 30, 2013
 TOWN OF MAMMOTH LAKES California Annual Financial Report TOWN OF MAMMOTH LAKES Table of Contents INDEPENDENT AUDITOR S REPORT...2-3 MANAGEMENT S DISCUSSION AND ANALYSIS (unaudited) Required Supplementary
City of Sachse, Texas As Prepared by The Finance Department
 COMPREHENSIVE ANNUAL FINANCIAL REPORT Fiscal Year Ended September 30, 2017 City of Sachse, Texas As Prepared by The Finance Department Sachse is a tranquil community welcoming the future while offering
CITY OF MENAHGA, MINNESOTA FINANCIAL STATEMENTS AND SUPPLEMENTARY INFORMATION YEAR ENDED DECEMBER 31, 2016
 FINANCIAL STATEMENTS AND SUPPLEMENTARY INFORMATION YEAR ENDED DECEMBER 31, 2016 TABLE OF CONTENTS DECEMBER 31, 2016 INTRODUCTORY SECTION PRINCIPAL CITY OFFICIALS 1 FINANCIAL SECTION INDEPENDENT AUDITORS
SAUGUS UNION SCHOOL DISTRICT
 SAUGUS UNION SCHOOL DISTRICT Excellence in Elementary Education ANNUAL FINANCIAL REPORT TABLE OF CONTENTS FINANCIAL SECTION Independent Auditor's Report 2 Management's Discussion and Analysis 5 Basic Financial
CITY OF HERCULES, CALIFORNIA ANNUAL FINANCIAL REPORT YEAR ENDED JUNE 30, 2017
 , CALIFORNIA ANNUAL FINANCIAL REPORT YEAR ENDED WEALTH ADVISORY OUTSOURCING AUDIT, TAX, AND CONSULTING THIS PAGE INTENTIONALLY LEFT BLANK TABLE OF CONTENTS YEAR ENDED FINANCIAL SECTION Independent Auditors
City of Le Sueur Le Sueur County, Minnesota. Financial Statements. December 31, 2015
 Le Sueur County, Minnesota Financial Statements December 31, 2015 Table of Contents Page Elected Officials and Administration 1 Independent Auditor's Report 3 Management's Discussion and Analysis 7 Basic
CITY OF CARSON CITY, MICHIGAN
 , MICHIGAN FINANCIAL STATEMENTS Vredeveld Haefner LLC CPAs and Consultants TABLE OF CONTENTS FINANCIAL SECTION PAGE Independent Auditors Report 1-2 Management s Discussion and Analysis 3-8 Basic Financial
CITY OF PAHOKEE, FLORIDA FINANCIAL STATEMENTS WITH INDEPENDENT AUDITOR S REPORT THEREON
 FINANCIAL STATEMENTS WITH INDEPENDENT AUDITOR S REPORT THEREON FISCAL YEAR ENDED SEPTEMBER 30, 2014 FINANCIAL STATEMENTS SEPTEMBER 30, 2014 TABLE OF CONTENTS Pages FINANCIAL SECTION Independent Auditor
JEFFERSON UNION HIGH SCHOOL DISTRICT COUNTY OF SAN MATEO DALY CITY, CALIFORNIA AUDITED FINANCIAL STATEMENTS FOR THE YEAR ENDED JUNE 30, 2017
 COUNTY OF SAN MATEO DALY CITY, CALIFORNIA AUDITED FINANCIAL STATEMENTS FOR THE YEAR ENDED AUDITED FINANCIAL STATEMENTS TABLE OF CONTENTS Page No. INDEPENDENT AUDITOR S REPORT... 1-3 MANAGEMENT'S DISCUSSION
COUNTY OF LAWRENCE, PENNSYLVANIA
 COUNTY OF LAWRENCE, PENNSYLVANIA NEW CASTLE, PENNSYLVANIA FINANCIAL STATEMENTS YEAR ENDED COUNTY OF LAWRENCE, PENNSYLVANIA YEAR ENDED CONTENTS Independent Auditor s Report 1-3 Page Management s Discussion
TOWN OF EAST GREENWICH ANNUAL FINANCIAL REPORT FOR THE FISCAL YEAR ENDED JUNE 30, 2017
 TOWN OF EAST GREENWICH ANNUAL FINANCIAL REPORT FOR THE FISCAL YEAR ENDED JUNE 30, 2017 Town Hall East Greenwich, Rhode Island Built in 1804 Gayle Corrigan Town Manager Linda Dykeman Finance Director Prepared
CITY OF FREEPORT FREEPORT, TEXAS
 FREEPORT, TEXAS ANNUAL FINANCIAL REPORT FOR THE YEAR ENDED SEPTEMBER 30, 2013 KENNEMER, MASTERS & LUNSFORD, LLC CERTIFIED PUBLIC ACCOUNTANTS 8 WEST WAY COURT LAKE JACKSON, TEXAS 77566 THIS PAGE LEFT BLANK
City of Taylor, Michigan. Financial Report with Supplemental Information June 30, 2017
 Financial Report with Supplemental Information Contents Report Letter 1-3 Management's Discussion and Analysis 4-11 Basic Financial Statements Government-wide Financial Statements: Statement of Net Position
SWEETWATER COUNTY, WYOMING
 FINANCIAL AND COMPLIANCE REPORT JUNE 30, 2017 CONTENTS INDEPENDENT AUDITOR S REPORT 1 and 2 MANAGEMENT S DISCUSSION AND ANALYSIS 3-11 (Required Supplementary Information) BASIC FINANCIAL STATEMENTS Government-Wide
CITY OF SHELTON, CONNECTICUT ANNUAL FINANCIAL REPORT. June 30, 2017
 ANNUAL FINANCIAL REPORT June 30, 2017 TABLE OF CONTENTS Page Number FINANCIAL SECTION Independent Auditor s Report 1-2 Management s Discussion and Analysis 3a-3g Basic Financial Statements: Government-Wide
CITY OF EAST GRAND RAPIDS, MICHIGAN FINANCIAL STATEMENTS FOR THE YEAR ENDED JUNE
 , MICHIGAN FINANCIAL STATEMENTS Vredeveld Haefner LLC TABLE OF CONTENTS FINANCIAL SECTION PAGE Independent Auditors Report 1-2 Management s Discussion and Analysis 3-8 Basic Financial Statements Government-wide
CITY OF WEST COVINA COMPREHENSIVE ANNUAL FINANCIAL REPORT WITH REPORT ON AUDIT BY INDEPENDENT CERTIFIED PUBLIC ACCOUNTANTS
 COMPREHENSIVE ANNUAL FINANCIAL REPORT WITH REPORT ON AUDIT BY INDEPENDENT CERTIFIED PUBLIC ACCOUNTANTS FOR THE YEAR ENDED JUNE 30, 2014 Prepared By: City of West Covina Finance Department Dennis Swink
City of North Chicago, Illinois
 Annual Financial Report Year Ended Annual Financial Report Table of Contents For the Year Ended Page INDEPENDENT AUDITORS' REPORT 1-3 MANAGEMENT'S DISCUSSION AND ANALYSIS (UNAUDITED) 4-12 BASIC FINANCIAL
City of Ocoee, Florida COMPREHENSIVE ANNUAL FINANCIAL REPORT. For The Year Ended September 30, 2016
 City of Ocoee, Florida COMPREHENSIVE ANNUAL FINANCIAL REPORT For The Year Ended September 30, 2016 Prepared by: City of Ocoee Finance Department This page intentionally left blank. INTRODUCTORY SECTION
CITY OF PLYMOUTH California
 California Annual Financial Report June 30, 2016 City Council Peter Taylor Jon Colburn Sandy Kyles Peter Amoruso Jason Ralphs Mayor Vice Mayor Member Member Member Appointed Officials City Manager Jeffry
ANAHEIM UNION HIGH SCHOOL DISTRICT ANNUAL FINANCIAL REPORT JUNE 30, 2015
 ANAHEIM UNION HIGH SCHOOL DISTRICT ANNUAL FINANCIAL REPORT TABLE OF CONTENTS FINANCIAL SECTION Independent Auditor's Report 2 Management's Discussion and Analysis 5 Basic Financial Statements Government-Wide
STATE OF MINNESOTA Office of the State Auditor
 STATE OF MINNESOTA Office of the State Auditor Rebecca Otto State Auditor YEAR ENDED DECEMBER 31, 2015 Description of the Office of the State Auditor The mission of the Office of the State Auditor is to
City of Niles Berrien County, Michigan FINANCIAL STATEMENTS. September 30, 2012
 Berrien County, Michigan FINANCIAL STATEMENTS September 30, 2012 TABLE OF CONTENTS September 30, 2012 Page INDEPENDENT AUDITOR S REPORT MANAGEMENT S DISCUSSION AND ANALYSIS i-ii iii-xi BASIC FINANCIAL
CITY OF CHAMBLEE, GEORGIA
 CITY OF CHAMBLEE, GEORGIA ANNUAL FINANCIAL REPORT FOR THE YEAR ENDED DECEMBER 31, 2012 Prepared By: City of Chamblee Finance Department CITY OF CHAMBLEE, GEORGIA ANNUAL FINANCIAL REPORT FOR THE YEAR ENDED
VICTOR VALLEY UNION HIGH SCHOOL DISTRICT ANNUAL FINANCIAL REPORT JUNE 30, 2015
 VICTOR VALLEY UNION HIGH SCHOOL DISTRICT ANNUAL FINANCIAL REPORT TABLE OF CONTENTS FINANCIAL SECTION Independent Auditor's Report 2 Management's Discussion and Analysis 5 Basic Financial Statements Government-Wide
BELTRAMI COUNTY BEMIDJI, MINNESOTA BASIC FINANCIAL STATEMENTS AND SUPPLEMENTARY INFORMATION YEAR ENDED DECEMBER 31, 2017
 BASIC FINANCIAL STATEMENTS AND SUPPLEMENTARY INFORMATION YEAR ENDED DECEMBER 31, 2017 TABLE OF CONTENTS YEAR ENDED DECEMBER 31, 2017 INTRODUCTORY SECTION ORGANIZATION 1 FINANCIAL SECTION INDEPENDENT AUDITORS'
Comprehensive Annual. Financial Report
 Comprehensive Annual Financial Report Warren County, Ohio For The Year Ended December 31, 2012 Introductory Section DEERFIELD TOWNSHIP COMPREHENSIVE ANNUAL FINANCIAL REPORT FOR THE YEAR ENDED DECEMBER
NASSAU COUNTY, FLORIDA
 NASSAU COUNTY, FLORIDA COMPREHENSIVE ANNUAL FINANCIAL REPORT FOR THE FISCAL YEAR ENDED SEPTEMBER 30, 2017 PREPARED BY: John A. Crawford CLERK OF THE CIRCUIT COURT/COMPTROLLER Table of Contents INTRODUCTORY