Session 61 L, Economic Scenario Generators: Risk-Neutral and Real-World Considerations from an Investment Perspective
|
|
|
- Isabella Cross
- 6 years ago
- Views:
Transcription


1 Session 61 L, Economic Scenario Generators: Risk-Neutral and Real-World Considerations from an Investment Perspective Moderator: Ryan Joel Stowe, FSA, MAAA Presenter: Jinsung Yoo, FSA, Ph.D.

2 Session 61: Risk Neutral and Real World Considerations from an Investment Perspective Jinsung Yoo, FSA Ph.D. AXA US
3 Polling Questions: Do we live in a Risk Neutral World? 1. Do you expect that over the long term, a basket of risky assets (equities, credit bonds) purchased today will have a higher return than a basket of treasuries? (1 yes / 2 no) 1. Yes 2. No 87% 13% 1 2 2
4 Polling Questions: Do we live in a Risk Neutral World? 2. Does your investment department believe it? (1 yes / 2 no) 1. Yes 2. No 74% 26% 1 2 3
5 Polling Questions: Do we live in a Risk Neutral World? 3. How long a holding period would you need to feel confident that will outperform treasury bonds? 1. 3 yrs 49% I don t believe equities will outperform treasuries 10% 13% 26% 3%
6 Session Description This session will review key pricing and modeling considerations in the context of economic scenario generators. Risk neutral and real world scenarios are used for different purposes and have different characteristics that can affect risk measurement and pricing outcomes. How these scenarios are created, the management actions assumed and the investment strategies are integral components of the final outcome. At the conclusion of the session, attendees will be able to interpret and explain differences between risk neutral and real world scenarios. In addition, attendees will be able to identify key characteristics of each type of scenario and how they should (and should not) be used in modeling processes. 5
7 Guidance from the AAA Life Capital Adequacy Subcommittee Probability Measure In general, there are two probability measures for simulating investment returns. The Q measure, or risk neutral distribution, is a convenient framework used for pricing securities and is predicated on the concept of replication under a no arbitrage environment. Under the Q measure, risk is hedged (hence, securities are expected to earn the risk free rate) and derivatives (options) can be priced using their expected discounted cashflows. The Q measure is crucial to option pricing, but equally important is the fact that it tells us almost nothing about the true probability distribution. The Q measure is relevant only to pricing ( fair market value determination) and replication (a fundamental concept in hedging); any attempt to project values ( true outcomes ) for a risky portfolio must be based on an appropriate (and unfortunately subjective) real world probability model. This is the so called physical measure, or P measure. The real world model should be used for all cash flow projections, consistent with the risk preferences of the market. This is the basis for the valuation of required capital and is the focus of the remainder of this appendix. However, the risk neutral measure is relevant if the company s risk management strategy involves the purchase or sale of derivatives or other financial instruments in the capital markets. Recommended Approach for Setting Regulatory Risk Based Capital Requirements for Variable Annuities and Similar Products Presented by the American Academy of Actuaries Life Capital Adequacy Subcommittee to the National Association of Insurance Commissioners Capital Adequacy Task Force Boston, MA June
8 Polling Question Real World Do you use stochastic RW scenarios in 1. Pricing 2. Valuation 3. ALM studies 4. Strategic Asset Allocation 5. Multiple Projects 6. Not at all Real World Stochastic Pricing Valuation ALM SAA Multiple N/A 7
9 Polling Question Real World Do you use stochastic RW scenarios in 1. Pricing 2. Valuation 3. ALM studies 4. Strategic Asset Allocation 5. Multiple Projects 6. Not at all 0% 0% 0% 0% 0% 0% Countdown
10 Polling Question Risk Neutral Do you use Risk Neutral scenarios in 1. Pricing 2. Valuation 3. ALM studies 4. Strategic Asset Allocation 5. Multiple Projects 6. Not at all Risk Neutral Scenarios Pricing Valuation ALM SAA Multiple N/A 9
11 Polling Question Risk Neutral Do you use Risk Neutral scenarios in 1. Pricing 2. Valuation 3. ALM studies 4. Strategic Asset Allocation 5. Multiple Projects 6. Not at all 0% 0% 0% 0% 0% 0% Countdown
12 Risk Neutral Scenarios Overview (1) Every asset class has same expected return No reward for taking on extra risk This comes from the assumptions that All assets can be hedged No arbitrage opportunities Investors are indifferent to risk (hence risk neutral ) No additional returns for taking on additional risk Additional spread on risky bonds will be offset (on average) by additional credit losses Traditional Capital Market Theory (CAPM) does not apply 11
13 Risk Neutral Scenarios Overview (2) Scenarios are calibrated to match observable asset prices on an expected value basis cashflows over all scenarios, discounted at the risk free rates within each scenario, should average out to current market price Typical calibration targets include swaptions (interest) and call or put volatility (equities) May target specific points, or full surface: Swaptions: Tenor and Maturity Puts or Calls: Maturity and strike price in the moneyness 12


14 Risk Neutral Scenarios Overview (2a) sample targets Implied Vol Targets swaptions Implied Vol Targets puts Mkt USD SPX Implied Vol Targets Puts maturity 60% 70% 80% 90% 100% 110% 120% 130% 140% 1Y 31.83% 28.64% 25.46% 22.41% 19.46% 16.72% 14.63% 13.41% 13.32% 2Y 30.11% 27.72% 25.40% 23.22% 21.18% 19.28% 17.63% 16.29% 15.29% 3Y 29.95% 27.93% 25.96% 24.12% 22.41% 20.82% 19.43% 18.27% 17.26% 4Y 29.74% 27.93% 26.19% 24.57% 23.07% 21.71% 20.50% 19.47% 18.56% 5Y 29.81% 28.14% 26.55% 25.08% 23.74% 22.52% 21.43% 20.50% 19.67% 7Y 30.01% 28.55% 27.16% 25.91% 24.77% 23.74% 22.83% 22.03% 21.30% 10Y 31.02% 29.76% 28.59% 27.52% 26.55% 25.68% 24.89% 24.18% 23.53% 15Y 33.45% 32.42% 31.44% 30.55% 29.71% 28.95% 28.23% 27.58% 26.93% 13
15 Risk Neutral Scenarios Overview (3) No individual scenario needs to make sense : different asset classes may perform better within a scenario in any particular scenario, risky bonds could can have large returns and zero defaults. Equities returns may or may not correlate to interest rates and other asset classes Calibration considers averages across all scenarios. Martingale test: the present value of $1 invested now in any asset class for any time period is $1 (before taxes, expenses) On average, interest rates follow the current forward rates Certaintly Equivalent scenario can be built just knowing the current yield curve The equivalent in a way of using the level scenario in a real world simulation 14
16 Risk Neutral Scenario Deflators and the Martingale Deflator: Discount factor applied to the cash flows from a particular scenario at a particular duration. Is equal to the product of annual discount factors based on the risk free cash (or 1 year) rate Martingale: The test that the present value of accumulated funds at each time t = starting MV Present value calculated as sum of the product across all scenarios at time t of deflators x accumulated values / number of scenario 15
17 Deflator and Martingale Example: Cash cash rate year scenario % 0.1% 3.6% 5.4% 3.7% 2 4.3% 4.2% 6.5% 5.1% 4.5% 3 2.5% 3.3% 6.9% 3.1% 1.4% 4 3.3% 6.6% 6.0% 1.3% 1.8% 5 3.0% 1.6% 3.9% 0.1% 2.8% accumulated cash % 106.8% 110.6% 116.6% 120.9% % 108.6% 115.6% 121.5% 127.0% % 105.9% 113.3% 116.8% 118.4% % 110.2% 116.9% 118.4% 120.5% % 104.6% 108.8% 108.8% 111.8% deflators (=v base on cash rates) % 93.6% 90.4% 85.7% 82.7% % 92.1% 86.5% 82.3% 78.7% % 94.4% 88.3% 85.6% 84.4% % 90.7% 85.6% 84.5% 83.0% % 95.6% 91.9% 91.9% 89.4% deflated % 100.0% 100.0% 100.0% 100.0% % 100.0% 100.0% 100.0% 100.0% % 100.0% 100.0% 100.0% 100.0% % 100.0% 100.0% 100.0% 100.0% % 100.0% 100.0% 100.0% 100.0% Martinga 100.0% 100.0% 100.0% 100.0% 100.0% Risk free cash rates will pass the martingale test by definition 16
18 Deflators and Martingale: Equity (1) equity returns first simulation % 11.3% 17.9% 13.5% 18.0% 2 0.8% 9.0% 21.6% 9.7% 24.5% % 13.8% 13.7% 14.9% 1.6% % 24.6% 7.4% 23.5% 19.4% 5 9.8% 21.9% 24.8% 20.2% 12.0% accumulated equity % 106.0% 125.0% 141.9% 116.4% % 91.7% 111.6% 100.7% 125.4% % 103.1% 117.2% 99.8% 98.2% % 57.0% 61.2% 75.5% 90.2% % 70.5% 88.0% 105.7% 93.0% martingale 92.6% 80.0% 89.3% 90.2% 87.2% (SumProduct(accumulated equity,deflator) / 5) Does not pass the martingale: average PV is not close to 100% adjustment f 107.9% 125.0% 112.0% 110.9% 114.7% (factor to apply to accumulated equity to force the martingale) 17
19 Deflators and Martingale: Equity (2) accumulated equity Adjusted accumulated % 132.5% 140.1% 157.3% 133.5% % 114.7% 125.0% 111.7% 143.8% % 128.8% 131.4% 110.6% 112.6% % 71.2% 68.5% 83.8% 103.5% % 88.1% 98.6% 117.2% 106.7% adjusted equity returns % 28.9% 5.7% 12.3% 15.1% 2 8.9% 5.3% 9.0% 10.7% 28.8% % 0.2% 2.0% 15.8% 1.8% % 12.7% 3.7% 22.2% 23.6% 5 2.6% 9.5% 11.9% 18.9% 9.0% deflated accumulated value % 124.0% 126.6% 134.9% 110.4% % 105.6% 108.1% 91.9% 113.2% % 121.6% 116.0% 94.7% 95.1% % 64.6% 58.6% 70.8% 85.9% % 84.2% 90.6% 107.7% 95.4% average 100.0% 100.0% 100.0% 100.0% 100.0% Martingale looks good Assets other than risk free cash may not pass the martingale on the first try may need to recalibrate or otherwise adjust 18
20 Risk Neutral Calibration Targets Risk Free Rates Replicate the starting yield curve: avg of all deflators at year n should equal 1/(n year spot) from starting curve Interest rate volatility: Expected value of a swaption (avg discounted cashflows over all scenarios) should match current swaption price (for selected tenors / maturities) 19
21 Refresher: Par, Spot, and Forward Rates Par: Coupon rate necessary for bond to trade at par value Spot: Rate for zero coupon bond Forward: Rate expected for zero coupon bond purchased in the future In the Risk Neutral world, you expect the same wealth accumulation after n years no matter how you invest the forward rate can be derived as the difference between spots of different maturities, e.g. E.g. invest in a five year zero coupon bond OR invest in a 4 year, reinvest for 1 year Same expected wealth after 5 years Year 4 forward rate = (5 yr spot) 5 / (4 year spot) 4 20
22 Certainty Equivalent scenario derived from Yearend 2014 Treasury curve par curve time % 0.67% 1.10% 1.38% 1.65% 1.81% 1.97% 2.04% 2.10% 2.17% spotcurve time o 0.25% 0.67% 1.11% 1.39% 1.67% 1.84% 2.00% 2.07% 2.14% 2.21% forward curve time % 1.09% 1.98% 2.23% 2.81% 2.67% 3.02% 2.55% 2.70% 2.86% forward curve time % 1.98% 2.23% 2.81% 2.67% 3.02% 2.55% 2.70% 2.86% forward curve time % 2.23% 2.81% 2.67% 3.02% 2.55% 2.70% 2.86% forward curve time % 2.81% 2.67% 3.02% 2.55% 2.70% 2.86% forward curve time % 2.67% 3.02% 2.55% 2.70% 2.86% forward curve time % 3.02% 2.55% 2.70% 2.86% spot curve time % 1.54% 1.77% 2.03% 2.16% 2.30% 2.34% 2.38% 2.43% spot curve time % 2.11% 2.34% 2.42% 2.54% 2.55% 2.57% 2.60% spot curve time % 2.52% 2.57% 2.68% 2.66% 2.67% 2.69% spot curve time % 2.74% 2.83% 2.76% 2.75% 2.77% spot curve time % 2.85% 2.75% 2.74% 2.76% Par curve % 1.53% 1.76% 2.02% 2.14% Par curve % 2.11% 2.34% 2.42% 2.53% Par curve % 2.52% 2.57% 2.68% 2.65% Par curve % 2.74% 2.83% 2.77% 2.75% Par curve % 2.84% 2.75% 2.74% 2.76% 21
23 Certainty Equivalent scenario derived from Yearend 2014 Treasury curve Spot and par very close at time 0 due to low rates / coupons Forwards are a bit jagged, maybe due to my linear interpolation of 4, 8, and 9 year par rates Yield curve goes up by year, especially at the short end in the current environment, this is a more aggressive assumptions than holding rates level 22
24 RN issues calibration (1) Only one RN curve (if pricing on the swap curves, then treasuries won t be RN) RN only applies to time 0 How to make a buy and hold portfolio RN Difficult to calibrate with low / negative forwards CRA, LP, VA more market consistent than the market? Number of scenarios required to pass a martingale, tamp down random noise 23
25 RN issues calibration (2) Calibration with no observable targets For example, to calibrate 40 years worth of 30 year scenarios, need 70 years worth of forward rates at time 0 If trying to calibrate to a swaption surface, there are many points at with no market or a very thin market Calibration with no observable asset types May look at history as opposed to something immediately observable on the market, e.g. what is the correlation between interest rates and equities? Credit spreads and equities? Implied vols are reproduced on an expected value basis. Shocks take you out of RN framework 24
26 RN issues modeling and using results Spread business looks bad with no spread Assets with high expenses look bad CAPM leftmost point. Not useful for strategic asset allocation Modeling management and policyholder behavior Do you consider corporate spread in your crediting? What are your competitor constraints in a risk neutral world? Extreme conditions, exploding rates or negative rates Results highly sensitive to starting conditions; No RTM Only Average is meaningful percentile and CTE results not meaningful Used for valuation models (EV) change in EV as the starting curve is shocked can be used as a measure of duration 25
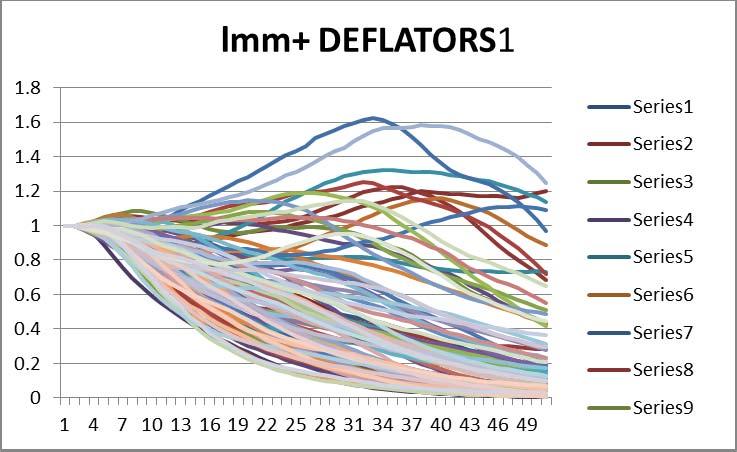
27 RN: example of 2 different calibrations (2FBK, LMM+) Given a set of targets, there is more than one way to calibrate Choice of calibration tools / models can make a substantial difference in the resulting scenarios Example: comparison of scenario sets generated by the 2 factor Black Karasinski (2fBK) model and * LMM+ model Both run within the B&H ESG 2fBK models short rates as a mean reverting process, with the mean reversion target also being a mean reverting process LMM+ is a model proprietary to B&H which applies an offset to the LMM model, limits the explosive upside seen in LMM models by allowing negative rates Graphs in this exhibit are based on a small subset (100 scenarios) of 2 sets generated explicitely to compare the two models 26

28 10 yr Par rates 2FBK 27

29 10 yr Par rates LMM+ 28
30 10 yr Par rates average rates compared 29
31 Polling Question From the prior slides, which set of interest scenarios would be better suited to model your business? 1: 2fBK 2: LMM+ 3: The New York 7 are looking pretty good right now! Scenario Choice 2fBK LMM+ No preference 30
32 Polling Question From the prior slides, which set of interest scenarios would be better suited to model your business? 1. 2fBK 2. LMM+ 3. The New York 7 are looking pretty good right now! 0% 0% 0% Countdown

33 Deflators compared 32
34 And yet The two scenario sets reproduce similar yield curves. They also (not illustrated) produce fairly similar swaption volatilities at key points (5, 10, 15 yr maturities of the 10 year tenor.) 33
35 Real World Highlights Can reflect a realistic relationship between asset classes e.g. risk/return tradeoff Can be deterministic (e.g. NY7, reverse stress scenarios) or stochastic (e.g. AG43) Calibration of stochastic sets is generally tied to observations of history e.g. hypothesize a parametric form of the variable being modeled, look at the actual history of the variable, and use a maximum likelihood estimator Normal / lognormal / regime switching Can model implied volatilities, or fx volatilities, or any other desired parameter AAA / NAIC requirements on scenarios include wealth accumulation percentiles Can define reasonableness as a scenario by scenario test, as an average, percentile, or CTE Possible use of RTM to smooth results 34
36 Issues with Real World History is not all that extensive, especially when considering tail events Since 1928, S&P 500 lost > 33.3% of its value in 3 years, grew by > 33.3 in 7 years How to avoid model arbitrage if a model with risky assets gets you a more favorable result, can end up backing fixed liabilities with (say) private equities Asset based capital charges Use x th percentile results or CTEs instead of averages allow volatility to hurt you Use discount rates consistent with the risk How well do any of these approaches work when you need to take a risk to clear some hurdle, say a minimum guaranteed rate? Calibrations and targets will be sensitive to the historical period included in your analysis 35
37 Uses of Real World Scenarios Deterministic: Test a particular, well defined concern NY7: what happens if interest rates follow particular patterns Reverse Stress scenarios: make sense out of a stochastic result by finding a single scenario that can replicate the numbers Stochastic: Reserves and Capital as defined by regulation (AG43, RBC C3) Asset Allocation use a full blown ALM model to search out an efficient frontier 36
38 Summary observations Risk Neutral: Since the scenario can reproduce the price of (some) assets observable on the market, makes sense to try to use to derive non observable prices, e.g. value of a block of business Should try to calibrate the scenarios to assets that should be related to the liabilities you are looking to value (e.g. in 2009, calibrate to in the money put options for equity based guarantees issued before 2008) Real World: Assumptions used in developing the scenario may strongly impact the results Risk Neutral view is that models should be built around data that can be derived from a snapshot of current market conditions. Real World allows the incorporation of historical data and explicit judgment 37
39 Session 61: Risk-Neutral and Real-World Considerations from an Investment Perspective Jinsung Yoo, FSA Ph.D. AXA US
40 Session Description This session will review key pricing and modeling considerations in the context of economic scenario generators. Risk neutral and real world scenarios are used for different purposes and have different characteristics that can affect risk measurement and pricing outcomes. How these scenarios are created, the management actions assumed and the investment strategies are integral components of the final outcome. At the conclusion of the session, attendees will be able to interpret and explain differences between risk neutral and real world scenarios. In addition, attendees will be able to identify key characteristics of each type of scenario and how they should (and should not) be used in modeling processes. 2
41 Risk Neutral versus Real World Risk Neutral Scenarios Real World Scenarios View Forward looking Backward looking Presumption History is irrelevent History will repeat What's oberved now is Learn from history a reflection of future events same expected return depending on riskness of security Asset return risk free rate risk rate plus risk premium CAPM: Probability Risk neutral Q measure Realistic P measure Discount risk free rate Weighted Average Cost of Capital Method Objective mechanical Subjective explicit judgment Risk metric Implied volatility Standard Deviation, beta Philsophy Hard to beat the market I can beat the market No arbitrage I can create "alfa" Pricing Correct Incorrect Risk bearing No extra return on average Requires extra return Data Sanpshot of current market Historical market data 3
42 Risk neutral or real world probability? Selected a trick question appeared on SOA exam Q1. Suppose the current IBM stock price is $100. Assume no dividend payment. After one year, there are 60% chance of stock price to increase by 10% and 40% chance of stock price to decrease by 10%. If the continuous risk free rate is 5%, what is the price of the call option on this stock with strike at 100? Show all your work using risk neutral valuation. See the answers on the next two slides. 4
43 Student Answer Sheet S 0 S 1 option payoff % 40% C = exp(-5%)[ 60%* %*0] = 5.71 His score is 3 out of 10 with a partial credit!! 5
44 Correct Answer Sheet S 0 S 1 option payoff 100 p 1-p = exp(-5%)[ p*110 + (1-p)*90] = exp(-5%)[110p - 90p +90] => 100 exp(5%) = 20p + 90 => 20p = 100 exp(5%) - 90 => 20p = 100 exp(5%) - 90 => 20p = => p = /20 = => 1 - p = C = exp(-5%)[ * *0] =
45 What did you learn from this SOA exam question? The student tried to calculate with a real world probability P- measure (subjective opinion) SOA key answer: risk neutral probability Q-measure Lesson: You have to read the question carefully!! Market option quote is based on Q-measure, otherwise there is an arbitrage opportunity 60% 40 % subjective view in Real world probability turns out to be a mispricing of the option. You should have used risk neutral probability of 74% 24%. No matter how the stock price would be realized at year 1, it should have a present value of 100 on average when you discount back with risk free rate. 7
46 Another trick question for fun Is it legal everywhere in the world for a man to marry his widow s sister? The answer will be given at the end of the session. 8
47 Volatility: Risk Metric Although both use the same notation s for volatility, they have different meanings. In Real world scenarios, it is a statistical metric standard deviation In Risk neutral scenarios, it is an implied volatility derived from Black-Scholes formula so that theoretical option price equals to the market price of the market traded option 9


48 Historical volatility versus Implied volatility Historical Volatility Implied Volatility present Past 30 days Next 30 days Historical stock price movement Current option price maturing in 30 days Statistical standard deviation Value maikng BS price equals market price A measure of fluctuations of stock prices Expected fluctuations of the underling during the past 30 days stock price over the next 30 days Up/down movement equally treated Stock Up => low IV, Stock Down => high IV Variation metric Fear index, uncertainty index 10
49 Example will make the concept clear I am going to show you how we generate S&P 500 equity price index return scenarios in two different ways. Real world scenarios Risk neutral scenarios Both will follow lognormal process for stock prices 11
50 Equity Scenario Generation Real world scenarios Step 1: Collect Historical data (S&P 500 price ) Step 2: Calculate m and s for lognormal stock price model Step 3: Using the above parameters, generate 1000 paths Risk neutral scenarios (simple setting) Step 1: Collect current market(s&p 500 put option implied volatility & risk free rate) Step 2: Using the above information, generate 1000 paths 12
51 Illustrative Graph In general, RN scenarios produce more conservative results due to lower mean and higher volatility Equity Price Real Wrold Risk Neutral 13
52 RN: example of 2 different calibrations (2FBK, 2FHW) Given a set of targets, there is more than one way to calibrate Choice of models can make a substantial difference in the resulting scenarios and financial impact Example: comparison of scenario sets generated by two different interest rate models 2FBK (Black-Karasinsky) model: lognormal model using short rates as a mean reverting process with the mean reversion target also being a mean reversion process 2FHW (Hull-White) model: normal model which is very simple and was popular in the 90 s 14
53 RN: Characteristics of BK2F and HW2F Lognormal model BK2F: No negative rates yet rates can be explosive Normal model HW2F: rates not explosive yet rates can be negative Cash Total Returns % 95.00% 75.00% Hull & White BK2F 55.00% 35.00% 15.00% -5.00% % 15
54 RN issues Hard to communicate with senior management Looks too theoretical and artificial, unusual individual paths Difficult to calibrate with low / negative forwards Hard to justify sensitivity cases to be more aligned with market consistency Calibration with no observable targets For example, swap spot curve or swaption volatility data beyond 30 years Yet still have to project at least up to 50 years Calibration with no observable investment instruments the correlation between different equity indexes The correlation between interest rates and equities The correlation between credit spreads and equities 16
55 Real World Highlights Actuaries still feel comfortable with real world scenarios since they look realistic Can reflect a realistic relationship between asset classes for example, can assume that classes with higher volatility must also offer higher expected return although still subjective Can be deterministic (e.g. NY7, reverse stress scenarios) or stochastic (e.g. AG43) AAA / NAIC requirements on scenarios include wealth accumulation percentiles Can define reasonableness as a scenario-by-scenario test, as an average, as a percentile, or as a CTE 17
56 Issues with Real World History is not all that extensive, especially when considering tail events 1 in 200 years of event scenario (not enough data except Great Britain) Under a situation of having to sell a block of business, buyers would not agree to your asking price based on real world scenarios Calibrations and targets will be sensitive to the historical period included in you analysis (arbitrary and subjective) Discount rates 18
57 Uses of Real World Scenarios Deterministic: Test a particular, well defined concern NY7: what happens if interest rates follow particular patterns Reverse Stress scenarios: make sense out of a stochastic result by finding a single scenario that can replicate the numbers Stochastic: Reserves and Capital as defined by regulation (AG43, RBC C3) Asset Allocation use a full blown ALM model to search out an efficient frontier 19
58 Summary observations Risk Neutral: Since the scenario can reproduce the price of assets observable on the market, it makes sense to try to use to derive non-observable prices, e.g. value of a block of business Real World: Assumptions used in developing the scenario may strongly impact the results Risk Neutral view is that models should be built around data that can be derived from a snapshot of current market conditions. Real World allows the incorporation of historical data and explicit judgment 20

59 Another trick question for fun Is it legal every where in the world for a man to marry his widow s sister? It doesn t matter It would be impossible! Since he has a widow, he must be dead himself 21
Economic Scenario Generation: Some practicalities. David Grundy July 2011
 Economic Scenario Generation: Some practicalities David Grundy July 2011 my perspective stochastic model owner and user practical rather than theoretical 8 economies, 100 sensitivity tests per economy
GN47: Stochastic Modelling of Economic Risks in Life Insurance
 GN47: Stochastic Modelling of Economic Risks in Life Insurance Classification Recommended Practice MEMBERS ARE REMINDED THAT THEY MUST ALWAYS COMPLY WITH THE PROFESSIONAL CONDUCT STANDARDS (PCS) AND THAT
Economic Scenario Generators
 Economic Scenario Generators A regulator s perspective Falk Tschirschnitz, FINMA Bahnhofskolloquium Motivation FINMA has observed: Calibrating the interest rate model of choice has become increasingly
Economic Scenario Generation: Some practicalities. David Grundy October 2010
 Economic Scenario Generation: Some practicalities David Grundy October 2010 my perspective as an empiricist rather than a theoretician as stochastic model owner and user All my comments today are my own
ESGs: Spoilt for choice or no alternatives?
 ESGs: Spoilt for choice or no alternatives? FA L K T S C H I R S C H N I T Z ( F I N M A ) 1 0 3. M i t g l i e d e r v e r s a m m l u n g S AV A F I R, 3 1. A u g u s t 2 0 1 2 Agenda 1. Why do we need
Stochastic Modeling Concerns and RBC C3 Phase 2 Issues
 Stochastic Modeling Concerns and RBC C3 Phase 2 Issues ACSW Fall Meeting San Antonio Jason Kehrberg, FSA, MAAA Friday, November 12, 2004 10:00-10:50 AM Outline Stochastic modeling concerns Background,
Session 76 PD, Modeling Indexed Products. Moderator: Leonid Shteyman, FSA. Presenters: Trevor D. Huseman, FSA, MAAA Leonid Shteyman, FSA
 Session 76 PD, Modeling Indexed Products Moderator: Leonid Shteyman, FSA Presenters: Trevor D. Huseman, FSA, MAAA Leonid Shteyman, FSA Modeling Indexed Products Trevor Huseman, FSA, MAAA Managing Director
Crashcourse Interest Rate Models
 Crashcourse Interest Rate Models Stefan Gerhold August 30, 2006 Interest Rate Models Model the evolution of the yield curve Can be used for forecasting the future yield curve or for pricing interest rate
Investment Symposium March F7: Investment Implications of a Principal-Based Approach to Capital. Moderator Ross Bowen
 Investment Symposium March 2010 F7: Investment Implications of a Principal-Based Approach to Capital David Wicklund Arnold Dicke Moderator Ross Bowen Investment Implications of a Principle Based Approach
Session 55 PD, Pricing in a MCEV Environment. Moderator: Kendrick D. Lombardo, FSA, MAAA
 Session 55 PD, Pricing in a MCEV Environment Moderator: Kendrick D. Lombardo, FSA, MAAA Presenters: Christopher Kirk Brown, FSA, MAAA Seng Siang Goh, FSA, MAAA Kendrick D. Lombardo, FSA, MAAA PRICING IN
Session 3B, Stochastic Investment Planning. Presenters: Paul Manson, CFA. SOA Antitrust Disclaimer SOA Presentation Disclaimer
 Session 3B, Stochastic Investment Planning Presenters: Paul Manson, CFA SOA Antitrust Disclaimer SOA Presentation Disclaimer The 8 th SOA Asia Pacific Annual Symposium 24 May 2018 Stochastic Investment
Economic Capital: Recent Market Trends and Best Practices for Implementation
 1 Economic Capital: Recent Market Trends and Best Practices for Implementation 7-11 September 2009 Hubert Mueller 2 Overview Recent Market Trends Implementation Issues Economic Capital (EC) Aggregation
4A: The Money Pit - Reflecting the Risks We Are Taking In Pricing Products
 9 th Annual Product Development Actuary Symposium June 2009 4A: The Money Pit - Reflecting the Risks We Are Taking In Pricing Products Dominique Lebel Market Consistent Pricing Risk Management at the Point
MORNING SESSION. Date: Thursday, November 1, 2018 Time: 8:30 a.m. 11:45 a.m. INSTRUCTIONS TO CANDIDATES
 Quantitative Finance and Investment Advanced Exam Exam QFIADV MORNING SESSION Date: Thursday, November 1, 2018 Time: 8:30 a.m. 11:45 a.m. INSTRUCTIONS TO CANDIDATES General Instructions 1. This examination
INSTITUTE OF ACTUARIES OF INDIA
 INSTITUTE OF ACTUARIES OF INDIA EXAMINATIONS 24 th March 2017 Subject ST6 Finance and Investment B Time allowed: Three Hours (10.15* 13.30 Hours) Total Marks: 100 INSTRUCTIONS TO THE CANDIDATES 1. Please
12/11/2008. Gary Falde, FSA, MAAA Vice-Chair, Life Reserve Work Group Chair, LRWG Asset Subgroup
 Purposes of Presentation A Proposed Methodology for Setting Prescribed Net Spreads on New Investments in VM- Gary Falde, FSA, MAAA Vice-Chair, Life Reserve Work Group Chair, LRWG Asset Subgroup Alan Routhenstein,
Practical example of an Economic Scenario Generator
 Practical example of an Economic Scenario Generator Martin Schenk Actuarial & Insurance Solutions SAV 7 March 2014 Agenda Introduction Deterministic vs. stochastic approach Mathematical model Application
Least Squares Monte Carlo (LSMC) life and annuity application Prepared for Institute of Actuaries of Japan
 life and annuity application Prepared for Institute of Actuaries of Japan") Least Squares Monte Carlo (LSMC) life and annuity application Prepared for Institute of Actuaries of Japan February 3, 2015 Agenda A bit of theory Overview of application Case studies Final remarks 2 Least
Least Squares Monte Carlo (LSMC) life and annuity application Prepared for Institute of Actuaries of Japan February 3, 2015 Agenda A bit of theory Overview of application Case studies Final remarks 2 Least
ECON FINANCIAL ECONOMICS
 ECON 337901 FINANCIAL ECONOMICS Peter Ireland Boston College Fall 2017 These lecture notes by Peter Ireland are licensed under a Creative Commons Attribution-NonCommerical-ShareAlike 4.0 International
MORNING SESSION. Date: Friday, May 11, 2007 Time: 8:30 a.m. 11:45 a.m. INSTRUCTIONS TO CANDIDATES
 SOCIETY OF ACTUARIES Exam APMV MORNING SESSION Date: Friday, May 11, 2007 Time: 8:30 a.m. 11:45 a.m. INSTRUCTIONS TO CANDIDATES General Instructions 1. This examination has a total of 120 points. It consists
The Actuarial Society of Hong Kong Modelling market risk in extremely low interest rate environment
 The Actuarial Society of Hong Kong Modelling market risk in extremely low interest rate environment Eric Yau Consultant, Barrie & Hibbert Asia Eric.Yau@barrhibb.com 12 th Appointed Actuaries Symposium,
Economic Scenario Generator: Applications in Enterprise Risk Management. Ping Sun Executive Director, Financial Engineering Numerix LLC
 Economic Scenario Generator: Applications in Enterprise Risk Management Ping Sun Executive Director, Financial Engineering Numerix LLC Numerix makes no representation or warranties in relation to information
Stochastic Analysis Of Long Term Multiple-Decrement Contracts
 Stochastic Analysis Of Long Term Multiple-Decrement Contracts Matthew Clark, FSA, MAAA and Chad Runchey, FSA, MAAA Ernst & Young LLP January 2008 Table of Contents Executive Summary...3 Introduction...6
LIFE INSURANCE & WEALTH MANAGEMENT PRACTICE COMMITTEE
 Contents 1. Purpose 2. Background 3. Nature of Asymmetric Risks 4. Existing Guidance & Legislation 5. Valuation Methodologies 6. Best Estimate Valuations 7. Capital & Tail Distribution Valuations 8. Management
Report of the VA CARVM Survey Results of the American Academy of Actuaries Variable Annuity Reserve Work Group
 Report of the VA CARVM Survey Results of the American Academy of Actuaries Variable Annuity Reserve Work Group Presented to the National Association of Insurance Commissioners Life and Health Actuarial
Modeling Report On the Stochastic Exclusion Test. Presented by the American Academy of Actuaries Modeling Subgroup of the Life Reserves Work Group
 Modeling Report On the Stochastic Exclusion Test Presented by the American Academy of Actuaries Modeling Subgroup of the Life Reserves Work Group Presented to the National Association of Insurance Commissioners
US Life Insurer Stress Testing
 US Life Insurer Stress Testing Presentation to the Office of Financial Research June 12, 2015 Nancy Bennett, MAAA, FSA, CERA John MacBain, MAAA, FSA Tom Campbell, MAAA, FSA, CERA May not be reproduced
SEPARATE ACCOUNTS LR006
 SEPARATE ACCOUNTS LR006 Basis of Factors Separate Accounts With Guarantees Guaranteed separate accounts are divided into two categories: indexed and non-indexed. Guaranteed indexed separate accounts may
MEASURING AND MANAGING THE ECONOMIC RISKS AND COSTS OF WITH-PROFITS BUSINESS. By A.J. Hibbert and C.J. Turnbull. abstract
 MEASURING AND MANAGING THE ECONOMIC RISKS AND COSTS OF WITH-PROFITS BUSINESS By A.J. Hibbert and C.J. Turnbull [Presented to the Institute of Actuaries, 2 June 2003] abstract The approaches to liability
SOA Research Paper on the IFRS Discussion Paper
 SOA Research Paper on the IFRS Discussion Paper Observations, Questions and Answers Through July 25, 2008 1. Income taxes a. How are income taxes treated? i. The report reflects income and balance sheet
Lecture 9: Practicalities in Using Black-Scholes. Sunday, September 23, 12
 Lecture 9: Practicalities in Using Black-Scholes Major Complaints Most stocks and FX products don t have log-normal distribution Typically fat-tailed distributions are observed Constant volatility assumed,
Practical application of Liquidity Premium to the valuation of insurance liabilities and determination of capital requirements
 28 April 2011 Practical application of Liquidity Premium to the valuation of insurance liabilities and determination of capital requirements 1. Introduction CRO Forum Position on Liquidity Premium The
Financial Risk Measurement/Management
 550.446 Financial Risk Measurement/Management Week of September 23, 2013 Interest Rate Risk & Value at Risk (VaR) 3.1 Where we are Last week: Introduction continued; Insurance company and Investment company
SOA Risk Management Task Force
 SOA Risk Management Task Force Update - Session 25 May, 2002 Dave Ingram Hubert Mueller Jim Reiskytl Darrin Zimmerman Risk Management Task Force Update Agenda Risk Management Section Formation CAS/SOA
Mathematics of Finance Final Preparation December 19. To be thoroughly prepared for the final exam, you should
 Mathematics of Finance Final Preparation December 19 To be thoroughly prepared for the final exam, you should 1. know how to do the homework problems. 2. be able to provide (correct and complete!) definitions
B6302 Sample Placement Exam Academic Year
 Revised June 011 B630 Sample Placement Exam Academic Year 011-01 Part 1: Multiple Choice Question 1 Consider the following information on three mutual funds (all information is in annualized units). Fund
Evaluating the Selection Process for Determining the Going Concern Discount Rate
 By: Kendra Kaake, Senior Investment Strategist, ASA, ACIA, FRM MARCH, 2013 Evaluating the Selection Process for Determining the Going Concern Discount Rate The Going Concern Issue The going concern valuation
Practice of Finance: Advanced Corporate Risk Management
 MIT OpenCourseWare http://ocw.mit.edu 15.997 Practice of Finance: Advanced Corporate Risk Management Spring 2009 For information about citing these materials or our Terms of Use, visit: http://ocw.mit.edu/terms.
Session 48PD: PBR - Real Life Applications. Moderator: Alberto A Abalo FSA,MAAA,CERA
 Session 48PD: PBR - Real Life Applications Moderator: Alberto A Abalo FSA,MAAA,CERA Presenters: Alberto A Abalo FSA,MAAA,CERA Lauren M Cross FSA,MAAA Martin Snow FSA,MAAA Erzhe Zhang FSA,MAAA SOA Antitrust
Predicting the Market
 Predicting the Market April 28, 2012 Annual Conference on General Equilibrium and its Applications Steve Ross Franco Modigliani Professor of Financial Economics MIT The Importance of Forecasting Equity
Corporate Finance, Module 21: Option Valuation. Practice Problems. (The attached PDF file has better formatting.) Updated: July 7, 2005
 Updated: July 7, 2005") Corporate Finance, Module 21: Option Valuation Practice Problems (The attached PDF file has better formatting.) Updated: July 7, 2005 {This posting has more information than is needed for the corporate
Corporate Finance, Module 21: Option Valuation Practice Problems (The attached PDF file has better formatting.) Updated: July 7, 2005 {This posting has more information than is needed for the corporate
13.1 INTRODUCTION. 1 In the 1970 s a valuation task of the Society of Actuaries introduced the phrase good and sufficient without giving it a precise
 13 CASH FLOW TESTING 13.1 INTRODUCTION The earlier chapters in this book discussed the assumptions, methodologies and procedures that are required as part of a statutory valuation. These discussions covered
Managing the Risk of Variable Annuities: a Decomposition Methodology Presentation to the Q Group. Thomas S. Y. Ho Blessing Mudavanhu.
 Managing the Risk of Variable Annuities: a Decomposition Methodology Presentation to the Q Group Thomas S. Y. Ho Blessing Mudavanhu April 3-6, 2005 Introduction: Purpose Variable annuities: new products
QFI Advanced Sample Flash Cards
 QFI Advanced Sample Flash Cards You have downloaded a sample of our QFI Advanced flash cards. The flash cards are designed to help you memorize key material for the QFI Advanced exam. The flash cards are
The Interaction of Implied Equity Volatility, Stochastic Interest, and Volatility Control Funds for Modeling Variable Products.
 Equity-Based Insurance Guarantees Conference Nov. 5-6, 2018 Chicago, IL The Interaction of Implied Equity Volatility, Stochastic Interest, and Volatility Control Funds for Modeling Variable Products Mark
Strategic Asset Allocation A Comprehensive Approach. Investment risk/reward analysis within a comprehensive framework
 Insights A Comprehensive Approach Investment risk/reward analysis within a comprehensive framework There is a heightened emphasis on risk and capital management within the insurance industry. This is largely
Calibration of Economic Scenario Generators. Meeting the Challenges of Change. Eric Yau Consultant, Barrie & Hibbert Asia
 Calibration of Economic Scenario Generators Eric Yau Consultant, Barrie & Hibbert Asia Hong Kong Eric.Yau@barrhibb.com Meeting the Challenges of Change 14 th Global Conference of Actuaries 19 th 21 st
Session 021 TS - U.S. Statutory Update: Annuities. Moderator: Simpa A. Baiye, FSA MAAA
 Session 021 TS - U.S. Statutory Update: Annuities Moderator: Simpa A. Baiye, FSA MAAA Presenters: Cindy D. Barnard, FSA, MAAA Richard W. Harris, FSA, FCIA, MAAA SOA Antitrust Compliance Guidelines SOA
RISKMETRICS. Dr Philip Symes
 1 RISKMETRICS Dr Philip Symes 1. Introduction 2 RiskMetrics is JP Morgan's risk management methodology. It was released in 1994 This was to standardise risk analysis in the industry. Scenarios are generated
Article from. Risk Management. April 2016 Issue 35
 Article from Risk Management April 216 Issue 35 Understanding the Riskiness of a GLWB Rider for FIAs By Pawel Konieczny and Jae Jung ABSTRACT GLWB guarantees have different risks when attached to an FIA
Advanced Seminar on Principle Based Capital September 23, 2009 Session 1: C3P3 Overview
 Advanced Seminar on Principle Based Capital September 23, 2009 Session 1: C3P3 Overview David E. Neve, FSA, CERA, MAAA Overview of C3 Phase 3 for Life Products David E. Neve, FSA, CERA, MAAA Vice President,
Binomial Trees. Liuren Wu. Zicklin School of Business, Baruch College. Options Markets
 Binomial Trees Liuren Wu Zicklin School of Business, Baruch College Options Markets Binomial tree represents a simple and yet universal method to price options. I am still searching for a numerically efficient,
Aggregate Margin Task Force: LATF Update
 Aggregate Margin Task Force: LATF Update Mark Birdsall, FSA, MAAA William Hines, FSA, MAAA Tricia Matson, MAAA, FSA Aggregate Margin Task Force American Academy of Actuaries All Rights Reserved. Agenda
Financial Risk Measurement/Management
 550.446 Financial Risk Measurement/Management Week of September 23, 2013 Interest Rate Risk & Value at Risk (VaR) 3.1 Where we are Last week: Introduction continued; Insurance company and Investment company
Session 102 PD - Impact of VM-20 on Life Insurance Pricing. Moderator: Trevor D. Huseman, FSA, MAAA
 Session 102 PD - Impact of VM-20 on Life Insurance Pricing Moderator: Trevor D. Huseman, FSA, MAAA Presenters: Carrie Lee Kelley, FSA, MAAA William Gus Mehilos, FSA, MAAA SOA Antitrust Compliance Guidelines
INSTITUTE OF ACTUARIES OF INDIA
 INSTITUTE OF ACTUARIES OF INDIA EXAMINATIONS 10 th November 2008 Subject CT8 Financial Economics Time allowed: Three Hours (14.30 17.30 Hrs) Total Marks: 100 INSTRUCTIONS TO THE CANDIDATES 1) Please read
Callability Features
 2 Callability Features 2.1 Introduction and Objectives In this chapter, we introduce callability which gives one party in a transaction the right (but not the obligation) to terminate the transaction early.
Life 2008 Spring Meeting June 16-18, Session 94, Impact of IFRS Insurance Accounting. Moderator Simon R. Curtis, FSA, FCIA, MAAA
 Life 2008 Spring Meeting June 16-18, 2008 Session 94, Impact of IFRS Insurance Accounting Moderator Simon R. Curtis, FSA, FCIA, MAAA Authors Simon R. Curtis, FSA, FCIA, MAAA Laurel A. Kastrup, FSA, MAAA
Introduction to Options
 Introduction to Options Introduction to options Slide 1 of 31 Overview Introduction to topic of options Review key points of NPV and decision analysis Outline topics and goals for options segment of course
Low interest rates the new normal?
 Low interest rates the new normal? Actuarial Club of Southwest and Southeastern Actuaries Conference Francisco Orduña, FSA, MAAA Marshall Lin, FSA, MAAA, CFA 17 November 2016 The better the question. The
Milliman STAR Solutions - NAVI
 Milliman STAR Solutions - NAVI Milliman Solvency II Analysis and Reporting (STAR) Solutions The Solvency II directive is not simply a technical change to the way in which insurers capital requirements
Empirical Distribution Testing of Economic Scenario Generators
 1/27 Empirical Distribution Testing of Economic Scenario Generators Gary Venter University of New South Wales 2/27 STATISTICAL CONCEPTUAL BACKGROUND "All models are wrong but some are useful"; George Box
Risks and Rewards Newsletter
 Article from: Risks and Rewards Newsletter September 2000 Issue No. 35 RISKS and REWARDS The Newsletter of the Investment Section of the Society of Actuaries NUMBER 35 SEPTEMBER 2000 Chairperson s Corner
Fixed Income and Risk Management
 Fixed Income and Risk Management Fall 2003, Term 2 Michael W. Brandt, 2003 All rights reserved without exception Agenda and key issues Pricing with binomial trees Replication Risk-neutral pricing Interest
2016 American Academy of Actuaries. All rights reserved. May not be reproduced without express permission. STOCHASTIC, DETERMINISTIC AND NPR RESERVES
 2016 American Academy of Actuaries. All rights reserved. May not be reproduced without express permission. STOCHASTIC, DETERMINISTIC AND NPR RESERVES Agenda VM-20 Net Premium Reserves by Tim Cardinal Net
Using Leverage to Offset the Negative Carry of Tail Protection Across Different Markets
 Using Leverage to Offset the Negative Carry of Tail Protection Across Different Markets November 212 Robert Gingrich Disclaimer: The methods, tests and results described herein represent exploratory investigations
The Financial Reporter
 Article from: The Financial Reporter December 2004 Issue 59 Rethinking Embedded Value: The Stochastic Modeling Revolution Carol A. Marler and Vincent Y. Tsang Carol A. Marler, FSA, MAAA, currently lives
IASB s Insurance Contracts Exposure Draft: Risk in the Next Decade
 Actuarial Society of Hong Kong s tenth annual Appointed Actuaries Symposium IASB s Insurance Contracts Exposure Draft: Risk in the Next Decade R. Thomas Herget, FSA, MAAA, CERA President, Risk Lighthouse
A SUMMARY OF OUR APPROACHES TO THE SABR MODEL
 Contents 1 The need for a stochastic volatility model 1 2 Building the model 2 3 Calibrating the model 2 4 SABR in the risk process 5 A SUMMARY OF OUR APPROACHES TO THE SABR MODEL Financial Modelling Agency
Structured Variable Annuities: Design, Risk Management and Accounting
 Equity-Based Insurance Guarantees Conference Nov. 6-7, 2017 Baltimore, MD Structured Variable Annuities: Design, Risk Management and Accounting Simpa Baiye Sponsored by Structured Variable Annuities: Design,
Hedging Default Risks of CDOs in Markovian Contagion Models
 Hedging Default Risks of CDOs in Markovian Contagion Models Second Princeton Credit Risk Conference 24 May 28 Jean-Paul LAURENT ISFA Actuarial School, University of Lyon, http://laurent.jeanpaul.free.fr
Session 83 PD, Modeling Managing and Pricing Living Benefits Risk. Moderator: Sean Michael Hayward, FSA, MAAA
 Session 83 PD, Modeling Managing and Pricing Living Benefits Risk Moderator: Sean Michael Hayward, FSA, MAAA Presenters: Guillaume Briere-Giroux, FSA, MAAA Sean Michael Hayward, FSA, MAAA Eric L. Henderson,
Article from. Small Talk September 2015 Issue 44
 Article from Small Talk September 2015 Issue 44 Liability Durations for Premium Paying Products By James Ward Figure 1 Asset/liability management (ALM) has become an ever-increasing discipline within the
Managing the Newest Derivatives Risks
 Managing the Newest Derivatives Risks Michel Crouhy IXIS Corporate and Investment Bank / A subsidiary of NATIXIS Derivatives 2007: New Ideas, New Instruments, New markets NYU Stern School of Business,
Asset Liability Management Best Practice in Insurance
 Asset Liability Management Best Practice in Insurance Joint Regional Seminar 2017 1 Investment Environment 2 Investment Strategy Impacting Factors Investment Strategy (SAA / ALM) 3 Assessment of Vulnerability
Disclosure of European Embedded Value as of March 31, 2016, using an Ultimate Forward Rate
 UNOFFICIAL TRANSLATION Although Japan Post Insurance pays close attention to provide English translation of the information disclosed in Japanese, the Japanese original prevails over its English translation
Final Exam. 5. (24 points) Multiple choice questions: in each case, only one answer is correct.
 Multiple choice questions: in each case, only one answer is correct.") Final Exam Fall 06 Econ 80-367 Closed Book. Formula Sheet Provided. Calculators OK. Time Allowed: 3 hours Please write your answers on the page below each question. (0 points) A stock trades for $50. After
Final Exam Fall 06 Econ 80-367 Closed Book. Formula Sheet Provided. Calculators OK. Time Allowed: 3 hours Please write your answers on the page below each question. (0 points) A stock trades for $50. After
NAIC VA RESERVE AND CAPITAL REFORM RECOMMENDED REVISIONS TO AG43 & C3P2
 NAIC VA RESERVE AND CAPITAL REFORM RECOMMENDED REVISIONS TO AG43 & C3P2 AUGUST 23, 2016 CONFIDENTIALITY Our clients industries are extremely competitive, and the maintenance of confidentiality with respect
Disclosure of European Embedded Value as of March 31, 2018
 UNOFFICIAL TRANSLATION Although Japan Post Insurance pays close attention to provide English translation of the information disclosed in Japanese, the Japanese original prevails over its English translation
B6302 B7302 Sample Placement Exam Answer Sheet (answers are indicated in bold)
") B6302 B7302 Sample Placement Exam Answer Sheet (answers are indicated in bold) Part 1: Multiple Choice Question 1 Consider the following information on three mutual funds (all information is in annualized
B6302 B7302 Sample Placement Exam Answer Sheet (answers are indicated in bold) Part 1: Multiple Choice Question 1 Consider the following information on three mutual funds (all information is in annualized
ERM Symposium Mary Neumann, CUNA Mutual Group Kailan Shang, Manulife Financial April Risk Appetite Framework and Strategic Planning
 Linkage between Risk Appetite and Strategic Planning ERM Symposium 2012 By Mary Neumann, CUNA Mutual Group Kailan Shang, Manulife Financial April 2012 Agenda Research Background Risk Appetite Framework
Multiple Objective Asset Allocation for Retirees Using Simulation
 Multiple Objective Asset Allocation for Retirees Using Simulation Kailan Shang and Lingyan Jiang The asset portfolios of retirees serve many purposes. Retirees may need them to provide stable cash flow
The Recovery Theorem* Steve Ross
 2015 Award Ceremony and CFS Symposium: What Market Prices Tell Us 24 September 2015, Frankfurt am Main The Recovery Theorem* Steve Ross Franco Modigliani Professor of Financial Economics MIT Managing Partner
Stochastic Modelling for Insurance Economic Scenario Generator. Jonathan Lau, FIA, Solutions Specialist
 Stochastic Modelling for Insurance Economic Scenario Generator Jonathan Lau, FIA, Solutions Specialist Jonathan.Lau@Moodys.com 5 June Moody s Analytics Overview beyond credit ratings 2002 2005 2008 2011
MEMORANDUM. Bruce Friedland, Chair, American Academy of Actuaries Variable Universal Life Subgroup
 MEMORANDUM TO: FROM: Pete Weber, Chair, NAIC VM PBR Life Subgroup Bruce Friedland, Chair, American Academy of Actuaries Variable Universal Life Subgroup DATE: September 23, 2010 SUBJECT: Deterministic
INTEREST RATES AND FX MODELS
 INTEREST RATES AND FX MODELS 7. Risk Management Andrew Lesniewski Courant Institute of Mathematical Sciences New York University New York March 8, 2012 2 Interest Rates & FX Models Contents 1 Introduction
Options Markets: Introduction
 17-2 Options Options Markets: Introduction Derivatives are securities that get their value from the price of other securities. Derivatives are contingent claims because their payoffs depend on the value
HANDBOOK OF. Market Risk CHRISTIAN SZYLAR WILEY
 HANDBOOK OF Market Risk CHRISTIAN SZYLAR WILEY Contents FOREWORD ACKNOWLEDGMENTS ABOUT THE AUTHOR INTRODUCTION XV XVII XIX XXI 1 INTRODUCTION TO FINANCIAL MARKETS t 1.1 The Money Market 4 1.2 The Capital
Economic Scenario Generator and Stochastic Modelling. Jonathan Lau, FIA. Moody s Analytics
 1 st Capacity Building Seminar on Key aspects of Risk Management in Life Insurance Companies Economic Scenario Generator and Stochastic Modelling Jonathan Lau, FIA Moody s Analytics 9 August, Mumbai Indian
Retirement. Optimal Asset Allocation in Retirement: A Downside Risk Perspective. JUne W. Van Harlow, Ph.D., CFA Director of Research ABSTRACT
 Putnam Institute JUne 2011 Optimal Asset Allocation in : A Downside Perspective W. Van Harlow, Ph.D., CFA Director of Research ABSTRACT Once an individual has retired, asset allocation becomes a critical
Portfolio Management Philip Morris has issued bonds that pay coupons annually with the following characteristics:
 Portfolio Management 010-011 1. a. Critically discuss the mean-variance approach of portfolio theory b. According to Markowitz portfolio theory, can we find a single risky optimal portfolio which is suitable
Stochastic Modelling: The power behind effective financial planning. Better Outcomes For All. Good for the consumer. Good for the Industry.
 Stochastic Modelling: The power behind effective financial planning Better Outcomes For All Good for the consumer. Good for the Industry. Introduction This document aims to explain what stochastic modelling
PBR Regulatory Update and Implementation Challenges
 PBR Regulatory Update and Implementation Challenges Jason Kehrberg, PolySystems Actuaries Club of the Southwest Spring Meeting June 25, 2015 Agenda Brief Overview of PBR Regulatory Update Implementation
Report from the American Academy of Actuaries Economic Scenario Work Group
 Report from the American Academy of Actuaries Economic Scenario Work Group Presented to the National Association of Insurance Commissioners Life and Health Actuarial Task Force Washington, DC September
SAMPLE FINAL QUESTIONS. William L. Silber
 SAMPLE FINAL QUESTIONS William L. Silber HOW TO PREPARE FOR THE FINAL: 1. Study in a group 2. Review the concept questions in the Before and After book 3. When you review the questions listed below, make
The New Risk-Based Capital
 INSURANCE The New Risk-Based Capital K P M G L L P Laura S. Gray Southeastern Actuaries Conference Amelia Island, Florida June 2008 Please note: This is a discussion of industry perspectives and does not
Standardized Approach for Calculating the Solvency Buffer for Market Risk. Joint Committee of OSFI, AMF, and Assuris.
 Standardized Approach for Calculating the Solvency Buffer for Market Risk Joint Committee of OSFI, AMF, and Assuris November 2008 DRAFT FOR COMMENT TABLE OF CONTENTS Introduction...3 Approach to Market
AFTERNOON SESSION. Date: Thursday, April 26, 2018 Time: 1:30 p.m. 3:45 p.m. INSTRUCTIONS TO CANDIDATES
 SOCIETY OF ACTUARIES Life Finance & Valuation - Canada Exam ILALFVC AFTERNOON SESSION Date: Thursday, April 26, 2018 Time: 1:30 p.m. 3:45 p.m. INSTRUCTIONS TO CANDIDATES General Instructions 1. This afternoon
ALM as a tool for Malaysian business
 Actuarial Partners Consulting Sdn Bhd Suite 17-02 Kenanga International Jalan Sultan Ismail 50250 Kuala Lumpur, Malaysia +603 2161 0433 Fax +603 2161 3595 www.actuarialpartners.com ALM as a tool for Malaysian
Proxy Function Fitting: Some Implementation Topics
 OCTOBER 2013 ENTERPRISE RISK SOLUTIONS RESEARCH OCTOBER 2013 Proxy Function Fitting: Some Implementation Topics Gavin Conn FFA Moody's Analytics Research Contact Us Americas +1.212.553.1658 clientservices@moodys.com