Annual Report and Financial Statements
|
|
|
- Joanna Bailey
- 5 years ago
- Views:
Transcription

1 Bluefield Solar Income Fund Limited Annual Report and Financial Statements FOR THE YEAR ENDED 30 JUNE 2017 Company Registration Number: 56708
2 Table of Contents General Information 3 Highlights 4 Corporate Summary 6 Chairman s Statement 7 The Company's Investment Portfolio 10 Analysis of the Company's Investment Portfolio 12 Strategic Report 13 Report of the Investment Adviser 30 Report of the Directors 53 Board of Directors 59 Directors Statement of Responsibilities 60 Responsibility Statement of the Directors in Respect of the Annual Report 61 Corporate Governance Report 62 Report of the Audit Commitee 70 Independent Auditor's Report 75 Statement of Financial Position 80 Statement of Comprehensive Income 81 Statement of Changes in Equity 82 Statement of Cash Flows 83 Notes to the Financial Statements for the year ended 30 June Glossary of Defined Terms 114
3 General Information Board of Directors (all non-executive) John Rennocks (Chairman) John Scott (Senior Independent Director) Paul Le Page (Chairman of Audit Committee) Laurence McNairn Investment Adviser Bluefield Partners LLP 53 Chandos Place London, WC2N 4HS Administrator, Company Secretary and Designated Manager Heritage International Fund Managers Limited Heritage Hall PO Box 225 Le Marchant Street, St Peter Port Guernsey, GY1 4HY Registered Office Heritage Hall PO Box 225 Le Marchant Street St Peter Port Guernsey, GY1 4HY Sponsor, Broker and Financial Adviser Numis Securities Limited The London Stock Exchange Building 10 Paternoster Square London, EC4M 7LT Independent Auditor & Reporting Accountants KPMG Channel Islands Limited Glategny Court, Glategny Esplanade St Peter Port Guernsey, GY1 1WR Registrar Capita Registrars (Guernsey) Limited Mont Crevelt House Bulwer Avenue, St Sampson Guernsey, GY2 4LH Receiving Agent and UK Transfer Agent Capita Registrars Limited The Registry 34 Beckenham Road, Beckenham Kent, BR3 4TU Legal Advisers to the Company (as to English law) Norton Rose Fulbright LLP 3 More London Riverside London, SE1 2AQ Legal Advisers to the Company (as to Guernsey law) Carey Olsen PO Box 98 Carey House Les Banques St Peter Port Guernsey, GY1 4BZ Principal Bankers Royal Bank of Scotland International Limited Royal Bank Place 1 Glategny Esplanade St Peter Port Guernsey, GY1 4BQ 3
4 Highlights Introduction The Company delivered total underlying earnings 1 of 25.1 million (2016: 20.9 million) in the year and underlying EPS 2 of 7.32 pence (2016: 7.10 pence) and declared a fully covered dividend of 7.25 pps against a target of 7.18 pps (2016: 7.25 pps and a target of 7.07 pps); Fully covered debt service including both interest and principal repayment of 2.7 million; A successful Placement of new shares in October 2016 raised gross proceeds of 60.6 million and the Company s market capitalisation grew to 425 million at 30 June 2017; During the year ended 30 June 2017, the Company announced 10 acquisitions, consisting of 10 additional plants, financed by total consideration of 44.4 million with an estimated combined energy capacity of 40.3 MWp; As at 30 June 2017, the Company had a total of 41 large solar assets, 40 micro solar assets and 1 roof top asset, with an estimated combined energy capacity in excess of MWp, all of which were operational; NAV as at 30 June 2017 was 409 million (30 June 2016: 308 million), equivalent to a NAV per share of pence (30 June 2016: pence); WACC used for the Directors Valuation reduced from 6.6% at 30 June 2016 to 6.15%; In September 2016, the Company announced a long term financing agreement between BSIFIL and Aviva Investors. The 187 million facility is fully amortising over 18 years and has two tranches: million is fixed at a cost of 2.875% and 65.5 million has a cost of 0.70% plus RPI; and The portfolio capacity as at 30 June 2017 will power the equivalent of 133,774 homes and save 189,845 tonnes of CO2 in a year. 1. Underlying earnings is an alternative performance measure employed by the Company to provide insight to the shareholders by definitively linking the underlying financial performance of the operational projects to the dividends declared and paid by the Company. Further detail is provided on page Underlying EPS is calculated using underlying earnings divided by the average number of shares calculated as described on page 39. 4
5 Highlights (continued) Results Summary: As at / year ended 30 June 2017 Total operating income 65,236,334 Total comprehensive income 64,045,718 Total underlying earnings 25,060,605 Earnings per share 18.26p Underlying EPS 7.32p Earnings per share bought forward 0.23p Total declared dividends per share for year 7.25p Earnings per share carried forward (See Page 39) 0.30p NAV per share p Share price at 30 June p Total return % Total return to shareholders % 3. Total return is based on NAV per share movement and dividends paid in the year 4. Total return to shareholders is based on share price movement and dividends paid in the year 5
6 Corporate Summary Investment objective The investment objective of the Company is to provide shareholders with an attractive return, principally in the form of regular income distributions, by investing in a portfolio of UK - based solar energy infrastructure assets. Structure The Company is a non-cellular company limited by shares incorporated in Guernsey under the Law on 29 May The Company s registration number is 56708, and is regulated by the GFSC as a registered closed-ended collective investment scheme. The Company s Ordinary Shares were admitted to the Premium Segment of the Official List and to trading on the Main Market of the London Stock Exchange following its IPO on 12 July The issued capital during the year comprises the Company s Ordinary Shares denominated in Sterling. The Company has the ability to use long term and short term debt at the holding company level as well as having long term, non-recourse debt at the SPV level. Investment Adviser The Investment Adviser to the Company during the year was Bluefield Partners LLP which is authorised and regulated by the UK FCA under the number In May 2015 BSL, a company with the same ownership as the Investment Adviser, commenced providing asset management services to the investment SPVs held by BSIFIL. 6
7 Chairman s Statement Introduction It has been another good year for the Company. Dividends for the full financial year are again 7.25 pps, unchanged from last year but ahead of our target of 7.18 pps; this now means we have distributed total dividends of pps from our cash flows since February The Company's NAV now reflects the value acquirers have ascribed to the UK solar assets they have purchased in recent transactions and this valuation is closer to the price the market attributes to our shares. NAV per share is pps up from pps a year ago and the share price as at 30 June 2017 rose to pps from pps. This has resulted in a NAV total return for the year of +18% and share price total return of +23%. Irradiation was 0.3% below the historical average, demonstrating that solar irradiation continues to be a highly predicable energy source that closely tracks long term irradiation data nonetheless our portfolio has again produced generational performance ahead of warranted levels, delivering a 2.6% outperformance compared to an outperformance of 1.8% last year. This is a credit to the technical asset management activities of BSL, who have driven the outperformance. Key Events We invested 44.4m in new projects in the year, a significant reduction on the investment rate in our first three years. Competitive acquisition market conditions and reduced Government incentives for investment diminished our appetite, despite continuing intensive activity by our Investment Adviser in reviewing possible opportunities. As I have indicated in previous statements, it is not our objective to dilute the excellent returns our present portfolio of assets is providing for our shareholders and we will not raise new capital to invest in inferior assets with lower returns. With effect from 1 April 2017, there are no longer any UK Government backed incentives to invest in new solar assets and for now this has effectively closed the market for new investments in primary assets. Any further investments by your Company, at least for the time being, will need to come from exploring the secondary market for existing assets but, at present, investments that meet our return criteria are few and far between. The capital cost of solar equipment has fallen sharply in recent years, and we expect this to continue, and in due course new solar PV projects in the UK may become more attractive and deliver acceptable returns without government incentives. But we are not there yet. The Company, through its direct subsidiary BSIFIL, agreed a favourable long term financing agreement with Aviva Investors in September Details are set out in the Investment Adviser s report. Underlying Earnings and Dividend Income The Company is a high yielding income fund and the principal measure of our health will always be the cash flows we generate year by year. We are pleased that once again our available cash flow for 2016/17, after scheduled debt repayments and interest, has exceeded our dividend objectives. This is despite power market prices being some 30% below projections made when your Company began operations in 2013, albeit slightly above the levels of the previous year. This has enabled us to maintain dividends at the rate of 7.25 pps, slightly above our target of 7.18 pps, with 0.30 pps carried forward to 2017/18. 61% of the Company s revenues are regulated and linked directly to RPI. In the medium to long term, in order to meet our dividend target of raising the dividend with RPI each year, the remaining 39% of revenues that comes from the sale of electricity in the wholesale market will need also to rise. 7
8 Chairman s Statement (continued) Underlying Earnings and Dividend Income (continued) In prior years, the requirement to balance dividends between existing and new shareholders when we had new share issues led to dividend payments just before each new issue. Should there be no such share issues in future years, it would be our intention to shape the quarterly dividends on a more even basis, but there will, nevertheless, always be an element of seasonality for a UK only solar investor. It remains our key objective to seek to pay dividends which increase in line with inflation from our base point in July 2014 of 7.00 pps and our target is set at the beginning of each financial year by adding RPI inflation to the previous year target. RPI for the 2017/18 financial year is expected to exceed 3%, so we are already aware that our target for the current year is above 7.40 pps. The Investment Adviser and BSL are focused on continuing to optimise the asset performance, negotiating the best PPA terms and continuing to seek opportunities to deploy the cash reserves and the revolving credit facility in value accretive transactions. The Board will be monitoring this closely. These enhancements to the earnings stream, together with the modest retentions carried over into next year will provide support for our dividend objective in 2017/18. We remain the highest dividend payer in the sector, and expect to continue to be so; with that higher dividend, however, comes the challenge of delivering higher dividend increases. Valuation Activity in the acquisition market place between willing buyers and willing sellers has seen higher transaction valuations than in the previous years, and this reflects lower discount rates on the cost of capital, whether equity, or weighted between equity and debt. This reduction has been further emphasised by historically low long term Sterling interest rates, and we were pleased to take advantage of that opportunity with our facility with Aviva Investors. To reflect these market changes we have decided to adopt discount rates at lower levels than for the previous year with equity now discounted at 7.43% and a weighted average cost of capital of 6.15%. The combination of new investors and funders, often seeking secure yield not available elsewhere, and the diminished availability of investment opportunities, has combined to push up asset prices and provide strong benefits to early investors such as ourselves, who built their portfolios before prices moved upwards and we have also benefitted from low debt costs. The discipline of not investing in higher priced, lower return assets prevents dilution and sustains these benefits for our shareholders. Our other most significant variable has been the projections of power prices where we use the combined forecasts of two leading independent forecasters and which, after a rise in the first part of the year, have fallen back in the second half and overall are little changed from the forecast we used last year. Similarly, our assumption on long term inflation is unchanged since 31 December 2016 and we have not taken benefit from the government proposals on tax shielding from debt (BEPS), which is not expected to be enacted until the autumn. 8
9 Chairman s Statement (continued) Long Term Financing In September 2016, we announced our long term financing agreement with Aviva Investors. The all-in cost of the million fixed price loan at 2.875% interest and the 65.5 million index linked element at 70bps plus RPI is highly attractive in respect of cost and offers protective levels of debt service cover. The 18 year, fully amortising payment profile is also appropriate for this asset class. This means that, beyond the element driven by RPI, the Company does not have any significant interest rate risks or bullet repayments on this financing for the full 18 year term. On the Company s base case projections the long term debt service cover ratio (DSCR) is nearly 3 times covered by earnings and this conservative position has been achieved because the Company has relatively low levels of overall leverage (c.33% to GAV), combined with low interest rates. Performance of the Portfolio The energy generation of the Company s portfolio is significantly above target. This is a credit to the technical asset management activities of BSL, who have increased the generational outperformance by comparison with levels warranted by the sellers and developers when they were acquired by the Company from 1.8% in the previous financial year to 2.6% in 2016/17. It is also a reflection of the quality of the portfolio. Detail on the generation is provided by the Investment Adviser and, as in previous reports, the analysis takes the actual generation and shows how this is monetised and drops down into the full year underlying earnings and dividend per share. Outlook The Company and its Investment Adviser will continue to examine acquisition opportunities, but will maintain the discipline necessary to deliver acceptable returns to our shareholders, as we have done during our first four years. As we have a full payout policy from our free cash flow, we do not create surplus funds for which we need to find new investments at times when the required returns are not available. Our focus in the coming year will be to optimise our revenue from the existing portfolio, both by active management of our power contracts, in a challenging market, and strong operational management through BSL, who will also actively pursue further value enhancing strategies across our portfolio. While not underestimating the challenge posed by the desire to increase our dividend in line with RPI, we look forward to another successful year. John Rennocks Chairman 15 September

10 The Company s Investment Portfolio 10
11 11

12 Analysis of the Company s Investment Portfolio 12
13 Strategic Report Introduction The Strategic Report sets out: STRATEGIC ISSUES 1. Company s Objectives and Strategy 2. Company s Operating Model 3. Investment Policy 4. Policies, approach and achievements adopted in respect of CSR OPERATIONAL ISSUES 5. Operational & Financial Review for the period (including KPI) 6. Directors Valuation of the Company s Portfolio 7. Principal Risks and Uncertainties STRATEGIC ISSUES 1. Company s Objectives and Strategy The Company seeks to provide shareholders with an attractive return, principally in the form of quarterly income distributions, by investing in a portfolio of large scale UK based solar energy infrastructure assets. The Company targeted a dividend of 7.00 pps in relation to the financial year ended 30 June 2015 with the intention of this rising annually thereafter with the RPI. Subject to maintaining a prudent level of reserves, the Company aims to achieve this through optimisation of asset performance, future acquisitions and use of gearing. The Company s dividend target for the financial year ended 30 June 2017 was 7.18 pps. For the year to 30 June 2017, the Company has declared dividends of 7.25 pps, a third year of dividend outperformance relative to its target. The Operational and Financial Review section on page 19 provides further information relating to performance during the year. 2. Company s Operating Model Structure The Company holds and manages its investments through a UK limited company, BSIFIL, in which it is the sole shareholder. 13

14 Strategic Report (continued) 2. Company s Operating Model (continued) Management Board and Committees The independent Board is responsible to shareholders for the overall management of the Company. The Board has adopted a Schedule of Matters Reserved for the Board which sets out the particular duties of the Board. Such reserved powers include decisions relating to the determination of investment policy, approval of new investments, oversight of the Investment Adviser, approval of changes in strategy, risk assessment, Board composition, capital structure, statutory obligations and public disclosure, financial reporting and entering into any material contracts by the Company. Through the Committees and the use of external independent advisers, the Board manages risk and governance of the Company. The Board consists of four independent non-executive Directors. See the Corporate Governance Report for further details. Investment Adviser The Company has entered into an Investment Advisory Agreement with the Investment Adviser. This sets out the Investment Adviser s key responsibilities, which include identifying and recommending suitable investments for the Company to enter into and negotiating on behalf of the Company the terms on which such investments will be made. 14
15 Strategic Report (continued) 2. Company s Operating Model (continued) Management (continued) Through a Technical Services Agreement with BSIFIL the Investment Adviser is also responsible for all issues relating to the supervision and monitoring of existing investments (included within the fee cap under the Investment Advisory Agreement). The Company has appointed BSL, a company with the same ownership as the Investment Adviser, to provide asset management services for the Company s portfolio. During the year the Investment Adviser has been paid a base fee of 0.73% of NAV at 30 June 2017 and a variable fee, in respect of 2016/17, equating to 0.04% of NAV, which was settled by issue of Ordinary Shares. Post year end, following the declaration of an above target total dividend by the Company for 2017, the Investment Adviser is also entitled to a variable fee which is triggered when dividends in relation to a full financial year exceed targets. In the financial year the variable fee, which will be paid in shares, equated to 0.02% of NAV. A summary of the fees paid to the Investment Adviser is given in Note 16 of the financial statements. The fees paid to BSL, the solar asset management business with shared ownership with the Investment Adviser, are detailed in Note 16. Administrator The Board has delegated administration and company secretarial services to the Administrator. Further details on the responsibilities assigned to the Investment Adviser and the Administrator can be found in the Corporate Governance Report. Employees and Officers of the Company The Company does not have any employees and therefore policies for employees are not required. The Directors of the Company are listed on page 3. Investment Process Through its record of investment in the UK solar energy market, the Investment Adviser has developed a rigorous approach to investment selection, appraisal and commitment. Repeat transaction experience with specialist advisers The Investment Adviser has worked with a range of legal, technical, insurance and accounting advisers in each of the transactions it has executed in the UK market. This direct experience has enabled it to develop an understanding of key areas of competence to address specific issues; for example, identifying specific individuals who are expert in advising on specific detailed technical aspects of a project. Through this direct specialist experience, the Investment Adviser is able to source relevant expertise to address project issues both during and following a transaction. Application of standardised terms developed from direct experience The Investment Adviser has developed standardised terms which have been specifically tested by reference to real transaction and project operational experience. Whilst contract terms are specifically negotiated and tailored for each individual project, solar project contracts applied by the Investment Adviser typically have specific protections from the construction contracts regarding recovery of revenue losses for underperformance and obligations for correction of defects. Both such provisions have been specifically exercised by the Investment Adviser giving it direct experience in activating contractual protections. 15
16 Strategic Report (continued) 2. Company s Operating Model (continued) Investment Process (continued) Rigorous internal approval process All investment recommendations issued to the Company, and all investment recommendations made in relation to previous transactions of the Investment Adviser are made following the formalised review process described below: (1) Investment origination and review by Managing Partners Before incurring costs in relation to the preparation of a transaction, a project is concept reviewed by the Investment Adviser s Managing Partners, following which a letter of interest or memorandum of understanding is issued and project exclusivity is secured. (2) Director Concept Approval In the event that material costs are to be incurred in pursuing a transaction, a concept paper is issued by the Investment Adviser for review by the Directors of the Company. This concept review fixes a project evaluation budget as well as confirming the project proposal is in line with the Company s investment policy and strategy. (3) Due diligence In addition to applying its direct commercial experience in executing solar PV project acquisitions and managing operational solar plants, the Investment Adviser engages legal, technical and, where required, insurance and accounting advisers to undertake independent due diligence in respect of a project. Where specialist expertise is required due to project specifications, the Investment Adviser has experience in identifying relevant experts. (4) Bluefield Partners LLP Investment Committee Investment recommendations issued by the Investment Adviser are made following the submission of a detailed investment paper to the Investment Committee. The Investment Committee operates on the basis of unanimous consent and has a record of making detailed evaluation of project risks. The investment paper submitted to the Investment Committee discloses all interests which the Investment Adviser and any of its affiliates may have in the proposed transaction. (5) Board approval Following approval by the Investment Adviser Investment Committee, investment recommendations are issued by the Investment Adviser for review by the boards of the Company and BSIFIL. Both the Company and the BSIFIL board undertake detailed review meetings with the Investment Adviser to assess the project prior to determining any approval. Both board approvals are required in order for a transaction to be approved. If the boards of the Company and BSIFIL approve the relevant transaction, the Investment Adviser is authorised to execute the transaction in accordance with the Investment Adviser s recommendation and any condition stipulated in the boards approval. The Board is continuously aware of the overall pipeline of potential new investments that can lead to choices between projects depending on available funding facilities. (6) Closing memorandum Prior to executing the transaction, the Investment Adviser completes a closing memorandum confirming that the final transaction is in accordance with the terms presented in the investment paper to the Investment Committee; detailing any material variations and outlining how any conditions to the approval of the Investment Committee and/or Board approval have been addressed. This closing memorandum is countersigned by an appointed member of the Investment Committee prior to completing the transaction. 16
17 Strategic Report (continued) 2. Company s Operating Model (continued) Managing conflicts of interest The Investment Adviser and any of its members, directors, officers, employees, agents and connected persons, and any person or company with whom they are affiliated or by whom they are employed may be involved in other financial, investment or other professional activities which may cause potential conflicts of interest with the Company and its investments. The Directors have noted that the Investment Adviser has other clients and have satisfied themselves that the Investment Adviser has procedures in place to address potential conflicts of interest. The potential conflicts of interest are disclosed in the investment recommendation for each investment. 3. Investment Policy The Company invests in a diversified portfolio of solar energy assets, each located within the UK, with a focus on utility scale assets and portfolios on greenfield, industrial and/or commercial sites. The Company targets long life solar energy infrastructure, expected to generate stable renewable energy output over a 25 year asset life. Individual solar assets or portfolios of solar assets are held within SPVs into which the Company invests through equity and/or debt instruments. The Company typically seeks legal and operational control through direct or indirect stakes of up to 100% in such SPVs, but may participate in joint ventures or minority interests where this approach enables the Company to gain exposure to assets within the Company s investment policy which the Company would not otherwise be able to acquire on a whollyowned basis. The Company may, at holding company level, make use of both short term debt finance and long term structural debt to facilitate the acquisition of investments, but such holding company level debt (when taken together with the SPV finance noted above) will also be limited so as not to exceed 50% of the Gross Asset Value. The Company may make use of non-recourse finance at the SPV level to provide leverage for specific solar energy infrastructure assets or portfolios provided that at the time of entering into (or acquiring) any new financing, total non-recourse financing within the portfolio will not exceed 50% of the prevailing Gross Asset Value. No single investment in a solar energy infrastructure asset (excluding any third party funding or debt financing in such asset) will represent, on acquisition, more than 25% of the Net Asset Value. The portfolio provides diversified exposure through the investment in not less than five individual solar energy infrastructure assets. Diversification is achieved across various factors such as grid connection points, individual landowners and leases, providers of key components (such as PV panels and inverters) and assets being located across various geographical locations within the United Kingdom. The Company aims to derive a significant portion of its targeted return through a combination of the sale of ROCs and FiTs (or any such regulatory regimes that replace them from time to time). Both such regimes are currently underwritten by UK Government policy providing a level of ROCs or FiTs fixed for 20 years for accredited projects and each regime currently benefits from an annual RPI escalation. The Company also intends, where appropriate, to enter into power purchase agreements with appropriate counterparties, such as co-located industrial energy consumers or wholesale energy purchasers. 17
18 Strategic Report (continued) 3. Investment Policy (continued) The Company s investment policy has the flexibility to commit to assets during the construction phase or the operational phase. During the period under review, the Investment Adviser has invested in construction phase assets and has acquired a large secondary portfolio in order to: 1. Maximise quality and scale of deal flow: The flexibility of the strategy maximises the pool of assets available to the Company. The majority of developers and contractors in the UK solar market were unable to fund on their own balance sheets, therefore construction funders such as Bluefield were able to select their construction partners and assets from the widest possible pool. The maturing of the UK solar market has resulted in the Company being offered substantial operational asset portfolios for the first time, during the period; 2. Optimise the efficiency of the acquisitions: Funding through the construction phase removes a layer of financing cost provided by third party construction funders, typically passed on to the end acquirer; likewise, when acquiring secondary assets, the Company has selected assets based on quality, cost and attractiveness of the financing attached to the acquisitions; 3. Minimise risk via appropriate contractual agreements: Risk can be further minimised by appropriate contractual agreements. For construction assets, these include making milestone payments backed, typically, by bonds, security plant and equipment and significant cash hold backs; and 4. Acquire assets using conservative assumptions: As can be seen by the valuation contained in this report, the Company has acquired assets based upon a cautious set of assumptions. Listing Rule Investment Restrictions The Company currently complies with the investment restrictions set out below and will continue to do so for so long as they remain requirements of the Financial Conduct Authority: neither the Company nor any of its subsidiaries will conduct any trading activity which is significant in the context of the Group as a whole; the Company must, at all times, invest and manage its assets in a way which is consistent with its objective of spreading investment risk and in accordance with the published investment policy; and not more than 10% of the Gross Asset Value at the time of investment is made will be invested in other closed-ended investment funds which are listed on the Official List. As required by the Listing Rules, any material change to the investment policy of the Company will be made only with the prior approval of the Financial Conduct Authority and Shareholders. 4. Policies, approach and achievements adopted in respect of CSR The Directors and the Investment Adviser are focused on the corporate objective of providing investors with an ethical, socially responsible and transparently managed Company. The best standards of governance and CSR are central to the Company s ethics and important in ensuring the continued attractiveness of the Company to the broad group of stakeholders with which it interacts. The production of sustainable energy from the Company s portfolio is expected to save the emission of millions of tonnes of CO2 throughout the life of the assets. In addition, the Company seeks to increase biodiversity at its sites by appropriate planting and landscaping of the land it manages, as detailed in the Environmental, Social and Governance report on pages 51 to
19 Strategic Report (continued) OPERATIONAL ISSUES 5. Operational & Financial Review for the period Key Performance Indicators The Board has identified the following indicators for assessing the Company s annual performance in meeting its objectives: As at 30 June 2017 As at 30 June 2016 Market Capitalisation 425,282, ,857,686 Share price p 99.75p Total dividends per share declared in relation to the year 7.25p 7.25p NAV 408,608, ,752,538 NAV per share p 99.39p Total Return to shareholders (based on share price and dividends paid in the year) 22.56% (2.5)% Acquisitions During the year, the Company completed 10 acquisitions for a total consideration of 44.4 million (2016: million). Each investment has been carefully selected to ensure the portfolio is well balanced geographically, with appropriate levels of diversification of construction and operation contractors and key equipment. Portfolio Performance Portfolio performance and power price movements are discussed within the Investment Adviser s report under Sections 2 and 4. The Company s PPA strategy is to enter into short term contracts with contracting periods spread quarterly across the portfolio in order to minimise the portfolio s sensitivity to short term price volatility. 19
20 Strategic Report (continued) 5. Operational & Financial Review for the period (continued) Summary Statement of Comprehensive Income Year ended 30 June 2017 million Year ended 30 June 2016 (Restated) million Total Income (Note 4 of the financial statements) Change in fair value of assets (Note 8 of the financial statements) Administrative expenses (Note 5 of the financial statements) (1.2) (1.4) Total comprehensive income before tax Tax - - Total comprehensive income Earnings per share 18.26p 2.92p Income for the period represents interest income and monitoring fees by BSIFIL to BSIF. The total comprehensive income before tax of 64.0 million reflects the performance of the Company when valuation movements and operating costs are included. Further detail on valuation movements of BSIFIL s portfolio is given in the Report of the Investment Adviser. Ongoing Charges Year to 30 June 2017 Year to 30 June 2016 The The Company BSIFIL Total Company BSIFIL Total Fees to Investment Adviser 355,371 2,642,082 2,997, ,518 2,206,714 2,832,232 Legal and professional fees 98,606 23, , ,871 1, ,971 Administration fees 262, , , ,274 Directors remuneration 159,963 10, , ,733 10, ,733 Audit fees 95,466 17, ,216 85,925 24, ,925 Other ongoing expenses 218, , , , , ,968 Total expenses 1,190,616 3,071,776 4,262,392 1,486,567 2,372,536 3,859,103 Non-recurring expenses (122,392) (224,093) (346,485) (485,289) - (485,289) Total ongoing expenses 1,068,224 2,847,683 3,915,907 1,001,278 2,372,536 3,373,814 Average NAV 361,749, ,619,714 Ongoing Charges (using AIC methodology) 1.08% 1.11% Performance fee 0.02% 0.06% Ongoing charges plus performance fee 1.10% 1.17% The ongoing charges ratio is calculated in accordance with the AIC recommended methodology, which excludes non-recurring costs and uses the average NAV in its calculation. 20
21 Strategic Report (continued) 6. Directors Valuation* of Company s portfolio The Investment Adviser or an independent external valuer is responsible for preparing the fair market valuation recommendations for the Company s investments for review and approval by the Directors. Valuations are carried out on a six monthly basis as at 31 December and 30 June each year and the Company has committed to procure a review of valuations by an independent expert not less than once every three years. Such an external valuation was undertaken by EY for the year ended 30 June 2015 and considered by the Directors in determining the portfolio fair value at that date. The Directors Valuation adopted for the portfolio as at 30 June 2017 was million (Note 8), representing a cumulative 5.69% uplift on investment cost, derived from a combination of income generated within the investments and revaluation uplift under discounted cash-flow methodology. The Board reviews and considers the recommendations of the Investment Adviser to form an opinion of the fair value of the Company s investments. A detailed analysis of the Directors Valuation is presented in the Report of the Investment Adviser. 7. Principal Risks and Uncertainties Under the FCA s Disclosure Guidance and Transparency Rules, the Directors are required to identify those material risks to which the Company is exposed and take appropriate steps to mitigate those risks. These inherent risks associated with investments in the solar energy sector could result in a material adverse effect on the Company s performance and value of Ordinary Shares. Bluefield Solar Income Fund Limited s risk register covers four main areas of risk: Portfolio Management; Operational; Regulatory; and External. Each of these areas, together with the principal risks with that category, is summarised in the table below and include commentary on the mitigating factors. * Directors Valuation is an alternative performance measure to show the gross value of the SPV investments held by BSIFIL, including their holding companies. A reconciliation of the Directors Valuation to Financial assets at fair value through profit and loss is shown in Note 8 of the financial statements. 21
22 Strategic Report (continued) 7. Principal Risks and Uncertainties (continued) PORTFOLIO MANAGEMENT Risk Potential Impact Mitigation 1. Portfolio Acquisition Risk 2. Portfolio Operational Risk Missed investment opportunities. Underperformance of solar plant versus expectations at acquisition. The Board reviews the Company's investment pipeline with the Investment Adviser on a regular basis. The Company, through BSIFIL, has access to additional debt financing under terms of its three year revolving credit facility with RBS, as well as the option to complete a tap issuance to support further acquisitions if required. The closure of the primary market for solar assets has led to inflation in secondary market prices reducing potential yield of new purchases. BSL as asset manager prepares a quarterly operational summary for the Board that evaluates the performance of each plant against budget and highlights any issues to be addressed. The Board also now receives a monthly operations report from BSL. 22
23 Strategic Report (continued) 7. Principal Risks and Uncertainties (continued) OPERATIONAL Risk Potential impact Mitigation 3. Valuation error Valuations of the SPV investments are reliant on large and detailed financial models based on discounted cash flows. Significant inputs such as the discount rate, rate of inflation and the amount of electricity the solar assets are expected to produce are subjective and certain assumptions or methodologies applied may prove to be inaccurate. This is particularly so in periods of volatility or when there is limited transactional data for solar PV generation against which the investment valuation can be benchmarked. Other inputs such as the price at which electricity and associated benefits can be sold are subject to government policies and support. The discount factor applied to the cash flows is reviewed by the Investment Adviser to ensure that it is set at the appropriate level. All papers supporting the GAV calculation and methodology used are presented to the Board for approval and adoption. Ongoing quarterly reconciliations are performed between the SPVs and BSIF. The Board has committed to obtaining 3rd party valuations at least every three years. The first valuation was completed in June An additional and detailed independent review of the portfolio cash flow model was carried out as part of the long term debt financing procurement process. To mitigate the impact of power price volatility on the Company s portfolio valuation blended power price curves from two leading forecasters are used in the portfolio cash flow model. 23
24 Strategic Report (continued) 7. Principal Risks and Uncertainties (continued) OPERATIONAL (continued) Risk Potential impact Mitigation 4. Valuation error Model Risk - An error in the cash-flow models could lead to an incorrect valuation. 5. Depreciation of NAV The portfolio NAV will depreciate towards the end of the fund's life. The SPV cash flow models are reviewed using a "four eyes" approach and were independently reviewed as part of the external portfolio valuation in June The models were subject to detailed reviews and stress tests by the Company's credit providers in Q The models do not extend the life of cash flows beyond 25-years without evidence of lease and planning extensions. The Investment Adviser has been requested to model how the portfolio NAV will move with time, producing long term scenario planning for the Boards review. The Board has authorised the Investment Adviser to negotiate lease extensions on all active plants as it deems necessary. EXTERNAL Risk Potential impact Mitigation 6. Unfavourable Weather and Climate Conditions Weather related risks: annual income generation of the Company is sensitive to weather conditions and in particular to the level of irradiation across the investment locations. Variability in weather could result in greater than 10% variability in revenue generation year on year. The Company has diversified the locations of its plants across the UK. 24
25 Strategic Report (continued) 7. Principal Risks and Uncertainties (continued) EXTERNAL (CONTINUED) Risk Potential impact Mitigation 6. Unfavourable Weather and Climate Conditions (continued) The Company uses on site measurement of irradiation in order to measure performance against budget, and its portfolio is dispersed across the south of the UK. The use of solar photovoltaic technology at the sites means generation is not dependent only on direct irradiation but also on predictable daylight, limiting short term volatility when compared to other weather dependent electricity generation. The Company and other clean energy providers are doing their part to reduce the Earth's Carbon Footprint, however there are already damaging long term effects which may impact the Company. The management of such an outcome is largely out of the Company's control. 25
26 Strategic Report (continued) 7. Principal Risks and Uncertainties (continued) EXTERNAL (CONTINUED) Risk Potential impact Mitigation 7. Unfavourable Electricity Market Conditions Annual income generation of the Company is sensitive to future power market pricing. A major structural shift in power demand or supply will impact the Company's ability to meet its dividend target. The reduction of all energy prices may also have a negative effect on the price of all sources of energy. The Investment Adviser regularly updates the portfolio cash flow model to reflect future power market forecasts and where appropriate applies discounts to the forecasts. New projects are always assessed using the most recent power market forecast data available. A rolling programme of PPA contract expiries has been implemented to minimise risk. Protection against a sustained period of low energy prices can only be achieved by maximising exposure to regulatory revenues through acquisition of more legacy FiT and ROC plants. Some recent acquisitions have included fixed power contracts for a longer period, reducing exposure to short term volatility. Long term power prices are however beyond the control of the Company. A third party review of the power strategy adopted by the Investment Adviser has also given a strong independent verification of the strategy. The Investment Adviser is currently reviewing possibilities for the private sale of electricity to stabilise long term revenues. 26
27 Strategic Report (continued) 7. Principal Risks and Uncertainties (continued) EXTERNAL (CONTINUED) Risk Potential impact Mitigation 8. Changes in tax regime There may be unfavourable tax related changes including restrictions on renewables, or no relief on debt structuring. In October 2015 the final proposals for the 15 Base Erosion and Profit Shifting Actions were delivered to the G20 Finance Ministers. This included a timetable for implementation and for which Europe is expected to be a forerunner. An independent taxation review of the Company was carried out as part of the long term debt financing procurement process. The Board continues to monitor the situation and take advice from the Company's tax advisers as necessary. 9. Changes to Government Plans Decisions affecting the wholesale supply of electricity through either i) a flooded market or ii) other available forms of energy sources. The Investment Adviser provides regular updates in this regard within the quarterly Board papers. 10. Political risk The decision by the UK to exit the EU has elevated levels of political uncertainty and may have an adverse impact on the Company. Since announcement of the EU referendum result there has been a weakening of Sterling s exchange rate against a number of major currencies, a downgrade of the UK s credit rating and a cut in interest rates. The Company has been favourably impacted by these changes to date. The Company has negligible foreign currency exposure and the reduction in yield on gilts has materially reduced the cost of the long term debt issue. There are however other unknown risks which may or may not occur in the medium and longer term and which the Board will monitor closely should they arise. 27
28 Strategic Report (continued) 7. Principal Risks and Uncertainties (continued) Longer-term viability statement Assessing the prospects of the Company The corporate planning process is underpinned by scenarios that encompass a wide spectrum of potential outcomes. These scenarios are designed to explore the resilience of the Company to the potential impact of significant risks set out below. The scenarios are designed to be severe but plausible and take full account of the availability and likely effectiveness of the mitigating actions that could be taken to avoid or reduce the impact or occurrence of the underlying risks and which would realistically be open to management in the circumstances. In considering the likely effectiveness of such actions, the conclusions of the Board s regular monitoring and review of risk and internal control systems, as discussed on page 57, is taken into account. The Board reviewed the impact of stress testing the quantifiable risks to the Company s cash flows in the previous pages as detailed in risk factors 1-10 and concluded that the Company, assuming current leverage levels, would be able to continue to produce distributable income in the event of the following scenarios: Strategic Report Risk Factor 2. Plant performance degradation of 0.8% per annum versus 0.4% per annum 2. Plant availability reduced to 95% 6. P90 irradiation 7. Power price set to zero The Directors consider that this stress testing based assessment of the Company s prospects is reasonable in the circumstances of the inherent uncertainty involved. In accordance with the Articles of Incorporation, every five years the Board is required to propose an ordinary resolution that the Company should cease to continue as presently constituted. The first such discontinuation vote is scheduled to be held at the 2018 AGM. However, for the purposes of the longer term viability statement it is assumed that no discontinuation resolution is passed. The period over which we confirm longer term viability Within the context of the corporate planning framework discussed above, the Board has assessed the prospects of the Company over a three year period ending 30 June Whilst the Board has no reason to believe the Company will not be viable over a longer period, given the inherent uncertainty involved, the period over which the Board considers it possible to form a reasonable expectation as to the Company s longer term viability, based on the stress testing scenario planning discussed above, is the three year period to June This period is used for our mid-term business plans and has been selected because it presents the Board and therefore readers of the annual report with a reasonable degree of confidence whilst still providing an appropriate longer term outlook. Confirmation of longer term viability The Board confirms that its assessment of the principal risks facing the Company was robust. Based upon the robust assessment of the principal risks facing the Company and its stress testing based assessment of the Company s prospects, the Board confirms that it has a reasonable expectation that the Company will be able to continue in operation and meet its liabilities as they fall due over the period to June
29 Strategic Report (continued) 7. Principal Risks and Uncertainties (continued) Longer term viability statement (continued) These inherent risks associated with investments in the solar energy sector could result in a material adverse effect on the Company s performance and value of Ordinary Shares. The Company s risks are mitigated and managed by the Board through continual review, policy setting and half-yearly review of the Company s risk matrix by the Audit Committee to ensure that procedures are in place with the intention of minimising the impact of the above mentioned risks. The Board carried out its last formal review of the risk matrix at the Audit Committee meeting held on 15 May The Board relies on periodic reports provided by the Investment Adviser and Administrator regarding risks that the Company faces. When required, experts will be employed to gather information, including tax advisers, legal advisers, and environmental advisers. Paul Le Page Laurence McNairn Director Director 15 September September
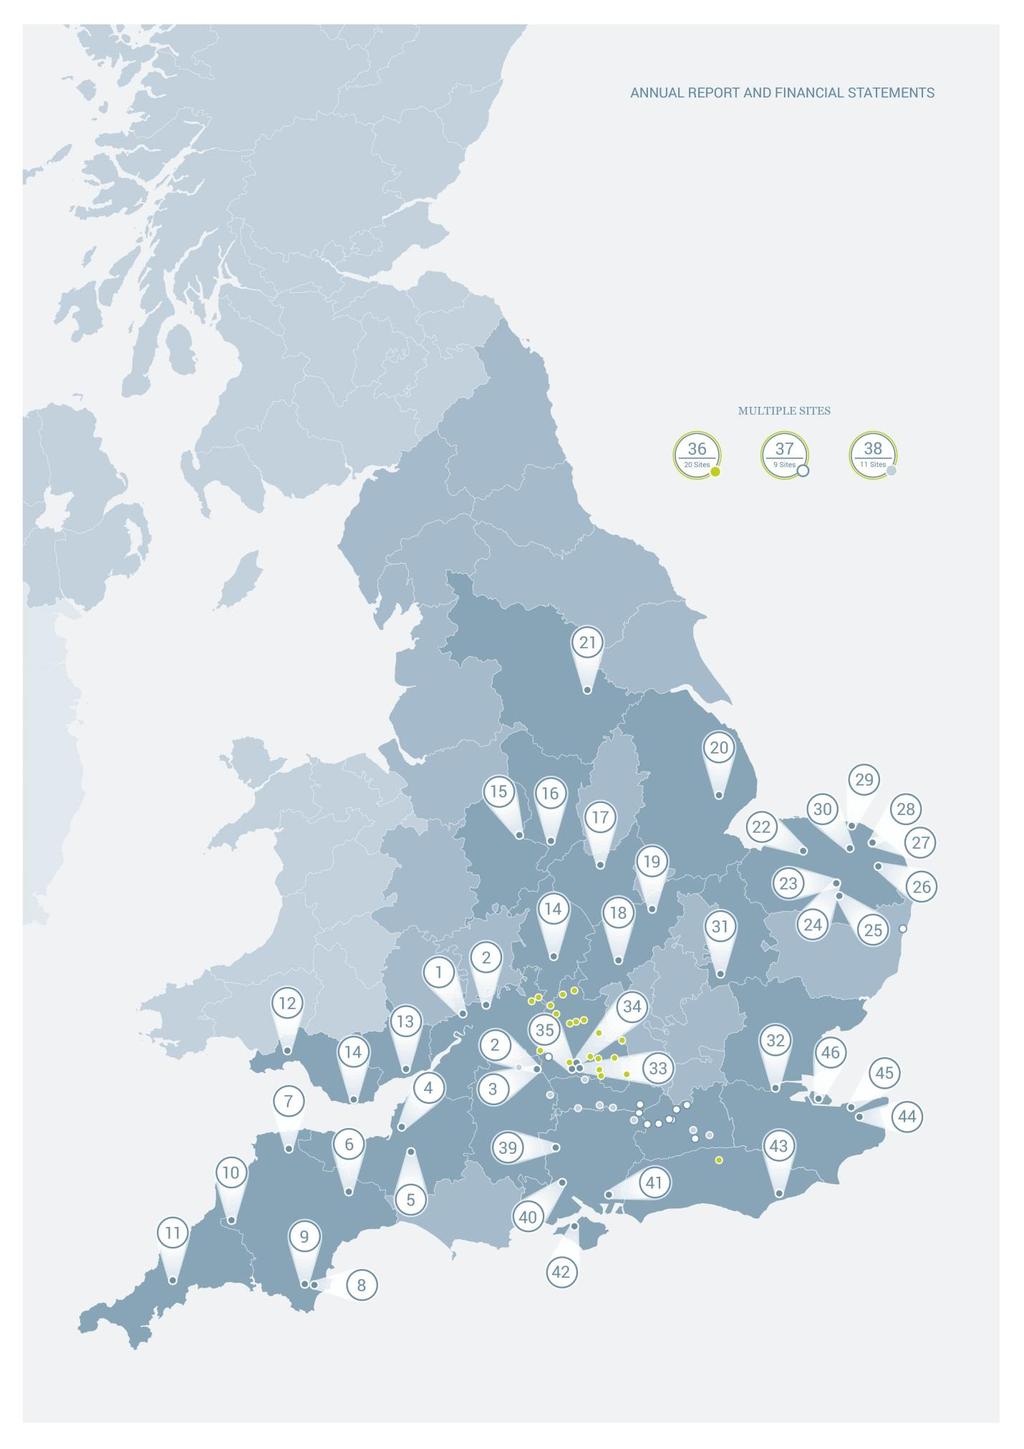
30 Report of the Investment Adviser 1. About Bluefield Partners LLP Bluefield was established in 2009 and is an investment adviser to companies and funds investing in solar energy infrastructure. Our team has a proven record in the selection, acquisition and supervision of large scale energy and infrastructure assets in the UK and Europe. The team has been involved in over 1 billion of solar PV funds and/or transactions since Bluefield was appointed Investment Adviser to the Company in June Based in its London office, Bluefield s partners are supported by a dedicated and highly experienced team of investment, legal and portfolio executives. As Investment Adviser, Bluefield takes responsibility, fully inclusive within its advisory fees, for selection, origination and execution of investment opportunities for the Company, having delivered 45 SPV investments to BSIF since flotation. Due to the strong expertise of the Investment Adviser, no additional transaction arrangement or origination service providers are employed by the Company and no investment transaction arrangement fees have been paid either to the Investment Adviser or any third parties. Bluefield s Investment Committee has collective experience of over 15 billion of energy and infrastructure transactions. 2. Portfolio: Acquisitions, Performance and Value-Enhancement Portfolio As at 30 June 2017, the Company held an operational portfolio of 82 PV plants (consisting of 41 large scale sites, 40 micro sites and 1 roof top site) with a total capacity of MWp with the portfolio displaying strong diversity through: geographical variety (as shown by the map on page 11), a range of proven PV technologies and infrastructure (arising from the solar PV farms having been constructed by a number of experienced solar contractors), and a blend of asset sizes with capacities ranging from microsites to substantial, utility-scale solar farms (including two plants at c.50mwp). Acquisitions During the 12-month period to 30 June 2017, the Company completed 44.4 million of acquisitions, with a combined capacity of 40.3MWp. This reflects a significant drop in activity from previous years following the closure of the ROC support to new primary assets and reflects the Company and Investment Adviser s discipline in investing only in projects which are accretive to the Company s returns. The acquisitions, all of which were made utilising the proceeds from the 60.6 million equity-raise in October 2016 (in addition to its partial utilisation to re-finance acquisitions previously funded using the revolving credit facility), included seven 1.2 ROC construction assets (all operational since March 2017), and three operational assets: a 5.0MWp 1.2 ROC facility at Kellingley in North Yorkshire (acquired on 30 June 2017); a 2.1MWp 2 ROC facility in East Devon; and a 0.5 MWp rooftop facility in Northamptonshire, constructed in 2011 and accredited under the 2011/12 FiT scheme. Both Langlands and the rooftop facility were partly owned by members of the Investment Adviser and are related party transactions in respect of BSIFIL, as disclosed in Note 16. In keeping with the Investment Adviser s objective to deliver value and return accretive acquisition opportunities to the Company, securing 7 primary assets during the last months of the RO scheme was a success for the Company as it enabled it to lock in the benefits of the 20 year RPI indexed support mechanism, a scheme which is now closed to further business. In parallel, the three secondary acquisitions, while small in volume, demonstrate that through incremental, selective acquisitions, the Investment Adviser is able to continue to secure new opportunities that add value to the Company. 30
31 Report of the Investment Adviser (continued) 2. Portfolio: Acquisitions, Performance and Value-Enhancement (continued) Acquisitions (continued) Looking forward, the Investment Adviser is currently negotiating on behalf of the Company across a range of large and small-scale transactions as it looks to continue its policy of securing high quality, return accretive acquisitions during the course of the 2017/18 financial year, though its strong pricing discipline means that its primary focus is now increasingly on the optimisation of performance of the excellent asset base already secured. Performance In the year to 3o June 2017, the operational portfolio as at 30 June 2016 of 401.2MWp has continued to display strong operational performance, achieving a Net Performance Ratio (the ratio at which a PV plant converts available irradiation to electrical output) of 83.4%, against a forecasted Net Performance Ratio of 81.3%, creating an asset management uplift of +2.6%. Table 1. Summary of BSIF Portfolio (401.2MWp) Performance for FY 2016/17: Actual Forecast Δ/WCM IRR kwh/m 2 1,182 1, % Performance Ratio (%) 83.4% 81.3% +2.6% Generation Yield (MWh/MWp) % Total unit Price Power + ROCs +LDs (GBP/MWh) % Total Revenue (GBP/MWp) 117.7k 114.0k +3.2% Notes to table Excluding grid outages and significant periods of constraint or curtailment that were outside of the Company s control. 2. The table excludes assets with a collective capacity of 40.3 MWp, which either were acquired or became operational during the Reporting Period and therefore do not yet offer 12 months of performance data. The solar farms excluded are shown in the second half of the full asset table on pages 33 and 34. As the table above summarises, marginally below average levels of irradiation, combined with operational outperformance, drove generation (measured as the energy yield per MWp of installed capacity) to +2.3% ahead of technical expectations and, with LDs earned in the period of 1.3m as well as a conservative estimate for CP 15 ROC recycle, the portfolio has generated an average of 117.7k/MWp, equivalent to +3.2% ahead of expectations. 31
32 MWh MWh Report of the Investment Adviser (continued) 2. Portfolio: Acquisitions, Performance and Value-Enhancement (continued) Performance (continued) Figure 1. Summary of BSIF Portfolio (401.2 MWp) generation for FY 2016/17 60,000 50,000 40,000 30,000 20,000 10, , , , , , , , ,000 50,000 0 Generation (Actual) Cumulative Generation (Actual) Generation (Budget) Cumulative Generation (Budget) As a result of effective liaison with the DNOs and negotiation by BSL, the Company s asset manager was able to reduce and mitigate the effect of potential grid outages in the financial year and as a result there were few material outages experienced across the portfolio. Particular success has been achieved in relation to Durrants Solar Farm, where curtailment to allow critical grid upgrade works to be undertaken on the Isle of Wight and Fawley was initially expected to result in 994.6MWh of lost generation but a coordinated approach by BSL, with other solar farm owners in the area, resulted in only 543MWh of lost generation a saving of 183k in revenue. In addition, 29 days of planned outage (22 May to 19 June 2017) for West Raynham were reduced to a total of 3.5 days and 16 days of planned outages (23 January to 7 February 2017) affecting Hill Farm were reduced to just 2 days, with generation and revenue savings of 6,645MWh and 658k and 204MWh and 22k respectively. During the financial year the Company exercised the strength of its contractual protections, enabling the recovery of 1.3m of LDs and insurance claims for periods of underperformance, revenue losses and the rectification of minor equipment defects. The fact that these LDs represent only 2.8% of the year s revenues is reflective of the strong performance of the majority of assets within the portfolio. There have been no incidents of material underperformance or outage during the financial year. A significant portion of the portfolio companies remains protected by performance warranties provided by the EPC contractors (in addition to equipment manufacturers warranties), backed by retentions or warranty bank bonds, applicable from each asset s provisional acceptance date. These warranties provide a contractual entitlement to the recovery of damages as a result of operational underperformance against a contracted level of performance, or as a result of defects. As assets pass their final acceptance dates, new performance guarantees are provided by contracted O&M service providers in addition to comprehensive insurance coverage. The geographical and equipment diversity of BSIF s portfolio allows the effects of both Outage Risk (whereby a higher proportion of large capacity assets would hold increased exposure to material losses due to curtailments and periods of outage) and Defect Risk (where over-reliance on limited equipment manufacturers could lead to large proportions of the portfolio suffering similar defects) to be mitigated. 32
33 Report of the Investment Adviser (continued) 2. Portfolio: Acquisitions, Performance and Value-Enhancement (continued) Performance (continued) The operational performance of the portfolio and the effective recovery of LDs once again highlight the success of the Company s dedicated portfolio function and effective working relationship with the Company s asset manager, BSL, who provide daily monitoring of the plants and regular contractor engagement. BSL have allocated approximately 5,600 hours analysing plant performance, 90 days assessing performance calculations at critical contractual milestones (performance acceptance testing and 1st / 2nd year performance tests) and spent in excess of 133 days at the solar farms inspecting the condition of the equipment and general maintenance of the sites during the reporting period. Value-Enhancement Initiatives Following the closure of the RO Scheme in March 2017, and the UK solar PV sector moving to a secondary market, the Investment Adviser has launched a number of new initiatives which seek to enhance and create additional value for the portfolio, through the optimisation of both operations and revenues. These initiatives, which are expected to begin to take effect during the 2017/18 financial year, include a wide-ranging asset-life extension programme, securing optionality for the addition of battery-storage facilities across the portfolio and actively discussing opportunities within the UK s burgeoning corporate and direct-wire PPA market, in order to provide predictable and reliable income streams for the Company over the long term. The Company s operating portfolio as at 30 June 2017 and the electricity generated in the 2016/17 financial year is shown below: Table 2. BSIF Portfolio Generation for FY 2016/17 by Asset: Solar Farm Asset Total Investment Commitment (GBP) 33 MWp Generation FY16/17 (Actual, MW/h) Southwick ,308.1 West Raynham ,701.9 Elms ,703.6 Molehill ,070.4 Hardingham ,479.3 Littlebourne ,910.4 Pentylands ,591.5 Goose Willow ,935.9 Hoback ,211.0 Hill Farm ,625.5 Pashley ,659.8 Burnaston ,629.1 Roves ,195.6 Hall Farm ,879.0 Sheppey/South Lees ,417.7 Betingau ,003.1 North Beer ,601.7
34 Report of the Investment Adviser (continued) 2. Portfolio: Acquisitions, Performance and Value-Enhancement (continued) Value-Enhancement Initiatives (continued) Solar Farm Asset Total Investment Commitment (GBP) MWp Generation FY16/17 (Actual, MW/h) Capelands ,119.5 Ashlawn ,620.8 Saxley ,901.5 Durrants ,668.0 Redlands ,424.5 Romsey ,178.8 Trethosa ,354.5 Salhouse ,896.8 Frogs Loke ,894.2 The Grange ,815.2 Bunns Hill ,910.8 Folly Lane ,658.4 Oulton ,849.0 Rookery ,802.7 Tollgate Farm ,042.1 Butteriss (20 micro sites) Goshawk ,034.2 Promothames (9 micro sites) SUB-TOTAL ,126.7 Assets becoming Operational / Acquired during the Reporting Period Old Stone ,499.3 Place Barton ,669.0 Court Farm ,817.8 Kellingley ,800.8 Kislingbury ,697.5 Willows ,738.8 Gypsum ,757.6 Barvills ,240.6 Langlands ,019.7 Corby SUB-TOTAL ,456.6 GRAND TOTAL ,
 Value-Enhancement Initiatives (continued) PPA Strategy Over the year the Company maintained its strategy to fix the price of")
35 Report of the Investment Adviser (continued) 2. Portfolio: Acquisitions, Performance and Value-Enhancement (continued) Value-Enhancement Initiatives (continued) PPA Strategy Over the year the Company maintained its strategy to fix the price of power sale contracts for individual assets, not covered by long term contracts, for periods between 12 and 36 months. The majority of contracts are being struck for a minimum of 18 months which is the average required duration under the Aviva Facility. For the c.75% of plant capacity that is not tied to long term contracts, the Company has also continued to implement the approach of fixing power prices evenly throughout the year, in order to mitigate the Company s exposure to seasonal fluctuations and short term events which have the potential to increase volatility in the price of electricity in the UK. The fixing period seeks to maximise potential revenues for the Company, whilst spreading exposure to short term seasonal power movements across the portfolio. Prices can be fixed up to 3 months in advance of the commencement of the fixing period and PPA counterparties are selected on a competitive basis but with a clear focus on achieving diversification of counterparty risk. The combination of the PPA renewal strategy applied during the period, and c.95 MWp of plants (c.25% of the portfolio) benefitting from 15 year PPAs with attractive fixed power prices until Q4 2018, means the Company is materially insulated from power price fluctuations both up and down over the next 12 months. Meanwhile the fact that 75% of the portfolio is contracted only on short term (12-36 month PPAs) has meant that the Company has been able to benefit from some of the rising power price trend in recent months. % of BSIF revenues fixed as at 30 June 2017* The graph above shows that the Company has a price confidence level of c.97% to December 2017 and c.78% to June 2018 over its power revenue streams. 35
36 Report of the Investment Adviser (continued) 2. Portfolio: Acquisitions, Performance and Value-Enhancement (continued) Value-Enhancement Initiatives (continued) PPA Strategy (continued) The Investment Adviser s strategy to secure leverage at the portfolio rather than asset level has enabled the Company to retain flexibility in implementing its short term PPA strategy following the closing of the Company s long term borrowing facility in September This means the Company now has the flexibility to explore value enhancing options such as negotiating corporate PPA offtake, flexibility which would not be available if it had been required by lenders to enter 15 year offtake contracts. The Company also remains able to maximise potential economies of scale by taking advantage of opportunities only available to owners who can commit significant volumes of generating capacity. Retaining this flexibility means that the Company has the opportunity to regularly tender out a large portion of its power to ensure it always achieves the most competitive pricing and avoids the greater discounts applied by offtakers when they are entering long term contracts. For example, a tender of 4 x 5MWp is preferred over 4 separate tenders of 5MWp in order to maximise value. Revenues and Power Price The portfolio s revenue streams in the financial year show that the sale of electricity accounts for 39% of the Company s income. Regulated revenues from the sale of FiTs, and ROCs account for 61%. Wholesale power markets have shown improvement from the lows experienced in Q1 2016, driven by concerns over supply in the UK electricity market, tight reserve capacity and the depreciation of Sterling post the Brexit referendum. The power price movement has been reflected in PPA fixes completed by the Company during the period. The month fixed contracts replaced in the period have seen a decrease to the average seasonal weighted power price achieved (from per MWh to per MWh) to 30 June 2017 compared to the year ended 30 June The resulting blended contracted price was in line with the day ahead market base load power prices over the equivalent period. In June 2016, the Board appointed Cornwall Energy, a leading independent market intelligence adviser, to review existing PPA contracts and power sale strategies to provide feedback and insight. The findings of the review were positive in respect of both ROC capture rates and prices achieved for the sale of power. The impact of power prices on NAV is set out below in the valuations section. 36
37 Report of the Investment Adviser (continued) 3. Analysis of underlying earnings The total generation and revenue earned in FY16/17 by the Company s portfolio, split by subsidy regime, is outlined below. Subsidy Regime Generation (MWh) PPA Revenue ( m) Regulated Revenue ( m) FiT 14, ROC 7, ROC 89, ROC 241, ROC 43, ROC 13, Total 409, The Company includes ROC recycle assumptions within its long term forecasts and applies a market based approach on recognition, including prudent estimates within its accounts where there is clear evidence participants are attaching value to ROC recycle for the current accounting period. In October 2017, Ofgem will announce the final value for ROC recycle for the period April March 2017, with settlement expected to occur in November As there is no means of assessing whether there is any ROC recycle value for the period April - June 2017 the Company has not recognised any income for ROC generated in this period. 37
38 Report of the Investment Adviser (continued) 3. Analysis of underlying earnings (continued) The following table demonstrates that in the past financial year the portfolio generated underlying earnings, after debt service costs relating to principal and interest repayments, of 7.32 pps, 0.14 pps ahead of the Company s dividend target of 7.18 pps, and enables the Company, for the third year running, to pay out dividends ahead of target, at 7.25 pps for 2016/17, while also increasing its retained earnings from 0.8m to 1.1m equivalent to 0.30 pps. Underlying Portfolio Earnings Full year to 30 Jun 17 ( m) Full year to 30 Jun 16 ( m) Full year to 30 Jun 15 ( m) Portfolio Revenue Liquidated damages Portfolio Income Portfolio Costs Project Finance Interest Costs Total Portfolio Income Earned Group # Operating Costs* BSIFIL Interest Costs Underlying Earnings Total Debt Repayments Total Underlying Earnings Bought forward reserves Total Underlying Earnings available for distribution Actual Distribution** Underlying Earnings carried forward (1-2) #Includes the Company and BSIFIL *Excludes one off transaction costs and the release of up-front fees related to the Company s debt facilities **Actual distribution is based on funds required for total dividend for each financial period. This has been above the target dividend in each full financial year since IPO 38
39 Report of the Investment Adviser (continued) 3. Analysis of underlying earnings (continued) The table below presents the underlying earnings on a per share. Target Distribution (RPI dividend) Total funds available for distribution (inc reserves) Average Number of shares in year* Total funds available for distribution (pps) - 1 Full year to 30 Jun 17 ( m) Full year to 30 Jun 16 ( m) Full year to 30 Jun 15 ( m) ,735, ,282, ,583, Total Dividend Declared & Paid (pps) - 2 Reserves carried forward (pps) ** *Average number of shares is calculated based on shares in issue at the time each dividend was declared. ** Reserves carried forward are based on the shares in issue at the corresponding year end. 4. NAV and Valuation of the Portfolio The Investment Adviser is responsible for advising the Board in determining the Directors Valuation and, when required, carrying out the fair market valuation of the Company s investments. Valuations are carried out on a six monthly basis as at 31 December and 30 June each year and the Company has committed to procure a review of valuations by an independent expert not less than once every three years, most recently by EY for the year ended 30 June As the portfolio comprises only non-market traded investments, the Investment Adviser has adopted valuation guidelines based upon the IPEV Valuation Guidelines as adopted by Invest Europe (formerly known as the European Venture Capital Association), application of which is considered consistent with the requirements of compliance with IAS 39 and IFRS 13. Following consultation with the Investment Adviser, the Directors Valuation adopted for the portfolio as at 30 June 2017 was 573.4m, compared to million as at 30 June 2016 and million as at 30 June A breakdown of the key components of the Directors Valuations over the last three consecutive financial years, is shown below: Valuation Component ( m) Jun 17 Jun 16 Jun 15 Portfolio DCF value Projects valued at cost (amount invested) Project Net Current Assets Directors Valuation These items are outlined below in the portfolio valuation movement section. 39
40 Report of the Investment Adviser (continued) 4. NAV and Valuation of the Portfolio (continued) Changes to Directors Valuation methodology During the financial year there have been a number of key developments which have impacted the Investment Adviser s recommendation to the Directors Valuation: (i) (ii) (iii) (iv) (v) During the financial year a number of large scale operational portfolios have been sold, notably 365MWp sold by TerraForm Power to EFG Hermes, 78MWp and 80MWp by Primrose to Greencoat and Equitix, respectively, and 105MWp by Wirsol to Rockfire Capital. A number of these acquirers are new entrants to the UK market and represent the availability of an increasingly low cost of capital, largely from pension fund investors; In the period, the Company, through BSIFIL, has closed long term (18.25 years tenor from September 2016) fully amortising (over 18 years) debt for the portfolio with Aviva Investors at a fixed rate of 2.875% on the 121.5m fixed rate component and 0.7% plus RPI on the 65.5m RPI indexed element; Following the Brexit referendum, Sterling depreciation, among other factors, has resulted in an increase in inflationary pressures in the UK and expectation of higher inflationary pressures in the future; A number of projects have been through FAC testing (generally conducted following 2-3 years of operational life). As these plants have now passed out of the EPC warranty period and are not subject to outstanding contractual testing obligations under the EPC contract, it is appropriate that they are now valued based on proven operational PR rather than warranted PR; and Notwithstanding some upward movements in energy price forecasts during the year, following UK electricity market capacity constraints, combined with higher costs of imported energy resulting from Sterling devaluation, power price forecasts as at year end remained low and so showed negligible change from the previous financial year. To avoid sensitivity to a single forecast in a volatile market, the Investment Adviser collects data from two leading forecasters. Each of these factors has been considered when determining the Directors Valuation. Discounting Methodology and Discount Rate The Directors Valuation is based upon the discounting of the net, unlevered, project cash flows of each investment held by the Company, through BSIFIL, irrespective of whether the investment has project leverage or not. The discount rate applied on the project cash flows is therefore the WACC. This approach of discounting the unlevered cash flows with a WACC has been applied, and is consistent with the approach taken in every previous Directors Valuation, and is intended to avoid asset valuations being distorted by different debt sizing or amortisation profiles. Having discounted the unlevered project cash flows, to establish a willing buyer willing seller enterprise valuation or EV, the project level debt (if any) is deducted to establish the equity value. It is notable that of the 45 SPVs held by the Company, only one (Project Durrants) has asset level debt (being 13.2 million at the financial period end). In December 2016, the Board noted that whilst there was clear evidence regarding the trend toward falling cost of capital for UK solar assets, most significantly the 365MWp TerraForm Power UK solar portfolio sale for a value of 1.29m/MWp for a largely 1.4ROC portfolio, it wanted to establish longer term trends before adopting further changes to the Company s discount rate. 40
41 Report of the Investment Adviser (continued) 4. NAV and Valuation of the Portfolio (continued) Discounting Methodology and Discount Rate (continued) Since December 2016, as noted above in point (i) within the Changes to Directors Valuation methodology section, there has been a continued trend of large scale portfolios transacting at prices equivalent to or higher than, on a /MWp basis, that of the 365 MWp TerraForm portfolio. In the Board s opinion, this activity clearly demonstrates the establishment of a consistent theme in pricing and it believes it appropriate under the willing buyer-willing seller methodology, that the valuation of the Company s portfolio be prudently benchmarked on /MWp basis against these comparable portfolio transactions. By valuing the portfolio at an EV of 558.6m (being the DCF valuation of 545.4m combined with the outstanding debt in project Durrants of 13.2m) and an effective price of 1.28m/MWp, the Board has conservatively achieved this aim. On this basis, the WACC discount rate of 6.60% (applied in December 2016, June 2016 and December 2015) has been lowered by 0.45% to 6.15%. For completeness, this discount rate incorporates tax shield from leverage held within BSIFIL based upon the actual amortisation profile and interest rates applicable to the contracted debt facilities. The equity discount rate implied by the Directors Valuation is 7.43% (up from 7.31% in June 2016), a reflection of synthetic leverage being replaced with actual leverage. This is derived from leverage of 33%, based on the Company s GAV as at 30 June 2017 of 600.0m*, and implies that the future cash flows of the Company, based upon the conservative assumption of a zero terminal value after 25 years, are expected to deliver a 7.4% gross annualised return on today s NAV. This attractive return level is indicative of the strong return characteristics of the solar sector and highlights the strong expected equity cash flow performance of the Company through its high performing portfolio and attractively priced long term debt (as set out in the section on Debt Financing below). The DCF has been applied on an asset portfolio with an average assumed operational life of 25 years from commissioning. The Board has elected not to adopt longer assumed life even for assets with extended lease or planning permission at this early stage in the life of the portfolio. Following an increase in inflationary expectations in the UK, the Board elected to adopt an increase to forecast RPI from 2.5% to 2.75% in the Company s 31 December 2016 Interim Financial Statements and has maintained this assumption as at 30 June This keeps the Company s valuation methodology in line with the peer group and it has been applied consistently across both revenues, costs and, as appropriate, debt facilities. * Gross Asset Value is the aggregation to the portfolio s DCF value, project Durrant s outstanding debt and the working capital balances from the portfolio and BSIFIL. 41
42 Report of the Investment Adviser (continued) 4. NAV and Valuation of the Portfolio (continued) Power Price In the period to 30 June 2016, the Directors Valuation was based on the forecast power curve from one leading independent power price forecaster. This approach was considered to be the purist way to apply future power prices within its valuations to prevent valuation movement distortion (positive or negative) that could arise if a blended or adjusted approach to forecast curves was applied. During the period since IPO significant movements have occurred in power prices and a divergences have emerged between the views taken by different forecasters leading to increased levels of volatility in their forecast power prices over time. The timing of the publication of forecasts has also diverged in the past year, which increases both the timing risk and sampling risk associated with using a single forecasting source. Forecaster June 2017 December 2016 Portfolio DCF Value ( m) Portfolio DCF Value ( m) Leading independent power forecaster 1* Equal blend of leading independent power forecasts Leading independent power forecaster * Forecaster used in all previous BSIF valuations As highlighted by the table, the selection of power forecaster can have a significant impact on valuation. The Company s 2014/15 and 2015/16 valuation approach, by utilising the power forecaster which is currently applying a more conservative power curve over the period of the discounted cash flow, built in significant conservatism versus peers utilising an alternative forecaster or blended forecasts. In order to avoid sensitivity to the timing or opinion provided by a single forecaster, and as a direct result of these market developments, the Board elected in the Company s 31 December 2016 Interim Financial Statements to adjust its assumptions of future power prices by adopting an equal blend of the forecasts of the two leading independent forecasters. Applying this approach is intended to smooth sensitivity of valuation to forecast timing (the Company s original forecaster released its latest forecast in April 2017 with updates coming only after the period end, while the second forecaster produced its latest forecast in June 2017). Similarly, by taking a blended approach it is intended that the Company will reduce divergence in valuation approach due to different opinions of the forecasters. The blended forecast used within the latest Directors Valuation is based on forecasts released in April 2017 (forecaster 1) and in June 2017 (forecaster 2) and implies an annualised growth in real power prices over the 25 year forecast of 1.4% The DCF for each project applies the contractually fixed power price applicable to each solar PV asset until the end of the fixed period and, thereafter, the blended independent forecast price. As in previous valuation cycles the short term pricing within the energy price forecast used was compared by the Investment Adviser to PPA prices achievable in the market for its solar assets and considered to reflect the market without discount or premium. 42
43 Report of the Investment Adviser (continued) 4. NAV and Valuation of the Portfolio (continued) Impact of Long Term Debt During the financial period, BSIFIL took on 187m of long term debt from Aviva Investors. This debt has been contractually fixed for a tenor of years (from September 2016), fully amortising over 18 years. As such, the Directors Valuation now incorporates the benefit of tax shielding from the Company s long term debt profile (at a fixed rate of 2.875% on 121.5m and 0.7% over RPI 65.5m). Consistent with previous periods, the valuation assumes tax shield only from external 3 rd parties. No tax shielding is assumed from intercompany loans within the group. The average interest tax shield from this long term debt equates to 7.2% over the life, being 15.0% in 2018 and falling thereafter with amortisation of the debt. As such, the extent of shielding is significantly below the maximum permissible level indicated under the BEPS (base erosion profit shifting) consultation and leaves potential room for additional tax shielding from interest on internal or external debt held by the Company. Plant Performance During the year, four plants were completed and passed FAC testing. This process triggered the end of performance related EPC warranties and, in the context of the valuation approach, marks the first point at which long term performance can be adopted within the future cash flows of the project. In line with the strong operational performance of the portfolio, as outlined within the portfolio section of the Investment Adviser s report, the Board is pleased to confirm that the average operational PR, applied for plants that have passed FAC, is 84.9%. This represents an uplift of 1.5% over warranted levels previously assumed within the Directors Valuation as well as the possibility of future valuation uplifts as more plants move through the FAC process and switch to operational PRs. Consistent with the valuation approach taken in previous periods, the Directors Valuation does not amend long term plant performance forecasts based upon short term performance while the plants remain within the warranty period and subject to outstanding contractual testing obligations. Other Cash flow Assumptions No material changes have been made regarding regulatory revenue or cost assumptions. During the period business rates have been amended and updated business rates have been applied for the forecast period. This update to business rates has resulted in a 2.8m increase to the Directors Valuation and is included with Balance of Portfolio return in the valuation movement graph on page 44. NAV movement The Company issued shares to the value of 60.6 million (gross) in the period and paid total dividends of 23.0 million, being 3.0 pps in total for the third and fourth interim dividends in respect of the year ended 30 June 2016 (when combined with the earlier interim dividends, these provided a total dividend in the 2015/16 financial year of 7.25 pps), 3.25 pps in November 2016 and 1.0 pps in May 2017 as first and second interim dividends, respectively, in relation to the current financial period. Adjusting the 30 June 2016 NAV of million for the net contribution of shares raised in the period ( 59.8 million) less the dividends paid in the period ( 23.0 million), the uplift in the NAV of the Company during the year was 64.0 million, or 20.8%. 43
44 Report of the Investment Adviser (continued) 4. NAV and Valuation of the Portfolio (continued) NAV movement (continued) A breakdown in the movement of the NAV ( million) of the Company over the period and how this interacts with the movement in the valuation of the portfolio is illustrated in the charts below. 44
45 Report of the Investment Adviser (continued) 4. NAV and Valuation of the Portfolio (continued) NAV movement (continued) Directors Valuation movement ( million) 30 June 2016 Valuation As % of re-based valuation Additions in the period # 47.6 Re-based Valuation Cash receipts from portfolio % Power Price Movement % Increase in inflation (2.5% to 2.75%) % Operational PR uplift % WACC reduction (6.60% to 6.15%) % Balance of portfolio return % 30 June 2017 Valuation % #Additions in the period reflect new acquisitions of 44.4m, deferred share consideration for West Raynham of 2.4m and net current assets of 0.8m from intermediate holding companies directly owned by BSIFIL. Each movement between the re-based valuation and the 30 June 2016 valuation is considered in turn below: Cash receipts from the Portfolio This movement reflects the cash payments made from the underlying project companies up to BSIFIL and the Company to enable the companies to settle operating costs and distribution commitments as they fall due within the period. Power Price Movement The Company s two independent forecasters released updated forecasts in April and June 2017 and these have been applied to the Directors Valuation. The impact of adopting an equal blend of two independent forecasters as well as the latest long term power price estimates, against power price expectations applied in the 30 June 2016 valuation, is an uplift of 3.4 million. The discounted cash flow for each project applies the contractually fixed power price applicable to each solar PV asset until the end of the fixed period, and thereafter the equal blend of two independent forecasters prices. 45
46 Report of the Investment Adviser (continued) 4. NAV and Valuation of the Portfolio (continued) NAV movement (continued) Directors Valuation movement (continued) Increase in RPI inflation Over the period long term RPI inflation expectations have risen and as a result the Directors have felt it appropriate to amend the base case assumption to 2.75%, up from 2.5%. The impact of the shift from the 30 June 2016 inflation assumption of 2.5% to 2.75% for 30 June 2017 is an uplift to the portfolio valuation of 10.4 million. Operational PR uplift The increase in value of 7.2m from PR changes during the period is a combination of two factors. The first relates to an uplift of 5.3m, driven by a positive change in the PR assumption for West Raynham as it moved from being valued on a constrained to an unconstrained basis. In keeping with disclosures in prior accounting periods, confirmation that the plant will not be grid-constrained over its life triggers a deferred share payment of c. 2.4m, to Trina, the EPC contractor who sold BSIFIL the project, and so a corresponding liability has now been recognised by BSIFIL. The second factor contributing an uplift in value during the period relates to four projects now being valued using operational PRs rather than warranted PRs. This change has only been enacted for plants that have successfully passed FAC testing as this represents the point in a project s lifecycle where it has, at a minimum, two years of stable operating history supporting the release of the EPC contractor from its performance guarantees. Discount rate reduction The reduction in the discount rate, from 6.60% to 6.15%, has resulted in an uplift to the valuation of 20.2m. As outlined in the section above, the reduction in the rate is a function of the Board ensuring that the valuation of the portfolio remains commensurate, albeit conservatively, with the pricing of comparable transactions within the UK solar market over the financial year and, specifically, within the six months to 30 June Balance of Portfolio Return The balance of portfolio return is comprised of the contribution from the unwinding of the discount rate, minor changes to the long term level of asset management costs as well as the inclusion of the latest estimates for business rates. Other Assumptions Consistent with previous Directors Valuations, the valuation assumes a terminal value of zero for all projects within the portfolio 25 years after their commencement of operation. There have been no material changes to assumptions regarding the future performance or cost optimisation of the portfolio when compared to the Directors Valuation of 30 June On the basis of these key assumptions the Board believes there remains further potential for NAV enhancement based upon long term proof of plant performance and through the potential for future extension of asset life. The assumptions set out in this section will remain subject to review by the Investment Adviser and the Board and may give rise to a revision of valuation approach in future reports. 46
 NAV movement (continued) Directors Valuation movement (continued) Reconciliation of Directors Valuation to Balance sheet Balance at Period / Year End")
47 Report of the Investment Adviser (continued) 4. NAV and Valuation of the Portfolio (continued) NAV movement (continued) Directors Valuation movement (continued) Reconciliation of Directors Valuation to Balance sheet Balance at Period / Year End Category 30 June 2017 ( m) 30 June 2016 ( m) 30 June 2015 ( m) Directors Valuation BSIFIL Working Capital BSIFIL 3 rd Party Debt (186.0) (180.4) (18.9) Financial Assets at Fair Value per Balance sheet * *Figure presented for June 2015 is for illustration only as the Company had not adopted the IFRS 10 amendments at this point Following the adoption of IFRS 10 and the Company s move to presenting its results on a nonconsolidated basis, rather than consolidating its immediate subsidiary BSIFIL, the above table serves to aid the reader in reconciling the Directors Valuation, for the current and re-stated period, to the relevant line on the current and restated Statement of Financial Position. Directors Valuation sensitivities Valuation sensitivities are set out in tabular form in Note 8 of the financial statements. The following diagram reviews the sensitivity of the closing valuation to the key assumptions underlying the discounted cash flow valuation. Furthermore, the chart below, which is based on the NAV as at 30 June 2017 of 408.6m, sets out the expected 25 year return (with a zero terminal value) of the Company s equity cash flows and indicates the robust nature of returns from solar cash flows, which results from the high proportion of regulated, RPI indexed, revenues. 47
Annual Report and Consolidated Financial Statements
 Bluefield Solar Income Fund Limited Annual Report and Consolidated Financial Statements FOR THE PERIOD FROM INCORPORATION ON 29 MAY 2013-30 JUNE 2014 Company Registration Number: 56708 Table of Contents
Solar Income Fund Limited
 Solar Income Fund Limited Solar Income Fund Limited For the year ended 30 june 2017 for the year ended 30 June 2017 Company Registration Number: 56708 2017. All rights reserved General Information 3 HIGHlights
Interim Report and Unaudited Condensed Interim Financial Statements
 Bluefield Solar Income Fund Limited Interim Report and Unaudited Condensed Interim Financial Statements FOR THE SIX MONTHS ENDED 31 DECEMBER 2017 Company Registration Number: 56708 Table of Contents General
THE RENEWABLES INFRASTRUCTURE GROUP LIMITED
 THIS DOCUMENT IS IMPORTANT AND REQUIRES YOUR IMMEDIATE ATTENTION. If you are in any doubt about the contents of this document or the action you should take you should consult your stockbroker, bank manager,
Honeycomb Investment Trust plc
 Registered Number: 09899024 Honeycomb Investment Trust plc Interim Report and Unaudited Financial Statements For the period from 1 January 2017 to 30 June 2017 Table of Contents 1 Strategic Report... 3
LONDON BOROUGH OF HARINGEY PENSION FUND INVESTMENT STRATEGY STATEMENT. 1. Introduction
 LONDON BOROUGH OF HARINGEY PENSION FUND INVESTMENT STRATEGY STATEMENT 1. Introduction Haringey Council is the Administering Authority for the Local Government Pension Scheme in the London Borough of Haringey
Circular to Shareholders. and. Notice of Extraordinary General Meeting
 THIS DOCUMENT IS IMPORTANT AND REQUIRES YOUR IMMEDIATE ATTENTION. If you are in any doubt about the contents of this document or the action you should take, you should consult your stockbroker, bank manager,
UK Commercial Property REIT Limited
 This document is issued by Standard Life Investments (Corporate Funds) Limited (as alternative investment fund manager of UK Commercial Property REIT Limited (the "Company" formerly known as UK Commercial
LENDINVEST SECURED INCOME PLC. Interim unaudited report for the 6 month period ended 30 September Company registration number:
 Interim unaudited report for the 6 month period ended 30 September 2017 Company registration number: 10408072 Contents Officers and professional advisors 3 Directors report 4 Responsibility statement of
General Accident plc. Registered in Scotland No. SC Annual Report and Financial Statements 2013
 Registered in Scotland No. SC119505 Contents Directors and Officers... 3 Strategic Report... 4 Directors Report... 6 Independent Auditors Report... 9 Accounting Policies... 11 Income Statement... 14 Statement
Half year report. For the six months ended 30 June 2017
 Half year report 2017 For the six months ended 30 June 2017 1 Alpha Pyrenees Trust Limited : Half year report 2017 Contents 1 About the Trust 2 Chairman s statement 3 Property review 5 Independent review
West Midlands Pension Fund. Statement of Investment Principles 2016
 West Midlands Pension Fund Statement of Investment Principles 2016 September 2016 Statement of Investment Principles 2016 1) Introduction This is the Statement of Investment Principles (the Statement )
UK Solar Investment. 8% return per annum. Defined exit strategy at the end of year 3 with option to extend. Pension Compatible.
 UK Solar Investment 8% return per annum. Defined exit strategy at the end of year 3 with option to extend. Pension Compatible. Sovereign backed income. All investments presently generating projected real
International Capital Flows
 International Capital Flows International investment into the UK & Europe: the role of Guernsey s investment funds sector January 2015 KPMG Channel Islands Limited Glategny Court Glategny Esplanade St
Information for investors
 Information for investors Martin Currie Asia Unconstrained Trust plc changed its name on 31 July 2015 having previously been known as Martin Currie Pacific Trust. This followed a vote by shareholders at
General Accident plc. Registered in Scotland No. SC Annual Report and Financial Statements 2014
 Registered in Scotland No. SC119505 Contents Directors and Officers... 3 Strategic Report... 4 Directors Report... 6 Independent Auditors Report... 9 Accounting Policies... 11 Income Statement... 15 Statement
Blue Diamond Limited INTERIM CONDENSED CONSOLIDATED FINANCIAL STATEMENTS FOR THE SIX MONTHS ENDED. 30 June 2018
 Blue Diamond Limited INTERIM CONDENSED CONSOLIDATED FINANCIAL STATEMENTS FOR THE SIX MONTHS ENDED BLUE DIAMOND LIMITED INTERIM CONDENSED CONSOLIDATED FINANCIAL STATEMENTS 30 JUNE COMPANY INFORMATION BLUE
Investment Strategy Statement: September 2018
 Investment Strategy Statement: September 2018 Introduction and background This is the Investment Strategy Statement ( ISS ) of the London Borough of Lewisham Pension Fund ( the Fund ), which is administered
About Non-Standard Finance Non-Standard Finance plc has been established to acquire companies or businesses in the UK s non-standard consumer finance
 Interim Results for the period ended About Non-Standard Finance Non-Standard Finance plc has been established to acquire companies or businesses in the UK s non-standard consumer finance sector. The Company
REAL ESTATE CREDIT INVESTMENTS LIMITED CONDENSED INTERIM FINANCIAL REPORT FOR THE SIX MONTHS ENDED 30 SEPTEMBER 2017 (UNAUDITED)
") CONDENSED INTERIM FINANCIAL REPORT FOR THE SIX MONTHS ENDED 30 SEPTEMBER 2017 (UNAUDITED) Condensed Interim Financial Report For the six months ended 30 September 2017 Contents Page Overview Financial
CONDENSED INTERIM FINANCIAL REPORT FOR THE SIX MONTHS ENDED 30 SEPTEMBER 2017 (UNAUDITED) Condensed Interim Financial Report For the six months ended 30 September 2017 Contents Page Overview Financial
JPMorgan Global Convertibles Income Fund Limited
 NOT FOR RELEASE, PUBLICATION OR DISTRIBUTION, DIRECTLY OR INDIRECTLY, IN WHOLE OR IN PART OUTSIDE THE UNITED KINGDOM This document is issued by JPMorgan Funds Limited (the Manager or the AIFM ) solely
Interim Financial Report
 Interim Financial Report 2014 CHIEF EXECUTIVE INTRODUCTION I am pleased to introduce a strong set of Interim Results. During the first half of 2014, we increased our membership, mortgage lending and market
World Careers Network Plc
 World Careers Network Plc report and consolidated financial statements for the year ended 31 July 2015 year ended 31 July 2015 Contents World Careers Network Plc Annual report and financial statements
THIS DOCUMENT IS IMPORTANT AND REQUIRES YOUR IMMEDIATE ATTENTION.
 THIS DOCUMENT IS IMPORTANT AND REQUIRES YOUR IMMEDIATE ATTENTION. If you are in any doubt about the contents of this document or the action you should take, you are recommended to seek immediately your
Half Yearly Financial Report 2017 Abbey National Treasury Services plc
 Half Yearly Financial Report 2017 Abbey National Treasury Services plc PART OF THE BANCO SANTANDER GROUP This page intentionally blank Index Introduction 2 Directors responsibilities statement 3 Financial
RESULTS UNDERPINNED BY TIGHT COST MANAGEMENT
 Financial review RESULTS UNDERPINNED BY TIGHT COST MANAGEMENT SEGMENTAL PERFORMANCE The financial statements for the period ended included 53 weeks. In the notes that follow, all comparative income statement
Revenue 167.5m 177.2m EBITDA 18.1m 22.9m Operating profit 9.5m 13.7m Profit before tax 7.6m 12.2m
 HALF-YEARLY REPORT 2012 Financial Highlights Continuing operations before operational restructuring costs and asset impairments: Half year ended Half year ended 30 June 2012 30 June 2011 Revenue 167.5m
Honeycomb Investment Trust plc
 Honeycomb Investment Trust plc Veritas House, 125 Finsbury Pavement London EC2A 1NQ Honeycomb Investment Trust plc Interim Report and Unaudited Financial Statements For the period from 2 December 2015
Profit before tax from continuing operations up 44.6% to 45.1m (1H 2016: 31.2m)
") 03 August 2017 esure Group plc interim results for the six months ended 30 June 2017 An excellent first half with growth in premiums, policies and profits Highlights Gross written premiums up 22.8% to
03 August 2017 esure Group plc interim results for the six months ended 30 June 2017 An excellent first half with growth in premiums, policies and profits Highlights Gross written premiums up 22.8% to
RANGER DIRECT LENDING FUND PLC
 (Registered No. 09510201) RANGER DIRECT LENDING FUND PLC Annual Report For the period from 10 April 2015 to 31 December 2015 CONTENTS Page Overview and Investment Strategy 3-7 Chairman s Statement 8 Investment
THAMESWEY SOLAR LIMITED
 THAMESWEY SOLAR LIMITED BUSINESS PLAN 2017-19 Address: 2 nd Floor, Gloucester Chambers, Jubilee Square, Woking, Surrey GU21 6GA Registered Address: The St Botolph Building, 138 Houndsditch, London, EC3A
West Midlands Pension Fund. Investment Strategy Statement 2017
 West Midlands Pension Fund Investment Strategy Statement 2017 March 2017 Investment Strategy Statement 2017 1) Introduction This is the Investment Strategy Statement (the ISS ) of the West Midlands Pension
Audit Committee report THE AUDIT COMMITTEE. Tim Weller Audit Committee Chairman
 Corporate governance report continued Audit Committee report management processes and systems; health and safety; and people. In addition, the growth strategy risk was addressed as part of the board strategy
JOHN LAING INFRASTRUCTURE FUND LIMITED (incorporated with limited liability under the laws of Guernsey with registered number 52256)
") THIS DOCUMENT IS IMPORTANT AND REQUIRES YOUR IMMEDIATE ATTENTION. If you are in any doubt about the action to be taken, you are recommended to seek immediately your own personal financial advice from an
THIS DOCUMENT IS IMPORTANT AND REQUIRES YOUR IMMEDIATE ATTENTION. If you are in any doubt about the action to be taken, you are recommended to seek immediately your own personal financial advice from an
Financial statements. Group financial statements. Company financial statements. 68 Independent auditor s report 74 Consolidated income statement
 Strategic report Governance Financial statements Financial statements Group financial statements 68 Independent auditor s report 74 Consolidated income statement 75 Consolidated statement of comprehensive
BURFORD CAPITAL PLC. Unaudited Interim Report. For the period ended 30 June 2015
 Company Registration No. 09077893 (England and Wales) BURFORD CAPITAL PLC Unaudited Interim Report Page Company Information 1 Strategic Report 2 Report of Directors 3 Profit and Loss Account 7 Balance
Ordinary Shares 30 June C shares 30 June Total Net Assets 220,976, ,658, ,324, ,351,145
 P2P GLOBAL INVESTMENTS PLC INTERIM REPORT AND UNAUDITED FINANCIAL STATEMENTS TO 30 JUNE 2015 28 August 2015 P2P Global Investments plc (the Company ) today announces its unaudited interim financial results
North Professional Series
 North Professional Series Product Disclosure Statement Issue number 5 Issued 29 September 2017 Issued by ipac asset management limited ABN 22 003 257 225, AFSL 234655 Registered trademark of National Mutual
Financial review. Financial performance
 Strategic Review Financial review Financial performance Contents Financial performance 47 Measurement of financial performance 47 Key performance indicators (KPIs) 47 Other performance measures 48 Earnings
Company Number: IMPERIAL BRANDS FINANCE PLC. Annual Report and Financial Statements 2017
 Company Number: 03214426 IMPERIAL BRANDS FINANCE PLC Annual Report and Financial Statements 2017 Board of Directors J M Jones N J Keveth (resigned 31 March 2017) D I Resnekov O R Tant M A Wall (appointed
Pillar 3 Disclosures. 31 December 2013
 Pillar 3 Disclosures 31 December 2013 Contents 1. Overview... 3 1.1 Background... 3 1.2 Scope of application... 3 1.3 Basis and frequency of disclosures... 3 1.4 External audit... 3 2. Risk Management
London Borough of Hackney Pension Fund. Investment Strategy Statement
 London Borough of Hackney Pension Fund Investment Strategy Statement Investment Strategy Statement (Published 01/04/2017) 1. Introduction The London Borough of Hackney is the Administering Authority for
Raven Russia Limited
 THIS DOCUMENT AND THE ENCLOSED FORM OF PROXY ARE IMPORTANT AND REQUIRE YOUR IMMEDIATE ATTENTION. If you are in any doubt as to the action you should take, you are recommended to seek advice from your own
Iona EnvIronmEntal vct PlC
 Iona EnvIronmEntal vct PlC HALF YEARLY REPORT & ACCOUNTS 31 MARCH 2012 Half Year Report Contents Half Yearly Review 2 3 4 5 6 8 Investment Objectives and Strategy Financial Highlights Chairman s Statement
SUPPLEMENTAL CELL PROSPECTUS 3 DECEMBER 2018 RENAISSANCE GLOBAL EQUITY FUND IC LIMITED MOMENTUM MUTUAL FUND ICC LIMITED
 SUPPLEMENTAL CELL PROSPECTUS 3 DECEMBER 2018 RENAISSANCE GLOBAL EQUITY FUND IC LIMITED (an incorporated cell registered with limited liability in Guernsey with registration number 61176) being an incorporated
INVESTMENT POLICY. January Approved by the Board of Governors on 12 December Third amendment approved with effect from 1 January 2019
 INVESTMENT POLICY January 2019 Approved by the Board of Governors on 12 December 2016 Third amendment approved with effect from 1 January 2019 1 Contents SECTION 1. OVERVIEW SECTION 2. INVESTMENT PHILOSOPHY-
THE LAFARGE UK PENSION PLAN STATEMENT OF INVESTMENT PRINCIPLES DEFINED BENEFIT SECTION
 THE LAFARGE UK PENSION PLAN STATEMENT OF INVESTMENT PRINCIPLES DEFINED BENEFIT SECTION Section Page 1 Introduction 2 The Framework of Investment Powers and Processes 3 Investment Principles 4 Investment
EUROPEAN REAL ESTATE INVESTMENT TRUST LIMITED HALF YEARLY REPORT FOR THE SIX MONTHS ENDED 30 JUNE 2017
 HALF YEARLY REPORT FOR THE SIX MONTHS ENDED 30 JUNE CONTENTS Pages Chairman s Statement 2 Investment Manager s Report 3 Statement of Directors Responsibilities 4 Unaudited Consolidated Condensed Financial
General Accident plc. Registered in Scotland No. SC Annual Report and Financial Statements 2016
 Registered in Scotland No. SC119505 Contents Directors and Officers... 3 Strategic Report... 4 Directors Report... 6 Independent Auditors Report on the Financial Statements... 9 Accounting Policies...
INDEPENDENT AUDITORS REPORT
 COMPANY FINANCIAL STATEMENTS INDEPENDENT AUDITORS REPORT TO THE MEMBERS OF MEDICLINIC INTERNATIONAL PLC REPORT ON THE AUDIT OF THE COMPANY FINANCIAL STATEMENTS Opinion In our opinion, Mediclinic International
Financial statements. Pets at Home Group Plc Annual Report and Accounts 2018
 Financial statements Independent Auditor s Report 103 Consolidated income statement 108 Consolidated statement of comprehensive income 108 Consolidated balance sheet 109 Consolidated statement of changes
Implementing measures on the Alternative Investment Fund Managers Directive: CESR call for evidence
 Implementing measures on the Alternative Investment Fund Managers Directive: CESR call for evidence Initial submission by the Association of Investment Companies The Association of Investment Companies
For personal use only
 AMP CAPITAL DYNAMIC MARKETS FUND (HEDGE FUND) Product Disclosure Statement ASX Code: DMKT ARSN: 609 155 731 Dated: 29 September 2017 Issuer and Responsible Entity: BetaShares Capital Ltd ABN 78 139 566
Solvency and financial condition report 2017
 Solvency and financial condition report 2017 The Standard Life Assurance Company 2006 Contents Summary 2 A Business and performance 4 A.1 Business 4 A.2 Underwriting performance 5 A.3 Investment performance
Pillar 3 Disclosure ICAP Europe Limited
 Pillar 3 Disclosure 31 st March 2017 1. INTRODUCTION AND SCOPE The purpose of this report is to meet Pillar 3 requirements laid out by the European Banking Authority (EBA) in Part Eight of the Capital
Morse plc Interim Results Six months ended 31 December On track to achieve performance objectives and confident of performance for the full year
 Wednesday 13 February 2008 Morse plc Interim Results Six months ended 31 December 2007 On track to achieve performance objectives and confident of performance for the full year Morse plc ( Morse or the
Raven Russia Limited
 THIS DOCUMENT AND THE ENCLOSED FORM OF PROXY ARE IMPORTANT AND REQUIRE YOUR IMMEDIATE ATTENTION. If you are in any doubt as to the action you should take, you are recommended to seek advice from your own
AQUA RESOURCES FUND LIMITED
 CIRCULAR THIS DOCUMENT IS IMPORTANT AND REQUIRES YOUR IMMEDIATE ATTENTION. When considering what action you should take, you are recommended to seek your own financial advice from your stockbroker, bank
STATEMENT OF INVESTMENT PRINCIPLES
 STATEMENT OF INVESTMENT PRINCIPLES NEW AIRWAYS PENSION SCHEME Adopted by the Trustee on 26 October 2016 Page 1 Contents Section 1 Introduction... 3 Section 2 Objectives funding and investment... 4 Section
THE SCOTTISH ORIENTAL SMALLER COMPANIES TRUST PLC
 This document is issued by The Scottish Oriental Smaller Companies Trust PLC (the "Company") solely in order to make certain particular information available to investors in the Company before they invest,
LENDINVEST LIMITED Interim unaudited consolidated report for the 6 month period ended 30 September 2017
 Interim unaudited consolidated report for the 6 month period ended 30 September 2017 Company registration number: 08146929 Contents Officers and professional advisors 3 Directors report 4-6 Responsibility
INVESTOR DISCLOSURE DOCUMENT
 This document is issued by Witan Investment Services Limited solely in order to make particular information available to investors in Witan Investment Trust plc (the Company ) before they invest, in accordance
1 A description of the investment strategy and objectives of the AIF
 Alternative Investment Fund Managers Directive - Pre-investment Disclosure Document Premier Global Infrastructure Trust PLC (the "Company") Dated: 2 November 2017 Article 23(1) and (2) of the Directive
RAVEN PROPERTY GROUP LIMITED
 RAVEN PROPERTY GROUP LIMITED 2018 Interim Report 1 RAVEN PROPERTY GROUP LIMITED INTERIM RESULTS FOR THE SIX MONTHS ENDED 30 JUNE 2018 CONTENTS PAGE Highlights 2 Chairman s Message 4 Chief Executive s
The Royal Bank of Scotland Group Pension Fund Statement of Investment Principles
 The Royal Bank of Scotland Group Pension Fund Statement of Investment Principles Introduction 1 Under the Pensions Act trustees are required to prepare a statement of principles governing decisions about
Half Yearly Report for the six months ended 30 April 2013
 Half Yearly Report for the six months 30 April 2013 Nplus1 Singer Capital Markets Limited is Corporate Broker to the Company. Shareholders, or intermediaries, wishing to sell or purchase of Chrysalis VCT
Nottinghamshire Pension Fund INVESTMENT STRATEGY STATEMENT. Introduction. Purpose and Principles. March 2017
 Nottinghamshire Pension Fund March 2017 INVESTMENT STRATEGY STATEMENT Introduction 1. The County Council is an administering authority of the Local Government Pension Scheme (the Scheme ) as specified
Ventus 2 VCT plc. Strategy Note Executive Summary
 1 Executive Summary This note summarises the outcome of a strategy review undertaken by the Board of Ventus 2 VCT plc (the Company ) over the past year during the period when the last of the Company s
Solvency & Financial Condition Report Centrewrite Limited
 Solvency & Financial Condition Report Centrewrite Limited For the year ended 31 December 2016 Prepared in accordance with Chapter XIII Section 1 Article 290-298 of Directive 2009/138/EC and Annex XX of
GUIDANCE NOTE ASSET MANAGEMENT BY AUTHORIZED INSURERS
 GN13 GUIDANCE NOTE ON ASSET MANAGEMENT BY AUTHORIZED INSURERS Office of the Commissioner of Insurance June 2004 GN13 Guidance Note on Asset Management By Authorized Insurers Table of Contents Page Preamble...
RSMR Portfolio Services Limited RSMR-PS Pillar 3 Disclosure
 RSMR Portfolio Services Limited RSMR-PS Pillar 3 Disclosure 1 Introduction Firms are required under the Senior Management Arrangements, Systems and Controls (SYSC) manual of the Financial Conduct Authority
Levendi Thornbridge Defined Return Fund
 Levendi Thornbridge Defined Return Fund The Levendi Thornbridge Defined Return Fund has been developed for investors looking to achieve steady returns with less volatility than that of the global stock
The Group has a portfolio of 118 investments located in the UK, France, Ireland, the Netherlands, Canada, the USA and Australia.
 1 August 2018 HICL Infrastructure Company Limited Interim Update Statement The Board of HICL Infrastructure Company Limited ( HICL or the Company or, together with its subsidiaries, the Group ), the listed
AMP Capital Core Infrastructure Fund
 Dated: 21 June 2010 Issued by AMP Capital Investors Limited ABN 59 001 777 591 AFSL 232497 Product Disclosure Statement For investments through a master trust or wrap platform Dated 16 December 2010 Issued
ScotGems plc INVESTOR DISCLOSURE DOCUMENT. 5 June 2017 IMPORTANT INFORMATION
 This document is issued by ScotGems plc (the "Company") solely in order to make certain particular information available to investors in the Company before they invest, in accordance with the requirements
Half Year Results for the Six Months to 31 January 2019
 Close Brothers Group plc T +44 (0)20 7655 3100 10 Crown Place E enquiries@closebrothers.com London EC2A 4FT W www.closebrothers.com Registered in England No. 520241 Half Year Results for the Six Months
Basel II Briefing: Pillar 2 Preparations. Considerations on Pillar 2 for Subsidiary Banks
 Basel II Briefing: Pillar 2 Preparations Considerations on Pillar 2 for Subsidiary Banks November 2006 Preamble Those studying this document should be aware that because of the nature of the technical
Schroder. Offshore Cash Fund. Final Report and Accounts 31 December 2012
 Schroder Offshore Cash Fund Final Report and Accounts 31 December 2012 Contents Schroder Offshore Cash Fund Fund Information................................................ 3 Investment objective and policy......................................
Appendix 1. London Economy: Jobs growth. Central London office potential completions 1. Headline office rents. Great Portland Estates. Growth.
 23 24 25 26 27 28 29 21 211 212 213 214 215 216 217 218 Great Portland Estates Appendix 1 London Economy: Jobs growth 6 55 5 Growth Decline 45 4 35 Dec 8 Employment intentions Dec 9 Dec 1 Dec 11 Dec 12
PANTHEON INTERNATIONAL PLC (the Company ) INFORMATION FOR INVESTORS
 INFORMATION FOR INVESTORS") PANTHEON INTERNATIONAL PLC (the Company ) INFORMATION FOR INVESTORS The Company is an alternative investment fund for the purposes of the EU Alternative Investment Fund Managers Directive (Directive 2001/61/EU)
PANTHEON INTERNATIONAL PLC (the Company ) INFORMATION FOR INVESTORS The Company is an alternative investment fund for the purposes of the EU Alternative Investment Fund Managers Directive (Directive 2001/61/EU)
Financial Condition Review
 MANAGEMENT S DISCUSSION AND ANALYSIS Financial Condition Review Summary Balance Sheet As at October 31 2015 2014 2013 2012 2011 Assets Cash and interest bearing deposits with banks 47,677 34,496 32,607
AMP CAPITAL DYNAMIC MARKETS FUND (HEDGE FUND)
") AMP CAPITAL DYNAMIC MARKETS FUND (HEDGE FUND) Product Disclosure Statement ASX Code: DMKT ARSN: 609 155 731 Dated: 24 June 2016 Issuer and Responsible Entity: BetaShares Capital Ltd ABN 78 139 566 868
AMP CAPITAL DYNAMIC MARKETS FUND (HEDGE FUND) Product Disclosure Statement ASX Code: DMKT ARSN: 609 155 731 Dated: 24 June 2016 Issuer and Responsible Entity: BetaShares Capital Ltd ABN 78 139 566 868
Unaudited interim report for the period ended 31 August 2017
 Octopus VCT 3 plc Unaudited interim report for the period ended 31 August 2017 Company number: 07744056 For UK investors only Octopus VCT 3 plc Interim Report 2017 Contents About Octopus VCT 3 plc 1 Financial
SUPPLEMENTAL CELL PROSPECTUS 19 SEPTEMBER 2018 CREDO GLOBAL EQUITY FUND IC LIMITED MOMENTUM MUTUAL FUND ICC LIMITED
 SUPPLEMENTAL CELL PROSPECTUS 19 SEPTEMBER 2018 CREDO GLOBAL EQUITY FUND IC LIMITED (an incorporated cell registered with limited liability in Guernsey with registration number 60876) being an incorporated
NB Private Equity Partners Limited Consolidated Financial Statements For the Years 31 December 2017 and 2016
 NB Private Equity Partners Limited Consolidated Financial Statements For the Years 31 December 2017 and 2016 KPMG LLP Suite 1400 2323 Ross Avenue Dallas, TX 75201-2721 Independent Auditors Report The Members
Pillar 1 sets out the minimum capital resource requirement firms are required to maintain to meet credit, market and operational risks
 Gresham House Asset Management Limited Pillar 3 Disclosure 1 Introduction Firms are required under the Senior Management Arrangements, Systems and Controls (SYSC) manual of the Financial Conduct Authority
Product Disclosure Statement
 Product Disclosure Statement Dated 2 August 2010 A selection of managed investments Goldman Sachs Core Plus Australian Fixed Income Fund Goldman Sachs Australia Quantitative Equity Fund Goldman Sachs Global
M&G Absolute Return Bond Fund
 M&G Absolute Return Bond Fund a sub-fund of M&G Investment Funds (10) Interim Short Report September 2017 For the six months ended 30 September 2017 Fund information The Authorised Corporate Director (ACD)
The Renewables Infrastructure Group Limited
 THIS DOCUMENT IS IMPORTANT AND REQUIRES YOUR IMMEDIATE ATTENTION. If you are in any doubt as to the action you should take, you are recommended to seek your own personal financial advice from your stockbroker,
P2P GLOBAL INVESTMENTS PLC INTERIM REPORT AND UNAUDITED CONDENSED CONSOLIDATED FINANCIAL STATEMENTS FOR THE PERIOD FROM 1 JANUARY 2017 TO 30 JUNE 2017
 P2P GLOBAL INVESTMENTS PLC INTERIM REPORT AND UNAUDITED CONDENSED CONSOLIDATED FINANCIAL STATEMENTS FOR THE PERIOD FROM 1 JANUARY 2017 TO 30 JUNE 2017 31 August 2017 P2P Global Investments plc (the Company
Financial resilience analysis
 Appendix 13g: Financial resilience analysis Contents Objective 3 Method 3 Reverse stress testing 3 a. Method 3 b. Results 4 Forward stress testing 7 a. Method 7 b. Results 7 c. Summary 9 Scenarios prescribed
Pillar 3 Disclosure November 2016
 Pillar 3 Disclosure November 2016 1 1. Overview 1.1 Background This document comprises the Capital and Risk Management Pillar 3 disclosures as at 30 September 2016 for River and Mercantile Group PLC and
European Bank for Reconstruction and Development. The RDI Special Fund
 European Bank for Reconstruction and Development The RDI Special Fund Annual Financial Report 31 December 2014 Contents Income statement... 1 Statement of comprehensive income... 1 Balance sheet... 1 Statement
Close Brothers Group plc Interim Report 2011
 Overview 01 Group Results 02 Chairman s and Chief Executive s Statement Business Review 04 Overview 10 Banking 12 Securities 14 Asset Management 16 Principal Risks and Uncertainties is a UK based financial
REPORT & AUDITED CONSOLIDATED FINANCIAL STATEMENTS
 REPORT & AUDITED CONSOLIDATED FINANCIAL STATEMENTS FOR THE YEAR ENDED 31 OCTOBER 2012 TABLE OF CONTENTS For the year ended 31 October 2012 General Information 2 The Company 3 Chairman s Statement 4 Investment
JOHN LAING INFRASTRUCTURE FUND LIMITED. (incorporated with limited liability under the laws of Guernsey with registered number 52256)
") THIS LETTER IS IMPORTANT AND REQUIRES YOUR IMMEDIATE ATTENTION. If you are in any doubt about the contents of this letter or what action you should take, you are recommended to seek your own independent
THIS LETTER IS IMPORTANT AND REQUIRES YOUR IMMEDIATE ATTENTION. If you are in any doubt about the contents of this letter or what action you should take, you are recommended to seek your own independent
Prospectus and Application Form
 Prospectus and Application Form Offer for subscription to raise up to 15 20 million through the issue of up to 25 million New Shares UNICORN AIM VCT PLC THIS DOCUMENT IS IMPORTANT AND REQUIRES YOUR IMMEDIATE
Pillar 3 Disclosures. Sterling ISA Managers Limited Year Ending 31 st December 2017
 Pillar 3 Disclosures Sterling ISA Managers Limited Year Ending 31 st December 2017 1. Background and Scope 1.1 Background Sterling ISA Managers Limited (the Company) is supervised by the Financial Conduct
RBS Collective Investment Funds Limited. Overall Risk Management Policy and Governance
 RBS Collective Investment Funds Limited Overall Risk Management Policy and Governance Contents Overall Context 3 Governance Structure 6 Risk Principles 10 Risk Policies 10 Reports Management 11 1 Overall
FOREIGN & COLONIAL INVESTMENT TRUST PLC Unaudited Statement of Results for the half-year ended 30 June 2018
 Date: 30 July 2018 Contact: Paul Niven Fund Manager 0207 011 4385 F&C Investment Business Limited FOREIGN & COLONIAL INVESTMENT TRUST PLC Unaudited Statement of Results for the half-year ended 30 June