MyState Limited Preliminary Final Report (Appendix 4E) for the year ended 30 June 2017
|
|
|
- Marion Phelps
- 5 years ago
- Views:
Transcription
1 18 August 2017 The Manager Company Announcements Australian Securities Exchange 20 Bridge Street Sydney NSW 2000 MyState Limited Preliminary Final Report (Appendix 4E) for the year ended 30 June 2017 The Directors of MyState Limited (the Company ) are pleased to announce the audited results of the Company for the year ended 30 June 2017 as follows: RESULTS FOR ANNOUNCEMENT TO THE MARKET Extracted from the Financial Statements for the year ended $ June 2017 $ June 2016 % Change Income from operations 124, , % Profit after tax attributable to members 30,080 28, % Net profit after tax attributable to members 30,080 28, %
2 Dividends for the current year are: Amount per security Franked amount per security Interim Dividend 2017 fully franked at 30% Paid 10 March cents 14.0 cents Final Dividend 2017 fully franked at 30% Payable 13 September cents 14.5 cents Record Date for determining entitlements for final dividend 24 August 2017 Dividends for the previous year are: Amount per security Franked amount per security Final dividend 2016 fully franked at 30% 14.5 cents 14.5 cents Paid 3 October 2016 Dividend Reinvestment Plan The MyState Limited Dividend Reinvestment Plan is operational for this Final Dividend 2017 Last Date for Receipt of DRP Election 25 August 2017 Net Tangible Assets per share cents 248 cents Details of entities over which control has been gained or lost during the period During the financial period the holding company MyState Limited gained control of the following entity: Nil Subsequent events The remainder of the information requiring disclosure to comply with Listing Rule 4.3A is contained in the attached copy of the Financial Statements and comments on performance of the Company included in the Media and ASX Release dated 18 August Further information regarding MyState Limited and its business activities can be obtained by visiting the company s website at Yours faithfully Scott Lukianenko Company Secretary
3 Directors Report MyState Limited ABN Directors Report Your Directors present their report on MyState Limited for the financial year ended 30 June Directors Miles L Hampton BEc (Hons), FCIS, FCPA, FAICD Chairman and independent non-executive Director. Melos A Sulicich BBus, GAICD, SA FIN Managing Director Executive Director. Peter D Armstrong BEc (Hons), DipED, Dip FP, CPA, FAICD, FAMI Independent non-executive Director. Brian V Bissaker BEc, FCA Independent non-executive Director. (Retired 18 May 2017). Robert L Gordon BSc, MIFA, MAICD, FAMI Independent non-executive Director. Colin M Hollingsworth CPA, MAICD, FAMI Independent non-executive Director. Stephen Lonie BCom, MBA, FCA, FFin, FAICD, FIMCA Independent non-executive Director. Sarah Merridew BEc, FCA, FAICD Independent non-executive Director. (Retired 18 May 2017). Sibylle Krieger LLB (Hons), LLM, FAICD, MBA Independent non-executive Director. (Appointed 1 December 2016). Company Secretary Scott A Lukianenko Ad Dip BMgmt, Grad Cert BA, GIA (Cert). 1
4 Directors Report Principal Activities Banking Services Trustee Services Wealth Management Personal, residential and business banking Transactional internet & mobile banking Savings and investments Insurance and other alliances Estate planning Estate and trust administration Power of attorney Corporate trustee Managed fund investments Financial planning Portfolio administration services Portfolio advisory services Private client services MyState Limited provides banking, trustee and wealth management products and services through its wholly-owned subsidiaries MyState Bank Limited and Tasmanian Perpetual Trustees Limited. There have been no significant changes in the nature of the principal activities of the Group during the financial year. Operating and Financial Review The Group posted a statutory profit after income tax for the year ended 30 June 2017 of $ million (2016: $ million). Dividends The Directors have declared a fully franked (at 30%) final dividend of 14.5 cents per share. The dividend will be payable on 13 September 2017 to shareholders on the register at 5pm EST on 24 August Dividends paid in the year ended 30 June 2017 were as follows: In respect of the year ended 30 June 2016, a fully franked dividend of 14.5 cents per share, amounting to $ million, was paid on 3 October In respect of the half year ended 31 December 2016, a fully franked dividend of 14 cents per share, amounting to $ million, was paid on 10 March
 Underlying results exclude on a post-tax basis: FY16 - $1.8m M&A related costs, $1.0m write down of intangible software FY15 - $3.9m profit on sale of Cuscal shares, $1.")
. Earnings per share, on an underlying basis, decreased by 4.2% to 34.")

5 Directors Report Review and Results of Operations Financial Performance 28.5 Net Profit after Tax (i) 31.1 (i) (i) Underlying results exclude on a post-tax basis: FY16 - $1.8m M&A related costs, $1.0m write down of intangible software FY15 - $3.9m profit on sale of Cuscal shares, $1.1m restructuring costs MyState Limited recorded a statutory net profit after income tax for the year ended 30 June 2017 of $ million, an increase of 6.2% on the prior year of $ million (or a 3.2% reduction on the FY16 underlying result 1 ). Earnings per share, on an underlying basis, decreased by 4.2% to 34.0 cents per share on the prior year and return on equity decreased 63bps to 10.0%. Whilst the FY17 result has declined slightly on the prior year, MyState has grown its business and delivered a program of investment in digital technology platforms and capability to create a simpler, more customer-centric business, notwithstanding strong competition in the market and sectoral headwinds. Executing on business transformation FY17 was a year in which MyState made significant progress delivering a technology program to position MyState as a highly scalable, modern banking and wealth management business. The main components of this program are now in place. MyState recently consolidated its core banking systems, which has simplified its business, reduced risk, and enables the business to deliver better customer outcomes in a more efficient manner. MyState also launched a new internet and mobile banking platform during the year and completed its Apply project, which enables online origination for deposit accounts and personal loans. MyState also became a leader in mobile payment offerings, successfully launching Apple Pay, Samsung Pay and Android Pay during the year. These initiatives are fundamentally important to MyState s strategy to provide contemporary banking services to customers and to grow and simplify its business through digital offerings. MyState also consolidated data centres and implemented and enhanced its customer relationship management platform to understand and react to customers needs more effectively. A new contact centre system has also significantly improved MyState s offering and enables improved customer service and operational productivity. 1 Unless otherwise indicated, all comparisons are to the prior full year ended 30 June 2016 which was reported on an underlying basis.fy2017 results are presented on a statutory reporting basis as no adjustments were made to report on an underlying basis. FY2016 underlying basis excludes $1.8m after tax M&A related costs and $1.0m after tax accelerated write down of intangible software assets 3
 4.27 3.85 3.54 3.")
, asset quality was again a highlight.")
6 Directors Report As the dynamics of the banking sector continue to shift at a rapid pace, MyState has rapidly transformed and modernised its technology platforms and digital offerings to keep pace with changing customer needs and to grow its business beyond traditional distribution channels and geographies. Growth in high quality credit Loan Book ($B) Home loan book by LVR ($m) ,052 2,195 2,509 High quality asset growth and credit performance The Banking division continued to increase market share, with the loan book growing $416m or 10.8%. Whilst this growth was well above national system (at 1.6x system), asset quality was again a highlight. Impairment charges remain at historic lows with 30 day arrears performance of 0.51% and 90 day arrears of 0.28%, well below benchmarks for both major and regional banks. Impairment expense decreased by $1.0m or 82.5% on the prior year, reflecting a quality loan portfolio growing in lower risk, lower loan to valuation ratio (LVR) home loans. With a strong focus on growing in lower LVR home loans, MyState grew its less than 80% LVR portfolio by 22% and reduced its portfolio of loans with greater than 80% LVR by 11%. Whilst this strategy has come at some expense to margin, MyState has grown prudently and has built in resilience to any potential changes in the economic and housing cycle. June 15 June 16 June 17 <80% 80% - 85% 85-90% >90% Modest income growth amidst strong competition and sectoral headwinds MyState s total income increased by $1.2m or 1% during the year. Net interest income decreased by 0.9% as a result of heavy competition for home loans in MyState s key market focus of lower risk, lower LVR, owner occupier home loans. Non-interest income grew by $1.97m or 5.7%. Net interest margin decreased to 1.93%, 20bps below the prior year, reflecting increased competition for owner-occupied home loan business and deposit funding. A focus on margin management enabled a flat NIM profile across the two halves of the year. 0.13% 0.16% NIM waterfall MyState s NIM remains above its regional peer group and margin management continues to be a key focus for the business. Deposits grew strongly through all channels, including for MyState s esaver product, launched earlier in Customer deposits grew to nearly $3 billion, up 10% from $2.7 billion a year ago. 2.36% 2.13% 0.36% FY 2015 FY 2016 Asset Price Origination Costs 0.03% 0.01% 0.22% 0.01% Asset Mix Origination costs Funding Price 0.19% 1.93% Funding Mix FY


7 Directors Report FUM and FUA ($m) $782 $738 $778 $1,017 $1,008 $1,089 FY15 FY16 FY17 Funds Under Management Funds Under Advice The Wealth management business benefited from record growth in funds under management and growth in financial planning. Returns to investors in the income funds outperformed their benchmarks and strong demand from retail and wholesale clients grew funds under management to $1.089 billion, an increase of 8% on the prior year. A strengthened financial planning team also supported an increase in funds under advice, which grew by 6% to $778 million. FY17 was a challenging year for the trustee business. The value of estates under administration were well below that of FY16 and revenue declined as a result. Trustee business income improved in the second half of FY17, with the business having stabilised on account of the prioritisation of generating new wills and revising existing wills over the past three years. Investments to deliver cost and productivity improvement over time The Group continues to manage its cost base prudently. Expense growth was contained to 1.3% on a statutory reporting basis and 3.7% on an underlying basis. The cost to income ratio increased from 64.3% to 65.9%. Whilst costs increased over the previous year, the increases reflect the investments in technology platforms and digital capability, which position MyState as a highly scalable modern banking business, able to deliver better customer outcomes in a more efficient manner. With most of the larger scale technology investments either complete or nearing completion, the business is now in a position to increase efficiency and reduce the cost to income ratio in the coming period. Strong capital position Total Capital Movements 13.0% 1.33% 1.90% 1.56% 0.57% 1.40% 1.96% 0.29% 13.3% Tier % 2.01% Tier 2 Tier % 11.28% Tier 1 FY16 Capital initiatives Profit Dividends paid Capitalised intangibles Securitised assets Secured mortgage lending Other asset growth FY17 5
8 Directors Report The Group has maintained its balance sheet strength, with a capital ratio at 13.3%, a 25bps improvement on the prior year. MyState s capital strategy was supported by multiple RMBS issuances in FY17, along with further issuance of subordinated notes. The more recent $400 million RMBS was our largest such transaction to date and was well supported by an increasingly broad investor base. MyState s strong and efficient capital strategy also includes the use of the dividend reinvestment plan to support continued lending growth and digital banking platform investments. MyState is also well positioned to meet APRA s unquestionably strong CET1 ratio requirements by 1 January Risk Management MyState has also invested in strengthening its risk management capability and has made significant progress in imbuing risk awareness into organisational culture. MyState s approach to risk management is overseen by the Board and its Group Risk Committee and is supported by a well defined risk appetite statement, contemporary processes and systems and an industry standard three lines of defence model which supports the identification, assessment, evaluation and management of risk. Conduct risk is an area of risk that has attracted much attention within the sector and MyState s long-standing commitment to delivering great customer outcomes has been re-affirmed by the appointment of a Customer Advocate during the year, a role independent from the bank s existing complaints resolution process. The Board looks across the full risk profile of the business and currently has identified the following key risks including: Market risk arising from intense competition for quality lending opportunities. Compliance risk in a highly regulated sector. Regulatory capital requirements that impact our capacity to grow. Cyber/digital security risk. We have established key actions to mitigate these risks. Outlook Economic conditions within Tasmania continue to trend positively, with the broader Australian economy also maintaining a healthy level of economic growth. Credit growth in the sector appears to be moderating, and coupled with regulator restrictions on investor and interest only lending, it is expected that intense competition for owner occupied lending will continue. Notwithstanding this outlook, MyState expects to continue to be able to achieve above-system lending growth and maintain a quality of loan book that performs favourably in comparison to the major banks and regional peers. MyState remains focused on the management of margins and as MyState s net interest margin remains above that of regional peers and it continues to grow above system, it is expected that some margin decline will continue. The performance of the Trustee business has stabilised and more recent upward trends in key income drivers such as funds under management, funds under advice and estates under administration which indicate an improved outlook for the Wealth business. With the main elements of the technology transformation program nearing completion, MyState is poised for further growth and productivity improvement across the business. More customers are 6
9 Directors Report using MyState s internet and mobile digital channels in preference to branches and the business will continue to leverage its technology platform, to ensure channels and points of presence are aligned with customer needs and products and services also keep pace with the changing landscape. MyState is participating in the launch of the New Payments Platform, which is intended to bring real time payment to customers in November As the dynamics of the banking landscape change, MyState remains focused on helping customers with simpler, more relevant and more accessible products. MyState also expects these investments to facilitate further revenue growth, deliver productivity and efficiency benefits and therefore, improved shareholder returns. MyState has a clear strategy of organic growth, responding to the changing needs of customers, whilst remaining true to its purpose of helping people achieve their dreams. MyState is well capitalised with sound credit and risk management processes and remains confident of future growth prospects. State of Affairs During the financial year, there was no significant change in the state of affairs of the Company other than referred to in the review and results of operation. Events Subsequent To Balance Date In the opinion of the Directors, there has not arisen, in the period between the end of the financial year and the date of this report, any material item, transactions or event that is likely to significantly affect the operations of the consolidated entity. Likely Developments and Expected Results Directors do not foresee any material changes in the likely developments in the operations or the expected results of those operations in future financial years. Directors consider that the disclosure of additional information in respect of likely developments in the operations or the expected results of those operations may unreasonably prejudice the Company. Accordingly, this information has not been disclosed in this report. Environmental Regulation The Company is not subject to significant environmental regulation. 7
10 Directors Report Directors Meetings The number of meetings of Directors (including meetings of the Committees of Directors) held during the year and the number of meetings attended by each director are as indicated in the following table: MyState Limited Directors Meetings 2016/2017 Board Meetings Group Audit Committee Group Remuneration Committee Group Risk Committee Group Nominations & Corporate Governance Committee Group Technology Committee A B A B A B A B A B A B P Armstrong n/a n/a 6 6 n/a n/a 4 4 n/a n/a B Bissaker (resigned 18/5/17) n/a n/a 5 5 n/a n/a n/a n/a R Gordon n/a n/a n/a n/a M Hampton n/a n/a 4 4 n/a n/a C Hollingsworth n/a n/a 5 5 n/a n/a n/a n/a S Krieger (appt 1/12/17) 7 7 n/a n/a n/a n/a 2 2 S Lonie n/a n/a n/a n/a 5 5 S Merridew (resigned 18/5/17) n/a n/a n/a n/a 5 5 n/a n/a 5 5 M Sulicich n/a n/a n/a n/a n/a n/a n/a n/a n/a n/a A - Number of meetings attended B - Number of meetings eligible to attend Indemnification and Insurance of Directors and Officers The Company has paid, or agreed to pay, a premium in relation to a contract insuring the Directors and Officers listed in this report against those liabilities for which insurance is permitted under Section 199B of the Corporations Act The Company has not otherwise, during or since the relevant period, indemnified or agreed to indemnify an Officer or Auditor of the Company or of any related body corporate against a liability incurred as such an Officer or Auditor. Non-Audit Services During the year, Wise Lord & Ferguson, the Company s auditor has performed certain other services in addition to their statutory duties. Further details are set out in note 8.2 to the financial statements. The Board has considered the non-audit services provided during the year by the auditor and, in accordance with written advice provided by the Group Audit Committee, is satisfied that the provision of those non-audit services during the year by the auditor is compatible with, and did not compromise, the auditor independence requirements of the Corporations Act 2001, for the following reasons: All non-audit services were subject to the corporate governance procedures adopted by the Company and have been reviewed by the Group Audit Committee to ensure that they do not impact the integrity and objectivity of the auditor; and The non-audit services provided do not undermine the general principles relating to the auditor independence as they related to technical disclosure issues. 8
11 Directors Report Auditor s Independence Declaration to the Directors The Directors received the following declaration from the auditor of the Company: In relation to our audit of the financial report for the consolidated group for the financial year ended 30 June 2017, to the best of my knowledge and belief, there have been no contraventions of the auditor independence requirements of the Corporations Act 2001 or any applicable code of professional conduct. This declaration is in respect of MyState Limited and the entities it controlled during the period. J Doyle Partner Wise Lord & Ferguson Hobart Dated 18 August
12 Directors Report MyState Limited Remuneration Report This Remuneration Report forms part of the Directors Report and outlines the Director and Executive remuneration arrangements of MyState Limited (the Company or MYS) for the year ended 30 June 2017, in accordance with the requirements of the Corporations Act 2001 and its regulations. For the purposes of this report, Key Management Personnel (KMP) are defined as those persons having authority and responsibility for planning, directing and controlling the major activities of the Company, directly or indirectly, including any Director (whether Executive or otherwise) of the Company. Contents 1. Group Remuneration Committee 2. Remuneration Philosophy 3. Consequences of Performance on Shareholder Wealth 4. Key Management Personnel 5. Non-Executive Director Remuneration 6. Managing Director and Executive Remuneration 6.1 Fixed Annual Remuneration 6.2 Short Term Incentive 6.3 Executive Long Term Incentive Plan 7. Remuneration of Key Management Personnel 8. Shareholdings of Key Management Personnel 9. Loans to Key Management Personnel 10. Contract Terms and Conditions 10

13 Directors Report 1. Group Remuneration Committee The Board has established a Group Remuneration Committee that assists the Directors in discharging the Board s responsibilities in relation to remuneration and human resources by reviewing and making recommendations to the Board on: Remuneration policy and arrangements for Directors, the Managing Director and other Executives, having regard to comparative remuneration in the financial services industry and independent advice, including assessment of the Remuneration Policy s effectiveness and compliance with the requirements of APRA Prudential Standards; Applicable Human Resource Policies, Practices and ratification of industrial instruments to ensure compliance with all legal and regulatory requirements; Matters such as the Company's Employee Share Scheme or other incentive schemes for Executives and staff; and Succession planning, to ensure the Company has sufficiently skilled staff to competently perform their roles. The Group Remuneration Committee monitors to ensure there is no conflict of interest, actual or perceived, regarding Executive Director involvement in Board decisions on remuneration packages and also in monitoring the involvement of Management generally in Committee discussions and deliberations regarding remuneration policy. No Executive is directly involved in deciding their own remuneration to ensure conflict of interest does not occur. 2. Remuneration Philosophy The objective of the Company's Remuneration Policy is to encourage behaviours that support the sustained financial performance and security of the Group and to reward Executive and Management efforts which increase shareholder and customer value. The Remuneration Policy is premised on: Appropriately balanced measures of performance; Variable performance based pay for Executives involving short and long-term incentive plans; Recognition and reward for strong performance; A considered balance between the capacity to pay and the need to pay to attract and retain capable staff at all levels; The exercise of Board discretion as an ultimate means to mitigate unintended consequences of variable pay and to preserve the interests of the shareholders; and Short-term and long-term incentive performance criteria being structured within the overall risk management framework of the Company. In accordance with best practice corporate governance, the structure of Non-Executive Director remuneration is separate and distinct from Executive remuneration. Composition of CEO and EMT Remuneration The Company links the nature and amount of the remuneration of the Executive Management Team (EMT), comprising the Managing Director and Executives directly reporting to the Managing Director, to its financial and operational performance. The remuneration packages for the EMT are based on a notional Total Target Reward (TTR) which from time to time may comprise one or more of the following: 11
14 Directors Report Total Fixed Reward (inclusive of superannuation and salary sacrifice) (TFR); Cash based short term incentives (STI); and Equity based long term incentives (LTI). 3. Consequences of Performance on Shareholder Wealth In considering the Company's performance and benefits for Shareholder wealth, the Group Remuneration Committee has regard to the following indices: Indicator Underlying Profit after income tax ($'000) Underlying Earnings per share (cents) 28,457 29,571 29,719 31,062 30, Dividends paid ($'000) 24,378 24,417 24,880 24,886 25,042 Share price (dollars) Underlying Return on equity 10.2% 10.5% 10.4% 10.6% 10.0% The performance measures for triggering both the Company s cash based Short Term Incentive Plan (STI) and Executive Long Term Incentive Plan (ELTIP) have been tailored to align "at-risk" remuneration and performance hurdle thresholds to the delivery of financial and operational objectives and sustained shareholder value growth. STI, from time to time, includes financial and non-financial metrics. ELTIP performance measures are based on total shareholder return (TSR) for the "2013" offer. For the "2014" and "2015" offers, the measures are weighted equally between relative TSR performance and absolute return on equity (ROE). For the "2016" offer, the measures are weighted equally between relative TSR performance and absolute post tax underlying ROE. The relative TSR is a measure which incorporates both dividends paid and movements in share prices, whilst absolute ROE and absolute post tax underlying ROE are measures of corporate profitability. 12
15 Directors Report 4. Key Management Personnel The Key Management Personnel (KMP) of the Company in office during the year and up to the date of this report was as follows: NAME POSITION MOVEMENTS IN 2017 FINANCIAL YEAR Non Executive Directors Miles Hampton Peter Armstrong Non Executive Chairman Non Executive Director Brian Bissaker Non Executive Director Retired 18 May 2017 Robert Gordon Non Executive Director Colin Hollingsworth Non Executive Director Sibylle Krieger Non Executive Director Appointed 1 December 2016 Stephen Lonie Non Executive Director Sarah Merridew Non Executive Director Retired 18 May 2017 Executive Directors Melos Sulicich Executives Huw Bough Katherine Dean David Harradine Managing Director and Chief Executive Officer General Manager Mortgage Broker Distribution General Manager Sales and Distribution General Manager Retail Banking Sales and Service Chief Financial Officer New role 20 February 2017 Outgoing role 19 February 2017 Appointed 20 February 2017 Colleen Harris General Manager, People Appointed 25 July 2017 Mandakini Khanna Jessica Kingston Paul Moss Aaron Pidgeon Andrew Polson Chris Thornton Chief Risk Officer Acting General Manager Human Resources & Property General Manager Technology and Operations General Manager Human Resources & Property General Manager Wealth Management General Manager Product and Marketing Appointed 22 February 2017 Ceased 24 July 2017 Ceased 22 February
16 Directors Report 5. Non-Executive Director Remuneration The Company s Non-Executive Directors (NEDs) receive only fees, including statutory superannuation, for their services and the reimbursement of reasonable expenses. These fees may be taken as shares subject to prior shareholder approval. They do not receive any retirement benefits other than statutory superannuation. The Board reviews its fees to ensure the Company's NEDs are fairly remunerated for their services, recognising the level of skill and experience required to conduct the role and that the fee scale will enable the Company to attract and retain talented NEDs. The advice of independent remuneration consultants is taken to ensure that the Directors fees are in line with market standards. The aggregate remuneration paid to all the NEDs, inclusive of statutory superannuation, may not exceed the $950,000 amount fixed by Shareholders at the October 2012 Annual General Meeting of Shareholders. This fee pool" is only available to NEDs. Each NED currently receives $85,000 per annum inclusive of statutory superannuation and the Chairman receives $212,500 per annum inclusive of statutory superannuation. The Chair of the Group Audit Committee receives an additional $15,000 per annum inclusive of statutory superannuation and all other Board Committee Chairs receive an additional $12,500 per annum inclusive of statutory superannuation. Additionally, Members of Board Committees who are not Chairs are paid $5,000 per annum per committee, inclusive of statutory superannuation. 6. Managing Director and Executive Remuneration 6.1 Fixed Annual Remuneration The Total Fixed Reward (TFR) is paid by way of cash salary, superannuation and salary sacrificed fringe benefits and is reviewed annually by the Group Remuneration Committee. The Board appoints external consultants on a regular basis to provide analysis and advice to the Committee to ensure that Executive remuneration is competitive and appropriately structured. The individual executive remuneration arrangements reflect the complexity of the role, individual responsibilities, individual performance, experience and skills. 6.2 Short Term Incentive The STI is an annual "at risk" incentive payment. It rewards EMT members for their contribution towards the achievement of the Company's strategic goals. The maximum potential payment is calculated as a percentage of the TFR of each EMT member and is payable in cash and/or superannuation contributions. Payment is conditional upon the achievement, during the financial year under review, of financial and nonfinancial performance objectives. The measures are chosen and weighted to best align the individual s reward to the Key Performance Indicators (KPI s) of the Company and its overall long term performance. There is no fixed minimum payment amount. The KPI's are measures relating to Company and personal performance accountabilities and include financial, strategic, operational, cultural, risk management and customer/stakeholder engagement measures. Each year, the Group Remuneration Committee, in consultation with the Board, sets the KPI s for the Managing Director who, in turn sets KPI s for Executives, subject to approval of the Board following a recommendation from the Group Remuneration Committee. The Group Remuneration Committee selects 14
17 Directors Report performance objectives which provide a robust link between Executive reward and the key drivers of long term shareholder value. At the end of the financial year, the Managing Director assesses the performance of the Executives against their KPIs set at the beginning of the financial year. Based upon that assessment, a recommendation for each Executive is made to the Group Remuneration Committee as to the STI payment. At the end of the financial year, the Group Remuneration Committee assesses the performance of the Managing Director against the KPIs set at the beginning of the financial year. The Group Remuneration Committee recommends the STI payments to be made to the Managing Director and Executives for approval by the Board. Approval and payment of a STI to the Managing Director or Executives is at the complete discretion of the Board. If the results on which any STI reward was based are subsequently found by the Board to have been the subject of deliberate management misstatement, the Board may require repayment of the relevant STI, in addition to any other disciplinary actions. Current STI Offers Details of the STI's that affects the calculation of KMP remuneration for the 2016/17 financial year are set out in the following tables. During the financial year, KMP were paid their STI entitlement, as assessed, in respect of the 2015/16 financial year. Assessment and payment of STI bonuses in respect of the 2016/17 financial year was completed in August Details of the amounts paid and forfeited are set-out in the accompanying table. KEY MANAGEMENT PERSONNEL Max. % (of TFR) Max Payable 2015/2016 STI % Awarded % Forfeited Amount Paid $ % Which is not yet assessed for payment Melos Sulicich 50% $275, % 63.64% $100,000 0% Huw Bough 30% $96, % 47.92% $50,000 0% David Harradine 30% $106, % 43.66% $60,000 0% Mandakini Khanna (1) 30% $57, % 39.39% $35,000 0% Paul Moss 30% $87, % 66.40% $29,232 0% Aaron Pidgeon 15% $41, % 76.90% $9,529 0% Andrew Polson (1) 30% $41, % 67.40% $13,448 0% Chris Thornton 30% $96, % 58.33% $40,000 0% 1) Pro-rata Max Payable based on commencement date. 15
18 Directors Report KEY MANAGEMENT PERSONNEL Max. % (of TFR) Max Payable 2016/2017 STI % Awarded % Forfeited Amount Paid $ % Which is not yet assessed for payment Melos Sulicich 50% $287, % 80.50% $56,063 0% Huw Bough 30% $99, % 80.37% $19,438 0% Katherine Dean (1) 30% $34, % 51.83% $6,680 0% David Harradine 30% $111, % 82.31% $19,635 0% Mandakini Khanna 30% $99, % 78.40% $21,384 0% Jessica Kingston (1) 10% $7, % 64.08% $5,298 0% Paul Moss 30% $99, % 78.40% $21,384 0% Aaron Pidgeon (1) 15% $27, % 68.68% $8,500 0% Andrew Polson 30% $99, % 81.90% $17,919 0% Chris Thornton 30% $96, % 81.77% $17,497 0% 1) Pro-rata Max Payable based on commencement and cessation dates as applicable. 6.3 Executive Long Term Incentive Plan The ELTIP provides a long term "at risk" incentive, assessed over a three year performance period. It was established by the Board to reward the EMT, comprising the Managing Director and participating Executives, to have a greater involvement in the achievement of the Company's objectives. To achieve this aim, the ELTIP provides for the issue to the participating Executives of fully paid ordinary shares in the Company if performance criteria specified by the Board are satisfied in a set performance period. Under the ELTIP, an offer may be made to individual members of the EMT every year as determined by the Board. The maximum value of the offer is determined as a percentage of the TFR of each member of the EMT. As a general guide, noting that the Board has absolute discretion to vary, the maximum percentages used are 50% for the Managing Director and between 15% and 50% for participating Executives. The value of the offer is converted into fully paid ordinary shares based upon the weighted average price of the Company s shares over a twenty trading day period from the 1st of July. Where an Executive commences employment with the Company post 1 July in a given year, the following conditions will apply in respect of ELTIP: Upon recommendation by the Managing Director, and if deemed eligible by the Board, the Executive shall receive a pro rata offer for that year, unless that person commences employment between 1 April and 30 June, in which case, they shall not be entitled to receive an offer for that financial year; Calculations for ELTIP entitlements in terms of the 20 day VWAP, must be consistent with the offers for that year, irrespective of the date that an employee commences or to whom an offer to participate is made; Where an ELTIP participant ceases employment with MyState during a performance period due to expiration of a fixed term contract, the offer shall be assessed at the end of the performance period, along with all other participants, subject to meeting the 12 month employment hurdle that applies to any ELTIP offer. 16
19 Directors Report In order for the shares to vest, certain performance criteria must be satisfied within the predetermined performance period. Both the performance criteria and the performance period are set by the Board, at its absolute discretion. The Board has, for the time being, set the three financial years, commencing with the year in which an offer is made under the plan as the performance period with relative TSR and absolute ROE for the "2014" and "2015" offers or relative TSR and absolute post tax underlying ROE for the "2016" offer as the performance criteria. The ELTIP provides for an independent Trustee to acquire and hold shares on behalf of the participating Executives. The Trustee is funded by the Company to acquire shares, as directed by the Board, either by way of purchase from other shareholders on market, or issue by the Company. Vesting of shares occurs once an assessment has been made after the performance period (currently 3 years) and once the Board resolves to notify the Trustee to issue entitlements under the relevant ELTIP Offer. Where shares have vested, the Trustee will allocate those shares to each eligible member of the EMT in accordance with their entitlement. The Trustee will hold the shares which have been allocated on behalf of the eligible EMT member. During the period that allocated shares are held by the Trustee, the eligible EMT member is entitled to receive the income arising from dividend payments on those shares and to have the Trustee exercise the voting rights on those shares in accordance with their instructions. The participating EMT member cannot transfer or dispose of shares which have been allocated to them until the earlier of: The seventh anniversary of the original offer date of the grant; Upon leaving the employment of the Company; Upon the Board giving permission for a transfer or sale to occur; or Upon a specified event occurring, such as a change in control of the Company. Upon request, the Board may exercise discretion to release vested shares to an Executive to the extent required to meet a taxation assessment directly related to the award of those shares. On separation from the Company, ELTIP shares will be released only if the separation is due to a Qualifying Reason or is at the initiation of the Company without cause. Effective as of the 2014 ELTIP Offer, if this separation occurs within the three year performance period, shares will be allocated on a prorata basis, following the completion of each applicable performance period and applicable performance assessment. A Qualifying Reason, as defined by the ELTIP Plan Rules, is death, total and permanent disability, retirement at normal retirement age, redundancy or other such reason as the Board, in its absolute discretion, may determine. Vesting of shares to the Managing Director and eligible Executive is at the complete discretion of the Board. Any shares to be allocated to the Managing Director under this Plan require shareholder prior approval in accordance with ASX Listing Rules. On accepting an ELTIP offer made by the Company, participating Executives are required not to hedge their economic exposure to any allocated non-vested entitlement. Failure to comply with this directive will constitute a breach of duty and may result in forfeiture of the offer and/or dismissal. 17
20 Directors Report Current ELTIP Offers Details of offers made under the ELTIP to KMP that affect the calculation of their remuneration in this financial year are set out in the following table. Offer "2014" "2015" "2016" Performance period 1 July 2014 to 30 June July 2015 to 30 June July 2016 to 30 June 2019 Performance criteria Measure 50% TSR 50% TSR 50% Absolute Post tax ROE 50% Absolute Post tax underlying ROE The comparator group Members of the S&P/ASX300 Calculation of the reward Shares will vest in accordance with the following schedule Share price baseline for $4.67 $4.71 $4.00 TSR calculation Offer date - Managing Director 3 November November November Other eligible Executives Huw Bough (2) 20 April 2016 Huw Bough 27 November 2015 Huw Bough 5 September 2016 David Harradine (2) 20 April 2016 David Harradine 27 November 2015 Katherine Dean (2) 15 May 2017 Natasha Whish-Wilson 3 November 2014 Mandakini Khanna (2) 29 April 2016 David Harradine 5 September 2016 Paul Moss 27 November 2015 Mandakini Khanna 5 September 2016 Andrew Polson (2) 29 April 2016 Paul Moss 5 September 2016 Chris Thornton 27 November 2015 Andrew Polson 5 September 2016 Chris Thornton 5 September 2016 Share price used in Calculations $4.72 $4.71 $4.11 Value of offer (1) - Managing Director $275,000 $274,998 $287,500 - Other eligible Executives $209,100 $478,272 $691,455 1) The value of the offer is the maximum value calculated as at the date of offer to the KMP(s) at that time. As such, it may include the value of offers made to individuals who are no longer KMP's of the Company. 2) Pro-rata offer. 18
21 Directors Report Calculation of the Reward TSR Component For the 2014, 2015, 2016 and 2017 Offers, the ELTIP TSR component will vest on the following basis: MYS TSR relative to the ASX 300: Percentage of the applicable reward that will vest: Below the mid-point percentage: 0% At the Median ASX300 50% Between the median and 75%percentile Opportunity vests pro rata on a straight line basis between 50% and 100% Above the 75th percentile 100% No reward will be payable if performance is negative irrespective of the benchmark group performance. ROE Component The performance period for the ROE component for the ELTIP reward will be based upon on the Company's absolute post tax ROE ("2014" and "2015" offers) and on the company's absolute post tax underlying ROE (for the "2016" and 2017 offers) and will be payable on the following basis: MYS aggregate absolute post tax ROE for the three periods: Percentage of the applicable reward that will vest: For the 2014 and 2015 Offers: Below 32.22% 0% 32.22% 25% 32.22% to 33.25% increases on a straight line basis from 25% to 100% 33.25% or above 100% MYS aggregate absolute post tax underlying ROE for the three periods: Percentage of the applicable reward that will vest: For the 2016 and 2017 Offers: Below 31.80% 0% 31.80% 25% 31.80% to 33.50% increases on a straight line basis from 25% to 100% 33.50% or above 100% 19
22 Directors Report Actual and Potential ELTIP Share Allocations The following tables detail, for current and former KMP, the status of offers made under the ELTIP. The "2013" offer performance period was completed on 30 June 2016 and the 2014 offer performance period was completed on 30 June Name Component Maximum Offer Forfeited Vested in the 2016/17 Financial Year Not yet assessed for Vesting Number of Shares "2013" Offer Tim Rutherford TSR 24,951 24, Natasha Whish-Wilson TSR 20,707 20, "2014" Offer Melos Sulicich (1) TSR 29,132 13,634 15,498 - ROE 29,131 29, Huw Bough TSR 8,411 3,936 4,475 - ROE 8,410 8, David Harradine TSR 3,168 1,483 1,685 - ROE 3,167 3, Natasha Whish-Wilson TSR 10,574 10, ROE 10,572 10, ) 2017 share allocation for the Managing Director and Chief Executive Officer is subject to shareholder approval. The "2015", "2016" and "2017" offers have not been assessed for vesting and no shares have been forfeited. The following table shows the maximum number of shares available under each of these offers: "2015" Offer "2016" Offer "2017" Offer Name Component Number of Shares Melos Sulicich (1) TSR 29,193 34,976 29,307 ROE 29,193 34,975 29,307 Huw Bough TSR 10,191 12,044 10,092 ROE 10,191 12,044 10,092 Katherine Dean TSR - 4,192 9,786 ROE - 4,191 9,786 David Harradine TSR 11,306 13,504 11,315 ROE 11,305 13,503 11,315 Mandakini Khanna TSR 6,116 12,044 10,551 ROE 6,116 12,044 10,551 Paul Moss TSR 9,235 12,044 10,092 ROE 9,235 12,044 10,092 Andrew Polson TSR 3,733 12,044 10,092 ROE 3,733 12,044 10,092 Chris Thornton TSR 10,191 11,679 10,245 ROE 10,191 11,679 10,245 Colleen Harris TSR - - 9,714 ROE - - 9,714 1) 2017 offer for the Managing Director and Chief Executive Officer is subject to shareholder approval. 20
23 Directors Report 7. Remuneration of Key Management Personnel Salary & Fees $ Cash Bonus $ Non- Monetary Benefits (14) $ Post Employment Superannuation $ Termination Benefits $ Share Based Payment (3) $ Total (1), (2) $ Non-Executive Directors Miles Hampton , , , , , ,578 Peter Armstrong , , , , , ,008 Brian Bissaker (4) , , , , ,257 Robert Gordon , , , , , ,678 Colin Hollingsworth , , , , , ,502 Sibylle Krieger (5) , , , Stephen Lonie , , , , , ,515 Ian Mansbridge (6) , , ,164 Sarah Merridew (7) , , , , , ,808 Sub Total , , , , , ,510 21
24 Directors Report Executives Melos Sulicich Salary & Fees $ Cash Bonus $ Non- Monetary Benefits (14) $ Post Employment Superannuation $ Termination Benefits $ Share Based Payment (3) $ Total (1), (2) ,288 56,063-34, , , , ,000 3,849 34,999-47, ,145 $ Huw Bough ,246 19,438 24,663 32,861-33, , ,250 50,000 31,226 27,508-13, ,588 Katherine Dean (8) ,531 6, ,930-9, , Miles Farrow (9) , , ,135 David Harradine ,214 19,635 1,194 37,146-31, , ,042 60,000-30,689-4, ,436 Mandakini Khanna (10) ,370 21,384-34,992-19, , ,784 53,307-18,058-3, ,131 Jessica Kingston (11) ,566 5,298-6, , Paul Moss ,874 21,384 1,194 28,203-30, , ,632 29,232-25,160-6, ,012 Aaron Pidgeon (12) ,195 8, , , , ,825 9,529-24, ,063 Andrew Polson (13) ,370 17,919-29,797-16, , ,047 13,448-9,029-2, ,740 Chris Thornton ,281 17,497 52,052 30,952-32, , ,237 40,000 20,533 27,762-7, ,243 Sub Total ,734, ,798 80, , , ,407 3,815, ,319, ,516 55, ,210-86,503 3,033,493 Total ,439, ,798 80, , , ,407 4,673, ,994, ,516 55, ,316-86,503 3,859,003 22
25 Directors Report 1) The amounts disclosed for the remuneration of KMP are the cost to the Company for these components, as recorded by it in the financial year. These amounts have been calculated in accordance with relevant accounting policies and Accounting Standards. As these figures are based on accrual accounting and not a reflection of actual cash paid or shares vested, negative figures can result in the event of accrual reversals being recorded. Amounts stated are in respect of the period that the individual held a role of a KMP. 2) Approximately 40% of the maximum amount, in respect of the 2016/17 financial year STI offers, has been accrued on the basis that it is probable that the KMP will partially meet this proportion of their respective KPI s for the period. Any adjustments between the actual amounts to be paid, as determined by the Group Remuneration Committee and Board, and the amounts accrued will be disclosed in the Company's Remuneration Report and financial statements for the 2018 financial year. In addition, the disclosed amounts include satisfaction of prior year STI obligations. 3) Share based payment amounts have been calculated in accordance with the relevant accounting policy and Accounting Standard. The fair value of the share grant is calculated at the date of grant and is allocated to each reporting period evenly over the period from grant date to vesting date. This fair value will generally be different to the value of shares at the time they vest. The value disclosed is the portion of the fair value of the share grant allocated to this reporting period. These amounts represent share grants which will only vest to the KMP when certain performance and service criteria are met. In some circumstances all, or a portion, of the shares may never vest to the KMP. 4) Brian Bissaker commenced as a KMP on 1 May 2016 and ceased as KMP on 18 May ) Sibylle Krieger commenced as a KMP on 1 December ) Ian Mansbridge ceased as a KMP on 30 April ) Sarah Merridew ceased as a KMP on 18 May ) Katherine Dean commenced as a KMP on 20 February ) Miles Farrow ceased as a KMP on 30 November ) Mandakini Khanna commenced as a KMP on 1 December ) Jessica Kingston commenced as a KMP on 22 February ) Aaron Pidgeon ceased as a KMP on 22 February The termination benefit amount shown Includes annual and long service leave entitlements paid on cessation. 13) Mr Polson commenced as KMP on 22 February ) Non-Monetary Benefits consist of car parking expense, travel & accommodation and entertainment. 23
26 Directors Report 8. Shareholdings of Key Management Personnel Non Executive Director Minimum Shareholding Requirement From 1 January 2015, a Minimum Shareholding Requirement (MSR) has been implemented for all Non Executive Directors. Non Executive Directors, in the absence of approval from the Board to the contrary, are required to acquire and maintain, directly or indirectly, shares in MyState Limited to the equivalent of one year s pre-tax base Director s fee. The MSR must be achieved within four years of their appointment or the date of implementation of this policy, whichever is the latter. Executive Minimum Shareholding Requirement From 1 January 2015, in the absence of approval from the Board to the contrary, a Minimum Shareholding Requirement (MSR) will apply to Executives whom: 1. Receive a Total Fixed Reward(TFR) greater or equal to $250,000; and 2. Participate in ELTIP and STI programs. The MSR will be 25% of TFR and must be achieved within 4 years of the date that the policy becomes applicable to the Executive. The shares in MyState Limited (ASX code: MYS) may be held directly or indirectly, and may include shares obtained prior to 1 January 2015 and/or shares acquired through ELTIP or any other scheme, where this includes shares vested and allocated but still held in trust, but excludes any allocated shares which have not yet vested. Details regarding the holdings by KMP and their related parties of ordinary shares in the Company are set out in the following table. Related parties include close members of the family of the KMP. It also includes entities under joint or several control or significant influence of the KMP and their close family members. No equity transactions with KMP, other than those arising as payment for compensation, have been entered into with the Company. Balance at commencement of financial year Granted as compensation Net change other Balance at end of financial year Balance at end of financial year held by ELTIP trustee Non-Executive Directors Miles Hampton 612,568-37, ,000 - Peter Armstrong 8,028-2,685 10,713 - Robert Gordon 14,387-6,000 20,387 - Colin Hollingsworth 20,274-5,000 25,274 - Sibylle Krieger (1) - - 5,000 5,000 - Stephen Lonie 51,795-1,704 53,499 - Sub Total 707,052-57, ,873-1) Appointed as KMP on 1 December
27 Directors Report Executives Balance at commencement of financial year Granted as compensation Net change other Balance at end of financial year Balance at end of financial year held by ELTIP trustee Melos Sulicich 35,000-7,100 42,100 - Huw Bough Katherine Dean (1) David Harradine 2, ,000 - Mandakini Khanna Paul Moss Andrew Polson Chris Thornton Sub Total 37,000-7,100 44,100 - Total 744,052-64, ,973-1) Appointed as KMP on 20 February Loans to Key Management Personnel There are no loans guaranteed or secured by the Company to KMP and their related parties in Related parties include close members of the family of the KMP. It also includes entities under joint or several control or significant influence of the KMP and their close family members. 25
28 Directors Report 10. Contract Terms and Conditions The Managing Director and Executives are employed under individual employment agreements. Incumbent Commenced in role Contract term Total Fixed Reward (TFR) (per year and subject to market based review mechanisms) Short Term Incentive (maximum) ELTIP (maximum) Termination Provisions In the event of termination by the Company (subject to shareholder approval in the event that they exceed the equivalent of 1 year TFR in total) Melos Sulicich 1 July Year term from 1 July $575,000 50% of TFR 50% of TFR Notice The contract may be terminated by the Company with 6 months notice or payment in lieu of notice. Entitlement Share Ownership Required to purchase and maintain shares to the value of 50% of TFR by 30 th June Huw Bough 13 August 2014 Ongoing $330,000 30% of TFR Katherine Dean David Harradine 22 February 2017 Ongoing $320, March 2015 Ongoing $370,000 Colleen Harris 25 July 2017 Ongoing $340,000 Paul Moss 13 May 2015 Ongoing $330,000 Mandakini Khanna Chris Thornton Andrew Polson 1 December 2015 Ongoing $345, April 2015 Ongoing $335, February 2016 Ongoing $330,000 Between 15% and 30% of TFR upon invitation to participate Notice Pro-rata STI payment applied, at the full discretion of the Board, as at the date of termination. Pro-rata ELTIP allocation, made following the completion of the applicable performance periods. The contract can be terminated by the Company upon provision of 3 months notice. Entitlement Payment of the equivalent of 6 months TFR. Pro-rata STI payment applied as at the date of termination. Payment of STI if the performance period is complete but not yet paid Pro-rata ELTIP allocation, made following the completion of the applicable performance periods. Jessica 22 February 2017 Temporary Kingston (1) / Acting $226,887 (includes Higher Duties Allowance) 10% N/A The contract can be terminated by the Company, under the provisions of the MyState Limited Enterprise Agreement , upon provision of 4 weeks notice plus redundancy entitlements (currently 18 weeks). 26
29 Directors Report Signed in accordance with a resolution of the Directors. M L Hampton Chairman M A Sulicich Managing Director Hobart Dated this 18 August

30 Consolidated Financial Statements For the year ended 30 June 2017
31 TABLE OF CONTENTS # Consolidated Income Statement 3 Consolidated Statement of Comprehensive Income 4 Consolidated Statement of Financial Position 5 Consolidated Statement of Changes in Equity 6 Consolidated Statement of Cash Flows 7 Section 1. Corporate information and basis of accounting 1.1 Reporting entity Basis of accounting Use of estimates and judgements Provisions (other than for impairment of financial assets) 9 Section 2. Financial performance 2.1 Income from banking activities Income from wealth management activities Income from other activities Expenses Earnings per share Dividends Segment financial information 14 Section 3. Capital and financial risk management 3.1 Capital management strategy Financial risk management Average balance sheet and sources of net interest income 24 Section 4. Financial assets and liabilities 4.1 Cash and liquid assets Financial instruments Loans and advances Transfer of financial assets (securitisation program) Deposits and other borrowings including subordinated notes Fair value of financial instruments 30 Section 5. Non-financial assets, liabilities and equity 5.1 Property, plant and equipment Intangible assets and goodwill Employee benefit provisions Share capital 37 Section 6. Income tax expense, current and deferred tax balances 6.1 Income tax expense, current and deferred tax balances 38 Section 7. Group structure and related parties 7.1 Parent entity information Controlled entities and principles of consolidation Related party disclosures 44 Section 8. Other notes 8.1 Contingent liabilities and expenditure commitments Remuneration of auditors Events subsequent to balance date Other significant accounting policies and new accounting standards 47
32 Consolidated Income Statement for the year ended 30 June Jun Jun 16 Notes $ '000 $ '000 Interest income , ,351 Less: Interest expense 2.1 (94,088) (94,441) Net interest income 88,132 88,910 Non-interest income from banking activities ,360 16,879 Net banking operating income 106, ,789 Income from wealth management activities ,738 17,462 Profit from sale of other investments 2.3 1,362 - Income from other activities Total operating income 124, ,422 Less: Expenses Personnel costs 38,069 36,995 Administration costs ,874 17,887 Significant due dilligence project costs 1,279 1,752 Impairment - software - 1,350 Technology costs ,838 9,513 Occupancy costs 2.4 6,930 6,748 Marketing costs 3,542 4,056 Governance costs 2,633 2,810 Total operating expenses 82,165 81,111 Profit before bad and doubtful debts and income tax expense 42,451 42,311 Less: Impairment expense on loans and advances ,221 Profit before income tax 42,238 41,090 Income tax expense ,158 12,756 Profit for the year 30,080 28,334 Profit attributable to the: Equity holders of MyState Limited 30,080 28,334 Basic earnings per share (cents per share) Diluted earnings per share (cents per share) The accompanying notes form part of these financial statements. 3
33 Consolidated Statement of Comprehensive Income for the year ended 30 June Jun Jun 16 Notes $ '000 $ '000 Profit for the year 30,080 28,334 Other comprehensive income Items that may be reclassified subsequently to profit or loss Cash flow hedges: Net gains / (losses) taken to equity (289) 587 Change in fair value of financial assets at fair value through other comprehensive income (619) 619 Income tax effect 272 (363) Total other comprehensive income for the year (636) 843 Total comprehensive income for the year 29,444 29,177 Total comprehensive income for the year is attributable to: Equity holders of MyState Limited 29,444 29,177 The accompanying notes form part of these financial statements. 4
34 Consolidated Statement of Financial Position as at 30 June 2017 Notes 30 Jun Jun 16 $ '000 $ '000 Assets Cash and liquid assets ,226 80,126 Due from other financial institutions 35,161 17,875 Other assets 6,577 5,819 Financial instruments , ,992 Loans and advances 4.3 4,282,525 3,863,133 Property, plant and equipment 5.1 8,296 9,812 Deferred tax assets 6.1 4,718 3,664 Intangible assets and goodwill ,179 78,982 Total assets 4,910,451 4,415,403 Liabilities Due to other financial institutions 34,319 30,710 Other liabilities 6,801 6,961 Deposits and other borrowings including subordinated notes 4.5 4,548,966 4,068,182 Employee benefit provisions 5.3 5,370 5,515 Tax liabilities 6.1 4,091 4,407 Total liabilities 4,599,547 4,115,775 Net assets 310, ,628 Equity Share capital , ,756 Retained earnings 164, ,320 Reserves 5,197 5,552 Total equity 310, ,628 The accompanying notes form part of these financial statements. 5
35 Consolidated Statement of Changes in Equity for the financial year ended 30 June 2017 Share capital Retained earnings General reserve for credit losses Employee equity benefits reserve Hedging reserve Net unrealised gains reserve Note $ '000 $ '000 $ '000 $ '000 $ '000 $ '000 $ '000 Total At 1 July , ,872 4, (394) - 293,140 Profit for the year - 28, ,334 Other comprehensive income Total comprehensive income for the year - 28, ,177 Equity issued under employee share scheme Equity issued under executive long term incentive plan (46) Equity issued under dividend reinvestment plan 5.4 1, ,941 Share based payment expense recognised Dividends paid (24,886) (24,886) At 30 June , ,320 4, ,628 At 1 July , ,320 4, ,628 Profit for the year - 30, ,080 Other comprehensive income (203) (433) (636) Total comprehensive income for the year - 30, (203) (433) 29,444 Equity issued under employee share scheme Equity issued under executive long term incentive plan Equity issued under dividend reinvestment plan 5.4 6, ,513 Share based payment expense recognised Dividends paid (25,042) (25,042) At 30 June , ,358 4, (187) - 310,904 The accompanying notes form part of these financial statements. 6
36 Consolidated Statement of Cash Flows for the financial year ended 30 June 2017 Notes 30 Jun Jun 16 $ '000 $ '000 Cash flows from operating activities Interest received 190, ,242 Interest paid (94,283) (95,396) Fees and commissions received 33,457 33,613 Dividends received Other non-interest income received 774 2,066 Payments to suppliers and employees (76,855) (71,011) Income tax paid (13,157) (16,429) Net cash flows from / (used in) operating activities ,628 42,163 Cash flows from investing activities Purchase of intangible assets (12,166) (4,116) Proceeds from sale of property, plant and equipment Purchase of property, plant and equipment (714) (499) Net decrease / (increase) in loans to customers (428,054) (319,794) Net increase / (decrease) in amounts due from other financial institutions (86,066) (3,514) Proceeds from sale of other investments 3,857 - Payments for other investments 168 (3,470) Net cash flows from / (used in) investing activities (522,960) (331,356) Cash flows from financing activities Employee share issue Dividends paid net of dividend reinvestment plan 2.6 (18,629) (22,945) Net increase in subordinated notes 10,032 24,663 Net (decrease) / increase in deposits and other borrowings 289, ,979 Net increase / (decrease) in due to other financial institutions 185,180 75,338 Net cash flows used in financing activities 466, ,134 Net (decrease) / increase in cash held (15,900) 13,941 Cash at beginning of financial year 80,126 66,185 Closing cash carried forward ,226 80,126 The accompanying notes form part of these financial statements. 7
37 Notes to the consolidated financial statements for the year ended 30 June Reporting entity MyState Limited (the Company) is incorporated and domiciled in Australia and is a company limited by shares that are publicly traded on the Australian Securities Exchange. The consolidated financial statements of MyState Limited and its subsidiaries (the Group) were authorised for issue by the Directors on 18 August Basis of accounting These consolidated financial statements are general purpose financial statements which have been prepared in accordance with the Corporations Act 2001, Accounting Standards and Interpretations, and other requirements of the law. Compliance with Australian Accounting Standards ensures that the financial statements and notes of the Company and the Group comply with International Financial Reporting Standards (IFRS). The financial statements comprise the consolidated financial statements of the Group. For the purpose of preparing the consolidated financial statements, the Company is a for-profit entity. Where necessary, comparatives figures have been re-classified and re-positioned for consistency with current period disclosures. Early Adoption of AASB 9 Financial Instruments (2010) Under s. 334(5) of the Corporations Act 2001, the Directors have elected to apply Accounting Standard AASB 9 'Financial Instruments' for the financial year beginning 1 July 2014, even though the standard is not required to be applied until annual reporting periods beginning on or after 1 January In accordance with the transition requirements of these provisions, comparatives were restated in the 2015 financial statements. The Held to Maturity (HTM) and Available for Sale (AFS) asset categories have been removed. Financial assets previously classified as "Available for sale" are contained within "Financial instruments" and detailed in the note as each instrument type. These instruments, when classified as "available for sale", were initially measured at cost and subsequently measured at fair value through other comprehensive income. They are now carried at amortised cost. This change has resulted in the reversal of the fair value gains related to these instruments that had been previously recognised in the Unrealised Gains Reserve in the Consolidated Statement of Comprehensive Income. The classification and measurement of other financial assets and liabilities is unchanged. The consolidated financial statements have been prepared on the basis of historical cost, except for certain properties and financial instruments that are measured at revalued amounts or fair values at the end of each reporting period, as explained in the accounting policies. The following transactions are exceptions to these described methods of determining fair values: Share-based payment transactions that are within the scope of AASB 2; and Leasing transactions that are within the scope of AASB 117. Rounding of amounts The company is a company of the kind referred to in Australian Securities and Investments Commission (ASIC) Class Order 2016/191, and, in accordance with that Class Order, amounts in the financial report are rounded off to the nearest thousand dollars, unless otherwise indicated. All amounts are presented in Australian dollars. SECTION 1: Corporate information and basis of accounting 8
38 1.3 Use of estimates and judgement MyState Limited Notes to the consolidated financial statements for the year ended 30 June 2017 The preparation of the financial report in conformity with Australian Accounting Standards requires the use of certain critical accounting estimates. It also requires management to exercise judgment in the process of applying the accounting policies. The notes to the financial statements set out areas involving a higher degree of judgment or complexity, or areas where assumptions are significant to the financial report such as: Recoverability of deferred tax assets, refer note 6.1; Impairment losses on loans and advances, refer note 4.3; Fair value of financial instruments, refer note 4.6; and Impairment assessment of intangibles and goodwill, refer note Provisions (other than for impairment of financial assets) Provisions are recognised when the Group has a legal, equitable or constructive obligation to make a future sacrifice of economic benefits to other entities as a result of past transactions or other past events and it is probable that a future sacrifice of economic benefits will be required and a reliable estimate can be made of the amount of the obligation. SECTION 1: Corporate information and basis of accounting 9
39 Notes to the consolidated financial statements for the year ended 30 June Income from banking activities 30 Jun Jun 16 $ '000 $ '000 Interest income Loans and advances 172, ,278 Investment securities 10,057 11,073 Total interest income 182, ,351 Interest expense At call deposits 11,161 12,405 Fixed term deposits 82,927 82,036 Total interest expense 94,088 94,441 Non-interest income from banking activities Transaction fees 7,776 7,985 Loan fee income 5,100 4,552 Banking commissions 3,797 3,315 Other banking operations income 1,687 1,027 Total non-interest income from banking activities 18,360 16,879 Income accounting policy Income is recognised to the extent that it is probable that the economic benefits will flow to the entity and the income can be reliably measured. The following specific recognition criteria must also be met before income is recognised. Interest, fees and commissions Control of a right to receive consideration for the provision of, or investment in, assets has been attained. Interest, fees and commission revenue is brought to account on an accrual basis. Interest income is accrued using the effective interest rate method, which is the rate that exactly discounts estimated future cash receipts through the expected life of the financial instrument. Loan origination fees Loan origination fees are recognised as components of the calculation of the effective interest rate method in relation to originated loans. They, therefore, affect the interest recognised in relation to this portfolio of loans. The average life of loans in the relevant loan portfolios is reviewed annually to ensure the amortisation methodology for loan origination fees is appropriate. SECTION 2: Financial performance 10
40 Notes to the consolidated financial statements for the year ended 30 June Income from wealth management activities 30 Jun Jun 16 $ '000 $ '000 Funds management income 9,456 9,272 Other fees and commissions 7,282 8,190 Total Income from wealth management activities 16,738 17,462 Funds management income and fiduciary activities Tasmanian Perpetual Trustees Limited, a controlled entity of the Group, acts as Responsible Entity, Trustee and Funds Manager for ten managed investment schemes. The investment schemes place monies with external wholesale fund managers, direct mortgages and mortgaged backed securities, term deposits and other investments. The clients include individual, superannuation and corporate investors. The assets and liabilities of these funds are not included in the Consolidated Financial Statements. Income earned by the Group in respect of these activities are included in the Consolidated Income Statement of the Group as "Funds management income". The following table shows the balance of the unconsolidated funds under management and funds under advice that gives rise to funds management and other fees and commissions income respectively: 30 Jun Jun 16 $ 'M $ 'M Funds under management 1,089 1,008 Funds under advice Other fees and commissions Tasmanian Perpetual Trustees Pty Ltd provides financial planning, private client tax accounting services and acts as trustee and executor of estates. "Other fees and commissions income" is the income earned from these activities. Income accounting policy Funds management income and other fees and commissions income is brought to account on an accrual basis to the extent that: It is probable that the economic benefits will flow to the entity; The revenue can be reliably measured; and Control of a right to receive consideration for the provision of, or investment in, assets has been attained. SECTION 2: Financial performance 11
41 Notes to the consolidated financial statements for the year ended 30 June Income from other activities 30 Jun Jun 16 $ '000 $ '000 Profit from sale of other investments 1,362 - In 2017, Tasmanian Perpetual Trustees Limited disposed of its investment in listed shares. The carrying value of these shares at the date of disposal was $3.84M. Dividends from other corporations Profit on sale of property plant and equipment assets 9 23 Total income from other activities Dividend accounting policy Dividends are recorded as income when the right to receive the dividend is established. 2.4 Expenses The following items are included within each item of specified expenses: Occupancy costs include: Operating lease payments 4,117 3,925 Depreciation - leasehold improvements 1,548 1,591 Technology costs include: Amortisation - computer software 2,167 1,964 Administration costs Amortisation - other intangibles Depreciation - furniture and equipment Expense accounting policy Operating lease expense Leases are classified at their inception as either operating or finance leases based on the economic substance of the agreement, to reflect the risks and benefits incidental to ownership. The minimum lease payments of operating leases, where the lessor effectively retains substantially all of the risks and benefits of ownership of the leased item, are recognised as an expense on a straight-line basis in the Consolidated Income Statement over the life of the lease. Depreciation and amortisation expense The Group adopts the straight line method of depreciating property, plant and equipment and amortising intangible assets over the estimated useful lives commencing from the time the asset is held ready for use. Leasehold improvements are depreciated over the shorter of either the unexpired expected term of the lease or the estimated useful life of the improvements. Estimated useful lives are: Buildings 40 years. Office furniture, fittings & equipment 4-7 years. Building fit-out (owned buildings) 4-15 years. Computer hardware 3 years. Software 3-10 years. SECTION 2: Financial performance 12
42 Notes to the consolidated financial statements for the year ended 30 June Earnings per share 30 Jun Jun 16 cents cents Basic earnings per share Diluted earnings per share Earnings per share accounting policy Basic earnings per share is calculated by dividing the Group's profit attributable to ordinary equity holders by the weighted average number of ordinary shares outstanding during the financial year. Diluted earnings per share is calculated by dividing the Group's profit attributable to ordinary equity holders by the weighted average number of ordinary shares that would be issued on the exchange of all the dilutive potential ordinary shares into ordinary shares. The following table details the income and weighted average number of shares used in the calculation of basic and diluted earnings per share: 30 Jun Jun 16 $' 000 $' 000 Profit for the year 30,080 28,334 Number Number Weighted average number of ordinary shares used in calculating basic and diluted earnings per share 88,355,988 87,463, Dividends Date of payment 30 Jun Jun 16 $ '000 $ '000 Dividends paid 2015 Final dividend paid cents per share 2 Oct , Interim dividend paid cents per share 24 Mar , Final dividend paid cents per share 3 Oct , Interim dividend paid cents per share 10 Mar ,302-25,042 24,886 The dividends paid during the year were fully franked at the 30 per cent corporate tax rate. SECTION 2: Financial performance 13
43 Notes to the consolidated financial statements for the year ended 30 June Dividends (continued) 30 Jun Jun 16 $ '000 $ '000 Franking credit balance The amount of franking credits available for the subsequent financial year are: Franking account balance as at the end of the period at 30% (2016: 30%) 61,797 59,370 Franking credits that will arise from the payment of income tax payable at the end of the period 837 1,839 Dividends not recognised at the end of the financial year On 18 August 2017, the Directors resolved to pay a final dividend for the 2017 financial year of 14.5 cents per share or $12.97m total to be paid on the 13th of September 2017, fully franked at the 30 per cent corporate tax rate. This dividend has not been brought to account as the amount had not been determined at the reporting date. This dividend will reduce the balance of the franking account by $5.56m. 2.7 Segment financial information Operations of reportable segments The Group has identified two operating divisions and a corporate division which are its reportable segments. These divisions offer different products and services and are managed separately. The Group's management committee review internal management reports for each of these divisions at least monthly. Banking division The banking division's product offerings include lending; encompassing home loans, personal, overdraft, line of credit and commercial products, transactional savings accounts and fixed term deposits and insurance products. It delivers these products and services through its branch network, digital channels and third party channels. The banking division is conducted by the MyState Bank Group. Prior to 30 September 2015, the Rock Building Society Group formed part of this group and was a second ADI. On the 30th of September 2015, the rights and obligations of the Rock Building Society Group were transferred to MyState Bank Limited and, as a result, the banking group is now comprised of one ADI and its subsidiaries. Wealth management division The wealth management division is a provider of funds management, financial planning and trustee services. It operates predominantly within Tasmania. It holds $1 billion in funds under management on behalf of personal, business and wholesale investors as the responsible entity for 10 managed investment schemes. The wealth management division is conducted by Tasmanian Perpetual Trustees Limited. Tasmanian Perpetual Trustees Limited is a trustee company licensed within the meaning of Chapter 5D of the Corporations Act 2001 and is the only private trustee company with significant operations in Tasmania. Corporate and consolidation division The corporate cost centre is responsible for the governance of the Group. The corporate cost centre charges the operating divisions on a cost recovery basis for costs it has incurred. This division is also where eliminations are shown between the banking division and the wealth management division. SECTION 2: Financial performance 14
44 Notes to the consolidated financial statements for the year ended 30 June Segment financial information (continued) Corporate Banking Business Wealth Management and Consolidation Total $' 000 $' 000 $' 000 $' 000 Year ended 30 June 2017 Interest income 181, ,220 Interest expense (94,088) - - (94,088) Other income Transaction fees 7, ,776 Loan fee income 5, ,100 Banking commissions 3, ,797 Other banking operations income 1,821 - (134) 1,687 Funds management income - 9,456-9,456 Other wealth management fees and commissions - 7,282-7,282 Profit from sale of other investments - 1,387-1,387 Income from other activities 24 - (25) (1) Total operating income 106,305 18, ,616 Expenses Personnel costs 25,565 7,336 5,168 38,069 Administration costs 23,158 4,022 (7,027) 20,153 Technology costs 10, ,838 Occupancy costs 5, ,930 Marketing costs 3, ,542 Governance costs ,071 2,633 Impairment expense on loans and advances Income tax expense 11,038 1,624 (504) 12,158 Segment profit for the year 26,269 3,815 (4) 30,080 Segment balance sheet information Segment assets 4,834,688 25,385 50,378 4,910,451 Segment liabilities 4,596,089 2, ,599,547 Banking Wealth Management Corporate and Consolidation Total $' 000 $' 000 $' 000 $' 000 Year ended 30 June 2016 Interest income 182, ,351 Interest expense (94,441) - - (94,441) Other income Transaction fees 7, ,985 Loan fee income 4, ,552 Banking commissions 3, ,315 Other banking operations income 1, (149) 1,027 Funds management income - 9,272-9,272 Other Wealth Management fees and commissions - 8,190-8,190 Income from other activities (2) 171 Total operating income 105,657 17, ,422 Expenses Personnel costs 25,990 6,925 4,080 36,995 Administration costs 23,403 3,926 (6,340) 20,989 Technology costs 8, ,513 Occupancy costs 5, ,748 Marketing costs 3, ,056 Governance costs ,148 2,810 Impairment expense on loans and advances 1, ,221 Income tax expense 10,644 1, ,756 Segment profit for the year 25,282 3,777 (725) 28,334 Segment balance sheet information Segment assets 4,335,161 28,036 52,206 4,415,403 Segment liabilities 4,110,774 2,378 2,623 4,115,775 SECTION 2: Financial performance 15
45 Notes to the consolidated financial statements for the year ended 30 June Capital management strategy The Group's capital management strategy is to adhere to regulatory requirements and maximise shareholder value through optimising the level and use of capital resources, whilst also providing the flexibility to take advantage of opportunities as they may arise. The Group's capital management objectives are to: Continue to support MyState Bank Limited s credit ratings; Ensure sufficient capital resource to support the Group's business and operational requirements; Maintain sufficient capital to exceed prudential capital requirements; and Safeguard the Group's ability to continue as a going concern. The Group's capital management policy covers both internal and external capital threshold requirements. Regulatory capital requirements are measured at two levels: Level 1 The authorised deposit taking institution (ADI's), MyState Bank Limited. Level 2 The wider MyState Limited prudential group which comprises MyState Limited (nonoperating holding company), MyState Bank and Connect Asset Management (the Securitisation program Manager). These two regulatory levels exclude certain securitisation vehicles and also exclude Tasmanian Perpetual Trustees Limited. The Australian Prudential Regulatory Authority (APRA) requires ADI's to have a minimum ratio of capital to risk weighted assets of 8 percent at both level 1 and level 2, with at least 4.5 percent of this capital in the form of tier 1 capital. In addition, APRA imposes ADI specific minimum capital ratios which may be higher than these levels. The Group has complied with the regulatory minimum capital requirements at all times during the year. The Group's capital management policy, set by the Board, requires capital floors above this regulatory required level. The Group has developed a detailed Internal Capital Adequacy Assessment Plan (ICAAP). This plan covers the capital requirements of the Regulated Groups (level 1 and level 2 as described previously) and Tasmanian Perpetual Trustees. The ICAAP aims to ensure that adequate planning activities take place so that the Group is efficiently capitalised to a level also satisfactory to regulators. The ICAAP caters for all known financial events, dividend policy, capital raisings and securitisation. SECTION 3: Capital and financial risk management 16
46 Notes to the consolidated financial statements for the year ended 30 June Capital management strategy (continued) The Board has currently set a minimum total capital adequacy ratio of 12.5%. Capital adequacy, at year end, of the level 2 regulatory group, which includes MyState Limited, MyState Bank Limited and Connect Asset Management Pty Ltd is detailed in the following table: 30 Jun Jun 16 $ '000 $ '000 Qualifying capital Common equity tier 1 capital Paid-up ordinary share capital 141, ,756 Retained earnings 177, ,298 Reserves excluding general reserve for credit losses Total common equity tier 1 capital 320, ,729 Regulatory adjustments Deferred expenditure including deferred tax assets 24,270 26,622 Goodwill and intangibles 49,760 49,760 Other deductions 53,141 47,730 Total regulatory adjustments 127, ,112 Net common equity tier 1 capital 192, ,617 Tier 2 capital Subordinated notes (1) 29,944 21,467 General reserve for credit losses 4,428 4,428 Total capital 227, ,512 Risk weighted assets 1,710,329 1,606,911 Capital adequacy ratio 13.29% 13.04% (1) On the 14 August 2015, the Group issued $25 million of floating rate subordinated notes ( notes ). The issuer was MyState Bank Limited. The notes have a term of 10 years, maturing 14 August 2025, and pay interest quarterly at a floating rate equal to the three-month BBSW plus a margin of 5% per annum. The issuer has the option to redeem all or some of the notes on 14 August 2020 and each quarterly interest payment date thereafter, and for certain regulatory events (in each case subject to APRA s prior written approval). On the 28th September 2016, the Group issued $10 million of floating rate subordinated notes ( notes ). The issuer was MyState Bank Limited. The notes have a term of 10 years, maturing 26 September 2026, and pay interest quarterly at a floating rate equal to the three-month BBSW plus a margin of 4.25% per annum. The issuer has the option to redeem all or some of the notes on 28 September 2021 and each quarterly interest payment date thereafter, and for certain regulatory events (in each case subject to APRA s prior written approval). If APRA notifies the issuer that a non-viability trigger event has occurred, the notes will be converted into ordinary shares of MyState Limited, or written-off. The amount included in the Level 2 Group s regulatory capital is a percentage equal to that of external interest in the Group's regulatory capital. MyState Bank Limited includes 100% at level 1 in its Tier 2 Capital. SECTION 3: Capital and financial risk management 17
47 Notes to the consolidated financial statements for the year ended 30 June Financial risk management Risk management is an integral part of the Group's business processes. The Board sets policy to mitigate risks and ensure the risk management framework is appropriate, to direct the way in which the Group conducts business. Promulgated Board approved policies ensure compliance throughout the business, which are monitored by way of a dedicated compliance system. Risk management plans exist for all documented risks within the Group and these plans are reviewed regularly by the Executive Management Team, the Group Risk Committee and the Board. Business units are accountable for risks in their area and are responsible for ensuring the appropriate assessment and management of these risks. Risk exposure profile The Group actively monitors a range of risks, which are not limited to, but include the following: - Credit risk, - Market risk; and - Liquidity risk Credit risk Approach to credit risk management Credit risk arises within the Group's lending and treasury investment activities and is the risk that a counterparty may fail to complete its contractual obligations when they fall due. The Group's approach to managing this risk is to separate prudential control from operational management by assigning responsibility for approval of credit exposures to specific individuals and management committees. The Group Risk Committee has oversight of credit risk exposures and the Risk and Credit Committee monitors credit related activities through regular reporting processes, including monitoring large exposure to single groups and counterparties. The roles of funding and oversight of credit are separate. Board approved lending policies guide the processes for all loan approvals by subsidiary operations. All loans over a designated amount, whether within delegated limits or not, are reported to the Group Risk Committee on a regular basis. Any loan outside of delegated limits must be approved by the Board prior to funding. Maximum exposure to credit risk The amounts disclosed in the following table are the maximum exposure to credit risk, before taking account of any collateral held or other credit enhancements. For financial assets recognised on the Balance Sheet, the exposure to credit risk equals their carrying amount. For customer commitments, the maximum exposure to credit risk is the full amount of the committed facility as at the reporting date. 30 Jun Jun 16 $ '000 $ '000 Cash and liquid assets 64,226 80,126 Due from other financial institutions 35,161 17,875 Other assets 6,577 5,819 Financial instruments 420, , , ,812 Loans and advances 4,282,525 3,863,133 Customer commitments (1) 117, ,651 Maximum exposure to credit risk 4,926,730 4,450,596 (1) For further information regarding these commitments, refer to note 8.1. SECTION 3: Capital and financial risk management 18
48 Notes to the consolidated financial statements for the year ended 30 June Financial risk management (continued) The credit quality of financial assets has been determined based on Standard and Poor's credit ratings for financial assets other than loans and advances at amortised cost. For loans and advances at amortised cost, the assets identified as being "closely monitored" are those assets that are greater than 30 days past due. Credit quality of financial assets 30 Jun Jun 16 $ '000 $ '000 Financial assets other than loans and advances at amortised cost Equivalent S&P rating A+ and above 263, ,394 Equivalent S&P rating A- and below 263, ,935 Loans and advances at amortised cost New Facilities - not closely monitored 1,271, ,586 New Facilities - closely monitored 730 2,416 Continuing facilities - not closely monitored 2,990,147 2,845,401 Continuing facilities - closely monitored 19,944 21,730 Total on balance sheet exposure to credit risk 4,809,258 4,323,462 New facilities are loans that have been funded within the financial year. Neither past due or impaired 4,260,413 3,839,166 Past due but not impaired - loans and advances at amortised cost 31 to 60 days 5,402 10, to 90 days 4,560 2,526 More than 90 days 10,577 7,912 Total past due but not impaired 20,539 20,876 Impaired - loans and advances at amortised cost 1,573 3,091 Maximum exposure to credit risk 4,282,525 3,863,133 Estimate of collateral held against past due but not impaired assets 35,119 38,260 Estimate of collateral held against impaired assets 2,360 2,294 Estimate of collateral held The Group holds collateral against loans and advances to customers in the form of a mortgage charge over property. To mitigate credit risk, the bank (ADI) can take possession of the security held against the loans and advances as a result of customer default. The collateral shown above is an estimate of the value of collateral held, it is not practicable to determine the fair value. SECTION 3: Capital and financial risk management 19
49 Notes to the consolidated financial statements for the year ended 30 June Financial risk management (continued) Credit quality is impacted by concentration risk created by the ensuing vulnerability of assets to similar conditions such as economic or political factors. The Group monitors the geographical diversification of its loans and advances. An analysis of this concentration of credit risk at the reporting date is shown in the following table: 30 Jun Jun 16 $ '000 $ '000 Tasmania 2,181,829 2,215,395 Victoria 556, ,442 New South Wales 762, ,812 Queensland 614, ,366 Western Australia 84,366 93,839 Australian Capital Territory 39,869 34,958 Northern Territory 2,434 3,064 South Australia 41,615 43,315 Gross loans and advances at amortised cost 4,283,482 3,864,191 There are no loans that individually represent 10% or more of shareholders' equity Market risk Managing market risk Market risk is the exposure to adverse changes in the value of the Group's portfolio as a result of changes in market prices or volatility. The Group is exposed primarily to interest rate risk. Interest rate risk exposure The operations of the ADI is subject to the risk of interest rate fluctuations as a result of mismatches in the timing of the repricing of interest rate on their assets and liabilities. Value at Risk (VaR) The following table indicates the VaR based on historical data. The Group estimates VaR as the potential loss in earnings from adverse market movements over a 20 day holding period to a 99% confidence level. VaR takes account of all material market variables that may cause a change in the value of the loan portfolio. Although an important tool for the measurement of market risk, the assumptions underlying the model are limited to reliance on historical data. Value at risk based on historic data Net profit after tax higher/(lower) 30 Jun Jun 16 $ '000 $ '000 Average 2,326 2,120 Minimum 1,455 1,370 Maximum 3,444 3,110 Derivatives The Group is exposed to changes in interest rates. The only derivative instruments currently entered into by the Group are interest rate swaps. The Group protects its portfolio of fixed rate loans, and exposure to variable rate debt obligations, by paying fixed rates to swap providers and receiving variable rates in return. The variable receipts mitigate the exposure to interest rate changes that will impact on the Group's variable rate payment obligations. SECTION 3: Capital and financial risk management 20
50 Notes to the consolidated financial statements for the year ended 30 June Financial risk management (continued) Derivatives accounting policy Derivatives are initially recognised at fair value on the date a derivative contract is entered into and subsequently remeasured to their fair value. Fair values are obtained from quoted market prices in active markets. Movements in the carrying amounts of derivatives are recognised in the Consolidated Income Statement, unless the derivative meets the requirements for hedge accounting. The Group documents the relationship between the hedging instruments and hedged items at inception of the transaction, as well as its risk management objective and strategy for undertaking various hedge transactions. The Group also documents its assessment of whether the derivatives used in hedging transactions have been or will continue to be, highly effective in offsetting changes in the fair values or cash flows of hedged items. This assessment is carried out both at inception and on a monthly basis. Cash flow hedges The Group has cash flow hedges that are used to hedge the variability of interest rates in relation to certain liabilities. These derivative instruments are established with terms that exactly match the terms of the liability designated as the hedged item and therefore form highly effective relationships. The portion of the liability designated in the hedging relationship is determined by reference to specific fixed rate assets within the loan portfolio. Sources of ineffectiveness are limited to credit risk of parties to the relationship. The Group tests for ineffectiveness each month. The variability in fair values attributable to an item designated as a cash flow hedge is recognised in Other Comprehensive Income to the extent of the hedges effectiveness. Any ineffective portion of the change in the fair value of a derivative is recognised immediately in the Consolidated Income Statement. Derivatives that do not qualify for hedge accounting If a derivative expires or is sold, terminated, or exercised, or no longer meets the criteria for hedge accounting, or the designation is revoked, then hedge accounting is discontinued and the amount recognised in Other Comprehensive Income remains in Other Comprehensive Income until the forecast transaction affects the Consolidated Income Statement. If the forecast transaction is no longer expected to occur, it is reclassified to the Consolidated Income Statement as a reclassification adjustment. When a derivative is not designated in a qualifying relationship, all changes in its fair value are recognised immediately in the Consolidated Income Statement, as a component of net income from other financial instruments carried at fair value. SECTION 3: Capital and financial risk management 21
51 Notes to the consolidated financial statements for the year ended 30 June Financial risk management (continued) Liquidity risk Managing liquidity risk Liquidity risk is the risk that the Group is unable to meet its financial and statutory obligations as they fall due, which could arise due to mismatches in cash flows. The Group's objective is to manage its funds in a way that will facilitate growth in core business under a wide range of market conditions. The Group maintains, and adheres to, an Internal Liquidity Adequacy Assessment Plan (ILAAP). This process includes acknowledgements of liquidity risks within the Group and justification of the amount of liquidity that is being held based on the liquidity risk profile of the organisation. Group Treasury is responsible for implementing liquidity risk management strategies in accordance with the ILAAP. The Group's Assets and Liabilities Committee (ALCO) assists the Board with oversight of asset and liability management including liquidity risk management. The Group's liquidity policies are approved by the Board after endorsement by the Group Risk Committee and the Banking Group's ALCO. The Group maintains a portfolio of highly marketable assets that can be liquidated in the event of an unforeseen interruption of cash flows. The Group also has committed lines of credit that it can access to meet its liquidity needs. Liquidity scenarios are calculated under stressed and normal operating conditions, to assist in anticipating cash requirements providing adequate reserves. Liquidity risk exposure The Group is exposed to liquidity risk primarily through its banking activities. The Group's contractual cash flows associated with its financial liabilities and hedging derivatives, within relevant maturity groupings is as follows. These are presented on an undiscounted basis and, therefore, will not agree to amounts presented on the Consolidated Statement of Financial Position as they incorporate principal and associated future interest payments. 3 months 1 year On demand < 3 months to 1 year to 5 years > 5 years Total $ '000 $ '000 $ '000 $ '000 $ '000 $ ' At call deposits 1,460, ,460,758 Due to other financial institutions - 34, ,319 Term deposits - 825, ,453 34,743-1,679,972 Negotiable certificates of deposit - 376,200 69, ,700 Subordinated notes ,710 9,120 40,318 51,718 Securitisation liabilities - 49, , , ,104 1,111,042 Contractual amounts payable 1,460,758 1,286,862 1,040, , ,422 4,783,509 Derivative liability ,308 9,734-11,251 SECTION 3: Capital and financial risk management 22
52 Notes to the consolidated financial statements for the year ended 30 June Financial risk management (continued) Liquidity risk (continued) 3 months 1 year On demand < 3 months to 1 year to 5 years > 5 years Total $ '000 $ '000 $ '000 $ '000 $ '000 $ ' At call deposits 1,318, ,318,370 Due to other financial institutions - 30, ,710 Term deposits - 861, ,322 32,903-1,408,692 Negotiable certificates of deposit - 311,472 66, ,976 Subordinated notes 445 1,335 7,120 33,900 42,800 Securitisation liabilities - 34, , , , ,513 Contractual amounts payable 1,318,370 1,238, , , ,278 4,104,061 Derivative liability ,780 4,971-6,839 Contractual maturity of assets and liabilities The contractual maturities of the Group's financial assets and liabilities as at the reporting date are contained in the following table. The Group expects that certain assets and liabilities will be recovered or settled at maturities which are different to their contractual maturities. 30 Jun Jun 16 Less than 12 months More than 12 Months Total Less than 12 months More than 12 Months Total $ '000 $ '000 $ '000 $ '000 $ '000 $ '000 Financial assets Cash and liquid assets 64,226-64,226 80,126-80,126 Due from other financial institutions 35,161-35,161 17,875-17,875 Other assets 6,577-6,577 5,819-5,819 Financial instruments 257, , , , , ,992 Loans and advances 105,727 4,176,798 4,282, ,305 3,572,828 3,863,133 Total financial assets 469,013 4,340,245 4,809, ,958 3,740,987 4,322,945 Financial liabilities Due to other financial institutions (34,319) - (34,319) (30,710) - (30,710) Other liabilities (6,801) - (6,801) (6,961) - (6,961) Deposits (3,519,810) (32,336) (3,552,146) (3,231,740) (30,637) (3,262,377) Subordinated notes - (34,695) (34,695) - (24,663) (24,663) Securitisation liabilities (173,183) (788,942) (962,125) (117,171) (663,971) (781,142) Total financial liabilities (3,734,113) (855,973) (4,590,086) (3,386,582) (719,271) (4,105,853) Net contractual amounts receivable / (payable) (3,265,100) 3,484, ,172 (2,804,624) 3,021, ,092 SECTION 3: Capital and financial risk management 23
53 Notes to the consolidated financial statements for the year ended 30 June Average balance sheet and sources of net interest income The following table shows the major categories of interest-earning assets and interest-bearing liabilities, together with their respective interest earned or paid by the Group and the average interest rates. Averages are calculated based on the balance at each month end. Average interest earning assets and interest income 30 Jun Jun 16 Average Interest Average Average Interest Average balance rate balance rate $ '000 $ '000 % $ '000 $ '000 % Interest-earning assets Cash and liquid assets 78, % 76, % Financial instruments 380,293 9, % 357,276 10, % Loans and advances 4,100, , % 3,756, , % Total average interestearning assets 4,559, , % 4,190, , % Non-interest earning assets 126, , Total average assets 4,685, , % 4,315, , % Average liabilities and interest expense Interest-bearing liabilities Deposits and derivatives 3,442,306 65, % 3,199,496 68, % Notes and bonds on issue 903,172 28, % 776,070 25, % Total average interestbearing liabilities 4,345,478 94, % 3,975,566 94, % Non-interest bearing liabilities 34, , Total average liabilities 4,380,401 94, % 4,021,525 94, % Reserves 285, , Total average liabilities and reserves 4,665,601 94, % 4,299,190 94, % SECTION 3: Capital and financial risk management 24
54 Notes to the consolidated financial statements for the year ended 30 June Cash and liquid assets 30 Jun Jun 16 $ '000 $ '000 Notes, coins and cash at bank 62,125 64,429 Other short term liquid assets 2,101 15,697 Total cash and liquid assets 64,226 80,126 Notes to the statements of cash flows Reconciliation of profit for the year to net cash provided by operating activities Profit for the year 30,080 28,334 Add / (less) items classified as investing / financing activities or noncash items: Depreciation of property, plant and equipment 2,223 2,328 Amortisation of intangible assets 2,970 2,461 Impairment of property, plant and equipment - 1,350 Net (gain)/ loss on sale of investments (1,362) (23) Net (gain)/ loss on sale of equipment (9) Bad and doubtful debts expense net of recoveries 213 1,221 Deferred upfront lending costs 8,476 6,373 Employee equity benefits reserve Tax movement within reserves 272 (363) Changes in assets and liabilities Decrease / (increase) in due from other financial institutions 215 6,372 Decrease / (increase) in other assets (758) 1,296 Decrease / (increase) in deferred tax assets (1,054) 659 Increase / (decrease) in due to other financial institutions (298) (4,690) Increase / (decrease) in other liabilities (160) 561 Increase / (decrease) in employee benefit provisions (145) 97 Increase / (decrease) in tax liabilities (316) (3,970) Net cash flows used in operating activities 40,628 42,163 Accounting policies Cash and liquid assets Cash and liquid assets in the Consolidated Statement of Financial Position and for the purposes of the Consolidated Statement of Cash Flows comprise cash at bank and in hand and short-term deposits with an original maturity of less then three months, net of outstanding bank overdrafts. Cash flows arising from deposits, share capital, investments, loans to subsidiaries and investments in associates are presented on a net basis in the Statement of Cash Flows. Cash Flow statement Cash flows arising from the following activities are presented on a net basis in the Statement of Cash Flows: Customer deposits and withdrawals from savings and fixed-term deposit accounts; Movements in investments; Amounts due to and from other financial institutions; Customer loans and advances; and Dividends paid. SECTION 4: Financial assets and liabilities 25
55 Notes to the consolidated financial statements for the year ended 30 June Financial instruments Financial instruments at amortised cost 30 Jun Jun 16 $ '000 $ '000 Negotiable certificates of deposits 221, ,420 Floating rate notes 196, ,970 Other deposits 1,504 1,819 Total financial instruments at amortised cost 419, ,209 Financial instruments at fair value Derivatives (267) 23 Other financial instruments at fair value 1,648 4,760 Total financial instruments 420, ,992 Accounting policies Financial instruments at amortised cost Financial instruments at amortised cost are those non-derivative financial assets that the Company has acquired with the objective of holding in order to collect contractual cash flows. The contractual terms of the financial asset give rise on specified dates to cash flows that are solely payments of principal and interest on the principal amount outstanding. Financial instruments at fair value Financial instruments other than those carried at amortised cost, are carried at their fair value at the reporting date. Note 4.6 contains information on how the group determines fair values. Fair value gains and losses are recognised in comprehensive income until the derecognition date, at which point the net gains and losses are transferred to profit or loss for that instrument. Derecognition of financial assets and liabilities Financial assets are derecognised when the contractual rights to receive cash flows from the assets have expired, or where the Bank has transferred its contractual rights to receive the cash flows of the financial assets and substantially all the risks and rewards of ownership. Financial liabilities are derecognised when they are extinguished, i.e. when the obligation is discharged, cancelled or expired. SECTION 4: Financial assets and liabilities 26
56 Notes to the consolidated financial statements for the year ended 30 June Loans and advances 30 Jun Jun 16 $ '000 $ '000 Classification of loans and advances at amortised cost Residential loans secured by mortgage 4,090,546 3,674,988 Personal loans and unsecured overdrafts 77,249 79,565 Overdrafts secured by mortgage 52,261 59,308 Commercial loans 63,426 50,330 Total loans and advances at amortised cost 4,283,482 3,864,191 Specific provision for impairment Collective provision for impairment Total loans and advances at amortised cost net of provision for impairment 4,282,525 3,863,133 Loans and advances at amortised cost accounting policy Loans and other receivables that have fixed or determinable payments that are not quoted in an active market are classified as "loans and advances". Loans and advances are recognised on trade date and are measured at amortised cost using the effective interest method, less any impairment. Interest income is recognised by applying the effective interest rate, except for short-term receivables when the effect of discounting is immaterial. Provision for impairment Specific provision for impairment Opening balance Charge / (credit) against profit Write-off of previously provisioned facilities (41) - Closing balance of specific provision for impairment Collective provision for impairment Opening balance Charge / (credit) against profit Write-off of previously provisioned facilities (476) (452) Closing balance of collective provision for impairment SECTION 4: Financial assets and liabilities 27
57 4.3 Loans and advances (continued) MyState Limited Notes to the consolidated financial statements for the year ended 30 June 2017 Charge to profit for impairment on loans and advances 30 Jun Jun 16 $ '000 $ '000 Increase / (decrease) in specific provision for impairment Increase / (decrease) in collective provision for impairment (154) (56) Bad debts recovered (1,131) (1,221) Bad debts written off directly 1,445 2,046 Total impairment expense on loans and advances 213 1,221 Impairment of financial assets accounting policy Financial assets are assessed for indicators of impairment at the end of each reporting period. Financial assets are considered to be impaired when there is objective evidence that, as a result of one or more events that occurred after the initial recognition of the financial asset, the estimated future cash flows of the investment have been affected. The primary source of credit risk for the Group arises on its loan portfolio. In relation to this portfolio, the Group maintains an individually assessed provision and a collective provision. Specific provisions for impairment are made against individual risk rated credit facilities where a loss is expected. The provisions are measured as the difference between a financial asset's carrying amount and the expected future cash flows. All other loans and advances that do not have an individually assessed provision are assessed collectively for impairment. The evaluation process is undertaken by categorising all loans in to a credit risk hierarchy based on a series of estimates and judgements based on APRA Prudential Standard APS Credit Quality. 4.4 Transfer of financial assets (securitisation program) Loans and advances to customers are sold by the Group to securitisation vehicles. The transfer takes the form of the Group assuming an obligation to pass cash flows from the underlying assets to investors in the notes. The Group utilises its securitisation program to provide regulatory capital relief and funding diversification. The following table sets out the values at the transaction date of financial assets transferred during the financial year in this manner to vehicles that provide regulatory capital relief during the year and the value of the associated liabilities issued from the vehicles. This table does not include transfer of assets to the securitisation vehicle in which the Group is the bond holder. Carrying value at transaction date 30 Jun Jun 16 $ '000 $ '000 Transferred financial assets: Loans and advances 420, ,819 Associated financial liabilities Securitisation liabilities to external investors 400, ,000 SECTION 4: Financial assets and liabilities 28
58 Notes to the consolidated financial statements for the year ended 30 June Transfer of financial assets (securitisation program) (continued) Transfer of financial assets accounting policy Once assets are transferred to a securitisation vehicle, the Group does not have the ability to use the transferred assets during the term of the arrangement. The Group does not have any loans transferred to unconsolidated securitisation vehicles. The consolidated securitisation vehicles generally transfer all the risks and rewards of ownership of the assets to the investors in the notes. However, derecognition of the transferred assets from the Group is prohibited because the cash flows that the securitisation vehicles collect from the transferred assets on behalf of the investors are not passed to them without material delay. In these cases, the consideration received from the investors in the notes in the form of cash is recognised as a financial asset and a corresponding financial liability is recognised. The investors in the notes have recourse only to the cash flows from the transferred financial assets. Interest in Joint Operations accounting policy Securitised positions are held through a number of Special Purpose Entities (SPE's). These entities are classified as joint operations, as the parties that have joint control of the arrangement, have rights to the assets, and obligations for the liabilities, relating to the arrangement. Joint control is the contractually agreed sharing of control of an arrangement which exists only when decisions about the relevant activities requires unanimous consent of the parties sharing control. The Group recognises its interest in a joint operation: Its assets, including its share of any assets held jointly; Its liabilities, including its share of any liabilities incurred jointly; Its revenue from the sale of its share of the output arising from the joint operation; Its share of the revenue from the sale of the output by the joint operation; and Its expenses, including its share of any expenses incurred jointly. The Group accounts for the assets, liabilities, revenues and expenses relating to its interest in a joint operation in accordance with the AASBs applicable to the particular assets, liabilities, revenues and expenses. When a Group entity transacts with a joint operation in which a Group entity is a joint operator (such as a sale or contribution of assets), the Group is considered to be conducting the transaction with the other parties to the joint operation, and gains and losses resulting from the transactions are recognised in the Group's consolidated financial statements only to the extent of other parties' interests in the joint operation. When a Group entity transacts with a joint operation in which a group entity is a joint operator (such as a purchase of assets), the Group does not recognise its share of the gains and losses until it re-sells those assets to a third party. SECTION 4: Financial assets and liabilities 29
59 Notes to the consolidated financial statements for the year ended 30 June Deposits and other borrowings including subordinated notes 30 Jun Jun 16 $ '000 $ '000 Deposits At call deposits 1,460,758 1,318,371 Term deposits 1,648,766 1,569,299 Negotiable certificates of deposit 442, ,707 Total deposits 3,552,146 3,262,377 Other borrowings Subordinated notes (1) 34,695 24,663 Securitisation liabilities 962, ,142 Total deposits and other borrowings including subordinated notes 4,548,966 4,068,182 Concentration of deposits: Customer deposits 2,988,057 2,714,858 Wholesale deposits 564, ,519 Subordinated notes (1) 34,695 24,663 Securitisation liabilities 962, ,142 Total deposits 4,548,966 4,068,182 There are no customers who individually have deposits which represent 10% or more of total liabilities. (1) Refer to note 3.1 (1) for details regarding the Subordinated Note issue. Deposits and other borrowings accounting policy Deposits and other borrowings are initially measured at fair value, net of transaction costs and are subsequently measured at amortised cost using the effective interest method, with interest expense recognised on an effective yield basis. The Group does not currently hold any financial liabilities at fair value. 4.6 Fair value of financial instruments Classification of financial instruments Cash and liquid assets, amounts due to financial institutions and amounts due from financial institutions are carried at cost. As these assets are short term assets, their cost is considered to approximate their fair value. The following financial assets and liabilities are also carried at amortised cost: Financial instruments; Loans and advances; Deposits; and Other borrowings. SECTION 4: Financial assets and liabilities 30
60 Notes to the consolidated financial statements for the year ended 30 June Fair value of financial instruments (continued) The aggregate net fair values of financial assets and financial liabilities which are carried at amortised cost is: 30 Jun Jun 16 Carrying Net fair Carrying Net fair value value value value $ '000 $ '000 $ '000 $ '000 Financial assets Financial instruments 419, , , ,007 Loans and advances 4,282,525 4,275,447 3,863,133 3,862,014 Total financial assets 4,701,913 4,694,470 4,214,307 4,213,021 Financial liabilities Deposits 3,552,146 3,544,954 3,262,377 3,262,826 Other borrowings including subordinated notes 996, , , ,805 Total financial liabilities 4,548,966 4,541,774 4,068,182 4,068,631 Fair value hierarchy The level in the fair value hierarchy of the inputs used in determining the fair values is shown below. The fair value of these assets is: Level 1 - inputs that are prices quoted for identical instruments in active markets; Level 2 - inputs based on observable market data other than those in level 1; and Level 3 - inputs for which there is no observable market data. Where the expected maturity is in excess of 12 months, the fair value is discounted to its present value. During the year, there have been no material transfers between levels of the fair value hierarchy. Level 1 Level 2 Level 3 Total value value value value $ '000 $ '000 $ '000 $ ' Financial assets Financial instruments - 419, ,023 Loans and advances - - 4,275,447 4,275,447 Financial liabilities Deposits - 3,544,954-3,544,954 Other borrowings including subordinated notes - 996, , Financial assets Financial instruments - 351, ,007 Loans and advances - - 3,862,014 3,862,014 Financial liabilities Deposits - 3,262,826-3,262,826 Other borrowings including subordinated notes - 805, ,805 The Group has performed a VaR analysis at section 3.2, Market risk. VaR takes account of all material market variables that may cause a change in the value of the loan portfolio, being 100% of Level 3 inputs. SECTION 4: Financial assets and liabilities 31
61 Notes to the consolidated financial statements for the year ended 30 June Property, plant and equipment 30 Jun Jun 16 $ '000 $ '000 Land and buildings At revalued amount 13,648 13,212 Accumulated depreciation (6,711) (5,163) 6,937 8,049 Plant and equipment At cost 4,171 3,943 Accumulated depreciation (2,812) (2,180) 1,359 1,763 Total property, plant and equipment 8,296 9,812 Property, plant and equipment accounting policy Plant and equipment Plant and equipment, including leasehold improvements, are measured at cost less accumulated depreciation and any impairment in value. Land and buildings Following initial recognition at cost, land and buildings are carried at a revalued amount, being their fair value at the date of the revaluation less any subsequent accumulated depreciation on buildings and accumulated impairment losses. Independent valuations are performed with sufficient regularity to ensure the carrying amount does not differ materially from the asset's fair value at the Consolidated Statement of Financial Position date. Fair value, is determined by reference to market-based evidence, which is the amount for which the assets could be exchanged between a knowledgeable willing buyer and seller in an arm's length transaction as at valuation date. Any revaluation surplus is credited to the asset revaluation reserve included in the equity section of the Consolidated Statement of Financial Position, unless it reverses a revaluation decrease of the same asset previously recognised in the Consolidated Income Statement. Any revaluation deficit is recognised in the Consolidated Income Statement unless it directly offsets a previous surplus of the same asset in the asset revaluation reserve. Accumulated depreciation is eliminated against the gross carrying amount of the asset and the net amount is restated to the revalued amount of the asset. Impairment of property, plant and equipment The carrying values of property, plant and equipment are reviewed for impairment when events or changes in circumstances indicate the carrying value may not be recoverable. For an asset that does not generate largely independent cash flows, the recoverable amount is determined for the cash-generating unit to which the asset belongs. Derecognition of property, plant and equipment An item of property, plant and equipment is derecognised upon disposal or when no future economic benefits are expected to arise from the continued use of the asset. Any gain or loss arising on derecognition of the asset (calculated as the difference between the net disposal proceeds and the carrying amount of the item) is included in the Consolidated Income Statement in the year the item is derecognised. SECTION 5: Non-financial assets, liabilities and equity 32
62 Notes to the consolidated financial statements for the year ended 30 June Intangible assets and goodwill Goodwill Software Other Total $ '000 $ '000 $ '000 $ '000 Year ended 30 June 2017: At 1 July 2016, net of accumulated amortisation 65,978 11,016 1,988 78,982 Additions - 9,189 2,978 12,167 Disposals Impairment Amortisation - (2,167) (803) (2,970) At 30 June 2017, net of accumulated amortisation 65,978 18,038 4,163 88,179 At 30 June 2017 Cost (gross carrying amount less impairment) 65,978 27,766 5,556 99,300 Accumulated amortisation - (9,728) (1,393) (11,121) Net carrying amount 65,978 18,038 4,163 88,179 Year ended 30 June 2016: At 1 July 2015, net of accumulated amortisation 65,978 10,806 1,893 78,677 Additions - 3, ,116 Disposal Impairment - (1,350) - (1,350) Amortisation - (1,964) (497) (2,461) At 30 June 2016, net of accumulated amortisation 65,978 11,016 1,988 78,982 At 30 June 2016 Cost (gross carrying amount less impairment) 65,978 22,596 2,578 91,152 Accumulated amortisation - (11,580) (590) (12,170) Net carrying amount 65,978 11,016 1,988 78,982 Intangibles accounting policy Intangible assets acquired separately are capitalised at cost and from a business combination are capitalised at fair value as at the date of acquisition. Following initial recognition, the cost model is applied to the class of intangible assets. The useful lives of these intangible assets are assessed to be either finite or infinite. Where amortisation is charged on assets with finite lives, this expense is taken to the Consolidated Income Statement. Certain costs directly incurred in acquiring and developing software are capitalised and amortised over the estimated useful life. Intangible assets are tested for impairment where an indicator of impairment exists and, in the case of indefinite life intangibles, annually, either individually or at the cash-generating unit level. Useful lives are also examined on an annual basis and adjustments, where applicable, are made on a prospective basis. Goodwill is treated as an indefinite life intangible, software and other intangibles are finite life intangibles. Refer to note 2.4 Expenses for the useful life of tangible and intangible assets. SECTION 5: Non-financial assets, liabilities and equity 33
63 Notes to the consolidated financial statements for the year ended 30 June Intangible assets and goodwill (continued) Impairment testing of Goodwill For the purpose of impairment testing, goodwill has been allocated to the Group's two cash-generating units (CGU's) the Banking Business and the Wealth Management Business. These CGU's represent the lowest level within the Group at which the goodwill is monitored for internal management purposes. The aggregate carrying amounts of goodwill allocated to each CGU for the purpose of impairment testing is as follows: 30 Jun Jun 16 $ '000 $ '000 Banking Business 40,189 40,189 Wealth Management Business 25,789 25,789 Total goodwill 65,978 65,978 The recoverable amounts for the relevant CGU's have been assessed based on value-in-use calculations using cash flow projections. The Company s assessment of goodwill value-in-use exceeds the carrying value allocated to the CGU's and included in the financial statements. Each CGU's value-in-use was determined using cash flow projections from Board approved financial budgets for the year ending 30 June Growth rates have been applied from year two through to year twenty. Cash flows are projected by undertaking detailed calculations for each income and expense category over the twenty year period. Certain income categories are modelled by projecting growth in relevant portfolio balances and the resulting income derived there-from. Other non-portfolio related income streams and expense categories are modelled by projecting real rates of growth (above inflation) for each category. Terminal value is determined at year twenty using the assumption that the CGU achieves no real growth above inflation into perpetuity. The growth rates applied do not exceed the long-term average growth rate for the business which the CGU operates. The discount rate used of 10% reflects the Group's post-tax nominal weighted average cost of capital, in which has been reviewed by externally engaged advisers and approved by the Board. Average inflation is projected to be 2.5%. The method for determining value-in-use is consistent with that adopted in the comparative period. The key assumptions adopted in assessing Banking's value-in-use are the rate of growth in the balance of the housing loan portfolio and the outlook for net interest margin (NIM). Taking into account management's past experiences and external evidence, the assumptions that have been adopted for both of these components are considered to be conservative. NIM is projected to be consistent with the budget outlook, which reflects the current low interest rate environment, this depresses this figure. Management expects that, over time, these assumptions will be positively exceeded and that any reasonably possible change to assumptions used in Management s assessment will not result in impairment. The key assumption adopted in assessing Wealth Management's value-in-use is the rate of growth in income derived from management fee (MF) income. MF income is derived from its activities as the responsible entity for various Managed Investment Schemes (MIS). MF income derived is directly related to the portfolio balances of the MIS. Other sources of income for the Wealth Management Business is its Financial Planning and Trustee Services divisions. Taking into account Management's past experiences and external evidence, the assumption adopted is considered reasonable and conservative. Management s assessment of Wealth Management's value-inuse exceeds its carrying value. Any reasonably possible change to assumptions used in Management s assessment will not result in impairment. SECTION 5: Non-financial assets, liabilities and equity 34
64 Notes to the consolidated financial statements for the year ended 30 June Intangible assets and goodwill (continued) Impairment testing of Goodwill (continued) Goodwill accounting policy Goodwill on the acquisition of businesses is carried at cost as established at the date of the acquisition of the business less accumulated impairment losses, if any. For the purposes of impairment testing, goodwill is allocated to each of the Group's cash generating units (or groups of CGU's) that is expected to benefit from the synergies of the combination. A CGU to which goodwill has been allocated is tested for impairment annually, or more frequently when there is an indication that the unit may be impaired. If the recoverable amount of the CGU is less than its carrying amount, the impairment loss is allocated first to reduce the carrying amount of any goodwill allocated to the CGU and then to the other assets of the unit pro rata based on the carrying amount of each asset in the CGU. Any impairment loss for goodwill is recognised directly in profit or loss. An impairment loss recognised for goodwill is not reversed in subsequent periods. On disposal of the relevant CGU, the attributable amount of goodwill is included in the determination of the profit or loss on disposal. Impairment of subsidiaries accounting policy Investments in subsidiaries are tested annually for impairment or more frequently if events or changes in circumstances indicate that the carrying value may not be recoverable. An impairment loss is recognised for the amount by which the investments carrying amount exceeds its recoverable amount (which is the higher of fair value less costs to sell and value in use). At each balance sheet date, the investments in subsidiaries that have been impaired are reviewed for possible reversal of the impairment. SECTION 5: Non-financial assets, liabilities and equity 35
65 Notes to the consolidated financial statements for the year ended 30 June Employee benefits provisions 30 Jun Jun 16 $ '000 $ '000 Balances Provision for annual leave 2,015 2,156 Provision for long service leave 3,355 3,359 Total employee benefits provisions 5,370 5,515 Due to be settled within 12 months 4,230 4,219 Due to be settled more than 12 months 1,140 1,296 Total employee benefits provisions 5,370 5,515 Employee benefits accounting policy Liabilities for salaries, wages and annual leave are recognised in respect of the employees service up to the reporting date. Where settlement is expected to occur within twelve months of the reporting date, the liabilities are measured at their nominal amounts based on the remuneration rates which are expected to be paid when the liability is settled. Where settlement is expected to occur later than twelve months from reporting date, the liabilities are measured at the present value of payments which are expected to be paid when the liability is settled. A liability for long service leave is recognised and measured at the present value of expected future payments to be made in respect of services provided up to the reporting date. Consideration is given to expected future wage and salary levels, experience of employee departures and periods of service. Contributions are made by the Group to employee superannuation funds and are charged as expenses when incurred. SECTION 5: Non-financial assets, liabilities and equity 36
66 Notes to the consolidated financial statements for the year ended 30 June Jun Jun 16 $ '000 $ ' Share capital Issued and paid up ordinary shares 141, ,756 Movements in ordinary share capital 30 Jun Jun 16 Number Amount Number Amount of shares $ '000 of shares $ '000 Opening balance 87,854, ,756 87,283, ,670 Shares issued pursuant to the - employee share scheme of the Group 18, , executive long term incentive plan , dividend reinvestment plan 1,572,411 6, ,883 1,941 Closing balance 89,445, ,349 87,854, ,756 Terms and conditions Ordinary shares have the right to receive dividends as declared from time to time and, in the event of a winding up of the Company, to participate in the proceeds from the sale of all surplus assets in proportion to the number of shares and amounts paid up on the shares held. Ordinary shares entitle their holder to one vote per share, either in person or by proxy at meetings of the Company. The Company does not have authorised capital or par value in respect of its issued shares. The Group offers share based remuneration, refer to note 7.3 and the Remuneration Report for further information regarding these arrangements. SECTION 5: Non-financial assets, liabilities and equity 37
67 Notes to the consolidated financial statements for the year ended 30 June Income tax expense, current and deferred tax balances The major components of income tax expense /(benefit) are: 30 Jun Jun 16 $ '000 $ '000 Income tax expense Current income tax charge 12,037 12,298 Adjustment in respect of current income tax of previous years 62 (220) Adjustments in respect of deferred income tax of previous years (563) 221 Relating to origination and reversal of temporary differences Total income tax expense 12,158 12,756 A reconciliation between tax expense and accounting profit before income tax multiplied by the Group's applicable income tax rate is as follows: Income tax expense attributable to: Accounting profit before income tax 42,238 41,090 The income tax expense comprises amounts set aside as: Provision attributable to the current year at the statutory rate of 30%, being: - Prima facie tax on accounting profit before tax 12,671 12,327 - Under / (over) provision in prior year (500) - Expenditure not allowable for income tax purposes Tax effect of tax credits and adjustments (55) (107) Other - - Income tax expense reported in the consolidated income statement 12,158 12,756 Weighted average effective tax rates 28.8% 31.0% SECTION 6: Income tax expense, current and deferred tax balances 38
68 Notes to the consolidated financial statements for the year ended 30 June Income tax expense, current and deferred tax balances (continued) Deferred income tax relates to the following: 30 Jun Jun 16 $ '000 $ '000 Deferred tax assets Employee entitlements 1,611 1,655 Provisions Doubtful debts Other 2,848 1,587 Carried forward losses - - Total deferred tax assets 4,718 3,664 Deferred tax liabilities Available for sale financial assets Property, plant and equipment 1,460 1,112 Other 1,776 1,363 Total deferred tax liabilities 3,306 2,562 Current tax payable 785 1,845 Total tax liabilities 4,091 4,407 Movements in deferred tax balances Deferred tax assets Deferred tax liabilities 30 Jun Jun Jun Jun 16 $' 000 $' 000 $' 000 $' 000 Opening balance 3,664 4,323 2,562 2,195 (Charged) / credited to income statement 550 (158) 1, Credited/(charged) to equity 99 (348) (270) - Adjustments for deferred tax of prior years 405 (153) (158) 68 Closing balance 4,718 3,664 3,306 2,562 SECTION 6: Income tax expense, current and deferred tax balances 39
69 Notes to the consolidated financial statements for the year ended 30 June Income tax expense, current and deferred tax (continued) Taxation accounting policy Income tax expense is recognised in the Consolidated Income Statement, except to the extent that it relates to items recognised directly in other comprehensive income, in which case it is recognised in the Consolidated Statement of Comprehensive Income. Income tax expense on the profit or loss of the period comprises current tax and deferred tax. Current tax payable Current tax payable is the expected tax payable on the taxable income for the financial year using tax rates that have been enacted, and any adjustment to tax payable in respect of previous years. Deferred tax Deferred income tax is provided on all temporary differences at the Consolidated Statement of Financial Position date. Temporary differences are calculated at each reporting date as the difference between the carrying amount of assets and liabilities for financial reporting purposes and their tax base. Deferred income tax liabilities are recognised for all taxable temporary differences except: Where the deferred income tax liability arises from the initial recognition of goodwill or of an asset or liability in a transaction that is not a business combination and, at the time of the transaction, affects neither the accounting profit nor taxable profit or loss; and When the taxable temporary differences associated with the investments in subsidiaries and the timing of the reversal of the temporary differences can be controlled and it is probable that the temporary differences will not reverse in the foreseeable future. Deferred income tax assets are recognised for all deductible temporary differences, carry forward of unused tax assets and unused tax losses, to the extent that it is probable that taxable profit will be available against which the deductible temporary differences and the carry forward of unused tax assets and unused tax losses can be utilised except: When the deferred income tax asset relating to the deductible temporary difference arises from the initial recognition of an asset or liability in a transaction that is not a business combination and, at the time of the transaction, affect neither the accounting profit nor the taxable profit and loss; and When the deductible temporary differences are associated with investments in subsidiaries, in which case a deferred tax asset is only recognised to the extent that it is probable that the temporary differences will reverse in the foreseeable future and taxable profit will be available against which the temporary differences can be utilised. Deferred tax assets and deferred tax liabilities are offset only if a legally enforceable right exists to set off current tax assets against current tax liabilities and the deferred tax assets and liabilities relate to the same taxable entity and the same taxable authority. The Group undertakes transactions in the ordinary course of business where the income tax treatment requires the exercise of judgement. The Group estimates its tax liability based on its understanding of the tax law. SECTION 6: Income tax expense, current and deferred tax balances 40
70 Notes to the consolidated financial statements for the year ended 30 June Income tax expense, current and deferred tax (continued) Taxation accounting policy (continued) Tax consolidation The Group has elected to be taxed as a single entity under the tax consolidation regime. The head company is MyState Limited. The members of the group have entered into a tax sharing agreement that provides for the allocation of income tax liabilities among the entities should the head entity default on its tax payment obligations. No amounts have been recognised in the financial statements in respect of this agreement on the basis that the possibility of default is remote. The Company and the controlled entities in the tax consolidated group continue to account for their own current and deferred tax amounts. The Company has applied the separate tax payer within group approach in determining the appropriate amount of current taxes and deferred taxes to allocate to members of the tax consolidated group. In addition to its own current and deferred tax amounts, the Company also recognises the current tax liabilities (or assets) and the deferred tax assets arising from unused tax losses and unused tax credits assumed from controlled entities in the tax consolidated group. Any difference between the amounts assumed and amounts receivable or payable under the tax funding agreement are recognised as a contribution to (or distribution from) wholly-owned tax consolidated entities. SECTION 6: Income tax expense, current and deferred tax balances 41
71 Notes to the consolidated financial statements for the year ended 30 June Parent entity information The accounting policies of the parent entity, which have been applied in determining the financial information shown below, are the same as those applied in the consolidated financial statements. Refer to note 1 and policy notes within the financial statements for a summary of the significant accounting policies relating to the Group. 30 Jun Jun 16 Statement of Financial Position $ '000 $ '000 Assets Cash and liquid assets 1,214 3,026 Other receivables Related party receivables 1,810 2,337 Investments in subsidiaries 249, ,364 Deferred tax assets 1, Total assets 254, ,660 Liabilities Other liabilities 786 2,181 Related party payables Tax liabilities 1,246 1,840 Employee benefit provisions Total liabilities 2,670 4,931 Net assets 251, ,729 Equity Share capital 247, ,684 Retained earnings 3,370 3,370 Reserves Total equity 251, ,729 Financial performance Profit after income tax for the year 25,041 24,155 Other comprehensive income - - Total comprehensive income 25,041 24,155 The parent entity has not entered in to any guarantees and does not have any contingent liabilities as at 30 June 2017 (30 June 2016: nil). Transactions between the Company and the consolidated entities principally arise from the provision of management and governance services. All transactions with subsidiaries are in accordance with regulatory requirements, the majority of which are on commercial terms. All transactions undertaken during the financial year with the consolidated entities are eliminated in the Consolidated Financial Statements. Amounts due from and due to entities are presented separately in the Statement of Financial Position of the Company except where offsetting reflects the substance of the transaction or event. SECTION 7: Group Structure and related parties 42
72 Notes to the consolidated financial statements for the year ended 30 June Controlled entities and principles of consolidation Details of the Group s material subsidiaries at the end of the reporting period are as follows. Country of Ownership Significant subsidiaries Principal activities Incorporation Interest MyState Bank Limited Banking Australia 100% Tasmanian Perpetual Trustees Limited Wealth Management Australia 100% Connect Asset Management Pty Ltd Manager of Securitisation Australia 100% Vehicles On 30 September 2015, the Rock Building Society Limited ceased operating as an ADI and is no longer a significant subsidiary. The operations were transferred to MyState Bank Limited. Basis of consolidation accounting policy The consolidated financial statements incorporate the financial statements of the Company and entities (including structured entities) controlled by the Company and its subsidiaries. Control is achieved when the Company: Has power over the investee; Is exposed, or has rights, to variable returns from its involvement with the investee; and Has the ability to use its power to affect its returns. The Company reassesses whether or not it controls an investee if facts and circumstances indicate that there are changes to one or more of these three elements of control. When the Company has less than a majority of the voting rights of an investee, it has power over the investee when the voting rights are sufficient to give it the practical ability to direct the relevant activities of the investee unilaterally. The Company considers all relevant facts and circumstances in assessing whether or not the Company's voting rights in an investee are sufficient to give it power, including: The size of the Company's holding of voting rights relative to the size and dispersion of holdings of the other vote holders; Potential voting rights held by the Company, other vote holders or other parties; Rights arising from other contractual arrangements; and Any additional facts and circumstances that indicate that the Company has, or does not have, the current ability to direct the relevant activities at the time that decisions need to be made, including voting patters at previous shareholders' meetings. Consolidation of a subsidiary begins when the Company obtains control over the subsidiary and ceases when the Company loses control of the subsidiary. Specifically, income and expenses of a subsidiary acquired or disposed of during the year are included in the Consolidated Income Statement and Other Comprehensive Income from the date the Company gains control until the date when the Company ceases to control the subsidiary. Profit or loss and each component of Other Comprehensive Income are attributed to the owners of the Company and to the non-controlling interests. Total comprehensive income of subsidiaries is attributed to the owners of the Company and to the non-controlling interests even if this results in the non-controlling interests having a deficit balance. When necessary, adjustments are made to the financial statements of subsidiaries to bring their accounting policies into line with the Group's accounting policies. All intragroup assets and liabilities, equity, income, expenses and cash flows relating to transactions between members of the Group are eliminated in full on consolidation. SECTION 7: Group Structure and related parties 43
73 7.3 Related party disclosures MyState Limited Notes to the consolidated financial statements for the year ended 30 June 2017 The ultimate parent entity and controlling entity is MyState Limited. Balances and transactions between the Company and its subsidiaries, which are related parties of the Company, have been eliminated on consolidation and are not disclosed in this note. Details of transactions between the Group and other related parties are disclosed in the following paragraphs. Managed Investment Schemes Within the Group, Tasmanian Perpetual Trustees Limited (TPT) is a Responsible Entity for Managed Investment Schemes (Funds) and, accordingly, has significant influence over their activities. TPT receives management fees from these Funds. TPT also pays expenses of the Funds for which it is reimbursed. TPT and the Company have also invested in these Funds and receives distributions on these investments. These investments are made on the same terms and conditions that apply to all investors in these Funds. Details of these transactions and balances are as follows: Consolidated TPT 30 Jun Jun Jun Jun 16 $ '000 $ '000 $ '000 $ '000 Management fees received 9,456 9,272 9,456 9,272 Balance of investment held at year end 7,216 9,663 3,863 2,334 Distributions received from managed funds The Funds have: Accepted money on deposit from Directors and Executives or entities associated with Directors and Executives at prevailing Fund rates and conditions; Loaned money to MSB, in the form of term deposits, totalling $30.75 million (2016: $29.75 million); and Loaned money to Trusts within the ConQuest Trusts Residential Mortgage Backed Securities Program in the form of Class A and B notes totalling $38.07 million (2016: $56.35 million). These deposits are made on the same terms and conditions that apply to all similar transactions. Key Management Personnel Individual Directors and Executive compensation disclosures Information regarding individual Directors, Executive compensation, and equity instruments disclosures, as required by the Corporations Regulation 2M.2.03, is provided in the Remuneration Report section of the Directors' report. Disclosure of the compensation and other transactions with key management personnel (KMP) is required pursuant to the requirements of Australian Accounting Standard AASB 124 Related Party Disclosures. The KMP of the Group is comprised of the non Executive Directors, Managing Director and Chief Executive Officer and certain Executives. 30 Jun Jun 16 $ '000 $ '000 Key management personnel compensation The key management personnel compensation comprised: Short-term employee benefits 3,713 3,405 Post employment benefits Share-Based payment (i) Termination benefits (i) These amounts are estimates of compensation and include a portion that will only vest to the Managing Director or Executive when certain performance criteria are met or a 'Capital Event' occurs. The fair value of shares is calculated at the date of grant and is allocated to each reporting period over the period from grant date to vesting date. The value disclosed is the portion of the fair value of the shares allocated to this reporting period. SECTION 7: Group Structure and related parties 44
74 Notes to the consolidated financial statements for the year ended 30 June Contingent liabilities and expenditure commitments 30 Jun Jun 16 $ '000 $ '000 Operating lease expenditure commitments not later than 1 year 3,726 3,861 later than 1 and not later than 5 years 9,498 10,618 later than 5 years 8,199 10,475 Total lease expenditure contracted for at balance date 21,423 24,954 The Group occupies a number of properties which house its branch network. The leases for these properties are on normal commercial terms and conditions. The usual initial term for these leases is five years. In the 2012 period, MyState Bank Limited (MSB) commenced leasing its Headquarters building located in Hobart. The term of the lease is fifteen years, with an option for a further ten year term. Rental increases over the term of the lease are determined by reference to movements in the consumer price index. The Group also entered into a lease of a property situated in Launceston, which is principally used to house elements of the Tasmanian Perpetual Trustees Limited (TPT) business. The term of the lease is five years, with an option for two further five year terms. Rental increases over the term of the lease are determined by reference to movements in the consumer price index. If the options for further terms are exercised, the rental is to be determined by market appraisal at that time. Other operating leases have an average term of 3 to 5 years for property and are non-cancellable. Assets that are the subject of operating leases are computer equipment and property. MSB has provided guarantees to third-parties in order to secure the obligations of customers. The range of situations in which guarantees are given include: Local Government Authorities, to secure the obligations of property and sub-divisional developers to complete infrastructure developments; Local Government Authorities, Schools and other building owners, to secure the obligations of building contractors to complete building works; Landlords, to secure the obligations of tenants to pay rent; and CUSCAL, to secure payroll and direct debit payments processed by CUSCAL on behalf of customers. Customer commitments Loans approved but not advanced to borrowers 42,520 49,360 Undrawn continuing lines of credit 72,952 76,415 Performance guarantees 2,000 1,876 Total customer commitments 117, ,651 Guarantees are issued in accordance with approved Board policy. Those guarantees over $10,000 are required to be secured. In the event that a payment is made under a guarantee, the customer's obligation to MSB is crystallised in the form of an overdraft or loan. Bank Guarantee 1,000 1,000 The Group is a non-broker participant in the Clearing House Electronic Sub Register System operated by the Australian Securities Exchange and has provided a guarantee and indemnity for the settlement account from Bendigo and Adelaide Bank Limited (BABL). The Group maintains a deposit with BABL for $1,000,000 (2016: $1,000,000) as collateral for the guarantee. SECTION 8: Other notes 45
75 Notes to the consolidated financial statements for the year ended 30 June Contingent liabilities and expenditure commitments (continued) 30 Jun Jun 16 $ '000 $ '000 Loan Guarantees TPT has given guarantees to Local Government Authorities to secure the obligations of property and subdivisional developers to complete infrastructure developments required of them. The developers are borrowers from managed funds for which TPT is the Responsible Entity. The developers provide cash or real property as security for the Group providing the loan guarantee. Estate Administration The Group acts as executor and trustee for a significant number of trusts and estates. In this capacity, the Group has incurred liabilities for which it has a right of indemnity out of the assets of those trusts and estates. Accordingly, these liabilities are not reflected in the financial statements. Other contracted commitments for expenditure on plant and equipment as at the reporting date are for only minimal amounts. 8.2 Remuneration of auditors During the financial year, the following fees were paid or payable for services provided by the auditor or the Group, Wise Lord & Ferguson: Audit services Audit of the financial statements of the consolidated entities Total remuneration for audit services Audit related services Assurance related services 89 7 Audit of loans and other services to the securitisation program Total remuneration for audit related services Other non-external audit related services Other services Total remuneration for non-audit related services Total remuneration for services provided Events subsequent to balance date There were no matters or circumstances that have arisen since the end of the year which significantly affected or may significantly affect the operations of the Group, the results of those operations, or the state of affairs of the Group in future financial periods. SECTION 8: Other notes 46
76 Notes to the consolidated financial statements for the year ended 30 June Other significant accounting policies and new accounting standards The principal accounting policies, which are consistent with those applied in the comparative period unless otherwise stated, that have been adopted in the preparation of the financial report are set out in this section and the preceding sections. Other assets Other assets comprise accounts receivable, accrued income and prepayments. Accounts receivable are initially recorded at the fair value of the amounts to be received and are subsequently measured at amortised cost using the effective interest rate method, less any provision for impairment loss. Other liabilities Other liabilities comprise accounts payable and accrued expenses and represent liabilities for goods and services received by the Group that remain unpaid at the end of the reporting period. The balance is recognised as a current liability with the amounts normally paid within 30 days of the recognition of the liability. New and revised accounting standards The Group has adopted the following new standards and amendments to standards, including any consequential amendments to other standards, with a date of initial application for reporting periods beginning on or after 1 July The adoption of these accounting standards have not resulted in any significant changes to the financial statements: AASB Amendments to Australian Accounting Standards - Accounting for Acquisitions of Interests in Joint Operations [AASB 1 & AASB 11]. AASB Clarification of Acceptable Methods of Depreciation and Amortisation (Amendments to AASB 116 & 138). AASB Amendments to Australian Accounting Standards Equity Method in Separate Financial Statements AASB Amendments to Australian Accounting Standards - Sale or Contribution of Assets between an Investor and its Associate or Joint Venture. AASB Amendments to Australian Accounting Standards - Recognition of Deferred Tax Assets for Unrealised Losses. AASB Amendments to Australian Accounting Standards - Disclosure Initiative: Amendments to AASB 107. AASB Amendments to Australian Accounting Standards Classification and Measurement of Sharebased Payment Transactions. AASB Amendments to Australian Accounting Standards Further Annual Improvements Cycles. The following standards have been identified as accounting standards which may impact the entity in the period of initial application. They are available for early adoption at 30 June 2017, but have not been applied in preparing this financial report. The Group will adopt these standards on their effective dates: AASB 9 Financial Instruments is effective for periods beginning on 1 July This standard introduces changes in the classification and measurement of financial assets and liabilities, including a new expected loss model for impairment and simplifications to hedge accounting. The impairment requirements are based on an expected credit loss model (ECL) that replaces the incurred loss model under the current accounting standard. AASB 9 will change the Group s current methodology for calculating the provision for doubtful debts, in particular for collective provisioning. The Group has not yet concluded the initial impact assessment, as the impact the new standard could have on the financial results will change as the circumstances of the Group change, up to the point of initial adoption. As such, it is not yet practical to reliably estimate the financial impact on the financial statements. SECTION 8: Other notes 47
77 Notes to the consolidated financial statements for the year ended 30 June Other significant accounting policies and new accounting standards (continued) AASB 15 Revenue from contracts with customers is effective for periods beginning on 1 July The core principle of AASB 15 is that an entity recognises revenue to depict the transfer of promised goods or services to customers in an amount that reflects the consideration to which the entity expects to be entitled in exchange for those goods or services. The model features a contract based five-step analysis of transactions to determine whether, how much and when revenue is recognised. The Group is currently undertaking an assessment of the potential impact of this standard. The potential impacts of this standard are yet to be determined. AASB 16 Leases is effective for periods beginning on 1 July AASB 16 requires lessees to recognise most leases on balance sheets as lease liabilities, with the corresponding right-of-use assets. Lessees must apply a single model for all recognised leases, but will have the option not to recognise short-term leases and leases of low-value assets. The Group is currently undertaking an assessment of the potential impact of this standard. The potential impacts of this standard are yet to be determined. Refer to note 8.1 for the Group's operating lease expenditure commitments. SECTION 8: Other notes 48
78 In accordance with a resolution of the Directors of MyState Limited, we state that: 1. In the opinion of the Directors: MyState Limited Directors' Declaration for the financial year ended 30 June 2017 (a) The financial statements and notes of the Group set out on pages 1 to 48 are in accordance with the Corporations Act 2001, including: (i) (ii) Giving a true and fair view of the Group's financial position as at 30 June 2017 and of its performance for the year ended on that date; and Complying with Accounting Standards, the Corporations Regulations 2001 and other mandatory professional reporting requirements; and (b) There are reasonable grounds to believe that MyState Limited will be able to pay its debts as and when they become due and payable. 2. The Directors have been given the declarations required by Section 295A of the Corporations Act 2001 by the Chief Executive Officer and Chief Financial Officer for the financial year ended 30 June The financial statements and notes also comply with International Financial Reporting Standards as disclosed in note 1.2. This declaration is made in accordance with a resolution of the Directors. On behalf of the Board M L Hampton Chairman C M Hollingsworth Director Hobart Dated this August
79
80
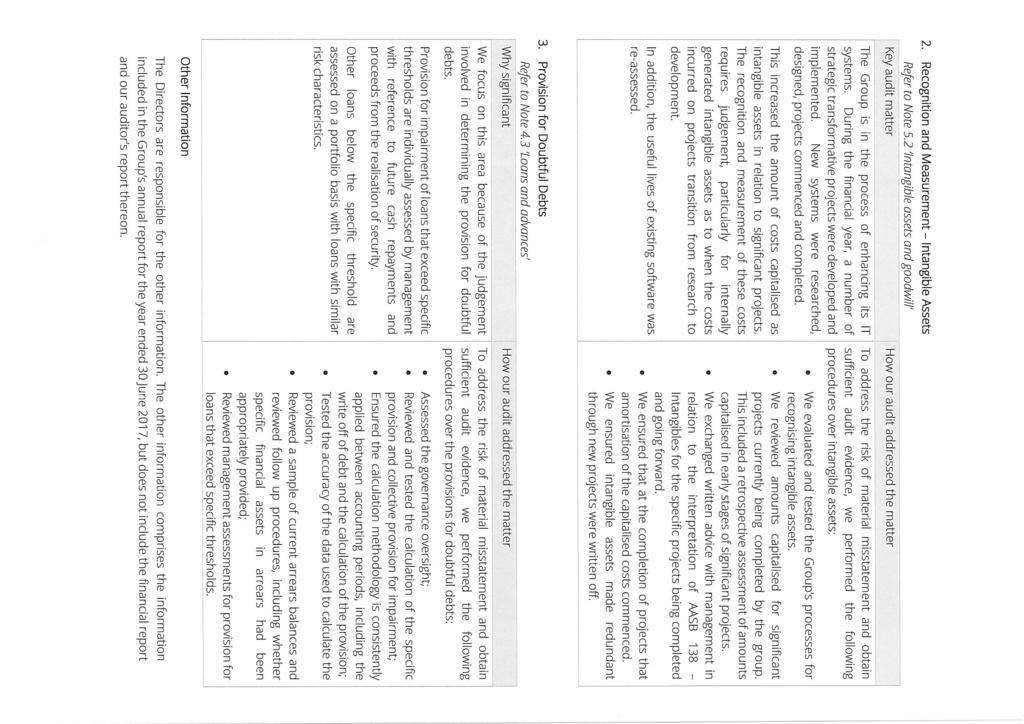
81
MyState Limited Directors Report
 Directors Report MyState Limited ABN 26 133 623 962 Directors Report Your Directors present their report on MyState Limited (the Company) for the financial year ended 30 June 2014. Directors and Company
Tasmanian Perpetual Trustees
 Trustees Managed Investment Schemes Financial Report Year ended 30 June 2017 Trustees Limited ABN 97 009 475 629 This Report comprises these Managed Investment Schemes: Contents ARSN ABN Directors Report
MyState Limited Remuneration Policy Board Approved August 2017
 Remuneration Policy Preamble This Policy applies to MyState Limited and all MyState Limited Group Companies and Subsidiaries. The Policy is compliant with applicable Australian Prudential Regulatory Standards.
MyState Limited Half Year Report (Appendix 4D) for the half year ended 31 December 2018
 for the half year ended 31 December 2018") 22 February 2019 ABN 26 133 623 962 Level 2, 137 Harrington Street Hobart 7000 Tasmania Australia The Manager Company Announcements Australian Securities Exchange 20 Bridge Street Sydney NSW 2000 Dear
22 February 2019 ABN 26 133 623 962 Level 2, 137 Harrington Street Hobart 7000 Tasmania Australia The Manager Company Announcements Australian Securities Exchange 20 Bridge Street Sydney NSW 2000 Dear
Document Hierarchy. Remuneration Policy. Board Policy
 Remuneration Policy Document Hierarchy Title of document Version 5.0 Category of document Applicable to Approval Authority Responsible Executive Board Policy MyState Group Board Via Group People and Remuneration
Financial Report for Long Term Fund
 Financial Report for Long Term Fund 2015-2016 Responsible Entity: Tasmanian Perpetual Trustees Limited ABN 97 009 475 629 a wholly owned subsidiary of MyState Limited ABN 26 133 623 962. Dear Investor,
Investor presentation
 FY17 INVESTOR PRESENTATION 1 18 August 2017 Investor presentation FY17 Agenda FY17 INVESTOR PRESENTATION 1. Overview & strategic landscape Melos Sulicich CEO & Managing Director 2. Financial results David
For personal use only
 17 February 2017 The Manager Company Announcements Australian Securities Exchange 20 Bridge Street Sydney NSW 2000 MyState Limited Correction to Investor Presentation Please be advised that an amendment
INVESTOR PRESENTATION
 INVESTOR PRESENTATION FULL YEAR FY2018 17 August 2018 AGENDA FY18 INVESTOR PRESENTATION 1. Highlights & strategy Melos Sulicich Managing Director & CEO 2. Financial results David Harradine Chief Financial
Underlying net profit after tax up 4.5% to $31.1 million $31.1m. Improved underlying cost to income ratio of 63.2%, down 112 basis points 63.
 ANNUAL REPORT 2016 Underlying net profit after tax up 4.5% to $31.1 million $31.1m Improved underlying cost to income ratio of 63.2%, down 112 basis points 63.2% Improved return on average equity of 10.6%,
Public Disclosure of Prudential Information in accordance with APRA Prudential Standard APS 330
 AUSTRALIAN CENTRAL CREDIT UNION LTD (TRADING AS PEOPLE'S CHOICE CREDIT UNION) ABN 11 087 651 125 AFSL 244310 Public Disclosure of Prudential Information in accordance with APRA Prudential Standard APS
APPENDIX 4D INTERIM FINANCIAL REPORT FOR THE SIX MONTHS ENDED 31 DECEMBER 2017
 Link Administration Holdings Limited ABN 27 120 964 098 Market Announcements Office ASX Limited 20 Bridge St SYDNEY NSW 2000 ASX ANNOUNCEMENT APPENDIX 4D INTERIM FINANCIAL REPORT FOR THE SIX MONTHS ENDED
For personal use only
 Appendix 4E (ASX Listing Rule 4.3A) PRELIMINARY FINAL REPORT Cochlear Limited ACN 002 618 073 30 June 2012 Results for announcement to the market Revenue A$000 down 4% to 778,996 Earnings before interest,
AMP Bank Limited. Remuneration disclosures. For the period 1 January 2015 to 31 December 2015
 Remuneration disclosures For the period 1 January 2015 to 31 December 2015 Remuneration disclosures for the year ended 31 December 2015 The remuneration disclosures have been prepared in accordance with
Common Disclosure Template - Capital
 Common Disclosure Template - Capital ABN: 88 087 651 956 Figures are reported on a Level 2 basis Greater Bank is using the post 1 January 2018 common disclosure template because we are fully applying the
Example Accounts Only
 Financial Statements Disclaimer: These financials include illustrative disclosures for a listed public company and are not intended to be and are not comprehensive in relation to its subject matter. This
Contents. Chairman and Managing Director s Report. About Money3. FY16 Key Highlights. Financial Report
 Annual Report Contents About Money3 1 FY16 Key Highlights 2 Chairman and Managing Director s Report 3 Financial Report 6 About Money3 Money3 is a national credit provider committed to servicing the needs
Bendigo and Adelaide Bank Limited APRA Prudential Standard APS 330 Basel III Pillar 3 Annual Remuneration Disclosures as at 30 June 2014
 Bendigo and Adelaide Bank Limited APRA Prudential Standard APS 330 Basel III Pillar 3 Annual Remuneration Disclosures as at 30 June 2014 Bendigo and Adelaide Bank Limited ABN 11 068 049 178 AFSL 237879
For personal use only
 Appendix 4D Half Year Results For the period ended 31 December 2015 Released 15 February 2016 ABN 11 068 049 178 This report comprises information given to the ASX under listing rule 4.2A. Information
It is therefore pleasing to report that this evolution of BOQ has continued throughout this financial year.
 1 2 Good morning everyone. I will start with the highlights of the results. The strategy we have been implementing in the past few years has transformed BOQ into a resilient, multi-channel business that
Notice of Annual. General Meeting
 Notice of Annual General Meeting 2019 00110010 00110000 00110001 00111001 00100000 01001110 01101111 01110100 01101001 01100011 01100101 00100000 01101111 01100110 00100000 01000001 01000111 01001101 01001001
REMUNERATION REPORT For the year ended 30 June 2016
 MESSAGE FROM THE BOARD Dear Shareholder, We are pleased to present our Remuneration Report for the financial year to 30 June 2016. Our aim with remuneration is to retain, reward and incentivise our Executives
Directors report. Matters subsequent to the end of the financial year. Directors. Likely developments and expected results of operations
 Directors report The Directors present their report together with the financial statements of CO2 Group Limited (referred to hereafter as the Group) consisting of CO2 Group Limited and the entities it
B A SE L III P IL L A R 3 A NNUA L RE MUNE R AT ION DIS C LO S URE S A S AT 3 0 J UNE 2016
 Bendigo and Adelaide Bank Limited B A SE L III P IL L A R 3 A NNUA L RE MUNE R AT ION DIS C LO S URE S A S AT 3 0 J UNE 2016 Bendigo and Adelaide Bank Limited ABN 11 068 049 178 AFSL 237879 Bendigo and
ANZ appoints Hongkong and Shanghai Bank s Michael Smith to succeed John McFarlane on 1 October 2007
 For Release: 12 June 2007 Corporate Communications 100 Queen Street Melbourne Vic 3000 www.anz.com ANZ appoints Hongkong and Shanghai Bank s Michael Smith to succeed John McFarlane on 1 October 2007 Mr
FY2015. Highlights. MyState Limited
 2015 Annual Report Net profit after tax increased to $32.5 milllion Improved cost-to-income ratio of 64.4%, down from 64.5% Improved return on average equity of 11.2%, up from 10.5% 28.5 28.5 total dividend
For personal use only
 Appendix 4E Full Year Results For the year ended 30 June 2017 Released 14 August 2017 ABN 11 068 049 178 This report comprises information given to the ASX under listing rule 4.3A THIS PAGE HAS BEEN LEFT
Plans for Conclusion
 Remuneration committee report The committee has set targets for the EIP for 2017 which will be disclosed in the remuneration committee report next year. Legacy LTIP scheme The long term financial and shareholder
1H19 RESULTS PRESENTATION
 1H19 RESULTS PRESENTATION 11 APRIL 2019 Half year ended 28 February 2019 Anthony Rose Interim CEO Matt Baxby Chief Financial Officer Anthony Rose Interim CEO 2 Niche growth, asset quality and capital remain
NOTICE OF ANNUAL GENERAL MEETING
 2018 NOTICE OF ANNUAL GENERAL MEETING PRIMARY HEALTH CARE LIMITED (ACN 064 530 516) NOTICE is hereby given of the Annual General Meeting (this AGM or this Meeting) of members of Primary Health Care Limited
REMUNERATION REPORT LETTER FROM THE PEOPLE AND REMUNERATION COMMITTEE CHAIRMAN
 REMUNERATION REPORT LETTER FROM THE PEOPLE AND REMUNERATION COMMITTEE CHAIRMAN Dear Shareholder IAG is pleased to present its Remuneration Report for the year ended 30 June 2015. The People and Remuneration
AUSTRALIA AND NEW ZEALAND BANKING GROUP LIMITED ABN
 AUSTRALIA AND NEW ZEALAND BANKING GROUP LIMITED ABN 11 005 357 522 Media Release For Release: 2 May 2012 ANZ 2012 Half Year Result - super regional strategy delivers solid performance, higher dividend
Directors. M. Smith (Chairman) D. Grant. P. James. L. McCann. P. McCarney appointed 22 April P. O Sullivan appointed 22 April 2014
 D. Grant. P. James. L. McCann. P. McCarney appointed 22 April P. O Sullivan appointed 22 April 2014") Photograph by Shoaib Mohammed, Customer Services Officer Your directors present their report on the consolidated entity (referred to hereafter as the Group) consisting of iinet Limited ( iinet ) and the
Photograph by Shoaib Mohammed, Customer Services Officer Your directors present their report on the consolidated entity (referred to hereafter as the Group) consisting of iinet Limited ( iinet ) and the
SUNCORP BANK APS 330 SUNCORP GROUP LIMITED FOR THE QUARTER ENDED 30 SEPTEMBER 2018 RELEASE DATE: 7 NOVEMBER 2018
 SUNCORP GROUP LIMITED SUNCORP BANK APS 330 FOR THE QUARTER ENDED 30 SEPTEMBER 2018 RELEASE DATE: 7 NOVEMBER 2018 Suncorp Group Limited ABN 66 145 290 124 BASIS OF PREPARATION This document has been prepared
FULL YEAR FINANCIAL STATEMENTS
 Perpetual Limited ABN 86 000 431 827 and its controlled entities FULL YEAR FINANCIAL STATEMENTS 30 June 2015 Directors' Report for the year ended 30 June 2015 The Directors present their report together
Basel III Pillar 3. Annual Remuneration Disclosures as at 30 June Commonwealth Bank of Australia ACN
 Basel III Pillar 3 Annual Remuneration Disclosures as at 30 June 2017 Commonwealth Bank of Australia ACN 123 123 124 Basel III Pillar 3 Remuneration disclosures Annual remuneration disclosures as at 30
UBS FINANCIAL SERVICES CONFERENCE Business Update
 UBS FINANCIAL SERVICES CONFERENCE Business Update Radisson Hotel Sydney 20 June 2007 John Nesbitt Chief Financial Officer Perpetual Limited 1 Slide #0: UBS Financial Services Conference Introduction Thanks
2016 Remuneration Report
 This 2016 remuneration report outlines the remuneration arrangements in place for the directors and executives of the Company and the Group in accordance with the Corporations Act 2001 and its Regulations
NEWS RELEASE ANZ FULL YEAR 2018 RESULT
 31 OCTOBER 2018 NEWS RELEASE ANZ FULL YEAR 2018 RESULT ANZ today announced a Statutory Profit after tax for the Full Year ended 30 September 2018 of $6.40 billion, flat on the comparable period and a Cash
APS 330 Common Disclosure
 APS 330 Common Disclosure 30 June 2018 APS 330 Common Disclosure 30 June 2018 (In accordance with APRA Prudential Standard APS 330) COMMON EQUITY TIER 1 CAPITAL: INSTRUMENTS AND RESERVES A$m 1 Directly
Basel III Pillar 3 Annual Remuneration Disclosures as at 30 June 2018
 APRA Prudential Standard APS 330 Rural Bank Limited ABN 74 083 938 416 AFSL 238042 Basel III Pillar 3 Annual Remuneration Disclosures as at 30 June 2018 Rural Bank Limited Basel III Pillar 3 Annual Remuneration
MyState Limited A Growing Banking & Wealth Management Group
 ASX Code: MYS December 20 MyState Limited A Growing Banking & Wealth Management Group Melos Sulicich Managing Director & CEO UBS Australian Small Caps Conference Our core businesses Customers 240,000 Branch
For personal use only
 Notice of Annual General Meeting Notice is given that the Annual General Meeting (the AGM ) of SEEK Limited ( SEEK ) will be held at: Venue: Arthur Streeton Auditorium Sofitel Melbourne 25 Collins Street
Notice of Extraordinary General Meeting. Challenger Limited. Notice of Extraordinary General Meeting. Challenger Limited (ABN )
") Notice of Extraordinary General Meeting Challenger Limited Notice of Extraordinary General Meeting Challenger Limited (ABN 85 106 842 371) NOTICE OF EXTRAORDINARY GENERAL MEETING NOTICE is hereby given
Notice of Extraordinary General Meeting Challenger Limited Notice of Extraordinary General Meeting Challenger Limited (ABN 85 106 842 371) NOTICE OF EXTRAORDINARY GENERAL MEETING NOTICE is hereby given
FULL YEAR FINANCIAL STATEMENTS
 SECTION HEAD TAB GOES HERE Perpetual Limited ABN 86 000 431 827 and its controlled entities FULL YEAR FINANCIAL STATEMENTS 30 June 2016 Title of Document goes here_1 Directors' Report for the year ended
Westpac Banking Corporation - New Zealand Division Disclosure Statement. For the three months ended 31 December 2012
 Westpac Banking Corporation - New Zealand Division Disclosure Statement For the three months ended 31 December 2012 Index 1 General information and definitions 1 General matters 2 Credit ratings 2 Disclosure
Interim Financial Report 31 DECEMBER IMB Ltd
 Interim Financial Report 31 DECEMBER 2014 IMB Ltd 92 087 651 974 Chairman s REVIEW PERFORMANCE The IMB Group recorded a net profit after tax of $14.5 million for the half year to 31 December 2014, a 6%
Remuneration Report. p.32
 Remuneration Report Introduction Content of the Report This Remuneration Report outlines the director and executive remuneration arrangements of Crown in accordance with the requirements of the Corporations
FOR THE HALF-YEAR ENDED 28 FEBRUARY Bank of Queensland Limited ABN AFSL No
 FOR THE HALF-YEAR ENDED 28 FEBRUARY 2017 Bank of Queensland Limited ABN 32 009 656 740. AFSL No 244616. JON SUTTON Managing Director & CEO ANTHONY ROSE Chief Financial Officer JON SUTTON Managing Director
For personal use only
 ANNUAL REPORT 30 June 2012 Run Corp Limited and Controlled Entities ACN 111 764 437 run.com.au CONTENTS Chairman s Letter 1 Chief Executive Officer s Report 2 Directors Report 4 Corporate Governance Statement
CONNECTING HEALTH SOLUTIONS. Annual Report 2016/17
 CONNECTING HEALTH SOLUTIONS Annual Report /17 CONTENTS Directors Report 01 Remuneration Report /17 04 Auditor s Independence Declaration 22 Financial Statements 23 Consolidated Statement of Comprehensive
Australia and New Zealand Banking Group Limited
 Australia and New Zealand Banking Group Limited ABN 11 005 357 522 31 March 2017 Consolidated Financial Report Dividend Announcement and Appendix 4D The Consolidated Financial Report and Dividend Announcement
QUARTER ENDING DECEMBER Incorporating the requirements of Australian Prudential Standard 330. MyState Limited APS330
 Incorporating the requirements of Australian Prudential Standard 330 QUARTER ENDING DECEMBER 2016 1 EXECUTIVE SUMMARY MYSTATE This document has been prepared by MyState Limited to meet the disclosure obligations
Governance Directors remuneration report Directors remuneration policy
 Directors remuneration policy 83 This section sets out the Directors remuneration policy of the Company. In accordance with section 439A of the Companies Act, a binding shareholder resolution to approve
Corum Group Limited ANNUAL REPORT 2015
 Corum Group Limited ANNUAL REPORT 2015 Corum Group Limited ABN 25 000 091 305 and its controlled entities Contents Chairman s Letter to Shareholders 2 Directors Report 3 Page Auditor s Independence Declaration
Bank of Queensland Full year results 31 August Bank of Queensland Limited ABN AFSL No
 Bank of Queensland Full year results 31 August 2013 Bank of Queensland Limited ABN 32 009 656 740. AFSL No 244616. Agenda Result overview Stuart Grimshaw Managing Director and CEO Financial detail Anthony
Directors remuneration report
 78 Capita plc Annual statement from the Remuneration Committee Chair Dear shareholder, It is my pleasure to report on the activities of the Remuneration Committee for the period to ember. This year s remuneration
Directors' Report Remuneration Report
 Directors' Report Remuneration Report Dear Shareholder On behalf of your Board, I am pleased to present our Directors Remuneration Report for the financial year ended 31 December 2016. This introduction
Profit Announcement For the full year ended 30 June 2013
 Profit Announcement For the full year ended 30 June 2013 COMMONWEALTH BANK OF AUSTRALIA ACN 123 123 124 14 AUGUST 2013 FIND OUT MORE VIA OUR APP ASX Appendix 4E Results for announcement to the market (1)
For personal use only
 21 March 2014 The Manager Company Announcements Office Australian Stock Exchange Exchange Centre 20 Bridge Street SYDNEY NSW 2000 ELECTRONIC LODGEMENT Dear Sir or Madam, Notice of 2014 Annual General Meeting
Basel III Pillar 3 Annual Remuneration Disclosures as at 30 June 2015
 APRA Prudential Standard APS 330 Rural Bank Limited ABN 74 083 938 416 AFSL 238042 Basel III Pillar 3 Annual Remuneration Disclosures as at 30 June 2015 Rural Bank Limited Basel III Pillar 3 Annual Remuneration
CBUS REMUNERATION POLICY
 CBUS REMUNERATION POLICY POLICY ADMINISTRATION SCHEDULE Policy Owner Who the Policy applies to Group Executive People Technology & Enablement All employees and Directors of United Super Pty Ltd ( Cbus,
ANNUAL REPORT. SP Telemedia Limited ABN
 2009 ANNUAL REPORT SP Telemedia Limited ABN 46 093 058 069 SP Telemedia Limited and its controlled entities ABN 46 093 058 069 Annual Report 31 July 2009 2 Contents Directors report (including corporate
For personal use only
 Preferred Capital Limited ABN 68 101 938 176 Annual Financial Report For the year ended 30 June 2015 Not guaranteed by Commonwealth Bank of Australia Annual Report for the year ended 30 June 2014 Contents
For personal use only ANZ BANK NEW ZEALAND LIMITED REGISTERED BANK DISCLOSURE STATEMENT
 ANZ BANK NEW ZEALAND LIMITED REGISTERED BANK DISCLOSURE STATEMENT FOR THE NINE MONTHS ENDED 30 JUNE 2016 NUMBER 82 ISSUED AUGUST 2016 ANZ Bank New Zealand Limited REGISTERED BANK DISCLOSURE STATEMENT FOR
ASX Announcement CBA 1H18 Result
 ASX Announcement CBA Result For the half year ended 31 December 2017 Reported 7 February 2018 Guide to CBA s financial results CBA s net profit after tax is disclosed on both a statutory and cash basis,
2 AUSTRALIAN CENTRAL CREDIT UNION LTD AND ITS CONTROLLED ENTITIES FOR THE YEAR ENDED 30 JUNE 2010
 2 3 Annual Financial Report CONTENTS PAGE Directors Report 4-6 Lead Auditor s Independence Declaration 7-7 Corporate Governance Statement 8-11 Independent Auditor s Report 12-13 Directors Declaration 14-14
2015 Executive Officer Remuneration Disclosures. MLC Nominees Pty Limited
 Executive Officer Remuneration Disclosures MLC Nominees Pty Limited January 2016 1. Introduction This document is designed to provide stakeholders with details about Executive Officer remuneration for
Babcock & Brown Infrastructure Trust
 Babcock & Brown Infrastructure Trust Financial Report for the financial year ended 30 June www.bbinfrastructure.com Annual financial report for the financial year ended 30 June Page number Report of the
HALF YEAR RESULTS 2017
 HALF YEAR RESULTS Incorporating the requirements of Appendix 4D The half year results announcement incorporates the half year report given to the Australian Securities Exchange (ASX) under Listing Rule
REMUNERATION REPORT for the year ended 30 June 2017
 REMUNERATION REPORT MESSAGE FROM THE BOARD Dear Shareholder, It is with pleasure that we present our Remuneration Report for the financial year to 30 June 2017. While the past 12 months have not been without
Annual report. For the financial year ending ₃₀ June ₂₀₁₇ National Mutual Pro-Super Fund. Welcome. We're here to help. Contents
 Annual report For the financial year ending ₃₀ June ₂₀₁₇ National Mutual Pro-Super Fund Contents Super fund information Introduction to the fund Super news Product news Other information 2 3 4 6 6 We're
Remuneration Report. Overview of Remuneration Policy. Introduction. Philosophy. Persons to whom Report applies
 This for the year ended 30 June 2014, outlines the Director and executive remuneration arrangements of Crown in accordance with the requirements of the Corporations Act 2001 and its regulations. For the
2015 Executive Officer Remuneration Disclosures. NULIS Nominees Pty Limited
 Executive Officer Remuneration Disclosures NULIS Nominees Pty Limited January 2016 1. Introduction This document is designed to provide stakeholders with details about Executive Officer remuneration for
TISO BLACKSTAR GROUP SE (TBG) REMUNERATION POLICY APPROVED BY THE TBG REMUNERATION COMMITTEE
 REMUNERATION POLICY APPROVED BY THE TBG REMUNERATION COMMITTEE") TISO BLACKSTAR GROUP SE (TBG) REMUNERATION POLICY APPROVED BY THE TBG REMUNERATION COMMITTEE CONTENTS PAGE 1. REMUNERATION PHILOSOPHY 3 2. REMUNERATION FRAMEWORK 3 3. IMPLEMENTATION 4 3.1 Guarantee package
TISO BLACKSTAR GROUP SE (TBG) REMUNERATION POLICY APPROVED BY THE TBG REMUNERATION COMMITTEE CONTENTS PAGE 1. REMUNERATION PHILOSOPHY 3 2. REMUNERATION FRAMEWORK 3 3. IMPLEMENTATION 4 3.1 Guarantee package
Appendix 4E and Full Year Financial Report
 Appendix 4E and Full Year Financial Report For the year ended Lodged with the ASX under Listing Rule 4.3A ABN 50 103 827 836 Appendix 4E Preliminary final report 1. Company details Name of entity: ABN:
For personal use only
 AUSTRALIAN FINANCE GROUP LIMITED ABN 11 066 385 822 Appendix 4E Preliminary Final Report for the year ended 30 June 2015 Contents Page Results for announcement to market 2 Discussion and analysis of the
ANNUAL REPORT
 ANNUAL REPORT Contents 01 Directors report 07 Remuneration report 22 Auditor s independence declaration 23 Consolidated statement of profit or loss and other comprehensive income 24 Consolidated statement
ASX Release. 24 April 2018
 ASX Release 24 April 2018 Westpac 2018 Interim Financial Results Template The Westpac has today released the template for its 2018 Interim Financial Results. It outlines the changes that will be made in
REPORT OF THE DIRECTORS ON REMUNERATION CONTINUED DIRECTORS REMUNERATION POLICY
 REPORT OF THE DIRECTORS ON REMUNERATION CONTINUED DIRECTORS REMUNERATION POLICY Introduction In this section of the Report of the Directors on Remuneration we provide details of the Company s new Remuneration
26 October 2016 MyState Limited Annual General Meeting
 ASX Code: MYS 26 October 2016 MyState Limited Annual General Meeting This presentation contains certain forward-looking statements with respect to the financial condition, results of operations, business
7 June Dear Securityholder
 Macquarie Bank Limited ABN 46 008 583 542 No.1 Martin Place Telephone (61 2) 8232 3333 Sydney NSW 2000 Facsimile (61 2) 8232 4330 GPO Box 4294 Internet www.macquarie.com.au Sydney NSW 1164 AUSTRALIA 7
QANTM Intellectual Property Limited ABN and Controlled Entities Financial report for the year ended 30 June 2017
 QANTM Intellectual Property Limited ABN 612 441 326 and Controlled Entities Financial report for the year ended 30 June 2017 APPENDIX 4E PRELIMINARY FINAL REPORT FOR THE YEAR ENDED 30 JUNE 2017 Key Information
198% 123% 142% 236% Directors Remuneration report. Dear Shareholder. Annual statement
 Directors Remuneration report Annual statement 2009 Overview Underlying Profit Before Tax Clare Hollingsworth Chairman of the Remuneration Committee 198% Dear Shareholder On behalf of the Board, I am pleased
The changes proposed are largely in adherence to best practice and to reflect the terms agreed for the new Executive Directors.
 Directors Remuneration Policy The Remuneration Policy for Executive Directors and Non-executive Directors, which Shareholders were asked to approve at the AGM on 27 April 2017 and which will apply to payments
At a glance...5. Executive summary...6. Net Interest Income Asset Quality Non-interest income Capital Costs...
 At a glance...5 Executive summary...6 Net Interest Income... 10 Asset Quality... 13 Non-interest income... 15 Capital... 17 Costs... 19 Return on Equity... 21 Major Australian Banks: Half Year 2018 Results
HSBC Bank Australia Ltd A.C.N Financial Report Year Ended 31 December 2011
 HSBC Bank Australia Ltd Financial Report Year Ended 31 December 2011 Contents CONTENTS... 2 DIRECTORS REPORT... 3 INCOME STATEMENTS... 6 STATEMENTS OF FINANCIAL POSITION... 7 STATEMENTS OF COMPREHENSIVE
Annual General Meeting. 7 August 2018
 Annual General Meeting 7 August 2018 Welcome Steven Sargent Chairman 2 Agenda Chairman s Address CEO s Address Formal Business Close Refreshments 3 Chairman s Address Steven Sargent Chairman 4 CEO s Address
2017 Executive Officer Remuneration Disclosures. NULIS Nominees (Australia) Limited
 Limited") Executive Officer Remuneration Disclosures NULIS Nominees (Australia) Limited January 2018 Statutory Remuneration Disclosures Introduction Section 1 Introduction This document is designed to provide stakeholders
Executive Officer Remuneration Disclosures NULIS Nominees (Australia) Limited January 2018 Statutory Remuneration Disclosures Introduction Section 1 Introduction This document is designed to provide stakeholders
For personal use only
 The Manager Company Announcements Office Australian Stock Exchange Exchange Centre 20 Bridge Street SYDNEY NSW 2000 5 May 2016 ELECTRONIC LODGEMENT Dear Sir or Madam, RE: CHAIRMAN AND CEO'S ADDRESS 2016
Remuneration committee report. Remuneration committee chairman s annual statement. Directors remuneration policy
 David Harrel Senior Independent Director Remuneration committee chairman s annual statement Last year we obtained shareholder approval for our remuneration policy and the introduction of the new Executive
Notice of Annual General Meeting 2014
 PROTECTION & PERFORMANCE Notice of Annual General Meeting 2014 Notice is given that the Annual General Meeting of Ansell Limited will be held at the Park Hyatt, 1 Parliament Place, East Melbourne Victoria
For personal use only
 OtherLevels Holdings Limited ACN 603 987 266 Annual report Annual report for the year ended 30 June 2018 Contents Page Chairman and Managing Director s message 2 Corporate governance statement 5 Financial
Attributable to: Ordinary equity holders of the parent Up 61.8% Non-controlling interest (1.7) Up 100.0%
 Up 100.0%") Appendix 4E Results for announcement to the market for the financial year ended 30 June. ASX Listing Rule 4.3A. Reporting period Reporting period: 30 June. Previous corresponding period: 30 June. Results
Appendix 4E Results for announcement to the market for the financial year ended 30 June. ASX Listing Rule 4.3A. Reporting period Reporting period: 30 June. Previous corresponding period: 30 June. Results
For personal use only
 Appendix 4E Final Report Clarity OSS Limited Appendix 4E Final Report Name of Entity CLARITY OSS LIMITED ACN 057 345 785 Financial Year Ended 30 June 2016 Previous Corresponding Reporting Period 6 July
HSBC Holdings plc. Directors Remuneration Policy Supplement 2017
 HSBC Holdings plc Directors Remuneration Policy Supplement 2017 Directors remuneration policy This supplement sets out our new remuneration policy for executive and non-executive Directors that was approved
Bendigo and Adelaide Bank Limited ABN
 Bendigo and Adelaide Bank Limited Appendix 4D Half Year Report Half Year Announcement Half Year Financial Report For the period ending 31 December 2011 Released 20 February 2012 This report comprises information
TPG Telecom Limited ABN ANNUAL REPORT
 TPG Telecom Limited ABN 46 093 058 069 ANNUAL REPORT TPG Telecom Limited and its controlled entities ABN 46 093 058 069 Annual Report 31 July 2011 2 TPG Telecom Limited and its controlled entities Annual
NATIONAL HEALTH CO-OPERATIVE OPERATIVE LIMITED ABN
 NATIONAL HEALTH CO-OPERATIVE OPERATIVE LIMITED FINANCIAL REPORT FOR THE YEAR ENDED 30 JUNE 2016 DIRECTORS REPORT Your directors present this report on the co-operative for the financial year ended 30 June
ECU Australia Ltd APS 330 Public Disclosure - June 2015 Capital Disclosure. Common Equity Tier 1 Capital: Instruments and Reserves
 Common Equity Tier 1 Capital: Instruments and Reserves '000 1 Directly issued qualifying ordinary shares (and equivalent for mutually-owned entities) capital 2 Retained earnings 18,741 3 Accumulated other