Group Sales Team Contribution Ratio
|
|
|
- Gordon Rice
- 5 years ago
- Views:
Transcription


1


2 Incremental Group ACV Subscriptions globally Group Sales Team Contribution Ratio Group Subscription churn Average Revenue per Subscription (ARPS) 1 ACV = Annualised Contract Value All currency amounts are in AU dollars unless otherwise noted.
3 AUD$ ,000 9,000 20, % % % % 26% 8,000 7,000 6,000 5,000 4,000 18,000 16,000 14,000 12,000 10,000 8,000 3,000 6,000 2,000 4,000 1,000 2, Jun Dec Jun Dec Jun 18 US Jun Dec Jun Dec Jun 18 US 5,539 8,737 11,443 14,648 18,404 AU 6,827 7,019 7,227 7,477 7,917 AU 5,039 5,272 5,540 5,799 6,167 AU US US AU 1 ARPS = Average Revenue per Subscription Refer Appendix 2 US ACV translated at period end exchange rate Refer Nearmap FY18 Analyst Pack for period-on-period FX impact


 (3.5) 12 Month Churn (%) 10.3% 7.")
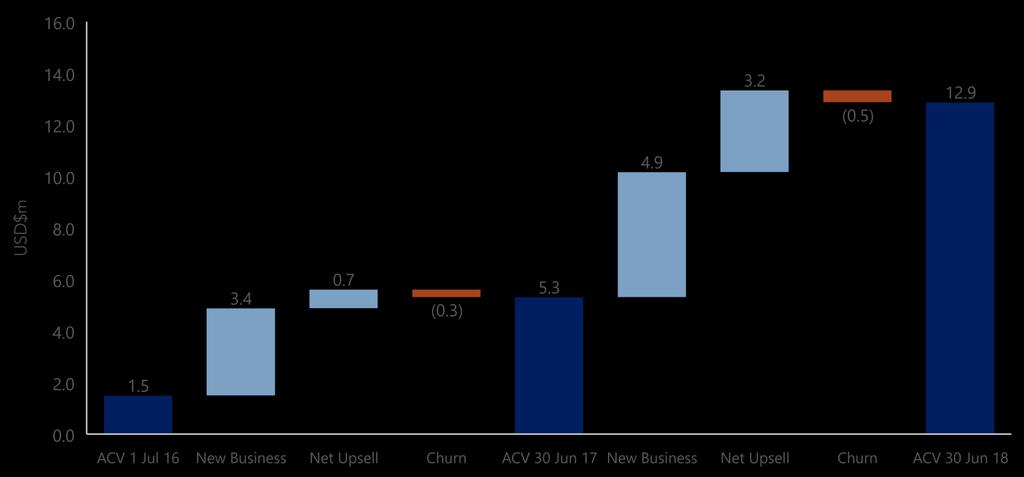
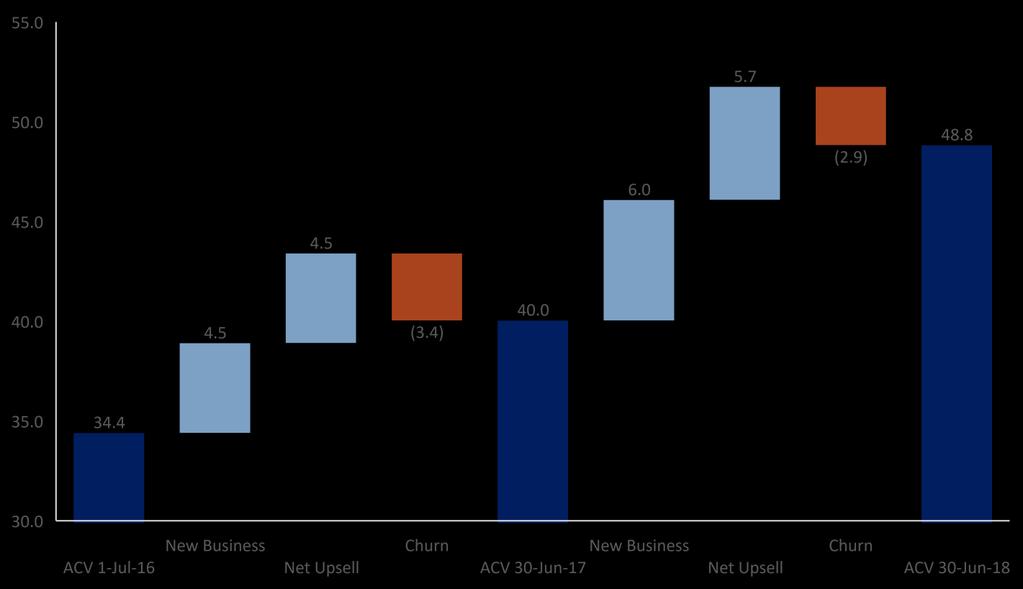
4 Growth in New Business ACV in FY18 compared to pcp Growth in Net Upsell ACV in FY18 compared to pcp 1 prior comparative period Refer Appendix FY18 group churn a 2.8% reduction and lower in dollar terms than FY17 Group Sales Team Contribution Ratio (STCR) an increase from 90% in FY17, reflecting improved productivity from the investment in sales and marketing 2 Net Upsell value of upsell minus downsell on subscriptions renewed during the period $M FY17 FY18 Opening portfolio New business Net upsell Churn (3.7) (3.5) 12 Month Churn (%) 10.3% 7.5% Net incremental FX impact Closing portfolio


5


6


7 Subscriptions at year end, 13% growth on pcp. Global customer base diversified across a range of industry sectors Percentage of subscriptions globally on a multi-year basis highlighting the value of Nearmap content ACV value of active subscriptions globally incorporating Oblique and Panorama product features as part of their subscription at 30 June Already over 1/7 th of total portfolio, aiding customer retention and renewal


8 1 LTV = Lifetime Value Refer Appendix. Measured since 30 June US ACV translated at period end exchange rate Refer Analyst Pack for period-on-period FX impact


9 Oblique capture footprint in place early commencement of FY19 captures Footprint increased to areas of urban development and customer interest Investments in direct sales and marketing generated 114% return through Sales Team Contribution Ratio Increased indirect investments reflecting technical sales and support, sales training and administration Reduced expenditure on camera systems offset by increased software and product development: 3D New MapBrowser Oblique and Panorama FY18 has seen investment in corporate infrastructure, including new head office rental premises, scaling of the executive team, and back end systems enhancements to provide scalable growth Expansion into New Zealand with product launch


 $(10.")
10 $64.2m Total cash receipts $(75.0m) Total cash payments (net of interest) $(10.8m) Net cash outflow

% Gross profit 2,3 34.7 43.")
% EBIT (2.8) (8.")
% (Loss) after tax (6.7) (11.")


11 $m FY17 FY18 Change on pcp ACV % Total revenue % Cost of revenue (73)% Gross profit 2, % Gross margin (%) 85% 81% (5)% Operating expenses (38)% EBIT (2.8) (8.4) >(100)% D&A (51)% EBITDA (17)% (Loss) after tax (6.7) (11.0) (64)% 1 Excludes impact of realised and unrealised FX gains / losses 2 Gross profit and operating expenses restated in FY17 to reflect revised financial reporting and business model assumptions. Refer Appendix 3 Excludes interest and other income

,")


12 Global aerial imagery market estimated at USD$7.4 billion (2018), growing to USD$10.1 billion in World leading technology and product Subscription business model opens up aerial imagery to new customers and use cases In the USD$339 billion global geospatial industry market 1 : 3D scanning software and services global market USD$3.8 billion (2018) 1 GIS / Spatial Analytics content global market USD$18.4 billion 1 Nearmap s unique business model has the potential to scale to multiple geographies around the world, particularly developed economies with an advanced level of adoption of geospatial technology, software and services 1 Geobuiz Geospatial Industry Outlook & Readiness Index 2018 edition, Geospatial Media & Communications 2 Nearmap company estimates


13 Full first pass of oblique capture footprint complete in both Australia and the United States 2nd pass of captures already underway 3D content derived from these captures processed using a high performance 3D pipeline Based on customer feedback, 3D content being made available in a number of formats Proven success with telco wireless planning, public safety, property management and construction and engineering Initial pricing utilises an area of interest unit based pricing model, typically a per square kilometre basis. As 3D content is enabled in the Nearmap platform, other pricing models will be explored Sales focus on target 3D growth industries including telco wireless planning, public safety, property management and construction and engineering Continued investment in 3D content standards to support greater range of customer applications Enabling 3D content in Nearmap MapBrowser technology platform Expanding location content offerings that allows for rapid transformation of 2D data into 3D reality.


14 Australia Commercialise new product Deepen / broaden customer experience United States Maintain enterprise sales success Build on capability in SME long tail Establish New Zealand operations following domestic launch in August 2018 Explore potential for national and multinational partnerships to: Expand channels for content delivery Explore geographic expansion 3D strategy as outlined on previous slide Continued focus on innovation and R&D, including development of early stage machine learning capability Continuing to enhance our capture, processing and delivery productivity The Group will tactically review our levels of investment and we expect FY19 to be cash flow break even

15


16 80% of Nearmap customers experience reductions in physical site visits, with a consequent impact on employee safety key insights from a location can be obtained without presenting occupational health & safety risks Reductions in physical site visits have a consequent impact on productivity and emissions from reduced travel and time on site Employee Matching Share Plan Employees can elect to contribute up to 10% of gross pay to purchase Nearmap shares, with the company providing a matching share for every three purchased, subject to time based vesting Life Event Support Up to 12 weeks paid parental leave for primary carers and 2 weeks paid parental leave for secondary carers. LinkedIn Learning Access to LinkedIn Learning modules Other benefits Include Employee Helpline, Phone Allowance, Flexible Working with the opportunity to work from home, flu vaccinations, well-being allowance, discounts with corporate health providers. Nearmap s content facilitates a range of use cases which benefit the broader community, including police search & rescue, emergency response, monitoring of historic houses and sites, and urban planning including smart cities
17 FY17 FY18 AU$m AU US Unallocated Group AU US Unallocated Group Revenue Cash cost to capture (2.3) (7.1) - (9.4) (3.0) (13.5) - (16.5) Storage, admin & other (1.2) (1.5) - (2.7) (1.0) (3.0) - (4.0) Total cost of sales (3.5) (8.6) - (12.1) (4.0) (16.4) - (20.4) Gross profit pre-capitalisation 32.8 (4.3) (5.8) Direct sales & marketing (5.8) (5.9) - (11.8) (7.5) (9.0) - (16.5) Indirect sales & marketing (2.0) (2.3) - (4.3) (2.7) (4.0) - (6.7) Total sales & marketing (7.8) (8.2) - (16.0) (10.2) (13.0) - (23.2) Product & Technology expensed (1.4) (1.0) (3.3) (5.7) (1.7) (1.2) (5.3) (8.2) Product & Technology development costs - - (5.6) (5.6) - - (7.2) (7.2) Total Product & Technology (1.4) (1.0) (8.9) (11.3) (1.7) (1.2) (12.5) (15.3) Corporate costs (3.5) (3.8) (3.0) (10.2) (5.2) (5.5) (2.9) (13.6) Segment Contribution 20.1 (17.3) (11.4) (8.6) 21.8 (25.5) (14.8) (18.4) Camera units (3.9) (1.8) Corporate CAPEX (0.6) (0.8) Total CAPEX (4.5) (2.6) Cash receipts from unearned income Capital raise net proceeds Other items Net increase / (decrease) in cash 16.1 (10.8)
18 AU$m FY17 FY18 Revenue Other income Total revenue Employee benefits expense (22.7) (31.0) Amortisation and depreciation (7.5) (13.3) Net foreign exchange differences (0.5) (0.2) AU$m FY17 FY18 AU Contribution US Contribution (13.0) (17.2) Unallocated (5.9) (7.6) Group Contribution 2.2 (1.9) Other operational expenses (11.9) (17.9) Total expenses (42.6) (62.4) Loss before tax (1.5) (8.2) Income tax (expense) / benefit (3.8) (2.8) Loss for the half year (5.3) (11.0) Other comprehensive income Items that may be reclassified to the profit and loss Exchange differences on translation of foreign operations - (0.3) Unrealised gain / (loss) on cash flow hedges Income tax associated with these items - (0.1) Total comprehensive income for the half year (5.3) (11.1) Earnings per share Basic earnings per share for the half year (cents per share) (1.41) (2.84) Diluted earnings per share for the half year (cents per share) (1.41) (2.84) Statutory presentation for FY17 not adjusted for change in financial reporting in FY18
19 AU$m FY17 FY18 Change on pcp Total revenue % Gross profit % Gross margin (%) 94% 94% 0% Sales & marketing direct (5.8) (7.5) (28%) indirect (2.0) (2.7) (36%) Total sales & marketing (7.8) (10.2) (30%) Overheads (5.2) (7.2) (38%) Segment Contribution % Segment Contribution (%) 58% 53% (9%) US$m FY17 FY18 Change on pcp Total revenue % Gross profit % Gross margin (%) 12% 27% 125% Sales & marketing direct (4.5) (6.9) (55%) indirect (1.7) (3.1) (83%) Total sales & marketing (6.2) (10.0) (63%) Overheads (4.0) (5.5) (38%) Segment Contribution (9.8) (13.3) (36%) Segment Contribution (%) n/a n/a
20 AU$m 30 June June 2018 Assets Current assets Cash and cash equivalents Trade receivables Other current assets Total current assets Non-current assets Plant and equipment Intangible assets Deferred tax assets Total non-current assets Total assets AU$m 30 June June 2018 Liabilities Current liabilities Trade and other payables Unearned income Other current liabilities Total current liabilities Total non-current liabilities Total liabilities Net assets Equity Contributed equity Reserves Profits reserve Accumulated losses (33.0) (44.1) Total equity
21 AU$m FY17 FY18 Cash flows from operating activities Receipts from customers Payments to suppliers and employees (44.7) (67.0) Interest, other receipts and tax Net cash (outflow)/inflow from operating activities 3.7 (2.7) Cash flows from investing activities Purchase of plant and equipment (6.4) (4.1) AU$m FY17 FY18 Net profit / (loss) after tax (5.3) (11.0) Income tax Interest income (0.4) (0.4) FX EBIT (1.4) (8.4) Depreciation & Amortisation EBITDA Payments for development costs (3.8) (5.7) Proceeds from sale of plant and equipment Net cash flows used in investing activities (10.1) (9.5) Cash flows from financing activities Proceeds from issue of shares (net of transaction costs) Proceeds from exercise of share options Proceeds from exercise of share option loans Net cash inflows from financing activities Net increase / (decrease in cash and cash equivalents 16.2 (10.7) Effect of movement of exchange rates on cash held (0.1) (0.1) Cash and cash equivalents at the beginning of the year Cash and cash equivalents at the end of the year
22


23 23
NEARMAP THE FUTURE OF LOCATION INTELLIGENCE. MACQUARIE AUSTRALIA CONFERENCE 1 MAY 2018
 NEARMAP THE FUTURE OF LOCATION INTELLIGENCE. MACQUARIE AUSTRALIA CONFERENCE 1 MAY 2018 OUR MISSION. WE CHANGE THE WAY YOU VIEW THE WORLD, SO YOU CAN PROFOUNDLY CHANGE THE WAY YOU WORK. NEARMAP S UNIQUE
Investor & Analyst Presentation Ful YearResults 30 June2016 For personal use only 25th August 2016 Rebekah O Flaherty - CEO I Jonathan Kenny - CFO
 Investor & Analyst Presentation Full YearResults 30 June2016 25th August 2016 Rebekah O Flaherty - CEO I Jonathan Kenny - CFO Agenda 1 Overview 2 Strategic Priorities 3 FY16 Financial Results 4 FY17 Outlook
Investor & Analyst Presentation
 Investor & Analyst Presentation FY18 H1 Results For the six monthsended 31 December 2017 15 th February 2018 Rebekah O Flaherty-CEO I Jonathan Kenny-CFO Agenda 1 2 3 4 5 6 Overview Strategic Priorities
FY18 Results Presentation Bravura Solutions Limited. 28 August 2018
 FY18 Results Presentation Bravura Solutions Limited 28 August 2018 Important notice and disclaimer The information contained in this document (including this notice) and discussed at this presentation
FY2017 Result Presentation. 21 August 2017
 FY2017 Result Presentation 21 August 2017 The Hansen journey growing and diversifying by geography, industry, propriety products and customer Early 1990 s Today Revenue by geography Industry verticals
Financial results & business update. Quarter ended 31 March April 2018
 Financial results & business update Quarter ended 31 March 2018 18 April 2018 Disclaimer 3 Any remarks that we may make about future expectations, plans and prospects for the company constitute forward-looking
Financial results & business update. Quarter and year ended 31 December February 2016
 Financial results & business update Quarter and year ended 31 December 2015 11 February 2016 Disclaimer 3 Any remarks that we may make about future expectations, plans and prospects for the company constitute
LogiCamms Limited ABN: Interim Financial Report
 ABN: 90 127 897 689 Interim Financial Report Contents Page Directors report 2 Auditor s Independence Declaration 4 Condensed consolidated statement of profit or loss and other comprehensive income 5 Condensed
METHVEN LIMITED. Results for announcement to the market
 METHVEN LIMITED Results for announcement to the market Reporting Period 6 months ended 31 December 2016 Previous Reporting Period 9 months ended 31 December 2015 Amount (NZD 000s) Percentage change Sales
For personal use only
 APPENDIX 4D HALF-YEAR INFORMATION GIVEN TO THE ASX UNDER LISTING RULE 4.2A ABN 91 112 452 436 HALF-YEAR ENDED 31 DECEMBER 2016 The information provided in this report should be read in conjunction with
March 2014 INVESTOR ROADSHOW. David Stewart CEO and Managing Director Ken Sheridan CFO and Executive Director
 March 2014 INVESTOR ROADSHOW David Stewart CEO and Managing Director Ken Sheridan CFO and Executive Director Delivering as Forecast Strategy and Execution 1H14 Growth Across all Key Metrics Revenue Mix
For personal use only
 A S X A N N O U N C E M E N T DATE: 24 August 2016 FY2016 RESULTS PRESENTATION Attached is the Presentation regarding Pact s Financial Results for the year ended 30 June 2016. The Presentation will occur
Full Year Result August 2015 Page 2
 Freightways Full Year Result Presentation 17 August 2015 This presentation relates to the Freightways Limited NZX announcement and media release of 17 August 2015. As such, it should be read in conjunction
For personal use only
 FY2017 Annual results Another record-breaking year 14 August 2017 Praemium Limited ACN: 098 405 826 Disclaimer The material contained in this document is a presentation of general information about the
Preliminary results for the year ended 31 March 2014
 Preliminary results for the year ended 31 March 2014 7 May 2014 2014 Experian plc. All rights reserved. Experian and the marks used herein are service marks or registered trademarks of Experian plc. Other
Full Year 2017 Results Presentation Bravura Solutions Limited
 Full Year 2017 Results Presentation Bravura Solutions Limited 23 rd August 2017 Important notice and disclaimer The information contained in this document (including this notice) or discussed at this presentation
Quarter ended 30 September Financial results & business update
 Quarter ended 30 September 2014 Financial results & business update 21 October 2014 Disclaimer Any remarks that we may make about future expectations, plans and prospects for the company constitute forward-looking
Fleetwood Corporation Limited. Preliminary Final Report Year ended 30 June 2012
 ABN 69 009 205 261 Preliminary Final Report Results for Announcement to the Market Change Amount $ 000 Revenue from ordinary activities Down 13% to 407,443 Profit from ordinary activities after tax attributable
TomTom Q results. Harold Goddijn - CEO & Marina Wyatt - CFO 18 February 2011
 TomTom Q4 2010 results Harold Goddijn - CEO & Marina Wyatt - CFO 18 February 2011 Financial highlights Content & Services revenue grew by 16% to 98 million Automotive revenue grew by 52% to 55 million
For personal use only
 HFA Holdings Limited For the six months ended 31 December 2015 ASX Appendix 4D Results for announcement to the market (all comparisons to the six months ended 31 December 2014) Amounts in USD 000 31 December
For personal use only
 ASX ANNOUNCEMENT 31 August 2018 Appendix 4E Preliminary Final Report DigitalX announces US$2.59 million annual profit Maiden full year profit of US$2.59 million Full year revenue from operations of US$8.2
For personal use only
 Blue Sky Alternative Investments Limited ACN 136 866 236 Appendix 4D Blue Sky Alternative Investments Limited ACN 136 866 236 Appendix 4D Half Year Report for the half year ended 31 December 2013 1. Details
For personal use only
 Click to edit Master text styles IDP Education FY16 Results Presentation Twelve months to 30 June 2016 11 February 2016 Important notice and disclaimer Click Disclaimer to edit Master text styles The material
Financial results & business update. Quarter ended 30 September October 2016
 Financial results & business update Quarter ended 30 September 2016 19 October 2016 Disclaimer 3 Any remarks that we may make about future expectations, plans and prospects for the company constitute forward-looking
ASSETS 31 March December 2017
 Condensed Consolidated Interim Balance Sheet as at 31 March 2018 Audited ASSETS 31 March 2018 31 December 2017 Current Assets Cash and Cash Equivalents 7.500 7.132 Financial Investments 198 736 Trade Receivables
Full Year Results Presentation For the year ended 31 March May 2017
 Full Year Results Presentation For the year ended 31 March 2017 30 May 2017 Important information EROAD Limited ( EROAD ) registered a prospectus in July 2014 ( Prospectus ) in relation to an initial public
GEO re-establishes growth momentum
 NZX and Media Release 28 August 2018 Summary UNAUDITED FINANCIAL RESULTS FOR THE YEAR TO 30 JUNE 2018 GEO re-establishes growth momentum Strong revenue growth re-established from March 2018, with June
IFRS 15 / AASB 15 International Financial Reporting Standards
 IFRS 15 / AASB 15 International Financial Reporting Standards Edward Chung Chief Executive Officer Gareth Pye Deputy Chief Financial Officer 17 July 2018 Commercial in confidence 129 FINAL Disclosure Statement
Temenos announces very strong start to 2018 with Q1 total software licensing growth of 40%
 Temenos announces very strong start to 2018 with Q1 total software licensing growth of 40% GENEVA, Switzerland, 18 April 2018 Temenos Group AG (SIX: TEMN), the banking software company, today reports its
OneVue Holdings Limited (OVH)
") OneVue Holdings Limited (OVH) H1 FY 2018 results presentation 26 February 2018 1 HIGHLIGHTS 2 FINANCIALS 3 OUTLOOK 4 APPENDICES Page 2 1 HIGHLIGHTS . BENEFITTING FROM SECTORAL GROWTH AND STRUCTURAL DISRUPTION
OneVue Holdings Limited (OVH) H1 FY 2018 results presentation 26 February 2018 1 HIGHLIGHTS 2 FINANCIALS 3 OUTLOOK 4 APPENDICES Page 2 1 HIGHLIGHTS . BENEFITTING FROM SECTORAL GROWTH AND STRUCTURAL DISRUPTION
Quarter ended 30 September Financial results & business update
 Quarter ended 30 September 2013 Financial results & business update 22 October 2013 Disclaimer Any remarks that we may make about future expectations, plans and prospects for the company constitute forward-looking
Half Year Results. for the six months ended 30 November January Chairman Chris Stone CEO Adam Palser CFO Brian Tenner
 Half Year Results for the six months ended 30 November 2017 16 January 2018 Chairman Chris Stone CEO Adam Palser CFO Brian Tenner Agenda Overview and strategy update Financial highlights Financial performance
For personal use only
 Vault Intelligence Limited ASX Preliminary final report Lodged with the ASX under Listing Rule 4.3A Contents Results for Announcement to the Market 2 Preliminary consolidated statement of comprehensive
Dreamscape Networks Limited (ASX: DN8) Maiden Full Year Results Presentation Year Ended 30 June 2017
 Maiden Full Year Results Presentation Year Ended 30 June 2017") Dreamscape Networks Limited (ASX: DN8) Maiden Full Year Results Presentation Year Ended 30 June 2017 1 Our Vision Providing simple, innovative and affordable Online Solutions that change lives 2 A Year
Dreamscape Networks Limited (ASX: DN8) Maiden Full Year Results Presentation Year Ended 30 June 2017 1 Our Vision Providing simple, innovative and affordable Online Solutions that change lives 2 A Year
2017 Full Year Results. Tuesday 21 November 2017
 2017 Full Year Results Tuesday 21 November 2017 Disclaimer Certain information included in the following presentation is forward looking and involves risks, assumptions and uncertainties that could cause
For personal use only
 PRELIMINARY FINAL REPORT RULE 4.3A APPENDIX 4E APN News & Media Limited ABN 95 008 637 643 Preliminary final report Full year ended 31 December Results for Announcement to the Market As reported Revenue
Investor Presentation
 Investor Presentation 1 Disclaimer This document has been prepared by Energy One Limited (EOL) and comprises written materials and slides for a presentation concerning EOL. This presentation is for information
H1/2018 Results u-blox Holding AG
 H1/2018 Results August 24, 2018 Thomas Seiler, CEO Roland Jud, CFO Disclaimer This presentation contains certain forward-looking statements. Such forward-looking statements reflect the current views of
Results for the six months ended 30 June Driving sustainable growth
 Results for the six months ended 30 June 2018 Driving sustainable growth 2018 Interim Overview Strong progress on profit growth and expansion of Healthcare LFL profits +14% Healthcare +6% 1 Marketing offering
ASSETS 30 September December 2017
 Condensed Consolidated Interim Balance Sheet as at Not Reviewed Audited ASSETS 31 December 2017 Current Assets Cash and Cash Equivalents 16.343 7.132 Financial Investments - 736 Trade Receivables -Trade
MSCI THIRD QUARTER 2016
 MSCI THIRD QUARTER 2016 Earnings Presentation October 27, 2016 2016 MSCI Inc. All rights reserved. Please refer to the disclaimer at the end of this document. FORWARD-LOOKING STATEMENTS Forward-Looking
Year-end results. 18 May
 Year-end results 18 May Highlights for the year Strong operational performance Good performance across all areas of activity Deepened our core franchise Sound levels of corporate client and private client
ASSETS 30 June December 2017
 Condensed Consolidated Interim Balance Sheet as at Audited ASSETS 31 December 2017 Current Assets Cash and Cash Equivalents 11.628 7.132 Financial Investments 395 736 Trade Receivables -Trade Receivables
Interim Report Q1 FY 18
 Interim Report Q1 FY 18 Quarter 1 / Fiscal Year 2018 Continued positive development extends into the new fiscal year Sivantos delivered 3.5% organic growth 1) in Q1 2018 with negative Fx translation effects
1H15 GROUP SUMMARY. Any discrepancies between totals and sums of components in this publication are due to rounding
 2 1H15 GROUP SUMMARY Group premium revenue up 9.1% to $802.3m (1H14: $735.4m). Group operating profit up 1.7% to $42.1m (1H14: $41.4m) 1. Australian residents health insurance (arhi) operating profit up
Xero Limited. Interim Report
 Xero Limited Interim Report For the six months ended 30 September 2017 Chair and CEO Report Commentary Financials Cover image A Little Farm on the Hill, Malaysia Xero customer Inside cover image Woodblock
Financial Statements. - Directors Responsibility Statement. - Consolidated Statement of Comprehensive Income
 X.0 HEADER Financial Statements - Directors Responsibility Statement - Consolidated Statement of Comprehensive Income - Consolidated Statement of Financial Position - Consolidated Statement of Changes
Financial results & business update
 Financial results & business update Quarter ended 31 March 2019 16 April 2019 Disclaimer Any remarks that we may make about future expectations, plans and prospects for the company constitute forward-looking
Interim FY 2015 results 6 months ended 31 December February 2015
 Interim FY 2015 results 31 December 2014 18 February 2015 Highlights Solid trading result for 1H FY2015; change in accounting policy for acquisition of healthcare practices First half result highlights
For personal use only
 Appendix 4D Half-year report 1. Company details Name of entity: ABN: 35 144 733 595 Reporting period: For the half-year ended 31 December 2017 Previous period: For the half-year ended 31 December 2016
Interim Financial Report. Janison Education Group Limited (formerly HJB Corporation Ltd.)
") (formerly HJB Corporation Ltd.) Table of Contents Chairman s Letter... 1 Directors Report... 2 BUSINESS RESULTS... 2 CAPITAL RAISING AND REVERSE TAKE-OVER ACQUISITION... 3 EARNINGS BEFORE INTEREST, TAX
(formerly HJB Corporation Ltd.) Table of Contents Chairman s Letter... 1 Directors Report... 2 BUSINESS RESULTS... 2 CAPITAL RAISING AND REVERSE TAKE-OVER ACQUISITION... 3 EARNINGS BEFORE INTEREST, TAX
Results Presentation. To be read in conjunction with the Appendix 4E and the Accounts
 Results Presentation Year ended December 2011 To be read in conjunction with the Appendix 4E and the Accounts 2 Performance Highlights Year Ended December 2011 Revenue up 1% to $91.3m EBITDA (excl relocation)*
2019 Half Year Investor Presentation Andrew Burnes CEO Michael Burnett CFO
 2019 Half Year Investor Presentation Andrew Burnes CEO Michael Burnett CFO Disclaimer The information contained in these materials or discussed at the presentation is not intended to be an offer for subscription,
Half-year results 31 December GBST Holdings Limited (ASX: GBT)
") Half-year results 31 December 2017 GBST Holdings Limited (ASX: GBT) H1 FY2018 Financial Performance Results for the half-year ($ millions) 1H FY18 2H FY17 1H FY17 REVENUE AND OTHER INCOME 42.7 42.6 45.4
Half-year results 31 December 2017 GBST Holdings Limited (ASX: GBT) H1 FY2018 Financial Performance Results for the half-year ($ millions) 1H FY18 2H FY17 1H FY17 REVENUE AND OTHER INCOME 42.7 42.6 45.4
THINKSMART 2009 Half Year Results Presentation: 21 st August 2009
 THINKSMART 2009 Half Year Results Presentation: 21 st August 2009 Ned Montarello Executive Chairman & CEO Neil Barker Group COO Agenda 1. The ThinkSmart Business 2. Half Year Scorecard 3. Key Financial
Cover-More Group. UBS Australasia Conference. November 2015
 Cover-More Group UBS Australasia Conference November 2015 Executive summary: FY15 overview Cover-More delivered another year of double digit earnings growth, with offshore business growing substantially.
A S X A N N O U N C E M E N T
 A S X A N N O U N C E M E N T DATE: 24 February 2016 Attached is the Presentation regarding Pact s Half year Financial Results for the half year ended 31 December 2015. The Presentation will occur at 10am
For personal use only
 SUMMARY OF 1H19 GROUP OUTCOMES Strong first half performance UNDERLYING PROFIT BEFORE TAX (UPBT) 1H19 $112.3m up $30.4m on 1H18 Highest 1H underlying result in 11 years Delivered despite $88.2m fuel and
Business Update. USPP Conference Miami. Luis Damasceno Group CFO Michael Williams Group Finance Director & Treasurer January 2019
 Business Update USPP Conference Miami Luis Damasceno Group CFO Michael Williams Group Finance Director & Treasurer 23-25 January 2019 www.alsglobal.com IMPORTANT NOTICE AND DISCLAIMER This presentation
1H 19 Investor Presentation February 2019
 1H 19 Investor Presentation February 2019 1 About Raiz Raiz (formerly Acorns) is a mobile first micro-investing platform via mobile phone or web app, which allows customers to invest in a portfolio of
Temenos announces very strong Q3 results, full year guidance raised
 Temenos announces very strong Q3 results, full year guidance raised GENEVA, Switzerland, 17 October 2018 Temenos AG (SIX: TEMN), the banking software company, today reports its third quarter 2018 results.
TerraNet Holding. Irons in the fire. Five new strategic development orders won in Q317. Cash flow burn reflecting multi-project activity
 TerraNet Holding Irons in the fire Q317 results release Software & comp services TerraNet (TERRNT) is an early-stage software group with a range of products under development deriving principally from
Financial results & business update. Quarter ended 30 September October 2017
 Financial results & business update Quarter ended 30 September 2017 18 October 2017 Disclaimer 3 Any remarks that we may make about future expectations, plans and prospects for the company constitute forward-looking
Appendix 4E Preliminary final report For the period ended 30 June 2017
 Appendix 4E Preliminary final report For the period ended WEBJET LIMITED And its controlled entities ABN: 68 002 013 612 1. Results for announcement to the market On 28 July, the Company advised the ASX
Paddy Power Betfair plc Prelim Results
 Paddy Power Betfair plc 2016 Prelim Results Financial & Operating Review [find new imagery for cover] Financial highlights 3 m, Proforma 1 2016 2015 YOY % YOY % CC 2 Revenue 1,551 1,318 +18% +11% Cost
For personal use only
 ASX:SKF SKYFII QUARTERLY BUSINESS REVIEW Q2 FY2019 Q2 FY2019 Highlights Total Operating Revenues for the December-ended quarter, Q2 FY2019, of $2.4m, up 7% on prior quarter, representing a strong continuation
Cover-More Group. FY15 Full year results presentation. 21 August 2015
 Cover-More Group FY15 Full year results presentation 21 August 2015 Executive summary Cover-More delivered another year of double digit earnings growth, with offshore business growing substantially. Significant
Full year results 30 June 2018.
 CORPORATE TRAVEL MANAGEMENT Full year results 30 June 2018. Presented by: Jamie Pherous, Founder & Managing Director Date: 22 nd August, 2018 PAGE 2 Disclaimer The information in this presentation does
Revenues from ordinary activities up 14.1% to 48,694. Earnings Before Interest, Tax, Depreciation and Amortisation (EBITDA) up 18.
 up 18.") Appendix 4D Half-year report 1. Company details Name of entity: Altium Limited ACN: 009 568 772 Reporting period: For the half-year ended Previous period: For the half-year ended 31 December 2015 2. Results
Appendix 4D Half-year report 1. Company details Name of entity: Altium Limited ACN: 009 568 772 Reporting period: For the half-year ended Previous period: For the half-year ended 31 December 2015 2. Results
For personal use only
 Blue Sky Alternative Investments 1H FY18 Results Presentation Private Equity Private Real Estate Real Assets Hedge Funds Disclaimer This presentation has been prepared by Blue Sky Alternative Investments
Appendix 4D Senetas Corporation Limited Half year report for announcement to the market ACN
 Appendix 4D Senetas Corporation Limited Half year report for announcement to the market ACN 006 067 607 1 Details of the reporting period and the previous corresponding period Reporting Period Half year
Fourth quarter and full year 2017 results
 Fourth quarter and full year 207 results FINANCIAL AND OPERATIONAL HIGHLIGHTS Financial summary Q4 '7 Revenue of 220 million (Q4 '6: 266 million) Gross margin of 59% (Q4 '6: 58%) EBITDA of 37 million (Q4
Financial results & business update. Quarter ended 30 June July 2017
 Financial results & business update Quarter ended 30 June 2017 19 July 2017 Disclaimer 3 Any remarks that we may make about future expectations, plans and prospects for the company constitute forward-looking
For personal use only
 Investor Presentation Half Year Results to 31 December 2016 24 February 2017 PETER CAUGHEY, CEO & MANAGING DIRECTOR 1 Agenda Overview Financials Business conditions, strategy and outlook 2 Overview 1H17
Investor Presentation Full Year 2017 Results Presentation August 2017
 Investor Presentation Full Year 2017 Results Presentation August 2017 Leading Managed Telco, IT and Cloud provider to SMEs, corporates and consumer brands across Australia. We invest in our people, products
INTERIM RESULTS 2015 FOR THE SIX MONTHS ENDING 30th JUNE 2015
 INTERIM RESULTS 2015 FOR THE SIX MONTHS ENDING 30th JUNE 2015 INTERIM RESULTS 2015 HIGHLIGHTS Organic revenue growth of 2%, lower than recent years as a result of: - Shift in phasing of revenues and trading
With great power comes great scalability STATPRO GROUP PLC INTERIM REPORT 2016
 With great power comes great scalability STATPRO GROUP PLC INTERIM REPORT StatPro is a global provider of award winning portfolio analytics solutions for the investment community. The Group s cloud-based
Q4 AND FY 2015 RESULTS. Harold Goddijn CEO Taco Titulaer CFO 9 February 2016
 Q4 AND FY 2015 RESULTS Harold Goddijn CEO Taco Titulaer CFO 9 February 2016 CONSUMER OPERATIONAL HIGHLIGHTS Within Drive, we maintained our leading market position and continued to strengthen our navigation-based
RESULTS FOR THE HALF YEAR ENDED 31 DECEMBER 2017
 RESULTS FOR THE HALF YEAR ENDED 31 DECEMBER 2017 IMPORTANT NOTICE AND DISCLAIMER + This document has been prepared by Goodman Group (Goodman Limited (ABN 69 000 123 071), Goodman Funds Management Limited
Appendix 1 Financial Results For the Third Quarter ended 31 March 2018
 Appendix 1 Financial Results For the Third Quarter ended 31 March 2018 Singapore Exchange Limited Incorporated in the Republic of Singapore Company Registration Number: 199904940D SINGAPORE EXCHANGE Financial
2017 half year results investor presentation
 2017 half year results investor presentation 27 February 2017 contents section presenting slide CEO presentation Julian Ogrin 3 broadband 10 CFO presentation Leanne Wolski 14 summary Julian Ogrin 21 appendix
For personal use only
 Appendix 4D 1. Half yearly report Rule 4.2A Name of entity SmartTrans Holdings Ltd ABN: 86 009 065 650 Report for the half-year ended 31 December 2015 Previous corresponding period is the financial year
Appendix 1 Financial Results For the Second Quarter ended 31 December 2017
 Appendix 1 Financial Results For the Second Quarter ended 31 December 2017 Singapore Exchange Limited Incorporated in the Republic of Singapore Company Registration Number: 199904940D SINGAPORE EXCHANGE
For personal use only
 Wilsons Rapid Insights Conference presentation Amber Stoney, CFO 10 November 2016 The numbers in this presentation have been presented in US dollars (USD), unless otherwise indicated. Who we are We take
Financial results & business update. Quarter and year ended 31 December February 2017
 Financial results & business update Quarter and year ended 31 December 2016 14 February 2017 Disclaimer 3 Any remarks that we may make about future expectations, plans and prospects for the company constitute
For personal use only
 FY14 RESULTS John Croll Chief Executive Officer Nimesh Shah Chief Financial Officer AGENDA OVERVIEW OF FY14 RESULT FINANCIAL PERFORMANCE FY15 OUTLOOK GROWTH STRATEGY Q&A JOHN CROLL NIMESH SHAH JOHN CROLL
Investor Presentation
 Investor Presentation Fourth Quarter 2017 Safe Harbor and Other Information This presentation contains forward looking statements that are based on our management s beliefs and assumptions and on information
ASSETS 31 December December 2016
 Condensed Consolidated Interim Balance Sheet as at 31 December 2017 ASSETS 31 December 2017 31 December 2016 Current Assets Cash and Cash Equivalents 7.132 5.159 Financial Investments 736 1.228 Trade Receivables
Appendix 4D Half-Year Report for the six months to 31 December 2016 Name of entity: ABN or equivalent company reference: CSG Limited and its controlle
 CSG Limited Level 1, 357 Collins Street MELBOURNE VIC 3000 Tel: 07 3840-1234 Fax: 07 3840-1266 Email: investor@csg.com.au Website: www.csg.com.au APPENDIX 4D CSG LIMITED AND CONTROLLED ENTITIES HALF-YEAR
AMP Limited reports A$672 million net profit for FY 13
 20 February 2014 Public Affairs Tel: 02 9257 6127 Email: media@amp.com.au Website: AMP.com.au/media AMP_AU AMP Limited reports A$672 million net profit for FY 13 AMP Limited has reported a net profit of
FY 2018 results presentation
 FY 2018 results presentation EMERGING FINANCIAL SERVICES COMPANY STRONGLY LEVERAGED TO SUPERANNUATION SECTOR, DELIVERS RECORD GROWTH OneVue Holdings Limited (OVH) 27 August 2018 1 HIGHLIGHTS Market leading
18 October Spatial plc (AIM: SPA) ( 1Spatial, the Group or the Company ) Interim Results for the six month period ended 31 July 2016
 ( 1Spatial, the Group or the Company ) Interim Results for the six month period ended 31 July 2016") 18 October 1Spatial plc (AIM: SPA) ( 1Spatial, the Group or the Company ) Interim Results for the six month period ended The Board of Directors of 1Spatial (the Board ), the AIM Spatial Data company today
18 October 1Spatial plc (AIM: SPA) ( 1Spatial, the Group or the Company ) Interim Results for the six month period ended The Board of Directors of 1Spatial (the Board ), the AIM Spatial Data company today
Xenith IP Group Limited
 Xenith IP Group Limited Results Financial Year to 30 June 2017 29 August 2017 Craig Dower Stuart Smith Lesley Kennedy CEO and Managing Director Executive Director and Head of Corporate Development CFO
Half Year Results Standard Life plc Analyst and Investor presentation
 Half Year Results 2013 Standard Life plc Analyst and Investor presentation Half Year Results 2013 Record flows driving strong growth in revenue David Nish Chief Executive This presentation may contain
For personal use only. JB Hi-Fi Limited. HY17 Results Presentation
 JB Hi-Fi Limited HY7 Results Presentation 3 5 FEBRUARY AUGUST 06 07 PAGE Agenda. Group Performance Overview. JB HI-FI 3. The Good Guys 4. Stores 5. Group Balance Sheet and Cash Flow 6. Outlook Richard
H Interim Results 4 September 2018
 H1 2018 Interim Results 4 September 2018 Disclaimer The following presentation is being made only to, and is only directed at, persons to whom such presentation may lawfully be communicated ( relevant
Responsible investment in growth
 Responsible investment in growth Issued: 17 June 2014 Legal notice This presentation has been prepared to inform investors and prospective investors in the secondary markets about the Group and does not
Revenue from ordinary activities Down 81% 8,041,026. Loss from ordinary activities after tax attributable to members Loss up 13% (3,848,395)
") PRELIMINARY FINAL REPORT REPORTING PERIOD Financial Period 30 June 2017 APPENDIX 4E RESULTS FOR ANNOUNCEMENT TO THE MARKET % change from financial period ending 30 June 2016 Revenue from ordinary activities
PRELIMINARY FINAL REPORT REPORTING PERIOD Financial Period 30 June 2017 APPENDIX 4E RESULTS FOR ANNOUNCEMENT TO THE MARKET % change from financial period ending 30 June 2016 Revenue from ordinary activities
HomeServe Interim results 21 November 2017
 HomeServe Interim results 21 November 2017 Highlights Outstanding performance in North America and our largest ever acquisition 125m equity placing retains balance sheet flexibility for a pipeline of exciting
rhipe Limited (ASX code RHP) FY16 Full Year Results Presentation & FY 2017 Outlook
 FY16 Full Year Results Presentation & FY 2017 Outlook") rhipe Limited (ASX code RHP) FY16 Full Year Results Presentation & FY 2017 Outlook Dominic O Hanlon, CEO & Managing Director Mike Hill, Executive Chairman 1 This presentation has been prepared by rhipe
rhipe Limited (ASX code RHP) FY16 Full Year Results Presentation & FY 2017 Outlook Dominic O Hanlon, CEO & Managing Director Mike Hill, Executive Chairman 1 This presentation has been prepared by rhipe