THREADNEEDLE GLOBAL EQUITY INCOME FUND (UNHEDGED) ARSN
|
|
|
- Myra Pierce
- 5 years ago
- Views:
Transcription


1 THREADNEEDLE GLOBAL EQUITY INCOME FUND (UNHEDGED) ARSN ANNUAL FINANCIAL REPORT FOR THE YEAR ENDED 30 JUNE
2 Threadneedle Global Equity Income Fund (Unhedged) ARSN Annual financial report For the year ended Contents Page Directors report 2 Auditor s independence declaration 5 Statement of comprehensive income 6 Statement of financial position 7 Statement of changes in equity 8 Statement of cash flows 9 11 Directors declaration 27 Independent auditor s report to the unitholders of Threadneedle Global Equity Income Fund (Unhedged) 28-1-
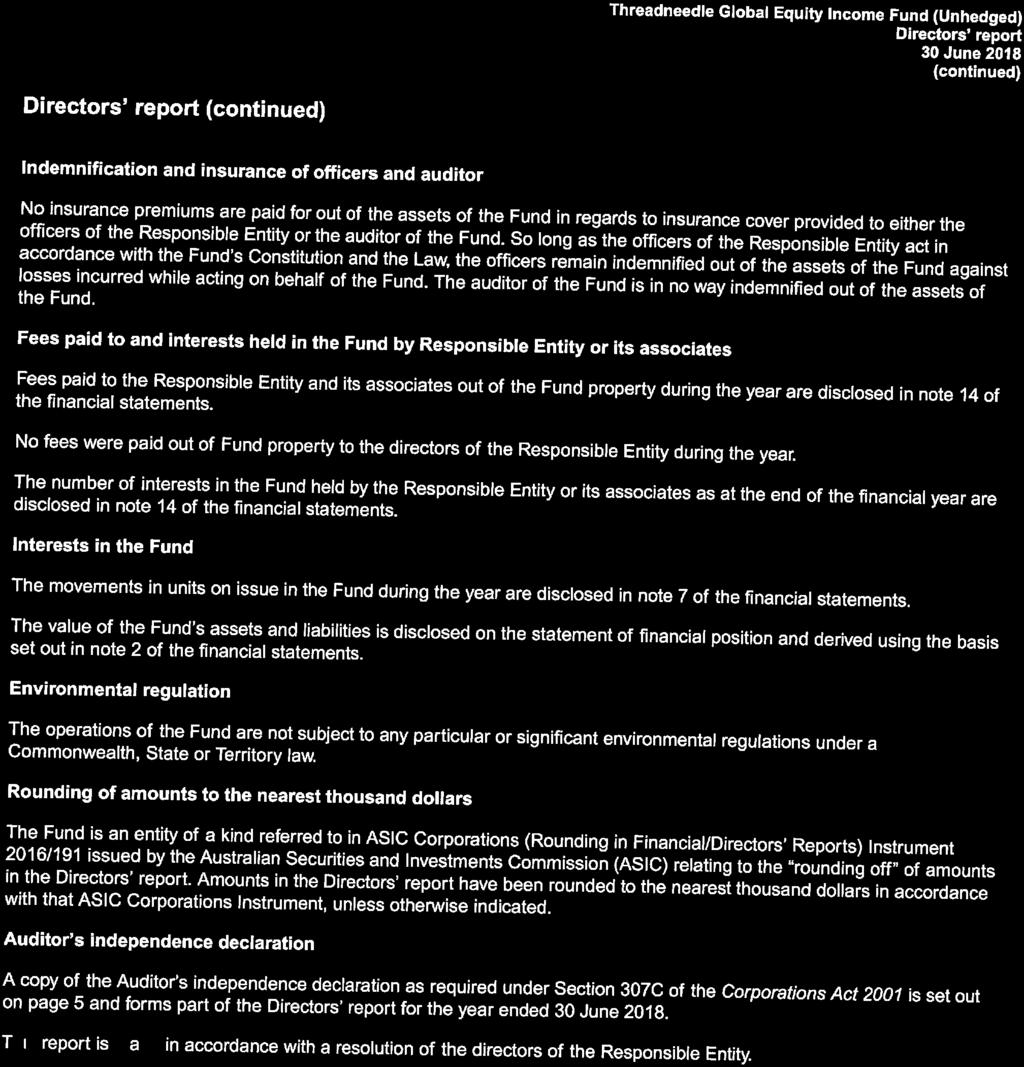
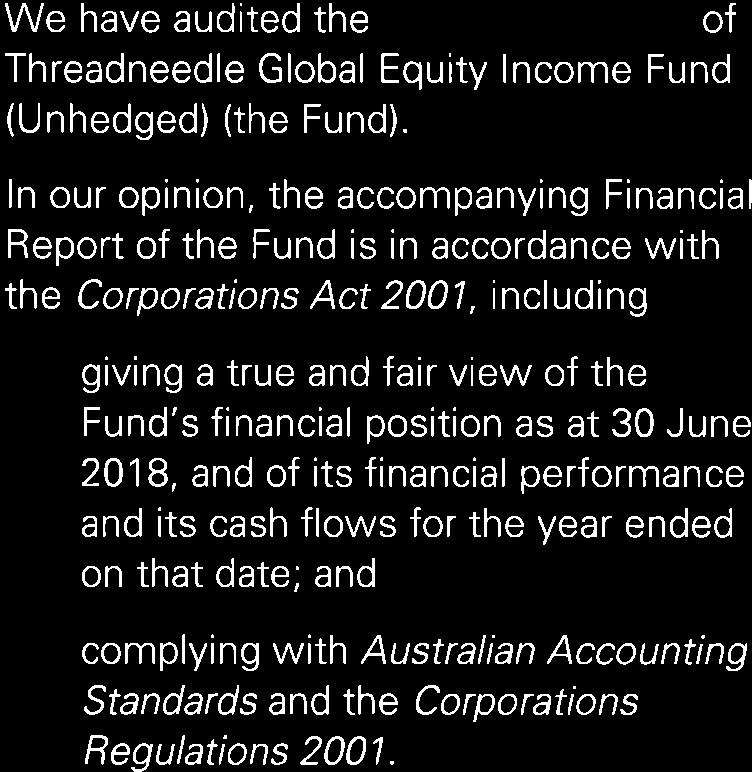
3 Directors report Directors report The directors of Ironbark Asset Management (Fund Services) Limited (the Responsible Entity ), the Responsible Entity of Threadneedle Global Equity Income Fund (Unhedged) (the Fund ), present their report together with the financial statements of the Fund for the year ended and the auditor s report thereon. Responsible Entity The registered office and principal place of business of the Responsible Entity and the Fund is Level 13, 1 Margaret Street, Sydney, NSW Directors The following persons held office as directors of the Responsible Entity of the Fund for the period from 1 July to the date of this report: B Carpenter A Donald C Larsen Principal activities The Fund is a registered managed investment scheme domiciled in Australia. The Fund s investment objective was to aim to deliver regular income distributions with capital growth through its investment in worldwide companies that produce strong and consistent returns. On 8 May, the Responsible Entity determined that the Fund was not of sufficient scale to continue operations and therefore, formally resolved to wind up the Fund in accordance with clause 17.3 of the Fund s Constitution. As part of the wind up process, the Fund returned a large portion of unitholders investment effective 23 May. The proceeds were paid via a distribution of cents per unit and partial redemption of $ per unit. The total amount paid out to the unitholders effective 23 May was $35,701,977 and represented approximately 97.75% of the total net asset value at this date. The effective date of wind up was 29 June with final proceeds being paid out to unitholders on 26 July which was represented by a distribution of cents per unit and a final redemption of $ per unit. The Fund did not have any employees during the year. Review and results of operations During the year, the Fund continued to invest in accordance with target asset allocations as set out in the governing documents of the Fund and the provisions of the Fund s Constitution. -2-
4 Directors report Directors report Results The performance of the Fund, as represented by the results of its operations, was as follows: Year ended Operating profit/(loss) ($ 000) 2,722 4,589 Distribution Distribution paid and payable ($ 000) 4,927 4,275 Distribution (cents per unit) Unit price as at Application price ($) Redemption price ($) Significant changes in the state of affairs On 8 May the Responsible Entity formally resolved to wind up the Fund in accordance with clause 17.3 of the Fund s Constitution. The effective date of the wind up was 29 June. As part of the wind up process, the Fund returned a large portion of unitholders investment effective 23 May. The proceeds were paid via a distribution of cents per unit and partial redemption of $ per unit. The total amount paid out to the unitholders effective 23 May was $35,701,977 and represented approximately 97.75% of the total net asset value at this date. The Fund terminated on 29 June when all unitholders entitlements were redeemed by way of cents per unit distribution and a final redemption of $ per unit. Any residual monies received by the Fund post payment of the final redemption will be remitted to Responsible Entity who will use these monies to settle any outstanding costs of the Fund associated with the wind up that were not directly covered by the Fund prior to commencement of its wind up on 29 June. Any shortfall between the residual monies and the final costs will be borne by the Responsible Entity. Matters subsequent to the end of the financial year The Responsible Entity has finalised proceedings to wind up the Fund following the payment of final proceeds to unitholders on 26 July. The Fund s financial report for the year ending will be the final financial report in respect of the Fund. Other than the above, no other matter or circumstance has arisen since. Likely developments and expected results of operations As stated in the Significant changes in the state of affairs above, the Fund terminated on 29 June. The results of the Fund s operations will be affected by a number of factors, including the performance of investment markets in which the Fund invests. Investment performance is not guaranteed and future returns may differ from past returns. As investment conditions change over time, past returns should not be used to predict future returns. -3-

5


6
7 Statement of comprehensive income For the year ended Statement of comprehensive income Year ended Notes $ 000 $ 000 Investment income Distribution and dividend income 1,171 2,111 Interest income 3 1 Net gains/(losses) on financial instruments held at fair value through profit or loss 6 2,286 3,393 Net foreign exchange gains/(losses) (278) (64) Other operating income 2 5 Total investment income/(loss) 3,184 5,446 Expenses Management fees Administration fees Transaction costs Withholding taxes Other operating expenses 31 - Total operating expenses Operating profit/(loss) 2,722 4,589 Finance costs attributable to unitholders Distributions to unitholders 8 (4,927) (4,275) (Increase)/decrease in net assets attributable to unitholders Total comprehensive income 7 2,205 (314) The above statement of comprehensive income should be read in conjunction with the accompanying notes. -6-
8 Statement of financial position As at Statement of financial position As at Notes $ 000 $ 000 Assets Cash and cash equivalents Receivables Financial assets held at fair value through profit or loss 11-41,273 Total assets ,109 Liabilities Payables Distributions payable 8-3,572 Total liabilities (excluding net assets attributable to unitholders) 29 4,106 Net assets attributable to unitholders - liability ,003 The above statement of financial position should be read in conjunction with the accompanying notes. -7-
9 Statement of changes in equity For the year ended Statement of changes in equity The Fund s net assets attributable to unitholders are classified as a liability under AASB 132 Financial Instruments: Presentation. As such the Fund has no equity, and no items of changes in equity have been presented for the current or comparative financial period. -8-
10 Statement of cash flows For the year ended Statement of cash flows Year ended Notes $ 000 $ 000 Cash flows from operating activities Distributions and dividends received 1,176 1,850 Interest received 3 1 Other operating income received 3 5 Management fees paid (350) (463) Administration fees paid (37) (51) Other operating expenses paid (47) (64) Net cash inflow/(outflow) from operating activities 10(a) 748 1,278 Cash flows from investing activities Proceeds from sale of financial instruments held at fair value through profit or loss 56,729 34,827 Purchase of financial instruments held at fair value through profit or loss (13,448) (22,120) Net cash inflow/(outflow) from investing activities 43,281 12,707 Cash flows from financing activities Proceeds from applications by unitholders 4,503 7,592 Payments for redemptions by unitholders (40,566) (20,132) Distributions paid (8,071) (2,598) Net cash inflow/(outflow) from financing activities (44,134) (15,138) Net increase/(decrease) in cash and cash equivalents (105) (1,153) Cash and cash equivalents at the beginning of the year 619 1,766 Effects of foreign currency exchange rate changes on cash and cash equivalents - 6 Cash and cash equivalents at the end of the year Non-cash operating and financing activities 10(b) The above statement of cash flows should be read in conjunction with the accompanying notes. -9-
11 For the year ended Contents of the notes to the financial statements Page 1 General information 11 2 Summary of significant accounting policies 11 3 Financial risk management 15 4 Fair value measurement 19 5 Auditor s remuneration 20 6 Net gains/(losses) on financial instruments held at fair value through profit or loss 21 7 Net assets attributable to unitholders 22 8 Distributions to unitholders 22 9 Cash and cash equivalents Reconciliation of profit/(loss) to net cash inflow/(outflow) from operating activities Financial assets held at fair value through profit or loss Receivables Payables Related party transactions Events occurring after the reporting period Contingent assets and liabilities and commitments
12 For the year ended 1 General information These financial statements cover Threadneedle Global Equity Income Fund (Unhedged) (the Fund ) as an individual entity. The Fund is an Australian registered managed investment scheme and was constituted on 15 November The Fund will terminate on 14 November 2092 unless terminated earlier in accordance with the provisions of the Fund s Constitution. The Responsible Entity of the Fund is Ironbark Asset Management (Fund Services) Limited (ABN ) (AFSL ) (the Responsible Entity ). The Responsible Entity s registered office is Level 13, 1 Margaret Street, Sydney, NSW The Fund s investment objective was to aim to deliver regular income distributions with capital growth through its investment in worldwide companies that produce strong and consistent returns. On 8 May, the Responsible Entity determined that the Fund was not of sufficient scale to continue operations and therefore, formally resolved to wind up the Fund in accordance with clause 17.3 of the Fund s Constitution. The effective date of wind up was 29 June with final proceeds being paid out to unitholders on 26 July. The financial statements were authorised for issue by the directors on the date the Directors declaration was signed. The directors of the Responsible Entity have the power to amend and reissue the financial statements. 2 Summary of significant accounting policies The principal accounting policies applied in the preparation of these financial statements are set out below. These policies have been consistently applied to all years presented, unless otherwise stated in the following text. (a) Basis of preparation These general purpose financial statements have been prepared in accordance with Australian Accounting Standards and Interpretations issued by the Australian Accounting Standards Board (AASB) and the Corporations Act 2001 in Australia. The Fund is a for-profit entity for the purpose of preparing the financial statements. On 8 May, the Responsible Entity formally resolved to wind up the Fund in accordance with clause 17.3 of the Fund s Constitution. Accordingly, the financial statements for the year ended have not been prepared on a going concern basis. In preparing the financial statements on an alternative basis, the directors have outlined to apply the requirements of the Australian Accounting Standards taking into account that the Fund commenced wind up on 29 June and paid a final redemption effective the same date. Subsequently, the Responsible Entity will deregister the Fund. The assets and liabilities have been recognised in accordance with the accounting policies set out below and the directors are satisfied that the change in the basis of the preparation has no impact on the classification and measurement of the assets and liabilities of the Fund. (i) Rounding of amounts The Fund is an entity of a kind referred to in ASIC Corporations (Rounding in Financial/Directors Reports) Instrument 2016/191 issued by the Australian Securities and Investments Commission (ASIC) relating to the rounding off of amounts in the financial statements. Amounts in the financial statements have been rounded to the nearest thousand dollars in accordance with that ASIC Corporations Instrument, unless otherwise indicated. (ii) Compliance with International Financial Reporting Standards (IFRS) The financial statements of the Fund also comply with IFRS and interpretations as issued by the International Accounting Standards Board (IASB). (iii) New and amended standards adopted by the Fund There are no new standards, interpretations or amendments to existing standards that are effective for the first time for the financial year beginning 1 July that have a material impact on the Fund. -11-
13 For the year ended 2 Summary of significant accounting policies (a) Basis of preparation (iv) New standards and interpretations not yet adopted A number of new accounting standards, amendments to standards and interpretations are effective for annual periods beginning on or after 1 July and have not been adopted in preparing these financial statements. As the Fund has been wound up effective 29 June and this financial report for the year ended will be the final financial report in respect of the Fund, these new standards, amendments and interpretations will have no impact on the Fund. (b) Financial instruments (i) Classification The Fund s investments are classified as held at fair value through profit or loss. They comprise: Financial instruments designated at fair value through profit or loss upon initial recognition These include financial assets that are not held for trading purpose and which may be sold. These are investments in securities listed on global stock exchanges. Financial assets and financial liabilities designated at fair value through profit or loss at inception are those that are managed and their performance evaluated on a fair value basis in accordance with the Fund s documented investment strategy. The Fund s policy is for the Responsible Entity to evaluate the information about these financial instruments on a fair value basis together with other related financial information. (ii) Recognition/derecognition The Fund recognises financial assets and financial liabilities on the date it becomes party to the contractual agreement (trade date) and recognises changes in fair value of the financial assets or financial liabilities from this date. Financial assets are derecognised when the contractual right to receive cash flows from the investments have expired or the Fund has transferred the financial asset and the transfer qualifies for derecognition in accordance with AASB 139 Financial Instruments: Recognition and Measurement. A financial liability is derecognised when the obligation specified in the contract is discharged, cancelled or expired. (iii) Measurement Financial assets and liabilities held at fair value through profit or loss At initial recognition, the Fund measures a financial asset at its fair value. Transaction costs on financial assets and financial liabilities at fair value through profit or loss are expensed immediately, while on other financial instruments they are amortised. Subsequent to initial recognition, all financial assets and financial liabilities at fair value through profit or loss are measured at fair value. Gains and losses arising from changes in the fair value of the financial assets or financial liabilities at fair value through profit or loss category are presented in the statement of comprehensive income within net gains/(losses) on financial instruments held at fair value through profit or loss in the period in which they arise. Other financial assets and liabilities Financial assets and financial liabilities not at fair value through profit or loss, include transaction costs that are directly attributable to the acquisition or issue of the financial asset or financial liability. Financial assets classified as receivables are carried at amortised cost using the effective interest rate method, less impairment losses, if any. Financial liabilities, other than those at fair value through profit or loss, are measured at amortised cost using the effective interest rate method. -12-
14 For the year ended 2 Summary of significant accounting policies (b) Financial instruments (iii) Measurement Financial liabilities arising from the redeemable units issued by the Fund are carried at the redemption amount representing the investors right to a residual interest in the Fund s assets, effectively fair value at the reporting date. (iv) Offsetting financial instruments Financial assets and liabilities are offset and the net amount reported in the statement of financial position when there is a legally enforceable right to offset the recognised amounts and there is an intention to settle on a net basis, or realise the asset and settle the liability simultaneously. At the end of the reporting period, there are no financial assets or liabilities offset or with the right to offset in the statement of financial position. (c) Net assets attributable to unitholders Units are redeemable at the unitholders option, however, applications and redemptions may be suspended by the Responsible Entity if it is in the best interests of the unitholders. The units are classified as financial liabilities as the Fund is required to distribute its distributable income. The units can be put back to the Fund at any time for cash based on the redemption price. The fair value of redeemable units is measured at the redemption amount that is payable (based on the redemption unit price) at the end of the reporting period if unitholders exercised their right to redeem units from the Fund. (d) Cash and cash equivalents For the purpose of presentation in the statement of cash flows, cash and cash equivalents include cash on hand, deposits held at call with financial institutions, other short term, highly liquid investments with original maturities of three months or less that are readily convertible to known amounts of cash and which are subject to an insignificant risk of changes in value. (e) Investment income Interest income on cash and cash equivalents is recognised in the statement of comprehensive income on an accruals basis. Dividend income is recognised in the statement of comprehensive income on the ex-dividend date with any related foreign withholding tax recorded as an expense. Other operating income is recognised on an accruals basis. (f) Expenses All expenses, including management fees, are recognised in the statement of comprehensive income on an accruals basis. (g) Income tax Under current legislation, the Fund is not subject to income tax as unitholders are presently entitled to the taxable income of the Fund (including assessable capital gains). Financial instruments held at fair value may include unrealised capital gains. Should such a gain be realised, that portion of the gain that is subject to capital gains tax will be distributed so that the Fund is not subject to capital gains tax. Realised capital losses are not distributed to unitholders but are retained in the Fund to be offset against any realised capital gains. If realised capital gains exceed realised capital losses, the excess is distributed to unitholders. The benefits of imputation credits and foreign tax paid are passed on to unitholders. -13-
15 For the year ended 2 Summary of significant accounting policies (g) Income tax The Fund currently incurs withholding tax imposed by certain countries on investment income. Such income is recorded gross of withholding tax in the statement of comprehensive income. (h) Increase/decrease in net assets attributable to unitholders Income not distributed is included in net assets attributed to unitholders. When the Fund s units are classified as liabilities, movements in net assets attributable to unitholders are recognised in profit or loss as finance costs. (i) Foreign currency translation (i) Functional and presentation currency Items included in the Fund s financial statements are measured using the currency of the primary economic environment in which it operates (the functional currency ). This is the Australian dollar, which reflects the currency of the economy in which the Fund competes for funds and is regulated. The Australian dollar is also the Fund s presentation currency. (ii) Transactions and balances Foreign currency transactions are translated into the functional currency using the exchange rates prevailing at the dates of the transactions. Foreign exchange gains and losses resulting from the settlement of such transactions and from the translations at year end exchange rates of monetary assets and liabilities denominated in foreign currencies are recognised in the statement of comprehensive income. The Fund does not isolate that portion of gains or losses on securities and derivative financial instruments that are measured at fair value through profit or loss and which is due to changes in foreign exchange rates from that which is due to changes in the market price of securities. Such fluctuations are included with the net gains/(losses) on financial instruments at fair value through profit or loss in the statement of comprehensive income. (j) Due from/to brokers Amounts due from/to brokers represent receivables for securities sold and payables for securities purchased that have been contracted for but not yet delivered by the end of the year. Trades are recorded on trade date, and normally settled within two business days. A provision for impairment of amounts due from brokers is established when there is objective evidence that the Fund will not be able to collect all amounts due from the relevant broker. Indicators that the amount due from brokers is impaired include significant financial difficulties of the broker, probability that the broker will enter into bankruptcy or financial reorganisation and default in payments. (k) Receivables Receivables may include amounts for dividends, trust distributions, interest, investment sold and applications received for units in the Fund where settlement has not yet occurred. Dividends and trust distributions are accrued when the right to receive payment is established. Interest is accrued at the reporting date from the time of last payment in accordance with the policy set out in note 2(e) above. Amounts are generally received within 30 days of being recorded as receivables. (l) Payables Payables include liabilities and accrued expenses owing by the Fund which are unpaid as at the end of the reporting date. The distribution amount payable to unitholders as at the reporting date is recognised separately on the statement of financial position when unitholders are presently entitled to the distributable income under the Fund s Constitution. -14-
16 For the year ended 2 Summary of significant accounting policies (m) Goods and Services Tax (GST) The GST incurred on the costs of various services provided to the Fund by third parties such as management fees and other expenses have been passed onto the Fund. The Fund qualifies for Reduced Input Tax Credits (RITC), hence management fees and other expenses have been recognised in the statement of comprehensive income net of the amount of GST recoverable from the Australian Taxation Office (ATO). Accounts payable are inclusive of GST. The net amount of GST recoverable from the ATO is included in receivables in the statement of financial position. Cash flows relating to GST are included in the statement of cash flow on a gross basis. (n) Use of estimates The Fund may make estimates and assumptions that affect the reported amounts of assets and liabilities within the next financial year. Estimates are continually evaluated and based on historical experience and other factors, including expectations of future events that are believed to be reasonable under the circumstances. 3 Financial risk management Overview The Fund s assets primarily consisted of financial instruments which comprised securities listed on global stock exchanges. It held these investments at the discretion of the Investment Manager, Columbia Threadneedle Investments, in accordance with the provisions of the Fund s Constitution. Following the Responsible Entity s resolution to wind up the Fund, all of the assets held by the Fund were realised and final proceeds were paid out the unitholders effective 29 June. The nature and extent of the financial instruments employed by the Fund are discussed below. This note presents information about the Fund s exposure to each of the risks below, the Fund s objectives, policies and processes for measuring and managing risk. The Board of Directors of the Responsible Entity had overall responsibility for the establishment and oversight of the Fund s risk management framework. Reports from the Fund s Investment Manager included details of the controls it had in place to monitor compliance with the Fund s investment strategy, training and personnel management standards and procedures, and details of how the Investment Manager developed and maintained a disciplined and constructive control environment in which its employees understood their roles and obligations. The Fund s investing activities exposed it to the following risks: market risk (including price risk, foreign exchange risk and interest rate risk), credit risk and liquidity risk. (a) Market risk Market risk is the risk that changes in market prices, such as foreign exchange rates, interest rates and equity prices will affect the Fund s income or the value of its holdings of financial instruments. Market risk embodies the potential for both losses and gains. The objective of market risk management is to manage and control market risk exposures within acceptable parameters, while optimising the return on risk. The Fund s strategy on the management of the investment risk was driven by the Fund s investment objective and all transactions were carried out within the investment guidelines set by the Responsible Entity. Information relating to the investment objective and guidelines could be obtained from the Product Disclosure Statement. (i) Price risk Price risk is the risk that the value of the financial instrument will fluctuate as a result of changes in market prices (other than those arising from foreign exchange risk and interest rate risk), whether caused by factors specific to an individual investment, its issuer or all factors affecting all instruments traded in the market. -15-
17 For the year ended 3 Financial risk management (a) Market risk (i) Price risk As the Fund s financial instruments were carried at fair value with fair value changes recognised in the statement of comprehensive income, all changes in market conditions would directly affect income. The Fund s overall market positions were monitored on a regular basis by the Responsible Entity. This information and the compliance with the Scheme s Product Disclosure Statement were reported to the Investment Committee, other key management personnel, the Compliance Committee and ultimately the Board where deemed appropriate. A sensitivity analysis of price risk is provided in note 3(a)(iv). (ii) Foreign exchange risk The foreign exchange risk is the risk that the fair value of future cash flows of a financial instrument will fluctuate because of changes in foreign exchange rates. The Fund was exposed to foreign exchange risk on financial instruments, cash held, receivables and liabilities that were denominated in a currency other than the functional currency (Australian dollars) of the Fund. These transactions were denominated in numerous currencies. The Fund s strategy on the management of foreign exchange risk was driven by the Fund s investment objective. The Fund s foreign exchange risk was managed and monitored on a daily basis by the Investment Manager in accordance with the investment guidelines as outlined in the Fund s Product Disclosure Statement. Foreign exchange risk was managed by ensuring investments were within the limits set for individual currencies thus minimizing currency concentration risk. Predicting currencies is difficult but an attempt to minimize foreign exchange risk is made by taking currency forecasts into consideration when making investment decisions. The Fund could invest in financial instruments and enter into transactions denominated in currencies other than its functional currency. Consequently, the Fund was exposed to risks that the exchange rate of its currency relative to other foreign currencies could have changed in a manner that had an adverse effect on the value of that portion of the Fund s assets or liabilities denominated in currencies other than the Australian dollar. As part of the wind up process all foreign assets were sold and proceeds were converted to Australian Dollars. Therefore the Fund had no exposure to foreign exchange risk as at. The table below summarizes the Fund s assets and liabilities that are denominated in these currencies. Net currency exposure A$ 000 A$ 000 US Dollars - 17,521 British Pound - 6,521 Euro - 4,660 Swiss Franc - 2,102 Canadian Dollar - 1,717 New Taiwan Dollar - 1,666 Japanese Yen - 1,515 Other - 3,601 Total - 39,
18 For the year ended 3 Financial risk management (a) Market risk (ii) Foreign exchange risk A sensitivity analysis of foreign exchange risk is provided in note 3(a)(iv). (iii) Interest rate risk The majority of the Fund s financial assets were non-interest bearing and as such the Fund was not exposed to significant levels of interest rate risk. However, the Fund held cash for liquidity and transactional purposes. The cash was held at floating interest rates. (iv) Summarised sensitivity analysis The following table summarises the sensitivity of the Fund s operating profit/(loss) and net assets attributable to unitholders to market risk. The reasonably possible movements in the risk variables have been determined based on management s best estimate, having regard to a number of factors, including historical correlation of the Fund s investments with the relevant benchmark and market volatility. However, actual movements in the risk variables may be greater or less than anticipated due to a number of factors, including unusually large market movements resulting from changes in the performance of the economies, markets and securities in which the Fund invests. As a result, historic variations in risk variables are not a definitive indicator of future variations in the risk variables. Price risk Foreign exchange risk Impact on operating profit(loss)/net assets attributable to unitholders -12% +12% -10% +10% $ 000 $ 000 $ 000 $ (3,302) 3,302 (3,930) 3,930 The sensitivity factors for were +/-12% for price risk and +/-10% for foreign exchange risk. In determining the impact of an increase/decrease in operating profit/(loss) and net assets attributable to unitholders arising from market risk, the Responsible Entity has considered prior period and expected future movements of the portfolio information in order to determine a reasonable possible shift in assumptions. (b) Credit risk Credit risk is the risk that a counterparty to a financial instrument will fail to discharge an obligation or commitment that it has entered into with the Fund. The Fund s credit risk was minimised by the Investment Manager by monitoring counterparty creditworthiness and only dealing with listed exchanges and internally approved counterparties each with set limits. Internally approved counterparties and the associated credit limits were regularly reviewed and monitored by the Investment Manager. At, the Fund was exposed to credit risk on its cash and cash equivalents and receivables. The total carrying amount of financial assets exposed to credit risk amounted to $670,000 (: $836,000). (i) Settlement of securities transactions Credit risk arising on transactions with brokers relates to transactions awaiting settlement. The Fund minimised concentration of credit risk by undertaking transactions with numerous brokers. The risk relating to unsettled transactions was considered small due to the short settlement period involved and the high quality of the brokers used. The Fund monitored the credit rating and financial positions of the brokers used to further mitigate credit risk. -17-
19 For the year ended 3 Financial risk management (b) Credit risk (i) Settlement of securities transactions All transactions in listed securities were settled/paid for upon delivery using approved brokers. The risk of default was considered low, as delivery of securities sold was only made once the broker had received payment. Payment was made on purchases of securities only when the securities had been received by the broker. The trade would fail if either party fails to meet its obligations. (ii) Cash and cash equivalents The Fund s cash and cash equivalents were held with State Street Bank and Trust Company, which is rated Aa1 (: Aa1) based on rating agency Moody s rating. The Responsible Entity monitored the financial position of State Street Bank and Trust Company on a regular basis. The Fund was not materially exposed to credit risk on other financial assets. The maximum exposure to credit risk at the reporting date is the carrying amount of the financial assets. (c) Liquidity risk Liquidity risk is the risk that the Fund will not be able to meet its financial obligations as they fall due. The Fund s approach to managing liquidity is to ensure, as far as possible, that it will always have sufficient liquidity to meet its liabilities when due, under both normal and stressed conditions, without incurring unacceptable losses or risking damage to the Fund s reputation. The Fund s Constitution provided for the daily application and redemptions of units and it is therefore exposed to the liquidity risk of meeting unitholders redemptions. The Fund was generally able to sell its investment holdings and receive proceeds within approximately five business days. Redemptions were usually processed and paid within seven business days after a redemption day. Under the terms of its Constitution, the Fund had the ability to manage liquidity risk by delaying redemptions to unitholders, if necessary, until the funds were available to pay them. The Fund s liquidity risk was managed on an on-going basis by the Responsible Entity by monitoring current cash balances and projecting future cash flow requirements. When the Responsible Entity considered that additional cash reserves may be required, the Responsible Entity would redeem a portion of its investment holdings. (i) Maturities of net settled derivative financial instruments The table below analyses the Fund s net settled derivative financial instruments based on their contractual maturity. The Fund may, at its discretion, settle financial instruments prior to their original contractual settlement date, in accordance with its investment strategy, where permitted by the terms and conditions of the relevant instruments. As at Less than 1 month $ months $ months $ 000 At call $ 000 Total $ 000 Payables Net assets attributable to unitholders Contractual cash flows
20 For the year ended 3 Financial risk management (c) Liquidity risk (i) Maturities of net settled derivative financial instruments As at Less than 1 month $ months $ months $ 000 At call $ 000 Total $ 000 Distributions payable 3, ,572 Payables Net assets attributable to unitholders ,003 38,003 Contractual cash flows 4, ,003 42,109 4 Fair value measurement The Fund measures and recognises the financial assets and liabilities at fair value on a recurring basis. Financial assets designated at fair value through profit or loss (FVTPL) (see note 11) The Fund has no assets or liabilities measured at fair value on a non-recurring basis in the current reporting period. AASB 13 Fair Value Measurement requires disclosure of fair value measurements by level of the following fair value hierarchy: Quoted prices (unadjusted) in active markets for identical assets or liabilities (level 1) Inputs other than quoted prices included within level 1 that are observable for the asset or liability, either directly or indirectly (level 2); and Inputs for the asset or liability that are not based on observable market data (unobservable inputs) (level 3) (i) Fair value in an active market (level 1) The fair value of financial assets and liabilities traded in active markets is based on their quoted market prices at the end of the reporting period without any deduction for estimated future selling costs. The Fund values its investments in accordance with the accounting policies set out in note 2 of the financial statements. Financial assets and liabilities are priced at redemption prices. For the majority of its investments, the Fund relies on information provided by independent pricing services for the valuation of its investments. A financial instrument is regarded as quoted in an active market if quoted prices are readily and regularly available from an exchange, dealer, broker, industry group, pricing service, or regulatory agency, and those prices represent actual and regularly occurring market transactions on an arm s length basis. An active market is a market in which transactions for the asset or liability take place with sufficient frequency and volume to provide pricing information on an ongoing basis. (ii) Fair value in an inactive or unquoted market (level 2 and level 3) The fair value of financial assets and liabilities that are not traded in an active market is determined using valuation techniques. These include the use of recent arm s length market transactions, reference to the current fair value of a substantially similar other instrument, discounted cash flow techniques, option pricing models or any other valuation technique that provides a reliable estimate of prices obtained in actual market transactions. -19-
21 For the year ended 4 Fair value measurement (iii) Recognised fair value measurements The following table presents the Fund s assets and liabilities measured and recognised at fair value as at and. The Fund did not held any investments as at (: listed equity securities and listed unit trusts). As at Level 1 $ 000 Level 2 $ 000 Level 3 $ 000 Total $ 000 Financial assets Financial assets designated at fair value through profit or loss: Equity securities 39, ,007 Unit trusts 2, ,266 Total 41, ,273 (iv) Transfers between levels The Fund s policy is to recognise transfers into and transfers out of fair value hierarchy levels as at the end of the reporting period. There were no transfers between levels in the fair value hierarchy for the years ended and. (v) Fair value measurements using significant unobservable inputs (level 3) The Fund did not hold any financial instruments with fair value measurements using significant unobservable inputs during the year ended and year ended. (vi) Financial instruments not carried at fair value The Fund did not hold any financial instruments which were not measured at fair value in the statement of financial position during the year ended or year ended. Due to their short-term nature, the carrying amounts of receivables and payables are assumed to approximate their fair value. 5 Auditor s remuneration Year ended $ $ Audit and review services Audit and audit related services - KPMG Financial statements audit 9,690 9,500 Compliance plan audit 3,400 3,600 Total remuneration for audit and audit related services 13,090 13,
22 For the year ended 5 Auditor s remuneration Year ended $ $ Taxation services Tax compliance services - KPMG 5,385 5,300 Total remuneration for taxation services 5,385 5,300 Total remuneration 18,475 18,400 The Auditor s remuneration is borne by the Responsible Entity. 6 Net gains/(losses) on financial instruments held at fair value through profit or loss Net gains/(losses) recognised in relation to financial assets and financial liabilities held at fair value through profit or loss: Year ended $ 000 $ 000 Net unrealised gains/(losses) on financial instruments designated at fair value through profit or loss (2,996) (493) (2,996) (493) Net realised gains/(losses) on financial instruments held for trading Net realised gains/(losses) on financial instruments designated at fair value through profit or loss 5,071 3,875 5,282 3,886 Total net gains/(losses) on financial instruments held at fair value through profit or loss 2,286 3,
23 For the year ended 7 Net assets attributable to unitholders Movements in number of units and net assets attributable to unitholders during the year were as follows: Year ended Units 000 Units 000 $ 000 $ 000 Opening balance 26,769 35,165 38,003 50,268 Applications 3,137 5,171 4,503 7,592 Redemptions (29,723) (13,733) (40,088) (20,411) Units issued upon reinvestment of distributions Increase/(decrease) in net assets attributable to unitholders - - (2,205) 314 Closing balance , ,003 As stipulated within the Fund s Constitution, each unit represents a right to an individual share in the Fund and does not extend to a right to the underlying assets of the Fund. There are no separate classes of units and each unit has the same rights attaching to it as all other units of the Fund. Capital risk management The Fund considers its net assets attributable to unitholders as capital until. The amount of net assets attributable to unitholders can change significantly on a daily basis as the Fund is subject to daily applications and redemptions at the discretion of unitholders. Daily applications and redemptions are reviewed relative to the liquidity of the Fund s underlying assets on a daily basis by the Responsible Entity. Under the terms of the Fund s Constitution, the Responsible Entity has the discretion to reject an application for units and to defer or adjust a redemption of units if the exercise of such discretion is in the best interests of unitholders. 8 Distributions to unitholders Year ended $ 000 CPU $ 000 CPU Distributions paid 4, Distributions payable - - 3, Total distributions 4, ,
24 For the year ended 9 Cash and cash equivalents As at $ 000 $ 000 Cash at bank Total cash and cash equivalents Reconciliation of profit/(loss) to net cash inflow/(outflow) from operating activities Year ended $ 000 $ 000 (a) Reconciliation of profit/(loss) to net cash inflow/(outflow) from operating activities Increase/(decrease) in net assets attributable to unitholders (2,205) 314 Distributions to unitholders 4,927 4,275 Net changes in financial instruments held at fair value through profit or loss (2,286) (3,393) Net foreign exchange (gains)/losses Net change in receivables Net change in payables (27) (27) Net cash inflow/(outflow) from operating activities 748 1,278 (b) Non-cash operating and financing activities The following distribution payments to unitholders were satisfied by the issue of units under the distribution reinvestment plan Total non-cash operating and financing activities As described in note 2, income not distributed is included in net assets attributable to unitholders. The change in this amount (as reported in (a) above) represents a non-cash financing cost as it is not settled in cash until such time as it becomes distributable. -23-
25 For the year ended 11 Financial assets held at fair value through profit or loss As at $ 000 $ 000 Designated at fair value through profit or loss Equity securities - 39,007 Unit trusts - 2,266 Total designated at fair value through profit or loss - 41,273 Total financial assets held at fair value through profit or loss - 41,273 An overview of the risk exposures relating to financial assets held at fair value through profit or loss is included in note Receivables As at $ 000 $ 000 Distributions and dividends receivable Other receivables 9 15 Total receivables Payables As at $ 000 $ 000 Redemptions payable Management fees payable - 34 Administration fees payable - 3 Withholding tax payable - 19 Other payables 29 - Total payables
26 For the year ended 14 Related party transactions Responsible Entity The Responsible Entity of Threadneedle Global Equity Income Fund (Unhedged) is Ironbark Asset Management (Fund Services) Limited (ABN ) (AFSL ). Accordingly, transactions with entities related to Ironbark Asset Management (Fund Services) Limited are disclosed below. (a) Key management personnel The Fund does not employ personnel in its own right. However it is required to have an incorporated Responsible Entity to manage the activities of the Fund and this is considered the key management personnel. Key management personnel of the Responsible Entity include persons who held office as directors of the Responsible Entity at any time during the year and up to the date of this report: B Carpenter A Donald C Larsen (b) Key management personnel unitholdings Key management personnel of the Responsible Entity did not hold units in the Fund as at (: Nil). (c) Key management personnel compensation Key management personnel were paid by the Responsible Entity. Payments made from the Fund to the Responsible Entity did not include any amounts directly attributable to the compensation of key management personnel. (d) Key management personnel loan disclosures The Fund has not made, guaranteed or secured, directly or indirectly, any loans to the Responsible Entity, its key management personnel or their personally related entities at any time during the reporting period. (e) Other transactions within the Fund Apart from those details disclosed in this note, the Responsible Entity has not entered into any other material contract with the Fund since the end of the previous financial year and there were no material contracts involving director s interests at year end. Management fees Management fees are calculated in accordance with the Fund s Constitution. For the year ended, the management fee was 0.950% (: 0.950%) per annum of the net asset value of the Fund, inclusive of the net effect of GST. Administration fees Administration fees are calculated in accordance with the Fund s Constitution, which allows the Responsible Entity to recover from the Fund certain fees and costs associated with the day-to-day operation of the Fund as specified in the Constitution. For the year ended, the administration fee was 0.103% (: 0.103%) per annum of the net asset value of the Fund. -25-
27 For the year ended 14 Related party transactions (e) Other transactions within the Fund Balances with related parties All related party transactions are conducted on normal commercial terms and conditions. The transactions during the year and amounts payable at year end between the Fund and the Responsible Entity were as follows: $ $ Management fees for the year 315, ,242 Administration fees for the year 34,075 49,527 Aggregate amounts payable to the Responsible Entity at the reporting date - 37,468 (f) Related party unitholdings Parties related to the Fund including the Responsible Entity, its related parties and other funds managed by the Responsible Entity, did not hold any units in the Fund as at (: Nil). (g) Investments The Fund did not hold any investments in the Responsible Entity or its related parties during the year (: Nil). 15 Events occurring after the reporting period The Responsible Entity has finalised proceedings to wind up the Fund following the payment of final proceeds to unitholders on 26 July. The Fund s financial report for the year ending will be the final financial report in respect of the Fund. Other than above, no other significant events have occurred since the end of the reporting period which would impact on the financial position of the Fund as disclosed in the statement of financial position as at or on the results and cash flows of the Fund for the year ended on that date. 16 Contingent assets and liabilities and commitments There were no outstanding contingent assets and liabilities or commitments as at and. -26-


28

29
30
AMS Moderately Conservative Fund
 Annual Financial Report ARSN: 169 105 319 For the year ended Responsible Entity: Ironbark Asset Management (Fund Services) Limited ABN 63 116 232 154 AFSL 298 626 ARSN 169 105 319 Annual financial report
Ironbark Global (ex-australia) Property Securities Fund
 Property Securities Fund") Ironbark Global (ex-australia) Property Securities Fund ARSN 110 908 793 Annual Financial Report For the year ended 2018 Responsible Entity Ironbark Asset Management (Fund Serviced) Ltd ABN: 63 116 232
Ironbark Global (ex-australia) Property Securities Fund ARSN 110 908 793 Annual Financial Report For the year ended 2018 Responsible Entity Ironbark Asset Management (Fund Serviced) Ltd ABN: 63 116 232
Sestante Diversified Fund
 ARSN 613 157 387 Annual Financial Report Responsible Entity AZ Sestante Limited ABN: 94 106 888 662 AFSL: 284442 ARSN 613 157 387 Annual financial report Contents Page Directors report 2 Auditor s independence
Pzena Funds Annual report For the year ended 30 June 2018
 Annual report For the year ended These financial reports cover the following Pzena Funds: Pzena Emerging Markets Value Fund ARSN 613 119 681 Pzena Global Expanded Value Fund ARSN 613 118 522 Annual report
Paradice Global Small Mid Cap Fund ARSN Annual report For the year ended 30 June 2017
 ARSN 161 493 456 Annual report ARSN 161 493 456 Annual report Contents Directors' report Auditor's independence declaration Statement of comprehensive income Statement of financial position Statement of
Copper Rock Capital Global Small Cap Fund ARSN Annual report For the year ended 30 June 2017
 ARSN 146 874 820 Annual report For the year ended 2017 ARSN 146 874 820 Annual report For the year ended 2017 Contents Directors report Auditor s independence declaration Statement of comprehensive income
For personal use only
 Aberdeen Actively Hedged International Equities Fund ARSN 088 905 033 Annual financial report Aberdeen Actively Hedged International Equities Fund ARSN 088 905 033 Annual financial report Contents Page
BNP Paribas Environmental Equity Trust ARSN Annual report For the year ended 30 June 2018
 ARSN 615 479 662 Annual report For the year ended 2018 ARSN 615 479 662 Annual report For the year ended 2018 Contents Directors' report Auditor's independence declaration Statement of comprehensive income
Wellington Management Portfolios (Australia) Global Value Equity Portfolio ARSN Annual report - 30 June 2013
 Global Value Equity Portfolio ARSN Annual report - 30 June 2013") Wellington Management Portfolios (Australia) Global Value Equity Portfolio ARSN 133 267 115 Annual report - 30 June 2013 ARSN 133 267 115 Annual report - 30 June 2013 Contents Page Directors' Report 1
Wellington Management Portfolios (Australia) Global Value Equity Portfolio ARSN 133 267 115 Annual report - 30 June 2013 ARSN 133 267 115 Annual report - 30 June 2013 Contents Page Directors' Report 1
Solaris Australian Equity Fund (Total Return) ARSN Annual Financial Statements for the year ended 30 June 2017
 ARSN Annual Financial Statements for the year ended 30 June 2017") ARSN 167 220 546 Annual Financial Statements for the year ended 30 June 2017 ARSN 167 220 546 Annual Financial Statements for the year ended 30 June 2017 Contents Page Directors' report 2 Auditor's independence
ARSN 167 220 546 Annual Financial Statements for the year ended 30 June 2017 ARSN 167 220 546 Annual Financial Statements for the year ended 30 June 2017 Contents Page Directors' report 2 Auditor's independence
8IP Australian Small Companies Fund ARSN Annual report For the year ended 30 June 2017
 ARSN 143 454 013 Annual report For the year ended ARSN 143 454 013 Annual report For the year ended Contents Directors' report Auditor's independence declaration Statement of comprehensive income Statement
MFS Global Equity Trust ARSN Annual report For the year ended 30 June 2017
 ARSN 093 197 221 Annual report For the year ended ARSN 093 197 221 Annual report For the year ended Contents Directors report Auditor s independence declaration Statement of comprehensive income Statement
Standard Life Investments Global Corporate Bond Trust ARSN Annual report For the year ended 30 June 2017
 Standard Life Investments Global Corporate Bond Trust ARSN 125 896 184 Annual report For the year ended 2017 Standard Life Investments Global Corporate Bond Trust ARSN 125 896 184 Annual report For the
Eaton Vance (Australia) Hexavest All-Country Global Equity Fund ARSN Annual report For the year ended 30 June 2017
 Hexavest All-Country Global Equity Fund ARSN Annual report For the year ended 30 June 2017") Eaton Vance (Australia) Hexavest All-Country Global Equity Fund ARSN 160 970 972 Annual report For the year ended Eaton Vance (Australia) Hexavest All-Country Global Equity Fund ARSN 160 970 972 Annual
Eaton Vance (Australia) Hexavest All-Country Global Equity Fund ARSN 160 970 972 Annual report For the year ended Eaton Vance (Australia) Hexavest All-Country Global Equity Fund ARSN 160 970 972 Annual
PERPETUAL WEALTHFOCUS INVESTMENT FUNDS
 PERPETUAL WEALTHFOCUS INVESTMENT FUNDS ANNUAL FINANCIAL REPORT 30 JUNE Perpetual Investment Management Limited ABN 18 000 866 535 AFSL 234426 Annual Financial Report Contents Page Directors' report 2 Lead
Grant Samuel Tribeca Australian Smaller Companies Fund ARSN Annual report For the year ended 30 June 2018
 ARSN 114 913 003 Annual report For the year ended ARSN 114 913 003 Annual report For the year ended Contents Directors' report Auditor's independence declaration Statement of comprehensive income Statement
T. Rowe Price Australian Equity Fund ARSN Annual report For the year ended 30 June 2018
 ARSN 155 367 481 Annual report For the year ended ARSN 155 367 481 Annual report For the year ended Contents Directors report Auditor s independence declaration Statement of comprehensive income Statement
GQG Partners Funds Annual report For the year ended 30 June 2018
 Annual report For the year ended These financial reports cover the following GQG Partners Funds: ARSN 616 385 838 GQG Partners Emerging Markets Equity Fund ARSN 616 386 344 Annual report For the year ended
Standard Life Investments Global Equity Unconstrained Trust ARSN Annual report For the period 27 September 2016 to 30 June 2017
 Standard Life Investments Global Equity Unconstrained Trust ARSN 614 785 367 Annual report Standard Life Investments Global Equity Unconstrained Trust ARSN 614 785 367 Annual report Contents Directors
Pendal Australian Share Fund (formerly known as BT Wholesale Core Australian Share Fund) ARSN Annual report - for the year ended 30 June
 ARSN Annual report - for the year ended 30 June") (formerly known as BT Wholesale Core Australian Share Fund) ARSN 089 935 964 Annual report - for the year ended (formerly known as BT Wholesale Core Australian Share Fund) ARSN 089 935 964 Annual report
(formerly known as BT Wholesale Core Australian Share Fund) ARSN 089 935 964 Annual report - for the year ended (formerly known as BT Wholesale Core Australian Share Fund) ARSN 089 935 964 Annual report
Paradice Global Small Mid Cap Fund ARSN Annual report For the year ended 30 June 2018
 ARSN 161 493 456 Annual report ARSN 161 493 456 Annual report Contents Directors' report Auditor's independence declaration Statement of comprehensive income Statement of financial position Statement of
Neuberger Berman Systematic Global Equity Trust ARSN Annual report For the year ended 30 June 2017
 ARSN 096 008 703 Annual report ARSN 096 008 703 Annual report Contents Directors report Auditor s independence declaration Statement of comprehensive income Statement of financial position Statement of
Macquarie Global Multi-Sector Fixed Income Fund ARSN Annual report - 30 June 2013
 Macquarie Global Multi-Sector Fixed Income Fund ARSN 154 703 474 Annual report - 30 June 2013 ARSN 154 703 474 Annual report - 30 June 2013 Contents Page Directors' Report 1 Auditor's Independence Declaration
Macquarie Investment Grade Bond Fund ARSN Annual report - 30 June 2013
 Macquarie Investment Grade Bond Fund ARSN 094 159 476 Annual report - 30 June 2013 ARSN 094 159 476 Annual report - 30 June 2013 Contents Page Directors' Report 1 Auditor's Independence Declaration 4 Statement
C Worldwide Global Equity Trust (formerly known as "Carnegie Worldwide Equity Trust") ARSN Annual report For the year ended 30 June 2017
 ARSN Annual report For the year ended 30 June 2017") (formerly known as "Carnegie Worldwide Equity Trust") ARSN 087 585 368 Annual report For the year ended (formerly known as "Carnegie Worldwide Equity Trust") ARSN 087 585 368 Annual report For the year
(formerly known as "Carnegie Worldwide Equity Trust") ARSN 087 585 368 Annual report For the year ended (formerly known as "Carnegie Worldwide Equity Trust") ARSN 087 585 368 Annual report For the year
MCG Endowment Strategy Fund ARSN Annual report For the year ended 30 June 2017
 ARSN 124 225 734 Annual report For the year ended ARSN 124 225 734 Annual report For the year ended Contents Directors' report Auditor's independence declaration Statement of comprehensive income Statement
Lincoln Australian Growth Fund
 ARSN 111 734 279 Annual report For the year ended ARSN 111 734 279 Annual report For the year ended Contents Directors' report Auditor's independence declaration Statement of comprehensive income Statement
Paradice Large Cap Fund (formerly known as "Paradice Emerging Markets Equity Fund") Annual report For the period 9 March 2017 to 30 June 2018
 Annual report For the period 9 March 2017 to 30 June 2018") (formerly known as "Paradice Emerging Markets Equity Fund") ARSN 617 679 071 Annual report ARSN 617 679 071 Annual report Contents Directors' report Auditor's independence declaration Statement of comprehensive
(formerly known as "Paradice Emerging Markets Equity Fund") ARSN 617 679 071 Annual report ARSN 617 679 071 Annual report Contents Directors' report Auditor's independence declaration Statement of comprehensive
Loftus Peak Global Disruption Fund (formerly known as "EQT Valu-Trac Equity Income Generation Fund") ARSN Annual report For the year
 ARSN Annual report For the year") (formerly known as "EQT Valu-Trac Equity Income Generation Fund") ARSN 098 764 080 Annual report (formerly known as "EQT Valu-Trac Equity Income Generation Fund") ARSN 098 764 080 Annual report Contents
(formerly known as "EQT Valu-Trac Equity Income Generation Fund") ARSN 098 764 080 Annual report (formerly known as "EQT Valu-Trac Equity Income Generation Fund") ARSN 098 764 080 Annual report Contents
Macquarie Wholesale Australian Equities Fund ARSN Annual report - 30 June 2013
 Macquarie Wholesale Australian Equities Fund ARSN 096 152 911 Annual report - 30 June ARSN 096 152 911 Annual report - 30 June Contents Page Directors' Report 1 Auditor's Independence Declaration 4 Statement
For personal use only
 VanEck Vectors MSCI World ex Australia Quality ETF (ASX Code: QUAL) ARSN 601 798 172 Financial report For the year ended 2018 VanEck Vectors MSCI World ex Australia Quality ETF (ASX Code: QUAL) ARSN 601
Alpha Australian Small Companies Fund ARSN Annual report For the year ended 30 June 2017
 ARSN 124 204 084 Annual report For the year ended ARSN 124 204 084 Annual report For the year ended Contents Directors report Auditor s independence declaration Statement of comprehensive income Statement
Atlantic Pacific Australian Equity Fund ARSN Annual report For the year ended 30 June 2017
 ARSN 158 861 155 Annual report ARSN 158 861 155 Annual report Contents Directors' report Auditor's independence declaration Statement of comprehensive income Statement of financial position Statement of
Polaris Global Equity Fund ARSN Annual report - 30 June 2017
 ARSN 169 928 232 Annual report - 30 June 2017 ARSN 169 928 232 Annual report - 30 June 2017 Contents Page Directors' Report 1 Auditor's Independence Declaration 4 Statement of Comprehensive Income 5 Statement
MFS Funds Annual report For the year ended 30 June 2018
 Annual report For the year ended This financial report covers the following MFS Funds: MFS Concentrated Global ARSN 130 718 188 MFS Blended Research Global ARSN 168 190 154 MFS Low Volatility Global ARSN
Walter Scott Emerging Markets Fund ARSN Annual report - 30 June 2013
 ARSN 140 355 719 Annual report - 30 June 2013 ARSN 140 355 719 Annual report - 30 June 2013 Contents Page Directors' Report 1 Auditor's Independence Declaration 4 Statement of Comprehensive Income 5 Statement
T. Rowe Price Funds Annual report For the year ended 30 June 2018
 Annual report For the year ended This financial report covers the following T. Rowe Price s: T. Rowe Price Global Equity ARSN 121 250 691 T. Rowe Price Global Equity (Hedged) ARSN 153 990 044 T. Rowe Price
All Star IAM Australian Share Fund ARSN Annual report For the year ended 30 June 2016
 ARSN 126 274 762 Annual report ARSN 126 274 762 Annual report Contents Directors' report Auditor's independence declaration Statement of comprehensive income Statement of financial position Statement of
For personal use only
 ARSN 616 755 803 Financial Report - ARSN 616 755 803 Financial Report - Contents Page Directors' Report 1 Auditor's Independence Declaration 5 Statement of Profit or Loss and Other Comprehensive Income
van Eyk Blueprint Global Emerging Markets Fund ARSN Annual report - 30 June 2013
 van Eyk Blueprint Global Emerging Markets Fund ARSN 133 494 461 Annual report - 30 June ARSN 133 494 461 Annual report - 30 June Contents Page Directors' Report 1 Auditor's Independence Declaration 4 Statement
21 September ASX Limited Market Announcements Office ANNUAL FINANCIAL REPORT [FOR RELEASE UNDER EACH ASX CODE LISTED BELOW]
![21 September ASX Limited Market Announcements Office ANNUAL FINANCIAL REPORT [FOR RELEASE UNDER EACH ASX CODE LISTED BELOW]](/thumbs/88/115046498.jpg "21 September ASX Limited Market Announcements Office ANNUAL FINANCIAL REPORT [FOR RELEASE UNDER EACH ASX CODE LISTED BELOW]") Investments Limited ABN 22 146 596 116, AFSL 416755 Aurora Place, Level 4 88 Phillip Street, Sydney NSW 2000 www.vaneck.com.au 21 September ASX Limited Market Announcements Office ANNUAL FINANCIAL REPORT
Investments Limited ABN 22 146 596 116, AFSL 416755 Aurora Place, Level 4 88 Phillip Street, Sydney NSW 2000 www.vaneck.com.au 21 September ASX Limited Market Announcements Office ANNUAL FINANCIAL REPORT
Robeco Emerging Conservative Equity Fund (AUD) ARSN Annual report For the year ended 30 June 2017
 ARSN Annual report For the year ended 30 June 2017") Robeco Emerging Conservative Equity Fund (AUD) ARSN 165 582 543 Annual report For the year ended Robeco Emerging Conservative Equity Fund (AUD) ARSN 165 582 543 Annual report For the year ended Contents
Robeco Emerging Conservative Equity Fund (AUD) ARSN 165 582 543 Annual report For the year ended Robeco Emerging Conservative Equity Fund (AUD) ARSN 165 582 543 Annual report For the year ended Contents
Bell Global Emerging Companies Fund
 Bell Global Emerging Companies Fund Annual Financial Report For the year ended 30 June 2018 ARSN 160 079 541 Bell Asset Management Limited ABN 84 092 278 647 This page has been intentionally left blank.
For personal use only
 ARSN 616 755 652 Annual Financial Report - 30 June 2018 ARSN 616 755 652 Annual Financial Report - 30 June 2018 Contents Page Directors' Report 1 Auditor's Independence Declaration 5 Statement of Profit
For personal use only
 VanEck Vectors FTSE Global Infrastructure (Hedged) ETF (ASX Code: IFRA) ARSN 611 369 058 Interim report For the period from 3 May 2016 (commencement of operations) to 30 September 2016 VanEck Vectors FTSE
Macquarie Global Infrastructure Trust II ARSN Annual report - 30 June 2013
 Macquarie Global Infrastructure Trust II ARSN 108 891 532 Annual report - 30 June ARSN 108 891 532 Annual report - 30 June Contents Page Directors' Report 1 Auditor's Independence Declaration 4 Statement
Solaris Core Australian Equity Fund. ARSN Annual financial statements for the year ended 30 June 2017
 ARSN 128 859 898 Annual financial statements for the year ended 30 June 2017 ARSN 128 859 898 Annual financial statements for the year ended 30 June 2017 Contents Page Directors' report 2 Auditor's independence
i Capital International Value Fund ARSN Financial statements For the year ended 30 June 2016
 ARSN 134 578 180 Financial statements For the year ended 2016 ARSN 134 578 180 Financial statements For the year ended 2016 Contents Page Directors' report 2 Auditor's independence declaration 5 Statement
van Eyk Blueprint High Growth Fund ARSN Annual report - 30 June 2013
 ARSN 103 447 141 Annual report - 30 June ARSN 103 447 141 Annual report - 30 June Contents Page Directors' Report 1 Auditor's Independence Declaration 4 Statement of Comprehensive Income 5 Statement of
L1 Capital UK Residential Property Fund ARSN Annual report For the period 25 July 2017 to 30 June 2018
 ARSN 620 381 704 Annual report ARSN 620 381 704 Annual report Contents Directors report Auditor s independence declaration Statement of comprehensive income Statement of financial position Statement of
Alpha Funds Annual report For the year ended 30 June 2018
 Annual report This financial report covers the following : Alpha Australian Blue Chip Fund ARSN 124 204 217 Alpha Global Opportunities Fund ARSN 124 204 299 Alpha Property Securities Fund ARSN 124 203
Booklet 1. BetaShares Australian High Interest Cash ETF (ARSN ) BetaShares British Pound ETF (ARSN )
 BetaShares British Pound ETF (ARSN )") BetaShares Interest Cash (ARSN 143 219 961) BetaShares (ARSN 151 133 514) BetaShares (ARSN 151 131 967) BetaShares (ARSN 147 517 280) Annual Financial Report Annual Financial Report Contents Page Directors'
BetaShares Interest Cash (ARSN 143 219 961) BetaShares (ARSN 151 133 514) BetaShares (ARSN 151 131 967) BetaShares (ARSN 147 517 280) Annual Financial Report Annual Financial Report Contents Page Directors'
Macquarie Wholesale Co-Investment Fund ARSN Report for the period ended 31 October 2017
 Macquarie Wholesale Co-Investment Fund ARSN 113 983 305 Report for the period ended ARSN 113 983 305 Report for the period ended Contents Page Directors' Report 1 Auditor's Independence Declaration 4 Statement
Macquarie Inflation Linked Bond Fund ARSN Annual report - 30 June 2013
 Macquarie Inflation Linked Bond Fund ARSN 091 491 039 Annual report - 30 June 2013 ARSN 091 491 039 Annual report - 30 June 2013 Contents Page Directors' Report 1 Auditor's Independence Declaration 4 Statement
Polaris Global Equity Fund. ARSN Annual report - 30 June 2016
 ARSN 169 928 232 Annual report - ARSN 169 928 232 Annual report - Contents Page Directors' Report 1 Auditor's Independence Declaration 4 Statement of Comprehensive Income 5 Statement of Financial Position
Macquarie High Yield Bond Fund ARSN Annual report - 30 June 2013
 ARSN 094 159 501 Annual report - 30 June 2013 ARSN 094 159 501 Annual report - 30 June 2013 Contents Page Directors' Report 1 Auditor's Independence Declaration 4 Statement of Comprehensive Income 5 Statement
Analytic Global Managed Volatility Fund ARSN Annual report - 30 June 2017
 Analytic Global Managed Volatility Fund ARSN 140 358 774 Annual report - 30 June 2017 ARSN 140 358 774 Annual report - 30 June 2017 Contents Page Directors' Report 1 Auditor's Independence Declaration
Somerset Emerging Markets Dividend Growth Fund ARSN Annual report For the year ended 30 June 2017
 ARSN 159 702 360 Annual report ARSN 159 702 360 Annual report Contents Directors' report Auditor's independence declaration Statement of comprehensive income Statement of financial position Statement of
Wellington Management Portfolios (Australia) - Global Contrarian Equity Portfolio ARSN Annual report - 30 June 2012
 - Global Contrarian Equity Portfolio ARSN Annual report - 30 June 2012") Wellington Management Portfolios (Australia) - Global Contrarian Equity Portfolio ARSN 129 581 675 Annual report - Wellington Management Portfolios (Australia) - Global Contrarian Equity Portfolio ARSN
Wellington Management Portfolios (Australia) - Global Contrarian Equity Portfolio ARSN 129 581 675 Annual report - Wellington Management Portfolios (Australia) - Global Contrarian Equity Portfolio ARSN
P/E Global FX Alpha Fund ARSN Annual report - For the period 21 February 2017 to 30 June 2017
 ARSN 617 261 186 Annual report - For the period 21 February 2017 to 30 June 2017 ARSN 617 261 186 Annual report - For the period 21 February 2017 to 30 June 2017 Contents Page Directors' Report 1 Auditor's
For personal use only
 ARSN 605 618 577 Annual Financial Report - 30 June 2018 ARSN 605 618 577 Annual Financial Report - 30 June 2018 Contents Page Directors' Report 1 Auditor's Independence Declaration 5 Statement of Profit
T. Rowe Price Asia ex-japan Fund ARSN Annual report For the year ended 30 June 2017
 ARSN 128 842 080 Annual report For the year ended ARSN 128 842 080 Annual report For the year ended Contents Directors' report Auditor's independence declaration Statement of comprehensive income Statement
Annual Financial Report. 30 June 2016
 BetaShares (ARSN 169 907 313) BetaShares Agriculture - Currency Hedged (ARSN 609 246 611) BetaShares Healthcare ETF - Currency Hedged (ARSN 609 155 124) BetaShares Gold Miners ETF - Currency Hedged (ARSN
THE TRUST COMPANY INVESTMENT FUNDS
 THE TRUST COMPANY INVESTMENT FUNDS ANNUAL FINANCIAL REPORT 30 JUNE Perpetual Investment Management Limited ABN 18 000 866 535 AFSL 234426 Investment Funds Annual Financial Report Contents Page Directors'
Henderson Global Equity Fund ARSN Financial report For the period ended 30 June 2014
 ARSN 166 791 760 Financial report For the period ended ARSN 166791 760 Financial report For the period ended Contents Directors' report Auditor's independence declaration Statement of comprehensive income
THE TRUST COMPANY INVESTMENT FUNDS Annual Financial Report 30 June Perpetual Investment Management Limited ABN AFSL
 THE TRUST COMPANY INVESTMENT FUNDS Annual Financial Report 30 June 2016 Perpetual Investment Management Limited ABN 18 000 866 535 AFSL 234426 Investment Funds Annual Financial Report 30 June 2016 Contents
Walter Scott Global Equity Fund (Hedged) ARSN Annual report - 30 June 2013
 ARSN Annual report - 30 June 2013") Walter Scott Global Equity Fund (Hedged) ARSN 129 574 447 Annual report - 30 June 2013 ARSN 129 574 447 Annual report - 30 June 2013 Contents Page Directors' Report 1 Auditor's Independence Declaration
Walter Scott Global Equity Fund (Hedged) ARSN 129 574 447 Annual report - 30 June 2013 ARSN 129 574 447 Annual report - 30 June 2013 Contents Page Directors' Report 1 Auditor's Independence Declaration
Booklet 6. Annual Financial Report For the year ended 30 June Contents. Page
 BetaShares Geared Australian Equity Fund (hedge fund) BetaShares U.S. Equities Strong Bear Hedge Fund - Currency Hedged BetaShares Geared U.S. Equity Fund - Currency Hedged (hedge fund) Annual Financial
Macquarie Australian Diversified Income (AA) Fund (formerly Macquarie Diversified Treasury (AA) Fund) ARSN Annual report - 30 June 2013
 Fund (formerly Macquarie Diversified Treasury (AA) Fund) ARSN Annual report - 30 June 2013") Macquarie Australian Diversified Income (AA) Fund (formerly Macquarie Diversified Treasury (AA) Fund) ARSN 104 932 818 Annual report - ARSN 104 932 818 Annual report - Contents Page Directors' Report 1
Macquarie Australian Diversified Income (AA) Fund (formerly Macquarie Diversified Treasury (AA) Fund) ARSN 104 932 818 Annual report - ARSN 104 932 818 Annual report - Contents Page Directors' Report 1
Arrowstreet Emerging Markets Fund ARSN Annual report - 30 June 2017
 ARSN 122 035 910 Annual report - 30 June 2017 ARSN 122 035 910 Annual report - 30 June 2017 Contents Page Directors' Report 1 Auditor's Independence Declaration 4 Statement of Comprehensive Income 5 Statement
CC JCB Active Bond Fund ARSN Annual Financial Statements for the period from 3 August 2016 to 30 June 2017
 ARSN 610 435 302 Annual Financial Statements for the period from 3 August 2016 to 30 June 2017 ARSN 610 435 302 Annual Financial Statements for the period from 3 August 2016 to 30 June 2017 Contents Page
Macquarie Australian Small Companies Fund ARSN Annual report - 30 June 2012
 ARSN 119 853 566 Annual report - ARSN 119 853 566 Annual report - Contents Page Directors' report 2 Auditor's independence declaration 5 Statements of comprehensive income 6 Statements of financial position
Walter Scott Emerging Markets Fund. ARSN Annual report - 30 June 2014
 ARSN 140 355 719 Annual report - 30 June 2014 ARSN 140 355 719 Annual report - 30 June 2014 Contents Page Directors' Report 1 Auditor's Independence Declaration 4 Statement of Comprehensive Income 5 Statement
Australian Unity High Yield Mortgage Trust ARSN Annual financial statements for the reporting period ended 30 June 2012
 High Yield Mortgage Trust ARSN 113 151 705 Annual financial statements for the reporting period ended 30 June 2012 ARSN 113 151 705 Annual financial statements for the reporting period ended 30 June 2012
Walter Scott Global Equity Fund ARSN Annual report - 30 June 2017
 ARSN 112 828 136 Annual report - 30 June 2017 ARSN 112 828 136 Annual report - 30 June 2017 Contents Page Directors' Report 1 Auditor's Independence Declaration 4 Statement of Comprehensive Income 5 Statement
Morgan Stanley Global Property Securities Fund. ARSN Annual report - 30 June 2014
 Morgan Stanley Global Property Securities Fund ARSN 115 314 979 Annual report - 30 June 2014 ARSN 115 314 979 Annual report - 30 June 2014 Contents Page Directors' Report 1 Auditor's Independence Declaration
Macquarie Asia New Stars No. 1 Fund. ARSN Annual report - 30 June 2014
 Macquarie Asia New Stars No. 1 Fund ARSN 134 226 387 Annual report - 30 June Macquarie Asia New Stars No.1 Fund ARSN 134 226 387 Annual report - 30 June Contents Page Directors' Report 1 Auditor's Independence
Macquarie High Yield Bond Fund ARSN Annual report - 30 June 2017
 ARSN 094 159 501 Annual report - 30 June 2017 ARSN 094 159 501 Annual report - 30 June 2017 Contents Page Directors' Report 1 Auditor's Independence Declaration 4 Statement of Comprehensive Income 5 Statement
PERPETUAL PRIVATE INVESTMENT FUNDS Annual Financial Report 30 June Perpetual Investment Management Limited ABN AFSL
 PERPETUAL PRIVATE INVESTMENT FUNDS Annual Financial Report Perpetual Investment Management Limited ABN 18 000 866 535 AFSL 234426 Annual Financial Report Contents Page Directors' report 2 Lead auditor's
Wellington Management Portfolios (Australia) Global Value Equity Portfolio
 Global Value Equity Portfolio") Wellington Management Portfolios (Australia) Global Value Equity Portfolio ARSN 133 267 115 Annual report - 30 June 2015 ARSN 133 267 115 Annual report - 30 June 2015 Contents Page Directors' Report 1
Wellington Management Portfolios (Australia) Global Value Equity Portfolio ARSN 133 267 115 Annual report - 30 June 2015 ARSN 133 267 115 Annual report - 30 June 2015 Contents Page Directors' Report 1
Macquarie Asia New Stars No. 1 Fund. ARSN Annual report - 30 June 2015
 Macquarie Asia New Stars No. 1 Fund ARSN 134 226 387 Annual report - 30 June ARSN 134 226 387 Annual report - 30 June Contents Page Directors' Report 1 Auditor's Independence Declaration 4 Statement of
Celeste Australian Small Companies Fund ARSN Annual Report For the year ended 30 June 2018
 ARSN 093 539 416 Annual Report For the year ended ARSN 093 539 416 Annual Report For the year ended Contents Page Directors' Report 2 Auditor's Independence Declaration 5 Statement of Comprehensive Income
Bell Global Emerging Companies Fund
 Bell Global Emerging Companies Fund Annual Financial Report For the year ended 30 June 2017 ARSN 160 079 541 Bell Asset Management Limited ABN 84 092 278 647 Contents Directors' report 2 Auditor's independence
For personal use only
 UBS IQ Research Preferred Australian Dividend Fund ARSN 161 570 574 Financial Report For the year ended UBS IQ Research Preferred Australian Dividend Fund ARSN 161 570 574 Financial Report For the year
Partners Group Global Value Fund (AUD) ARSN Annual report For the year ended 30 June 2018
 ARSN Annual report For the year ended 30 June 2018") ARSN 151 215 342 Annual report ARSN 151 215 342 Annual report Contents Directors' report Auditor's independence declaration Statement of comprehensive income Statement of financial position Statement of
ARSN 151 215 342 Annual report ARSN 151 215 342 Annual report Contents Directors' report Auditor's independence declaration Statement of comprehensive income Statement of financial position Statement of
PERPETUAL S TERM FUND
 PERPETUAL S TERM FUND Annual Financial Report 30 June 2014 ARSN 092 387 874 Perpetual Investment Management Limited ABN 18 000 866 535 AFSL 234426 ARSN 092 387 874 Annual Financial Report - 30 June 2014
Macquarie Australian Pure Indexed Equities Fund. ARSN Annual report - 31 December 2013
 Macquarie Australian Pure Indexed Equities Fund ARSN 096 257 224 Annual report - 31 December ARSN 096 257 224 Annual report - 31 December Contents Page Directors' Report 1 Auditor's Independence Declaration
Macquarie Australian Diversified Income (A) Fund (formerly Macquarie Diversified Treasury (A) Fund) ARSN Annual report - 30 June 2013
 Fund (formerly Macquarie Diversified Treasury (A) Fund) ARSN Annual report - 30 June 2013") Macquarie Australian Diversified Income (A) Fund (formerly Macquarie Diversified Treasury ARSN 094 593 790 Annual report - 30 June 2013 ARSN 094 593 790 Annual report - 30 June 2013 Contents Page Directors'
Macquarie Australian Diversified Income (A) Fund (formerly Macquarie Diversified Treasury ARSN 094 593 790 Annual report - 30 June 2013 ARSN 094 593 790 Annual report - 30 June 2013 Contents Page Directors'
IPM Global Macro Fund ARSN Annual report - For the period 21 February 2017 to 30 June 2017
 ARSN 617 257 717 Annual report - For the period 21 February 2017 to 30 June 2017 ARSN 617 257 717 Annual report - For the period 21 February 2017 to 30 June 2017 Contents Page Directors' Report 1 Auditor's
For personal use only
 VanEck Vectors FTSE Global Infrastructure (Hedged) ETF (ASX Code: IFRA) ARSN 611 369 058 Financial report VanEck Vectors FTSE Global Infrastructure (Hedged) ETF (ASX Code: IFRA) ARSN 611 369 058 Financial
Barrow Hanley Global Equity Trust ARSN Annual report For the year ended 30 June 2018
 ARSN 603 923 682 Annual report For the year ended ARSN 603 923 682 Annual report For the year ended Contents Directors' report Auditor's independence declaration Statement of comprehensive income Statement
PERPETUAL CASH MANAGEMENT FUND
 PERPETUAL CASH MANAGEMENT FUND Annual Financial Report 2015 ARSN 093 211 093 Perpetual Investment Management Limited ABN 18 000 866 535 AFSL 234426 ARSN 093 211 093 Annual Financial Report - 2015 Contents
Macquarie Wholesale Property Securities Fund ARSN Annual report - 30 June 2013
 Macquarie Wholesale Property Securities Fund ARSN 090 078 470 Annual report - 30 June ARSN 090 078 470 Annual report - 30 June Contents Page Directors' Report 1 Auditor's Independence Declaration 4 Statement
Infrastructure Securities
 Macquarie International Infrastructure Securities Fund ARSN 115990611 Annual report - Macquarie International Infrastructure Securities Fund ARSN 115990611 Annual report - Contents Directors' report 2Page
Separately Managed Accounts
 ARSN: 114 818 530 Annual Financial Report 30 June 2017 Praemium Australia Limited ABN 92 117 611 784 Australian Financial Services Licence No 297956 Annual Financial Report - 30 June 2017 Contents Page
Orbis Global Equity LE Fund (Australia Registered) ARSN Annual report For the period 2 August 2016 to 30 June 2017
 ARSN Annual report For the period 2 August 2016 to 30 June 2017") ARSN 613 753 030 Annual report to ARSN 613 753 030 Annual report to Contents Directors' report Auditor's independence declaration Statement of comprehensive income Statement of financial position Statement
ARSN 613 753 030 Annual report to ARSN 613 753 030 Annual report to Contents Directors' report Auditor's independence declaration Statement of comprehensive income Statement of financial position Statement
Arrowstreet Global Equity Fund. ARSN Annual report - 30 June 2014
 ARSN 122 036 006 Annual report - 30 June 2014 ARSN 122 036 006 Annual report - 30 June 2014 Contents Page Directors' Report 1 Auditor's Independence Declaration 4 Statement of Comprehensive Income 5 Statement
Macquarie Global Infrastructure Trust II. ARSN Annual report - 30 June 2014
 Macquarie Global Infrastructure Trust II ARSN 108 891 532 Annual report - 30 June ARSN 108 891 532 Annual report - 30 June Contents Page Directors' Report 1 Auditor's Independence Declaration 4 Statement
Macquarie True Index Global Infrastructure Securities Fund. ARSN Annual report - 31 March 2015
 Macquarie True Index Global Infrastructure Securities Fund ARSN 134 225 915 Annual report - 31 March 2015 ARSN 134 225 915 Annual report - 31 March 2015 Contents Page Directors' Report 1 Auditor's Independence
Macquarie Global Multi-Sector Fixed Income Fund. ARSN Annual report - 30 June 2014
 Macquarie Global Multi-Sector Fixed Income Fund ARSN 154 703 474 Annual report - 30 June 2014 ARSN 154 703 474 Annual report - 30 June 2014 Contents Page Directors' Report 1 Auditor's Independence Declaration