Note. EQUITY AND LIABILITIES Equity Members' Equity 64,107, ,850,351
|
|
|
- Todd Bryant
- 5 years ago
- Views:
Transcription
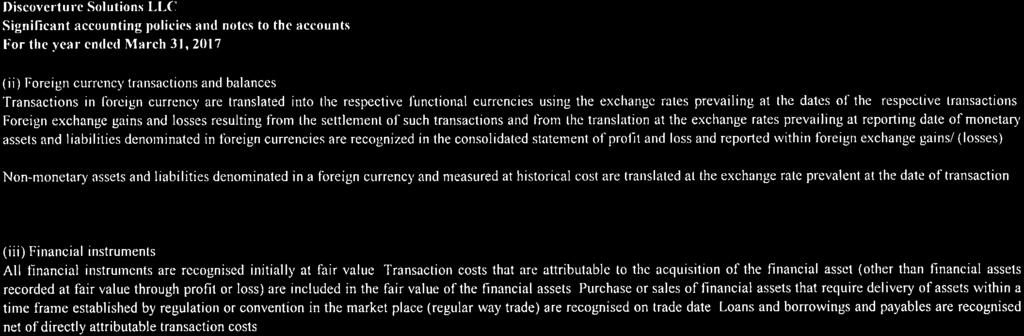
1 Discoverture Solutions LLC Consolidated balance sheet Note As at March 31, 2017 (Amount in Rs) As at March 31, 2016 ASSETS Non-current assets Property, plant and equipment 3 3, ,441 Intangible assets 4-37,956 Financial assets 5 Loans 5.1 1,140,710 1,140,710 Deferred tax assets (Net) 6,411,383 9,111,763 Other non-current assets 6 10,602,761 7,538,511 18,158,231 18,245,381 Current assets Financial assets 7 Trade receivables ,078, ,797,009 Cash and cash equivalents ,200, ,189,016 Other financial assets ,500 9,862,919 Other current assets 8 3,476,838 3,428, ,404, ,277,769 TOTAL ASSETS 279,562, ,523,150 EQUITY AND LIABILITIES Equity Members' Equity 64,107, ,850,351 Liabilities Current liabilities Financial liabilities 9 Trade payables 38,248, ,814,582 Other financial liabilities ,047,582 24,661,771 Other current liabilities ,429 4,263,057 Provisions 11 8,526,483 7,058,535 Current tax liabilities (Net) 104,371,584 76,874, ,455, ,672,799 TOTAL EQUITY AND LIABILITIES 279,562, ,523,150 See accompanying notes to the consolidated financial statements For Discoverture Solutions LLC By its sole member Mindtree Limited Authorised Signatory Place : Bangalore Date : April 20, 2017
2 Discoverture Solutions LLC Consolidated statement of profit and loss Revenue from operations Other income Total income Expenses Employee benefits expense Depreciation and amortization expense Other expenses Total expenses Profit before tax Tax expense: Current tax Deferred tax Profit for the period Other comprehensive income Total comprehensive income for the period (Amount in Rs) For the year ended Note 775,629, ,545, ,025, ,629, ,570, ,509, ,745, ,020 6,169, ,998, ,309, ,958, ,224,477 60,670,987 68,346,079 29,830,740 64,016,288 2,700,380 (9,111,764) 28,139,867 13,441, ,139,867 13,441,555 See accompanying notes to the consolidated financial statements For Discoverture Solutions LLC By its sole member Mindtree Limited Authorised Signatory Place : Bangalore Date : April 20, 2017
3 Discoverture Solutions LLC Consolidated statement of cash flow Rs in million, except per share data For the year ended March Cash flow from operating activities Profit for the period 60,670,987 68,346,079 Adjustments for : Depreciation and amortization expense 451,020 6,169,638 Allowance for doubtful debt (18,940,922) 19,937,315 Changes in operating assets and liabilities Trade receivables 4,659,296 18,948,734 Loans Advances and Other assets 9,334,185 (6,733,908) Trade payables (65,566,457) 42,029,613 Other liabilities 35,384,183 5,898,740 Provisions 1,467,948 2,203,851 Net cash provided by operating activities before taxes 27,460, ,800,062 Income taxes paid (5,566,039) (6,214,389) Net cash (used in)/ provided by operating activities 21,894, ,585,673 Cash flow from investing activities Net cash (used in)/ provided by investing activities - - Cash flow from financing activities Change in Members Equity (80,882,754) (83,547,326) Net cash (used in)/ provided by financing activities (80,882,754) (83,547,326) Effect of exchange differences on translation of foreign currency cash and cash equivalents - 1,107 Net decrease in cash and cash equivalents (58,988,553) 67,039,454 Cash and cash equivalents at the beginning of the period 154,189,016 87,149,562 Cash and cash equivalents at the end of the period (Refer note 7.3) 95,200, ,189,016 95,200,463 See accompanying notes to the consolidated interim financials statements 0 For Discoverture Solutions LLC By its sole member Mindtree Limited Authorised Signatory Place : Bangalore Date : April 20, 2017
4 Discoverture Solutions LLC Consolidated statement of changes in equity for the year ended March 31, 2017 Members' equity Members' capital account Amount in Rs Balance as on April 1, ,955,014 Add: addition during the year (70,104,663) Balance as on March 31, ,850,351 Balance as on April 1, ,850,351 Add: addition during the year (52,742,887) Balance as on March 31, ,107,464 See accompanying notes to the consolidated financial statements 64,272,306 For Discoverture Solutions LLC By its sole member Mindtree Limited Authorised Signatory Place : Bangalore Date : April 20, 2017


5
6

7


8

9
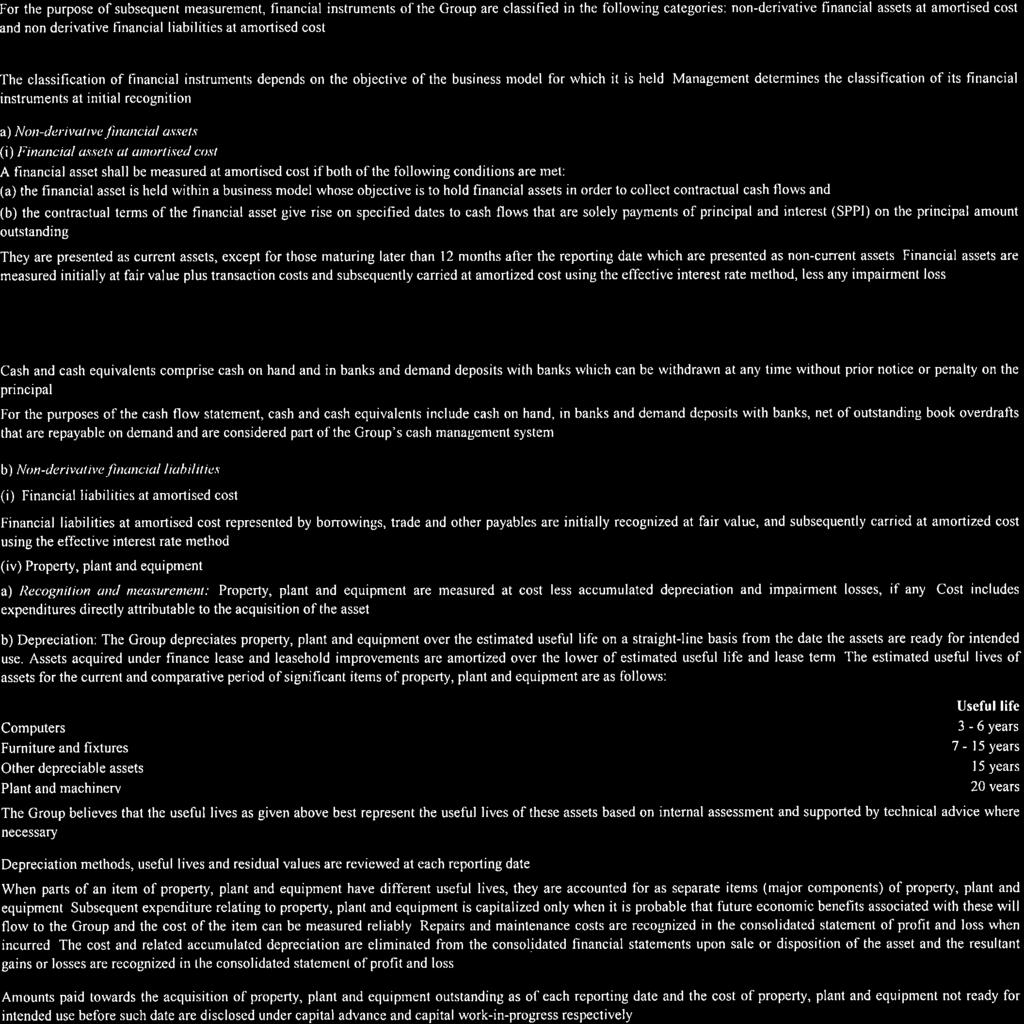
10 Discoverture Solutions LLC 3 Property, plant and equipment Gross carrying value Leasehold improvements Office equipment Computers Furniture and fixtures Total At April 1, ,099 3,273,732 9,669,169 4,086,858 17,402,858 Additions Disposals / adjustments At March 31, ,099 3,273,732 9,669,169 4,086,858 17,402,858 At April 1, ,099 3,273,732 9,669,169 4,086,858 17,402,858 Additions Disposals / adjustments At March 31, ,099 3,273,732 9,669,169 4,086,858 17,402,858 Accumulated depreciation At April 1, ,544 2,595,721 5,945,670 2,583,162 11,342,097 Depreciation expense 123, ,838 3,360,852 1,503,696 5,644,320 Disposals / adjustments At March 31, ,478 3,251,559 9,306,522 4,086,858 16,986,417 At April 1, ,478 3,251,559 9,306,522 4,086,858 16,986,417 Depreciation expense 31,621 22, , ,064 Disposals / adjustments At March 31, ,099 3,273,732 9,665,792 4,086,858 17,399,481 Net carrying value as at March 31, ,377-3,377 Net carrying value as at March 31, ,621 22, , ,441
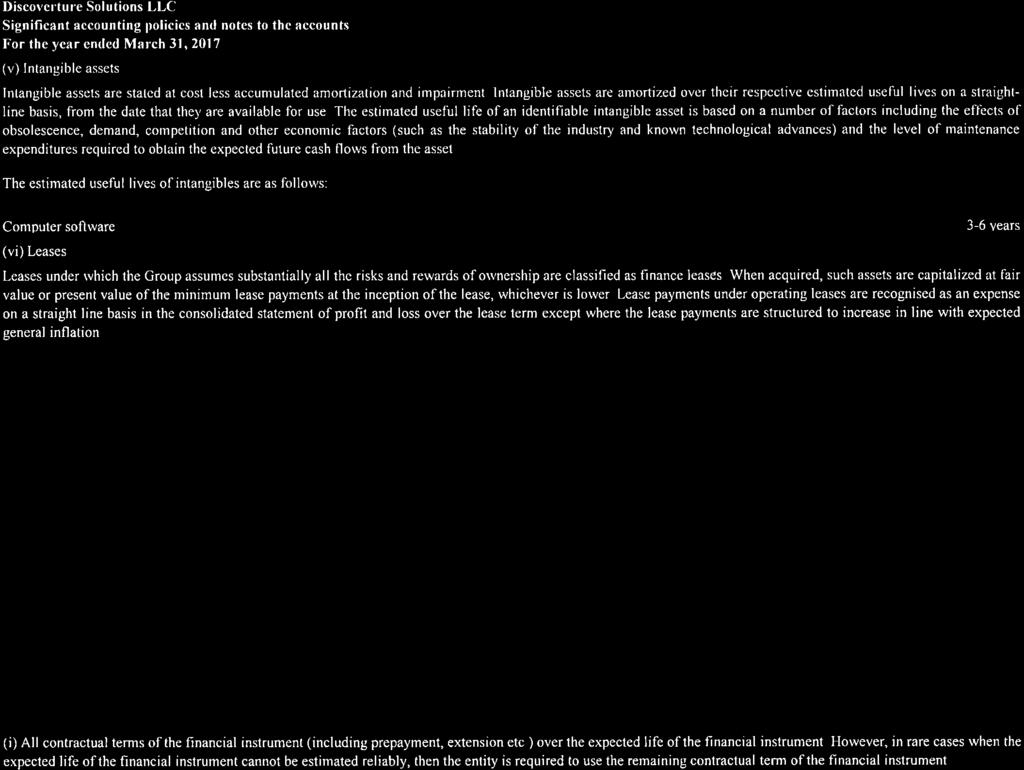
11 Discoverture Solutions L.L.C. 4 Intangible assets Computer software Gross carrying value At April 1, ,033,445 Additions - Translation adjustment - Disposals / adjustments - At March 31, ,033,445 At April 1, ,033,445 Additions - Translation adjustment - Disposals / adjustments - At March 31, ,033,445 Accumulated depreciation At April 1, ,470,172 Amortisation expense 525,317 Translation adjustment - Disposals / adjustments - At March 31, ,995,489 At April 1, ,995,489 Amortisation expense 37,956 Translation adjustment - Disposals / adjustments - At March 31, ,033,445 Net carrying value as at March 31, Net carrying value as at March 31, ,956
12 Discoverture Solutions L.L.C. Non-current assets 5 Financial assets 5.1 Loans As at As at (Unsecured, considered good) Security deposits 1,140,710 1,140,710 Total 1,140,710 1,140,710 6 Other non-current assets As at As at Advance income-tax 10,602,761 7,370,731 Others - 167,780 Total 10,602,761 7,538,511 Current assets 7 Financial assets 7.1 Trade receivables As at As at (Unsecured ) Considered good 162,078, ,797,009 Considered doubtful 3,281,623 22,222,544 Less: Allowance for doubtful debts (3,281,623) (22,222,544) Total 162,078, ,797,009 Movement in the expected credit loss allowance For the year ended Balance at the beginning of the year 22,222,544 2,285,229 Movement in expected credit loss allowance on trade receivables calculated at (18,940,922) 19,937,315 lifetime expected credit losses Provision at the end of the year 3,281,623 22,222, Cash and cash equivalents As at As at Balances with banks in current accounts and deposit accounts 95,200, ,189,016 Cash and cash equivalents 95,200, ,189, Other financial assets As at As at Unbilled revenue 648,500 9,862, ,500 9,862,919 8 Other current assets As at As at Prepaid expenses 3,335,906 3,428,825 Others 140,932 - Total 3,476,838 3,428,825
13 Discoverture Solutions L.L.C. Current liabilities 9 Financial liabilities 9.1 Other financial liabilities As at As at Employee benefits payable 64,047,582 24,661,771 Total 64,047,582 24,661, Other current liabilities As at As at Advance from customers 261,429 2,505,178 Others - 1,757,879 Total 261,429 4,263, Provisions As at As at Provision for discount 1,425,830 1,551,401 Provision for compensated absences 7,100,653 5,507,134 Total 8,526,483 7,058,535 Provision for discount Provision for discount are for volume discounts and pricing incentives to customers accounted for by reducing the amount of revenue recognized at the time of sale. For the year ended Balance at the beginning of the year 1,551,401 - Provisions made during the year - 1,551,401 Utilisations during the year (125,571) - Released during the year - - Provision at the end of the year 1,425,830 1,551,401
14 Discoverture Solutions L.L.C. 12 Other income For the year ended Foreign exchange gain/ (loss) - 15,460,319 Others - 15,565,049 Total - 31,025, Employee benefits expense For the year ended Salaries and wages 426,512, ,308,585 Contribution to provident and other funds 39,591,700 47,708,623 Staff welfare expenses 405,303 1,728,057 Total 466,509, ,745, Depreciation and amortization expense For the year ended Depreciation on property, plant and equipment (note 3) 413,064 5,644,320 Amortization of intangible assets (note 4) 37, ,317 Total 451,020 6,169, Other expenses For the year ended Travel expenses 15,368,151 34,178,515 Communication expenses 3,115,624 3,026,619 Sub-contractor charges 206,744, ,927,059 Computer consumables 55, ,934 Legal and professional charges 1,022,777 5,364,723 Foreign exchange loss, net 1,851,741 - Power and fuel - 97,406 Lease rentals 15,357,169 17,718,429 Repairs and maintenance - Machinery - 262,738 Insurance - 357,350 Rates and taxes 169,728 8,345 Other expenses 4,312,869 30,476,456 Total 247,998, ,309,575
15 Discoverture Solutions L.L.C. 16 Operating lease The Group has various operating leases, mainly for office buildings including land. Lease rental expense under such non-cancellable operating lease during the year ended March 31, 2017 amounted to Nil (for the year ended March 31, 2016 amounted to Rs 17,718,429) As at Payable Later than one year and not later than five years - 2,200,208 Payable Later than five years - - Additionally, the Group leases office facilities and residential facilities under cancellable operating leases. The rental expense under cancellable operating lease during the year ended March 31, 2017 amounted to Rs 15,357,169 (for the year ended March 31, 2016 amounted to Rs Nil).
16 Discoverture Solutions L.L.C. 17 Financial instruments The carrying value and fair value of financial instruments by categories as at March 31, 2017 and March 31, 2016 is as follows: Carrying value Financial assets March 31,2017 March 31,2016 Fair value March 31,2017 March 31,2016 Amortised cost Loans 1,140,710 1,140,710 1,140,710 1,140,710 Trade receivable 162,078, ,797, ,078, ,797,009 Cash and cash equivalents 95,200, ,189,016 95,200, ,189,016 Other financial assets 648,500 9,862, ,500 9,862,919 Total assets 259,068, ,989, ,068, ,989,654 Financial liabilities Amortised cost Trade payables 38,248, ,814,582 38,248, ,814,582 Other financial liabilities 64,047,582 24,661,771 64,047,582 24,661,771 Total liabilities 102,295, ,476, ,295, ,476,353 The management assessed that fair value of cash and short-term deposits, trade receivables, other current assets, trade payables, book overdrafts and other current liabilities approximate their carrying amounts largely due to the short-term maturities of these instruments. The fair value of the financial assets and liabilities is included at the amount at which the instrument could be exchanged in a current transaction between willing parties, other than in a forced or liquidation sale. The following methods and assumptions were used to estimate the fair values: i) Long-term fixed-rate and variable-rate receivables/borrowings are evaluated by the Group based on parameters such as interest rates, specific country risk factors, individual creditworthiness of the customer and the risk characteristics of the financed project. Based on this evaluation, allowances are taken into account for the expected losses of these receivables. ii) Fair values of the Group s interest-bearing loans are determined by using DCF method using discount rate that reflects the issuer s borrowing rate as at the end of the reporting period. The own non- performance risk as at March 31, 2017 was assessed to be insignificant.
17 Discoverture Solutions L.L.C. 18 Financial risk management The Group's activities expose it to a variety of financial risks: market risk, credit risk and liquidity risk. The Group's primary focus is to foresee the unpredictability of financial markets and seek to minimize potential adverse effects on its financial performance. The Board of Directors reviews and agrees policies for managing each of these risks, which are summarised below: Credit risk Credit risk is the risk of financial loss to the Group if a customer or counterparty to a financial instrument fails to meet its contractual obligations, and arises principally from the Group s receivables from customers and investment securities. Credit risk arises from cash held with banks and financial institutions, as well as credit exposure to clients, including outstanding accounts receivable. The maximum exposure to credit risk is equal to the carrying value of the financial assets. The objective of managing counterparty credit risk is to prevent losses in financial assets. The Group assesses the credit quality of the counterparties, taking into account their financial position, past experience and other factors. Trade and other receivables The Group s exposure to credit risk is influenced mainly by the individual characteristics of each customer. The demographics of the customer, including the default risk of the industry and country in which the customer operates, also has an influence on credit risk assessment. The following table gives details in respect of percentage of revenues generated from top customer and top 5 customers: For the year ended March 31,2017 March 31,2016 Revenue from top customer 160,019, ,359,681 Revenue from top 5 customers 647,938, ,064,551 Five customer accounted for more than 10% of the revenue for the year ended March 31, 2017, however five of the customers accounted for more than 10% of the receivables for the year ended March 31, Four customers accounted for more than 10% of the revenue for the year ended March 31, 2016, however two of the customers accounted for more than 10% of the receivables for the year ended March 31, Liquidity risk Liquidity risk is the risk that the Group will not be able to meet its financial obligations as they become due. The Group manages its liquidity risk by ensuring, as far as possible, that it will always have sufficient liquidity to meet its liabilities when due. Also, the Group has unutilized credit limits with banks. The Group s corporate treasury department is responsible for liquidity, funding as well as settlement management. In addition, processes and policies related to such risks are overseen by senior management. The working capital position of the Group is given below: As at As at March 31,2017 March 31, 2016 Cash and cash equivalents 95,200, ,189,016 Total 95,200, ,189,016 The table below provides details regarding the contractual maturities of significant financial liabilities as at March 31, 2017 and March 31, 2016: As at March 31, 2017 Less than 1 year 1-2 years 2 years and above Trade payables 38,248, Other financial liabilities 64,047, As at March 31, 2016 Less than 1 year 1-2 years 2 years and above Trade payables 103,814, Other financial liabilities 24,661, Interest rate risk Interest rate risk is the risk that the fair value or future cash flows of a financial instrument will fluctuate because of changes in market interest rates. The Group s exposure to the risk of changes in market interest rates relates primarily to the Group s debt obligations with floating interest rates and investments. The Group s borrowings and investments are primarily short-term, which do not expose it to significant interest rate risk.
18 Discoverture Solutions L.L.C. 19 Capital management The Group s policy is to maintain a strong capital base so as to maintain investor, creditor and market confidence and to sustain future development of the business. The Group monitors the return on capital as well as the level of dividends on its equity shares. The Group s objective when managing capital is to maintain an optimal structure so as to maximize shareholder value. The capital structure is as follows: As at As at March 31,2017 March 31, 2016 Total equity attributable to the equity share holders of the Group 64,107, ,850,351 As percentage of total capital 100% 100% Total capital (loans and borrowings and equity) 64,107, ,850,351 The Group's is equity financed which is evident from the capital structure table. Further, the Group has always been a net cash Group with cash and bank balances.
19 Discoverture Solutions L.L.C. 20 Related party transaction Name of related party Nature of relationship Mindtree Limited Holding Company Relational Solutions, Inc Fellow subsidiary with effect from July 16, 2015 Magnet 360, LLC Fellow subsidiary with effect from January 19, 2016 Reside, LLC Fellow subsidiary with effect from January 19, 2016 M360 Investments, LLC Fellow subsidiary with effect from January 19, 2016 Numerical Truth, LLC Fellow subsidiary with effect from January 19, 2016 Bluefin Solutions Limited Fellow subsidiary with effect from July 16, 2015 Bluefin Solutions Inc. Fellow subsidiary with effect from July 16, 2015 Bluefin Solutions Sdn Bhd Fellow subsidiary with effect from July 16, 2015 Blouvin (Pty) Limited Fellow subsidiary with effect from July 16, 2015 Bluefin Solutions Pte Ltd Fellow subsidiary with effect from July 16, 2015 Mindtree Software (Shanghai) Co., Ltd. Fellow subsidiary Transactions with the above related parties during the year were: Name of related party Nature of transaction For the year ended Mindtree Limited Software services rendered 159,841,998 92,205,037 Software services received 197,345, ,603,975 Dividend received 80,718,000 68,430,000 Balances payable to related parties are as follows: Name of related party Nature of balance As at As at Mindtree Limited Trade payables 33,793,603 98,000,000 Balances receivable from related parties are as follows: Name of related party Nature of balance As at As at Mindtree Limited Trade receivables 23,803,794 15,000,000 The amount outstanding are unsecured and will be settled in cash. No guarantee has been given or received.
20 Discoverture Solutions L.L.C. 21 Segment information The Group is engaged in providing services in BFSI Vertical and is considered to constitute a single segment in the context of primary segment reporting as prescribed by Ind AS Operating Segment. Geographical information For year ended March 31, Revenues America 772,592, ,165,578 Rest of world 3,037,402 6,379,610 Total 775,629, ,545,188 Note: Management believes that it is currently not practicable to provide disclosure of assets by geographical location, as meaningful segregation of the available information is onerous. Please refer to Note No. 18 on Financial Instruments for information on revenue from major customers. 22 Dues to micro, small and medium enterprises The Ministry of Micro, Small and Medium Enterprises has issued an office memorandum dated August 26, 2008 which recommends that the Micro and Small Enterprises should mention in their correspondence with its customers the Entrepreneurs Memorandum Number as allocated after filing of the Memorandum in accordance with the Micro, Small and Medium Enterprises Development Act, 2006 ( the Act ). Accordingly, the disclosure in respect of the amounts payable to such enterprises as at March 31, 2017 has been made in the financial statements based on information received and available with the Group. Further in view of the Management, the impact of interest, if any, that may be payable in accordance with the provisions of the Act is not expected to be material. The Group has not received any claim for interest from any supplier as at the balance sheet date. For the year ended The principal amount and the interest due thereon remaining unpaid to any supplier as at the end of accounting year; Nil Nil The amount of interest paid by the buyer under the Act along with the amounts of the payment made to the supplier beyond the appointed day during each accounting year; Nil Nil The amount of interest due and payable for the year (where the principal has been paid but interest under the Act not paid); Nil Nil The amount of interest accrued and remaining unpaid at the end of accounting year; and Nil Nil The amount of further interest due and payable even in the succeeding year, until such date when the interest dues as above are actually paid to the small enterprise, for the purpose of disallowance as a deductible expenditure under section 23. Nil Nil For Discoverture Solutions LLC By its sole member Mindtree Limited Authorised Signatory Place : Bangalore Date : April 20, 2017
Magnet 360, LLC Consolidated balance sheet Amount in Rs
 Consolidated balance sheet Amount in Rs Note As at As at ASSETS Non-current assets Property, plant and equipment 3 37,150,482 39,436,733 Goodwill 451,087,694 460,860,681 Other intangible assets 4 486,098
Mindtree Software (Shanghai) Co., Ltd ( MSSCL ) Balance Sheet (Amount in Rs) Note
 Co., Ltd ( MSSCL ) Balance Sheet (Amount in Rs) Note") Balance Sheet (Amount in Rs) Note As at As at ASSETS Non-current assets Financial assets 3 Loans 3.1 155,768 117,978 Other non-current assets 4 19,013 263,373 174,781 381,351 Current assets Financial assets
Balance Sheet (Amount in Rs) Note As at As at ASSETS Non-current assets Financial assets 3 Loans 3.1 155,768 117,978 Other non-current assets 4 19,013 263,373 174,781 381,351 Current assets Financial assets
Bluefin Solutions Limited Consolidated balance sheet (Amount in Rs)
") Consolidated balance sheet (Amount in Rs) Note As at As at ASSETS Non-current assets Property, plant and equipment 3 17,872,206 23,342,943 Intangible assets 4 1,008,818 2,252,525 Financial assets 5 Loans
Consolidated balance sheet (Amount in Rs) Note As at As at ASSETS Non-current assets Property, plant and equipment 3 17,872,206 23,342,943 Intangible assets 4 1,008,818 2,252,525 Financial assets 5 Loans
For Mindtree Software (Shanghai) Co., Ltd. Balance sheet
 Co., Ltd. Balance sheet") Balance sheet Note As at As at EQUITY AND LIABILITIES Shareholders' funds Share capital 3.1.1 13,592,500 13,592,500 Reserves and surplus 3.1.2 (3,135,078) (4,086,508) 10,457,422 9,505,992 Current liabilities
Balance sheet Note As at As at EQUITY AND LIABILITIES Shareholders' funds Share capital 3.1.1 13,592,500 13,592,500 Reserves and surplus 3.1.2 (3,135,078) (4,086,508) 10,457,422 9,505,992 Current liabilities
Discoverture Solutions LLC Consolidated Balance Sheet as at March 31, (Amount in Rs.) Note no. As at March 31, 2015
 Note no. As at March 31, 2015") Consolidated Balance Sheet as at March 31, 2015 A Particulars EQUITY AND LIABILITIES Note no. As at March 31, 2015 1 Shareholders funds Share capital 3.1.1 168,388,568 Reserves and surplus 3.1.2 18,566,445
Consolidated Balance Sheet as at March 31, 2015 A Particulars EQUITY AND LIABILITIES Note no. As at March 31, 2015 1 Shareholders funds Share capital 3.1.1 168,388,568 Reserves and surplus 3.1.2 18,566,445
Shareholder's funds Share capital 3 1,777,885,036 1,777,885,036 Reserves and surplus 4 (7,552,905,671) (309,099,121) (5,775,020,635) 1,468,785,915
 (309,099,121) (5,775,020,635) 1,468,785,915") WIPRO SOLUTIONS CANADA LIMITED (Formerly WIPRO TECHNOLOGIES CANADA LTD) Balance sheet (Amount in, except share and per share data, unless otherwise stated) EQUITY AND LIABILITIES As at As at Sch No. 31
WIPRO SOLUTIONS CANADA LIMITED (Formerly WIPRO TECHNOLOGIES CANADA LTD) Balance sheet (Amount in, except share and per share data, unless otherwise stated) EQUITY AND LIABILITIES As at As at Sch No. 31
WIPRO TECHNOLOGY CHILE SPA FINANCIAL STATEMENTS
 WIPRO TECHNOLOGY CHILE SPA FINANCIAL STATEMENTS AS OF AND FOR THE YEAR ENDED MARCH 31, 2016 WIPRO TECHNOLOGY CHILE SPA BALANCE SHEET AS AT MARCH 31,2016 (Amount in except share and per share data, unless
Wipro Technologies SRL
 BALANCE SHEET AS AT MARCH 31st, 2016 Wipro Technologies SRL ( Amt. in INR, Except Shares and per share Data, unless otherwise stated) As at As at Particulars Notes 31st March 2016 31st March 2015 A. EQUITY
WIPRO TECHNOLOGIES S.A DE C.V FINANCIAL STATEMENTS
 WIPRO TECHNOLOGIES S.A DE C.V FINANCIAL STATEMENTS AS OF AND FOR THE YEAR ENDED MARCH 31, 2016 WIPRO TECHNOLOGIES S.A DE C.V BALANCE SHEET AS AT MARCH 31, 2016 (Amount in except share and per share data,
Liabilities Loans and borrowings Other non-current liabilities Total non-current liabilities
 MINDTREE LIMITED AND SUBSIDIARIES CONDENSED CONSOLIDATED INTERIM STATEMENT OF FINANCIAL POSITION (Rupees in millions, except share data) As at As at Note December 31, 2015 March 31, 2015 (Unaudited) Assets
Our responsibility is to express an opinion on these financial statements based on our audit.
 INDEPENDENT AUDITOR S REPORT To the Board of Directors of Report on the Financial Statements We have audited the accompanying financial statements of (the Company), which comprises of the Balance Sheet
3. Our responsibility is to express an opinion on these financial statements based on our audit.
 Independent Auditor s Report To the Board of Directors of Wipro Technologies Peru SAC Report on the Financial Statements 1. We have audited the accompanying financial statements of Wipro Technologies Peru
Balance As at ASSETS 1. Non-Current Assets a Property, plant and equipment b Other Intangible assets
 Balance Sheet as at 31st March 2018 Note No Balance As at 31-03-2018 Balance As at 31-03-2017 Balance As at 01-04-2016 ASSETS 1. Non-Current Assets a Property, plant and equipment 2 5.86 7.48 6.75 b Other
WIPRO SHANGHAI LIMITED FINANCIAL STATEMENTS AS OF AND FOR THE YEAR ENDED MARCH 31, 2015
 WIPRO SHANGHAI LIMITED FINANCIAL STATEMENTS AS OF AND FOR THE YEAR ENDED MARCH 31, 2015 WIPRO SHANGHAI LIMITED BALANCE SHEET (Amount in ` except share and per share data, unless otherwise stated) As at
Liabilities Loans and borrowings Other non-current liabilities Total non-current liabilities
 MINDTREE LIMITED AND SUBSIDIARIES CONSOLIDATED STATEMENT OF FINANCIAL POSITION (Rupees in millions, except share data) As at As at Note March 31, 2016 March 31, 2015 Assets Goodwill 5b, 24, 25,26 & 27
Harrington Health Services, Inc. FINANCIAL STATEMENTS AS OF AND FOR THE YEAR ENDED MARCH 31, 2016
 Harrington Health Services, Inc. FINANCIAL STATEMENTS AS OF AND FOR THE YEAR ENDED MARCH 31, Bangalore May 31, HARRINGTON HEALTH SERVICES INC. BALANACE SHEET AS AT 31ST MARCH (Amount in Rs, except share
Share application money pending allotment (g) - 4
 - 4") Consolidated balance sheet Rs in million Note As at As at March 31, 2016 March 31, 2015 EQUITY AND LIABILITIES Shareholders' funds Share capital 3.1.1 1,678 837 Reserves and surplus 3.1.2 22,278 19,287
Consolidated balance sheet Rs in million Note As at As at March 31, 2016 March 31, 2015 EQUITY AND LIABILITIES Shareholders' funds Share capital 3.1.1 1,678 837 Reserves and surplus 3.1.2 22,278 19,287
As at September 30, Note
 Consolidated balance sheet ASSETS Note As at September 30, 2016 As at March 31, 2016 Rs in million As at April 1, 2015 Non-current assets Property, plant and equipment 3 3,947 4,173 4,325 Capital work
WIPRO GALLAGHER SOLUTIONS INC
 WIPRO GALLAGHER SOLUTIONS INC FINANCIAL STATEMENTS AS OF AND FOR THE YEAR ENDED MARCH 31, 2016 WIPRO GALLAGHER SOLUTIONS INC. BALANCE SHEET (Amount in, e xcept share and per share data, unless otherwise
Liabilities Loans and borrowings Other non-current liabilities Total non-current liabilities
 MINDTREE LIMITED AND SUBSIDIARIES CONSOLIDATED INTERIM STATEMENT OF FINANCIAL POSITION (Rupees in millions, except share data) As at As at Note June 30, 2016 March 31, 2016 Assets Goodwill 5b, 24, 25,26
WIPRO UK LIMITED (Formerly SAIC UK Limited) BALANCE SHEET (` in `, except share and per share data, unless otherwise stated) Notes
 BALANCE SHEET (` in `, except share and per share data, unless otherwise stated) Notes") WIPRO UK LIMITED (Formerly SAIC UK Limited) BALANCE SHEET (` in `, except share and per share data, unless otherwise stated) Notes As on Mar 31, 2015 Mar 31, 2014 EQUITY AND LIABILITIES Shareholder's funds
WIPRO UK LIMITED (Formerly SAIC UK Limited) BALANCE SHEET (` in `, except share and per share data, unless otherwise stated) Notes As on Mar 31, 2015 Mar 31, 2014 EQUITY AND LIABILITIES Shareholder's funds
WIPRO DO BRASIL TECNOLOGIA LTDA (Formely Enabler Brasil Ltda) FINANCIAL STATEMENTS
 FINANCIAL STATEMENTS") WIPRO DO BRASIL TECNOLOGIA LTDA (Formely Enabler Brasil Ltda) FINANCIAL STATEMENTS AS OF AND FOR THE YEAR ENDED MARCH 31, 2016 WIPRO DO BRASIL TECNOLOGIA LTDA (Formely Enabler Brasil Ltda) BALANCE SHEET
WIPRO DO BRASIL TECNOLOGIA LTDA (Formely Enabler Brasil Ltda) FINANCIAL STATEMENTS AS OF AND FOR THE YEAR ENDED MARCH 31, 2016 WIPRO DO BRASIL TECNOLOGIA LTDA (Formely Enabler Brasil Ltda) BALANCE SHEET
Financial Statements and Independent Auditor's Report. Wipro Technologies Australia Pty Limited. 31 March 2016
 Financial Statements and Independent Auditor's Report Wipro Technologies Australia Pty Limited 31 March 2016 Contents Page Independent Auditor's Report Balance Sheet 1 Statement of Profit and Loss 2 Cash
Liabilities Loans and borrowings Other non-current liabilities Total non-current liabilities
 MINDTREE LIMITED AND SUBSIDIARIES CONSOLIDATED INTERIM STATEMENT OF FINANCIAL POSITION (Rupees in millions, except share data) As at As at Note June 30, 2017 March 31, 2017 Assets Goodwill 5b 4,525 4,470
WIPRO TECHNOLOGIES SA FINANCIAL STATEMENTS
 WIPRO TECHNOLOGIES SA FINANCIAL STATEMENTS AS OF AND FOR THE YEAR ENDED MARCH 31, 2015 WIPRO TECHNOLOGIES SA BALANCE SHEET AS AT MARCH 31,2015 (Amount in except share and per share data, unless otherwise
WIPRO TECHNOLOGIES S.A DE C.V FINANCIAL STATEMENTS
 WIPRO TECHNOLOGIES S.A DE C.V FINANCIAL STATEMENTS AS OF AND FOR THE YEAR ENDED MARCH 31, 2015 WIPRO TECHNOLOGIES S.A DE C.V BALANCE SHEET AS AT MARCH 31,2015 (Amount in except share and per share data,
3. Our responsibility is to express an opinion on these financial statements based on our audit.
 Independent Auditor s Report To the Board of s of Wipro Promax Analytics Solutions LLC Report on the Financial Statements 1. We have audited the accompanying financial statements of Wipro Promax Analytics
Financial Statements and Independent Auditor's Report WIPRO (THAILAND) CO LIMITED. 31 March 2016
 CO LIMITED. 31 March 2016") Financial Statements and Independent Auditor's Report WIPRO (THAILAND) CO LIMITED 31 March 2016 Contents Page Independent Auditor's Report Balance Sheet 1 Statement of Profit and Loss 2 Cash Flow Statement
Financial Statements and Independent Auditor's Report WIPRO (THAILAND) CO LIMITED 31 March 2016 Contents Page Independent Auditor's Report Balance Sheet 1 Statement of Profit and Loss 2 Cash Flow Statement
Tejas Networks Limited (All amounts in Rupees Crore except for share data or as otherwise stated) Standalone Balance Sheet as at
 Standalone Balance Sheet as at") Standalone Balance Sheet as at Notes March 31, ASSETS Non-current assets Property, plant and equipment 4(a) 29.14 35.98 Intangible assets 4(b) 46.62 38.75 Intangible assets under development 4(b) 56.29
Standalone Balance Sheet as at Notes March 31, ASSETS Non-current assets Property, plant and equipment 4(a) 29.14 35.98 Intangible assets 4(b) 46.62 38.75 Intangible assets under development 4(b) 56.29
IIPL USA LLC FINANCIAL STATEMENTS
 FINANCIAL STATEMENTS - - (1) 0 - Balance sheet as at March Notes As at As at As at March March 31, April 1, 2015 ASSETS Non-current Assets (a) Property, plant and equipment 4 21,848,458 - - (b) Intangible
Auditor s Responsibility Our responsibility is to express an opinion on these standalone Ind AS financial statements based on our audit.
 Independent Auditor s Report To the Board of Directors of Wipro Limited Report on the Standalone Ind AS Financial Statements At the request of Wipro Limited, the Ultimate Holding Company of Wipro Data
Liabilities Loans and borrowings Other non-current liabilities Total non-current liabilities
 MINDTREE LIMITED AND SUBSIDIARIES CONSOLIDATED INTERIM STATEMENT OF FINANCIAL POSITION (Rupees in millions, except share data) As at As at Note December 31, 2017 March 31, 2017 Assets Goodwill 5b 4,505
Tejas Networks Limited (All amounts in Rupees Crore except for share data or as otherwise stated) Standalone Balance Sheet as at
 Standalone Balance Sheet as at") Standalone Balance Sheet as at Notes ASSETS Non-current assets Property, plant and equipment 4(a) 30.80 35.98 Intangible assets 4(b) 46.82 38.75 Intangible assets under development 4(b) 46.88 46.85 Investments
Standalone Balance Sheet as at Notes ASSETS Non-current assets Property, plant and equipment 4(a) 30.80 35.98 Intangible assets 4(b) 46.82 38.75 Intangible assets under development 4(b) 46.88 46.85 Investments
3. Our responsibility is to express an opinion on these financial statements based on our audit.
 Independent Auditor s Report To the Board of Directors of Wipro do Brasil Technologia Ltda Report on the Financial Statements 1. We have audited the accompanying financial statements of Wipro do Brasil
Share application money pending allotment (g) 4 4
 4 4") Balance sheet Rs in million Note As at As at September 30, 2015 March 31, 2015 EQUITY AND LIABILITIES Shareholders' funds Share capital 3.1.1 838 837 Reserves and surplus 3.1.2 21,440 19,271 22,278 20,108
Balance sheet Rs in million Note As at As at September 30, 2015 March 31, 2015 EQUITY AND LIABILITIES Shareholders' funds Share capital 3.1.1 838 837 Reserves and surplus 3.1.2 21,440 19,271 22,278 20,108
WIPRO TECHNOLOGIES SOUTH AFRICA PROPREITARY PVT LTD FINANCIAL STATEMENTS AS OF AND FOR THE YEAR ENDED MARCH 31, 2015
 WIPRO TECHNOLOGIES SOUTH AFRICA PROPREITARY PVT LTD FINANCIAL STATEMENTS AS OF AND FOR THE YEAR ENDED MARCH 31, 2015 1 WIPRO TECHNOLOGIES SOUTH AFRICA PROPRIETARY LIMITED BALANCE SHEET (Amount in ` except
To the Board of Directors of Wipro Information Technology Kazakhstan LLP
 Independent Auditor s Report To the Board of Directors of Wipro Information Technology Kazakhstan LLP Report on the Financial Statements 1. We have audited the accompanying financial statements of Wipro
Financial assets Other financial assets 7 12,445 12,445 Deferred tax assets (net) 17 57,701-2,343,156 1,094,063
 17 57,701-2,343,156 1,094,063") eclerx LLC Balance Sheet as at Notes Amount in USD Amount in USD Assets Non-current assets Property, plant and equipment 3 1,026,609 685,984 Capital work in progress 3 11,907 113,074 Intangible assets
eclerx LLC Balance Sheet as at Notes Amount in USD Amount in USD Assets Non-current assets Property, plant and equipment 3 1,026,609 685,984 Capital work in progress 3 11,907 113,074 Intangible assets
WIPRO PROMAX ANALYTICS SOLUTIONS LLC FINANCIAL STATEMENTS AS OF AND FOR THE YEAR ENDED MARCH 31, 2015
 WIPRO PROMAX ANALYTICS SOLUTIONS LLC FINANCIAL STATEMENTS AS OF AND FOR THE YEAR ENDED MARCH 31, 2015 1 WIPRO PROMAX ANALYTICS SOLUTIONS LLC BALANCE SHEET (Amount in ` except share and per share data,
1, , Total liabilities Total equity and liabilities 1, ,329.77
 Consolidated Balance Sheet Notes ASSETS Non-current assets Property, plant and equipment 4(a) 30.80 35.98 Intangible assets 4(b) 46.82 38.75 Intangible assets under development 4(b) 46.88 46.85 Financial
Gener8 Digital Media Services Limited
 Balance sheet In CAD Notes As at March 31, Assets Non-current assets Property, plant and equipment 3 333,087 116,003 115,296 Capital work-in progress 1,070 - - Intangible assets 4 12,323,814 9,204,348
Financial Statements and Independent Auditor's Report WIPRO TECHNOLOGIES SOUTH AFRICA PROPRIETARY LIMITED. 31 March 2016
 Financial Statements and Independent Auditor's Report WIPRO TECHNOLOGIES SOUTH AFRICA PROPRIETARY LIMITED 31 March 2016 Contents Page Independent Auditor's Report Balance Sheet 1 Statement of Profit and
TOTAL 287,564, ,726, ,957,426
 CONDENSED BALANCE SHEET AS AT JUNE 30, 2016 Notes As at As at As at ASSETS Non-current assets Property, Plant and Equipment 5.1 12,267,982 22,170,178 14,393,710 Intangible assets 5.2 66,977 208,187 89,117
WIPRO NETWORKS PTE LIMITED FINANCIAL STATEMENTS AS OF AND FOR THE YEAR ENDED MARCH 31, 2015
 WIPRO NETWORKS PTE LIMITED FINANCIAL STATEMENTS AS OF AND FOR THE YEAR ENDED MARCH 31, 2015 1 WIPRO NETWORKS PTE LIMITED BALANCE SHEET (Amount in ` except share and per share data, unless otherwise stated)
Arrow Pharma Pte Limited BALANCE SHEET AS AT Mar 31, 2016
 BALANCE SHEET AS AT Mar 31, 2016 Schedule Mar16 A. EQUITY AND LIABILITIES 1. Shareholders' funds a) Share capital 1 72,625 b) Reserves and Surplus 2 (360,205) (287,580) 2. Share application money pending
NOTES FORMING PART OF THE FINANCIAL STATEMENTS 1. CORPORATE INFORMATION. 2. BASIS OF PREPARATION AND PRESENTATION 2.1 Statement of compliance
 103 1. CORPORATE INFORMATION company domiciled and incorporated under the provisions of the Companies Act, 1956. The Company is engaged in the manufacturing and selling of motorised 2. BASIS OF PREPARATION
Cardinal Energy and Infrastructure Private Limited Balance Sheet as at March 31, 2018
 Balance Sheet as at March 31, 2018 Note No. (` In lacs) As at As at As at ASSETS A Non Current Assets a Property, Plant and Equipment 2 2,610.48 2,606.14 2,310.87 b Capital Work in Progress 804.89 783.51
INFOSYS TECHNOLOGIES LIMITED in Rs. crore Balance Sheet as at Schedule September 30, 2004 September 30, 2003 March 31, 2004
 Balance Sheet as at Schedule September 30, 2004 September 30, 2003 March 31, 2004 SOURCES OF FUNDS SHAREHOLDERS' FUNDS Share capital 1 133.93 33.13 33.32 Reserves and surplus 2 3,937.53 3,302.48 3,220.11
Share application money pending allotment (g) - 4
 - 4") Balance sheet Rs in million Note As at As at December 31, 2015 March 31, 2015 EQUITY AND LIABILITIES Shareholders' funds Share capital 3.1.1 839 837 Reserves and surplus 3.1.2 22,514 19,271 23,353 20,108
Balance sheet Rs in million Note As at As at December 31, 2015 March 31, 2015 EQUITY AND LIABILITIES Shareholders' funds Share capital 3.1.1 839 837 Reserves and surplus 3.1.2 22,514 19,271 23,353 20,108
Manappuram Finance Limited (formerly Manappuram General Finance and Leasing Limited)
") Balance Sheet as at September 30, 2011 Schedule SOURCES OF FUNDS Shareholders' funds Share capital 1 1,667.50 833.75 Share application money pending allotment 111.03 - Reserves and surplus 2 20,003.34
Balance Sheet as at September 30, 2011 Schedule SOURCES OF FUNDS Shareholders' funds Share capital 1 1,667.50 833.75 Share application money pending allotment 111.03 - Reserves and surplus 2 20,003.34
Sd/- For, Swamy & Ravi Chartered Accountants Firm Registration number : S. Sd/- Bangalore. Balance sheet (Rs) As of March 31, As of March 31,
 As of March 31, As of March 31,") Balance sheet SOURCES OF FUNDS As of As of Schedule 2010 2009 SHAREHOLDERS' FUNDS Share capital 1 415,890 415,890 Reserves and surplus 2 92,454,314 263,794,025 92,870,204 264,209,915 APPLICATION OF FUNDS
Balance sheet SOURCES OF FUNDS As of As of Schedule 2010 2009 SHAREHOLDERS' FUNDS Share capital 1 415,890 415,890 Reserves and surplus 2 92,454,314 263,794,025 92,870,204 264,209,915 APPLICATION OF FUNDS
As at March 31, SOURCES OF FUNDS Shareholders' funds Share capital Reserves and surplus 2 7,364 6,065 7,764 6,460
 Balance sheet Schedule As at March 31, SOURCES OF FUNDS Shareholders' funds Share capital 1 400 395 Reserves and surplus 2 7,364 6,065 7,764 6,460 Loan funds Unsecured loans 3 46 31 7,810 6,491 APPLICATION
ANNUAL REPORT OF TATA TECHNOLOGIES INC, USA
 ANNUAL REPORT OF TATA TECHNOLOGIES INC, USA TATA TECHNOLOGIES INC, USA Directors of the Company 1 Significant Accounting Policies 2-4 Financial Statements and notes forming part of financials 5-15 Directors
INFOSYS TECHNOLOGIES LIMITED in Rs. crore Balance Sheet as at Schedule March 31, 2009 March 31, 2008
 in Rs. crore Balance Sheet as at Schedule 2009 2008 SOURCES OF FUNDS SHAREHOLDERS' FUNDS Share capital 1 286 286 Reserves and surplus 2 17,523 13,204 17,809 13,490 APPLICATION OF FUNDS FIXED ASSETS 3 Original
As at March 31, SOURCES OF FUNDS Shareholders' funds Share capital Reserves and surplus 2 7,362 6,311 7,762 6,706
 Consolidated balance sheet Schedule As at March 31, SOURCES OF FUNDS Shareholders' funds Share capital 1 400 395 Reserves and surplus 2 7,362 6,311 7,762 6,706 Loan funds Unsecured loans 3 46 31 7,808
Firstsource-Dialog Solutions (Private) Limited
 Limited") Special Purpose Financial Statements together with the Independent Auditors Report Special Purpose Financial Statements together with the Independent Auditors Report Contents Independent auditors report
Special Purpose Financial Statements together with the Independent Auditors Report Special Purpose Financial Statements together with the Independent Auditors Report Contents Independent auditors report
SOURCES OF FUNDS SHAREHOLDERS' FUNDS Share capital Reserves and surplus 2 6,323 5,090 6,459 5,225 MINORITY INTEREST 52 -
 Consolidated Balance Sheet as at Schedule September 30, 2005 March 31, 2005 SOURCES OF FUNDS SHAREHOLDERS' FUNDS Share capital 1 136 135 Reserves and surplus 2 6,323 5,090 6,459 5,225 MINORITY INTEREST
Financial Statements and Independent Auditor's Report PT WT INDONESIA LIMITED. 31 March 2016
 Financial Statements and Independent Auditor's Report PT WT INDONESIA LIMITED 31 March 2016 Contents Page Independent Auditor's Report Balance Sheet 1 Statement of Profit and Loss 2 Cash Flow Statement
Oracle Financial Services Software Pte ltd. Directors Report
 Oracle Financial Services Software Pte ltd. Directors Report To the Members, Your Directors are pleased to present Annual Report on the business and operations of your company, together with the accounts
Share application money pending allotment (g) - 4
 - 4") Balance sheet Rs in million Note As at As at EQUITY AND LIABILITIES Shareholders' funds Share capital 3.1.1 838 837 Reserves and surplus 3.1.2 20,362 19,271 21,200 20,108 Share application money pending
Balance sheet Rs in million Note As at As at EQUITY AND LIABILITIES Shareholders' funds Share capital 3.1.1 838 837 Reserves and surplus 3.1.2 20,362 19,271 21,200 20,108 Share application money pending
MINORITY INTEREST PREFERENCE SHARES ISSUED BY SUBSIDIARY* , , ,318.76
 Consolidated Balance Sheet as at Schedule SOURCES OF FUNDS SHAREHOLDERS' FUNDS Share capital 1 135.71 33.43 135.29 Reserves and surplus 2 5,770.84 3,685.95 5,089.82 5,906.55 3,719.38 5,225.11 MINORITY
CAMBRIDGE SOLUTIONS PTE LTD
 BALANCE SHEET AS AT DECEMBER 31, 2010 SOURCES OF FUNDS Notes 2010 2010 2009 2009 SGD INR SGD INR Shareholders' Funds Share capital 3 2,300,000 81,128,820 2,300,000 76,740,880 Reserves and surplus 4 759,691
INDEPENDENT AUDITOR S REPORT TO THE BOARD OF DIRECTORS OF HEXAWARE TECHNOLOGIES LIMITED
 INDEPENDENT AUDITOR S REPORT TO THE BOARD OF DIRECTORS OF HEXAWARE TECHNOLOGIES LIMITED Report on the Condensed Interim Standalone Ind AS Financial Statements We have audited the accompanying condensed
Oracle Financial Services Software Inc. Directors Report. FINANCIAL PERFORMANCE (Amount in Rs. million)
") Directors Report To the Members, Your Directors are pleased to present the Annual Report on the business and operations of your Company, together with the accounts for the year ended March 31, 2013 FINANCIAL
Directors Report To the Members, Your Directors are pleased to present the Annual Report on the business and operations of your Company, together with the accounts for the year ended March 31, 2013 FINANCIAL
WIPRO DO BRASIL TECHNOLOGIA LTDA (Formely Enabler Brasil LTDA) FINANCIAL STATEMENTS
 FINANCIAL STATEMENTS") WIPRO DO BRASIL TECHNOLOGIA LTDA (Formely Enabler Brasil LTDA) FINANCIAL STATEMENTS AS OF AND FOR THE YEAR ENDED DECEMBER 31, 2014 WIPRO DO BRASIL TECHNOLOGIA LTDA (Forme ly Enable r Brasil LTDA) FINANCIAL
WIPRO DO BRASIL TECHNOLOGIA LTDA (Formely Enabler Brasil LTDA) FINANCIAL STATEMENTS AS OF AND FOR THE YEAR ENDED DECEMBER 31, 2014 WIPRO DO BRASIL TECHNOLOGIA LTDA (Forme ly Enable r Brasil LTDA) FINANCIAL
DEFERRED TAX LIABILITIES MINORITY INTEREST ,281 18,291
 in Rs. crore Consolidated Balance Sheet as at Schedule 2010 2009 SOURCES OF FUNDS SHAREHOLDERS' FUNDS Share capital 1 286 286 Reserves and surplus 2 22,763 17,968 23,049 18,254 DEFERRED TAX LIABILITIES
INFOSYS TECHNOLOGIES LIMITED in Rs. crore Balance Sheet as at Schedule March 31, 2006 March 31, 2005
 Balance Sheet as at Schedule March 31, 2006 March 31, 2005 SOURCES OF FUNDS SHAREHOLDERS' FUNDS Share capital 1 138 135 Reserves and surplus 2 6,759 5,107 6,897 5,242 APPLICATION OF FUNDS FIXED ASSETS
WIPRO TECHNOLOGIES NORWAY AS FINANCIAL STATEMENTS AS OF AND FOR THE YEAR ENDED MARCH 31, 2015
 WIPRO TECHNOLOGIES NORWAY AS FINANCIAL STATEMENTS AS OF AND FOR THE YEAR ENDED MARCH 31, 2015 WIPRO TECHNOLOGIES NORWAY AS BALANCE SHEET (Amount in ` except share and per share data, unless otherwise stated)
We believe that the audit evidence we have obtained is sufficient and appropriate to provide a basis for our opinion.
 Independent Auditor s Report To the Shareholder Messrs. Wendt Middle East FZE P.O. Box 50732 Hamriyah Free Zone, Sharjah, United Arab Emirates Our Ref: JV-86/13 Report on the financial statements We have
1. Basis of Presenting the Consolidated Financial Statements
 1. Basis of Presenting the Consolidated Financial Statements The accompanying consolidated financial statements of THE NIPPON ROAD CO., LTD. (the Company ) and its consolidated subsidiaries (hereinafter
3i Infotech Trusteeship Services Limited Balance Sheet as at March 31, 2015 (Amount in `) Note No.
 Note No.") 3i Infotech Trusteeship Services Limited Balance Sheet as at Note No. EQUITY AND LIABILITIES Shareholders funds Share capital 2 5,56,97,620 5,56,97,620 Reserves and surplus 3 (2,26,66,109) (2,52,13,499)
3i Infotech Trusteeship Services Limited Balance Sheet as at Note No. EQUITY AND LIABILITIES Shareholders funds Share capital 2 5,56,97,620 5,56,97,620 Reserves and surplus 3 (2,26,66,109) (2,52,13,499)
JETCON CORPORATION LIMITED FINANCIAL STATEMENTS YEAR ENDED DECEMBER 31, 2017
 FINANCIAL STATEMENTS FINANCIAL STATEMENTS CONTENTS Page Independent Auditors' Report to Members 1 Statement of Profit or Loss and Other Comprehensive Income 2 Statement of Financial Position 3 Statement
Oracle Financial Services Software (Shanghai) Limited. Directors Report. FINANCIAL PERFORMANCE (Rs. in lacs) Particulars
 Limited. Directors Report. FINANCIAL PERFORMANCE (Rs. in lacs) Particulars") To the Members, Directors Report Your Directors are pleased to present Annual Report on the business and operations of your company, together with the accounts for the year ended March 31, 2011. FINANCIAL
To the Members, Directors Report Your Directors are pleased to present Annual Report on the business and operations of your company, together with the accounts for the year ended March 31, 2011. FINANCIAL
INFOSYS TECHNOLOGIES LIMITED in Rs. crore Balance Sheet as at Schedule December 31, 2007 March 31, 2007
 in Rs. crore Balance Sheet as at Schedule 2007 March 31, 2007 SOURCES OF FUNDS SHAREHOLDERS' FUNDS Share capital 1 286 286 Reserves and surplus 2 13,788 10,876 14,074 11,162 APPLICATION OF FUNDS FIXED
3. Our responsibility is to express an opinion on these financial statements based on our audit.
 Independent Auditor s Report To the Board of s of Wipro Information Technology Egypt SAE Report on the Financial Statements 1. We have audited the accompanying financial statements of Wipro Information
CELLENT AG AUSTRIA STANDALONE FINANCIAL STATEMENTS AS OF AND FOR THE YEAR ENDED MARCH 31, 2016
 CELLENT AG AUSTRIA STANDALONE FINANCIAL STATEMENTS AS OF AND FOR THE YEAR ENDED MARCH 31, 2016 1 CELLENT AG AUSTRIA BALANCE SHEET AS AT MARCH 31, 2016 (Amount in INR, except share and per share data, unless
INFOSYS TECHNOLOGIES LIMITED in Rs. crore Balance Sheet as at Schedule September 30, 2008 March 31, 2008
 in Rs. crore Balance Sheet as at Schedule 2008 March 31, 2008 SOURCES OF FUNDS SHAREHOLDERS' FUNDS Share capital 1 286 286 Reserves and surplus 2 15,224 13,204 15,510 13,490 APPLICATION OF FUNDS FIXED
Share application money pending allotment (g) - 4
 - 4") Consolidated balance sheet Rs in million Note As at As at EQUITY AND LIABILITIES Shareholders' funds Share capital 3.1.1 838 837 Reserves and surplus 3.1.2 20,390 19,287 21,228 20,124 Share application
Consolidated balance sheet Rs in million Note As at As at EQUITY AND LIABILITIES Shareholders' funds Share capital 3.1.1 838 837 Reserves and surplus 3.1.2 20,390 19,287 21,228 20,124 Share application
Net Current Assets (62,748,149) (2,858,178,175) (90,126,095) (4,225,111,319)
 (2,858,178,175) (90,126,095) (4,225,111,319)") Balance Sheet as at December 31, 2010 SOURCES OF FUNDS Schedule 2010 2010 2009 2009 (Amount in USD) (Amount in INR) (Amount in USD) (Amount in INR) Shareholders' Funds Share capital A 28 1,275 28 1,313
Balance Sheet as at December 31, 2010 SOURCES OF FUNDS Schedule 2010 2010 2009 2009 (Amount in USD) (Amount in INR) (Amount in USD) (Amount in INR) Shareholders' Funds Share capital A 28 1,275 28 1,313
FINANCIAL STATEMENTS OF UAA (M) SDN BHD BALANCE SHEET. As of Schedule 31 March March As of SOURCES OF FUNDS
 SDN BHD BALANCE SHEET. As of Schedule 31 March March As of SOURCES OF FUNDS") BALANCE SHEET SOURCES OF FUNDS Schedule 31 March 2010 31 March 2009 SHAREHOLDERS' FUNDS Share capital 1 2,426,058 2,426,058 Reserves and surplus 2 246,761,737 222,262,909 249,187,795 224,688,967 APPLICATION
BALANCE SHEET SOURCES OF FUNDS Schedule 31 March 2010 31 March 2009 SHAREHOLDERS' FUNDS Share capital 1 2,426,058 2,426,058 Reserves and surplus 2 246,761,737 222,262,909 249,187,795 224,688,967 APPLICATION
INFOSYS TECHNOLOGIES LIMITED in Rs. crore Balance Sheet as at Schedule December 31, 2008 March 31, 2008
 in Rs. crore Balance Sheet as at Schedule 2008 March 31, 2008 SOURCES OF FUNDS SHAREHOLDERS' FUNDS Share capital 1 286 286 Reserves and surplus 2 16,832 13,204 17,118 13,490 APPLICATION OF FUNDS FIXED
Total Non-Current Assets 11,052,694 7,819,990
 Balance Sheet as at Notes As at As at ASSETS Non-current Assets Property Plant and Equipment ('PPE') 3 6,074,314 2,513,990 Financial Assets (i) Other Financial Assets 4 4,978,380 4,386,000 Other Non-current
International Equities Corporation Ltd
 International Equities Corporation Ltd and Controlled Entities ABN 97 009 089 696 PRELIMINARY FINAL REPORT FOR YEAR ENDED 30 JUNE 2009 APPENDIX 4E APPENDIX 4E PRELIMINARY FINAL REPORT FOR YEAR ENDED 30
Independent Auditor s Report To the Board of Directors of Biocon Limited
 Independent Auditor s Report To the Board of Directors of Biocon Limited Report on the audit of standalone Special purpose Ind AS financial statements of Biocon SA ( the Company ) We have audited the accompanying
Liabilities Loans and borrowings Other non-current liabilities Total non-current liabilities
 MINDTREE LIMITED AND SUBSIDIARIES CONSOLIDATED INTERIM STATEMENT OF FINANCIAL POSITION (Rupees in millions, except share data) As at As at Note December 31, 2018 March 31, 2018 Assets Goodwill 5b 4,732
DAX Cloud ULC. Standalone Financial Statement for the Year ended
 Standalone Financial Statement for the Year ended March 31, 2018 Balance Sheet as on 31.03.2018 Particulars Notes 31.Mar.18 31.Mar.17 Assets 1. Non-current assets (a) Property, plant and equipment - -
As at March 31, 2017 Balance Sheet as at March 31, 2018 Note No. Rs. Lakhs Rs. Lakhs Rs. Lakhs
 As at March 31, 2018 As at March 31, 2017 Balance Sheet as at March 31, 2018 Note No. Rs. Lakhs Rs. Lakhs Rs. Lakhs Particulars ASSETS Non-current assets Property, plant and equipment 1.1 162.81 42.76
SENAO NETWORKS, INC. AND SUBSIDIARIES
 SENAO NETWORKS, INC. AND SUBSIDIARIES CONSOLIDATED FINANCIAL STATEMENTS AND REVIEW REPORT OF INDEPENDENT ACCOUNTANTS SEPTEMBER 30, 2015 AND 2014 ------------------------------------------------------------------------------------------------------------------------------------
Liabilities Loans and borrowings Other non-current liabilities Total non-current liabilities
 MINDTREE LIMITED AND SUBSIDIARIES CONSOLIDATED STATEMENT OF FINANCIAL POSITION (Rupees in millions, except share data) As at As at Note March 31, 2018 March 31, 2017 Assets Goodwill 5b 4,539 4,470 Property,
INFOSYS TECHNOLOGIES LIMITED in Rs. crore Balance Sheet as at March 31, Schedule
 in Rs. crore Balance Sheet as at March 31, Schedule 2010 2009 SOURCES OF FUNDS SHAREHOLDERS' FUNDS Share capital 1 287 286 Reserves and surplus 2 21,749 17,523 22,036 17,809 DEFERRED TAX LIABILITIES 5
INDEPENDENT AUDITOR S REPORT TO THE PARTNERS OF HCG NCHRI ONCOLOGY LLP
 GARGESH & CO, CHARTERED ACCOUNTANTS HO: # 54, Chamaraja Road, Fort Mohalla, MYSORE 570004 Branch : #1878, 6 th Cross, 20 th Main, J.P.Nagar, 2 nd Phase, Bangalore - 560078 : HO : 0821-2445607, Branch :
TATA CONSULTANCY SERVICES LIMITED CONDENSED BALANCE SHEET AS AT JUNE 30, 2007
 CONDENSED BALANCE SHEET AS AT JUNE 30, 2007 Schedule Rupees in Crores Rupees in Crores SOURCES OF FUNDS: 1 SHAREHOLDERS' FUND (a) Share Capital A 97.86 97.86 (b) Reserves and Surplus B 8920.50 7961.13
TATA CONSULTANCY SERVICES LIMITED CONDENSED BALANCE SHEET AS AT JUNE 30, 2008
 CONDENSED BALANCE SHEET AS AT JUNE 30, 2008 Schedule SOURCES OF FUNDS: 1 SHAREHOLDERS' FUND (a) Share Capital A 197.86 197.86 (b) Reserves and Surplus B 11315.94 10806.95 11513.80 11004.81 2 LOAN FUNDS
As at. As at 31-Mar-17
 Balance Sheet as at Notes 31-Mar-17 31-Mar-16 1-Apr-15 ASSETS Non-current assets Property, plant and equipment 1(a) 73,473,714 4,764,770 75,732,710 5,017,292 76,033,917 4,752,120 Capital work-in-progress
TeamHGS Limited. Financial Statements 31 March 2017
 Financial Statements Index Page INDEPENDENT AUDITORS REPORT TO THE MEMBERS Financial Statements Statement of financial position 1 Statement of comprehensive income 2 Statement of changes in equity 3 Statement
INFOSYS TECHNOLOGIES LIMITED in Rs. crore Balance Sheet as at Schedule March 31, 2007 March 31, 2006
 Balance Sheet as at Schedule March 31, 2007 March 31, 2006 SOURCES OF FUNDS SHAREHOLDERS' FUNDS Share capital 1 286 138 Reserves and surplus 2 10,876 6,759 11,162 6,897 APPLICATION OF FUNDS FIXED ASSETS
S G M & Associates LLP Chartered Accountants
 S G M & Associates LLP Chartered Accountants 444 Ground Floor, 6 th Cross, 7 th Main, J P Nagar 3 rd Phase, Bengaluru 560 078. CIN AAI-0262 INDEPENDENT AUDITOR S REPORT TO THE PARTNERS OF HEALTHCARE DIWANCHAND
Example Accounts Only
 CaseWare Australia & New Zealand Large Streamlined Pty Ltd Financial Statements Disclaimer: These financials include illustrative disclosures for a large proprietary company lodging financial statements
Financial Statements of Cyber Media Research & Services Limited for the Financial Year ended
 Financial Statements of Cyber Media Research & Services Limited for the Financial Year ended 31.03.2017 CYBER MEDIA RESEARCH & SERVICES LIMITED CIN : U74130DL1996PLC081509 BALANCE SHEET AS AT 31ST MARCH,
WENDT MIDDLE EAST FZE - HAMRIYAH FREE ZONE, SHARJAH - U.A.E. STATEMENT OF FINANCIAL POSITION AS AT 31ST MARCH, 2011
 STATEMENT OF FINANCIAL POSITION AS AT Assets Note 2011 2010 2011 2010 AED AED Rs. Rs. Current assets Inventory 38,641 151,550 469,063 1,839,665 Goods in transit - 12,955-157,261 Accounts receivable 5 240,153-2,915,217