2006 Annual Report SUCCESSFULLY EXECUTING OUR STR ATEGY
|
|
|
- Randall Malone
- 5 years ago
- Views:
Transcription

1 2006 Annual Report SUCCESSFULLY EXECUTING OUR STR ATEGY
2
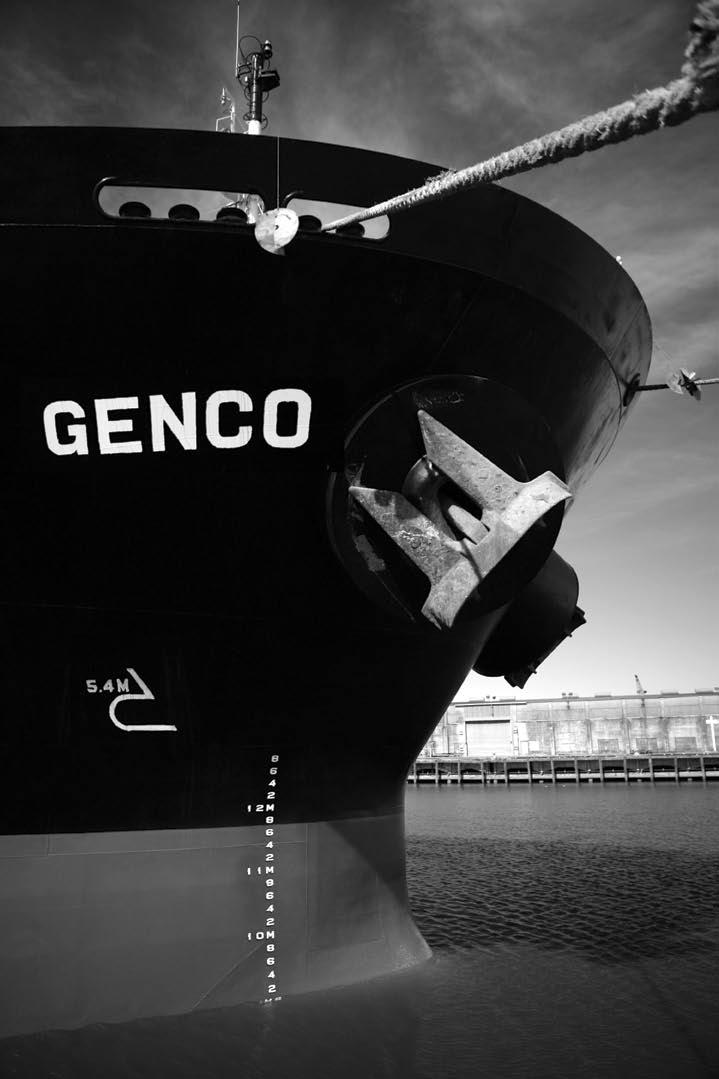
3 ABOUT US Genco Shipping & Trading Limited is a leading provider of international seaborne drybulk transportation services. Utilizing its 19 drybulk carriers, the Company transports iron ore, coal, grain, steel products and other drybulk cargoes along worldwide shipping routes for leading multi-national charterers. Genco Shipping & Trading Limited currently owns a fleet of 19 drybulk vessels, consisting of seven Panamax, seven Handymax and five Handysize vessels, with a carrying capacity of approximately 988,000 dwt. p 1
4 20 06 FINANCIAL AND OPER ATIONAL HIGHLIGHTS (dollars in thousands) PRO FORMA BALANCE SHEET ITEMS (1) PERFORMANCE ITEMS (1) Pro Forma Cash $ 64,030 EBITDA Margin 75.7% Net Debt $ 142,203 Fleet Utilization 99.3% Net Debt to Total Capitalization 29.5% Return on Total Capital 14.5% Total Liquidity (2) $ 507,797 (1) Please refer to page 56 for a reconciliation of Pro Forma Balance Sheet Items and Performance Items. (2) Includes the option to expand credit facility by $100 million. See page 47 for details. p 2
5 FINANCIAL HIGHLIGHTS (dollars in thousands except for share and per share data) Revenues $ 133,232 $ 116,906 Operating Expenses: Voyage expenses 4,710 4,287 Vessel operating expenses 20,903 15,135 General and administrative expenses 8,882 4,937 Management fees 1,439 1,479 Depreciation and amortization 26,978 22,322 Total operating expenses 62,912 48,160 Operating income 70,320 68,746 Other expense (6,798) (14,264) Net income $ 63,522 $ 54,482 Earnings per share Basic $ 2.51 $ 2.91 Earnings per share Diluted $ 2.51 $ 2.90 Dividends declared and paid per share $ 2.40 $ 0.60 p 3
6 TO OUR S HAREHOLDERS Genco s ability to distribute cumulative dividends of $3.66 per share, expand the fleet by 30% and provide shareholders who invested in its 2005 IPO with a cumulative return of 47% as of 2006 highlights the Company s core differentiators and underscores management s success in executing the Company s strategy. p 4

7 LET TE R FROM THE CHAIRMAN Genco Shipping & Trading Limited had a significant year in 2006 delivering strong results in its first full year operating as a public company. In our inaugural letter discussing 2005, we detailed a strategy for drawing upon our experienced management team, significant time charter coverage, and financial flexibility to achieve growth and distribute sizeable dividends to shareholders. Genco s ability to distribute cumulative dividends of $3.66 per share, expand the fleet by 30% and provide shareholders who invested in its 2005 IPO with a cumulative return of 47% as of 2006 highlights the Company s core differentiators and underscores management s success in executing the Company s strategy. Expanding Leadership Position in the Drybulk Industry Genco was founded with the distinct vision of becoming a global leader in the drybulk industry with a large, high-quality fleet. Building on the Company s strong financial foundation, past success in consolidating the industry and diligent approach to managing its business, Genco continued to successfully execute its acquisition strategy. During 2006, we remained focused on adding quality vessels that surpass rigorous standards and increase the Company s earnings potential. Specifically, we acted decisively to take advantage of a temporary short-term softness in asset prices and acquired three drybulk vessels for an aggregate purchase price of $81.25 million, expanding our fleet by 23% on a tonnage basis and improving our fleet s age profile. The subsequent rise in asset prices during the year, combined with our success at signing contracts for all three vessels at strong rates, is a testament to the merit of this acquisition and our ongoing focus on employing a prudent and opportunistic growth strategy. Providing Both Growth and Dividends As we continued to grow our fleet in 2006, we are pleased to have distributed sizeable dividends. Since going public in 2005, we have provided shareholders with cumulative dividends of $3.66 per share, which highlight the Company s significant earnings power as well as its ongoing ability to secure time charter coverage with prestigious multi-national charterers. Our continued expertise in taking advantage of the strong freight market during 2006 and into 2007, led to our success in securing 84% of our fleet s remaining 2007 available days and 39% of our fleet s 2008 available days on time charters as of March 20, With significant time charter coverage secured early in the year, and our solid prospects for increased profitability as a result of our expanded fleet, our Board made the important decision to p 5
8 increase our dividend paid for the fourth quarter of 2006 by 10% to $0.66 per share. This decision underscores one of Genco s key differentiators: operating the Company to best serve shareholders in both the near and long term. Solidifying a Strong Foundation for Growth Complementing Genco s diligent approach of employing strict acquisition criteria during the year, we advanced our unrelenting commitment to maintain the appropriate financial flexibility in order to continue to further our position as a leading consolidator in the industry. During the year, we increased our 10-year credit facility to $550 million from $450 million, a direct result of our strong relationships with our lenders and our proactive approach of ensuring an optimal foundation for the future. Our total pro forma liquidity of $508 million combined with our pro forma net debt-to-total capital ratio of 29% as of 2006 positions the Company well to continue to grow Genco s fleet and earnings for the benefit of our shareholders. Furthermore, this financial strength and our unique dividend policy, which includes a reserve for growth, bodes well for Genco to continue to meet its critical growth objective without having to rely on the equity markets, another key differentiator of our Company. Ongoing Support from the U.S. Capital Markets In addition to the support Genco received from its banking group during 2006, the Company successfully completed a secondary offering of shares held by Fleet Acquisition LLC in February of The offering was noteworthy for a number of reasons. First, the offering was closed at the market price, when secondary offerings of other companies in the shipping industry were priced at a discount to the market price. Second, management and I maintained our ownership of Genco s shares, which underscores our belief in Genco s strategy and longterm prospects. Outlook for 2007 When we founded Genco in November of 2004, we did so with the strategic focus of taking advantage of the favorable long-term global demand for core commodities such as iron ore, coal and grain. I am proud of Genco s initial success capitalizing on these positive fundamentals as well the progress the Company has made in advancing its vision of becoming the industry bellwether. Going forward, we remain committed to build upon the considerable success we experienced in As we did when we acquired our initial fleet of 16 vessels and the subsequent acquisitions of a total of four quality vessels in 2005 and 2006, we intend to maintain an unrelenting focus in seeking accretive acquisitions that meet strict financial criteria while also creating value for shareholders through our target quarterly dividend of $0.66 per share. Complementing this approach, we intend to continue to maintain a large portion of our fleet secured on long-term time charters and provide leading charterers with service that meets the highest standards. Remaining true to this focus gives us great confidence for the future as we continue to p 6
9 During 2006, we remained focused on adding quality vessels that surpass rigorous standards and increase the Company s earnings potential. Specifically, we acted decisively to take advantage of a temporary short-term softness in asset prices and acquired three drybulk vessels for an aggregate purchase price of $81.25 million. strive for the ongoing creation of long-term value for our shareholders. In Appreciation of a Dedicated Team Genco s tremendous success in 2006, and since its founding a little more than two years ago, can be attributed directly to the dedication and expertise of our staff. The Company s strong reputation in the industry for providing service to leading multinational charters that adheres to the highest standards stems from the commitment of our staff to meet customer demand for the efficient transportation of essential commodities around the world. I thank our team for all their efforts in enabling Genco to truly become a leading drybulk company. I also express my appreciation to our shareholders and other supporters and look forward to providing an update on our continued progress in the future. Peter C. Georgiopoulos Chairman of the Board Genco Shipping & Trading Limited p 7


10 LET TE R FROM THE PRESIDENT The strong reputation of Genco s management team as an operator of quality tonnage has been instrumental in significantly increasing our fleet s time charter coverage throughout 2006 and into Specifically, our success at taking advantage of the favorable drybulk rate environment enabled the Company to enter into long-term contracts with leading international charterers at strong rates boding well for the Company s earnings potential and fleet utilization. Consistent with our strategy of securing a large portion of our fleet on time charters, we recently enhanced our in-house chartering capabilities by appointing a new Chartering Manager with extensive shipping experience was a year of operational excellence for Genco, as the Company further solidified its leading position and enhanced its reputation in the global drybulk industry. During 2006, we are pleased to have furthered our commitment to providing customers with first-in-class vessels that support rigorous standards. Consistent with this intense focus, the Company acquired three drybulk vessels one Handymax and two Panamax that further improved the profile of our modern, high-quality fleet. Building upon our past success, we worked diligently to ensure the seamless integration of these newly acquired vessels into our existing infrastructure. Our success at maintaining the operational integrity of our entire fleet and securing employment of the vessels prior to their delivery is testimony to our integration expertise. This considerable success also contributed to the Company achieving utilization of over 99% for the year. In support of the Company s commitment to providing service that meets the highest standards, Genco engaged the services of Barber Ship Management and Anglo-Eastern Ship Management in 2006 following the appointment of Wallem Shipmanagement during the prior year. With three of the world s leading technical management companies complementing our ship operations, we were able to achieve two important objectives: first, we are ensured of high quality of customer service at a cost-effective price. Second, we gained access to a larger pool of quality crew members allowing us to better serve our world-class customers was clearly a significant year for Genco in which we further strengthened our position to continue to surpass the exacting requirements of our global customers. I would like to thank all our dedicated staff, both onboard and onshore, for their hard work and look forward to the year ahead. Robert Gerald Buchanan President Genco Shipping & Trading Limited p 8
11 2007 The strong reputation of Genco s management team as an operator of quality tonnage has been instrumental in significantly increasing our fleet s time charter coverage throughout 2006 and into p 9
12 29% Our pro forma liquidity totaled $508 million and our pro forma net debt-to-total capital ratio was further reduced to 29%, positioning the Company to further execute its acquisition strategy. p 10


13 LET TE R FROM THE CFO With an aim of providing value to our shareholders in both the near and long term, Genco continued to effectively deliver on its financial objectives during Highlighting the considerable success we achieved in this important area, we drew upon our strong operational results to pay sizeable dividends while further enhancing our financial liquidity. The Company also posted a 14.5% return on capital for 2006, which we believe was the highest among the U.S. publicly traded drybulk shipping companies for the year. Our success in delivering such a strong return is directly related to Genco s disciplined acquisition and chartering approach and focus on creating significant value. Furthermore, shareholders who invested in our IPO have realized a 47% total return based on the stock s closing price as of December 29, 2006 and cumulative dividends. At the core of Genco s continued success in consolidating the drybulk industry is our commitment to maintaining significant financial flexibility. Drawing upon this key differentiator, Genco utilized its significant liquidity position to acquire three quality drybulk vessels, without the need to access the equity markets. This enabled the Company to expand its fleet and further enhance its earnings power, without diluting current shareholders. The acquisition of our three drybulk vessels in 2006 was followed by the sale of the Genco Glory, a 1984-built Handymax vessel for $13.15 million. The sale, which resulted in a net gain of approximately $3.6 million in the first quarter of 2007, further demonstrates management s ability to act opportunistically and take advantage of the strong drybulk market. During a time when we grew our fleet on a tonnage basis by 23%, we are also pleased to have increased our credit facility by $100 million to $550 million, positioning the Company well for the future. The facility, which was executed at the same favorable terms of our original facility, also has an expandable feature with the option to increase the facility by an additional $100 million to $650 million. As of 2006, and after the $100 million expansion option under the credit facility, our pro forma liquidity totaled $508 million and our pro forma net debt-to-total capital ratio was further reduced to 29%, positioning the Company well to further execute its acquisition strategy. We continue to look for acquisition candidates, and remain focused on scrutinizing potential transactions based on their ability to provide earnings and cash flow accretion as well as significant returns on total capital. Since going public in July of 2005, Genco exceeded its $0.54 target dividend for five consecutive quarters. As a result of our enhanced earnings power and significant time charter coverage our Board of directors increased our 2007 quarterly dividend target by 22% to $0.66 per share. Including the dividend of $0.66 per share we declared for the fourth quarter of 2006, we have declared dividends totaling $2.46 per share for 2006 and $3.66 per share on a cumulative basis since going public. At Genco Shipping & Trading Limited we have a strong commitment to the integrity of our financial reporting. In 2006, we successfully executed the implementation of Section 404 of the Sarbanes-Oxley Act. I am pleased to report that Genco Shipping & Trading Limited had effective internal financial controls at I thank our finance team for the dedication they demonstrated throughout the year. Their hard work contributed to Genco s overall success as well as positioning the company for continued growth in the future. John C. Wobensmith Chief Financial Officer Genco Shipping & Trading Limited p 11


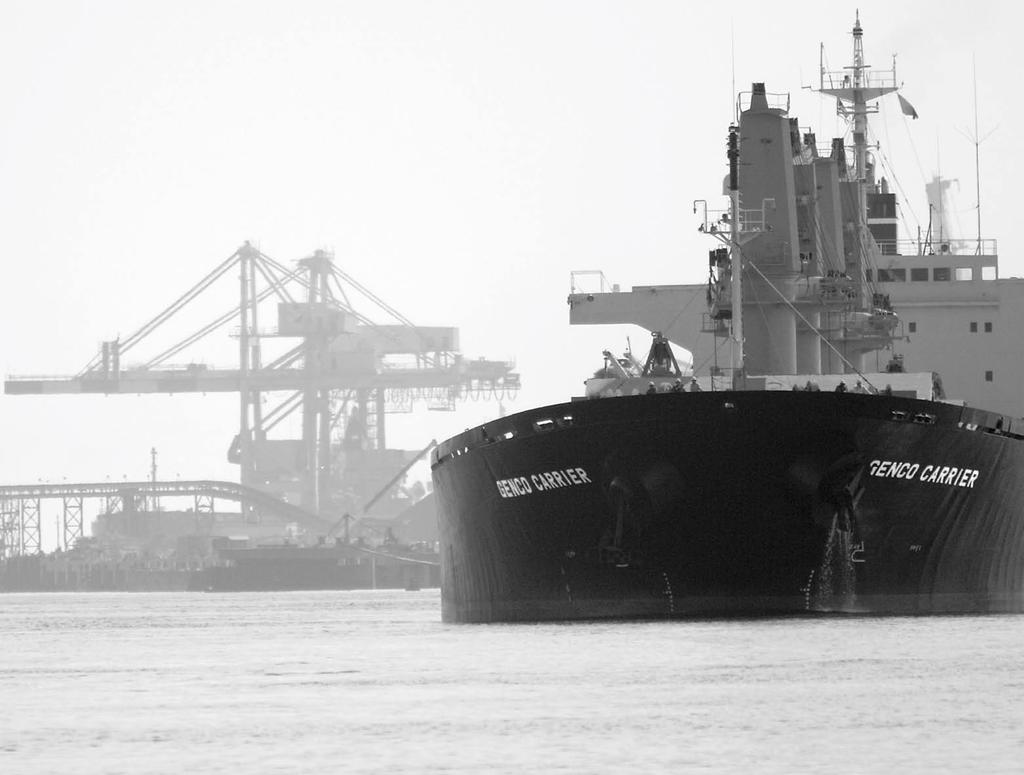
14 STRONG REL ATIONSHIPS WITH INTE RNATIONAL CHARTE RERS Genco s strong relationships with top-tier charterers are directly related to the Company s leading reputation as an operator of high-quality tonnage and the extensive industry experience of its management team. With a commitment to strict operating standards, Genco continues to meet and exceed the expectations of its global customers. Consistent with the Company s goal of building a fleet of first-in-class vessels, Genco acquired three drybulk ships in Following the delivery of the Genco Commander, a 1994-built Handymax vessel, the Genco Acheron, a 1999-built Panamax vessel, and the Genco Surprise, a 1998-built Panamax vessel, the Company further enhanced its modern fleet profile and future commercial prospects. Currently, the average age of Genco s fleet is approximately 9 years, well below the industry average. As Genco successfully expanded its leading position in the drybulk industry, the Company achieved considerable progress in locking away a significant portion of its fleet on long-term time charters at attractive rates. As of March 20, 2007, Genco has approximately 84% of its fleet s remaining 2007 available days and 39% of its 2008 available days secured on contracts. In achieving this important objective, the Company will maintain its focus on securing long-term time charters and enhancing its revenue stream for the benefit of shareholders. Genco s philosophy of operational excellence is evident throughout all aspects of its business. The Company s rigorous in-house policies and procedures, both onshore and at sea, are complemented by its partnership with three of the world s leading technical management companies that promote the highest industry standards. Genco has developed a strong track record in transporting essential commodities along worldwide shipping routes and intends to continue to draw upon its quality fleet and top industry experience in delivering first-rate service to leading international charterers. p 12
15 p 13


16 E XPANDING INDUSTRY LE ADERSHIP POSITION Genco Shipping continues to establish itself as a leading consolidator in the industry. At the core of Genco s considerable success during the year meeting this critical objective was the Company s progress in entering into acquisitions that met strict earnings and cash flow accretion criteria as well as return on capital hurdles. The Company s unrelenting focus on employing this diligent approach combined with its focus on building its existing strong financial and operational foundation resulted in the acquisition of three drybulk vessels from affiliates of Franco Compania Naviera S.A., for an aggregate purchase price of $81.25 million. Genco s growth strategy, which is focused on continuing to add quality vessels to its fleet, positions the Company to take advantage of strong fundamentals for drybulk shipping. During 2006, the drybulk market was robust, driven primarily by three factors. First, Chinese steel production in 2006 increased 21% on a year-over-year basis. Second, iron ore imports into China increased 18% from 2005 levels. And finally, longer haul distances, which resulted from China importing more iron ore from places such as Brazil, had a positive effect on the drybulk rate environment. In addition to the iron ore trade, China s rapid development has resulted in an increase of energy demand, boosting the country s coal imports and leading the country to become a net importer of coal over the long term. In an effort to take advantage of future growth opportunities in the drybulk industry, Genco increased its credit facility to $550 million from $450 million. With a sound capital structure, including total pro forma liquidity of approximately $508 million, low leverage position with a pro forma net debt-to-total capital ratio of 29%, and a unique dividend policy with a reserve for growth, Genco remains well positioned to capitalize on such opportunities that create long-term value for the Company and its shareholders. Consistent with the Company s success in acquiring 20 vessels since its founding in 2004, we intend to continue to draw upon management s extensive consolidation experience to achieve this critical objective. p 14
17 p 15


18 DISTRIBUTING SIGNIFICANT DIVIDENDS IN A PE RIOD OF GROW TH Genco s unique dividend policy is aimed at enabling shareholders to benefit from its earnings power while at the same time providing the Company with a reserve for growth. The Company s solid operating performance since inception has allowed Genco to consistently exceed its initial $0.54 per share quarterly target dividend without sacrificing its financial strength. Since the Company s IPO in July 2005, Genco has declared cumulative dividends of $3.66 per share for the six eligible quarters. Period Declared Dividend Q $ 0.60 Q $ 0.60 Q $ 0.60 Q $ 0.60 Q $ 0.60 Q $ 0.66 Total $ 3.66 Building upon the Company s success in capitalizing on strategic acquisitions and significantly increasing the time charter coverage for its high-quality fleet, Genco made the important decision to raise its quarterly dividend target for 2007 by 22% to $0.66 per share. This new quarterly target dividend is testimony to Genco s continued success in expanding its fleet in a prudent manner and securing its vessels on long-term time charters with leading international charterers. Key to Genco s increased dividend was the Company s ability to expand its fleet by 23% on a tonnage basis following the acquisition of the Genco Commander, a 1994-built Handymax vessel, the Genco Acheron, a 1999-built Panamax vessel, and the Genco Surprise, a 1998-built Panamax vessel. Genco acted decisively and drew upon its increased credit facility of $550 million to finance the acquisition, which met all of the Company s stringent return criteria. As Genco successfully executed its growth plan, the Company further strengthened its ability to distribute significant dividends by locking away a large portion of its fleet on time charters at attractive rates. With approximately 84% of its fleet s remaining available days secured on contracts for 2007 as of March 20, 2007, combined with a sound capital structure including $508 million in total pro forma liquidity and a unique dividend policy with a reserve for growth, Genco remains in a strong position to distribute sizable dividends to shareholders. p 16
19 p 17
20 FLEET LI STING VESSEL VESSEL TYPE DEADWEIGHT YEAR BUILT Genco Leader Panamax 73,941 MT 1999 Genco Vigour Panamax 73,941 MT 1999 Genco Beauty Panamax 73,941 MT 1999 Genco Knight Panamax 73,941 MT 1999 Genco Trader Panamax 69,338 MT 1990 Genco Wisdom Handymax 47,180 MT 1997 Genco Prosperity Handymax 47,180 MT 1997 Genco Marine Handymax 45,222 MT 1996 Genco Carrier Handymax 47,180 MT 1998 Genco Muse Handymax 48,913 MT 2001 Genco Success Handymax 47,186 MT 1997 Genco Explorer Handysize 29,952 MT 1999 Genco Sugar Handysize 29,952 MT 1998 Genco Pioneer Handysize 29,952 MT 1999 Genco Reliance Handysize 29,952 MT 1999 Genco Progress Handysize 29,952 MT 1999 p 18
21 FINANCIAL TABLE OF CONTENTS Selected Consolidated Financial and Other Data 20 Management s Discussion and Analysis of Financial Condition and Results of Operations 23 Quantitative and Qualitative Disclosures about Market Risk 35 Consolidated Balance Sheets 37 Consolidated Statements of Operations 38 Consolidated Statements of Shareholders Equity and Comprehensive Income 39 Consolidated Statements of Cash Flows 40 Notes to Consolidated Financial Statements 41 Management Report on Internal Control over Financial Reporting 53 Report of Independent Registered Public Accounting Firm Market for Registrant s Common Equity, Related Stockholder Matters and Purchases of Equity Securities 55 19
22 SELECTED CONSOLIDATED FINANCIAL AND OTHER DATA Income Statement Data: 20 For the years ended For the period from September 27, 2004 to (U.S. dollars in thousands except for share and per share data) Revenues $ 133,232 $ 116,906 $ 1,887 Operating Expenses: Voyage expenses 4,710 4, Vessel operating expenses 20,903 15, General and administrative expenses 8,882 4, Management fees 1,439 1, Depreciation and amortization 26,978 22, Total operating expenses 62,912 48, Operating income 70,320 68,746 1,141 Other expense (6,798) (14,264) (234) Net income $ 63,522 $ 54,482 $ 907 Earnings per share Basic $ 2.51 $ 2.91 $ 0.07 Earnings per share Diluted $ 2.51 $ 2.90 $ 0.07 Dividends declared and paid per share $ 2.40 $ 0.60 Weighted average common shares outstanding Basic 25,278,726 18,751,726 13,500,000 Weighted average common shares outstanding Diluted 25,351,297 18,755,195 13,500,000 Balance Sheet Data: (U.S. dollars in thousands, at end of period) Cash $ 73,554 $ 46,912 $ 7,431 Total assets 578, , ,628 Total debt (current and long-term) 211, , ,766 Total shareholders equity 353, ,242 73,374 Cash Flow Data: (U.S. dollars in thousands) Net cash flow provided by operating activities $ 90,068 $ 88,230 $ 2,718 Net cash flow used in investing activities (82,840) (268,072) (189,414) Net cash provided by financing activities 19, , ,127 EBITDA (1) $ 100,845 $ 91,743 $ 1,562 (1) EBITDA represents net income plus net interest expense, income tax expense, depreciation and amortization, plus amortization of nonvested stock compensation, and amortization of the value of time charter acquired which is included as a component of other long-term assets. EBITDA is included because it is used by management and certain investors as a measure of operating performance. EBITDA is used by analysts in the shipping industry as a common performance measure to compare results across peers. Our management uses EBITDA as a performance measure in consolidating internal financial statements and it is presented for review at our board meetings. EBITDA is also used by our lenders in certain loan covenants. For these reasons, we believe that EBITDA is a useful measure to present to our investors. EBITDA is not an item recognized by U.S. GAAP and should not be considered as an alternative to net income, operating income or any other indicator of a company s operating performance required by U.S. GAAP. EBITDA is not a source of liquidity or cash flows as shown in our consolidated statement of cash flows. The definition of EBITDA used here may not be comparable to that used by other companies. The following table demonstrates our calculation of EBITDA and provides a reconciliation of EBITDA to net income for each of the periods presented above: For the years ended For the period from September 27, 2004 to (U.S. dollars in thousands except for per share data) Net income $ 63,522 $54,482 $ 907 Net interest expense 6,906 14, Amortization of value of time charter acquired (1) 1, Amortization of nonvested stock compensation 1, Depreciation and amortization 26,978 22, EBITDA $ 100,845 $91,743 $ 1,562 (1) Amortization of value of time charter acquired is a reduction of revenue and the unamortized portion is included in other long-term assets.
23 For the years ended For the period from September 27, 2004 to Fleet Data: Ownership days (1) Panamax 1, , Handymax 2, , Handysize 1, , Total 6, , Available days (2) Panamax 1, , Handymax 2, , Handysize 1, , Total 6, , Operating days (3) Panamax 1, , Handymax 2, , Handysize 1, , Total 6, , Fleet utilization (4) Panamax 99.0% 99.3% 100.0% Handymax 99.0% 99.3% 100.0% Handysize 99.9% 99.1% 100.0% Fleet average 99.3% 99.2% 100.0% Average Daily Results: For the years ended For the period from September 27, 2004 to (U.S. dollars) Time Charter Equivalent (5) Panamax $24,128 $25,090 $41,367 Handymax 21,049 21,255 18,166 Handysize 15,788 16,955 17,191 Fleet average 20,455 20,903 21,960 Daily vessel operating expenses (6) Panamax $ 3,615 $ 3,061 $ 2,101 Handymax 3,228 2,796 1,577 Handysize 3,019 2,597 1,597 Fleet average 3,285 2,805 1,683 (1) We define ownership days as the aggregate number of days in a period during which each vessel in our fleet has been owned by us. Ownership days are an indicator of the size of our fleet over a period and affect both the amount of revenues and the amount of expenses that we record during a period. (2) We define available days as the number of our ownership days less the aggregate number of days that our vessels are off-hire due to scheduled repairs or repairs under guarantee, vessel upgrades or special surveys and the aggregate amount of time that we spend positioning our vessels. Companies in the shipping industry generally use available days to measure the number of days in a period during which vessels should be capable of generating revenues. (3) We define operating days as the number of our available days in a period less the aggregate number of days that our vessels are off-hire due to unforeseen circumstances. The shipping industry uses operating days to measure the aggregate number of days in a period during which vessels actually generate revenues. (4) We calculate fleet utilization by dividing the number of our operating days during a period by the number of our available days during the period. The shipping industry uses fleet utilization to measure a company s efficiency in finding suitable employment for its vessels and minimizing the number of days that its vessels are off-hire for reasons other than scheduled repairs or repairs under guarantee, vessel upgrades, special surveys or vessel positioning. 21
24 SELECTED CONSOLIDATED FINANCIAL AND OTHER DATA (continued) (5) We define TCE rates as our net voyage revenue (voyage revenues less voyage expenses) divided by the number of our available days during the period, which is consistent with industry standards. TCE rate is a common shipping industry performance measure used primarily to compare daily earnings generated by vessels on time charters with daily earnings generated by vessels on voyage charters, because charterhire rates for vessels on voyage charters are generally not expressed in per-day amounts while charterhire rates for vessels on time charters generally are expressed in such amounts. For the years ended For the period from September 27, 2004 to Income statement data (U.S. dollars in thousands) Voyage revenues $133,232 $116,906 $1,887 Voyage expenses 4,710 4, Net voyage revenue $128,522 $112,619 $1,843 (6) We define daily vessel operating expenses to include crew wages and related costs, the cost of insurance, expenses relating to repairs and maintenance (excluding drydocking), the costs of spares and consumable stores, tonnage taxes and other miscellaneous expenses. Daily vessel operating expenses are calculated by dividing vessel operating expenses by ownership days for the relevant period. 22
25 MANAGEMENT S DISCUSSION AND ANALYSIS OF FINANCIAL CONDITION AND RESULTS OF OPERATIONS General We are a Marshall Islands company incorporated in September 2004 to transport iron ore, coal, grain, steel products and other drybulk cargoes along worldwide shipping routes through the ownership and operation of drybulk carrier vessels. As of December 31, 2006, excluding the Genco Glory, our fleet consisted of seven Panamax, seven Handymax and five Handysize drybulk carriers, with an aggregate carrying capacity of approximately 988,000 dwt, and the average age of our fleet was approximately 8.9 years as of 2006, as compared to the average age for the world fleet of approximately 15.6 years for the drybulk shipping segments in which we compete. All of the vessels in our fleet are on time charters to reputable charterers, including Lauritzen Bulkers, Cargill, HMMC, BHP, DS Norden, A/S Klaveness, Cosco Bulk Carrier Co., Ltd., and NYK Europe. All of the vessels in our fleet are presently engaged under time charter contracts that expire (assuming the option periods in the time charters are not exercised) between March 2007 and December Each vessel in our fleet was delivered to us on the date specified in the following chart: Vessel Acquired Date Delivered Class Year Built Genco Reliance 12/6/04 Handysize 1999 Genco Glory 12/8/04 (1) Handymax 1984 Genco Vigour 12/15/04 Panamax 1999 Genco Explorer 12/17/04 Handysize 1999 Genco Carrier 12/28/04 Handymax 1998 Genco Sugar 12/30/04 Handysize 1998 Genco Pioneer 1/4/05 Handysize 1999 Genco Progress 1/12/05 Handysize 1999 Genco Wisdom 1/13/05 Handymax 1997 Genco Success 1/31/05 Handymax 1997 Genco Beauty 2/7/05 Panamax 1999 Genco Knight 2/16/05 Panamax 1999 Genco Leader 2/16/05 Panamax 1999 Genco Marine 3/29/05 Handymax 1996 Genco Prosperity 4/4/05 Handymax 1997 Genco Trader 6/7/05 Panamax 1990 Genco Muse 10/14/05 Handymax 2001 Genco Commander 11/2/06 Handymax 1994 Genco Acheron 11/7/06 Panamax 1999 Genco Surprise 11/17/06 Panamax 1998 (1) We reached an agreement to sell the vessel to Cloud Maritime S.A. The delivery of the vessel to the new owner is expected to occur during February We intend to grow our fleet through timely and selective acquisitions of vessels in a manner that is accretive to our cash flow. In connection with this growth strategy, we negotiated the New Credit Facility, which has been used to refinance the outstanding indebtedness under our previous credit facility (the Original Credit Facility ) remaining after application of a portion of the net proceeds of our initial public offering on July 22, Our management team and our other employees are responsible for the commercial and strategic management of our fleet. Commercial management includes the negotiation of charters for vessels, managing the mix of various types of charters, such as time charters and voyage charters, and monitoring the performance of our vessels under their charters. Strategic management includes locating, purchasing, financing and selling vessels. We currently contract with three independent technical managers to provide technical management of our fleet at a lower cost than we believe would be possible in-house. Technical management involves the day-to-day management of vessels, including performing routine maintenance, attending to vessel operations and arranging for crews and supplies. Members of our New York City-based management team oversee the activities of our independent technical managers. Factors Affecting Our Results of Operations We believe that the following table reflects important measures for analyzing trends in our results of operations. The table reflects our ownership days, available days, operating days, fleet utilization, TCE rates and daily vessel operating expenses for the years ended 2006 and 2005 and the period from inception September 27, 2004 to Because predominately all of our vessels have operated on time charters, our TCE rates equal our time charter rates less voyage expenses consisting primarily of brokerage commissions paid by us to third parties. For the years ended For the period from September 27, 2004 to Fleet Data: Ownership days (1) Panamax 1, , Handymax 2, , Handysize 1, , Total 6, , Available days (2) Panamax 1, , Handymax 2, , Handysize 1, , Total 6, , Operating days (3) Panamax 1, , Handymax 2, , Handysize 1, , Total 6, , Fleet utilization (4) Panamax 99.0% 99.3% 100.0% Handymax 99.0% 99.3% 100.0% Handysize 99.9% 99.1% 100.0% Fleet average 99.3% 99.2% 100.0% 23
26 MANAGEMENT S DISCUSSION AND ANALYSIS OF FINANCIAL CONDITION AND RESULTS OF OPERATIONS (continued) For the years ended For the period from September 27, 2004 to (U.S. dollars) Average Daily Results: Time Charter Equivalent (5) Panamax $ 24,128 $ 25,090 $ 41,367 Handymax 21,049 21,255 18,166 Handysize 15,788 16,955 17,191 Fleet average 20,455 20,903 21,960 Daily vessel operating expenses (6) Panamax $ 3,615 $ 3,061 $ 2,101 Handymax 3,228 2,796 1,577 Handysize 3,019 2,597 1,597 Fleet average 3,285 2,805 1,683 (1) We define ownership days as the aggregate number of days in a period during which each vessel in our fleet has been owned by us. Ownership days are an indicator of the size of our fleet over a period and affect both the amount of revenues and the amount of expenses that we record during a period. (2) We define available days as the number of our ownership days less the aggregate number of days that our vessels are off-hire due to scheduled repairs or repairs under guarantee, vessel upgrades or special surveys and the aggregate amount of time that we spend positioning our vessels. Companies in the shipping industry generally use available days to measure the number of days in a period during which vessels should be capable of generating revenues. (3) We define operating days as the number of our available days in a period less the aggregate number of days that our vessels are off-hire due to unforeseen circumstances. The shipping industry uses operating days to measure the aggregate number of days in a period during which vessels actually generate revenues. (4) We calculate fleet utilization by dividing the number of our operating days during a period by the number of our available days during the period. The shipping industry uses fleet utilization to measure a company s efficiency in finding suitable employment for its vessels and minimizing the number of days that its vessels are off-hire for reasons other than scheduled repairs or repairs under guarantee, vessel upgrades, special surveys or vessel positioning. (5) We define TCE rates as net voyage revenue (voyage revenues less voyage expenses) divided by the number of our available days during the period, which is consistent with industry standards. TCE rate is a common shipping industry performance measure used primarily to compare daily earnings generated by vessels on time charters with daily earnings generated by vessels on voyage charters, because charterhire rates for vessels on voyage charters are generally not expressed in per-day amounts while charterhire rates for vessels on time charters generally are expressed in such amounts. For the years ended For the period from September 27, 2004 to Income Statement Data: (U.S. dollars in thousands) Voyage revenues $133,232 $116,906 $1,887 Voyage expenses 4,710 4, Net voyage revenue $128,522 $112,619 $1,843 (6) We define daily vessel operating expenses to include crew wages and related costs, the cost of insurance, expenses relating to repairs and maintenance (excluding drydocking), the costs of spares and consumable stores, tonnage taxes and other miscellaneous expenses. Daily vessel operating expenses are calculated by dividing vessel operating expenses by ownership days for the relevant period. Operating Data The following discusses our operating income and net income for the years ended 2006 and 2005 and the period from inception September 27, 2004 to For the years ended For the period from September 27, 2004 to Income Statement Data: (U.S. dollars in thousands except for share and per share data) Revenues $133,232 $116,906 $1,887 Operating Expenses: Voyage expenses 4,710 4, Vessel operating expenses 20,903 15, General and administrative expenses 8,882 4, Management fees 1,439 1, Depreciation and amortization 26,978 22, Total operating expenses 62,912 48, Operating income 70,320 68,746 1,141 Other expense (6,798) (14,264) (234) Net income $ 63,522 $ 54,482 $ 907 Earnings per share Basic $ 2.51 $ 2.91 $ 0.07 Earnings per share Diluted $ 2.51 $ 2.90 $ 0.07 Dividends declared and paid per share $ 2.40 $ 0.60 Weighted average common shares outstanding Basic 25,278,726 18,751,726 13,500,000 Weighted average common shares outstanding Diluted 25,351,297 18,755,195 13,500,000 24
27 For the years ended For the period from September 27, 2004 to Balance Sheet Data: (U.S. dollars in thousands, at end of period) Cash $ 73,554 $ 46,912 $ 7,431 Total assets 578, , ,628 Total debt (current and long-term) 211, , ,766 Total shareholders equity 353, ,242 73,374 Cash Flow Data: (U.S. dollars in thousands) Net cash flow provided by operating activities $ 90,068 $ 88,230 $ 2,718 Net cash flow used in investing activities (82,840) (268,072) (189,414) Net cash provided by financing activities 19, , ,127 EBITDA (1) $100,845 $ 91,743 $ 1,562 (1) EBITDA represents net income plus net interest expense, income tax expense, depreciation and amortization, plus amortization of nonvested stock compensation, and amortization of the value of time charters acquired which is included as a component of other long-term assets. EBITDA is included because it is used by management and certain investors as a measure of operating performance. EBITDA is used by analysts in the shipping industry as a common performance measure to compare results across peers. Our management uses EBITDA as a performance measure in consolidating internal financial statements and it is presented for review at our board meetings. EBITDA is also used by our lenders in certain loan covenants. For these reasons, we believe that EBITDA is a useful measure to present to our investors. EBITDA is not an item recognized by U.S. GAAP and should not be considered as an alternative to net income, operating income or any other indicator of a company s operating performance required by U.S. GAAP. EBITDA is not a source of liquidity or cash flows as shown in our consolidated statement of cash flows. The definition of EBITDA used here may not be comparable to that used by other companies. The following table demonstrates our calculation of EBITDA and provides a reconciliation of EBITDA to net income for each of the periods presented above: For the years ended For the period from September 27, 2004 to (U.S. dollars in thousands) Net income $ 63,522 $54,482 $ 907 Net interest expense 6,906 14, Amortization of value of time charter acquired (1) 1, Amortization of nonvested stock compensation 1, Depreciation and amortization 26,978 22, EBITDA $ 100,845 $91,743 $ 1,562 (1) Amortization of value of time charter acquired is a reduction of revenue and the unamortized portion is included in other long-term assets. Results of Operations Year ended 2006 compared to the year ended 2005 Revenues Our revenues are driven primarily by the number of vessels in our fleet, the number of days during which our vessels operate and the amount of daily charterhire that our vessels earn, that, in turn, are affected by a number of factors, including: the duration of our charters; our decisions relating to vessel acquisitions and disposals; the amount of time that we spend positioning our vessels; the amount of time that our vessels spend in drydock undergoing repairs; maintenance and upgrade work; the age, condition and specifications of our vessels; levels of supply and demand in the drybulk shipping industry; and other factors affecting spot market charter rates for drybulk carriers. We were incorporated on September 27, 2004 and took delivery of our first six vessels in December The next ten vessels of our fleet were delivered in the first six months of 2005, another vessel was delivered in October 2005, and the last three vessels in the fleet were delivered in the fourth quarter of During February 2007, we expect to complete the pending sale of the Genco Glory to Cloud Maritime S.A. for $13.2 million. The increase in the size of our fleet has enabled us to grow our revenues significantly and to increase our ownership, available and operating days. For the year ended 2006, revenues grew 13.9% to $133.2 million versus $116.9 million for the year ended Revenues in both periods consisted of charterhire payments for our vessels. The increase in revenues was due primarily to the operation of a larger fleet. The average TCE rate of our fleet declined by 2.1% to $20,455 a day for the year ended 2006 from $20,903 a day for the year ended 2005 mostly due to lower charter rates achieved on the five handysize vessels on time charter to Lauritzen Bulkers. The five vessels were renewed under a time charter with Lauritzen Bulkers in the third quarter of 2006 at a lower charter rate than the previous time charter. Furthermore, lower charter rates were realized on the Genco Leader, which was subject to lower overall spot market in 2006 versus For the years ended 2006 and 2005, we had ownership days of 6,363.1 days and 5,396.1 days, respectively. Fleet utilization remained static at 99.3% in 2006 versus 99.2% in 2005, respectively. 25
28 MANAGEMENT S DISCUSSION AND ANALYSIS OF FINANCIAL CONDITION AND RESULTS OF OPERATIONS (continued) The following table sets forth information about the current employment of the vessels currently in our fleet: Vessel Time Charter Rate (1) Charterer Charter Expiration (2) Panamax Vessels Genco Beauty $29,000 Cargill March 2007 Genco Knight 29,000 BHP March 2007 Genco Leader 25,650 (3) A/S Klaveness December 2008 Genco Trader 25,750 (3) Baumarine AS October 2007 Genco Vigour 29,000 BHP March 2007 Genco Acheron 28,500 Global Maritime Investments Ltd. March ,000 (4) STX Pan Ocean January 2008 Genco Surprise 25,000 Cosco Bulk Carrier Co., Ltd. November 2007 Handymax Vessels Genco Success 24,000 KLC January 2008 Genco Commander 19,750 A/S Klaveness October 2007 Genco Carrier 24,000 DBCN Corporation March ,000 (5) Pacific Basin Chartering Ltd. January 2008 Genco Prosperity 23,000 DS Norden March 2007 Genco Wisdom 24,000 HMMC November 2007 Genco Marine 18,000 (6) NYK Europe March ,000 February 2008 Genco Muse 26,500 (7) Qatar Navigation QSC September 2007 Handysize Vessels Genco Explorer 13,500 Lauritzen Bulkers July 2007 Genco Pioneer 13,500 Lauritzen Bulkers August 2007 Genco Progress 13,500 Lauritzen Bulkers August 2007 Genco Reliance 13,500 Lauritzen Bulkers July 2007 Genco Sugar 13,500 Lauritzen Bulkers July 2007 (1) Time charter rates presented are the gross daily charterhire rates before the payments of brokerage commissions ranging from 1.25% to 5% to third parties, except as indicated for the Genco Trader and the Genco Leader in note 3 below. In a time charter, the charterer is responsible for voyage expenses such as bunkers, port expenses, agents fees and canal dues. (2) The charter expiration dates presented represent the earliest dates that our charters may be terminated in the ordinary course. Under the terms of each contract, the charterer is entitled to extend time charters from two to four months in order to complete the vessel s final voyage plus any time the vessel has been off-hire. (3) The Genco Leader and the Genco Trader were delivered to the charterer for the commencement of the time charter on January 15, 2007 and December 24, 2006, respectively. For each of these vessels, the time charter rate presented is the net daily charterhire rate. There are no payments of brokerage commissions associated with these time charters. (4) We have reached an agreement to commence a time charter for 11 to 13 months at a rate of $30,000 per day, less a 5% third-party brokerage commission. The estimated charter expiration is based on the time charter beginning in March 2007, the earliest possible termination of the previous charter. (5) The estimated charter expiration is based on the time charter beginning in March 2007, the earliest possible termination of the previous charter. (6) The time charter rate was $26,000 until March 2006 and $18,000 thereafter until March For purposes of revenue recognition, the time charter contract through March 2007 is reflected on a straight-line basis in accordance with generally accepted accounting principles in the United States, or U.S. GAAP. Additionally, we have reached an agreement with the current charterer for an additional 11 to 13 months at a rate of $24,000 per day, less a 5% third-party brokerage commission. (7) Since this vessel was acquired with an existing time charter at an above-market rate, we allocated the purchase price between the vessel and an intangible asset for the value assigned to the above-market charterhire. This intangible asset is amortized as a reduction to voyage revenues over the remaining term of the charter, resulting in a daily rate of approximately $22,000 recognized as revenues. For cash flow purposes, we will continue to receive $26,500 per day until the charter expires. Voyage Expenses Voyage expenses include port and canal charges, fuel (bunker) expenses and brokerage commissions payable to unaffiliated parties. Port and canal charges and bunker expenses primarily increase in periods during which vessels are employed on voyage charters because these expenses are for the account of the vessel owner. For the years ended 2006 and 2005, we did not incur port and canal charges or any significant expenses related to the consumption of bunkers as part of our vessels overall expenses, because all of our vessels were employed under time charters that require the charterer to bear all of those expenses. As is common in the shipping industry, we pay brokerage commissions ranging from 1.25% to 5% of the total daily charterhire rate of each charter to brokers involved with arranging the charter. We believe that the amounts and the structures of our commissions are consistent with industry practices. For the years ended 2006 and 2005, voyage expenses were $4.7 million and $4.3 million, respectively, and consisted primarily of brokerage commissions paid to third parties. Vessel Operating Expenses Vessel operating expenses include crew wages and related costs, the cost of insurance, expenses relating to repairs and maintenance, the cost of spares and consumable stores, 26
29 tonnage taxes and other miscellaneous expenses. For the years ended 2006 and 2005, vessel operating expenses were $20.9 million and $15.1 million, respectively. The increase in vessel operating expenses year over year was due mostly to the fact that our operations had not fully ramped up in 2005 and our fleet expanded to an average of 17.4 vessels for the year ended 2006 as compared to an average of 14.8 vessels for the year ended The average daily vessel operating expenses for our fleet were $3,285 and $2,805 per day for the years ended December 31, 2006 and 2005, respectively. As 2005 was our initial period of operations for the majority of our fleet, we believe the year ended 2006 is more reflective of our daily vessel operating expenses. We believe daily vessel operating expenses are best measured for comparative purposes over a 12-month period in order to take into account all of the expenses that each vessel in our fleet will incur over a full year of operation. Based on management s estimates and budgets provided by our technical managers, we expect our vessels to have daily vessel operating expenses during 2007 of: Vessel Type Average Daily Budgeted Amount Budgeted Amount Panamax $3,900 Handymax 3,600 Handysize 3,490 Our vessel operating expenses, which generally represent fixed costs, will increase as a result of the expansion of our fleet. Other factors beyond our control, some of which may affect the shipping industry in general, including, for instance, developments relating to market prices for crewing, lubricants and insurance, may also cause these expenses to increase. General and Administrative Expenses We incur general and administrative expenses, including our onshore vessel-related expenses such as legal and professional expenses. Our general and administrative expenses also include our payroll expenses, including those relating to our executive officers, and rent. For the years ended 2006 and 2005, general and administrative expenses were $8.9 million and $4.9 million, respectively. General and administrative expenses increased as a result of the expansion of our fleet and the costs associated with running a public company for a full 12-month period, including the preparation of disclosure documents, legal and accounting costs, incremental director and officer liability insurance costs, incremental director and employee compensation, and costs related to compliance with the Sarbanes-Oxley Act of Additionally, management expects 2007 general and administrative expenses to increase, mainly due to increases associated with broad-based cash and non-cash compensation and costs associated with the planned offering of shares owned by Fleet Acquisition LLC. See Note 1 in Notes to Consolidated Financial Statements of this report describing the offering. Management Fees We incur management fees to third-party technical management companies that include such services as the day-to-day management of our vessels, including performing routine maintenance, attending to vessel operations and arranging for crews and supplies. For the years ended 2006 and 2005, management fees were $1.4 million and $1.5 million, respectively. Technical management fees are paid to our independent ship managers. Income from Derivative Instruments For the year ended 2006, income from derivative instruments was $0.1 million and is due solely to the gain in value during the time the 5.075% and 5.25% Swaps had not been designated against our debt. (See Interest Rate Swap Agreements and Forward Freight Agreements under the Liquidity and Capital Resource section for definitions of these Swaps.) For the year ended 2005, we had no derivative instruments in place that resulted in income from derivative instruments. Depreciation and Amortization We depreciate the cost of our vessels on a straight-line basis over the expected useful life of each vessel. Depreciation is based on the cost of the vessel less its estimated residual value. We estimate the useful life of our vessels to be 25 years, which we believe is common in the drybulk shipping industry. Furthermore, we estimate the residual values of our vessels to be based upon $175 per lightweight ton, which we believe is standard in the drybulk shipping industry. For the years ended 2006 and 2005, depreciation and amortization charges were $27.0 million and $22.3 million, respectively. The increase primarily was due to the growth in our fleet to an average of 17.4 vessels for the year ended 2006 as compared to an average of 14.8 vessels for the year ended Net Interest Expense For the years ended 2006 and 2005, net interest expense was $6.9 million and $14.3 million, respectively. Net interest expense consisted mostly of interest payments made under our New Credit Facility for the 2006 period. For the 2005 period, net interest expense consisted mostly of interest payments made under our Original Credit Facility and the New Credit Facility. Additionally, interest income as well as amortization of deferred financing costs related to our credit facilities is included in both periods. The decrease in net interest expense for 2006 versus 2005 was mostly a result of a charge of $4.1 million in 2005 which is associated with the write-down of unamortized deferred bank charges related to our Original Credit Facility, lower interest margin and a lower debt outstanding under our New Credit Facility. Year ended 2005 as compared to the period September 27, 2004 (date of inception) through 2004 For the purpose of discussing the results of our operations, we present results for the year ended 2005 and the period ended 2004, but do not compare the two periods due to the short period of operations of the fleet in In presenting the results for 2004, we refer to the period September 27 through December
Genco Shipping & Trading Limited
 Genco Shipping & Trading Limited Q1 2006 Earnings Call May 4, 2006 Forward Looking Statements "Safe Harbor" Statement Under the Private Securities Litigation Reform Act of 1995 This presentation contains
Genco Shipping & Trading Limited. Morgan Stanley Small Cap Executive Conference June 13, 2007
 Genco Shipping & Trading Limited Morgan Stanley Small Cap Executive Conference June 13, 2007 Forward Looking Statements "Safe Harbor" Statement Under the Private Securities Litigation Reform Act of 1995
Genco Shipping & Trading Limited
 Genco Shipping & Trading Limited Q3 2005 Earnings Call November 3 rd, 2005 Forward Looking Statements "Safe Harbor" Statement Under the Private Securities Litigation Reform Act of 1995 This presentation
Genco Shipping & Trading Limited
 Genco Shipping & Trading Limited JPMorgan Aviation & Transportation Conference March 19, 2008 Forward Looking Statements "Safe Harbor" Statement Under the Private Securities Litigation Reform Act of 1995
Genco Shipping & Trading Limited
 Genco Shipping & Trading Limited Q3 2007 Earnings Call November 1, 2007 Forward Looking Statements "Safe Harbor" Statement Under the Private Securities Litigation Reform Act of 1995 This presentation contains
Genco Shipping & Trading Limited. Annual Report 2012
 Genco Shipping & Trading Limited Annual Report 2012 Genco Shipping & Trading Limited Genco Shipping & Trading Limited transports iron ore, coal, grain, steel products and other drybulk cargoes along worldwide
Genco Shipping & Trading Limited. Genco Shipping & Trading Limited
 Genco Shipping & Trading Limited Genco Shipping & Trading Limited Investor Day December 11, 2006 Forward Looking Statements "Safe Harbor" Statement Under the Private Securities Litigation Reform Act of
Genco Shipping & Trading Limited. Goldman Sachs 3 rd Annual Shipping Conference November 28, 2006
 Genco Shipping & Trading Limited Goldman Sachs 3 rd Annual Shipping Conference November 28, 2006 Forward Looking Statements "Safe Harbor" Statement Under the Private Securities Litigation Reform Act of
Genco Shipping & Trading Limited
 Genco Shipping & Trading Limited Q4 2007 Earnings Call February 14, 2008 Forward Looking Statements "Safe Harbor" Statement Under the Private Securities Litigation Reform Act of 1995 This presentation
GENCO SHIPPING & TRADING LIMITED ANNUAL REPORT 2011
 GENCO SHIPPING & TRADING LIMITED ANNUAL REPORT 2011 481 Mt Million tons of Australian iron ore are forecast to be exported in 2012, a 12% increase from the previous year.1 41% Increase in Indian coal demand
Baltic Trading Limited
 Baltic Trading Limited Annual Report 2011 Baltic Trading Limited is a drybulk company focused on the spot charter market. Baltic Trading transports iron ore, coal, grain, steel products and other drybulk
Genco Shipping & Trading Limited. Stephens Inc. Fall Investment Conference November 18, 2008
 Genco Shipping & Trading Limited Stephens Inc. Fall Investment Conference November 18, 2008 Forward Looking Statements "Safe Harbor" Statement Under the Private Securities Litigation Reform Act of 1995
Genco Shipping & Trading Limited. Morgan Stanley Commodities and Shipping Conference June 9, 2009
 Genco Shipping & Trading Limited Morgan Stanley Commodities and Shipping Conference June 9, 2009 Forward Looking Statements "Safe Harbor" Statement Under the Private Securities Litigation Reform Act of
Genco Shipping & Trading Limited. Q Earnings Call February 25, 2009
 Genco Shipping & Trading Limited Q4 2009 Earnings Call February 25, 2009 Forward Looking Statements "Safe Harbor" Statement Under the Private Securities Litigation Reform Act of 1995 This presentation
UNITED STATES SECURITIES AND EXCHANGE COMMISSION Washington, D.C FORM 10-K/A
 UNITED STATES SECURITIES AND EXCHANGE COMMISSION Washington, D.C. 20549 FORM 10-K/A Amendment No. 2 x Annual Report Pursuant to Section 13 or 15(d) of the Securities Exchange Act of 1934 For the fiscal
11,760,000 Shares. Common Stock
 QuickLinks -- Click here to rapidly navigate through this document Filed Pursuant to Rule 424(b)(1) Registration No. 333-124718 PROSPECTUS 11,760,000 Shares Common Stock Genco Shipping & Trading Limited
Genco Shipping & Trading Baltic Trading Limited. Investor Presentation October 2010
 Genco Shipping & Trading Baltic Trading Limited Investor Presentation October 2010 Forward Looking Statements "Safe Harbor" Statement Under the Private Securities Litigation Reform Act of 1995 This presentation
Genco Shipping & Trading Limited Aviation and Transportation Conference September 13, 2011
 Genco Shipping & Trading Limited 2011 Aviation and Transportation Conference September 13, 2011 Forward Looking Statements "Safe Harbor" Statement Under the Private Securities Litigation Reform Act of
Genco Shipping & Trading Limited. Investor Presentation May 2012
 Genco Shipping & Trading Limited Investor Presentation May 2012 Forward Looking Statements "Safe Harbor" Statement Under the Private Securities Litigation Reform Act of 1995 This presentation contains
Genco Shipping & Trading Limited. Merrill Lynch Global Transportation June 18, 2008
 Genco Shipping & Trading Limited Merrill Lynch Global Transportation June 18, 2008 Forward Looking Statements "Safe Harbor" Statement Under the Private Securities Litigation Reform Act of 1995 This presentation
Genco Shipping & Trading Baltic Trading Limited Global Shipping Conference September 5, 2012
 Genco Shipping & Trading Baltic Trading Limited 2012 Global Shipping Conference September 5, 2012 Forward Looking Statements "Safe Harbor" Statement Under the Private Securities Litigation Reform Act of
Genco Shipping & Trading Limited. Q Earnings Call August 2, 2012
 Genco Shipping & Trading Limited Q2 2012 Earnings Call August 2, 2012 Forward Looking Statements "Safe Harbor" Statement Under the Private Securities Litigation Reform Act of 1995 This presentation contains
George Economou, the Company s Chairman and Chief Executive Officer of DryShips Inc., commented:
 DRYSHIPS INC. REPORTS SECOND QUARTER AND FIRST HALF 2007 RESULTS, THE ACQUISITION OF THREE ADDITIONAL VESSELS AND THE DISPOSAL OF ONE VESSEL August 21, 2007, Athens, Greece. DryShips Inc. (NASDAQ: DRYS),
DryShips Inc. Informational Roadshow NASDAQ: DRYS
 DryShips Inc. Informational Roadshow NASDAQ: DRYS June 2006 Disclaimer Forward-Looking Statements This presentation contains forward-looking statements within the meaning of applicable federal securities
GENCO SHIPPING & TRADING LIMITED (Exact name of registrant as specified in its charter)
") UNITED STATES SECURITIES AND EXCHANGE COMMISSION WASHINGTON, DC 20549 FORM 8-K CURRENT REPORT Pursuant to Section 13 OR 15(d) of The Securities Exchange Act of 1934 Date of Report (Date of earliest event
UNITED STATES SECURITIES AND EXCHANGE COMMISSION WASHINGTON, DC 20549 FORM 8-K CURRENT REPORT Pursuant to Section 13 OR 15(d) of The Securities Exchange Act of 1934 Date of Report (Date of earliest event
GLOBUS MARITIME LTD. Globus Maritime Limited Reports Financial Results for the Year Ended December 31, 2007
 Globus Maritime Limited Reports Financial Results for the Year Ended December 31, 2007 Athens, Greece, March 3, 2008. Globus Maritime Limited ("Globus" or "the Company"), (AIM: GLBS), a marine transportation
Genco Shipping & Trading Limited. Q Earnings Call February 28 th, 2018
 Genco Shipping & Trading Limited Q4 2017 Earnings Call February 28 th, 2018 Forward Looking Statements "Safe Harbor" Statement Under the Private Securities Litigation Reform Act of 1995 This presentation
DRYSHIPS REPORTS RESULTS FOR THE FOURTH QUARTER AND TWELVE MONTHS ENDED DECEMBER 31, 2007
 DRYSHIPS REPORTS RESULTS FOR THE FOURTH QUARTER AND TWELVE MONTHS ENDED DECEMBER 31, 2007 February 14, 2008, Athens, Greece. DryShips Inc. (NASDAQ: DRYS), a global provider of marine transportation services
DRYSHIPS INC. REPORTS FIRST QUARTER 2007 RESULTS
 DRYSHIPS INC. REPORTS FIRST QUARTER 2007 RESULTS May 29, 2007, Athens, Greece. DryShips Inc. (NASDAQ: DRYS), a global provider of marine transportation services for drybulk cargoes, today announced its
UBS Best of Americas Conference. Eagle Bulk Shipping Inc. 11 September Eagle Bulk Shipping Inc. DELIVERING SUSTAINABLE GROWTH
 Eagle Bulk Shipping Inc. UBS Best of Americas Conference 11 September 2008 DELIVERING SUSTAINABLE GROWTH Forward Looking Statements This presentation contains certain statements that may be deemed to be
Genco Shipping & Trading Limited. Capesize Acquisition Conference Call July 19, 2007
 Genco Shipping & Trading Limited Capesize Acquisition Conference Call July 19, 2007 Forward Looking Statements "Safe Harbor" Statement Under the Private Securities Litigation Reform Act of 1995 This presentation
Forward Looking Statements
 1 Forward Looking Statements 2 This presentation contains forward-looking statements (as defined in Section 27A of the Securities Exchange Act of 1933, as amended, and in the Section 21E of the Securities
Eagle Bulk Shipping Inc. 2Q 2008 Results Presentation. 7 August 2008
 Eagle Bulk Shipping Inc. 2Q 2008 Results Presentation 7 August 2008 Forward Looking Statements This presentation contains certain statements that may be deemed to be forward-looking statements within the
GLOBUS MARITIME LIMITED
 GLOBUS MARITIME LIMITED Globus Maritime Limited Reports Financial Results for the Quarter and Nine-Month Period Ended 2018 Athens, Greece, November 12, 2018, Globus Maritime Limited ( Globus, the Company,
UNITED STATES SECURITIES AND EXCHANGE COMMISSION Washington, D.C FORM 10-K
 UNITED STATES SECURITIES AND EXCHANGE COMMISSION Washington, D.C. 20549 FORM 10-K Annual Report Pursuant to Section 13 or 15(d) of the Securities Exchange Act of 1934 For the fiscal year ended December
GLOBUS MARITIME LIMITED
 GLOBUS MARITIME LIMITED Globus Maritime Limited Reports Financial Results for the Quarter and Six Months Ended June 30, 2013 Athens, Greece September 3, 2013, Globus Maritime Limited ("Globus," the Company,"
Excel Maritime Reports Results for the Third Quarter and Nine Month Period Ended September 30, 2006
 NEWS RELEASE for November 13, Contact: Investor Relations / Financial Media: Nicolas Bornozis President Capital Link, Inc. 230 Park Avenue Suite 1536 New York, NY 10160, USA Tel: (212) 661-7566 Fax: (212)
Eagle Bulk Shipping Inc. JPMorgan Aviation & Transportation Conference 19 March 2008
 Eagle Bulk Shipping Inc. JPMorgan Aviation & Transportation Conference 19 March 2008 Forward Looking Statements This presentation contains certain statements that may be deemed to be forward-looking statements
Seanergy Maritime Holdings Corp. Reports Financial Results for the First Quarter Ended March 31, 2018
 Seanergy Maritime Holdings Corp. Reports Financial Results for the First Quarter Ended March 31, 2018 Highlights of First Quarter 2018: Net revenues: $21.3 million in Q1 2018, up 60% compared to $13.3
GENCO SHIPPING & TRADING LIMITED (Exact name of registrant as specified in its charter)
") UNITED STATES SECURITIES AND EXCHANGE COMMISSION WASHINGTON, DC 20549 FORM 8-K CURRENT REPORT PURSUANT TO SECTION 13 OR 15(d) OF THE SECURITIES EXCHANGE ACT OF 1934 Date of Report (Date of earliest event
UNITED STATES SECURITIES AND EXCHANGE COMMISSION WASHINGTON, DC 20549 FORM 8-K CURRENT REPORT PURSUANT TO SECTION 13 OR 15(d) OF THE SECURITIES EXCHANGE ACT OF 1934 Date of Report (Date of earliest event
Navios Maritime Containers Inc. Reports Financial Results for the Fourth Quarter and Year Ended December 31, 2017
 Navios Maritime Containers Inc. Reports Financial Results for the Fourth Quarter and Year Ended December 31, Acquired seven containerships for $128.0 million Grew fleet by 50% in Q4 (14 to 21 vessels at
3 rd Quarter and 9 Months 2010 Financial Results
 3 rd Quarter and 9 Months 2010 Financial Results NASDAQ: SBLK November 2010 Safe Harbor Statement Except for the historical information contained herein, this presentation contains among other things,
Forward Looking Statements
 Eagle Bulk Shipping Inc. 3Q 2005 Results Presentation November 14, 2005 Forward Looking Statements This presentation contains certain statements that may be deemed to be forward-looking statements within
Safe Bulkers, Inc. Reports Fourth Quarter and Twelve Months 2014 Results and Declares Quarterly Dividend on Common Stock
 Safe Bulkers, Inc. Reports Fourth Quarter and Twelve Months 2014 Results and Declares Quarterly Dividend on Common Stock Monaco, Monaco February 26, 2015 -- Safe Bulkers, Inc. (the Company ) (NYSE: SB),
Genco Shipping & Trading Limited. Genco Unlimited On a course for success
 Genco Shipping & Trading Limited Genco Unlimited On a course for success October 2017 Forward Looking Statements "Safe Harbor" Statement Under the Private Securities Litigation Reform Act of 1995 This
GLOBUS MARITIME LTD. Globus Maritime Limited Reports Financial Results for the Fourth Quarter and Year Ended December 31, 2008
 Globus Maritime Limited Reports Financial Results for the Fourth Quarter and Year Ended December 31, 2008 Athens, Greece, March 20, 2009. Globus Maritime Limited ("Globus" or the Company"), (AIM: GLBS),
UNITED STATES SECURITIES AND EXCHANGE COMMISSION Washington, D.C FORM 6-K. Pyxis Tankers Inc.
 UNITED STATES SECURITIES AND EXCHANGE COMMISSION Washington, D.C. 20549 FORM 6-K REPORT OF FOREIGN PRIVATE ISSUER PURSUANT TO RULE 13a-16 OR 15d-16 OF THE SECURITIES EXCHANGE ACT OF 1934 For the month
Eagle Bulk Shipping Inc. 4Q 2005 Results Presentation
 Eagle Bulk Shipping Inc. 4Q 2005 Results Presentation March 7, 2006 Forward Looking Statements This presentation contains certain statements that may be deemed to be forward-looking statements within the
Safe Bulkers, Inc. Reports First Quarter 2012 Results and Declares Quarterly Dividend
 Safe Bulkers, Inc. Reports First Quarter 2012 Results and Declares Quarterly Dividend Athens, Greece May 8, 2012 -- Safe Bulkers, Inc. (the Company ) (NYSE: SB), an international provider of marine drybulk
BALTIC TRADING LIMITED. Annual Report 2013
 BALTIC TRADING LIMITED Annual Report 2013 Baltic Trading Limited is a drybulk company focused on the spot charter market. Baltic Trading s vessels transport core drybulk commodities such as iron ore, coal,
Golden Ocean Group Limited. Preliminary Results for the Financial Year Introduction
 Golden Ocean Group Limited Preliminary Results for the Financial Year 2004 Introduction Golden Ocean Group Limited ( Golden Ocean or the Company ) was incorporated as a wholly owned subsidiary of Frontline
Safe Bulkers, Inc. Reports Second Quarter and Six Months 2017 Results
 Safe Bulkers, Inc. Reports Second Quarter and Six Months 2017 Results Monaco July 26, 2017 -- Safe Bulkers, Inc. (the Company ) (NYSE: SB), an international provider of marine drybulk transportation services,
Looking Ahead: Key Themes for the Drybulk Market
 Marine Money Ship Finance Forum November 12 th, 2014 Looking Ahead: Key Themes for the Drybulk Market Forward Looking Statements This presentation contains certain statements that may be deemed to be forward-looking
TEEKAY TANKERS LTD. REPORTS THIRD QUARTER 2015 RESULTS
 TEEKAY TANKERS LTD. REPORTS THIRD QUARTER 2015 RESULTS Highlights Reported third quarter 2015 adjusted net income attributable to shareholders (1) of $40.3 million, or $0.30 per share, compared to $2.6
DryShips Inc. 3 rd Quarter and Nine Months Ended September 30, 2007 Earnings Presentation NASDAQ: DRYS
 3 rd Quarter and Nine Months Ended September 30, 2007 Earnings Presentation NASDAQ: DRYS November 7, 2007 Forward Looking Statements Matters discussed in this presentation may constitute forward-looking
Navios Maritime Partners L.P. Reports. Financial Results for the First Quarter Ended March 31, 2017
 Navios Maritime Partners L.P. Reports Financial Results for the First Quarter Ended 2017 Revenue: $42.4 million in Q1 Adjusted EBITDA: $25.9 million in Q1 No debt maturities until August 2020 Acquired
GLOBUS MARITIME LIMITED
 GLOBUS MARITIME LIMITED Globus Maritime Limited Reports Financial Results for the Quarter Ended March 31, 2017 Athens, Greece, July 6, 2017, Globus Maritime Limited ("Globus," the Company," we, or our
DryShips Inc. Informational Roadshow November/December 2005 NASDAQ: DRYS
 DryShips Inc. Informational Roadshow November/December 2005 NASDAQ: DRYS Disclaimer Forward-Looking Statements This presentation contains forward-looking statements within the meaning of applicable federal
Pangaea Logistics Solutions Ltd. Reports Financial Results for the Three Months and Year Ended December 31, 2017
 Pangaea Logistics Solutions Ltd. Reports Financial Results for the Three Months and Year Ended December 31, 2017 Company posts strong earnings after two years of industry turmoil NEWPORT, RI - March 21,
DRYSHIPS INC. REPORTS FINANCIAL AND OPERATING RESULTS FOR THE THIRD QUARTER 2016
 DRYSHIPS INC. REPORTS FINANCIAL AND OPERATING RESULTS FOR THE THIRD QUARTER 2016 November 9, 2016, Athens, Greece. DryShips Inc. (NASDAQ:DRYS), or DryShips or the Company, an international owner of drybulk
TEEKAY TANKERS LTD. REPORTS SECOND QUARTER 2015 RESULTS
 TEEKAY TANKERS LTD. REPORTS SECOND QUARTER 2015 RESULTS Highlights Reported second quarter 2015 adjusted net income attributable to shareholders(1) of $41.3 million, or $0.35 per share, compared to an
GLOBUS MARITIME LIMITED
 GLOBUS MARITIME LIMITED Globus Maritime Reports Financial Results for the Quarter and Six Months Ended June 30, 2012 Athens, Greece, September 10, 2012. Globus Maritime Limited ("Globus," the Company,"
GLOBUS MARITIME LIMITED
 GLOBUS MARITIME LIMITED Globus Maritime Limited Reports Financial Results for the Quarter Ended March 31, 2015 Athens, Greece June 22, 2015, Globus Maritime Limited ("Globus," the Company," we, or our
Genco Shipping & Trading Limited. Q Earnings Call November 6, 2015
 Genco Shipping & Trading Limited Q3 2015 Earnings Call November 6, 2015 Forward Looking Statements "Safe Harbor" Statement Under the Private Securities Litigation Reform Act of 1995 This presentation contains
GLOBUS MARITIME LIMITED
 GLOBUS MARITIME LIMITED Globus Maritime Reports Financial Results for the Third Quarter & Nine Months Ended September 30, 2011 Athens, Greece, November 21, 2011. Globus Maritime Limited ("Globus," the
Navios Maritime Containers Inc. Reports Financial Results for the First Quarter Ended March 31, 2018
 Navios Maritime Containers Inc. Reports Financial Results for the First Quarter Ended March 31, 2018 34% increase in fleet capacity YTD 2018 Acquired four containerships YTD 2018 for $129.0 million 59%
UNITED STATES SECURITIES AND EXCHANGE COMMISSION Washington, D.C FORM 6-K. Pyxis Tankers Inc.
 UNITED STATES SECURITIES AND EXCHANGE COMMISSION Washington, D.C. 20549 FORM 6-K REPORT OF FOREIGN PRIVATE ISSUER PURSUANT TO RULE 13a-16 OR 15d-16 UNDER THE SECURITIES EXCHANGE ACT OF 1934 For the month
Pioneer Marine Inc. Announces Third Quarter 2014 Results
 Pioneer Marine Inc. Announces Third Quarter 2014 Results MAJURO -- (Marketwired December 9, 2014) Pioneer Marine Inc. (OSLO-OTC: PNRM) ("Pioneer Marine," or the "Company,") a leading shipowner and global
4 th Quarter and FY 2013 Financial Results
 NASDAQ: SBLK 4 th Quarter and FY 2013 Financial Results March 2014 Safe Harbor Statement Except for the historical information contained herein, this presentation contains among other things, certain forward-looking
Navios Maritime Partners L.P. Reports. Financial Results for the Second Quarter and Six Months Ended June 30, 2017
 Navios Maritime Partners L.P. Reports Financial Results for the Second Quarter and s Ended Revenue: $92.4 million for the six months; $50.0 million in Q2 Adjusted EBITDA: $58.1 million for the six months;
Wachovia Transportation & Packaging Conference 8 September Eagle Bulk Shipping Inc. Eagle Bulk Shipping Inc. DELIVERING SUSTAINABLE GROWTH
 Eagle Bulk Shipping Inc. Wachovia Transportation & Packaging Conference 8 September 2008 DELIVERING SUSTAINABLE GROWTH Forward Looking Statements This presentation contains certain statements that may
Seeking Alpha Maritime Investor Forum Presentation. 19 June 2017
 Seeking Alpha Maritime Investor Forum Presentation 19 June 2017 Disclaimer This presentation contains certain statements that may be deemed to be forward-looking statements within the meaning of Section
Our common shares began trading under the symbol PXS on November 2, 2015.
 Pyxis Tankers Inc. Announces Financial Results for the Three Months and Twelve Months Ended December 31, 2015 Maroussi, Greece, March 2, 2016 Pyxis Tankers Inc. (NASDAQ Cap Mkts: PXS), an emerging growth
DRYSHIPS INC. REPORTS FINANCIAL AND OPERATING RESULTS FOR THE SECOND QUARTER 2016
 DRYSHIPS INC. REPORTS FINANCIAL AND OPERATING RESULTS FOR THE SECOND QUARTER 2016 August 8, 2016, Athens, Greece. DryShips Inc. (NASDAQ:DRYS), or DryShips or the Company, an international owner of drybulk
UNITED STATES SECURITIES AND EXCHANGE COMMISSION Washington, D.C FORM 6-K. Pyxis Tankers Inc.
 UNITED STATES SECURITIES AND EXCHANGE COMMISSION Washington, D.C. 20549 FORM 6-K REPORT OF FOREIGN PRIVATE ISSUER PURSUANT TO RULE 13a-16 OR 15d-16 UNDER THE SECURITIES EXCHANGE ACT OF 1934 For the month
Pioneer Marine Inc. Announces Financial Results for the Second Quarter and Six Months Ended June 30, 2018
 Pioneer Marine Inc. Announces Financial Results for the Second Quarter and Six 30, 2018 MAJURO, MARSHALL ISLANDS -- (GlobeNewswire August 28, 2018) Pioneer Marine Inc. and its subsidiaries (OSLO-OTC: PNRM)
Genco Shipping & Trading Limited. Q Earnings Call November 8 th, 2018
 Genco Shipping & Trading Limited Q3 2018 Earnings Call November 8 th, 2018 Forward Looking Statements "Safe Harbor" Statement Under the Private Securities Litigation Reform Act of 1995 This presentation
Pangaea Logistics Solutions Ltd. Reports Financial Results for the Quarter Ended March 31, 2018
 Pangaea Logistics Solutions Ltd. Reports Financial Results for the Quarter Ended March 31, 2018 Net income triples in transitioning market Announces ten year Arctic contract NEWPORT, RI - May 10, 2018
9 th Global Shipping & Logistics Conference
 9 th Global Shipping & Logistics Conference NASDAQ: SBLK September 2012 Safe Harbor Statement Except for the historical information contained herein, this presentation contains among other things, certain
Euroseas Ltd. Reports Results for the Year and Quarter Ended December 31, 2017
 Euroseas Ltd. Reports Results for the Year and Quarter Ended 2017 Maroussi, Athens, Greece March 5, 2018 Euroseas Ltd. (NASDAQ: ESEA) (the Company or Euroseas ), an owner and operator of drybulk and container
Q Financial Results. May 18, 2017
 Q1 2017 Financial Results May 18, 2017 DISCLAIMER FORWARD-LOOKING STATEMENTS & INFORMATION This presentation contains forward-looking statements and forward-looking information within the meaning of applicable
was RESULTS Q May 30, 2018
 was RESULTS Q1-2018 May 30, 2018 FORWARD-LOOKING STATEMENTS Matters discussed in this presentation may constitute forward-looking statements. The Private Securities Litigation Reform Act of 1995 provides
Scorpio Bulkers Inc. Q Earnings Supplementary Presentation April 23, 2018
 1 Scorpio Bulkers Inc. Q1 2018 Earnings Supplementary Presentation April 23, 2018 Safe Harbor Statement This document may contain forward-looking statements that reflects management s expectations for
EuroDry Ltd. Reports Results for the Nine-Month Period and Quarter Ended September 30, 2018
 Reports Results for the Nine-Month Period and Quarter 30, 2018 Maroussi, Athens, Greece November 15, 2018 (NASDAQ: EDRY, the Company or EuroDry ), an owner and operator of drybulk vessels and provider
Q Financial Results
 Q2 2015 Financial Results Management Team Polys Hajioannou Chairman and CEO Dr. Loukas Barmparis President Konstantinos Adamopoulos Chief Financial Officer Ioannis Foteinos Chief Operating Officer Forward
Safe Bulkers, Inc. Reports Third Quarter and Nine Months 2018 Results
 Safe Bulkers, Inc. Reports Third Quarter and Nine Months 2018 Results Monaco November 7, 2018 -- Safe Bulkers, Inc. (the Company ) (NYSE: SB), an international provider of marine drybulk transportation
DYNAGAS LNG PARTNERS LP REPORTS RESULTS FOR THE THREE MONTHS ENDED MARCH 31, 2018
 DYNAGAS LNG PARTNERS LP REPORTS RESULTS FOR THE THREE MONTHS ENDED MARCH 31, 2018 MONACO May 16, 2018 - Dynagas LNG Partners LP (NYSE: DLNG ) ( Dynagas Partners or the Partnership ), an owner and operator
DRYSHIPS INC. REPORTS FINANCIAL AND OPERATING RESULTS FOR THE FOURTH QUARTER OF 2017
 DRYSHIPS INC. REPORTS FINANCIAL AND OPERATING RESULTS FOR THE FOURTH QUARTER OF 2017 February 27, 2018, Athens, Greece. DryShips Inc. (NASDAQ:DRYS) ( DryShips or the Company ), a diversified owner of ocean
TORM REPORTS NINE MONTHS RESULTS IN LINE WITH EXPECTATIONS AND MAINTAINS OUTLOOK FOR THE YEAR.
 3. quarter 2002 A/S Dampskibsselskabet TORM Marina Park Sundkrogsgade 10 DK-2100 Copenhagen Ø Denmark Tel: +45 39 17 92 00 Fax: +45 39 17 93 93 Telex: 22315 TORM DK E-mail: Website: Comtext: mail@torm.dk
DRYSHIPS INC. REPORTS FINANCIAL AND OPERATING RESULTS FOR THE FOURTH QUARTER OF 2018
 DRYSHIPS INC. REPORTS FINANCIAL AND OPERATING RESULTS FOR THE FOURTH QUARTER OF 2018 February 28, 2019, Athens, Greece, DryShips Inc. (NASDAQ:DRYS) ( DryShips or the Company ), a diversified owner and
TEEKAY SHIPPING CORPORATION Bayside House, Bayside Executive Park, West Bay Street & Blake Road P.O. Box AP-59212, Nassau, Bahamas EARNINGS RELEASE
 TEEKAY SHIPPING CORPORATION Bayside House, Bayside Executive Park, West Bay Street & Blake Road P.O. Box AP-59212, Nassau, Bahamas EARNINGS RELEASE TEEKAY REPORTS FIRST QUARTER RESULTS Highlights Reported
Safe Bulkers, Inc. Reports Third Quarter and Nine Months 2016 Results
 Safe Bulkers, Inc. Reports Third Quarter and Nine Months 2016 Results Monaco October 31, 2016 -- Safe Bulkers, Inc. (the Company ) (NYSE: SB), an international provider of marine drybulk transportation
2010 Annual Report. Aegean Marine Petroleum Network 2010 Annual Report
 Aegean Marine Petroleum Network 2010 Annual Report Aegean Marine Petroleum Network 2010 Annual Report Corporate Profile Aegean Marine Petroleum Network Inc. is a leading international marine fuel logistics
Pioneer Marine Inc Announces Second Quarter 2014 Results
 Pioneer Marine Inc Announces Second Quarter 2014 Results MAJURO -- (Marketwired August 29, 2014) Pioneer Marine Inc. (OSLO-OTC: PNRM) ("Pioneer Marine," or the "Company") a leading shipowner and global
DRYSHIPS INC. REPORTS FINANCIAL AND OPERATING RESULTS FOR THE FIRST QUARTER OF 2018
 DRYSHIPS INC. REPORTS FINANCIAL AND OPERATING RESULTS FOR THE FIRST QUARTER OF 2018 May 8, 2018, Athens, Greece. DryShips Inc. (NASDAQ:DRYS) ( DryShips or the Company ), a diversified owner and operator
First Half and Second Quarter 2012 Financial Results
 First Half and Second Quarter 2012 Financial Results NASDAQ: SBLK August 2012 Safe Harbor Statement Except for the historical information contained herein, this presentation contains among other things,
DryShips Inc. NASDAQ: DRYS George Economou, CEO. Jefferies & Co. 4 th Annual Shipping Conference, New York, September, 2007
 DryShips Inc. NASDAQ: DRYS George Economou, CEO Jefferies & Co. 4 th Annual Shipping Conference, New York, 25-26 September, 2007 Forward Looking Statements Matters discussed in this presentation may constitute
KNOT OFFSHORE PARTNERS LP EARNINGS RELEASE INTERIM RESULTS FOR THE PERIOD ENDED MARCH 31, 2017
 Highlights KNOT OFFSHORE PARTNERS LP EARNINGS RELEASE INTERIM RESULTS FOR THE PERIOD ENDED MARCH 31, 2017 For the three months ended March 31, 2017, KNOT Offshore Partners LP ( KNOT Offshore Partners or
Genco Shipping & Trading Limited. Q Earnings Call November 2 nd, 2017
 Genco Shipping & Trading Limited Q3 2017 Earnings Call November 2 nd, 2017 Forward Looking Statements "Safe Harbor" Statement Under the Private Securities Litigation Reform Act of 1995 This presentation
Navios Maritime Partners L.P. Reports Financial Results for the Second Quarter and Six Months Ended June 30, 2018
 Navios Maritime Partners L.P. Reports Financial Results for the Second Quarter and s Ended Revenue: $58.2 million in Q2; $111.2 million for the six months Net cash from operating activities: $24.8 million