Dorsey, Wright & Associates
|
|
|
- Lionel Rose
- 5 years ago
- Views:
Transcription


1 Dorsey, Wright & Associates Technical Insights, Powerful Solutions Amy Kemp Senior Analyst Boulder Springs Drive, Suite 150; Richmond, VA P:


 Virtus Equity Trend Fund (VAPAX) Virtus Global Equity Trend Fund (VGPAX)")
 First Trust Dorsey Wright Dynamic Focus 5 ETF (FVC) PowerShares DWA Momentum Portfolio (PDP) PowerShares DWA Developed Momentum Portfolio (PIZ) PowerShares DWA Emerging Momentum")
 PowerShares DWA Consumer Staples Portfolio (PSL) PowerShares DWA Energy Momentum Portfolio (PXI) PowerShares DWA Financial Momentum Portfolio (PFI) PowerShares DWA")
2 DWA Background: Founded January 1987 Research Services: Daily Equity & Market Analysis Report : Daily research report covering global capital markets, focusing on tactical asset rotation and risk management Extensive technical analysis website available with over 7,000 domestic stocks, 19,000 international stocks, 20,000 mutual funds, and 1,500 ETFs charted on a Point & Figure basis 30+ different Guided ETF Model Portfolios, covering the scope of asset classes and ETF providers Weekly ETF Reports featuring each of the 30 guided models DWA Media produces its own multimedia (video) presentations and weekly podcasts D.A.L.I.: Asset Allocation Guidance based on relative strength analysis across, and among, asset classes Tactical Tilt Models: Turn-key 3 rd party ETF model management Most Recently Published Book by DWA: Point & Figure Charting, 4 th Edition Money Management Services & Products Mutual Funds: Virtus Sector Trend Fund (PWBAX) Virtus Equity Trend Fund (VAPAX) Virtus Global Equity Trend Fund (VGPAX) Virtus Multi-Asset Trend Fund (VAAAX) Arrow DWA Balanced Fund (DWAFX) Arrow DWA Tactical Fund (DWTFX) Exchange Traded Funds: First Trust Dorsey Wright Focus 5 ETF (FV) First Trust Dorsey Wright Int l Focus 5 ETF (IFV) First Trust Dorsey Wright Dynamic Focus 5 ETF (FVC) PowerShares DWA Momentum Portfolio (PDP) PowerShares DWA Developed Momentum Portfolio (PIZ) PowerShares DWA Emerging Momentum Portfolio (PIE) PowerShares DWA SmallCap Momentum Portfolio (DWAS) PowerShares DWA NASDAQ Momentum Portfolio (DWAQ) PowerShares DWA Basic Materials Momentum Portfolio (PYZ) PowerShares DWA Consumer Cyclicals Momentum Portfolio (PEZ) PowerShares DWA Consumer Staples Portfolio (PSL) PowerShares DWA Energy Momentum Portfolio (PXI) PowerShares DWA Financial Momentum Portfolio (PFI) PowerShares DWA Healthcare Momentum Portfolio (PTH) PowerShares DWA Industrials Momentum Portfolio (PRN) PowerShares DWA Technology Momentum Portfolio (PTF) PowerShares DWA Utilities Momentum Portfolio (PUI) PowerShares DWA Tactical Sector Rotation Portfolio (DWTR) PowerShares DWA Tactical Multi-Asset Income Portfolio (DWIN) Arrow DWA Tactical ETF (DWAT) Unit Investment Trusts: First Trust Dorsey Wright RS Dividend Trust First Trust Dorsey Wright RS Top 50 Trust SmartTrust Dorsey Wright Int l Momentum Trust 2


3 Must be able to navigate through both Bull and Bear markets. 3
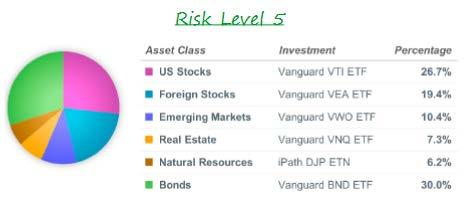
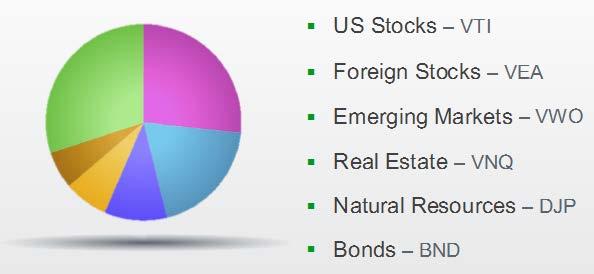
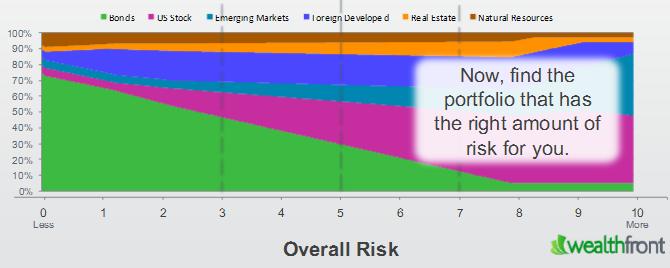

4 Traditional Asset Allocation Rinse Wash Rebalance Mean Variance Optimization Source: wealthfront.com 4

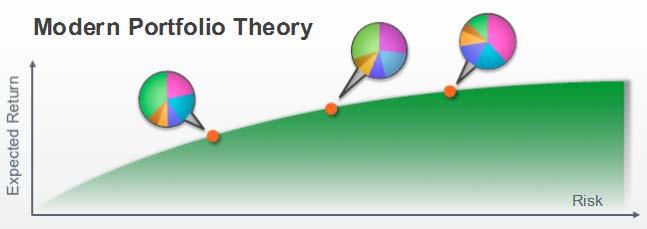
5 A Few Practical Considerations Modern Portfolio Theory is predicated upon academic observations that clients don t often adhere to in reality Strategic Allocation is free on the internet. In the absence of value, the only consideration is price. MPT offers no means for separating one s self from other Financial Advisors. 5


6 Our Game Plan The Point & Figure Methodology Trend Analysis Measuring Direction of Movement The DWA Evaluation Process Supply & Demand Relative Strength Measuring Magnitude of Movement 6


7 Relative Strength Research The premier anomaly is momentum: stocks with low returns over the last year tend to have low returns for the next few months and stocks with high past returns tend to have high future returns. Eugene Fama & Kenneth French ( Dissecting Anomalies June 2007) Source: Tactical Capital, from Morningstar Data The relative strength strategy is NOT a guarantee. There may be times where all investments and strategies are unfavorable and depreciate in value. Investors cannot invest directly in indexes, which have no fees. Past performance is no guarantee of future returns. Potential for profits is accompanied by possibility of loss. Copyright Dorsey, Wright & Associates, LLC. For Financial Professional Use Only. Not For Use With The Public. 4


8 Relative Strength Calculation All major sports have a ranking system. The Point & Figure Relative Strength tool is the ranking system we use for stocks and ETFs. Daily Calculation: Stock X 100 = Relative Strength Index Reading This reading is plotted on a Point & Figure chart which then tells us whether we can expect that stock or ETF to outperform or underperform the base index.

9 Point & Figure Method: The Most Basic Patterns Double Top Double Bottom 45 O 45 X X O X O X O O X O X O O X O O O X X S 40 O X 40 X O O X X O O X X O O X X O O X X O 35 O B 35 X O O X X X O X O X X O X O X X O O X
 With Positive RS")
 SBUX: 943.")
 SBUX: -67.")


10 Starbucks (SBUX) vs. S&P Equal Weighted Index (SPXEWI) With Positive RS (4/7/1999 2/20/2007) SBUX: % SPXEWI: 87.55% SPX: 10.01% With Positive RS... (3/16/2009 4/29/2016) SBUX: % SPXEWI: % SPX: % With Negative RS (2/20/2007 3/16/2009) SBUX: % SPXEWI: % SPX: % This example is presented for illustrative purposes only and does not represent a past or present recommendation. The performance numbers are price returns, not inclusive of dividends, fees, or other expenses. Investors cannot invest directly in an Index like the SPX or SPXEWI, indexes have no fees. Past performance is not indicative of future results. Potential for profits is accompanied by possibility of loss 10


11 Stocks vs Bonds Start Date When the RS Chart is on a buy signal, it suggests outperformance by the numerator (i.e., SPX). End Date Signal SPX AGG 11/22/00 7/31/03 Sell % 23.16% 7/31/03 7/15/08 Buy 22.68% 1.84% 7/15/08 6/5/09 Sell % % 6/5/09 2/11/2016 Buy 94.56% 9.99% Buy and hold SPX: 38.32% Buy and Hold AGG: 37.01% Switching: % RS Signal: Buy = Outperformance of SPX to Bonds Sell = Underperformance of SPX to Bonds This example is presented for illustrative purposes only, and does not represent a past or present recommendation. Performance of the switching strategy is the result of back-testing. Back-tested performance results have certain limitations. Such results do not represent the impact of material economic and market factors might have on an investment advisor s decision-making process if the advisor were actually managing client money. Back-testing performance also differs from actual performance because it is achieved through retroactive application of a model investment methodology designed with the benefit of hindsight. The performance numbers above are pure price returns, not inclusive of dividends, fees, or all transaction costs. Investors cannot invest directly in an Index, like the S&P 500 Index (SPX), and index performance numbers do not include fees. Past performance is not indicative of future results. Potential for profits is accompanied by possibility of loss. 11
12 Dynamic Asset Level Investing (DALI) Tool DALI evaluates the supply and demand forces of asset classes, and ranks them from strongest to weakest based on their relative strength score. Step One: Create Inventory US Equities Commodities Foreign Currencies Int l Equities Fixed Income Cash Step Two: Relative Strength Analysis Step Three: Rank Each Asset Class 12


13 Current DALI Perspective Data as of 5/2/2016 Tactical Tilting is now focused toward Fixed Income due to the recent change in our DALI Tool. This example is presented for illustrative purposes only, and does not represent a past or present recommendation. The performance numbers above are pure price returns, not inclusive of dividends, fees, or all transaction costs. Investors cannot invest directly in an Index, like the S&P 500 Index (SPX), and index performance numbers do not include fees. Past performance is not indicative of future results. Potential for profits is accompanied by possibility of loss. Copyright Dorsey, Wright & Associates, LLC. For Financial Professional Use Only. Not For Use With The Public. 13


14 Step 2: Tactical Tilting Strategic Allocation Tactical Guidance Strategic Pitfalls Rigid Guidelines Unresponsive to trend changes Can stay wrong for long periods of time Tactical Tilt Rules-based Respects boundaries Adapts to leadership change Tactical Pitfalls Emotional Over-rides Counter-intuitive to implement Can lead to highly focused exposure 14

15 Step 1: Strategic Boundaries The Tilt allocation concept is about facilitating the strategic allocation framework to succeed in a truly tactical investment world. Strategic Boundaries Commodity Domestic Intl. Eqty Currency Fix Inc. Cash Eqty MIN 0% 10% 10% 0% 10% 0% MAX 20% 80% 30% 20% 40% 30% Commodity Domestic Intl. Eqty Currency Fix Inc. Cash Eqty MIN 0% 20% 5% 0% 20% 0% MAX 10% 75% 25% 10% 60% 33% Commodity Domestic Intl. Eqty Currency Fix Inc. Cash Eqty MIN 0% 0% 0% 0% 40% 0% MAX 10% 40% 20% 10% 80% 50% Benchmark Aggressive 80% Stocks Tilt / 20% Allocation Bonds Benchmark Moderate 60% Stocks Tilt / 40% Allocation Bonds Conservative Benchmark 40% Stocks Tilt / 60% Allocation Bonds This example is presented for illustrative purposes only and does not represent a past or present recommendation. 15


16 The Allocation Process 45% of your moderate allocation is accounted for at all times. The remaining 55% is allocated tactically based on DALI rankings. The remaining 15% is added to US Equities With Fixed Income now in the #1 spot, you add 40% to your 20% minimum to reach your maximum boundary of 60%. This example is presented for illustrative purposes only, and does not represent a past or present recommendation. 16
17 100% Tactical Tilt Moderate Allocation Strategy Historic Asset Class Weighting Based Upon Tactical Tilt Methodology 90% 80% 70% 60% 50% 40% 30% 20% 10% 0% Domestic Equity (%) Int'l Equities (%) Fixed Income (%) Commodities (%) Currency (%) Cash (%) Year 1 Year 2 Year 3 Year 4 Year 5 Year 6 Year 7 Year 8 Year 9 Year 10 Year 11 Year 12 Year 13 Allocation data prior to Index inception (5/25/2012) is the result of back-testing. Back-tested results are hypothetical (they do not reflect trading in actual accounts) and are provided for informational purposes to illustrate the effects of the strategy during a specific period. Back-tested results have certain limitations. Such results do not represent the impact of material economic and market factors might have on an investment advisor s decision making process if the advisor were actually managing client money. Back-testing performance also differs from actual performance because it is achieved through retroactive application of a model investment methodology designed with the benefit of hindsight. 17


18 A Lesson in Adaptation DALI Rankings: 6/8/08 DALI Rankings: 9/2/08 Source: The Economist, June 8 th 2008 Lehman : 9/15/08 The examples presented above are for illustrative purposes only and do not represent past or present recommendations. 18


19 Today s Outlook for Equities Data as of 5/2/

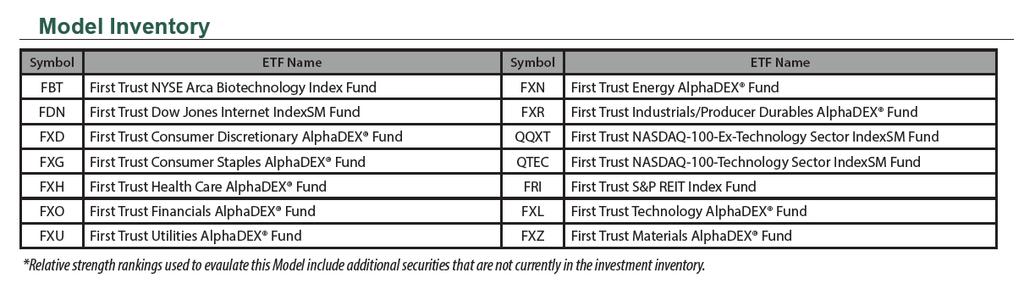
20 The Focus Five Model 20
 3/4/16-4/29/16 Symbol Return FXN 14.98% FXH 5.")


21 First Trust Energy AlphaDEX Fund (FXN) versus First Trust Health Care AlphaDEX Fund (FXH) First Trust Technology AlphaDEX Fund (FXL) 3/4/16-4/29/16 Symbol Return FXN 14.98% FXH 5.47% 3/7/16-4/29/16 Symbol Return FXN 9.49% FXL -0.19% The examples on this slide are presented for illustrative purposes only, and do not represent a past or present recommendation. The performance numbers above are price returns, not inclusive of dividends or all transaction costs. Past performance is not indicative of future results. Potential for profits is accompanied by possibility of loss 21

22 The Focus Five Model Matrix ETF Matrix Function: Summation of big RS wrestling match between First Trust sector line-up Focus buying on top quartile Hold position until RS deteriorates sufficiently Matrix rankings as of 4/29/2016 This example is presented for illustrative purposes only, and does not represent a past or present recommendation. The relative strength strategy is NOT a guarantee. There may be times where all investments and strategies are unfavorable and depreciate in value. 22

23 **Model inception date is October 21, Performance data after model inception date is model data. The Model s NET numbers reflect a theoretical annual management fee of 1.5%, deducted quarterly. This is not a fee charged by Dorsey Wright. Management fees may vary. Neither the returns for the Model nor the benchmark include the reinvestment of dividends and may not include all transaction costs. Performance data does not reflect the material impact economic and market factors might have on an investment advisor s decision making process if the advisor were actually managing client money. Past performance is not indicative of future results. Potential for profits is accompanied by possibility of loss. 23
24 Hypothetical Growth of $100k Portfolios (Data 1/30/2000 4/30/2016) $600,000 $500,000 S&P 500 Index 60/40 Benchmark Moderate Tactical Tilt (w/ Proxy ETFs) Moderate Tactical Tilt Moderate Tactical Tilt (PROMOD): % $400,000 $300,000 $200,000 Moderate Tactical Tilt (w/ Proxy ETFs): 94.84% $100,000 SPX: 48.11% $0 DWA6040: 42.00% Inception date of Dorsey Wright Tactical Tilt Models is 5/25/2012. Back-tested performance is hypothetical (it does not reflect trading in actual accounts) and is provided for informational purposes to illustrate the effects of the strategy during a specific period. Back-tested performance results have certain limitations. Such results do not represent the impact of material economic and market factors might have on an investment advisor s decision making process if the advisor were actually managing client money. Back-testing performance also differs from actual performance because it is achieved through retroactive application of a model investment methodology designed with the benefit of hindsight. All performance numbers are price returns for Models and Passive Benchmarks, not inclusive of dividends, management fees or all potential transaction costs. Investors cannot invest directly in the DWA6040 Index. It is an internal benchmark created and maintained by Dorsey Wright. Past performance not indicative of future results. Potential for profits accompanied by possibility of loss. 24

25 Model History & Back-testing Tactical Tilt portfolios produced positive absolute & relative returns in , though market conditions became more tenuous early in 2016, and the portfolios lagged. Performance numbers prior to 5/25/2012 are the result of back-testing. Performance numbers following that date are model performance numbers.back-tested performance is hypothetical (it does not reflect trading in actual accounts) and is provided for informational purposes to illustrate the effects of the strategy during a specific period. Back-tested performance results have certain limitations. Back-testing performance differs from actual performance because it is achieved through retroactive application of a model investment methodology designed with the benefit of hindsight. Performance results (both backtested and model returns) do not represent the impact of material economic and market factors might have on an investment advisor s decision making process if the advisor were actually managing client money. Past performance is not indicative of future results. Potential for profits is accompanied by possibility of loss. 25

26 Tactical Tilt Performance Fact Sheet A logical, organized, portfolio construction process guided by relative strength can produce attractive outcomes (after fees) without taking unreasonable risk to do so. Model Returns do not reflect the actual returns of any single client account. Fees and Returns vary from one account to the next. Returns of the strategies do not include dividends or all potential transaction costs. Model performance data does not represent the impact of material economic and market factors might have on an investment advisor s decision making process if the advisor were actually managing client money. The relative strength strategy is NOT a guarantee. There may be times where all investments and strategies are unfavorable and depreciate in value. Back-tested performance is hypothetical (it does not reflect trading in actual accounts) and is provided for informational purposes to illustrate the effects of the strategy during a specific period. Back-tested performance results have certain limitations. Such results do not represent the impact of material economic and market factors might have on an investment advisor s decision making process if the advisor were actually managing client money. Back-testing performance also differs from actual performance because it is achieved through retroactive application of a model investment methodology designed with the benefit of hindsight. 26
27 100% 90% Tactical Tilt: Rewarding Discipline Frequency of Excess Positive Returns Moderate Tilt Allocation vs. DWA6040 Updated Sept % 92% 92% 92% 100% 100% 80% 76% 70% 60% 65% 50% 40% 35% 30% 24% 20% 10% 12% 8% 8% 8% 0% 1 Month Comparison 3 Month Comparison 6 Month 12 Month Comparison Comparison Moderate Tilt Outperforms 18 Month 24 Month Comparison Comparison DWA6040 Outperforms 36 Month Comparison 0% 0% 60 Month Comparison Inception date of Dorsey Wright Tactical Tilt Models is 5/25/2012. Back-tested performance is hypothetical (it does not reflect trading in actual accounts) and is provided for informational purposes to illustrate the effects of the strategy during a specific period. Back-tested performance results have certain limitations. Such results do not represent the impact of material economic and market factors might have on an investment advisor s decision making process if the advisor were actually managing client money. Back-testing performance also differs from actual performance because it is achieved through retroactive application of a model investment methodology designed with the benefit of hindsight. All performance numbers are price returns for Models and Passive Benchmarks, not inclusive of dividends, management fees or all potential transaction costs. Investors cannot invest directly in the DWA6040 Index. It is an internal benchmark created and maintained by Dorsey Wright. Past performance not indicative of future results. Potential for profits accompanied by possibility of loss. 27

28 Sign up for a 21 day free trial, and enjoy full access to Dorsey Wright s equity research platform, including the following popular features: Daily Equity & Market Report a comprehensive daily report Dynamic Asset Level Investing (D.A.L.I.) tool an asset allocation tool Guided Model Portfolios Matrix Plus relative strength tool Global Charting and Alert System covering over 30,000 stocks and funds Portfolio Management and Evaluation tools Multimedia offerings webinars, podcasts, and educational tools Call us at (804) Or visit

29 Tactical Tilt Disclosures 29
30 Disclosures Some performance information presented is the result of back-tested performance. Back-tested performance is hypothetical (it does not reflect trading in actual accounts) and is provided for informational purposes to illustrate the effects of the strategy during a specific period. Back-tested performance results have certain limitations. Back-testing performance differs from actual performance because it is achieved through retroactive application of a model investment methodology designed with the benefit of hindsight. Model performance data as well as back-tested performance do not represent the impact of material economic and market factors might have on an investment advisor s decision making process if the advisor were actually managing client money. Dorsey, Wright & Associates, LLC (collectively, with is parent company and affiliates DWA ) believes the data used in the testing to be from credible, reliable sources, however; DWA makes no representation or warranties of any kind as to the accuracy of such data. The relative strength strategy is NOT a guarantee. There may be times where all investments and strategies are unfavorable and depreciate in value. Relative Strength is a measure of price momentum based on historical price activity. Relative Strength is not predictive and there is no assurance that forecasts based on relative strength can be relied upon. Unless otherwise stated, or marked total return, the returns of the strategies do not include dividends for stocks or ETFs. Unless otherwise stated, returns of the strategies do not include all fees or transaction costs. Past performance, hypothetical or actual, does not guarantee future results. In all securities trading there is a potential for loss as well as profit. It should not be assumed that recommendations made in the future will be profitable or will equal the performance as shown. Investors should have long-term financial objectives. The information contained herein has been prepared without regard to any particular investor s investment objectives, financial situation, and needs. Accordingly, investors should not act on any recommendation (express or implied) or information in this material without obtaining specific advice from their financial advisors and should not rely on information herein as the primary basis for their investment decisions. Information contained herein is based on data obtained from recognized statistical services, issuer reports or communications, or other sources believed to be reliable ( information providers ). However, such information has not been verified by DWA or the information provider and DWA and the information providers make no representations or warranties or take any responsibility as to the accuracy or completeness of any recommendation or information contained herein. DWA and the information provider accept no liability to the recipient whatsoever whether in contract, in tort, for negligence, or otherwise for any direct, indirect, consequential, or special loss of any kind arising out of the use of this document or its contents or of the recipient relying on any such recommendation or information (except insofar as any statutory liability cannot be excluded). Any statements nonfactual in nature constitute only current opinions, which are subject to change without notice. Neither the information nor any opinion expressed shall constitute an offer to sell or a solicitation or an offer to buy any securities, commodities or exchange traded products. This document does not purport to be complete description of the securities or commodities, markets or developments to which reference is made. Each investor should carefully consider the investment objectives, risks and expenses of any Exchange-Traded Fund ("ETF") prior to investing. Before investing in an ETF investors should obtain and carefully read the relevant prospectus and documents the issuer has filed with the SEC. ETF's may result in the layering of fees as ETF's impose their own advisory and other fees. To obtain more complete information about the product the documents are publicly available for free via EDGAR on the SEC website ( 30
Technical Insights, Powerful Solutions
 Nasdaq Dorsey Wright Technical Insights, Powerful Solutions CONTENTS / 3 Our Company 4 Our Mission 4 Our Clients 5 Our Research Methodology 5 A Road Map for Investing 5 Dorsey Wrignt's Presence on Wall
Dorsey, Wright & Associates
 Dorsey, Wright & Associates Alpha Generation With ETFs Tom Dorsey President, Founder tom@dorseywright.com www.dorseywright.com P: 804-320-8511 1 For Financial Professional Use Only. Not For Use With The
GLOBAL MACRO STRATEGY: CAPITALIZING ON GLOBAL TRENDS
 GLOBAL MACRO STRATEGY: CAPITALIZING ON GLOBAL TRENDS John Lewis, CMT Dorsey Wright Money Management Dorsey, Wright & Associates, a Nasdaq Company Joseph Barrato CEO, Owner Arrow Investment Advisors, LLC
ETF.com Webinar: H2O Investing: Combining the Best Elements Within Smart Beta
 ETF.com Webinar: H2O Investing: Combining the Best Elements Within Smart Beta Sponsored by: Panelists: Dave Gedeon Vice President Nasdaq Jay Gragnani Vice President Dorsey Wright & Associates Moderator:
March 5, 2018 Form ADV Part 2A and 2B Investment Advisor Brochure and Brochure Supplement
 Item 1: Cover Page March 5, 2018 Form ADV Part 2A and 2B Investment Advisor Brochure and Brochure Supplement Name of Firm Dorsey, Wright & Associates, LLC Address 1011 Boulder Springs Drive, Suite 150,
Dorsey Wright Sector 4 Index Methodology
 Dorsey Wright Sector 4 Index Methodology Index Description The Dorsey Wright Sector 4 Index selects up to four exchange-traded funds from the PowerShares DWA Momentum Sector line-up of ETFs. The objective
Technical Insights, Powerful Solutions
 Technical Insights, Powerful Solutions CONTENTS Our Company 3 Our Mission 4 Our Clients 4 Our Research Methodology 5 A Road Map for Investing 6 Dorsey Wright s Presence on Wall Street 6 Our Research Platform
Point & Figure Basics
 DORSEY WRIGHT Point & Figure Basics Technical Insights, Powerful Solutions Presented by Nasdaq Dorsey Wright Our Research Methodology Simple Economics Simply stated, Nasdaq Dorsey Wright focuses on the
Why Tactical Portfolio Management?
 Why Tactical Portfolio Management? A long-term perspective of the Dow Jones Industrial Average since 1896 reveals the reality that there are extended periods of time in which the US equity market will
Dorsey Wright Global Technical Leaders Index Methodology
 Dorsey Wright Global Technical Leaders Index Methodology Index Description The Dorsey Wright Global Technical Leaders Index invests in up to four exchange-traded funds from the PowerShares DWA Momentum
Dorsey Wright Multi-Factor Global Equity Index Methodology
 Dorsey Wright Multi-Factor Global Equity Index Methodology Index Description The Dorsey Wright Multi-Factor Global Equity Index seeks to provide global equity exposure by selecting up to eight exchange-traded
Dorsey Wright Dynamic U.S. Sector Focus Five Index Methodology
 Dorsey Wright Dynamic U.S. Sector Focus Five Index Methodology Index Description The Dorsey Wright Dynamic U.S. Sector Focus Five Index selects five exchange-traded funds from the First Trust Portfolios
International Technical Leaders: Developed and Emerging ETFs Celebrate 10-Year Anniversary
 International Technical Leaders: Developed and ETFs Celebrate 10-Year Anniversary Summing up a Strong 2017 and analyzing historical returns for International CHARLIE COLEMAN, ASSOCIATE PORTFOLIO MANAGER,
Don't Underestimate the Power of International Buybacks
 Don't Underestimate the Power of International s International companies have continued to benefit from quantitative easing policies that strengthen corporate balance sheets and provide the necessary cash
AlphaSolutions Sector Rotation Model
 AlphaSolutions Sector Rotation Model An investment model based on trending and momentum strategies Portfolio Goals Primary: Seeks long term growth of capital by investing in highranked U.S. Equity Sectors
TOTAL RETURN MARCH Newfound Case ID:
 TOTAL RETURN MARCH 2015 Newfound Case ID: 3377049 1 THE NEWFOUND MISSION Newfound Research s product suite has been designed to balance the desire to pursue growth with the need to avoid large drawdowns.
December 31, June 30,
 A long-term perspective of the Dow Jones Industrial Average since 1896 reveals the reality that there are extended periods of time in which the US equity market will trend generally upwards, and also lengthy
AlphaSolutions Blended Bull/Calendar
 AlphaSolutions Blended Bull/Calendar An investment model based on trending strategies coupled with market analytics for downside risk control with predetermined investment periods Portfolio Goals Primary:
TARGET EXCESS YIELD SUITE
 TARGET EXCESS YIELD SUITE MARCH 2015 Newfound Case ID: 3377056 1 THE NEWFOUND MISSION Newfound Research s product suite has been designed to balance the desire to pursue growth with the need to avoid large
AlphaSolutions Reduced Volatility Bull-Bear
 AlphaSolutions Reduced Volatility Bull-Bear An investment model based on trending strategies coupled with market analytics for downside risk control Portfolio Goals Primary: Seeks long term growth of capital
AlphaSolutions Momentum High Equity Model
 AlphaSolutions Momentum High Equity Model An investment model based on trending and momentum strategies Portfolio Goals Primary: Seeks long term growth of capital by investing in highranked Global Equity
The Q2 Factor Winner? Small Cap.
 The Q2 Factor Winner? Small Cap. July 23, 2018 by Nick Kalivas of Invesco As global risks grow, factor diversification may help investors stay prepared With fears of a trade war looming over global large-cap
How to Assess Real Exchange Rate Overvaluation
 JANUARY 2018 INTERNATIONAL EQUITY WHITEPAPER How to Assess Real Exchange Rate Overvaluation Leila Heckman, Ph.D., Founder John Mullin, Ph.D., Chief Strategist For More Information (917) 386-6261 www.heckmanglobal.com
Trade Signals Short-term Sentiment Says Buy, Trend Evidence Positive, Bonds are a Different Story
 cmgwealth.com http://www.cmgwealth.com/ri/trade-signals-short-term-sentiment-says-buy-trend-evidence-positive-bonds-are-a-different-story/ Trade Signals Short-term Sentiment Says Buy, Trend Evidence Positive,
The AdvisorShares Dorsey Wright Short ETF. Ticker: DWSH.
 The AdvisorShares Dorsey Wright Short ETF Ticker: DWSH 1 Table of Contents About Nasdaq Dorsey Wright... 3 The Case for DWSH.. 10 About Relative Strength. 4 How DWSH Fits Within a Portfolio.. 11 Investment
ETF Research: Understanding Smart Beta KNOW Characteristics: Finding the Right Factors Research compiled by Michael Venuto, CIO
 ETF Research: Understanding Smart Beta KNOW Characteristics: Finding the Right Factors Research compiled by Michael Venuto, CIO In this paper we will explore the evolution of smart beta investing through
Guided Equity Allocation
 September 2017 Guided Equity Allocation VanEck Vectors NDR CMG Long/Flat Allocation ETF Disclosures This material does not constitute an offer to sell or solicitation to buy any security, including shares
Anthony Capital Portfolio Historical Performance
 Anthony Capital Portfolio Historical Performance FBIAS Portfolios Annual Returns Core Blend Portfolios Year Anthony Min/Max 10/30 Anthony Min/Max 20/60 Anthony Min/Max 30/90 Anthony Min/Max 0/100 Anthony
The AdvisorShares Dorsey Wright Micro Cap ETF. Ticker: DWMC.
 The AdvisorShares Dorsey Wright Micro Cap ETF Ticker: DWMC 1 Table of Contents About Nasdaq Dorsey Wright... 3 The Case for DWMC.. 10 About Relative Strength. 4 How DWMC Fits Within a Portfolio.. 11 Investment
The AdvisorShares Dorsey Wright ADR ETF. Ticker: AADR.
 The AdvisorShares Dorsey Wright ADR ETF Ticker: AADR 1 Table of Contents About Dorsey Wright & Associates...3 About Relative Strength....4 About ADRs.......5 Investment Strategy Overview...6 Investment
Trade Signals New All Time High, Trend Evidence Remains Positive
 cmgwealth.com http://www.cmgwealth.com/ri/trade-signals-new-all-time-high-trend-evidence-remains-positive/ Trade Signals New All Time High, Trend Evidence Remains Positive S&P 500 Index 2100 By Steve Blumenthal
Smart Beta Dashboard. Thoughts at a Glance. January By the SPDR Americas Research Team
 By the SPDR Americas Research Team Thoughts at a Glance 2017 marked another year of factor performance shifts. s comeback in the US on the heels of the US election and the potential for a Trump-flation
A new direction in. Retirement Investing
 A new direction in Retirement Investing Target date funds have been increasing in popularity since their introduction in the early 1990 s. The idea that an individual can make one simple choice and be
Asset Allocation Portfolios
 Asset Allocation Portfolios Christopher Eckert Senior Vice President Wealth Management Senior Portfolio Manager Financial Advisor 320 Post Road West Westport, CT 06880 phone: 203-222-4057 toll-free: 866-740-7841
Aspiriant Risk-Managed Equity Allocation Fund RMEAX Q4 2018
 Aspiriant Risk-Managed Equity Allocation Fund Q4 2018 Investment Objective Description The Aspiriant Risk-Managed Equity Allocation Fund ( or the Fund ) seeks to achieve long-term capital appreciation
Total
 The following report provides in-depth analysis into the successes and challenges of the Northcoast Tactical Growth managed ETF strategy throughout 2017, important research into the mechanics of the strategy,
Smart Beta: Index Investing, Evolved
 Franklin LibertyShares TM Topic Paper November 2017 Smart Beta: Index Investing, Evolved Global investing literally and figuratively is foreign to many US investors. That s why some have taken a passive
Smart Beta and the Evolution of Factor-Based Investing
 Smart Beta and the Evolution of Factor-Based Investing September 2017 Donald J. Hohman Managing Director, Product Management Hitesh C. Patel, Ph.D Managing Director Structured Equity Douglas J. Roman,
Morgan Stanley Target Equity Balanced Index
 Morgan Stanley Target Equity Balanced Index Targeting Equity and Bond Allocation in a Balanced Way The Target Equity Balanced Index (the TEBI Index ) invests dynamically between Equities and Bonds in order
BEYOND SMART BETA: WHAT IS GLOBAL MULTI-FACTOR INVESTING AND HOW DOES IT WORK?
 INVESTING INSIGHTS BEYOND SMART BETA: WHAT IS GLOBAL MULTI-FACTOR INVESTING AND HOW DOES IT WORK? Multi-Factor investing works by identifying characteristics, or factors, of stocks or other securities
HSBC Vantage5 Index Methodology Guide
 HSBC Vantage5 Index Methodology Guide Table of contents Index overview 1 Index components 2 Vantage5 Index methodology 3 Monthly rebalancing process 4 Simulated historic volatility 5 Simulated portfolio
Tailwinds Tactical Portfolio Suite
 Tailwinds Tactical Portfolio Suite Newfound Case ID: 4176917 1 December 2015 The Newfound Mission Defensive Simple Consistent Thoughtful In August 2008, Newfound Research was founded based on a simple,
Nasdaq DW Global Momentum
 FREE TO SHARE Nasdaq DW Global Momentum Q2 2018 Experts pick your stocks, targeting strong returns Invests into developed and emerging markets stocks across the globe. Excludes all US stocks You own each
Tactical Income ETF. Investor Presentation N ORTHC OAST I NVESTMENT A DVISORY T EAM NORTHCOASTAM. COM
 Tactical Income ETF Investor Presentation N ORTHC OAST I NVESTMENT A DVISORY T EAM 203.532.7000 INFO@ NORTHCOASTAM. COM NORTHCOAST ASSET MANAGEMENT An established leader in the field of tactical investment
STRATEGY OVERVIEW. Opportunistic Growth. Related Funds: 361 U.S. Small Cap Equity Fund (ASFZX)
") STRATEGY OVERVIEW Opportunistic Growth Related Funds: 361 U.S. Small Cap Equity Fund (ASFZX) Strategy Thesis The thesis driving 361 s traditional long-only equity strategies is based on the belief that
STRATEGY OVERVIEW Opportunistic Growth Related Funds: 361 U.S. Small Cap Equity Fund (ASFZX) Strategy Thesis The thesis driving 361 s traditional long-only equity strategies is based on the belief that
Hi, everyone. there. should be. We are an this for 28 Louie, our
 TRANSCRIPT OF THE TD AMERITRADE WEBINAR January 22, 2015 Hi, everyone. We appreciate you taking time out of your day to join us. My name is Andrew Harris, and I head the national sales team to the advisors.
Multi-Asset Income. Newfound Case ID: December 2015
 Multi-Asset Income Newfound Case ID: 4173689 1 December 2015 The Newfound Mission Defensive Simple Consistent Thoughtful In August 2008, Newfound Research was founded based on a simple, but powerful, premise:
Market Insights. The Benefits of Integrating Fundamental and Quantitative Research to Deliver Outcome-Oriented Equity Solutions.
 Market Insights The Benefits of Integrating Fundamental and Quantitative Research to Deliver Outcome-Oriented Equity Solutions Vincent Costa, CFA Head of Global Equities Peg DiOrio, CFA Head of Global
Premium (Institutional Share Class) Simple. Performance.TM. Wellesley Hills Naples
 Simple. Performance.TM. Wellesley Hills Naples") Premium (Institutional Share Class) Simple. Performance.TM Wellesley Hills Naples Our investors seek relative outperformance in bull markets and absolute performance in bear markets. The BCM strategies
Premium (Institutional Share Class) Simple. Performance.TM Wellesley Hills Naples Our investors seek relative outperformance in bull markets and absolute performance in bear markets. The BCM strategies
Growth vs Value. or is Fundamental Indexing More Attractive
 Growth vs Value JUNE 213 By Vincent Lowry or is Fundamental Indexing More Attractive Key Points: By overweighting a portfolio toward growth or value at the right time, outperformance of the general market
Finding Income with MLPs
 Finding Income with MLPs Webinar November 1, 2016 Disclosures (1/2) Investing involves risk, including the possible loss of principal. International investments may involve risk of capital loss from unfavorable
An All-Cap Core Investment Approach
 An All-Cap Core Investment Approach A White Paper by Manning & Napier www.manning-napier.com Unless otherwise noted, all figures are based in USD. 1 What is an All-Cap Core Approach An All-Cap Core investment
THE FULL SPECTRUM. This model has indicated a bull market environment since early Spectrum Financial, Inc. Market Environment Model
 THE FULL SPECTRUM GENERAL MARKET COMMENTARY The financial markets have been responding well to the Federal Reserve s threats of interest rate hikes. In addition, the bull market is overdue for a correction,
UBS Conservative Income - Muni FI
 Product Type: Multi-Product Portfolio Headquarters: New York, NY Total Staff: 2,329 Geography Focus: Global Year Founded: 1989 Investment Professionals: 953 Type of Portfolio: Balanced Total AUM: $627,645
Market Maps. Bob Dickey, Technical Strategist, Portfolio Advisory Group. December RBC Capital Markets, LLC / Portfolio Advisory Group
 Market Maps Bob Dickey, Technical Strategist, Portfolio Advisory Group RBC Capital Markets, LLC / Portfolio Advisory Group All values in U.S. dollars and priced as of market close, December 1, 2017, unless
Active vs. Passive Money Management
 Active vs. Passive Money Management Exploring the costs and benefits of two alternative investment approaches By Baird s Advisory Services Research Synopsis Proponents of active and passive investment
MOMENTUM INVESTING: SIMPLE, BUT NOT EASY
 MOMENTUM INVESTING: SIMPLE, BUT NOT EASY As Of Date: 9/5/2018 Wesley R. Gray, PhD T: +1.215.882.9983 F: +1.216.245.3686 ir@alphaarchitect.com 213 Foxcroft Road Broomall, PA 19008 Empower Investors Through
Minimizing Timing Luck with Portfolio Tranching The Difference Between Hired and Fired
 Minimizing Timing Luck with Portfolio Tranching The Difference Between Hired and Fired February 2015 Newfound Research LLC 425 Boylston Street 3 rd Floor Boston, MA 02116 www.thinknewfound.com info@thinknewfound.com
Ted Stover, Managing Director, Research and Analytics December FactOR Fiction?
 Ted Stover, Managing Director, Research and Analytics December 2014 FactOR Fiction? Important Legal Information FTSE is not an investment firm and this presentation is not advice about any investment activity.
An Introduction to Factor Investing: Understanding the increasingly popular strategy
 A quarterly publication of CLS Investments FALL 2015 An Introduction to Factor Investing: Understanding the increasingly popular strategy Factors have engrossed the investing world in recent years. Strategies
VelocityShares Equal Risk Weight ETF (ERW) Please refer to Important Disclosures and the Glossary of Terms section at the end of this material.
 Please refer to Important Disclosures and the Glossary of Terms section at the end of this material.") VelocityShares Equal Risk Weight ETF (ERW) Please refer to Important Disclosures and the Glossary of Terms section at the end of this material. Glossary of Terms Beta: A measure of a stocks risk relative
VelocityShares Equal Risk Weight ETF (ERW) Please refer to Important Disclosures and the Glossary of Terms section at the end of this material. Glossary of Terms Beta: A measure of a stocks risk relative
FundAdvisor. Building diversified portfolios of high-quality mutual funds
 FundAdvisor Building diversified portfolios of high-quality mutual funds One James Center 901 East Cary Street, Suite 1100 Richmond, VA 23219 (888) 285-1863 Davenport & Company LLC Member NYSE l FINRA
Tower Square Investment Management LLC Strategic Aggressive
 Product Type: Multi-Product Portfolio Headquarters: El Segundo, CA Total Staff: 15 Geography Focus: Global Year Founded: 2012 Investment Professionals: 12 Type of Portfolio: Balanced Total AUM: $1,422
Active vs. Passive Money Management
 Active vs. Passive Money Management Exploring the costs and benefits of two alternative investment approaches By Baird s Advisory Services Research Synopsis Proponents of active and passive investment
Investment Management Philosophy
 Investment Management Philosophy Executive Overview The investment marketplace has grown increasingly complex and unpredictable for individual investors. This reality may make it difficult for many people
Tactical Core Equity Portfolio Strategy Global core equity portfolio strategy that seeks to outperform equity markets while minimizing volatility
 EquityCompass Tactical Core Equity Portfolio Strategy Global core equity portfolio strategy that seeks to outperform equity markets while minimizing volatility Approved for public distribution Investment
An Introduction to Dynamic Overlay
 Tactical investment strategy striving to preserve and grow client wealth An Introduction to Dynamic Overlay www.mrminv.com 12444 Powerscourt Drive Suite 350, St. Louis, MO 63131 1-(800) 233-1944 Q4 2018
Smart Beta: Unlocking New Investment Opportunities
 Smart Beta: Unlocking New Investment Opportunities Ana Paula Harris State Street Global Advisors FOR INVESTMENT PROFESSIONAL USE ONLY. Not for use with the public. All the information contained in this
Smart Beta and the Evolution of Factor-Based Investing
 Smart Beta and the Evolution of Factor-Based Investing September 2016 Donald J. Hohman Managing Director, Product Management Hitesh C. Patel, Ph.D Managing Director Structured Equity Douglas J. Roman,
CMG Opportunistic All Asset Strategy
 CMG Opportunistic All Asset Strategy Why CMG Founded in 1992, CMG is a Registered Investment Advisor located in King of Prussia, Pennsylvania. Since inception, CMG has embraced the application of tactical
Source: Morningstar, Inc., IFA, ifabt.com IFA Index Portfolios are shown net of 90 bps advisory fees. See the attached disclosures or ifabt.
 Source: Morningstar, Inc., IFA, ifabt.com IFA Index Portfolios are shown net of 90 bps advisory fees. See the attached disclosures or ifabt.com for more details on the construction and historical data
Market Maps. Bob Dickey, Technical Strategist, Portfolio Advisory Group. April RBC Capital Markets, LLC / Portfolio Advisory Group
 Market Maps Bob Dickey, Technical Strategist, Portfolio Advisory Group RBC Capital Markets, LLC / Portfolio Advisory Group All values in U.S. dollars and priced as of March 29, 2018, unless otherwise noted
Introducing BlackRock's Target Allocation ETF Models
 Introducing BlackRock's Target Allocation ETF Models Eve Cout Director, Managed Accounts Business Thomas Wood, CFA Lead Strategist, US Model Portfolios Tuesday January 23 rd, 2018 BENEFIT # 1 Scale and
Are You Smarter Than a Monkey? Course Syllabus. How Are Our Stocks Doing? 9/30/2017
 Are You Smarter Than a Monkey? Course Syllabus 1 2 3 4 5 6 7 8 Human Psychology with Investing / Indices and Exchanges Behavioral Finance / Stocks vs Mutual Funds vs ETFs / Introduction to Technology Analysis
Navigator Global Equity ETF
 CCM-17-12-3 As of 12/31/2017 Navigator Global Equity ETF Navigate Global Equity with a Dynamic Approach The world s financial markets offer a variety of growth opportunities, but identifying the right
Factor Investing & Smart Beta
 Factor Investing & Smart Beta Raina Oberoi VP, Index Applied Research MSCI 1 Outline What is Factor Investing? Minimum Volatility Index Methodology Historical Performance and Index Characteristics Risk
Investor Guide RiverSource Strategic Allocation Fund
 Investor Guide RiverSource Strategic Allocation Fund Professional asset allocation, disciplined investment approach. Insightful Solutions for Today s Investor. Your life shouldn t revolve around your investments.
Factor Investing. Fundamentals for Investors. Not FDIC Insured May Lose Value No Bank Guarantee
 Factor Investing Fundamentals for Investors Not FDIC Insured May Lose Value No Bank Guarantee As an investor, you have likely heard a lot about factors in recent years. But factor investing is not new.
+ Small caps typically have more direct access to local consumer sectors and local economies
 WisdomTree Emerging Markets SmallCap Fund DGS The world economy is increasingly powered by the evolution of the emerging market consumer and growing manufacturing base. At the same time, consumers in developed
BROCHURE. Published July The first step to increasing your money is keeping it. Tactical Core US
 BROCHURE Published July 2013 The first step to increasing your money is keeping it. Tactical Core US Tactical Core US Brochure 3 The first step to increasing your money is keeping it. Most investors want
Factors have delivered similar risk-adjusted performance as asset classes, but may perform worse going forward
 Are Factors Better and More Diversifying Than Asset Classes? (For the most part, we don t think so) February 2018 By: Maneesh Shanbhag, CFA Executive Summary - Factor investing promises outperformance
2017 Strategy Review. CAN SLIM Investment Program. 1 Cash Scaling
 2017 Strategy Review CAN SLIM Investment Program December 31, 2017 The following report provides in-depth analysis into the objective, investment process, and the successes and challenges of the strategy
THE DURSO WEALTH MANAGEMENT GROUP AT MORGAN STANLEY DISCRETIONARY PORTFOLIO MANAGEMENT INVESTMENT STRATEGIES
 Morgan Stanley 20 Linden Place Red Bank, NJ 07701 (732) 936-3400 THE DURSO WEALTH MANAGEMENT GROUP AT MORGAN STANLEY THE DURSO WEALTH MANAGEMENT GROUP AT MORGAN STANLEY DISCRETIONARY MANAGEMENT INVESTMENT
VelocityShares Equal Risk Weighted Large Cap ETF (ERW): A Balanced Approach to Low Volatility Investing. December 2013
: A Balanced Approach to Low Volatility Investing. December 2013") VelocityShares Equal Risk Weighted Large Cap ETF (ERW): A Balanced Approach to Low Volatility Investing December 2013 Please refer to Important Disclosures and the Glossary of Terms section of this material.
VelocityShares Equal Risk Weighted Large Cap ETF (ERW): A Balanced Approach to Low Volatility Investing December 2013 Please refer to Important Disclosures and the Glossary of Terms section of this material.
Morgan Stanley ETF-MAP 2 Index Information
 Morgan Stanley ETF-MAP 2 Index Information Investing in instruments linked to the Morgan Stanley ETF-MAP 2 Index involves risks not associated with an investment in other instruments. See Risk Factors
FVC First Trust Dorsey Wright Dynamic Focus 5 ETF
 First Trust Dorsey Wright Dynamic Focus 5 ETF ETF.com segment: Equity: Global - Total Market Competing ETFs: DWLV, QXGG, ASET, VT, ACWI Related ETF Channels: Smart-Beta ETFs, Total Market, Broad-based,
FundSource. Professionally managed, diversified mutual fund portfolios. A sophisticated approach to mutual fund investing
 FundSource Professionally managed, diversified mutual fund portfolios Is this program right for you? FundSource is designed for investors who: Want a diversified portfolio of mutual funds that fits their
Innovative solutions to add alpha & manage risk
 Client Education Summit 2012 Multi-asset: Innovative solutions to add alpha & manage risk Multi Asset Management October 10, 2012 Agenda The case for multi-asset An "all-weather" approach Flexibility is
The Arrow Funds & Alternative Investment Solutions
 R E P R I N T E D F R O M j u n e 2 3, 2 0 0 8 The Arrow Funds & Alternative Investment Solutions JOSEPH BARRATO is CEO, Director of Investment Strategies and a founding member of Arrow Investment Advisors,
TAKE CONTROL OF YOUR INVESTMENT DESTINY Increasing control over your investments.
 TAKE CONTROL OF YOUR INVESTMENT DESTINY Increasing control over your investments. Challenge for Investors Case for Factor-based Investing What Next? The Real World Economic and Market Outlooks are Constrained
Get active with Vanguard factor ETFs
 Get active with Vanguard factor ETFs Factor investing has gained attention in recent years, in part because of the rise of alternatively weighted indexes and smart-beta products. Yet factor investing has
Smart Beta Dashboard. Thoughts at a Glance. March By the SPDR Americas Research Team
 By the SPDR Americas Research Team Thoughts at a Glance For the first two months of Q1, US outperformed the broader market by nearly 5%. However, as 10-year Treasury yields and inflation expectations came
Discover the power. of ETFs. Not FDIC Insured May May Lose Lose Value Value No No Bank Bank Guarantee
 Discover the power of ETFs Not FDIC Insured May May Lose Lose Value Value No No Bank Bank Guarantee Discover exchange-traded funds (ETFs) Financial television programs and publications continue to give
Franklin Utilities Fund Class A, C
 Utilities Equity Product Profile Product Details 1 Fund Assets $5,788,850,628.56 Fund Inception Date 09/30/1948 Number of Issuers 43 Investment Style Benchmark Lipper Classification Morningstar Category
Growth Investing. in Times of Market Volatility. White Paper
 White Paper Growth Investing in Times of Market Volatility April 2018 Executive Summary Many investors may be dismayed by the volatile nature of high-flying growth stocks. While, by definition, growth
FACTOR INVESTING: Targeting your investment needs. Seek to enhance returns Manage risk Focused outcomes
 FACTOR INVESTING: Targeting your investment needs Seek to enhance returns Manage risk Focused outcomes 1 Table of Contents Introduction What is factor investing? How to use factors in a portfolio Fidelity
CMG Tactical Rotation Strategy CMG Capital Management Group, Inc. Financial Professional Use Only
 CMG Tactical Rotation Strategy About CMG CMG is a Registered Investment Advisor located in King of Prussia, Pennsylvania founded in 1992 by Stephen Blumenthal. Since the beginning, CMG has embraced Uncommon
Cash. Period Ending 06/30/2016 Period Ending 3/31/2016. Equity. Fixed Income. Other
 Product Type: Multi-Product Portfolio Headquarters: Austin, TX Total Staff: 46 Geography Focus: Global Year Founded: 1996 Investment Professionals: 16 Type of Portfolio: Balanced Total AUM: $12,046 million
Please Retain This Supplement For Future Reference.
 POWERSHARES EXCHANGE-TRADED FUND TRUST SUPPLEMENT DATED DECEMBER 7, 2016 TO THE PROSPECTUS DATED AUGUST 26, 2016, AS PREVIOUSLY SUPPLEMENTED OCTOBER 7, 2016 AND SEPTEMBER 21, 2016 OF: PowerShares Aerospace
INSERT ACCOUNT ADDENDUM HERE
 INSERT ACCOUNT ADDENDUM HERE SCHEDULE OF SERVICES & FEES JEFFERSON NATIONAL MONUMENT ADVISOR Asset Management SERVICES Other (Financial/Estate Planning etc.) * For a detailed description of Money Manager