At BLOM BANK, our mission has always been to spread Peace of Mind in the region and all around the world through our international network.
|
|
|
- Thomas Atkinson
- 5 years ago
- Views:
Transcription
1
2 ANNUAL REPORT 07
3

4 At BLOM BANK, our mission has always been to spread Peace of Mind in the region and all around the world through our international network. The universal banking services provided by our group and our concern to maximize customer satisfaction constitute the key elements for the success of our mission.


5

6

7 Dr. Naaman AZHARI Chairman of BLOM BANK GROUP Mr. Saad AZHARI Chairman and General Manager of BLOM BANK S.A.L
8 SUMMARY CHAIRMAN S LETTER 09 GROUP CHART 11 EVOLUTION OF MAIN INDICATORS 12 FINANCIAL RATIOS 13 BLOM BANK CUSTOMER DEPOSITS EVOLUTION 14 STRONG AND CONTINUOUS GROWTH FOR THE LAST 5 YEARS 15 BLOM BANK SAL BOARD OF DIRECTORS 18 BLOM BANK S MAJOR SHAREHOLDERS AND GENERAL MANAGEMENT 19 BLOM BANK ORGANIZATIONAL CHART 21 MANAGEMENT DISCUSSION AND ANALYSIS 1. OPERATING ENVIRONMENT OVERVIEW EVOLUTION OF TOTAL ASSETS SOURCES OF FUNDS USES OF FUNDS LIQUIDITY PROFITABILITY DIVIDEND DISTRIBUTION AND PREFERRED SHARES REVENUES CAPITAL ADEQUACY RATIO INTEREST RATE RISK RISK MANAGEMENT AND BASEL II PREPARATIONS UNIVERSAL BANKING SERVICES INFORMATION SYSTEMS AND TECHNOLOGY PEOPLE DEVELOPMENT BANK S OPERATIONAL EFFICIENCY REGIONAL EXPANSION 68 INDEPENDENT AUDITORS REPORT TO THE SHAREHOLDERS OF BLOM BANK SAL 74 CONSOLIDATED INCOME STATEMENT YEAR ENDED 31 DECEMBER 75 CONSOLIDATED BALANCE SHEET AT 31 DECEMBER 76 CONSOLIDATED CASH FLOWS STATEMENT FOR THE YEAR ENDED 31 DECEMBER 78 CONSOLIDATED STATEMENT OF CHANGES IN EQUITY FOR THE YEAR ENDED 31 DECEMBER 80 NOTES TO THE CONSOLIDATED FINANCIAL STATEMENTS 83 BLOM BANK S WORLDWIDE CORRESPONDENT BANKS 164 BLOM BANK GROUP DIRECTORY 166

9 08 Mr. Saad AZHARI Chairman and General Manager of BLOM BANK S.A.L
10 CHAIRMAN S LETTER True to its record, BLOM BANK has remained at the forefront of the Lebanese banking system in. It proved itself once again to be a solid and successful financial institution, earning the highest level of profits among Lebanese banks at $204.7 million. This was 13.53% higher than the 2006 level, and it was largely a product of its managerial and financial efficiency as reflected in an effective cost to income ratio of 34.6% the lowest among the leading banks. The banks consolidated balance sheet also saw a significant increase, rising by 17% each for assets and deposits to reach $16,628 million and $13,737 million respectively. Also significant was the increase in loans especially to service clients in regional markets to $2,772 million that lifted the loans to deposits ratio from 16.9% to 20.2%. All this has happened within an operating framework that maintained high levels of liquidity and strong asset quality to better manage risk and to ensure clients peace of mind. Thus immediate net liquidity in Lebanese Pounds and foreign currencies stood at a comfortable 105.9% and 63.2% respectively; whereas the ratios of gross nonperforming loans and loan loss reserves were a respectable 7.9% and 95.55%. Also, in terms of capital adequacy and its new risk adjustments according to the standardized approach, BLOM Bank s ratios reached healthy values of 29.05% and 14.6% according to Basel I and Basel II respectively. These achievements of BLOM BANK did not translate to the highest profitability in absolute measures only, but also included relative measures. In terms of returns on average assets and equity, BLOM retained the highest ratios among leading Lebanese banks at 1.33% and 15.65% respectively. This was reflected in financial markets, as the price of BLOM s GDR (Global Depository Receipts) increased by 50.5% to close the year at $90.2. In addition, the Bank s General Assembly of Shareholders on the 9th of April 2008 approved as follows the distribution of dividends for the financial year : preferred shares 2002 issue received $15 each, and their corresponding 2004 and 2005 issues $8.5 and $9.5 respectively; whereas each of the listed common shares and GDRs got the equivalent of $3.65 per share. This commendable performance under difficult circumstances in the Lebanese economy attracted several awards and marks of excellence in from reputable ranking and rating institutions. The Bank was awarded Best Bank in Lebanon from Global Finance; Highest Financial Strength Rating at BBB from Capital Intelligence; Highest National Rating at Aa1.lb from Moody s; Best Trade Finance, Best Foreign Exchange, and Best Customer Internet Bank from Global Finance; Best Use of Technology in the Middle East from The Banker Middle East; and Best Deal of the Year from the Banker. Despite the climate of political uncertainty, Lebanon s economy managed to grow by 3% in real terms in. Also noteworthy was a solid fiscal performance that saw net debt at $39.1 billion fall as a ratio of Gross Domestic Product to 162% and primary surplus rise as a similar ratio to 3%, an outcome of improving tax revenues and Paris III donor support. And, true to its history, the Lebanese banking sector was the backbone of the economy in, continuing undeterred its healthy domestic growth and foreign expansion. All the basic indicators from the financials of its domestic operations were up: assets increased by 10.6% to $82.2 billion; deposits by 11.4% to $67.5 billion; loans by 11.7% to $23.9 billion; and capital by 10.5% to $6.3 billion. And the banking system has crowned these accomplishments by continuing its sustained profitability, with net profits increasing by 11.8% to $850 million. But perhaps the current defining feature of the Lebanese banking sector is its foreign expansion. The result is that there are currently 17 Lebanese banks with presence in 20 foreign countries encompassing more than 150 banking units and corresponding to around 15% of banks total activities. Of course, the banking system s performance was greatly facilitated by the supervisory oversight of Banque du Liban (BdL). Regulatory directives from BdL ensured that banks have remained well capitalized, at more than 12% according to Basel II; and also ensured that banks have stayed away from the asset classes that engendered the credit crises in the US and elsewhere in late. In addition, BdL continued its sound monetary management of the economy, preserving the exchange rate peg and amassing more than $12 billion in foreign reserves, ensuring in the process both liquidity and stability in financial markets. 09
11 In this context, BLOM BANK s success rests on a twopronged strategy of geographical expansion and service diversification, so as to evolve the bank to a regional, universal Bank. BLOM BANK currently stands to be the Lebanese bank with the largest overseas activities, where overseas assets and profits represent 36% and 24% of total assets and profits respectively. It is present in ten countries: Lebanon (BLOM BANK), Syria (Bank of Syria and Overseas, BSO), Jordan (BLOM BANK), Egypt (BLOM BANK EGYPT), UAE (BLOM BANK FRANCE), France, England, and Romania (BLOM BANK FRANCE), Cyprus (BLOM BANK), and Switzerland (BLOM BANK (SWITZERLAND)). The Bank also obtained a license to open a Representative Office in Abu Dhabi in ; and has been granted licenses to operate an investment company in Saudi Arabia, BLOMINVEST Saudi Arabia, in mid 2008, and to start a private and corporate bank in Qatar in late Also, in relation to expansion in individual countries, BSO opened a new branch in Aleppo in that increased the number of branches to 10, expected to increase to 20 in 2008; two new branches were opened in Jordan, and two more are planned to open in 2008, raising the total to 7. In addition, BLOM BANK EGYPT continued with its robust expansion, increasing its number of branches to 20 in and aiming to raise it to 30 in And not to forget Lebanon, four additional branches were inaugurated in, and we look forward to add more new branches in 2008, mainly in the areas of Furn El Cheback, Dekwaneh, Sodeco, Choueifat, and Abbasya. As important, geographic diversification has been coupled with a process of product and services diversification to support the Bank s universal banking model. BLOM BANK s banking services now include retail, corporate, investment, asset management, Islamic, and private banking, in addition to insurance. This has also led to diversification in the sources of income, where fee income now constitutes 24% of operating income, increasing in by 19.4% compared to an increase by 11.4% in net interest income. In turn, the sources of interest income have undergone diversification and more balance as well, comprising 42% from interbank deposits, 29% from government securities, and 29% from customer loans. In this respect also, the activities of BLOMINVEST BANK, the investment arm of BLOM BANK, have been upgraded and widened as a conduit to increase diversification of services and income. One prominent product of such widened specialization by BLOMINVEST has been in the area of asset management, where it established a balanced growth fund, the BLOM Cedars Balanced Fund, the first of its kind in Lebanon combining both fixed income assets and equities. And last but not least, a notable undertaking by the Bank has been the development of a corporate governance code in, to be applied starting The Bank is fully aware of the importance of such a code, not only for the healthy functioning of the institution but also for the confidence and trust that it sheds to all stakeholders. As a result, the code is built to the highest standards, as proposed by the Basel Committee, and covers all crucial elements that make up an effective governing system. Notable among them are those that relate to the Board of Directors, its role (effective governance over the Bank for the benefit of shareholders), structure (majority of independent directors), and committees (audit, risk management, strategy, and nomination and remuneration). In addition, it covers elements of transparency and stakeholders relations, ranging from the adoption of internationally recognized accounting standards, public disclosure rules, code of conduct and banking ethics, to staff, customers, and suppliers relations. In conclusion, I would like to pledge that BLOM BANK will continue in its geographical and business expansion while remaining true to its core values of safety, outstanding customer service, longterm shareholder value, and responsible corporate citizenship in each of our countries of presence. I would also like to thank the managers and staff for their dedication and hard work. Saad Azhari Chairman and General Manager 10
12 BLOM BANK GROUP CHART BLOM BANK GROUP CHART 99.99% BLOM BANK FRANCE S.A. 100% BLOM BANK (SWITZERLAND) S.A. Head Office: Paris Branches: London Dubai Sharjah Romania (6) Head Office: Geneva BLOM BANK S.A.L. Head Office: Beirut Branches: Lebanon (53 Branches) Cyprus Damascus Free Zone Jordan (6 branches in Amman) Abu Dhabi (Representative Office) 99% BLOM BANK QATAR L.L.C * 99.37% BLOM BANK EGYPT S.A.A. Head Office: Cairo Branches: Egypt (24) 33.33% 99.88% BLOMINVEST BANK S.A.L % BLOM DEVELOPMENT BANK S.A.L. 50% Head Office: Beirut Head Office: Beirut 10% 88.56% 10% AROPE INSURANCE S.A.L. Head Office: Beirut Branches Lebanon (9) 99.97% 34% Head Office: Doha BLOM EGYPT SECURITIES Head Office: Cairo BLOMINVEST SAUDI ARABIA * Head Office: Riyadh AROPE SYRIA Syria International Insurance Head Office: Damascus Branch Aleppo 39.00% BANK OF SYRIA & OVERSEAS S.A.A. 5% Head Office: Damascus Branches: Syria (12) * Under Establishment 11
13 EVOLUTION OF MAIN INDICATORS FINANCIAL RATIOS EVOLUTION OF MAIN INDICATORS (in millions) 2006 Change 06/07 TOTAL ASSETS LBP USD 25, , , , % 17.00% CUSTOMER DEPOSITS LBP USD 20, , , , % 17.06% TOTAL NET LIQUIDITY LBP USD 15, , , , % 0.68% SHAREHOLDERS EQUITY LBP USD 2, , , , % 9.72% CAPITAL FUNDS LBP USD 2, , , , % 9.18% TOTAL LOANS AND ADVANCES LBP USD 4, , , , % 39.46% NET INCOME AFTER TAX LBP USD 308, % 13.53% 12
14 FINANCIAL RATIOS (in % or USD) 2006 LIQUIDITY RATIOS Net liquidity in LBP Net immediate liquidity Liquid assets over total assets % 63.24% 63.19% 109.8% 78.26% 74.39% LOANS TO DEPOSITS RATIOS LBP F/C Total 9.98% 22.11% 20.18% 7.96% 18.96% 16.94% ASSETS QUALITY NOT INCLUDING GENERAL PROVISION Net doubtful loans over total loans Provision over doubtful loans Provision over total loans Gross doubtful loans/ Gross total loans 1.68% 80.40% 8.19% 7.92% 2.02% 82.35% 8.85% 10.25% CAPITAL ADEQUACY RATIOS Before dividend distribution After dividend distribution 31.53% 29.05% 39.50% 36.35% PROFITABILITY RATIOS Return on average equity Return on average assets Earnings per share USD Dividend per common share USD Dividend payout ratio Retention Ratio Net asset value per common share USD 15.65% 1.33% 8.22 USD 3.65 USD 44.39% 55.61% USD 16.81% 1.38% 7.29 USD 3.32 USD 45.98% 54.02% USD 13
15 CUSTOMER DEPOSITS EVOLUTION STRONG AND CONTINUOUS GROWTH FOR THE LAST 5 YEARS Customer Deposits Evolution (in USD Millions) Deposits (in millions of USD) ,735 13, ,992 10, , ,333 3,861 4,330 5,525 5,056 6,215 2, ,259 1, Years
16 Strong and Continuous Growth for the Last 5 Years Total assets (in USD Millions) 18,000 16,000 14,000 12,000 10,000 8,000 8,786 10,835 11,918 14,212 16,628 6,000 4,000 2, Net profits (in USD Millions) Tier I & Tier II capital (in USD Millions) , ,

17

18
19 BLOM BANK S.A.L BOARD OF DIRECTORS BLOM BANK S.A.L MAJOR SHAREHOLDERS AND GENERAL MANAGEMENT BLOM BANK S.A.L Board of Directors Chairman of the BLOM BANK Group Dr. Naaman AZHARI Chairman and General Manager Mr. Saad AZHARI Directors H.E. Sheikh Ghassan SHAKER, Grand Officier de la Légion d Honneur Sheikh Salim Boutros EL KHOURY Mr. Samer AZHARI Group Secretary General H.E Me. Youssef Selim TAKLA Mr. Habib RAHAL General Manager Mr. Joseph Emile KHARRAT Mr. Nicolas Nicolas SAADE Dr. Fadi OSSEIRAN 18 Mr. Marwan JAROUDI
20 BLOM BANK S.A.L Major Common Shareholders Bank of New York** Banorabe Holding*** AZA Holding (Azhari Family over 50%) Azhari Family Actionnaires Unis (Azhari Family over 50%) Shaker Holdings S.A.L. (Shaker Family) Mrs. Nada Aoueini Jaroudy Family Saade Family Khoury Family Others % of Total Common Shares* % 11.4 % 9.33 % 2.86 % 1.83 % 5.39 % 5 % 4.92 % 2.81 % 2.02 % % * Total common shares: 21,500,000 ** Starting 1998, and after the issuance of Global Depositary Receipts (GDR) by BLOM BANK Shareholders, the Bank of New York as Depositary, became shareholder on the Bank s register. *** The major shareholders of Banorabe Holding are the same as in BLOM BANK S.A.L (except Bank of New York and AZA Holding). Dr. Naaman AZHARI Chairman of the Group Mr. Samer AZHARI Group Secretary General BLOM BANK General Management Mr. Saad AZHARI Chairman and General Manager Mr. Habib RAHAL General Manager Mr. Amr AZHARI General Manager Chairman s Advisors Mr. Fawaz KAYAL Sheikh Fahim MOADAD** Mr. Elias ARACTINGI Planning & Organization Department, Retail Banking Department (** Fomerly Vice Governor of the Central Bank of Lebanon) General Management Consultants Mr. Georges SAYEGH Mr. Adnan SALLAKH 19
21 BLOM BANK GENERAL MANAGEMENT BLOM BANK S ORGANIZATINAL CHART BLOM BANK S.A.L Central Departments & Units DEPARTMENTS & UNITS * MANAGEMENT Accounting Administration Anti Money Laundering Unit Back Office Operations Communication & Investor Relations Corporate Unit Credit Engineering Follow Up Foreign Exchange Human Resources Information Systems Information System Security Unit Internal Audit Internal Audit /Group Inspection International Affairs & Treasury IT Operations Legal Marketing Marketing Overseas Marketing Overseas Recovery & General Management Secretariat Unit Regional Marketing Regional Marketing Retail Credit Retail Marketing Risk Management Strategic Planning & Organization Trade Finance Mr. Talal BABA Senior Manager Mr. Samih ZEINEDDINE Senior Manager Mr. Malek COSTA Head of Unit Mr. Mekhael KAZZI Senior Manager Dr. Gladys YOUNES Manager Mr. Samir KASSIS Senior Manager Mr.Moustapha GHALAYINI Senior Manager Mr. Mohamed BIZRI Manager Mr. Riad TABBARAH Senior Manager Mr. Wassim KHODR Manager Dr Pierre ABOU EZZE Senior Manager Mr. Antoine LAWANDOS Senior Manager Ms. Aya YAMOUT Head of Unit Mr. Ramzi TARABICHI Senior Manager Mr. Naoum RAPHAEL Senior Manager Mr. Grégoire AZAR Senior Manager Mr. Mohamed SOUBRA Senior Manager Me. Aimee SAYEGH Senior Manager Mr. Michel GHANEM Manager Mr. Fouad SAID Senior Manager Mr. Marcel ABOU JAOUDE Manager Mr. Charles HADDAD Head of Unit Mr. Elias MOKHACHEN Senior Manager Mr. Georges CHEDID Senior Manager Mr. Imad KADI Manager Mrs. Jocelyne CHAHWAN Senior Manager Mr. Gerard RIZK Manager Mr. Rabih HALABI Manager Mr. Jacques SABOUNGI Senior Manager * By alphabetical order 20
22 BLOM BANK S ORGANIZATIONAL CHART SHAREHOLDERS BOARD OF DIRECTORS BOARD COMMITTEES Board Audit Committee Board Risk Management Committee Consulting, Strategy & Corporate Governance Committee Nomination & Renumeration Committee DEPARTMENTS/ UNITS Accounting Administration AntiMoney Laundering Unit Back Office Operations Communication & Investor Relations Corporate Unit Credit Engineering Follow Up Foreign Exchange Human Resources Information Systems Information System Security Unit Internal Audit Internal Audit /Group Inspection International Affairs & Treasury IT Operations Legal Marketing Marketing Overseas (2) Recovery & General Management Secretariat Unit Regional Marketing (2) Retail Credit Retail Marketing Risk Management Strategic Planning & Organization Trade Finance EXTERNAL AUDITORS Ernst & YoungSemaan, Gholam & Co. SOLICITORS H.E. ME. Mohamad JAROUDI Me. Georges ABOU ZAMEL Me. Antoine MERHEB MANAGEMENT COMMITTEES Executive Committee Credit Committee 1 Credit Committee 2 Exceptional Credit Committee Followup Credit Risk Committee Provisions Committee Retail Credit Committee Assets & Liabilities Committee Investment & Treasury Committee Marketing Committee Information Technology Committee Human Resources Committee Legal Committee Internal Audit Committee Compliance Committee Operations & Internal Procedures Committee Foreign Branches & Subsidaries Committee Purchasing & Maintenance Committee Information System Securitiy Committee Branch Managers 53 in Lebanon, 1 in Cyprus 1 in Damascus Free Zone 6 in Jordan 1 Chief Representative in Abu Dhabi 21

23
24
25 MANAGEMENT DISCUSSION & ANALYSIS
26 Management discussion & analysis 1. OPERATING ENVIRONMENT 1. OPERATING ENVIRONMENT Despite the political tensions, the economy recovered slowly in the year after the overwhelming adverse effects of the July 2006 war. This was driven mainly by the strong external assistance that Lebanon received from the Paris III International Donor Conference in January. The Lebanese government presented an ambitious fiveyear program to Paris III, designed to address the country s fiscal deficit, maintain macroeconomic stability, promote privatization and improve living standards. While the financial assistance was partly made available, the economic reforms are still on the agenda, waiting for an end to the political impasse. Backed by the success of the Paris III conference and the financial support received, real GDP growth bounced back to the positive rate of 3% after a clear contraction due to the destructive events of July This growth was further promoted by the good performance of the construction, financial and services sectors. Despite the increase in international commodity prices and the weakening of the US dollar, inflation retreated slightly to 6% in, down from the high of 7% caused by the supply shortages during the 2006 conflict. The trade and current account deficits widened up as exports and especially imports were buoyant in. Total exports increased by 23.4% to $2.8 billion and imports went up 25.7% reaching $11.8 billion. As a result of the higher trade deficit and the particular drop in foreign direct investment (FDI), the balance of payments declined to $2 billion from $3 billion in the previous year. The net foreign assets at the central Bank declined by $580M and the foreign debt stood at $21.3 billion, representing 89.1% of GDP. The country s budget deficit improved by 24.5% to $2.3 billion in, driven by strong VAT revenues, increasing telecom revenues as well as the Paris III grants. Nevertheless, the gaping holes in expenditures remain increasing interest payments and transfers to EDL. Consequently, the ratio of gross public debt to GDP stabilized at 173%. 25
27 1. OPERATING ENVIRONMENT Financial markets showed strong resilience and monetary stability was sustained by the exchange rate peg. The average interbank rate stood at an average of 4.2% in, down from 4.6% a year earlier as the impact of the 2006 conflict slowly faded away. Money demand remained robust with broad money increasing by 12.5% in compared to 8.4% in Dollarization widened in, registering ratios higher than those prior to the July 2006 conflict. As such, deposit dollarization increased from 76% in 2006 to 78.1% while dollarization of loans went up from 84% to 84.5%. Interest rates on the Lebanese Pound declined slightly in to 7.4% helped by the favourable effects of Paris III and monetary stability that outweighed any adverse effect from the international global credit crisis. Interest rates in USD widened from 4.71% to 4.75% as they were slightly affected by higher political risk. The value of cleared check jumped by 19.17% to $38.7 billion in. Lebanese Pound denominated cleared checks accounted for 23% of total cleared checks value while foreign currency denominated cleared check represented 77% of the total value. In the banking sector, the consolidated balance sheets of the commercial banks mirrored the strong momentum of the sector. As such, the balance sheet of domestic banks stood at $82.2 billion in, with a yearly increase of 10.7%. The sector s high profitability was reflected in a 12% increase over the previous year to $847M while its capitalisation went up 10.5% to $6.3 billion. Customer deposits and loans rose by 11.4% and 11.7% to $67.5 billion and $23.9 billion respectively. The stock market recovered in despite the political impasse and global financial markets turbulence. In fact, after a 9.5% decline in 2006, the BLOM Stock Index (BSI), Lebanon s benchmark index, picked up by 27% in to close at Market capitalisation increased 32.5% to $10.2 B while total market turnover dropped by 51% to $991.8 million. On the other side, the Eurobond market stayed dormant and witnessed very limited trading throughout the year. With the continuing political stalemate, the country s rating started to slip with Standard & Poor s downgrading Lebanon s long term foreign currency sovereign securities from B to CC+ while Moody s maintained its B3 rating. In the absence of an active parliament, many actions that was present on the Paris III reform agenda have been suspended, with the outlook of the economy closely depending on a possible solution to the political impasse in the country. 26
28 Management discussion & analysis Key Indicators USD Millions or % GDP Growth Rate Estimated Inflation Balance of Payments Trade Deficit Budget Deficit LP/USD External Debt Gross Public Debt Gross FX Reserves Banks Assets BLOM Stock Index % 7.0% $2,749.5 $7,117 $3,040 $1,507.5 $20,430 $40,466 $12,975 $74,293 1, % 6.0% $2,036.6 $9,004 $2,294 $1,507.5 $21,249 $42,060 $12,395 $82,255 1,502 % Change 300 b.p. 100 b.p. (25.9%) 26.5% (24.5%) 0.0% 4.0% 3.9% (4.47%) 10.72% 26.8% Notes: Data included in BLOM s Environment are based on several sources. Public finance, public debt, interest payments and cost of debt are based on the Ministry of Finance s publications. Trade balance, FX reserves, cleared checks, balance of payments and banking sector s performance are based on Banque du Liban s publications. GDP figures are based on IMF estimations. Stock market data, interbank rate, domestic interest spread and average eurobonds yield are based on calculations performed by the Economic Research Department at BLOMINVEST BANK s.a.l. 27

29
30
31 2. OVERVIEW 3. EVOLUTION OF TOTAL ASSETS 2. OVERVIEW BLOM BANK accomplished in another successful year, marked by a solid financial position, a diversification of services on offer and an increasing regional presence. BLOM BANK s strong stand as the leading banking group in Lebanon was reflected by the number of awards accredited to it in the year : Best Bank in Lebanon from Global FinanceFebruary 2008 Best Trade Finance in the Middle East from Banker Middle EastJanuary 2008 Best Trade Finance Bank in Lebanon from Global FinanceDecember Best Foreign Exchange Bank in Lebanon from Global FinanceDecember Best Consumer Internet Bank from Global Finance July Best Bank in Lebanon from Global Finance April Deal of the Year in Lebanon from the BankerApril Best use of Technology in the Middle East from the Banker Middle East May BLOM BANK continued to maintain the highest financial ratings in Lebanon. As such, the Bank has been rated by Capital Intelligence, a Middle Eastspecialized rating agency, BBB, which is the highest financial strength rating in Lebanon and has received the highest national score rating Aa1.lb from Moody s. In, BLOM BANK confirmed its position as the most profitable bank of Lebanon, with net profits reaching $204.7m and as one of the largest banks in the country with total assets of $16.6bn and total customer deposits of $13.7bn at year end. In also, BLOM BANK continued with its strategy of geographic and business services diversification. Foreign expansion not only spreads the risk of operating mainly in Lebanon, but also takes advantage of the economic and business opportunities opening up in the regional economies and of their liberal financial policies. In this respect, saw the Bank operate in ten countries: Lebanon, Syria, Egypt, Jordan, UAE, France, Switzerland, England, Cyprus and Romania. In addition, the Bank has developed further its retail network by opening new branches in Egypt, Jordan and Syria. In Lebanon, the Bank inaugurated in four new branches in the areas of Tabaris (Beirut), Jbeil, Mina El Hosn and Hamra Street (Retail Branch). In addition, BLOM BANK was recently awarded licenses to establish an investment bank in Saudi Arabia, BLOMINVEST Saudi Arabia, as well as a representative office in Abu Dhabi (UAE) and a commercial and private bank in Qatar, BLOM BANK Qatar in QFC. 30
32 Management discussion & analysis The other component of the strategy is to diversify business activities towards a universal banking model. As a result, the bank has expanded the operations of its investment arm, Blominvest Bank, by enhancing its private and investment banking and capital market activities, in addition to introducing asset and wealth management services. The latter aim at establishing funds and investment vehicles for retail and high networth investors that are diversified in their asset composition and geography. The first of such funds is the Cedars Balanced Growth Fund that combines Lebanese fixed income and equity assets. The aim of the services diversification is a diversification in the sources of income that gives increasing share for noninterest income AROPE Insurance, BLOM BANK s subsidiary, has also witnessed a year of growth and expansion, marked by the opening of three additional branches in Lebanon as well as one branch in Aleppo (Syria) through AROPE Syria. In 2008, AROPE is projected to continue its aggressive policy of expansion and will be the first to penetrate Egypt s commercial insurance sector through Arope Egypt for Life Insurances and Arope Egypt for Property Insurances. 3. EVOLUTION OF TOTAL ASSETS The Bank witnessed a strong growth in assets in. Indeed, total assets increased by USD2,416 million to reach USD16,628 million in, thus registering a rise of 17% over the year A large part of the growth in assets was denominated in foreign currency as a result of the high rate of dollarization and overseas deposits growth. In addition, BLOM bank successfully increased its market share in terms of total assets among Lebanese banks from 18.67% in the year 2006 to 20.22% in. Evolution of Total Assets (in USD Millions) 16,000 12,000 8,000 7,146 8,786 10,835 11,918 14,212 16,628 4,
33 4. SOURCES OF FUNDS 4. SOURCES OF FUNDS Sources of funding fall into four main categories: customer deposits, capital funds (Tier I & Tier II), banks and financial institutions and other liabilities. The Bank s main source of funds came in the form of customer deposits which accounted for 82.61% of total funding in. Tier I and Tier II capital constituted 8.35% of total funds for, while the share of banks and financial institutions amounted at 6.21% in. Breakdown of sources of funds 2006 Customer Deposits Tier I & Tier II Capital 8.95% 6.11% 2.38% 8.35% 6.21% 2.83% Banks & Financial Institutions Other Liabilities 82.53% 82.61% 4.1 Customer Deposits Customer deposits increased by 17%, up from USD 11,735 million in 2006 to reach USD 13,737 million in. This increase is even higher than last year s 15.49% growth of deposits and much larger than the 11.4% growth of the market, once again giving evidence for BLOM BANK S outgrowth of the market. As a result of the Bank s network of expansion locally and regionally, foreign currencies share of total deposits went up, standing at 84.07% of total deposits for the year, slightly up from 82.38% in 2006 and much larger than 76.35% in The increase in the share of foreign currency deposits out of total deposits can then be mainly attributed to the Bank s regional and international growth. 32
34 Management discussion & analysis Evolution of Customer Deposits (in USD Millions) 16,000 13,737 12,000 8,000 6,215 7,686 8,992 10,161 11,735 4, BLOM BANK s market share in terms of customer deposits in the Lebanese banking sector accounted for 20.35% in, up from 19.3% in Fiduciary deposits reached USD 2, million in, increasing 42.7% yearonyear. 33
35 4. SOURCES OF FUNDS 5. USES OF FUNDS 4.2 Capitalization (Tier I & Tier II Capital) Tier I Capital increased by 9.72% to USD 1, million at the end of compared to an increase of 39.49% at the end of Tier I increase can be mainly attributed to retained profits of the year amounting to USD million before dividend distribution. Tier II capital continued its decreasing trend, falling by 19.2% at the end of to USD million as a result of a 30% drop in the cumulative change in fair value due to the decline in financial assets prices. Tier I and Tier II Capital (in USD Millions) , , Tier I Capital Tier II Capital 34
36 Management discussion & analysis 5. USES OF FUNDS BLOM BANK s strategy stresses the maintenance of high asset quality and a strong portfolio of investments. The risk component, which has always been the Bank s primary consideration while assessing the uses of funds, is reflected in the return on assets ratio, at 1.33% in. The share of Lebanese Pound Treasury Bills as well as other government debt securities in foreign currencies to total assets stood at 20.27% in, up from 16.22% in Nevertheless, the share of cash and deposits at the Central Bank to total assets dropped to 25.25% in from 29.16% in 2006, while the share of bonds and financial instruments with fixed income rose to 4.65% in, up from 1.80% in On the other hand, loans granted to customers constituted 16.67% of total assets in, up from ratio of 13.99% in The Bank placements with other banks and financial institutions amounted to 30.07% of total assets in compared to 36.19% in 2006 Breakdown of uses of funds 2006 Lebanese Treasury Bills and other government bonds 1.80% 13.99% 2.64% 16.22% 4.65% 16.67% 3.09% 20.27% Cash and Central Banks Banks and Financial Institutions Bonds and Financial Instruments with Fixed Income 36.19% 29.16% 30.07% 25.25% Loans to Customers Others 35
37 5. USES OF FUNDS 5.1 Cash and Central Bank Cash and central banks reserves stood at USD 4,199 million in, up 1.33% from last year. The share of subscription in certificates of deposit amounted to 43.86% of total cash and balances with central banks, down from 57.91% in Central Banks reserves accounted for the largest share in, standing at 54.12% of total cash and balances with central banks as compared to 40.60% in 2006; while cash represented the remaining 2.02%, slightly up from its contribution of 1.49% in The cash and central banks category includes noninterest bearing balances held by the Bank at the Lebanese Central Bank (Banque Du Liban) in compliance with the obligatory reserve requirements for all banks operating in Lebanon on commitments in Lebanese Pounds (calculated on the basis of 25% of sight and 15% of term commitments). The requirement also applies to interest bearing placements at the rate of 15% of total deposits in foreign currencies, as well as the certificates of deposit issued by the Central Bank of Lebanon. Distribution of Cash and Central Banks (In USD Millions) End of Year End of Year 2006 Amount % Amount % Cash Central banks Certificates of Deposit Total 85 2,272 1,842 4, ,682 2,400 4,
38 Management discussion & analysis 5.2 Lebanese Treasury Bills and Other Governmental Bills and Bonds The Bank s portfolio of Lebanese Treasury Bills and other governmental debt securities increased by USD 46.2% to reach USD 3,370million in from USD 2,305 million in Nevertheless, the share of Lebanese pounds denominated treasury bills dropped to % of the total portfolio as compared to 57.50% in On the other hand, the foreign currencydenominated government bills constituted 52.87% of the total in as compared to 42.50% in The treasury portfolio according to the new IFRS (International Financial Reporting Standards) classification that was adopted starting 1st January 2005 shows the following: Distribution of the Treasury Portfolio ( Lebanese Treasury Bills & other Governmental Bills and Bonds ) (In USD Millions) At December 31, At December 31, 2006 Investments held for trading Treasury Bills and Bonds Accrued Interest Available for sale Investments Treasury Bills and Bonds Accrued Interest Unrealized Premiums Unrealized Discounts 3, , (41.796) 2, , (17.436) Total 3, , Distribution of the Treasury Bills and other Governmental Bills 2006 Lebanese Treasury Bills Other Governmental Bonds in Foreign Currencies 52.87% 42.50% 47.13% 57.50% 37
39 5. USES OF FUNDS 5.3 Bonds and financial instruments with fixed income Bonds and financial instruments with fixed income registered a significant 202% growth in, up to USD 773 million in from USD 256 million a year earlier as the Bank opted for a diversification of its investments in high yielding instruments that are rated BBB or above. This caption includes bonds and certificates of deposit that are classified as follows: Held for trading Available for sale Loans and receivables Distribution of Bonds and Financial Instruments with Fixed Income (in USD Millions) At December 31, At December 31, 2006 Trading Bonds Accrued Interest Available for Sale Bonds Less: provision for Impairment Accrued Interest Held To Maturity Bonds Accrued Interest Loans & Receivables Certificates of Deposit Accrued Interest Total
40 Management discussion & analysis 5.4 Banks and Financial Institutions The bank s deposits at banks and financial institutions decreased by 2.82% in to USD billion as compared to USD billion This small decrease resulted from the Bank s investments in fixed income instruments. Nonetheless, those deposits continued to represent the largest shares of the Bank s assets, accounting for 30.07% of the total in as compared to 36.17% in Time deposits constituted 95.65% of total deposits with banks and financial institutions in, slightly down from 96.12% in Like for previous years, more than 99% of the current and time deposits are denominated in foreign currencies. 5.5 Loans and Advances to Customers The Bank is following a conservative loan strategy in order to maintain a high asset quality. This strategy has been reflected by a ratio of net loans and advances to total deposits which has been successfully maintained at low levels, standing at 20.2% in. Outstanding loans reached USD 2,772 million at the end of, increasing 39.46% from last year driven by growth in regional loans. In comparison, local loans grew by 11.7% in. BLOM BANK s market share in terms of total loans and advances reached 11.6% in, up from 9.28% in Evolution of Total Loans and Advances (In USD Millions) 3,000 2,772 2,500 2,000 1,988 1,500 1, ,164 1,352 1,
41 5. USES OF FUNDS The Credit risk classification of the Bank s Loans portfolio is as follows : Credit Risk Classification of Total Net Loan Portfolio (in USD Millions) 2006 Regular Accounts Special Attention Accounts Net NonPerforming Accounts Net Doubtful Accounts Net Provisions for Commercial Loans not Classified Bad Debt Accounts Total 2, (26.55) ,772 1, (35.71) , The above loan classification is in accordance to the Central Bank of Lebanon s (Banque Du Liban s) classification under decree N dated November, 10th, 1998 and the decree related to bad debt classification dated December Below is a briefing about the basis of loan classification defining each category s characteristics. Regular Accounts A Unconditional: Covers accounts which display regular movements sufficient to repay the loan in accordance with the repayment schedule. The latest financial statements should be available and adequate collateral should be taken to cover the loan. B Incomplete file: as in point (A), adequate collateral and repayment on schedule are foreseen. However, the file is considered incomplete because the client is late in submitting his financial statements. Special Attention Accounts Display signs of irregular movements or exceed the credit limit on a continuous basis. Recent financial statements are unavailable and adverse economic conditions may affect the borrower s ability to repay the debt. Collateral has not been evaluated for the last 3 years. Such an account may be considered recoverable. However, it should be closely monitored for a year, at the end of which the account is reclassified if the previously mentioned conditions are not regularized. 40
42 Management discussion & analysis Nonperforming Accounts Covers loans which display most or all of the following: a significant drop in the client s profitability a drop in the flow of cash into the account for a period exceeding 2 years, and thus resulting in repetitive delays in repayment exceeding a period of 3 months. a noticeable depreciation in the value of the collateral provided and repetitive delays in repayment for a period not exceeding three months. credit facilities are not used partially or in whole for the purpose specified in the loan agreement. The credit risk committee will review the repayment schedule with the client and will keep the account under close observation. However, interest and commissions will be classified as unrealized until the account is regularized. Doubtful Accounts Represents loans which display all of the conditions of a nonperforming account in addition to having a complete lack of credit movement into the account for a period of 6 months and a delay in payments of the rescheduled loan which exceeds 3 months from the date of maturity. The Bank will make a partial provision for the loan and consider interest and commission as unrealized. Bad Debt Accounts Includes all Doubtful Accounts which are considered unrecoverable due to the lack of a collateral or the loss of contact with the client. In this case, interest ceases to be accrued and a provision of 100% of the principal amount of the loan is made. The account is under litigation until a ruling by the court is made, after which it is writtenoff. The improving quality of the loan portfolio was further highlighted by a decrease in the Bank s ratio of gross doubtful debts to gross total loans to 7.92% in from 10.25% in The coverage of doubtful accounts dropped to 91.57% in from 98.04% in 2006 Provisions and unrealized interest for doubtful debts and nonperforming accounts decreased by USD million to reach USD million at the end of. The amount includes provisions for commercial loans not classified at the end of after deducting the amount of USD 9 million of provisions for doubtful loans no more required and transferring provisions writtenoff amounting to USD million. 41
43 5. USES OF FUNDS The ratio of foreign currency loans with respect to total loans went up to 92.12% in from 91.72% in 2006 while the ratio of foreign currency loans to foreign currency deposits increased to 22.11% in, up from 18.86% in The breakdown of the loan portfolio by maturities shows that medium and long term loans with maturities exceeding one year constituted 28.5% of the bank s outstanding net commercial loans in as compared to 17.57% in 2006, whereas short term loans, with maturities of less than one year, constituted 71.5% of the total net commercial loans, compared to 82.43% in As for the breakdown of the loan portfolio by economic sectors, it appears that the highest share of loans was granted to trade and services activities, followed by construction and manufacturing. Loans to the agriculture sector witnessed a slight increase to 0.71% of the total loan portfolio in from 0.60% in Loans granted to the manufacturing sector dropped to 10.42% in down from 13.01% in 2006 while trade loans decreased also from 30.37% in 2006 to 24.22% in with 7.41% of the portfolio granted to retail trade and 16.81% to wholesale trade. Loan portfolio to the services sector slightly improved to 20.69% in, up from 20.21% a year earlier. The construction sector witnessed a strong boom in, driven mainly by the postwar reconstruction projects, and accounted for 16.73% of the loan portfolio for the year, up from 7.19% in Loans given to freelance professions dropped further to 8.08% in from 12.65% in Finally, consumer loans recorded a significant increase to 19.15% in, up from 15.99% in Distribution of Loans by Economic Sector 2006 Agriculture and Forestry Manufacturing 13.01% 30.37% 10.42% Trade 0.60% 0.71% 24.22% Services 15.99% Construction 19.15% Freelance Professions 12.65% 8.08% Consumer Loans 7.19% 20.21% 16.73% 20.69% 42
44 Management discussion & analysis The analysis of the loan portfolio by type of collateral reveals that the commercial loans secured by mortgages accounted for the largest share of the portfolio, despite a small drop from 29.30% in 2006 to 28.07% in. Similarly, advances against personal guarantees decreased, representing 11.96% of the total loans portfolio in, down from 16.60% in Advances against cash collateral dropped also to 17.09% in from 19.78% in On the other hand, the share of LC financing went up to 2.86% in, up from 1.62% in 2006 and syndicated loans stood at 0.27% in, up from nil a year earlier. Retail loans recorded an important increase in, with its share in the total loan portfolio going up to 19.15% in from 15.99% in Loans to members of staff increased to 0.20% from 0.13% while loans to directors and related parties accounted for 2.44%, up from 0.04%. Overdraft also increased in, representing 17.96% of the total loans portfolio in from 16.36% in Distribution of Loans by Type of Collateral 2006 Advanced Against Personal Guaranties LC Financing Syndicated Loans Advanced Against Cash Collateral 0.04% 0.13% 15.99% 16.36% 29.30% 17.96% 2.44% 0.20% 19.15% 28.07% Retail Loans Loans to Member of Saff 0.00% 19.78% 16.60% 1.62% 0.27% 17.09% 2.86% 11.96% Loans to Directors Overdraft Commercial Loans Secured by Mortages 43
45
46
47 6. LIQUIDITY 7. PROFITABILITY 6. LIQUIDITY BLOM BANK s ability to maintain high liquidity levels, minimizing risks and ensuring high quality of assets, has been at the centre of liquidity management and core objectives of the Group. The Bank has successfully maintained ample liquidity in, despite a light drop in its ratio. As such, the Lebanese Pound liquidity ratio (including Lebanese government Treasury Bills) stood at % in compared to % in 2006, reflecting high liquidity levels. Moreover, the immediate liquidity (cash & banks) in foreign currencies accounted for 63.24% of foreign currency deposits in compared to 78.26% in 2006, a small drop mainly due to the Bank s regional expansion activities. Maturity mismatch between assets and liabilities, which characterises the Lebanese banking sector, was also noticeable in BLOM BANK accounts. In, the gap was negative in the maturities from zero to one month and from 1 to 3 months, amounting to USD 4,530 million and USD 1,872 million respectively. Afterwards, the maturity gaps turned back positive, reaching a maximum of USD 3,639 for maturities of 2 to 5 years. AssetLiabilities Maturity Gap (In USD Millions) Up to 1 Month From 1 to 3 Months From 3 to 6 Months From 6 Months to 1 Year From 1 to 2 Years From 2 to 5 Years Over 5 Years Total Total Assets Total Liabilities & Shareholder s Equities Liquidity Gap Cumulative Maturity Gap 6,861 11,391 (4,530) (4,530) 1,015 2,887 (1,872) (6,402) (6,086) (5,647) 1, ,734 (3,913) 3, ,639 (274) 1,751 1, ,628 16,
48 Management discussion & analysis 7. PROFITABILITY BLOM BANK was ranked first by net profits in Lebanon in. In fact, the Bank recorded net profits of USD million for the year, increasing 13.53% compared to the year 2006 where net profits reached USD million. Returnonaverage equity stood at 15.65% in, down from 16.81% a year earlier. Returnonaverage assets for the year amounted at 1.33%, slightly less than 1.38% in 2006 due to the larger growth in assets of 17% compared to a 13.53% rise in net profits. Earning per share increased from USD 7.28 in 2006 to USD 8.22 in. Evolution of Net Income (In USD Millions)
49 7. PROFITABILITY 7.1 Net Interest Income Net interest income registered a 12% increase in to USD million. The growth came as a result of a 17.9% increase in interest and similar income to USD million in, despite a 20.6% increase in interest charges in to reach USD million. On the other hand, net interest revenue after provisions and doubtful loans, went up by 15.03% to reach USD million in as compared to USD million in The growth of net interest income will be further elaborated through the breakdown of net interest income into interest and similar income, interests and similar charges, interest margin as well as net provisions for doubtful loans Interest and Similar Income Interest and similar income witnessed a 17.9% increase in, after a hike of 35.67% in Average interest earning assets increased by 16.1% to reach USD 13,359 million in from USD 11,507 million in The below table illustrates the breakdown of average earning assets by currency at the end of : Breakdown of Average Interest Earning Assets at the End of (In USD Millions) LBP Foreign Currencies Total Lebanese Treasury Bills and Other Governmental Bills Deposits with Banks and Central Banks Bonds and Other Financial Instruments with Fixed Income Including Certificates of Deposit Loans and Advances Total 1, ,257 1,248 5,723 1,996 2,135 11,102 2,615 5,838 2,581 2,325 13,359 48
50 Management discussion & analysis In, the weights of interest and similar income components remained very similar to those of the year Lebanese and other government bills accounted for 19.57% of total average interest earning assets in, decreasing modestly from 21.13% in The average deposits with banks and central banks stood at 43.70% of the total in, up from 42.25% in The share of bonds and other financial instruments with fixed income, including certificates of deposits, accounted for 19.32%, down from 20.57% a year earlier while the weight of loans and advances increased to 17.40% in, compared to 16.04% in The breakdown of Interest and Similar Income is detailed in the following table: Breakdown of Interest and Similar Income (In USD Millions) End of End of 2006 Amount % of Total Amount % of Total Lebanese Treasury Bills and Other Governmental Bills Deposits with Banks and Central Banks Bonds and Other Financial Instruments with Fixed Income Including Certificates of Deposit Loans and Advances Including Related Parties Total % 32.79% 23.36% 20.55% % % 29.69% 25.67% 19.12% % The breakdown of interest and similar income reveals a decrease in the share of Lebanese Treasury Bills and other government bills to 23.30% in compared to 25.52% in On the other hand, the portion of income generated from deposits with banks and central banks increased to 32.79%, up from 29.69%; while the contribution of bonds and other financial instruments with fixed income (including certificates of deposit) stood at 23.36% in, down from 25.67% a year earlier. Finally, interest income generated from loans and advances including related parties represented 20.55% of the total in, increasing from 19.12% in
51 7. PROFITABILITY Breakdown of Interest and Similar Income 2006 Deposits with Banks and Central Banks Bonds and Other Financial Instruments with Fixed Income Including Certificates of Deposit 19.12% 25.52% 20.55% 23.30% Loans and Advances Lebanese Treasury Bills and Other Governmental Bonds 25.67% 26.69% 23.36% 32.79% Interest and Similar Charges Interest and similar charges increased 20.6% to USD 686 million in up from USD 569 million in 2006, while average interest bearing liabilities went up by 16.9% to USD 12,870 million compared to USD 11,011 million a year earlier. Deposits from customers including related parties accounted for the largest share of the average interest bearing liabilities, amounting to 97.40% in while deposits from banks and financial institutions represented the remaining 2.59%. Average Interest Bearing Liabilities at the End of (In USD Millions) LBP Foreign Currencies Total Deposits and Similar Accounts from Banks and Financial Institutions Deposits from Customers Including Related Parties Total 3 2,168 2, ,368 10, ,536 12,870 50
52 Management discussion & analysis The breakdown of the interest and similar charges shows a modest increase in the portion of deposits and similar accounts from banks and financial institutions to 1.85% in, up from 1.56% in 2006 while the share of interest paid on customers deposits slightly retreated to 98.15% in compared to 98.44% in Finally, charges from notes and fixed income financial instruments remained nil for the second year on a row. Breakdown of Interest and Similar Charges (In USD Millions) Amount End of % of Total Amount End of 2006 % of Total Deposits & Similar Accounts from Banks & Financial Institutions Notes & Financial Instruments with Fixed Income Deposits from Customers Including Related Parties Total % 0.00% 98.15% % % 0.00% 98.44% % Distribution of Loans by Type of Collateral 2006 Deposits from Customers Including Related Parties Deposits and Similar Accounts from Banks & Financial Institutions Notes and Financial Instruments with Fixed Income 1.56% 0.00% 1.85% 0.00% 98.44% 98.15% 51
53 7. PROFITABILITY Interest Margin (Before Provisions For Doubtful Loans) The Bank s Net Interest Income before provisions for doubtful loans rose by 11.4% in to USD million, while the net interest margin before provisions on doubtful loans stood at 2.03% in, down from 2.13% in The ratio of interest charges to interest income increased to 69.4% up from 67.8% in 2006 due to a larger increase in interest charges as compared to interest income. Net Interest Income (Before Provisions) (In USD Millions) Net Interest Margin (in percent) 2.50% 2.00% 2.34% 2.13% 1.75% 1.77% 2.13% 2.03% 1.50% 1.00% 0.50% 0.00%
54 Management discussion & analysis Net Interest Margin (in percent) 72.0% 71.0% 70.40% 70.91% 71.25% 70.66% 70.0% 69.0% 69.40% 68.0% 67.81% 67.0% 66.0% Net Provisions for Doubtful Loans The net provisions for doubtful loans increased from USD million in 2006 to a positive balance of USD million in. 53
55 7. PROFITABILITY 7.2 NonInterest Income Noninterest income increased by 21.6% yearonyear, amounting at USD million in compared to USD million in Breakdown of NonInterest Income (In USD Millions) 2006 % Change Amount % of Total Amount Total % of Net commission Net income from financial operations Other income Total (38.59) 21.6 Net commissions maintained the largest share of the total noninterest income, accounting for 69.30%, decreasing slightly from 72.23% in Net income from financial operations represented 28.49% of total noninterest income in, registering a rise of 48% compared to 2006 due to the active private banking and asset management operations. Other net income accounted for 2.21% of the total, decreasing 38.59% yearonyear. Constituents of NonInterest Income 2006 Net Commissions Net Income From Financial Operations 23.40% 4.37% 28.49% 2.21% Other Income 72.23% 69.30% 54
56 Management discussion & analysis 7.3 Staff and Operating Expenses Staff and operating expenses reached USD million in, registering a 14.85% increase yearonyear. Staff (salaries and related benefits) increased by 14.89% in to USD million while operating expenses went up by 14.79% to reach USD million. Staff expenses accounted for the largest share of staff and operating expenses with 61.36% of the total while operating expenses stood at 38.64% of the total. BLOM BANK is successfully maintaining a low costtoincome ratio, reflecting the Bank s costcontainment policy. In fact, costtoincome ratio dropped further to 34.63% in compared to 35.31% in Distribution of Staff and Operating Expenses (In USD Millions) 2006 % Change Amount % of Total Amount Total % of Staff Expenses Operating Expenses Total Cost to Income Ratio 55% 50% 47.34% 45% 40% 35% 42.56% 40.93% 39.77% 38.37% 38.09% 38.58% 36.80% 34.11% 35.10% 34.63% 30% 25%
57

58
59 8. DIVIDEND DISTRIBUTION &PREFERRED SHARES REVENUES 9. CAPITAL ADEQUACY RATIOS 10. INTEREST RATE RISK 11. RISK MANAGEMENT & BASEL II PREPARATIONS 8. DIVIDEND DISTRIBUTION &PREFERRED SHARES REVENUES During BLOM BANK s Annual General Assembly, on April 9th, 2008, the distribution of dividends for the year was approved. Preferred shares, issue 2002, will yield USD 15, while the preferred shares, issue 2004, will pay USD 8.5 and their corresponding 2005 issue will give USD 9.5. As for the common stocks and Global Depositary Receipts (GDR), each will pay a dividend of LBP 5,500 per share. 9. CAPITAL ADEQUACY RATIOS The Bank s capital adequacy ratio reached 31.53% (before dividend distribution) at the end of, a ratio which is almost four times the international ratio of 8% required by the Basel Commission. For Tier I capital alone, the capital adequacy ratio stood at 31.07% at the end of. After dividend distribution, the capital adequacy ratio reached 29.05% for Tier I &Tier II and 28.60% for Tier I alone. Capital Adequacy Ratios (After Dividend Distribution ) 40.00% 36.10% 35.00% 35.00% 33.23% 35.33% 30.00% 29.88% 29.76% 28.22% 30.71% 29.05% 25.00% 26.06% 28.02% 27.34% 28.60% 20.00% 15.00% Tier I Capital Tier I + Tier II Capital 58
60 Management discussion & analysis 10. INTEREST RATE RISK Interest rate risk arises from adverse movements in interest rates, affecting the interest earning assets and liabilities of the bank. Interest rate risk is well managed through the continuous repricing of assets and liabilities. Most assets and liabilities are repriced within one year. With the major parts of the Bank s deposits repriced within the 3 months interval, interest rate risk continues to be concentrated within this period, while the biggest part of Bank s treasury bills and governmental bonds portfolio being repriced after the 3 months period. The bank s interest rate sensitivity position based on contractual repricing arrangements as of December 31, is as follows: InterestRate Sensitivity Position at the end of (In USD Millions) Up to 1 Month From 1 to 3 Months From 3 to 6 Months From 6 Months to 1 Year From 1 to 2 Years From 2 to 5 Years Over 5 Years Nonsensitive to interest rate risk Total Assets Total Liabilities and Shareholder s Equilty Interest Rate Sensitivity Gap for Cumulative Interest Rate Sensitive Gap 5,641 10,647 (5,006) (5,006) 878 2,634 (1,756) (6,762) (6,497) (6,025) 1, ,743 (4,282) 3, ,730 (552) 1, , ,689 2,559 (870) RISK MANAGEMENT & BASEL II PREPARATIONS BLOM BANK s responsibility for establishment of effective risk management practices and culture lies with the Board of Directors as does the setting up of the bank s risk appetite and tolerance levels. The Board of Directors delegates through its Risk Management Committee the daytoday responsibility for establishing and monitoring of risk management processes across the bank s group to the Head of Risk Management, who is directly appointed by the Board of Directors and works closely with the bank s Executive Senior Management in Beirut. 59
61 11. RISK MANAGEMENT & BASEL II PREPARATIONS 12. UNIVERSAL BANKING SERVICES In addition to the Group s Risk Management in Beirut, risk managers and/or risk officers were assigned within the Group s foreign subsidiaries or branches to report to the department and Executive Senior Management in a manner that ensures: Standardization of risk management functions and systems across the Group. Regional consistency of conducted business in line with the Board s approved risk appetite. As regards to Basel II capital adequacy ratio calculations, the Risk Management Department started, since December 2004 s consolidated balances, to issue internal reports to Executive Management and the Board revealing multiple scenarios of capital charges calculations for credit and market risks under the Standardized approaches and for operational risk under the Basic Indicator approach. In addition, the bank has submitted to the Lebanese Banking Control Commission two Quantitative Impact Studies for the Basel 2 capital adequacy calculations for June and December balances, and is maintaining a ratio well above the minimum international requirement of 8%. In December 2006, the bank acquired, through an enterprisewide license, the Moody s KMV Risk Advisor, a stateoftheart credit analysis and rating system for corporate and commercial borrowers, in order to aid the bank in moving at a later stage to internal ratingsbased measurements under Basel II. The credit risk team is responsible for the implementation and administration of the Moody s Risk Advisor system along with the generation of internal ratings for all analyzed credit files. In terms of market risk, the department is responsible for generating internal reports quantifying the Bank s liquidity risk and earnings at risk due to extreme movements in interest rates, while daily monitoring the sensitivity of the bank s trading portfolio of fixed income securities to changes in market prices and/or market parameters. All abovementioned reports as well as interest rate sensitivity and liquidity gaps are reported to Executive Senior Management and to regulatory authorities on a monthly basis. This is done in line with the bank s Asset & Liability Management (ALM) policy which assigns authority for its formulation, revision and administration to the Asset/Liability Management Committee (ALCO) of BLOM BANK s.a.l. The market risk team is responsible for monitoring compliance with all limits set in the ALM Policy and is also in the process of implementing the newly acquired (October ) Asset & Liability Management system Focus ALM by Sungard, which provides for ALM analysis from both static and dynamic perspectives including stress testing and extensive scenario analysis. 60
62 Management discussion & analysis As for operational risk, the department conducted a series of operational risk assessments on head office departments and functions and on local and foreign branches, resulting in a set of amendments on operational procedures and system processes. In addition, a loss incident reporting system has been introduced to record losses across the bank s operating activities, as the bank builds up an operational risk database in line with regulatory and Basel 2 directives. The operational risk team is responsible for continuously introducing modifications on the bank s core banking application in relation to specificbranchoperations and control measures. At the same time, Risk Management has broken down the bank s internal accounts according to Basel 2 designated business lines with losses apportioned accordingly and in preparation for later moving on to the more advanced approaches of operational risk measurements Corporate Governance The Board of Directors of BLOM BANK sal approved a Corporate Governance Code at the end of. The Code applies to BLOM BANK sal and its Lebanese subsidiaries and affiliates. It complies not only with Lebanese laws and regulations, but also with the Basel Committee directives on Corporate Governance for Banks. The Code covers shareholders rights and key ownership functions as well as their constitution. It also clarifies the Board s structure and composition, its role, duties and functions. Issues related to Board meetings, practices and committees are discussed as well as those related to management committees and the internal control system. The Code highlights the importance of stakeholders relations with the Bank s own human resources as well as with customers and suppliers, and also the prominence of banking ethics in the conduct of business. The Code is designed to enforce transparency and clarity of reporting lines in guiding the Bank s operations, policies and strategies, and in helping deliver the highest quality of service to the Bank s clients and value to its shareholders. 12. UNIVERSAL BANKING SERVICES In line with its policy of maximizing customers satisfaction and increasing shareholders value, BLOM BANK has sustained the diversification of its products and services. BL0M BANK GROUP provides the following universal banking services that suit all customers needs: Commercial corporate banking Private and investment banking Retail banking Islamic banking Insurance products & services 61
63 12. UNIVERSAL BANKING SERVICES 12.1 Commercial and Corporate Banking BLOM BANK continues to apply a conservative lending policy. Throughout, the bank expanded its credit portfolio to corporate and commercial customers especially in projects finance and real estate developments. In addition, the bank has financed several hotel projects in Beirut Central District (BCD) and other promising touristic areas. BLOM BANK has also catered for the commercial sector, in particular trade and working capital financing. Furthermore, the bank s policy is to expand even further in regional countries to satisfy the needs of the Lebanese and Arab expatriates in those countries. With the collaboration of IFC, BLOM has extended unique soft loans to customers affected by the July 2006 war with the objective of helping them overcome the consequences of this war and enabling them to recover their prewar financial status Private and investment banking BLOM BANK provides private banking services such investment consulting and portfolio management through both its investmentbanking arm BLOMINVEST Bank Sal and its Genevabased affiliate BLOM Bank Switzerland. Some of these services are listed below: Investment Products: includes a variety of investment funds and structural products focusing on Lebanese and foreign instruments. The first, BLOM Cedars Balanced Fund, launched in early 2008 and is considered the first investment vehicle of its kind in Lebanon for its equity and fixedincome investments. Project Finance : consists of extending medium and long term financing and in participating in bank loan syndications. Treasury & Capital Market Services: includes brokering on the Beirut Stock Exchange (BSE), advising on trades in international equities, trading in debt securities and dealing in the foreign exchange markets. Investment Banking: participates in the underwriting and distribution of Lebanese and other debt instruments and provides advices on mergers and acquisitions and privatisation. Asset & Portfolio Management: covers management of portfolios of shares, bonds and term placements in all currencies. Research Department : produces weekly and quarterly reports on the Lebanese economy, and analyzes leading Lebanese economic sectors. In addition, it provides country reports on regional economies, especially those where BLOM Bank has a presence. It publishes as well the BLOM Stock Index (BSI), Lebanon s first financial market index that covers all stocks quoted on the BSE, and conducts equity research on major Lebanese and regional companies. 62
64 Management discussion & analysis 12.3 Retail Banking As of December 31,, BLOM BANK offered more than 110 retail products, classified in different families: Payment cards: BLOM BANK offers a wide range of payment cards that target different customers, provide different methods of payments and meet different purposes. As such, BLOM Visa comes in Classic, Gold and Corporate; also the Bank offers Internet cards dedicated for Internet users, Platinum and Platinum Black cards as well as Mini cards. In addition, the Bank has been the pioneer in launching the first Titanium MasterCard in Lebanon. In, BLOM introduced the Alfa BLOM Mastercard, a first of its kind in Lebanon and the Middle East, offering to its holders free minutes on the Alfa Active and Alfa Classic lines. Also in, a new card Watan was launched for the Lebanese army, internal security and national security forces. Rewards programs: BLOM Golden Points Loyalty program enables customers to win a variety of gifts such as airline tickets, free stays at the finest hotels, electronics and much more by accumulating Golden points with every $100 purchases using the card. In addition to this, BLOM Gifts Loyalty program allows cardholder to win valuable gifts for purchases at certain merchants over a period of 6 months. Consumer loans: BLOM BANK customers can take advantage of a number of consumer loans on offer such as KARDI for personal loans, SAYARATI for car loans, DARATI or Housing CPH for house loans and PC loans. Saving plans: BLOM BANK offers DAMANATI, a retirement saving plan denominated in US Dollar coupled with life insurance. Moreover, WALADI a savings program dedicated to child s education, coupled with life insurance is also offered to the Bank s customers. Ebanking: BLOM BANK offers to its customers phone banking services such as Allô BLOM ( a 24hour customer service) as well as internet banking services such as eblom. In addition, the Bank provides free of charge SMS ALERT services, enabling customers to be alerted whenever the balance of accounts changes or whenever a transaction is being performed. 63
65 12. UNIVERSAL BANKING SERVICES 13. INFORMATION SYSTEM & TECHNOLOGY 12.4 Islamic banking Blom Development Bank (BDB), a full fledged Islamic bank, was established in February 2006 and started operation in march. BDB carries out all its banking and investment transactions in compliance with provision of the Islamic Shari a and pursuant to the instructions and regulations issued by Banque Du Liban and the direction of its Shari a Board consisting of the three prominent shari a scholars. BDB business covers all spectrum of banking services including, acceptance of deposits provision of various Islamic financing solutions in the form of Murabaha, Ijara, Tawaruk, Forward lease, Wakala and istisna a. Since its inception, BDB established relationships with major Islamic Banks and Investment Companies operating in the region and played a major role in developing products which suits the requirements of its clientele; On the Retail side Al Yassir Restricted Investment Account was introduced aiming at providing depositors with monthly profit distribution resulting from Sharia compliant shortterm investments concluded with rated Islamic institutions. Furthermore, Mowasalati, car Murabaha finance as well as Manzili home Murabaha finance, were initiated aiming at providing Islamic wary customers with Islamic solutions to finance their acquisitions of cars and homes based on Murabaha structure which could be later adjusted to suit an Ijara structure as per customers requirements. On the international financing front, BDB participated with other regional Islamic Banks in raising funds in favor of major corporations operating in the Gulf and played a major role in the issuance of two Islamic Sukuk transactions, namely: the Wakala Sukuk to Berber Cement co and the Ijara Sukuk to Dar Al Arkan On the collective investment front, BDB is currently exploring lot of investment opportunities in several asset classes and is in the process of developing products carrying acceptable returns compared to the risks involved and shall, during the course of next year s launch such products to savvy investors Insurance Products & Services Life and nonlife insurance products and services are offered through our subsidary Arope Insurance in Lebanon. Our second insurance subsidary, Arope Syria, provides as well insurance services in Syria. 13. INFORMATION SYSTEMS & TECHNOLOGY In today s technologydriven world, it is a wellknown fact that if you are standing still, you are falling behind. That is the reason why we are constantly seeking to grow and evolve our 64
66 Management discussion & analysis business by proactively using powerful information technologies. Thus, we have been putting Information Technology, Finance and Relationship Management in partnership using leadingedge technology deployments in order to enhance customers experiences, enrich products and services portfolio, achieve Enterprise Application Integration (EAI), streamline business processes by transforming them into STP (Straight Through Processing) mode, address national and international compliance and regulatory requirements (such as Basel II and others ) and improve systems availability and reliability Customer Relationship Management During this year, we kept on developing our eblom suite, which encompasses advanced electronic customer relationship management (ecrm) services. Through the eblom initiative, we have been interacting with our customers however, wherever and whenever they desire. Our eblom suite of integrated electronic banking delivery channels consists of: eblom ALLO BLOM the Bank s Interactive Voice Response System eblom Internet Banking our online banking service that offers a wide array of services in a high level of trust and security enabled by a public key infrastructure (PKI) and digital certificates as a second factor for authentication. eblom SMS Alerts a realtime alerting system based on delivering messages to our customers mobile phones to inform them, instantly, about events in relation with their accounts or cards. eblom Contact Center our contact center is available 24 hours a day all year long and is benefiting from continuous enhancements based on CTI and IP telephony to achieve seamless integration with the Bank s CRM application. eblom Self Service using the bank Network of ATMs deployed all over Lebanon and where additional services are being constantly planned and added. eblom Live Information Broadcasting System a system that enables the bank to broadcast in realtime over large LCD screens deployed at the branches live and updates information covering stock quotes, foreign exchange quotes, news feeds ect... 65
67 13. INFORMATION SYSTEM & TECHNOLOGY 14. PEOPLE DEVELOPMENT 13.2 Targeted Marketing Systems In addition, we identified the need to provide customerfacing employees with a powerful tool that would allow them to present new products and services to customers during their presence at the branch. Consequently, we introduced T.I.P.S. which stands for Targeted Information Processing System and which includes a teller lead referral system coupled with a backoffice marketing management system. The aim of this tool is to increase our marketing campaigns efficiency by improving the hit rate of marketing campaigns by offering customers new products and services that are tailored to their needs. In addition, this system has the ability to send instant SMS messages containing information pertaining to our marketing campaigns while the customer is visiting his/her branch Enterprise Application Integration (EAI) Moreover, as a financial institution that has been around for over 55 years, we have in place well defined business processes and rules that allow us to deliver banking products and services to our customers and to manage our internal operations. However, we identified the need to reorganize these business processes in order to achieve a higher degree of automation. To this end, we decided to adopt the Service Oriented Architecture (SOA) framework to achieve the highest degree of integration between our different applications through the use of webservices and of a powerful and flexible workflow engine thus achieving straightthrough processing (STP) throughout our different systems. This EAI framework was applied to many processes, in particular, our consumer loan processing system consisting of a loan origination system, a loan assessment system, and a loan granting system. This high degree of automation has allowed us to drastically reduce the time to process a car loan from origination to final approval and to increase the volume of our car loan activity, and consequently sustain our uncontestable leadership position in the car loan market. The success of the EAI framework implementation has led us to plan the movement of many of the bank s business processes into this system during the coming year Advanced Electronic Payment Systems On the other hand, and based on our recently deployed EFT SWITCH we have completely insourced our ATM driving, management and monitoring activities. In addition, we became an active player in the POS market thus gaining more and more on POS market share. On the cards issuing side, we continued to develop our Information Systems infrastructure in order to keep adding more features to our existing cards products and loyalty programs, in addition to introducing new types of payment cards including Visa prepaid cards with online refill capability, Visa EURO Cards, Credit cards with grace period, BLOM MasterCard cards, 66
68 Management discussion & analysis Cobranded cards; and we also started issuing EMV cards. In addition, we introduced an online card fraud monitoring system capable of sending realtime alerts to the bank call center agents, thus enabling for immediate action and insight as well as reporting and tracking should a fraud pattern be detected. This card fraud monitoring system drastically reduced fraud losses and incidences Basel II Compliance Regarding the Basel II rules and regulations, we have taken several measures in order to be compliant with these regulations and, in particular, we have completed the implementation of a system from MOODYS for corporate and commercial credit risk rating, and we started the implementation of an Assets and Liabilities management and Funds Transfer Pricing system in partnership with SUNGARD Systems High Availability Finally, it is worth noting that we have constantly in mind our information security and availability, where we are looking very closely at ensuring the highest possible availability for our systems, raising employees awareness through the development of Information Security Policies and Procedures and addressing security threats and systems failure incidents proactively through implementing advanced preventive and detective controls and online monitoring systems and procedures 14. PEOPLE DEVELOPMENT The Bank has proceeded with its policy of growth through development and training of employees by organizing intensive inhouse and external training sessions as well as the recruitment of a young and skilled workforce. In, the number of the Bank s employees reached 2,759 compared to 2,216 in In, BLOM BANK expanded further its range of services, launching the asset management department, responsible for promoting structured products, besides developing other business lines such as investment banking and brokerage. 67
69 13. INFORMATION SYSTEM & TECHNOLOGY 14. PEOPLE DEVELOPMENT 15. BANK S OPERATIONAL EFFICIENCY 16. REGIONAL EXPANSION Regarding training activities and development of human resources, BLOM BANK organized and sponsored the participation of its employees in various seminars and workshops. The Bank has also in place special training programs such as: Manager Training Program (MTP): a fiveyear program where the Manager Training Officer (MTO) gets exposed to the different departments and entities within the Bank before being assigned to a managerial position Fast Track Program (FTP): a fiveyear program which promotes a fast career path for the employees. In, the Bank conducted 6,444 employees training sessions for a total of 45,785 hours. Training sessions involved employees from all BLOM and BLOMINVEST departments and covered various topics related to banking techniques, management, marketing, information technology as well as language courses. 15. BANK S OPERATIONAL EFFICIENCY In, the net profit by branch decreased by 7.55% to USD 1,898,148 while the net profit per employee also dropped by 8.87% to USD 74,302 compared to USD 81,538 a year earlier. Bank s Operational Efficiency Indicators Number of Employees Number of Branches USD Net Profit per Employee USD Average Assets per Employee USD Average Assets per Branch USD Net Profit per Branch 2, ,302 5,154, ,685,185 1,898, , ,538 6,416, ,586,009 2,053, REGIONAL EXPANSION BLOM BANK pursued its aggressive expansion policy, inaugurating new branches within the Lebanese territory and expanding further regionally. On the local front, in, BLOM BANK opened four additional branches in the areas of Tabaris (Beirut), Jbeil, Mina El Hosn as well as a retail branch in Hamra Street. The Bank is looking forward to expanding further its local network and is planning to inaugurate new branches within the year On the regional front, two new branches have been inaugurated in Jordan during the year while two others should be opened in the incoming year, rising the total number of BLOM BANK branches in Jordan to six. 68
70 Management discussion & analysis BSO (Bank of Syria and Overseas) is also expanding in Syria and opened, in, a new branch in Aleppo. BSO is focusing on developing its branches network within Syria in 2008 and the Bank has set the robust objective to increase the number of its branches from 10 to 20 by the end of the year BLOM BANK EGYPT is also expanding its network in Egypt and the number of branches in operation has increased from 9 branches in 2006 to 20 branches in. On another note, the five branches located in Romania and previously affiliated to BLOM BANK EGYPT, have been consolidated with BLOM BANK FRANCE in December. In 2008, the Bank is looking forward to bringing the number of its branches in Egypt to 30, in line with BLOM BANK group s robust expansion strategy. On another note, BLOM BANK was awarded license to establish a representative office in Abu Dhabi by the end of while BLOMINVEST BANK received the approval to launch in January 2008 an investment bank in Saudi Arabia named BLOMINVEST Saudi Arabia. In April 2008, the Bank expanded further and was granted a license to establish a commercial and private bank in Qatar, financial center, BLOM BANK QATAR. In addition BLOM BANK FRANCE has applied for a bank license in Algeria. All in all, in the incoming years, BLOM BANK is looking forward to penetrating new Arab markets enhancing its market accessibility and developing further its international network. 69

71
72
73
74 CONSOLIDATED FINANCIAL STATEMENTS

75 74 INDEPENDENT AUDITORS REPORT TO THE SHAREHOLDERS OF THE BLOM BANK SAL CONSOLIDATED INCOME STATEMENT Year ended 31 December
76 CONSOLIDATED INCOME STATEMENT Year ended 31 December Interest and similar income Lebanese and other governmental treasury bills and bonds available for sale Lebanese and other governmental treasury bills and bonds trading Deposits and similar accounts with banks and financial institutions Bonds and other financial assets with fixed income non trading Bonds and other financial assets with fixed income trading Bonds and other financial assets with fixed income fair value through profit or loss Loans and advances to customers Loans and advances to related parties Interest and similar charges Deposits and similar accounts from banks and financial institutions Deposits from customers and other credit balances Deposits from related parties Net interest received NOTES 1,490, ,600 5, , , , (1,034,637) (19,112) (1,010,636) (4,889) 456,112 Restated ,264, ,473 3, , ,649 1, , (857,569) (13,342) (838,657) (5,570) 407,255 Net provisions less recoveries on loans and advances Provisions for loans and advances Recovery of provisions for loans and advances 4 11,435 (20,026) 31,461 (808) (19,660) 18,852 Revenues from shares and financial assets with variable income 969 1,123 Net commissions Commissions received Commissions paid 5 89,380 96,007 (6,627) 76,989 81,804 (4,815) Profit from financial operations Profit from trading investments Profit from nontrading investments Profit from foreign exchange operations ,376 3,843 18,469 27,064 45,505 10,381 10,037 25,087 Loss on financial operations Loss on trading investments Loss on nontrading investments Loss on foreign exchange operations 6 7 (9,708) (1,820) (7,888) (18,706) (3,796) (514) (14,396) Net profit from financial operations 39,668 26,799 Other operating income 8 24,618 22,394 Other operating expenses 9 (14,446) (11,675) General and administrative expenses Salaries and related benefits General operating expenses (210,450) (129,133) (81,317) (183,238) (112,399) (70,839) Depreciation and amortization of tangible and intangible assets 12 (18,350) (16,143) Net provisions less recoveries on financial fixed assets 395 Provision for contingent liabilities 13 (13,350) (1,458) Profit before tax 365, ,633 Income tax (57,000) (49,829) Profit for the year 308, ,804 Basic/ diluted earnings per share attributable to equity holders of the parent for the year (in LL) Attributable to: Equity holders of the parent Minority interest The accompanying notes 1 to 56 form part of these consolidated financial statements , ,472 5, ,586 10, ,604 2, ,804 75
77 CONSOLIDATED BALANCE SHEET At 31 December CONSOLIDATED BALANCE SHEET At 31 December NOTES Restated 2006 ASSETS Cash and balances with the Central Banks Lebanese and other governmental treasury bills and bonds Bonds and financial assets with fixed income Shares, securities and financial assets with variable income Banks and financial institutions Current accounts Time deposits Loans and advances to customers (*) (**) Commercial loans Other loans to customers Overdraft accounts Net debtor accounts against creditor and cash collateral accounts Advances to related parties Doubtful debts (net) Bank acceptances Investments and loans to related parties Tangible fixed assets Intangible fixed assets Other assets Regularization accounts and other debit accounts Goodwill ,330,031 5,080,323 1,165,140 11,725 7,536, ,558 7,208,975 4,179,307 3,228, ,043 11,932 14,308 5,940 70, ,357 27, ,642 4,459 34, ,487 60,586 6,246,406 3,474, ,100 8,403 7,754, ,789 7,453,495 2,996,698 2,388, ,241 8,190 10,826 7,400 60, ,260 3, ,372 2,845 33,715 61,408 63,980 TOTAL ASSETS 25,067,014 21,424,611 * Of which substandard loans ** After deduction of: Provision for doubtful debts and provision for commercial and consumer loans not classified at the balance sheet date Unrealized interest on: Substandard loans Doubtful debts , ,209 82,968 14,238 68,730 34, ,156 87,593 13,899 73,694 OFFBALANCE SHEET ITEMS Financial assets sold with an option to repurchase Engagements received Bad loans fully provided for Foreign currencies to deliver against foreign currencies to receive ,647 7,088,518 28,312 2,939,186 10,199,663 5,467,773 43,905 2,144,617 7,656,295 The consolidated financial statements were authorized for issue in accordance with a resolution of the board of directors on 18 March
78 CONSOLIDATED BALANCE SHEET At 31 December NOTES Restated 2006 LIABILITIES AND EQUITY LIABILITIES Banks and financial institutions Current accounts Time deposits Customers' deposits Sight deposits Time deposits Saving accounts Credit accounts and cash margins against debit accounts Related parties accounts Engagements by acceptances Other liabilities Regularization accounts and other credit accounts Provisions for risks and charges ,555, ,913 1,369,001 20,708,516 2,341,594 9,589,749 7,862, , , , , ,792 80,566 1,308, ,362 1,149,482 17,690,381 1,897,765 7,874,196 7,180, ,696 75, , , ,869 64,646 TOTAL LIABILITIES 22,974,605 19,508,067 EQUITY ATTRIBUTABLE TO EQUITY HOLDERS OF PARENT Share capital Revaluation reserves Reserve for general banking risks Reserves and premiums Cumulative changes in fair values Treasury shares Retained earnings Profit for the year MINORITY INTEREST ,000 14,727 69,503 1,221,804 14,497 (36,122) 176, ,472 2,004,335 88, ,000 14,727 59,324 1,162,790 21,430 (52,108) 121, ,604 1,837,373 79,171 TOTAL EQUITY 2,092,409 1,916,544 TOTAL LIABILITIES AND EQUITY 25,067,014 21,424,611 OFFBALANCE SHEET ITEMS Financing commitments given to: Financial intermediaries Customers Bank guarantees given to: Financial intermediaries Customers Commitments on term financial instruments Financial assets bought with an option to resell Fiduciary deposits, assets under management and custody accounts Foreign currencies to receive against foreign currencies to deliver ,374 21, , , , ,618 34, ,647 3,959,136 2,942,549 8,225, ,186 13, , ,528 96, ,430 17,659 2,774,360 2,146,755 5,935,488 The consolidated financial statements were authorized for issue in accordance with a resolution of the board of directors on 18 March The accompanying notes 1 to 56 form part of these consolidated financial statements. 77
79 CONSOLIDATED CASH FLOW STATEMENT For the year ended 31 December CONSOLIDATED CASH FLOW STATEMENT For the year ended 31 December NOTES Restated 2006 OPERATING ACTIVITIES Profit before tax Adjustments for: Depreciation and amortization of tangible and intangible fixed assets Provision for impairment of assets taken in recovery of debts Writeback of provision for impairment of assets taken in recovery of debts Provision for end of service indemnity, net Provision for complementary taxes and contingent liabilities related to a subsidiary bank, net (Writeback of provision) provision for risk and charges, net Provision for outstanding claims and IBNR reserves, net (Writeback of various provisions) provisions for risks and charges, net (Writeback of provision) provision for doubtful loans and advances, net Provision for impairment of investment in a non consolidated subsidiary Unrealized loss on shares, securities and financial assets with variable income held for trading Profit from sale of shares, securities and financial assets with variable income not held for trading Unrealized profit on investments related to unitlinked contracts Profit from sale of certificates of deposit Central Banks Profit from sale of Lebanese and other governmental treasury bills and bonds not held for trading Unrealized profit from Lebanese and other governmental treasury bills and bonds held for trading (Profit) loss on disposal of tangible and intangible fixed assets Provision for doubtful sundry debtors Other equity transactions Foreign currency translation reserve realized upon sale of branches in Romania ,586 18,350 (1,044) 2,491 13,142 (240) 2,507 (607) (11,435) (3,034) (2,910) (14,558) (201) (2,152) (37) (7,169) 359, ,633 13,725 2,418 (3,121) 5,498 1, , ,010 (472) (902) (9,265) (484) (9,595) ,633 Changes in operating assets and liabilities: Lebanese and other governmental treasury bills and bonds held for trading Shares, securities and financial assets with variable income held for trading Bonds and other financial assets with fixed income held for trading Loans and advances to customers Banks and financial institutionsdebit Other assets Regularization accounts and other debit accounts Banks and financial institutionscredit Customers' deposits Other liabilities Regularization accounts and other credit accounts (24,249) (1,693) (66,714) (1,171,174) (409,095) 2,409 (58,281) 91,021 3,018,135 48,930 59,923 (23,401) 7,138 (479,524) 339,099 (9,027) (8,881) (4,224) 2,372,892 (12,097) 34,998 Cash from operations Taxes paid End of service indemnities paid Provision for risks and charges paid ,848,563 (53,953) (2,694) (54) 1,865,408 (45,515) (703) (464) Net cash from operating activities 1,791,862 1,818,726 78
80 NOTES Restated 2006 INVESTING ACTIVITIES Lebanese and other governmental treasury bills and bonds not held for trading (1) Balances with the Central Banks (term accounts and certificates of deposit) (1) Investments and loans to related parties Purchase of tangible and intangible fixed assets Shares, securities and financial assets with variable income not held for trading Bonds and other financial assets with fixed income not held for trading Cash proceeds from the disposal of tangible and intangible fixed assets Purchase of an additional equity interest in a subsidiary 3 (457,574) (484,133) (24,032) (84,136) 1,694 (714,664) 15,367 (815,611) 423,178 (144) (49,576) 3,478 37,981 16,293 (4,031) Net cash used in investing activities (1,747,478) (388,432) FINANCING ACTIVITIES Issuance of common shares Sale (purchase) of treasury shares, net Premium from issuance of common shares Dividends paid Minority interest, net Share in a subsidiary s equity before consolidation 33 37&38 12,818 (147,245) (773) 30,000 (52,044) 374,059 (117,002) 15, Net cash (used in) from financing activities (135,200) 250,499 Effect of exchange rate changes 19,432 22,570 (Decrease) increase in cash and cash equivalents (71,384) 1,703,363 Cash and cash equivalents as of 1 January 8,924,912 7,221,549 Cash and cash equivalents as of 31 December 39 8,853,528 8,924,912 (1) Non cash transactions in the investing activities include a decrease in certificates of depositcentral Banks in the amount of LL 1,109,280 million (2006: increase in the amount of LL 800,784 million) against an increase in Lebanese and other governmental treasury bills and bonds not held for trading for the same amount (2006: decrease in the amount of LL 800,784 million) during. The accompanying notes 1 to 56 form part of these consolidated financial statements. 79
81 CONSOLIDATED STATEMENT OF CHANGES IN EQUITY For the year ended 31 December CONSOLIDATED STATEMENT OF CHANGES IN EQUITY For the year ended 31 December Attributable to equity holders of the parent Share capital Revaluation reserves Reserve for general banking risks Reserves and premiums (Note 35) At 31 December 2005 (as previously reported) 210,000 14,727 50, ,783 Correction of an error (note 40) At 31 December 2005 (as restated) Net movement in cumulative changes in fair values (note 36) Currency translation difference Profit for the year 2006 (restated) Total income and expenses for the year Dividends distributions (note 38) Appropriation of 2005 profits Issuance of common shares net of issuance costs (note 33) Purchase of treasury shares, net Gain on sale of treasury shares Decrease in minority interest due to acquisition by the bank Other Minority interest in share capital increase of subsidiaries Dividends on treasury shares 210,000 30,000 14,727 50, , ,783 19,641 19,641 42, , At 31 December 2006 Net movement in cumulative changes in fair values (note 36) Currency translation difference Profit for the year Total income and expenses for the year Dividends distributions (note 38) Appropriation of 2006 profits Sale of treasury shares, net Net loss on sale of treasury shares Increase in minority due to decrease in majority share Minority interest in dividends distribution in a subsidiary Dividends on treasury shares Foreign currency translation reserve realized upon sale of branches in Romania (note 2) Other 240,000 14,727 59, ,874 1,162,790 10,962 10,962 58,020 (3,168) (7,169) 369 At 31 December 240,000 14,727 69,503 1,221,804 80
82 Minority interest Total equity Cumulative changes in fair value Treasury shares Retained earnings Profit for the year Total 81,067 99, ,188 1,383,722 60,163 1,443,885 81,067 (11,844) 87, ,188 (11,844) 1,371,878 60,163 (11,844) 1,432,041 (59,637) (59,637) , , ,604 (118,223) (83,965) (59,637) 20, , ,261 (118,223) (19) 3,885 2,200 6,066 (59,656) 24, , ,327 (118,223) (52,108) 404,059 (52,108) ,059 (52,108) 64 (386) 221 (2,334) (2) (2,334) 219 1,221 1,221 15,278 15,278 1,221 21,430 (52,108) 121, ,604 1,837,373 79,171 1,916,544 (7,006) 73 (6,933) 15, ,319 1, , ,472 (148,391) (121,213) (7,006) 11, , ,258 (148,391) 15,986 (3,168) 1,146 (264) 4,826 5,114 9,676 2,141 (2,871) (7,270) 16, , ,934 (148,391) 15,986 (3,168) 2,141 (2,871) 1,146 (69) (7,169) 300 (45) 2 (7,214) ,497 (36,122) 176, ,472 2,004,335 88,074 2,092,409 The accompanying notes 1 to 56 form part of these consolidated financial statements. 81
83
84 NOTES TO THE CONSOLIDATED FINANCIAL STATEMENTS
85 1. ACTIVITIES 2. SIGNIFICANT ACCOUNTING POLICIES 1. ACTIVITIES BLOM Bank SAL (the "Bank"), a Lebanese joint stock company, was incorporated in 1951 and registered under No 2464 at the commercial registry of Beirut and under No 14 on the banks list published by the Bank of Lebanon. The headquarters of the Bank are located in Verdun, Rashid Karameh Street, Beirut, Lebanon. The Bank, together with its subsidiaries, BLOM INVEST Bank SAL, Arope Insurance SAL, Syria International Insurance (Arope Syria) SA, BLOM Bank France SA, BLOM Bank (Switzerland) SA, Bank of Syria and Overseas SA, BLOM Bank Egypt SAE, BLOM Egypt Securities SAE, BLOM Development Bank SAL and BLOM Invest Saudi Arabia (under establishment) (the Group), provide all banking activities (commercial, investing and private), as well as insurance and brokerage activities. On 1 January 2006, the Bank s branch in Cyprus started to be treated as a local branch and not as an international banking unit. On 14 February 2008, the Central Bank of the United Arab Emirates licensed BLOM Bank SAL to open a representative office and operate in the United Arab Emirates. This license is valid for five years. On 12 July, the Bank s board of directors approved on the establishment of a bank in the state of Qatar to be located in Qatar Financial Center with share capital of US$ 10 million, whereby the Bank will subscribe in 99% of its capital. On 18 February 2008, the Bank obtained the approval of the Central Bank of Lebanon on the establishment provided that the Bank provides the Central Bank of Lebanon and the Banking Control Commission with the approval of the regulatory authorities in Qatar. 2. SIGNIFICANT ACCOUNTING POLICIES The significant accounting policies adopted in the preparation of the consolidated financial statements are set out below: Basis of preparation The consolidated financial statements have been prepared in accordance with International Financial Reporting Standards (IFRS) and general accounting plan for banks in Lebanon and the regulations of the Bank of Lebanon and the Banking Control Commission. 84
86 NOTES TO THE CONSOLIDATED FINANCIAL STATEMENTS At 31 December The consolidated financial statements are prepared under the historical cost convention as modified for the restatement of certain tangible real estate properties in Lebanon according to the provisions of law No 282 dated 30 December 1993, and for the measurement at fair value of derivatives, Lebanese and other governmental treasury bills and bonds, bonds and financial assets with fixed income, and shares, securities and financial assets with variable income held for trading and available for sale, and investments related to unitlinked contracts (fair value through profit or loss). The consolidated financial statements have been presented in million of Lebanese Lira (), which is the functional currency of the Bank. Balances denominated in other currencies have been presented in thousands. Changes in accounting policies The Group has adopted IFRS 7 Financial Instruments: Disclosures and amendments to IAS 1 Presentation of Financial Statements effective for the year ended 31 December which has resulted in amended and additional disclosures relating to financial instruments and associated risks, capital and capital management. Other accounting policies are consistent with those used in the previous year. Future changes in accounting policies Below is the list of standards issued but not yet effective for the year ended 31 December : IAS 1 (Revised): Presentation of Financial Statements IAS 23: Borrowing costs IFRS 8: Operating Segments IFRIC 9: Reassessment of Embedded Derivatives IFRIC 11: IFRS 2 Group and Treasury Share Transactions IFRIC 12: Service Concession Arrangements IFRIC 13: Customer Loyalty Programmes IFRIC 14: IAS 19 The Limit on a Defined Benefit Asset, Minimum Funding Requirements and their Interaction Management do not expect the above standards to have a significant impact on the Group s financial statements when implemented in future years. 85
87 2. SIGNIFICANT ACCOUNTING POLICIES Basis of consolidation The consolidated financial statements comprise the financial statements of BLOM Bank SAL and its controlled subsidiaries drawn up to 31 December each year. The financial statements of subsidiaries are prepared for the same reporting year as the Bank, using consistent accounting policies. All intragroup balances, transactions, income and expenses and profits and losses resulting from intragroup transactions are eliminated in full. Subsidiaries are fully consolidated from the date on which control is transferred to the Group. Control is achieved where the Bank has the power to govern the financial and operating policies of an entity so as to obtain benefits from its activities. The results of subsidiaries acquired or disposed of during the year are included in the consolidated income statement from the date of acquisition or up to the date of disposal, as appropriate. Minority interests represent the portion of profit or loss and net assets not owned, directly or indirectly, by the Group and are presented separately in the income statement and within equity in the consolidated balance sheet, separately from parent shareholders equity. Acquisitions of minority interests are accounted for using the parent entity extension method, whereby, the difference between the consideration and the fair value of the share of the net assets acquired is recognized as goodwill. If the cost of acquisition below the fair values of the identifiable net assets acquired (i.e. a discount on acquisition), the difference is recognized directly in the income statement in the year of acquisition. The consolidated financial statements include the financial statements of BLOM Bank SAL and the subsidiaries listed in the following table: % EQUITY INTEREST BLOM Bank France SA (c) BLOM Bank (Switzerland) SA (100% owned by BLOM Bank France SA) BLOM Invset Bank SAL BLOM Development Bank SAL (99.98% owned by BLOM Invest Bank SAL) Bank of Syria and Overseas SA (a) Arope Insurance SAL Syria International Insurance (Arope Syria) SA (b) BLOM Bank Egypt SAE (c) BLOM Egypt Securities SAE (99.8% owned by BLOM Bank Egypt SAE) Country of incorporation France Switzerland Lebanon Lebanon Syria Lebanon Syria Egypt Egypt Activities Banking activities Banking activities Banking activities Islamic banking activities Banking activities Insurance activities Insurance activities Banking activities Brokerage activities % %
88 NOTES TO THE CONSOLIDATED FINANCIAL STATEMENTS At 31 December (a) Effective 1 January 2004, the Group obtained control, by virtue of agreement with other investors, over Bank of Syria and Overseas SA, and consequently, the financial statements of Bank of Syria and Overseas SA have been consolidated with those of the Group. (b) Effective 1 January 2006, the Group obtained control, by virtue of agreement with other investors, over Syria International Insurance (Arope Syria) SA, and consequently, the financial statements have been consolidated with those of the Group. (c) In November, Blom Bank Egypt SAE sold its branches in Romania to Blom Bank France SA. Consequently, the Group realized foreign currency translation reserve in the amount of LL 7,169 million upon the sale of the branches in Romania. Business combinations and goodwill Business combinations are accounted for using the purchase method of accounting. This involves recognizing identifiable assets (including previously unrecognized intangible assets) and liabilities (including contingent liabilities but excluding future restructuring) of the acquired business at fair value. Any excess of the cost of acquisition over the fair values of the identifiable net assets acquired is recognized as goodwill. If the cost of acquisition is less than the fair values of the identifiable net assets acquired, the discount on acquisition is recognized directly in the income statement in the year of acquisition. Goodwill acquired in a business combination is initially measured at cost being the excess of the cost of the business combination over the Group s interest in the net fair value of the identifiable assets, liabilities and contingent liabilities acquired. Following initial recognition, goodwill is measured at cost less any accumulated impairment losses. Goodwill is reviewed for impairment, annually or more frequently if events or changes in circumstances indicate that the carrying value may be impaired. For the purpose of impairment testing, goodwill acquired in a business combination is, from the acquisition date, allocated to each of the Group s cashgenerating units, or groups of cashgenerating units, that are expected to benefit from the synergies of the combination, irrespective of whether other assets or liabilities of the acquiree are assigned to those units or groups of units. Each unit or group of units to which the goodwill is allocated: represents the lowest level within the Group at which the goodwill is monitored for internal management purposes; and is not larger than a segment based on either the Group s primary or secondary reporting format determined in accordance with IAS 14 Segment Reporting. 87
89 2. SIGNIFICANT ACCOUNTING POLICIES Where goodwill forms part of a cashgenerating unit (or group of cashgenerating units) and part of the operation within that unit is disposed of, the goodwill associated with the operation disposed of is included in the carrying amount of the operation when determining the gain or loss on disposal of the operation. Goodwill disposed of in this circumstance is measured based on the relative values of the operation disposed of and the portion of the cashgenerating unit retained. When subsidiaries are sold, the difference between the selling price and the net assets plus cumulative translation differences and unamortized goodwill is recognized in the income statement. Impairment is determined by assessing the recoverable amount of the cashgenerating unit (group of cashgenerating units), to which the goodwill relates. Where the recoverable amount of the cashgenerating unit (group of cashgenerating units) is less than the carrying amount, an impairment loss is recognized. Trading investments Trading investments include: Lebanese and other governmental treasury bills and bonds, Bonds and financial assets with fixed income, Shares, securities and financial assets with variable income. These are initially recognized at cost (being the fair value given) and subsequently remeasured at fair value. All related realized or unrealized gains or losses are included in the consolidated income statement. Interest earned is included in interest and similar income while dividends received are included in revenues from shares and financial assets with variable income. Nontrading investments These are classified as follows: Available for sale, Investments carried at fair value through profit or loss, Investments carried at amortized cost (loans and receivable). 88 Nontrading investments include: Certificates of deposit, Lebanese and other governmental treasury bills and bonds, Bonds and financial assets with fixed income, Shares, securities and financial assets with variable income, Investments and loans to related parties, Investments related to unitlinked contracts.
90 NOTES TO THE CONSOLIDATED FINANCIAL STATEMENTS At 31 December All investments are initially recognized at cost, being the fair value of the consideration given including acquisition costs. Premiums and discounts on nontrading investments are amortized using the effective interest rate method and are taken to interest income. Available for sale Availableforsale financial investments are those investments which are designated as such or do not qualify to be classified as designated at fair value through profit or loss, heldtomaturity or loans and receivables. After initial recognition, investments which are classified available for sale are normally remeasured at fair value. If the Group is not able to estimate the fair value, available for sale investments are then carried at cost, less provision for impairment in value. Fair value changes which are not part of an effective hedging relationship, are reported as a separate component of equity until the investment is derecognized or the investment is determined to be impaired. On derecognition or impairment, the cumulative gain or loss previously reported as cumulative changes in fair value within equity, is included in the consolidated income statement for the period. That portion of any fair value changes relating to an effective hedging relationship is recognized directly in the consolidated income statement. Investments carried at fair value through profit or loss Investments are classified as fair value through profit or loss account if the fair value of the investment can be reliably measured and the classification as fair value through profit or loss account is as per the documented strategy of the Group. Investments classified as Investments at fair value through profit or loss upon initial recognition are remeasured at fair value with all changes in fair value being recorded in the consolidated income statement. Investments carried at amortised cost Debt instruments which do not meet the definition of held to maturity and which have fixed or determinable payments but are not quoted in an active market are carried at amortised cost, less provision for impairment in value. 89
91 2. SIGNIFICANT ACCOUNTING POLICIES Derecognition of financial assets and financial liabilities i. Financial assets A financial asset (or, where applicable a part of a financial asset or part of a group of similar financial assets) is derecognised where: the rights to receive cash flows from the asset have expired; or the Group has transferred its rights to receive cash flows from the asset or has assumed an obligation to pay the received cash flows in full without material delay to a third party under a passthrough arrangement; and either (a) the Group has transferred substantially all the risks and rewards of the asset, or (b) the Group has neither transferred nor retained substantially all the risks and rewards of the asset, but has transferred control of the asset. When the Group has transferred its rights to receive cash flows from an asset or has entered into a passthrough arrangement, and has neither transferred nor retained substantially all the risks and rewards of the asset nor transferred control of the asset, the asset is recognised to the extent of the Group s continuing involvement in the asset. Continuing involvement that takes the form of a guarantee over the transferred asset is measured at the lower of the original carrying amount of the asset and the maximum amount of consideration that the Group could be required to repay. ii. Financial liabilities A financial liability is derecognised when the obligation under the liability is discharged or cancelled or expires. Where an existing financial liability is replaced by another from the same lender on substantially different terms, or the terms of an existing liability are substantially modified, such an exchange or modification is treated as a derecognition of the original liability and the recognition of a new liability, and the difference in the respective carrying amounts is recognised in profit or loss. Fair values For investments and derivatives quoted in an active market, fair value is determined by reference to quoted market prices. Bid prices are used for assets and offer prices are used for liabilities. For unquoted financial instruments, fair value is determined by reference to the market value of similar investments, or is based on the expected discounted cash flows, or by using other techniques. The estimated fair value of deposits with no stated maturity, which includes noninterest bearing deposits, is the amount payable on demand. 90
92 NOTES TO THE CONSOLIDATED FINANCIAL STATEMENTS At 31 December Due from banks and financial institutions These are stated at fair value of consideration given less any amounts written off and allowance for impairment. Loans and advances to customers Loans and advances are stated at fair value of consideration given, net of suspended interest, provisions for doubtful debts, any amounts written off, and allowance for impairment. Renegotiated loans Where possible, the Group seeks to restructure loans rather than to take possession of collateral. This may involve extending the payment arrangements and the agreement of new loan conditions. Once the terms have been renegotiated, the loan is no longer considered past due. Management continuously reviews renegotiated loans to ensure that all criteria are met and that future payments are likely to occur. The loans continue to be subject to an individual or collective impairment assessment, calculated using the loan s original effective interest rate. Investments in associates The Group s investments in associates are accounted for using the equity method of accounting. An associate is an entity in which the Group has significant influence and which is neither a subsidiary nor a joint venture. Under the equity method, the investment in the associate is carried in the balance sheet at cost plus postacquisition changes in the Group s share of net assets of the associate. Losses in excess of the cost of the investment in an associate are recognized when the Group has incurred obligations on its behalf. Goodwill relating to an associate is included in the carrying amount of the investment and is not amortized. The income statement reflects the Group s share of the results of operations of the associate. Where there has been a change recognized directly in the equity of the associate, the Group recognizes its share of any changes and discloses this, when applicable, in the statement of changes in equity. Unrealized profits and losses resulting from transactions between the Group and the associate are eliminated to the extent of the interest in the associate. The reporting dates of the associate and the Group are identical and the associate s accounting policies conform to those used by the Group for like transactions and events in similar circumstances. 91
93 2. SIGNIFICANT ACCOUNTING POLICIES Tangible fixed assets Tangible fixed assets are stated at cost less accumulated depreciation and any accumulated impairment in value. Certain of tangible real estate properties purchased prior to 1 January 1994 were restated for the changes in the general purchasing power of the Lebanese Lira according to the provisions of law No 282 dated 30 December The net surplus arising on revaluation is credited to the account of revaluation reserves recognized in shareholders equity. Changes in the expected useful life are accounted for by changing the depreciation period or method, as appropriate, and treated as changes in accounting estimates. Depreciation is calculated on a straight line basis to write down the cost of tangible fixed assets to their residual values over their estimated useful lives. Freehold land is not depreciated. The estimated useful lives are as follows: 2006 Buildings Vehicles Furniture, office installations and computer equipment 50 years 6.67 years years 40 years 6.67 years years The impact of the depreciation expense due to the change in the estimated useful lives is accounted for prospectively. An item of tangible fixed assets is derecognised upon disposal or when no future economic benefits are expected from its use or disposal. Any gain or loss arising on derecognition of the asset (calculated as the difference between the net disposal proceeds and the carrying amount of the asset) is recognised in Other operating income or Other operating expenses in the income statement in the year the asset is derecognised. The carrying values of tangible fixed assets are reviewed for impairment to determine whether events for changes in circumstances indicate the carrying value may not be recoverable. If any such indication exists and where the carrying values exceed the estimated recoverable amount, the assets are written down to their recoverable amount, being the higher of the fair value less costs to sell and their value in use. Expenditure incurred to replace a component of an item of tangible fixed assets that is accounted for separately is capitalised and the carrying amount of the component that is replaced is written off. Other subsequent expenditure is capitalised only when it increases future economic benefits of the related item of tangible fixed assets. All other expenditure is recognised in the income statement as the expense is incurred. 92
94 NOTES TO THE CONSOLIDATED FINANCIAL STATEMENTS At 31 December Collateral pending sale The Group occasionally acquires real estate in settlement of certain loans and advances. Such real estate is stated at the lower of the amount of the related loans and advances and the current fair value of such assets based on the instructions of the Control Authorities. Gains or losses on disposal, and revaluation losses, are recognized in the consolidated income statement for the period. Intangible fixed assets Intangible assets are initially measured at cost. following initial recognition, intangible assets are carried at cost less any accumulated amortization and any accumulated impairment losses. The useful lives of the intangible assets are assessed to be either finite or indefinite. Intangible assets with finite lives are amortized over the useful economic life and tested for impairment whenever there is an indication that the intangible asset may be impaired. Intangible assets with indefinite useful lives are not amortized but tested for impairment annually and whenever there is an indication that the intangible asset may be impaired. If the carrying value of the intangible asset is more than the recoverable amount, the intangible asset is considered impaired and is written down to its recoverable amount. The excess of carrying value over the recoverable amount is recognized in the income statement. Impairement losses on intangible assets recognized in the income statement in previous periods, are reversed when there is an increase in the recoverable amount. Amortisation is calculated using the straightline method to write down the cost of intangible assets to their residual values over their estimated useful lives as follows: Key money: Software development cost: the lesser of lease period or 5 years 25 years Customer deposits All customer deposits are carried at the fair value of the consideration received, less amounts repaid. Taxation (i) Current tax Taxation is provided for in accordance with the fiscal regulations of the respective countries in which the Bank and its branches and subsidiaries operate. 93
95 2. SIGNIFICANT ACCOUNTING POLICIES Current tax assets and liabilities for the current and prior years are measured at the amount expected to be recovered from or paid to the taxation authorities. The tax rates and tax laws used to compute the amount are those that are enacted or substantively enacted by the balance sheet date. The Bank s profits from operations in Lebanon are subject to a tax rate of 15% after deducting the 5% tax on interest received according to Law no. 497/2003 dated 30 January Dividends are subject to a flat 10% tax, reducible to 5% provided that the Bank is listed on a regulated stock exchange. (ii) Deferred tax Deferred income tax is provided using the liability method on temporary differences at the balance sheet date between the tax bases of assets and liabilities and their carrying amounts in the financial statements. Deferred income tax assets and liabilities are measured at the tax rates that are expected to apply in the year when the asset is realized or the liability is settled, based on tax rates (and tax laws) that have been enacted or substantively enacted at the balance sheet date. Current tax and deferred tax relating to items recognized directly in equity are also recognized in equity and not in the income statement. The carrying amount of deferred tax assets is reviewed at each balance sheet date and reduced to the extent that it is no longer probable that sufficient taxable profit will be available to allow all or part of the deferred tax asset to be utilized. Unrecognized deferred tax assets are reassessed at each balance sheet date and are recognized to the extent that it has become probable that future taxable profit will allow the deferred tax asset to be recovered. Provisions for risks and charges Provisions are recognized when the Group has a present obligation (legal or constructive) arising from a past event and the costs to settle the obligation are both probable and able to be reliably measured. Employees endofservice benefits The Group provides end of service benefits to its employees. The entitlement of these benefits are based upon the employees final salary, length of services and other local regulations where the Group operates. The expected costs of these benefits are accrued over the period of employment. With respect to employees based in Lebanon, the Group makes contribution to the National Social Security Fund calculated as a percentage of the employees salaries. The Group s obligations are limited to these contributions, which are expensed when due. 94
96 NOTES TO THE CONSOLIDATED FINANCIAL STATEMENTS At 31 December Treasury shares Own equity instruments which are acquired (treasury shares) are deducted from equity and are accounted for at weighted average cost. No gain or loss is recognized in the income statement on the purchase, sale, issue or cancellation of the Bank s own equity instruments. Derivatives Derivatives are stated at fair value. For the purposes of hedge accounting, hedges are classified into three categories: (a) fair value hedges which hedge the exposure to changes in the fair value of a recognized asset or liability; (b) cash flow hedges which hedge exposure to variability in cash flows of a recognized asset or liability or a forecasted transaction, and (c) hedges of the net investment in a foreign subsidiary bank. In relation to effective fair value hedges any gain or loss from remeasuring the hedging instrument to fair value, as well as related changes in fair value of the item being hedged, are recognized immediately in the consolidated income statement. In relation to effective cash flow hedges, the gain or loss on the hedging instrument is recognized initially in equity and is transferred to the income statement in the period in which the hedged transaction impacts the income statement, or included as part of the cost of the related asset or liability. In relation to effective hedges of the net investment in a foreign subsidiary bank, any gain or loss from remeasuring the hedging instrument to fair value is recognized immediately in equity and is transferred to the income statement once the investment is sold. For those hedges which do not qualify for hedge accounting, any gains or losses arising from changes in the fair value of the hedging instrument are taken directly to the consolidated income statement for the period. Hedge accounting is discontinued when the hedging instrument expires or is sold, terminated or exercised, no longer qualifies for hedge accounting or is revoked by the Group. For effective fair value hedges of financial instruments with fixed maturities any adjustment arising from hedge accounting is amortised over the remaining term to maturity. For effective cash flow hedges, any cumulative gain or loss on the hedging instrument recognized in equity remains in equity until the hedged transaction occurs. If the hedged transaction is no longer expected to occur, the net cumulative gain or loss recognized in equity is transferred to the consolidated income statement. 95
97 2. SIGNIFICANT ACCOUNTING POLICIES Fiduciary assets Assets held in a fiduciary capacity are not treated as assets of the Group and accordingly are recorded as off balance sheet items. Off balance sheet items Off balance sheet balances include commitments which may take place in the Group s normal operations such as commitments for loan granting, letters of guarantees, and letters of credit, without deducting the margins collected and related to these commitments. Offsetting Financial assets and financial liabilities are only offset and the net amount reported in the balance sheet when there is a legally enforceable right to set off the recognized amounts and the Group intends to either settle on a net basis, or to realize the asset and settle the liability simultaneously. Financial guarantees In the ordinary course of business, the Group gives financial guarantees, consisting of letters of credit, guarantees and acceptances. Financial guarantees are initially recognised in the financial statements at fair value, in Other liabilities, being the premium received. Subsequent to initial recognition, the Group s liability under each guarantee is measured at the higher of the amortised premium and the best estimate of expenditure required to settle any financial obligation arising as a result of the guarantee. Any increase in the liability relating to financial guarantees is taken to the income statement in Provisions for loans and advances. The premium received is recognised in the income statement in Commission received on a straight line basis over the life of the guarantee. Revenue recognition Interest income and fees that are considered part of the effective interest is recognized using the effective yield method unless there is doubt of uncollectibility. The recognition of interest income is suspended when loans become impaired, such as when overdue by more than 90 days. Notional interest is recognized on impaired loans and other financial assets based on the rate used to discount future cash flows to their net present value. Other fees receivable are recognized as the services are provided. Dividend income is recognized when the right to receive payment is established. When the Group enters in interest rate swap contracts to change the interest rate from fixed to variable (or viceversa), interest income or expense is adjusted by the net difference resulting from the swap. 96
98 NOTES TO THE CONSOLIDATED FINANCIAL STATEMENTS At 31 December Foreign currencies The consolidated financial statements are presented in Lebanese Lira which is the Bank s functional currency. Each entity in the Group determines its own functional currency and items included in the financial statements of each entity are measured using that functional currency. Transactions and balances Transactions in foreign currencies are initially recorded in the functional currency at the rate of exchange ruling at the date of the transaction. Monetary assets and liabilities denominated in foreign currencies are retranslated into Lebanese Lira or other functional currencies at rates of exchange prevailing at the balance sheet date. Any gains or losses are taken to the consolidated income statement. Translation gains or losses on nonmonetary items carried at fair value are included in equity as part of the fair value adjustment on securities availableforsale, unless part of an effective hedging strategy. Translation of financial statements of foreign entities The assets and liabilities of foreign branches and subsidiaries are not deemed an integral part of the head office s operations and are translated at rates of exchange ruling at the balance sheet date. Income and expense items are translated at average exchange rates for the period. Any exchange differences are taken directly to a foreign currency translation adjustment reserve. Cash and cash equivalents Cash and cash equivalents as referred to in the Cash Flow Statement comprise balances with original maturities of a period of three months including: cash and balances with the Central Banks, deposits with banks and financial institutions, deposits due to banks and financial institutions, and treasury bills. Repurchase and resale agreements Assets sold with a simultaneous commitment to repurchase at a specified future date (repos) continue to be recognized in the balance sheet. Amounts received under these agreements are treated as liabilities and the difference between the sale and the repurchase price is treated as interest expense using the effective yield method. Assets purchased with a corresponding commitment to resell at a specified future date (reverse repos) are not recognized in the balance sheet. Amounts paid under these agreements are treated as assets and the difference between the purchase and resale price is treated as interest income using the effective yield method. 97
99 2. SIGNIFICANT ACCOUNTING POLICIES Impairment and uncollectibility of financial assets An assessment is made at each balance sheet date to determine whether there is objective evidence that financial assets may be impaired. If such evidence exists, any impairment loss is recognized in the consolidated income statement. Impairment is determined as follows: (a) for assets carried at amortised cost, impairment is based on estimated cash flows that are discounted at the original effective interest rate; (b) for assets carried at fair value, impairment is the difference between cost and fair value less any impairment loss previously recognized in the consolidated income statement; and (c) for assets carried at cost, impairment is the present value of future cash flows discounted at the current market rate of return for a similar financial asset. For available for sale equity investments, reversal of impairment losses are recorded as increases in cumulative changes in fair values through equity. For the purpose of a collective evaluation of impairment, financial assets are grouped on the basis of the bank s review of credit risk characteristics such as asset type, industry, geographical location, collateral type, pastdue status and other relevant factors. Future cash flows on a group of financial assets that are collectively evaluated for impairment are estimated on the basis of historical loss experience for assets with credit risk characteristics similar to those in the group. Historical loss experience is adjusted on the basis of current observable data to reflect the effects of current conditions that did not affect the years on which the historical loss experience is based and to remove the effects of conditions in the historical period that do not exist currently. Estimates of changes in future cash flows reflect, and are directionally consistent with, changes in related observable data from year to year (such as changes in property prices, payment status, or other factors that are indicative of incurred losses in the group and their magnitude). The methodology and assumptions used for estimating future cash flows are reviewed regularly to reduce any differences between loss estimates and actual loss experience. Trade and settlement date accounting All regular way purchases and sales of financial assets are recognized on the trade date, i.e. the date that the Group commits to purchase or sell the asset. Regular way purchases or sales are purchases or sales of financial assets that require delivery of assets within the time frame generally established by regulations. Operating leases Leases where the lessor retains substantially all the risks and benefits of ownership of the asset are classified as operating leases. Operating lease payments are recognized as an expenses in the income statement on a straightline basis over the lease term. 98
100 NOTES TO THE CONSOLIDATED FINANCIAL STATEMENTS At 31 December Accounting policies of subsidiaryinsurance companies The financial statements of the subsidiary insurance companies have been prepared in accordance with International Financial Reporting Standards and the requirements of the regulations related to insurance and reinsurance companies where the subsidiaries operate. The key accounting policies are as follows: Premiums earned Net premiums and accessories (gross premiums) are taken to income over the terms of the policies to which they relate using the prorata temporis method for nonmarine business and 25% of gross premiums for marine business. Unearned premiums reserve represent the portion of the gross premiums written relating to the unexpired period of coverage. If the unearned premiums reserve is not considered adequate to cover future claims arising on these premiums a premium deficiency reserve is created. Commissions earned and paid Commissions earned are recognized at the time policies are written. Commissions paid are expensed over the terms of the policies to which they relate using the prorata temporis method for nonmarine business and 25% of commissions paid for marine business. Deferred acquisition costs represent the portion of commissions paid relating to the unexpired period of coverage. 2.a SIGNIFICANT ACCOUNTING JUDGMENTS AND ESTIMATES Judgments In the process of applying the Group s accounting policies, management has made the following judgements, apart from those involving estimations, which have the most significant effect in the amounts recognised in the financial statements: Classification of investments Management decides on acquisition of an investment whether it should be classified as held to maturity, held for trading, carried at fair value through profit or loss account, or available for sale. The Group classifies investments as trading if they are acquired primarily for the purpose of making a short term profit by the dealers. Classification of investments as fair value through profit or loss account depends on how management monitors the performance of these investments. When they are not classified as held for trading but have readily available reliable fair values and the changes in fair values are reported as part of profit or loss in the management accounts, they are classified as fair value through profit or loss. All other investments are classified as available for sale. 99
101 2. SIGNIFICANT ACCOUNTING POLICIES 3. BUSINESS COMBINATION 4. NET PROVISIONS LESS RECOVERIES ON LOANS AND ADVANCES Impairment of investments The Group treats available for sale equity investments as impaired when there has been a significant or prolonged decline in the fair value below its cost. In addition, the Group evaluates other factors, including normal volatility in share price for quoted equities and the future cash flows and the discount factors for unquoted equities. Estimation uncertainty The key assumptions concerning the future and other key sources of estimation uncertainty at the balance sheet date, that have a significant risk of causing a material adjustment to the carrying amounts of assets and liabilities within the next financial year are discussed below: Impairment losses on commercial loans and advances The Group reviews its problem commercial loans and advances on a regular basis to assess whether a provision for impairment should be recorded in the consolidated income statement. In particular, considerable judgment by management is required in the estimation of the amount and timing of future cash flows when determining the level of provisions required. Such estimates are necessarily based on assumptions about several factors involving varying degrees of judgment and uncertainty, and actual results may differ resulting in future changes to such provisions. In addition to specific allowances against individually significant loans and advances, the Group also makes a collective impairment allowance against exposures which, although not specifically identified as requiring a specific allowance, have a greater risk of default than when originally granted. This takes into consideration factors such as any deterioration in country risk, industry, and technological obsolescence, as well as identified weaknesses or deterioration in cash flows. Impairment losses on consumer loans An estimate of the collectible amount of consumer loans is made when collection of the full amount is no longer probable. This estimation is assessed collectively and a provision applied according to the length of time past due, based on historical recovery rates. Fair value of financial instruments Where the fair values of financial assets and financial liabilities recorded on the balance sheet cannot be derived from active markets, they are determined using a variety of valuation techniques that include the use of mathematical models. The input to these models is taken from observable markets where possible, but where this is not feasible, a degree of judgment is required in establishing fair values. The judgments include consideration of liquidity and model inputs such as correlation and volatility for longer dated derivatives. 100
102 NOTES TO THE CONSOLIDATED FINANCIAL STATEMENTS At 31 December 3. BUSINESS COMBINATION BLOM Bank Egypt SAE In 2006, the Group acquired an additional 2.6% of the voting shares of BLOM Bank Egypt SAE for a total consideration of LL 4,031 million with effective date 30 November Group s interest (2.6%) 2,323 Goodwill arising on acquisition (note 27) 1,708 Cost of acquisition (net cash outflow) 4,031 In 2006, BLOM Bank Egypt SAE increased its ownership in BLOM Egypt Securities SAE from 67.74% to 99.37%. The total cost of acquisition is approximately LL 174 million. Net cash inflow on acquisition amounted to LL 219 million. The Bank consolidated BLOM Egypt Securities SAE with effect from 1 January During 2006, BLOM Bank and two of its subsidiaries subscribed in 979,313 shares representing 49% of the voting shares of Syria International Insurance (Arope Syria) SA, a newly established insurance company in Syria with a total investment amount of LL 14,559 million. 4. NET PROVISIONS LESS RECOVERIES ON LOANS AND ADVANCES Restated 2006 Provision for doubtful loans and advances: Provision for doubtful loans and advances Provision for doubtful consumer loans Provision for consumer loans not classified at the balance sheet date Recoveries on loans and advances: Recoveries on doubtful and bad loans and advances Recoveries on doubtful loans from off balance sheet Recoveries on personal loans Recoveries on commitments by signature (12,661) (3,427) (3,938) (20,026) 28,852 2, ,461 11,435 (13,394) (6,266) (19,660) 18, ,852 (808) 101
103 5. NET COMMISSIONS 6. NET PROFIT FROM TRADING INVESTMENTS 7. NET PROFIT FROM NONTRADING INVESTMENTS 8. OTHER OPERATING INCOME 9. OTHER OPERATING EXPENSES 10. SALARIES AND RELATED BENEFITS 11. GENERAL OPERATING EXPENSES 5. NET COMMISSIONS 2006 Commissions received: Letters of credit, guarantees and acceptances Loans and advances to customers Asset management and correspondents accounts Checking accounts and transfers Customers deposits Credit cards Other services Less: commissions paid on correspondents accounts Net commissions received 25,448 22,494 10,766 6,041 13,685 8,431 9,142 96,007 (6,627) 89,380 22,084 17,931 7,907 9,832 11,950 5,446 6,654 81,804 (4,815) 76, NET PROFIT FROM TRADING INVESTMENTS 2006 Trading loss from equities Trading income from debt securities (129) 2,152 2,023 (3,010) 9,595 6, NET PROFIT FROM NONTRADING INVESTMENTS 2006 Profit from sale of certificates of deposit Profit from sale of equities Others 14,558 3, ,469 9, (214) 9, OTHER OPERATING INCOME 2006 Premiums earned on insurance contracts Other miscellaneous income 19,760 4,858 24,618 16,181 6,213 22,
104 NOTES TO THE CONSOLIDATED FINANCIAL STATEMENTS At 31 December 9. OTHER OPERATING EXPENSES 2006 Claims paid on insurance contracts Others 14, ,446 11, , SALARIES AND RELATED BENEFITS 2006 Salaries and wages Social security contributions Provisions for end of service indemnities (note 32) Additional indemnities paid Other allowances (including bonuses) 65,215 12,412 2,615 12,610 36, ,133 58,667 10,692 5,498 10,628 26, , GENERAL OPERATING EXPENSES 2006 Board of directors attendance fees Taxes and fees Fee for guarantee of deposits Rent and related charges Electricity and fuel Professional fees Postage and telecommunications Maintenance and repairs Travel expenses Insurance Marketing and advertising Stationery and printings Fiscal stamps Others 1,416 2,631 5,893 6,224 3,594 7,883 8,557 5,648 3, ,140 5,326 2,080 19,798 81,317 1,077 2,875 5,494 4,259 2,469 5,986 7,028 6,175 3, ,904 4,670 2,129 16,747 70,
105 12. DEPRECIATION AND AMORTIZATION OF TANGIBLE AND INTANGIBLE ASSETS 13. PROVISION FOR CONTINGENT LIABILITIES 14. EARNINGS PER SHARE 15. CASH AND BALANCES WITH THE CENTRAL BANKS 16. LEBANESE AND OTHER GOVERNMENTAL TREASURY BILLS AND BONDS 12. DEPRECIATION AND AMORTIZATION OF TANGIBLE AND INTANGIBLE ASSETS Tangible fixed assets (note 23) Intangible fixed assets (note 24) Provision for impairment against real estate acquired in settlement of debts (note 23) 17, , , ,418 16, PROVISION FOR CONTINGENT LIABILITIES 2006 Provision for complementary taxes and contingent liabilities related to a subsidiary bank (note 32) Others 13, ,350 1, , EARNINGS PER SHARE Basic earnings per share amounts are calculated by dividing the net profit for the year attributable to ordinary equity holders of the parent by the weighted average number of ordinary shares outstanding during the year. The following reflects the income and share data used in the basic earnings per share computation: 2006 Net profit for the year Less :Proposed dividends on preferred shares (note 38) Minority interest Net profit attributable to equity holders of the parent Weighted average number of common shares Basic earnings per share LL 308,586 (40,890) (5,114) 262,582 21,183,704 12, ,804 (40,891) (2,200) 228,713 20,850,721 10,969 No figure for diluted earnings per share has been presented as the Bank has not issued any instruments which would have an impact on earnings per share when exercised. 104
106 NOTES TO THE CONSOLIDATED FINANCIAL STATEMENTS At 31 December 15. CASH AND BALANCES WITH THE CENTRAL BANKS Cash Central Banks: Current accounts Time deposits Accrued interest at 31 December Certificates of deposit loans and receivables Accrued interest at 31 December 128, ,922 2,429,799 43,935 3,425,656 2,718,370 57,922 2,776,292 6,330, , ,505 1,630,300 21,300 2,536,105 3,534,441 83,093 3,617,534 6,246,406 Cash and balances with the Central Banks include noninterest bearing balances held by the Group at the Bank of Lebanon in coverage of the obligatory reserve requirements for all banks operating in Lebanon on deposits in Lebanese Lira as required by the Lebanese banking rules and regulations. This obligatory reserve is calculated on the basis of 25% of sight commitments and 15% of term commitments. In addition to the above, all banks operating in Lebanon are required to deposit with the Bank of Lebanon interest bearing placements at the rate of 15% of total deposits in foreign currencies regardless of nature. Foreign subsidiaries are also subject to obligatory reserve requirements with varying percentages, according to the banking rules and regulations of the countries in which they are located. 16. LEBANESE AND OTHER GOVERNMENTAL TREASURY BILLS AND BONDS Trading: Treasury bills and bonds (quoted) Accrued interest at 31 December Available for sale: Treasury bills and bonds Accrued interest at 31 December 75,537 1,412 76,949 4,904,147 99,227 5,003,374 5,080, ,511 1,037 50,548 3,353,399 70,973 3,424,372 3,474,920 As of 30 December 2005, the Group reclassified treasury bills and bonds denominated in Lebanese Lira and in foreign currencies from investments held to maturity to investments available for sale. Accordingly, the Group is not allowed to classify investments as held to maturity before 1 January 2008, according to IAS 39. Consequently, held to maturity investments were carried at fair value and reclassified as available for sale as at 31 December This reclassification resulted in an increase in the fair value of the available for sale investments as at 31 December 2005 with a corresponding increase in cumulative changes in fair values in the consolidated statement of changes in equity. Available for sale investments include unquoted governmental bonds in the amount of LL 132,645 million (2006: LL 243,668 million) that are stated at cost, which approximately equal to fair value. 105
107 17. BONDS AND FINANCIAL ASSETS WITH FIXED INCOME 18. SHARES, SECURITIES AND FINANCIAL ASSETS WITH VARIABLE INCOME 19. BANKS AND FINANCIAL INSTITUTIONS DEBIT 17. BONDS AND FINANCIAL ASSETS WITH FIXED INCOME Trading: Bonds Fair value through profit or loss: Bonds Available for sale: Bonds Loans and receivables: Certificates of deposit 21,244 45, , ,241 1,165, , , ,100 Included in bonds and financial assets with fixed income, accrued interest up to 31 December amounting to LL 15,990 million (2006: LL 7,408 million). As of 30 December 2005, the Group reclassified bonds and financial assets with fixed income from investments held to maturity to investments available for sale. Accordingly, the Group is not allowed to classify investments as held to maturity before 1 January 2008, according to IAS 39. Consequently, held to maturity investments were carried at fair value and reclassified as available for sale as at 31 December This reclassification resulted in an increase in the fair value of the available for sale investments as at 31 December 2005 with a corresponding increase in cumulative changes in fair values in the consolidated statement of changes in equity. Bonds and financial assets with fixed income include unquoted available for sale investments in the amount of LL 44,331 million (2006: LL 44,213 million) and unquoted certificates of deposit in the amount of LL 16,952 million (2006: LL 38,023 million) that are stated at cost, which approximately equal to fair value. 18. SHARES, SECURITIES AND FINANCIAL ASSETS WITH VARIABLE INCOME Trading: Shares Investment fund Available for sale: Shares 4,663 1,849 6,512 5,213 11, , ,948 3,455 8,403 Trading investments include unquoted investments in the amount of LL 1,149 million (2006: LL 980 million) and available for sale investments include unquoted investments in the amount of LL 3,842 million (2006: LL 2,198 million) that are stated at cost due to the unpredictable nature of future cash flows and lack of suitable other methods for arriving at a reliable fair value. 106
108 NOTES TO THE CONSOLIDATED FINANCIAL STATEMENTS At 31 December 19. BANKS AND FINANCIAL INSTITUTIONS DEBIT 2006 Current accounts: Current accounts Checks for collection Accrued interest at 31 December Time deposits: Term deposits Granted financial loans Accrued interest at 31 December 254,966 72, ,558 7,094,791 85,933 28,251 7,208,975 7,536, ,257 69, ,789 7,359,698 70,335 23,462 7,453,495 7,754,284 Included in banks and financial institutions debit, time deposits amounting to US$ 620,000 thousand (2006: US$ 840,000 thousand) being guarantees against short term borrowings in the amount of Euro 325,000 thousand (2006: Euro 525,000 thousand) reflected under banks and financial institutions credit. According to the contracts entered into with these banks, the Bank can withdraw these term deposits upon the settlement of the shortterm borrowings. Included also in banks and financial institutions debit, time deposits amounting to US$ 1,600 thousand (2006: nil), being guarantees against two letters of credit maturing in September 2008 and amounting to US$ 800 thousand each. 107
109 20. LOANS AND ADVANCES TO CUSTOMERS 20. LOANS AND ADVANCES TO CUSTOMERS Commercial loans Other loans to customers (consumer loans) Overdraft accounts Net debtor accounts against creditor and cash collateral accounts Advances to related parties Doubtful debts (including consumer loans) Total loans Provision for doubtful loans Provisions for commercial loans not classified as doubtful debts at the balance sheet date Provision for doubtful consumer loans Provision for consumer loans not classified as doubtful debts at the balance sheet date Total provisions Unrealized interest substandard loans Unrealized interest doubtful loans Total unrealised interest Commercial loans Less: Provision for doubtful loans and provision for commercial loans not classified as doubtful debts at the balance sheet date Unrealized interestsubstandard loans Unrealized interestdoubtful loans Consumer loans Less: Provision for doubtful consumer loans and provision for consumer loans not classified as doubtful debts at the balance sheet date 3,265, ,793 11,932 14,308 5, ,109 4,521,484 (215,626) (22,272) (3,561) (17,750) (259,209) (14,238) (68,730) (82,968) 4,179,307 3,643,411 (237,898) (14,238) (68,730) 3,322, ,073 (21,311) 856,762 4,179, ,442, ,053 8,190 10,826 7, ,561 3,348,447 (210,071) (40,017) (256) (13,812) (264,156) (13,899) (73,694) (87,593) 2,996,698 2,813,138 (250,088) (13,899) (73,694) 2,475, ,309 (14,068) 521,241 2,996,698 Commercial loans as at 31 December include substandard loans amounting to LL 36,285 million(2006: LL 34,456 million). Breakdown by economic sector Agriculture and forestry Manufacturing Trade retail Trade wholesale Services Construction Freelance professions Consumer loans 32, , , , , , , ,793 4,521, , , , , , , , ,062 3,348,
110 NOTES TO THE CONSOLIDATED FINANCIAL STATEMENTS At 31 December The movement of provision for doubtful loans and advances by class is as follows: 2006 Provision for doubtful commercial loans and provision for commercial loans not classified yet Provision for doubtful consumer loans and provision for consumer loans not classified yet Total Provision for doubtful commercial loans and provision for commercial loans not classified yet Provision for doubtful consumer loans and provision for consumer loans not classified yet Total Balance at 1 January Add: Charge for the year Foreign exchange difference Provision transferred from off balance sheet Provision of acquired subsidiary Blom Egypt Securities SAE Less: Provisions writtenoff Recovery of provisions Provision transferred to off balance sheet Foreign exchange difference Balance at 31 December Individual provision Provision for loans not classified yet Gross amount of loans individually determined to be impaired 250,088 12,661 5, ,730 (6,869) (23,738) (225) (30,832) 237, ,626 22, , ,829 14,068 7,365 21,433 (103) (19) (122) 21,311 3,561 17,750 21,311 12, ,156 20,026 5, ,163 (6,972) (23,757) (225) (30,954) 259, ,187 40, , , ,383 13,394 1, ,384 (5,885) (7,675) (7,400) (336) (21,296) 250, ,071 40, , ,305 9,009 6,266 15,275 (1,207) (1,207) 14, ,812 14, ,392 19,660 1, ,659 (5,885) (8,882) (7,400) (336) (22,503) 264, ,327 53, , ,
111 20. LOANS AND ADVANCES TO CUSTOMERS 21. BANK / ENGAGEMENTS BY ACCEPTANCES The following is a reconciliation of the individual provision for impairment losses on loans and advances and provision for loans not classified yet: Individual provision Provision for loans not classified yet Total 2006 Individual provision Provision for loans not classified yet Total Balance at 1 January Add: Charge for the year Provisions transferred from offbalance sheet Difference of exchange Provision of acquired subsidiary BLOM Egypt Securities SAE Less: Provisions written off Recovery of provisions Provisions transferred to off balance sheet Foreign exchange difference Balance at 31 December 210,327 16, , ,396 (6,972) (6,012) (225) (13,209) 219,187 53,829 3,938 57,767 (17,745) (17,745) 40, ,156 20, , ,163 (6,972) (23,757) (225) (30,954) 259, ,897 13,092 1, ,597 (5,885) (4,649) (7,400) (336) (18,270) 210,327 51,495 6,568 58,063 (4,234) (4,234) 53, ,392 19,660 1, ,660 (5,885) (8,883) (7,400) (336) (22,504) 264,156 The movement of unrealized interest is as follows: Balance at 1 January Add: Unrealized interest for the year Foreign exchange difference Less: Recoveries of unrealized interest Amounts writtenoff Transferred to offbalance sheet Foreign exchange difference Balance at 31 December 87,593 12, ,294 (5,114) (13,212) (18,326) 82, ,472 14, ,534 (9,224) (1,831) (3,821) (65) (14,941) 87,593 As required by Bank of Lebanon regulations, doubtful loans fulfilling certain conditions have been transferred to offbalance sheet, together with the related provisions and unrealized interest. 110
112 NOTES TO THE CONSOLIDATED FINANCIAL STATEMENTS At 31 December The movement of provisions against fully provided bad loans included off balance sheet accounts is as follows: 2006 Balance at 1 January Add: Transferred from balance sheet Provision transferred from balance sheet Less: Provisions writtenback Amounts writtenoff Provision transferred to balance sheet Balance at 31 December 20, ,364 (2,265) (1,056) (25) (3,346) 17,018 13,795 7, ,334 (400) (732) (1,132) 20,202 The movement of unrealized interest included in off balance sheet accounts is summarized as follows 2006 Balance at 1 January Add: Unrealized interest for the year Transferred from balance sheet Foreign exchange difference Less: Recoveries Amounts writtenoff Balance at 31 December Total provisions and unrealized interest included in off balance sheet accounts 23,703 1, ,372 (325) (13,753) (14,078) 11,294 28,312 22,436 1,697 3, ,115 (183) (4,229) (4,412) 23,703 43, BANK / ENGAGEMENTS BY ACCEPTANCES 2006 Acceptances as of 31 December 245, ,260 Acceptances resulted from letters of credit opened for accounts of customers, with deferred payments. 111
113 22. INVESTMENTS AND LOANS TO RELATED PARTIES 23. TANGIBLE FIXED ASSETS 22. INVESTMENTS AND LOANS TO RELATED PARTIES Investments in nonconsolidated subsidiaries and associates BLOM Services SARL Société de Services d Assurances et de Marketing SAL International Payment Network SAL Arope services SAL BLOM Invest Saudi Arabia (under establishment) Investments available for sale Misr for Central, Clearing, Depository and Central Registry Banque de l Habitat SAL BLOM Real Estate SAL Swift Investment property Immobilière Foch 65 SARL Less: Provision for impairment Country of incorporation Lebanon Lebanon Lebanon Lebanon Saudi Arabia Egypt Lebanon Lebanon France France Ownership percentage 2006 The carrying values of the investments in subsidiaries which were not consolidated because they are immaterial to the consolidated financial statements as at 31 December are detailed as follows: 99.92% 23.50% 90.00% 59.94% 2.85% 7.23% 0.01% % 99.70% 99.92% 23.50% 90.00% 0.46% 2.85% 7.23% 0.01% % ,120 24,922 1, ,684 1,029 (427) ,208 Shareholders equity , , (383) 539 3,220 BLOM Services SARL (*) Société de Services d Assurances et de Marketing SAL Arope Services SAL is a dormant company. Accordingly, the carrying value of this investment was not consolidated because it is immaterial to the consolidated financial statements as at 31 December (2006: the same). (*)The partners in their meeting dated 3 May 2005 resolved to liquidate the company and appointed a liquidator. On 29 May 2006, the Ordinary Meeting of Partners approved the completion of the liquidation process which was announced in the Official Gazette on 8 March. BLOM Invest Saudi Arabia (under establishment) The Bank, together with BLOM Invest SAL (a subsidiary), established BLOM Invest Saudi Arabia and contributed in 10% and 50% respectively to its capital. The regulatory institutions in Lebanon and the Kingdom of Saudi Arabia approved on this investment in January BLOM Invest Saudi Arabia is under establishment and is not included in the consolidation of the Group as of 31 December, and no pre incorporation expenses have been incurred for the year then ended. It will be consolidated when established. 112
114 NOTES TO THE CONSOLIDATED FINANCIAL STATEMENTS At 31 December 23. TANGIBLE FIXED ASSETS Freehold land and buildings Vehicles Furniture, office installations and computer equipment Advances on acquisition of fixed assets and construction in progress Fixed assets acquired in settlement of debts Total Cost At 1 January Additions Disposals Transfers Translation difference At 31 December Depreciation At 1 January Charge for the year Relating to disposals Transfers Translation difference At 31 December Impairment At 1 January Provided during the year Provision written back during the year Translation difference At 31 December Net carrying value At 31 December 156,031 19,938 (115) 5,414 1, ,812 27,361 3,604 (58) , ,614 3,464 1,200 (365) ,498 1, (363) ,078 2, ,359 31,418 (8,464) 1,826 1, ,119 79,452 13,365 (5,129) (32) 1,333 88,989 57,130 31,049 24,270 (7,516) ,583 48,583 25,912 5,346 (11,936) ,099 7,990 (1,044) 258 7,204 12, ,815 82,172 (20,880) (140) 5, , ,453 17,717 (5,550) (18) 1, ,265 7,990 (1,044) 258 7, ,

115 23. TANGIBLE FIXED ASSETS 24. INTANGIBLE FIXED ASSETS Freehold land and buildings Vehicles Furniture, office installations and computer equipment Advances on acquisition of fixed assets and construction in progress Fixed assets acquired in settlement of debts Total Cost At 1 January 2006 Additions from the acquisition of subsidiaries Additions Disposals Transfers Translation difference At 31 December 2006 Depreciation At 1 January 2006 Accumulated depreciation from the acquisition of subsidiaries Charge for the year Relating to disposals Transfers Translation difference At 31 December 2006 Impairment At 1 January 2006 Provided during the year Provision written back during the year Translation difference At 31 December 2006 Net carrying value At 31 December ,457 6,654 (970) 1,365 1, ,031 23,528 3,652 (243) , ,670 2,929 1,025 (499) 9 3,464 1, (450) 2 1,640 1,824 97, ,480 (1,411) 7, ,359 70, ,071 (1,210) ,452 39,907 17,560 22,378 (387) (8,483) (19) 31,049 31,049 35,843 2,875 (12,688) 12 (130) 25,912 8,734 2,418 (3,121) (41) 7,990 17, , ,412 (15,955) 2, ,815 95, ,328 (1,903) ,453 8,734 2,418 (3,121) (41) 7, ,372 Certain freehold land and buildings purchased prior to 1 January 1999 were restated for the changes in the general purchasing power of the Lebanese Lira giving rise to a net surplus amounting to LL 14,727 million, which was credited to equity under revaluation reserves. 114
116 NOTES TO THE CONSOLIDATED FINANCIAL STATEMENTS At 31 December 24. INTANGIBLE FIXED ASSETS Software development Key money Advances on acquisition of intangible fixed assets Total Cost At 1 January Additions Transfers Translation difference At 31 December Amortization At 1 January Charge for the year Transfers Translation difference At 31 December Net carrying value At 31 December 4,443 1, ,007 4, ,927 1,080 8, ,869 5, ,377 2, ,748 1, ,763 9, ,304 4,459 Software development Key money Advances on acquisition of intangible fixed assets Total Cost At 1 January 2006 Additions Disposals Translation difference At 31 December 2006 Amortization At 1 January 2006 Charge for the year Relating to disposals Transfers Translation difference At 31 December 2006 Net carrying value At 31 December , (121) 306 4,443 3, (121) 286 4, , (2,097) 608 8,305 5, (201) 358 5,825 2, (224) 13,136 1,140 (2,442) ,748 9, (121) (201) 644 9,903 2,
117 25. OTHER ASSETS 26. REGULARIZATION ACCOUNTS AND OTHER DEBIT ACCOUNTS 27. GOODWILL 25. OTHER ASSETS Compulsory deposits (i) Precious metals and stamps Investments related to unitlinked contracts fair value through profit or loss (ii) Other assets 14, ,600 1,149 34, , ,751 1,762 33,715 (i) Compulsory deposits represent amounts deposited with local authorities based on local regulations of the countries in which the subsidiaries are located, and are detailed as follows: BLOM Invest SAL Bank of Syria and Overseas SA BLOM Development Bank SAL 1,500 8,903 4,500 14, ,500 8,690 4,500 14,690 (ii) The unrealized profit on investments related to unitlinked contracts amounted to LL 2,910 million for the year ended 31 December (2006: LL 902 million). 26. REGULARIZATION ACCOUNTS AND OTHER DEBIT ACCOUNTS Customers transactions between head office and branches Prepaid expenses Sundry debtors (i) Other revenues to be collected Revaluation variance on foreign exchange forward contracts related to the Group s customers (note 43) (ii) Reinsurers share of technical reserves Taxes paid in advance in a subsidiary bank Other accounts (i) Sundry debtors Sundry debtors Less: Provision against sundry debtors 28,739 8,143 23,107 1,754 8,935 12,190 19,997 16, ,487 24,573 (1,466) 23, ,510 8,308 8,476 3, ,501 14, , ,740 (1,264) 8,
118 NOTES TO THE CONSOLIDATED FINANCIAL STATEMENTS At 31 December The movement of provision against sundry debtors is summarized as flows: 2006 Balance at 1 January Provided during the year Translation difference Balance at 31 December 1, ,466 1, ,264 (ii) Revaluation variance on foreign exchange forward contracts Revaluation variance on foreign exchange forward contracts hedging operations related to Group s customers represents operations in which the Group is engaged to hedge foreign exchange operations for its clients. As at 31 December, the revaluation of these contracts resulted in unrealized losses (2006: same). 27. GOODWILL Cost: At 1 January Acquisition of a subsidiary Exchange difference At 31 December 63,980 (3,394) 60, ,758 1, ,980 Impairment testing of goodwill Goodwill acquired through business combinations with indefinite lives have been allocated to two individual cashgenerating units, which are subsidiaries of the Bank, for impairment testing as follows: BLOM Bank Egypt SAE BLOM Bank (Switzerland) SA The carrying amount of goodwill to each of the subsidiaries is as follows: BLOM Bank Egypt SAE BLOM Bank (Switzerland) SA 59,480 1,106 60, , ,980 Key assumptions used in value in use calculations The recoverable amount of BLOM Bank Egypt SAE has been determined based on a value in use calculation, using cash flow projections based on financial budgets approved by senior management covering a tenyear period. The following rates are used by the Bank. 117
119 27. GOODWILL 28. BANKS AND FINANCIAL INSTITUTIONS CREDIT 29. CUSTOMERS' DEPOSITS 30. OTHER LIABILITIES % 2006 % Discount rate Projected growth rate (average during the first 4 years in and 5 year in 2006) Projected growth rate beyond the four year period in and five year period in The calculation of value in use for BLOM Bank Egypt SAE is most sensitive to the following assumptions: Interest margins; Discount rates; Projected growth rates; Gross domestic product of the country where the subsidiary operates; Local inflation rates. Interest margins Interest margins are based on average values achieved in the 13 months proceeding of the budget period. These are increased over the budget period for anticipated market conditions. Discount rates Discount rates reflect management s estimate of return on capital employed. Discount rates are calculated by using the weighted average cost of capital. Projected growth rates, GDP and local inflation rates Assumptions are based on management analysis and published industry research. Sensitivity to changes in assumptions Management believes that reasonable possible changes in key assumptions used to determine the recoverable amount will not result in an impairment of goodwill. 118
120 NOTES TO THE CONSOLIDATED FINANCIAL STATEMENTS At 31 December 28. BANKS AND FINANCIAL INSTITUTIONS CREDIT Current accounts Term: Term Accrued interest at 31 December 186,913 1,365,807 3,194 1,369,001 1,555, ,362 1,147,370 2,112 1,149,482 1,308, CUSTOMERS' DEPOSITS Sight deposits Time deposits Saving accounts Credit accounts and deposits against debit accounts Related parties accounts 2,341,594 9,589,749 7,862, , ,963 20,708, ,897,765 7,874,196 7,180, ,696 75,259 17,690,381 Customers' deposits include coded deposit accounts in BLOM Bank SAL and BLOM Invest Bank SAL amounting to LL 76,092 million as of 31 December (2006: LL 73,182 million). 30. OTHER LIABILITIES Margins on letters of credit (i) Income tax payable (ii) Distribution tax due on subsidiary s dividends (note 40) Other taxes due Deposits related to entities under constitution Transactions pending between consolidated subsidiaries Advances from customers for acquisition of securities Sundry creditors Dividends payable 77,300 31,984 12,984 9,587 12,875 12,789 12,170 24, , ,046 28,079 12,426 9,354 2,975 5,884 7,868 10, ,067 (i) Margins on letters of credit Margins on letters of credit represent deposits by the clients on account of documentary credits opened by the Group on their behalf. (ii) Income tax payable The relationship between taxable profit and accounting profit of BLOM Bank SAL and its foreign branches and subsidiaries is as follows: 119
121 30. OTHER LIABILITIES Profit before income tax Less: Results of the subsidiary insurance company located in Lebanon (*) Accounting profit before income tax Add: Provisions non tax deductible Other non tax deductible charges Unrealized loss on difference of exchange Capital gain Others Less: Dividends received and previously subject to income tax Provisions no more required and previously subject to income tax Remunerations already taxed 4% of a subsidiary s capital eligible to be tax deductible Writeback of provisions previously subject to income tax Non taxable income Difference in depreciation of fixed assets Permanent deductible charges Others Taxable profit 365,586 (5,125) 360,461 5,009 37,102 3,376 2, ,842 (2,194) (8,301) (400) (20,552) (1,762) (2,433) (71,021) (855) 301, ,633 (4,874) 316,759 6,299 15, ,112 (329) (6,645) (400) (4,732) (830) 325,176 The effective income tax rate of the Group is approximately 15.27% (2006: 15.31%). (*) The insurance company in Lebanon is subject to income tax at the rate of 15% calculated based on gross insurance premiums weighted differently for each class of business. 120
122 NOTES TO THE CONSOLIDATED FINANCIAL STATEMENTS At 31 December Income statement: Current income tax: Current income tax charge (a) Adjustments in respect of current income tax of previous years (b) Current distribution tax due (c) 55, , , ,829 Income tax payable is detailed as follows: At 1 January Tax expense for the year Tax paid during the year Exchange difference At 31 December 28,079 33,198 (30,709) 1,416 31, ,561 26,454 (22,722) ,079 (a) Current income tax charge in the consolidated income statement is detailed as follows: 5% tax paid on interest revenue during the year Income tax on profit for the year 22,641 33,198 55, ,793 26,454 49,247 (b) During, the tax authorities reviewed the Bank s accounts in Lebanon for the years 2003 to 2005 (inclusive), and the review resulted in complementary taxes and fines amounted to LL 603 million, settled in full during the year ended 31 December. (c) Movement of distribution tax due recognized in the balance sheet is detailed as follows: Balance at 1 January Provided during the year Balance at 31 December For more information about distribution tax due, refer to note , , , ,426 Current income tax allocation is as follows: Income taxblom Bank SAL Income taxforeign subsidiaries Income taxsubsidiaries in Lebanon 41,940 13,011 2,049 57, ,959 9,568 2,302 49,
123 30. OTHER LIABILITIES 31. REGULARIZATION ACCOUNTS AND OTHER CREDIT ACCOUNTS 32. PROVISIONS FOR RISKS AND CHARGES Income tax paid during and 2006 reflected in the consolidated cash flow statement is detailed as follows: Income tax paid for the years 2006 and % tax paid on interest revenue during the year Adjustments in respect of current income tax of previous years 31. REGULARIZATION ACCOUNTS AND OTHER CREDIT ACCOUNTS Accrued expenses Revaluation variance on foreign exchange forward contracts hedging a net investment in a foreign subsidiary bank (note 43) Transactions pending between branches Unearned premiums and liability related to unit linked insurance contracts 30,709 22, ,953 54,399 8,472 6, , , ,722 22,793 45, ,684 3,566 1,342 92, , PROVISIONS FOR RISKS AND CHARGES Provision for risks and charges (i) Provision for outstanding claims and IBNR reserves related to subsidiaryinsurance companies (ii) Provision for end of service indemnities (iii) Provision for complementary taxes and contingent liabilities related to a subsidiary bank (iv) Provision for contingencies of correspondents operations related to a subsidiary bank Provision for unusual commitments related to a subsidiary bank (v) Other provision 3,188 9,512 26,160 38,512 2, , ,374 6,903 26,432 24, , ,646 (i) Provisions for risks and charges Balance at 1 January Charge for the year Provisions paid during the year Provisions writtenback during the year Exchange difference Balance at 31 December 3, (54) (622) 108 3, , (464) (325) 116 3,374 The provision for risks and charges mostly represent a provision against probable taxes on interest taken by a subsidiary insurance company in the amount of LL 1,638 million not finalized yet with the Ministry of Finance, in addition to a provision taken by a subsidiary bank in the amount of LL 1,237 million against contingent liabilities. 122
124 NOTES TO THE CONSOLIDATED FINANCIAL STATEMENTS At 31 December (ii) Provisions for outstanding claims and IBNR reserves related to subsidiaryinsurance companies Balance at 1 January Provision for outstanding claims and IBNR reserves charged for the year Provisions used during the year Exchange difference Balance at 31 December 6,903 2,857 (350) 102 9, , ,903 (iii) Provisions for end of service indemnities Balance at 1 January Charge for the year Indemnities paid Provisions writtenback Exchange difference Balance at 31 December 26,432 2,615 (2,694) (124) (69) 26, ,664 5,498 (703) (27) 26,432 (iv) Provision for complementary taxes and contingent liabilities related to a subsidiary bank Provision for complementary taxes and contingent liabilities related to a subsidiary bank represents mainly accruals for additional complementary taxes in a subsidiary resulting from inspection by tax authorities for the years from 1991 onwards. Movement in provision for complementary taxes and contingent liabilities related to a subsidiary bank recognized in the balance sheet are as follows: 2006 Balance at 1 January Charge for the year Provision writtenback during the year Exchange difference Balance at 31 December (v) Provision for unusual commitments related to a subsidiary bank Balance at 1 January Charge for the year Exchange difference Balance at 31 December 24,136 13,327 (185) 1,234 38,512 2, ,358 22,868 1,455 (85) (102) 24, ,301 (4) 2,
125 33. SHARE CAPITAL 33. SHARE CAPITAL 21,500,000 common shares of LL 10,000 per share 750,000 preferred shares (2002 issue) of LL 10,000 per share 750,000 preferred shares (2004 issue) of LL 10,000 per share 1,000,000 preferred shares (2005 issue) of LL 10,000 per share Total preferred shares 215,000 7,500 7,500 10,000 25, , ,000 7,500 7,500 10,000 25, ,000 a) The Extraordinary General Meeting of Shareholders held on 30 December 2005, resolved to increase the Bank s capital from LL 210,000 million to LL 240,000 million by the increase of LL 30,000 million through the issuance of 3,000,000 new common shares, of LL 10,000 per share. The subscription in these shares is limited to Bank of New York to be fully settled in cash. The issuance and subscription in these common shares was based on the following conditions: Number of issued shares Par value of issued shares (LL 10,000 per share) Premium (denominated in US$) 3,000,000 LL 30,000 million US$ as determined by the Extraordinary General Assembly of Shareholders held on 13 February On 16 February 2006, the Extraordinary General Assembly of Shareholders approved the subscription of these common shares amounting to 3,000,000 shares, which were approved to be issued and fully paid in the amount of LL 30,000 million plus a premium amounting to US$ 256,033 thousand (equivalent to LL 385,970 million) based on US$ per share. The commission and the issuance costs amounted to US$ 7,590 thousand (equivalent to LL 11,911 million) which was deducted from the issuance premium. It is to be noted that the Board of Directors decided on 7 February 2006 to list the GDSs in the Beirut and Luxembourg Stock Exchanges in parallel with the current GDRs of the Bank. b) According to the provisions of Law no 308 dated 3 April 2001, the Extraordinary General Assembly Meeting of Shareholders held on 11 October 2002, and then the Extraordinary General Assembly Meetings of Shareholders held on 4 June 2004 and 17 September 2005, resolved to issue preferred shares at the following conditions: 124
126 NOTES TO THE CONSOLIDATED FINANCIAL STATEMENTS At 31 December 2002 ISSUE 2004 ISSUE 2005 ISSUE Number of shares 750, ,000 1,000,000 Par value of issued shares (LL 10,000 per share) LL 7,500 million LL 7,500 million LL 10,000 million Premium (denominated in USD) Non cumulative benefits LL 105,593 million (USD 70,045 thousands) An annual amount equal to 11.25% of the net consolidated profitsofthebank,withaminimum of USD 10 per share and not in excess of USD 15 per share, (subject to the approval of the Shareholders General Assembly Meeting and the availability of a nonconsolidated distributable net income for the year). LL 105,590 million (USD 70,043 thousands) An annual amount for each share equal to USD 8.5 based on the exchange rate on the date of the General Assembly Meeting, (subject to the approval of the Shareholders General Assembly Meeting and the availability of a nonconsolidated distributable net income for the year). LL 140,720 million (USD 93,347 thousands) 2005 distributions to be based on a fixed amount of USD 3.75 per share and thereafter at an annual amount equal to 6% of the net consolidated profit of the Bank, with a minimum of 7.5% and a maximum of 9.5% of the issue price (subject to the approval of the Shareholder s General Assembly Meeting and the availability of a nonconsolidated distributable net income for the year). These preferred shares (2002, 2004 and 2005 issues) are redeemable 60 days after the annual general assemblies dealing with the accounts for the years, 2009 and 2010 respectively at the discretion of the Bank at issue price (LL 10,000 per share plus paid premium) in addition to any dividends declared but not paid during the years prior to the redemption year. In the event of any liquidation, dissolution or windingup of the Bank, the holders of series 2002, 2004 and 2005 preferred shares shall be entitled to be paid out of the assets of the Bank available for distribution to its shareholders on a pro rata basis, before any payment shall be made to common shareholders. c) On 12 May 2006, the Extraordinary General Assembly of shareholders decided to list 750,000 preferred shares (2002 issue), 750,000 preferred shares (2004 issue), and 1,000,000 preferred shares (2005 issue), in addition to 7,166,667 common shares in the regulated markets in Lebanon and / or abroad. The Beirut Stock Exchange Committee decided on 24 August 2006 to list, trade and value one third of the common shares and all the preferred shares (2002, 2004 and 2005 issues) issued by BLOM Bank SAL as detailed above in the official market of the Beirut Stock Exchange. These four types of shares became listed on 25 August
127 33. SHARE CAPITAL 34. RESERVES FOR GENERAL BANKING RISKS 35. RESERVES AND PREMIUMS Accordingly, the shares of the Bank listed on the Beirut and the Luxemburg Stock Exchanges are detailed as follows: Number of shares 2006 Number of shares GDR Common shares Preferred shares (2002 issue) Preferred shares (2004 issue) Preferred shares (2005 issue) 7,389,601 7,166, , ,000 1,000,000 17,056,268 7,389,601 7,166, , ,000 1,000,000 17,056, RESERVES FOR GENERAL BANKING RISKS According to the Bank of Lebanon regulations, banks are required to appropriate from their annual net profit a minimum of 0.2 percent and a maximum of 0.3 percent of total risk weighted assets and offbalance sheet accounts based on rates specified by the Bank of Lebanon to cover general banking risks. The consolidated ratio should not be less than 1.25 percent of these risks at the end of year ten () and 2 percent at the end of year twenty (2017). This reserve is part of the Bank s equity and cannot be distributed as dividends. This reserve is based on the denomination (Lebanese Lira and US Dollars) of the risk weighted assets and offbalance sheet accounts. 35. RESERVES AND PREMIUMS Reserve for translation difference Legal reserve General reserve Reserve for increase of share capital Nondistributable reserves Premium on issuance of preferred shares Premium on issuance of common shares Total At 31 December 2005 Currency translation difference Appropriation of 2005 profits Issuance of common shares net of issuance costs (note 33) Transfer to nondistributable reserves Gain on sale of treasury shares Transfer to reserve for increase in share capital Other At 31 December 2006 Currency translation difference Appropriation of 2006 profits Net loss on sale of treasury shares Foreign currency translation reserve realized upon sale of branches in Romania (note 2) Other At 31 December 13,037 18,718 31,755 1,850 33,605 94, , , , , ,012 20,982 (44,613) (6) 226,375 2,856 25,848 (7,169) 247,910 5,003 3, ,404 8,922 (3,168) 14,158 10, , ,040 6, , , , , , , , ,783 19,641 42, , ,162,790 10,962 58,020 (3,168) (7,169) 369 1,221,
128 NOTES TO THE CONSOLIDATED FINANCIAL STATEMENTS At 31 December Legal reserve According to the Lebanese Code of Commerce and to the Money and Credit Act, banks and companies operating in Lebanon have to transfer 10% of their annual net profit to a legal reserve. This reserve cannot be distributed as dividends. General reserve The Group appropriated general reserves from its retained earnings to strengthen its equity. This reserve amounting to LL 247,910 million as at 31 December (2006: LL 226,375 million) is available for dividends distribution. Reserve for increase of share capital The balance amounting to LL 14,158 million (2006: LL 8,404 million) represents a regulatory reserve pursuant to circular no. 167 issued by the Banking Control Commission. This reserve cannot be distributed as dividends. Details of the reserve for increase of share capital are as follows: Recoveries of provisions for doubtful debts Revaluation reserves for fixed assets sold Gain on sale of treasury shares 12, ,467 14, , ,635 8,404 Premium on issuance of preferred shares 2002 issue (note 33) 2004 issue (note 33) 2005 issue (note 33) 105, , , , , , , ,903 Non distributable reserves During 2006, a subsidiary increased its share capital partially from a transfer of LL 44,613 million from general reserves. 127
129 36. CUMULATIVE CHANGES IN FAIR VALUES 37. TREASURY SHARES 38. PAID AND PROPOSED DIVIDENDS 39. CASH AND CASH EQUIVALENTS 36. CUMULATIVE CHANGES IN FAIR VALUES According to the Bank of Lebanon regulations, banks are required to appropriate from their annual net Balance at 1 January Realized during the year Net changes in fair values during the year Difference on exchange Balance at 31 December 21,430 (7,006) 73 14, ,067 (458) (59,607) , TREASURY SHARES Movement of treasury shares recognized in the balance sheet is as follows: 2006 No. of common shares Amount No. of common shares Amount At 1 January Acquisition of treasury shares Sales of treasury shares At 31 December 414, ,885 (728,285) 306,000 52,108 65,189 (81,175) 36, , ,400 52,108 52,108 The treasury shares represent Global Depository Receipts (GDR) owned by the Group. The market value of one GDR was US$ as of 31 December (2006: US$ 57.65). The Bank refunded the distribution of dividends on the treasury shares amounting to LL 1,146 million (2006: LL 1,221 million) resulting from the distribution of dividends for all ordinary shares in The Group realized losses of LL 3,168 million on the sale of treasury shares during the year (2006: nil). This loss is reflected under Reserve for increase of share capital in the Reserves and premiums (note 35). 128
130 NOTES TO THE CONSOLIDATED FINANCIAL STATEMENTS At 31 December 38. PAID AND PROPOSED DIVIDENDS According to the resolutions of the General Assembly Meetings held during the years and 2006, dividends paid were as follows: 2006 Preferred shares 2002 issue: LL 22, per share (2006: LL 22, per share) Preferred shares 2004 issue: LL 12, per share (2006: LL 12, per share) Preferred shares 2005 issue: LL 14, per share (2006: LL 5, per share) Common shares: LL 5,000 per share (2006: LL 4,000 per share) 16,959 9,610 14, , ,391 16,959 9,610 5,654 86, ,223 In their meeting held on 18 March 2008, the board of directors proposed the distribution of dividends for as follows: Common shares (LL 5,500 per share) Preferred shares 2002 issue (LL 22, per share) Preferred shares 2004 issue (LL 12, per share) Preferred shares 2005 issue (LL 14, per share) 118,250 16,959 9,610 14,321 40, , CASH AND CASH EQUIVALENTS Cash and balances with the Central Banks Lebanese and other governmental treasury bills and bonds held not for trading (whose original maturities are less than three month) Deposits with banks and financial institutions (whose original maturities are less than 3 months) Less: Due to banks and financial institutions (whose original maturities are less than 3 months) 3,611,152 17,297 6,674,691 10,303,140 (1,449,612) 8,853, ,916,938 7,301,537 10,218,475 (1,293,563) 8,924,912 Balances with the Central Banks include term placements with the Bank of Lebanon, which are considered as cash equivalent based on a contractual agreement with the Bank of Lebanon. 129
131 40. CORRECTION OF AN ERROR 41. RELATED PARTIES TRANSACTIONS 42. ENGAGEMENTS RECEIVED 43. DERIVATIVES 40. CORRECTION OF DEFFERRED TAX LIABILITY During the previous years, the Bank did not provide for deferred tax liability on its share of dividend distribution from subsidiary, BLOM INVEST BANK SAL, in accordance with International Accounting Standard No 12 (Income taxes). Accordingly, the Bank corrected comparative financial statements and increased income tax expense by LL 558 million and LL 582 million for and 2006, respectively, and decreased retained earnings as of 31 December 2005 by LL 11,844 million and increased deferred tax liability by LL 558 million and LL 12,426 million as of 31 December and 2006, respectively. 41. RELATED PARTIES TRANSACTIONS The Group enters into transactions with major shareholders, directors, senior management, and their related concerns, and entities controlled, jointly controlled or significantly influenced by such parties in the ordinary course of business at commercial interest and commission rates. All the loans and advances to related parties are performing advances and are free of any provision for possible credit losses. The transactions with related parties are as follows: Deposits Loans and advances Indirect facilities Interest received from loans and advances Interest paid on deposits Accounting services revenues from a nonconsolidated subsidiary Major shareholders 69,676 4, ,341 Board of directors and senior management 28,072 1, ,346 Other related parties 4, ,963 5, , ,259 7, , The board of directors and senior management remunerations are as follows: 2006 Board of directors and senior management remunerations All remunerations paid to board of directors and senior management are short in nature. 20,729 19,
132 NOTES TO THE CONSOLIDATED FINANCIAL STATEMENTS At 31 December 42. ENGAGEMENTS RECEIVED Guarantees received Personal guarantees received from customers Mobilization bills Mobilization bills (renegotiated loans) Directors shares in guarantee of their management Real estate guarantees received Cash collateral received Treasury bills in pledge 26,537 3,379,093 51,735 1, ,742, , ,450 7,088, ,453 2,268,645 53,413 1, ,159, , ,908 5,467, DERIVATIVES The following schedule shows the positive and the negative fair values of the derivatives and their notional amounts according to maturity. The notional amount is the amount of a derivative s underlying asset, reference rate or index and represents the basis for measuring the change in the derivatives value. The notional amounts show the volume of operations at year end and do not reflect either market or credit risk. Positive fair value Negative fair value Total notional amount Notional amount by maturity Less than 3 months 3 to 12 months 1 to 5 Years 31 December Forward contracts on foreign currencies for hedging purposes Forward contracts on foreign currencies for trading purposes 31 December 2006 Forward contracts on foreign currencies for hedging purposes Forward contracts on foreign currencies for trading purposes 166, , ,450 5,281 8, , ,943 4,397 3,549 7, ,735 2,703,814 2,942, ,793 1,935,962 2,146,755 89,387 2,651,292 2,740, , , , ,348 52, ,870 1,259,401 1,259,401 Additionally, the Group holds or issues currency options for trading purposes that are primarily related to the Group s customers operations. The notional amount of these contracts is as follows: 2006 Currency options 34,142 17,659 All these contracts mature during 2008 that are primarily related to the Group s customers operations. 131
133 43. DERIVATIVES 44. COMMITMENTS AND CONTINGENT LIABILITIES Derivative held or issued for hedging purposes As part of its asset and liability management, the Group uses derivatives for hedging purposes in order to reduce its exposure to currency risk. The Group uses forward foreign exchange contracts to hedge against specifically identified currency risks. The Bank uses forward foreign exchange contracts (to sell Euros and buy US Dollars) to hedge its net investment in a foreign subsidiary denominated in Euro and amounting to Euro 107,904 thousand (2006: same). The notional amount of these contracts amounted to Euro 107,900 thousand as at 31 December (2006: same). The forward foreign exchange contracts were revalued as of 31 December and resulted in unrealized losses of LL 8,472 million (2006: LL 3,566 million), refer to note 31. The contracts mature on 30 April 2008 at latest. 44. COMMITMENTS AND CONTINGENT LIABILITIES Credit related commitments Creditrelated commitments include commitments to extend credit, standby letters of credit, guarantees and acceptances which are designed to meet the requirements of the Group's customers. Letters of credit, guarantees (including standby letters of credit), and acceptances commit the Group to make payments on behalf of customers contingent upon the failure of the customer to perform under the terms of the contract. Commitments to extend credit represent contractual commitments to make loans and revolving credits. Commitments generally have fixed expiration dates, or other termination clauses. Since commitments may expire without being drawn upon, the total contract amounts do not necessarily represent future cash requirements. 132
134 NOTES TO THE CONSOLIDATED FINANCIAL STATEMENTS At 31 December The Group has the following credit related commitments: 2006 Commitments on behalf of customers: Letters of credit Letters of guarantees Authorized but unutilized facilities 359, ,996 1,146,370 1,358,444 2,504, , , , ,641 1,983,355 Please refer to note 21 for acceptances outstanding as of 31 December and 2006 respectively. Capital and operating lease commitments The commitments on capital expenditures and operating lease commitments at the balance sheet date, which were not provided for, were as follows: 2006 Capital commitments Tangible fixed assets purchases Operating lease commitments Minimum payments for future lease contracts: During one year More than 1 year and less than five years More than five years Total operating lease commitments at the balance sheet date 82,172 3,531 13,980 13,192 30,703 48,513 2,362 9,015 8,649 20,
135 45. SEGMENTAL INFORMATION 46. FIDUCIARY DEPOSITS, ASSETS UNDER MANAGEMENT AND CUSTODY ACCOUNTS 47. CONCENTRATION OF ASSETS, LIABILITIES AND OFF BALANCE SHEET ITEMS 45. SEGMENTAL INFORMATION The Group operates in two geographic markets based on the location of its markets and customers. The local market represents the Lebanese market and the international market represents markets outside Lebanon. The following table shows the distribution of the Group s gross income, total assets and capital expenditure by geographical segment: Domestic International Total Net interest received Net provisions less recoveries on loans and advances Revenues from shares and financial assets with variable income Net commissions Net profit from financial operations Other operating income 288,335 12, ,650 21,812 16, ,369 8, ,424 12,906 16, ,777 (667) ,730 17,856 8, ,886 (9,428) ,565 13,893 5, ,112 11, ,380 39,668 24, ,255 (808) 1,123 76,989 26,799 22,394 Gross income 383, , , , , ,752 Operating expenses and amortization and depreciation Net provisions less recoveries on financial fixed assets Provisions for contingent liabilities (156,777) (23) (134,846) (3) (86,469) (13,327) (76,210) 395 (1,455) (243,246) (13,350) (211,056) 395 (1,458) Profit before tax 226, , , , , ,633 Total assets 12,837,800 10,953,024 12,229,214 10,471,587 25,067,014 21,424,611 Total liabilities 12,411,356 11,240,625 10,563,249 8,267,442 22,974,605 19,508,067 Capital expenditures 31,071 18,094 53,065 31,482 84,136 49,576 The Group s major business segment is banking. Insurance activities represent 1.71% of profit before income tax and 1% of total assets. 46. FIDUCIARY DEPOSITS, ASSETS UNDER MANAGEMENT AND CUSTODY ACCOUNTS 2006 Fiduciary deposits 3,959,136 2,774,360 Fiduciary accounts include notes, checks, policies, treasury bills/bonds, shares and documents for collection held by the Group to the order of third parties. 134
136 NOTES TO THE CONSOLIDATED FINANCIAL STATEMENTS At 31 December 47. CONCENTRATION OF ASSETS, LIABILITIES AND OFF BALANCE SHEET ITEMS Concentrations arise when a number of counter parties are engaged in similar business activities or activities in the same geographic region, or have similar economic features that would cause their ability to meet contractual obligations to be similarly affected by changes in economic, political or other conditions. Concentrations indicate the relative sensitivity of the Group s performance developments affecting a particular industry or geographic location. The distribution of assets, liabilities, and offbalance sheet items by geographic region was as follows: 2006 Geographical Location Lebanon Outside Lebanon Assets 12,837,800 12,229,214 25,067,014 Liabilities 12,411,356 10,563,249 22,974,605 Offbalance sheet 5,078,702 3,147,142 8,225,844 Assets 10,953,024 10,471,587 21,424,611 Liabilities 11,240,625 8,267,442 19,508,067 Offbalance sheet 1,719,322 4,216,166 5,935,
137 48. BALANCE SHEET BY CATEGORY 48. BALANCE SHEET BY CATEGORY 31 December Assets Cash and balances with the Central Banks Lebanese and other governmental treasury bills and bonds Bonds and financial assets with fixed income Shares, securities and financial assets with variable income Deposits with banks and financial institutions Loans and advances to customers Bank acceptances Investments and loans to related parties Tangible fixed assets Intangible fixed assets Other assets Regularization accounts and other debit accounts Out of which: Revaluation variance on foreign exchange forward contracts hedging operations related to the Group s customers Goodwill Liabilities Due to banks and other financial institutions Customers deposits Engagements by acceptances Other liabilities Regularization accounts and other credit accounts Provisions for risks and charges Loans and receivables 6,330, ,241 7,536,533 4,179, ,357 18,517,469 Available for sale 5,003, ,185 5,213 1,684 5,882,456 Fair value through profit or loss 45,470 17,600 63,070 Held for trading 76,949 21,244 6,512 13, ,372 Derivatives designated as hedging instruments 8,472 8,472 Amortized cost 1,555,914 20,708, ,357 22,509,787 Non financial assets and liabilities and others 25, ,642 4,459 16, ,820 60, , , ,320 80, ,346 Total 6,330,031 5,080,323 1,165,140 11,725 7,536,533 4,179, ,357 27, ,642 4,459 34, ,820 13,667 60,586 25,067,014 1,555,914 20,708, , , ,792 80,566 22,974,
138 NOTES TO THE CONSOLIDATED FINANCIAL STATEMENTS At 31 December 31 December 2006 Assets Cash and balances with the Central Banks Lebanese and other governmental treasury bills and bonds Bonds and financial assets with fixed income Shares, securities and financial assets with variable income Deposits with banks and financial institutions Loans and advances to customers Bank acceptances Investments and loans to related parties Tangible fixed assets Intangible fixed assets Other assets Regularization accounts and other debit accounts Out of which: Revaluation variance on foreign exchange forward contracts hedging operations related to the Group s customers Goodwill Liabilities Due to banks and other financial institutions Customers deposits Engagements by acceptances Other liabilities Regularization accounts and other credit accounts Provisions for risks and charges Loans and receivables 6,246, ,599 7,754,284 2,996, ,260 17,417,247 Available for sale 3,424, ,501 3,455 1,730 3,569,058 Fair value through profit or loss 16,751 16,751 Held for trading 50,548 4, ,397 Derivatives Amortized cost Non designated as hedging financial assets and instruments liabilities and others ,566 3,566 1,308,844 17,690, ,260 19,172,485 1, ,372 2,845 16,964 60,351 63, , , ,303 64, ,016 Total 6,246,406 3,474, ,100 8,403 7,754,284 2,996, ,260 3, ,372 2,845 33,715 60, ,980 21,424,611 1,308,844 17,690, , , ,869 64,646 19,508,
139 49. FAIR VALUE OF THE FINANCIAL INSTRUMENTS 49. FAIR VALUE OF THE FINANCIAL INSTRUMENTS The following table shows the difference between the carrying values and fair values for the financial assets and liabilities classified in the balance sheet. This table does not show the fair values of nonfinancial assets and liabilities Carrying value Fair value Unrecognized gains (losses) Carrying value Fair value Unrecognized gains (losses) Financial assets Cash and balances with the Central Banks Lebanese and other government treasury bills and bonds Bonds and financial assets with fixed income Shares, securities and financial assets with variable income Banks and financial institutions Loans and advances to customers Bank acceptances Investments and loans to related parties 6,330,031 5,080,323 1,165,140 11,725 7,536,533 4,179, ,357 27,208 6,418,226 5,080,323 1,163,720 11,725 7,543,196 4,182, ,357 27,208 88,195 (1,420) 6,663 3,448 6,246,406 3,474, ,100 8,403 7,754,284 2,996, ,260 3,220 6,389,936 3,474, ,700 8,403 7,755,827 3,020, ,260 3, ,530 (1,400) 1,543 23,933 Financial liabilities Banks and financial institutions Customers deposits Engagements by acceptances 1,555,914 20,708, ,357 1,555,911 20,667, ,357 (3) (40,701) 1,308,844 17,690, ,260 1,308,844 17,658, ,260 (32,220) Total unrecognized change in unrealized fair value 56, ,386 The following describes the methodologies and assumptions used to determine fair values for those financial instruments which are not already recorded at fair value in the financial statements: Assets for which fair value approximates carrying value For financial assets and financial liabilities that are liquid or having a short term maturity (less than three months) it is assumed that the carrying amounts approximate to their fair value. This assumption is also applied to demand deposits, savings accounts without a specific maturity and variable rate financial instruments. 138
140 NOTES TO THE CONSOLIDATED FINANCIAL STATEMENTS At 31 December Fixed rate financial instruments The fair value of fixed rate financial assets and liabilities carried at amortized cost are estimated by comparing market interest rates when they were first recognized with current market rates offered for similar financial instruments. The estimated fair value of fixed interest bearing deposits is based on discounted cash flows using prevailing moneymarket interest rates for debts with similar credit risk and maturity. For quoted debt issued the fair values are calculated based on quoted market prices. For those notes issued where quoted market prices are not available, a discounted cash flow model is used based on a current interest rate yield curve appropriate for the remaining term to maturity. Financial instruments recorded at fair value The following table shows an analysis of financial instruments recorded at fair value, between those whose fair value is based on quoted market prices and those involving valuation techniques where all the model inputs are observable in the market Quoted market prices Valuation techniques market observable inputs Unquoted Total Quoted market prices Valuation techniques market observable inputs Unquoted Total Financial assets Lebanese and other governmental treasury bills and bonds Bonds and financial assets with fixed income Shares, securities and financial assets with variable income Investments and loans to related parties 2,181, ,568 6,734 3,083,053 2,765,927 2,765, ,645 44,331 4,991 1, ,651 5,080, ,899 11,725 1,684 6,032,631 1,285,169 95,288 5,225 1,385,682 1,946,083 1,946, ,668 44,213 3,178 1, ,789 3,474, ,501 8,403 1,730 3,624,554 The unquoted financial instruments that are stated at cost approximately equal to fair value. 139
141 50. RISK MANAGEMENT 50. RISK MANAGEMENT The Bank manages its business activities within risk management guidelines as set by the Group s risk management policy approved by the board of directors. The Bank recognizes the role of the board of directors and executive management in the risk management process as set out in the Banking Control Commission circular 242. In particular, it is recognized that ultimate responsibility for establishment of effective risk management practices and culture lies with the board of directors as does the setting up of Bank s risk appetite and tolerance levels. The board of directors delegates through its risk management committee the day to day responsibility for establishment and monitoring of risk management process across the Bank s group to the head of risk management, who is directly appointed by the board of directors, in coordination with executive management at BLOM Bank SAL. The Group is exposed to credit risk, liquidity risk, market risk and operational risk. The board s risk management committee has the mission to periodically (1) review and assess the risk management function to the Group, (2) review the adequacy of the Bank s capital and its allocation within the Group, and (3) review risk limits and reports and make recommendations to the Board. The head of risk management undertakes his responsibilities through the Risk Management Department, with its employees reporting directly to the head of risk management. The risk manager is responsible for establishing the function of the department and its employees. BLOM Bank s risk management department aids executive management in controlling and actively managing the Group s overall risk. The department mainly ensures that: Risk policies and methodologies are consistent with the Group s risk appetite. Limits and risk across banking activities are monitored throughout the Group. Through a comprehensive risk management framework, transactions and outstanding risk exposures are quantified and compared against authorized limits, whereas nonquantifiable risks are monitored against policy guidelines as set by the Group s Risk Management Policy. Any discrepancies, breaches or deviations are escalated to executive senior management in a timely manner for appropriate action. 140
142 NOTES TO THE CONSOLIDATED FINANCIAL STATEMENTS At 31 December In addition to the Group s risk management in Lebanon, risk managers and / or risk officers were assigned within the Group s foreign subsidiaries or branches to report to the department and executive senior management in a manner that ensures: Standardization of risk management functions and systems developed across the Group. Regional consistency of conducted business in line with the board s approved risk appetite. In respect to Basel 2 capital adequacy ratio calculations, risk management started, since December 2004 consolidated balances, to issue internal reports to executive management and the board revealing multiple scenarios of capital adequacy calculations for credit and market risks under the standardized approaches and for operational risk under the basic indicator approach. In addition, the Bank sent to the Banking Control Commission a quantitative impact study for the Basel 2 capital adequacy calculations for June balances revealing a ratio well above the minimum international requirement of 8% Credit risk Credit risk is the risk that one party to a financial instrument will fail to discharge an obligation and cause the other party to incur a financial loss. The Group attempts to control credit risk by monitoring credit exposures, limiting transactions with specific counter parties, and continuously assessing the creditworthiness of counter parties. The Group manages credit risk by setting limits for individual borrowers and groups of borrowers and for geographical and industry segments. In addition the Group obtains security where appropriate. The debt securities included in investments are mainly sovereign risk and standard grade securities. Analysis of investments by counterparty is provided in notes 16 and 17. For details of the composition of the loans and advances refer to note 20. Information on credit risk relating to derivative instruments is provided in note 43 and for commitments and contingencies in note 44. The information on the Group s net maximum exposure by economic sectors is given in note (A) below. The Group maintains a general credit risk policy that is in compliance with the Group s general risk management related to the Group s credit transactions. It consists of the following: The permissible activities, segments, programs and services that the Group intends to deliver and the acceptable limits; The mechanism of the approval on creditfacilities; The mechanism for managing and following up creditfacilities; and The required actions for analyzing and organizing credit files. 141
143 50. RISK MANAGEMENT The Group attempts to control credit risk by monitoring credit exposures, limiting transactions with specific counter parties, and continually assessing the creditworthiness of counter parties. The Group s risk management are designed to identify and to set appropriate risk limits and to monitor the risk adherence to limits. Actual exposures against limits are monitored daily, monthly and periodically. Risk management is responsible for monitoring the risk profile of the Group s loan portfolio by producing internal reports highlighting any exposure of concern in corporate, commercial and consumer lending. The Group examines the level of concentration whether by credit quality, client groupings or economic sector and collateral coverage. Further, the Group monitors nonperforming loans and takes the required provisions for these loans. The Group in the ordinary course of lending activities holds collaterals and guarantees as security to mitigate credit risk in the loans and advances. These collaterals mostly include cash collateral, quoted shares and debt securities, real estate mortgages, personal guarantees and others. In addition, the collection unit in the Group dynamically manages and takes remedial actions for nonperforming loans. The Group uses an internal classification system based on risk ratings for its corporate and middle market customers. The risk rating system, which is managed by an independent unit, provides a rating based on client and transaction level. The classification system includes six grades, of which three grades relate to the performing portfolio (regular credit facilities: risk rating 1 and 2 and special mention watch list: risk rating 3 ), one grade relates to substandard loans (risk rating 4 ) and two grades relate to nonperforming loans (risk rating 5 and 6 ). Credit cards, personal loans, car loans, housing loans and other loans related to these loans are classified as regular as they are performing and have timely repayment with no past dues; except for those loans that have unsettled bills due for more than 90 days. Each individual borrower is rated based on an internally developed debt rating model that evaluates risk based on financial as well as qualitative inputs. The associated loss estimate norms for each grade have been calculated based on the Group s historical default rates for each rating. These risk ratings are reviewed on a regular basis. As for credit rating system, the Bank is implementing the Moody s KMV Risk Advisor for credit analysis and rating systems for corporate and commercial borrowers, in order to aid the Group in moving at a later stage to internal ratingbased measurements under Basel 2. The Bank has obtained a license from Moody s KMV to implement this system on the whole Group. 142
144 NOTES TO THE CONSOLIDATED FINANCIAL STATEMENTS At 31 December A Maximum exposure to credit risk An analysis of the Group s financial assets before and after taking into account collateral held or other credit enhancements, is as follows: Gross maximum exposure Net maximum exposure Gross maximum exposure 2006 Net maximum exposure Balances with the Central Banks Lebanese and other governmental treasury bills and bonds Bonds and financial assets with fixed income Shares, securities and financial assets with variable income Banks and financial institutions Loans and advances to customers Bank acceptances Investments and loans to related parties Other assets Regularization accounts and other debit accounts Contingent liabilities Commitments Total credit exposure 6,201,948 5,080,323 1,165,140 11,725 7,536,533 4,179, ,357 2,286 34, ,487 24,576,322 1,146,370 1,358,444 2,504,814 27,081,136 6,201,948 5,080,323 1,165,140 11,725 7,478,790 1,706,143 2,286 34, ,487 21,800, , ,691 1,594,467 23,394,525 6,153,639 3,474, ,100 8,403 7,754,284 2,996, ,260 2,269 33,715 61,408 21,044, , ,641 1,983,355 23,028,051 6,153,639 3,474, ,100 8,403 7,697,175 1,448,185 2,269 33,715 61,408 19,265, , ,852 1,320,247 20,586,061 For onbalance sheet financial assets, the exposures set out above are based on net carrying amount as reported in the balance sheet. 143
145 50. RISK MANAGEMENT Collateral and other credit enhancements The amount, type and valuation of collateral is based on guidelines specified in the risk management framework. The main types of collateral obtained include real estate, quoted shares, cash collateral and bank guarantees. The revaluation and custody of collaterals are performed independent of the business units. B Risk concentrations of maximum exposure to credit risk Domestic 4,567,394 4,836, ,843 6, ,437 2,322, ,956 1,651 24,019 50,380 12,661, ,998 1,078,209 1,279,207 13,940,576 International Total Balances with the Central Banks Lebanese and other governmental treasury bills and bonds Bonds and financial assets with fixed income Shares, securities and financial assets with variable income Banks and financial institutions Loans and advances to customers Bank acceptances Investments and loans to related parties Other assets Regularization accounts and other debit accounts Contingent liabilities Commitments Total credit exposure 1,634, ,159 1,001,297 4,735 6,952,096 1,856, , ,197 69,107 11,914, , ,235 1,225,607 13,140,560 6,201,948 5,080,323 1,165,140 11,725 7,536,533 4,179, ,357 2,286 34, ,487 24,576,322 1,146,370 1,358,444 2,504,814 27,081, Domestic 5,238,073 3,240, ,663 5, ,752 1,396,537 89,450 1,651 32,647 35,424 10,802, , , ,121 11,658,415 International Total 6,153,639 3,474, ,100 8,403 7,754,284 2,996, ,260 2,269 33,715 61,408 21,044, , ,641 1,983,355 23,028,051 Balances with the Central Banks Lebanese and other governmental treasury bills and bonds Bonds and financial assets with fixed income Shares, securities and financial assets with variable income Banks and financial institutions Loans and advances to customers Bank acceptances Investments and loans to related parties Other assets Regularization accounts and other debit accounts Contingent liabilities Commitments Total credit exposure 915, , ,437 2,897 7,201,532 1,600,161 83, ,068 25,984 10,242, , ,762 1,127,234 11,369,
146 NOTES TO THE CONSOLIDATED FINANCIAL STATEMENTS At 31 December C Credit quality per class of financial assets In managing its portfolio, the Group utilizes ratings and other measures and techniques which seek to take account of all aspects of perceived risk. Credit exposures classified as High quality are those where the ultimate risk of financial loss from the obligor s failure to discharge its obligation is assessed to be low. These include facilities to corporate entities with financial condition, risk indicators and capacity to repay which are considered to be good to excellent. Credit exposures classified as Standard quality comprise all other facilities whose payment performance is fully compliant with contractual conditions and which are not impaired. The ultimate risk of possible financial loss on Standard quality is assessed to be higher than that for the exposures classified within the High quality range. The credit quality of financial assets is managed by the Group using internal credit ratings. The table below shows the credit quality by class of financial asset for balance sheet lines, based on the Group s credit rating system Neither past due nor impaired High Standard grade grade Past due but not impaired Past due and impaired Total Lebanese and other governmental treasury bills and bonds Bonds and financial assets with fixed income Shares, securities and financial assets with variable income Banks and financial institutions Loans and advances to customers Bank acceptances Investments and loans to related parties 5,080,323 1,165,140 11,725 7,536,533 3,968, ,357 2,286 18,010, , ,078 35,095 35,095 70,192 70,192 5,080,323 1,165,140 11,725 7,536,533 4,179, ,357 2,286 18,220, Neither past due nor impaired High Standard grade grade Past due but not impaired Past due and impaired Total Lebanese and other governmental treasury bills and bonds Bonds and financial assets with fixed income Shares, securities and financial assets with variable income Banks and financial institutions Loans and advances to customers Bank acceptances Investments and loans to related parties 3,474, ,100 8,403 7,754,284 2,840, ,260 2,269 14,640,181 60,864 60,864 34,349 34,349 60,540 60,540 3,474, ,100 8,403 7,754,284 2,996, ,260 2,269 14,795,
147 50. RISK MANAGEMENT D Aging analysis of past due but not impaired loans Less than 90 days More than 90 days Total Loans and advances to customers 13,048 22,047 35, Less than 90 days More than 90 days Total Loans and advances to customers 13,792 20,557 34,349 Impairment assessment The main considerations for the loan impairment assessment include whether any payments of principal or interest are overdue by more than 90 days or there are any known difficulties in the cash flows of counterparties, credit rating downgrades, or infringement of the original terms of the contract. The Group addresses impairment assessment in two areas: individually assessed allowances and collectively assessed allowances. Individually assessed allowances The Group determines the allowances appropriate for each individually significant loan or advance on an individual basis. Items considered when determining allowance amounts include the sustainability of the counterparty s business plan, its ability to improve performance once a financial difficulty has arisen, projected receipts and the expected dividend payout should bankruptcy ensue, the availability of other financial support and the realisable value of collateral, and the timing of the expected cash flows. The impairment losses are evaluated at each reporting date, unless unforeseen circumstances require more careful attention. Collectively assessed allowances Allowances are assessed collectively for losses on loans and advances that are not individually significant (including credit cards, housing loans and unsecured consumer lending) and for individually significant loans and advances where there is not yet objective evidence of individual impairment. Allowances are evaluated on each reporting date with each portfolio receiving a separate review. 146
148 NOTES TO THE CONSOLIDATED FINANCIAL STATEMENTS At 31 December The collective assessment takes account of impairment that is likely to be present in the portfolio even though there is not yet objective evidence of the impairment in an individual assessment. Impairment losses are estimated by taking into consideration of the following information: historical losses on the portfolio, current economic conditions, the approximate delay between the time a loss is likely to have been incurred and the time it will be identified as requiring an individually assessed impairment allowance, and expected receipts and recoveries once impaired. Management is responsible for deciding the length of this period which can extend for as long as one year. The impairment allowance is then reviewed by credit management to ensure alignment with the Group s overall policy. Financial guarantees and letters of credit are assessed and provision made in a similar manner as for loans. E Credit quality using external risk ratings Moody s equivalent grades S & P equivalent grades Total risk High grade Risk rating class 1 Risk rating class 2 Risk rating class 3 Risk rating class 4 Aaa Aa1 A3 Baa1 Baa2 Baa3 AAA AA+ to A3 BBB+ to BBB BBB 247,553 7,227,824 1,013,378 74,902 Standard grade Risk rating class 5 Risk rating class 6 Risk rating class 7 Ba1 Ba2 Ba3 B1 B2 BB+ BB to BB B+ to B 116,132 11,922 Substandard grade Risk rating class 8 Risk rating class 9 B3 Caa C B CCC+ to C 9,449,028 Impaired Risk rating class 10 D 274,244 Unclassified 8,666,153 27,081,
149 50. RISK MANAGEMENT 50.2 Liquidity Risk Liquidity risk is the risk that the Group will be unable to meet its liabilities when they fall due under normal and stress circumstances. Liquidity risk can be caused by market disruptions or credit downgrades which may cause certain sources of funding to dry up immediately. To limit this risk, management has arranged diversified funding sources in addition to its core deposit base, manages assets with liquidity in mind, maintaining a healthy balance of cash and cash equivalents and readily marketable securities. The management of liquidity risk is currently governed by the Group s Assets and Liabilities Management policy. The main objectives converge around the following: Set targets and ranges for key balance sheet or income statement ratios to assure that the needed liquidity capacity of the Group is maintained at all times, while providing sufficient flexibility to enable the Group to address short term fluctuations in liquidity pressures. Provide general guidance on the sequence to be followed in drawing on the Group s funding sources to meet a liquidity drain. Review the current and prospective liquidity positions and monitor alternative funding sources. Develop parameters for the pricing and maturity distributions of deposits, loans and investments. Promulgate a contingency liquidity plan that identifies early indicators of stress conditions and describe actions to be taken in the event of financial difficulties arising from systemic or other crises, while minimizing adverse longterm implications for the Group s business. In accordance with Lebanese banking rules and regulations, the Group maintains a noninterest bearing balances at the Bank of Lebanon calculated on the basis of 25% of sight commitments and 15% of term commitments in Lebanese Lira. Regarding foreign currencies, the Group maintains interestbearing placements at the Bank of Lebanon at the rate of 15% of total deposits in foreign currencies regardless of nature. Foreign subsidiaries are also subject to obligatory reserve requirements with varying percentages, according to the banking rules and regulations of the countries in which they are locates. The liquidity position is assessed and managed under a variety of scenarios, giving due consideration to stress factors relating to both the market in general and specifically to the Group. One of these methods is to maintain limits on the ratio of liquid assets to customers deposits, set to reflect market conditions. Net liquid assets consist of cash and balances with the Central Banks, deposits with banks and financial institutions, Lebanese and other governmental treasury bills and bonds less deposits due to banks and financial institutions due to mature within the next month. The ratio during the year was as follows: 148
150 NOTES TO THE CONSOLIDATED FINANCIAL STATEMENTS At 31 December % 2006 % At 31 December Average during the year Highest Lowest Analysis of financial liabilities by remaining contractual maturities The table below summarizes the maturity profile of the Group s financial liabilities at 31 December and 2006 based on contractual undiscounted repayment obligations. As the special commission payments up to contractual maturity are included in the table, totals do not match with the balance sheet. The contractual maturities of liabilities have been determined on the basis of the remaining period at the consolidated balance sheet date to the contractual maturity date and do not take into account the effective expected maturities as shown on note 5022 below (maturity analysis of assets and liabilities). Repayments which are subject to notice are treated as if notice were being given immediately. However, the Group expects that many customers will not request repayment on the earliest date the Group could be required to pay and the table does not reflect the expected cash flows indicated by the Group s deposit retention history. 31 December Up to 1 month 1 to 3 months 3 to 12 months 1 to 5 years Over 5 years Total Due to banks and financial institutions Customers deposits Engagements by acceptances 1,487,146 15,507,373 72,930 2,414 4,049, ,773 8,295 1,095,153 50,400 12, ,694 2,254 48,052 12,635 1,558,831 20,820, ,357 Total undiscounted financial liabilities 17,067,449 4,172,153 1,153, ,872 60,687 22,625,
151 50. RISK MANAGEMENT 31 December 2006 Up to 1 month 1 to 3 months 3 to 12 months 1 to 5 years Over 5 years Total Due to banks and financial institutions Customers deposits Engagements by acceptances 1,298,281 13,267,629 49, ,399, ,717 12,908 1,079,216 21,775 1,311,415 17,768, ,260 Total undiscounted financial liabilities 14,615,453 3,523,451 1,092,124 21,775 19,252,803 The table below shows the contractual expiry by maturity of the Group s contingent liabilities and commitments: Up to 1 month 1 to 3 months 3 to 12 months 1 to 5 years Over 5 years Total Contingent liabilities Commitments Foreign currencies to receive against foreign currencies to deliver 1,146,370 1,358,444 2,504,814 2,740,679 2,740, , ,870 1,146,370 1,358,444 2,942,549 5,447, Up to 1 month 1 to 3 months 3 to 12 months 1 to 5 years Over 5 years Total Contingent liabilities Commitments Foreign currencies to receive against foreign currencies to deliver 996, ,641 1,983, , ,354 1,259,401 1,259, , ,641 2,146,755 4,130,
152 NOTES TO THE CONSOLIDATED FINANCIAL STATEMENTS At 31 December The Group expects that not all of the contingent liabilities or commitments will be drawn before expiry of the commitments Maturity analysis of assets and liabilities The table below shows an analysis of assets and liabilities analyzed according to when they are expected to be recovered or settled. See note 5021 above for the Group s contractual undiscounted financial liabilities. The maturity profile of the Group s assets and liabilities as at 31 December is as follows: Less Than one year More Than one year ASSETS Cash and balances with the Central Banks Lebanese and other governmental treasury bills and bonds Bonds and financial assets with fixed income Shares, securities and financial assets with variable income Banks and financial institutions Loans and advances to customers Bank acceptances Investments and loans to related parties Tangible fixed assets Intangible fixed assets Other assets Regularization accounts and other debit accounts Goodwill TOTAL ASSETS Up to 1 month 1,998, ,026 10,266 6,224,244 1,695,238 72,930 26,959 80,315 10,343,055 1 to 3 months 114, ,423 30, , , , ,368 1,530,673 3 months To 1 Year 303, , ,403 89, ,520 50, ,656 2,318,776 Subtotal 2,415,740 1,110, ,808 7,141,505 2,988, ,103 27, ,339 14,192,504 (12) years 878,256 1,133,887 45, , ,057 2, ,677,979 (25) years 2,263,172 2,236, ,862 42, , ,557,469 Over 5 years 772, , ,172 11,725 43, ,110 27, ,642 4,459 7,102 60,586 2,639,062 Subtotal 3,914,291 3,969,844 1,018,332 11, ,028 1,190,870 2,254 27, ,642 4,459 7, ,586 10,874,510 Total 6,330,031 5,080,323 1,165,140 11,725 7,536,533 4,179, ,357 27, ,642 4,459 34, ,487 60,586 25,067,014 LIABILITIES Banks and financial institutions Customers deposits Engagements by acceptances Other liabilities Regularization accounts and other credit accounts Provisions for risks and charges TOTAL LIABILITIES NET LIQUIDITY GAP 1,469,530 15,398,393 72,930 68, ,888 3,954 17,169,813 (6,826,758) 22,204 4,112, ,773 69,211 28,957 4,352,556 (2,821,883) 18,955 1,053,796 50,400 55,498 1,510,689 20,564, , ,827 2, ,660 3,954 1,181,464 22,703,833 1,137,312 (8,511,329) 59,151 2,254 1, ,928 2,614,051 72,794 72,794 5,484,675 45,225 11, , ,050 2,505,012 45, ,916 2,254 1,633 1,132 76, ,772 10,603,738 1,555,914 20,708, , , ,792 80,566 22,974,605 2,092,
153 50. RISK MANAGEMENT The maturity profile of the Group s assets and liabilities as at 31 December 2006 is as follows: Less Than one year More Than one year Up to 1 month 1 to 3 months 3 months To 1 Year Subtotal (12) years (25) years Over 5 years Subtotal Total ASSETS Cash and balances with the Central Banks Lebanese and other governmental treasury bills and bonds Bonds and financial assets with fixed income Shares, securities and financial assets with variable income Banks and financial institutions Loans and advances to customers Bank acceptances Investments and loans to related parties Tangible fixed assets Intangible fixed assets Other assets Regularization accounts and other debit accounts Goodwill TOTAL ASSETS 1,072,713 41,070 18,320 6,603,818 1,567,276 49,543 21,542 47,778 9,422, ,949 37,203 1, , , ,717 6,144 7,787 1,810, , ,973 62, , ,964 5,469 1,777,081 2,190, ,246 82,198 7,564,822 2,470, ,260 27,686 61,034 13,009, , ,269 70, , , ,958,593 2,401,613 1,986, , , ,810, , ,466 54,132 8,403 6,301 86,925 3, ,372 2,845 6, ,980 1,645,748 4,056,290 3,034, ,902 8, , ,649 3, ,372 2,845 6, ,980 8,415,200 6,246,406 3,474, ,100 8,403 7,754,284 2,996, ,260 3, ,372 2,845 33,715 61,408 63,980 21,424,611 LIABILITIES Banks and financial institutions Customers deposits Engagements by acceptances Other liabilities Regularization accounts and other credit accounts Provisions for risks and charges TOTAL LIABILITIES NET LIQUIDITY GAP 1,282,646 13,311,728 49,543 38,502 98,906 14,781,325 (5,359,265) 13,808 3,321, ,717 55,213 15,345 3,529,871 (1,719,601) 12,390 1,051,578 47,352 1,308,844 17,685, , ,067 8, ,185 1,120,254 19,431, ,827 (6,422,039) 5,287 2,968 8,255 1,950, ,810,816 3,673 64,646 68,319 1,577,429 5,287 6,684 64,646 76,617 8,338,583 1,308,844 17,690, , , ,869 64,646 19,508,067 1,916, Market risk Market risk is the risk that the fair value or future cash flows of financial instruments will fluctuate due to changes in market prices. Market risks arise from open positions in interest rate and currency rate, all of which are exposed to general and specific market movements and changes in the level of volatility of market rates or prices such as interest rates and foreign exchange rates. 152
154 NOTES TO THE CONSOLIDATED FINANCIAL STATEMENTS At 31 December Risk management is responsible for generating internal reports quantifying the Group s earnings at risk due to extreme movements in interest rates, while daily monitoring the sensitivity of the Group s trading portfolio of fixed income securities to changes in market prices and / or market parameters. Interest rate sensitivity gaps are reported to executive management and to the Banking Control Commission unconsolidated on a monthly basis and consolidated (Group level) on a semi annual basis. The Bank s Asset and Liability Management (ALM) policy assigns authority for its formulation, revision and administration to the Asset / Liability Management Committee (ALCO) of BLOM Bank SAL. Risk management will be responsible for monitoring compliance with all limits set in the ALM policy ranging from core foreign currency liquidity to liquidity mismatch limits to interest sensitivity gap limits. The Bank is also in the process of implementing the newly acquired Asset and Liability Management system Focus ALM aimed at automating the management of the Bank s assets and liabilities from a static and dynamic perspectives including stress testing and extensive scenario analysis Interest rate risk Interest rate risk arises from the possibility that changes in interest rates will affect future profitability or the fair values of financial instruments. The Group is exposed to interest rate risk as a result of mismatches of interest rate repricing of assets and liabilities and offbalance sheet items that mature or reprice in a given period. The Group manages this risk by matching the repricing of assets and liabilities through risk management strategies. Interest rate sensitivity The following table demonstrates the sensitivity to a reasonable possible change in interest rates, with all other variables held constant, of the Group s income statement or statement of changes in equity. The sensitivity of the income statement is the effect of the assumed changes in interest rates on the net interest income for one year, based on the floating rate nontrading financial assets and financial liabilities held at the year end, including the effect of hedging instruments. The sensitivity of equity is calculated by revaluing the available for sale investments, based on the assumption that there are parallel shifts in the yield curve. 153
155 50. RISK MANAGEMENT The sensitivity of equity is analyzed by maturity of the assets or cash flow hedge swaps. All the nontrading book exposures are monitored and analyzed in currency concentrations and relevant sensitivities are disclosed in local currency. ThesensitivityanalysisdoesnottakeaccountofactionbytheGroupthatmightbetakentomitigatetheeffectofsuchchanges. Sensitivity of equity Currency Lebanese Lira United States Dollar Euro Others Increase in basis points 0.50% 0.50% 0.25% 0.25% Sensitivity of net interest income (4,756) 2, ,049 0 to 6 months (4,559) (3,225) (85) (101) 6 months to 1 year (3,777) (3,873) (90) (101) (1 5) years (10,681) (22,967) (73) (582) More than 5 years (11,392) (214) Total (19,017) (41,457) (248) (998) Sensitivity of equity Currency Lebanese Lira United States Dollar Euro Others Decrease in basis points 0.50% 0.50% 0.25% 0.25% Sensitivity of net interest income 4,756 (2,655) (735) (1,049) 0 to 6 months 4,694 9, months to 1 year 3,899 7, (1 5) years 11,408 38, More than 5 years 15, Total 20,001 71, ,013 Sensitivity of equity 2006 Currency Lebanese Lira United States Dollar Euro Others Increase in basis points 0.50% 0.50% 0.25% 0.25% Sensitivity of net interest income (6,243) 7,261 1,144 1,202 0 to 6 months (4,293) (1,554) (84) (107) 6 months to 1 year (4,221) (1,554) (84) (48) (1 5) years (9,004) (8,567) (198) (305) More than 5 years (3,202) (115) Total (17,518) (14,877) (366) (575) Sensitivity of equity 2006 Currency Lebanese Lira United States Dollar Euro Others Decrease in basis points 0.50% 0.50% 0.25% 0.25% Sensitivity of net interest income 6,243 (7,261) (1,144) (1,202) 0 to 6 months 4,345 3, months to 1 year 4,264 3, (1 5) years 9,133 15, More than 5 years 4, Total 17,742 26,
156 NOTES TO THE CONSOLIDATED FINANCIAL STATEMENTS At 31 December Effective interest rates of financial instruments The effective interest rates by major currencies for each of the monetary financial instruments are as follows: ASSETS Central banks and other banks Lebanese and other governmental treasury bills and bonds Bonds and financial assets with fixed income Loans and advances to customers LIABILITIES Banks and financial institutions Customers deposits LL % Other currencies %
157 50. RISK MANAGEMENT Interest rate sensitivity gap The Group s interest rate sensitivity position based on contractual repricing arrangements or maturity as at 31 December has been shown in the table below. Up to 1 month 1 to 3 months 3 months to 1 year (1 2) years (2 5) years More than 5 years Non interest sensitive Total ASSETS Cash and balances with the Central Banks Lebanese and other governmental treasury bills and bonds Bonds and financial assets with fixed income Shares, securities and financial assets with variable income Banks and financial institutions Loans and advances to customers Bank acceptances Investments and loans to related parties Tangible fixed assets Intangible fixed assets Other assets Regularization accounts and other debit accounts Goodwill TOTAL ASSETS 984, ,525 7,537 1,770 5,899,948 1,392,262 8,503,155 88,314 78,264 28, , ,829 1,323, , , ,096 87, ,274 8,079 2,124, ,256 1,133,887 43,996 2, , ,435 2,674,397 2,176,206 2,236, ,199 42, ,822 5,694, , , ,866 43,746 84,740 2,200,664 1,150,879 97,900 12,829 7, , , ,278 27, ,642 4,459 34, ,487 60,586 2,546,044 6,330,031 5,080,323 1,165,140 11,725 7,536,533 4,179, ,357 27, ,642 4,459 34, ,487 60,586 25,067,014 LIABILITIES AND EQUITY Banks and financial institutions Customers deposits Engagements by acceptances Other liabilities Regularization accounts and other credit accounts Provisions for risks and charges Shareholders' equity 1,298,955 14,752,113 22,184 3,932,547 16,137 18, ,626 8,079 47,393 72,794 45,225 11, , , , , ,792 80,566 2,092,409 1,555,914 20,708, , , ,792 80,566 2,092,409 TOTAL LIABILITIES AND EQUITY 16,051,068 3,970,868 1,013,180 47,393 72,794 56,594 3,855,117 25,067,014 Total interest rate sensitivity gap (7,547,913) (2,647,853) 1,111,635 2,627,004 5,622,130 2,144,070 (1,309,073) Cumulative interest rate sensitivity gap (7,547,913) (10,195,766) (9,084,131) (6,457,127) (834,997) 1,309,
158 NOTES TO THE CONSOLIDATED FINANCIAL STATEMENTS At 31 December The Group s interest rate sensitivity position based on contractual repricing arrangements or maturity as at 31 December 2006 was as follows: Up to 1 month 1 to 3 months 3 months to 1 year (1 2) years (2 5) years More than 5 years Non interest sensitive Total ASSETS Cash and balances with the Central Banks Lebanese and other governmental treasury bills and bonds Bonds and financial assets with fixed income Shares, securities and financial assets with variable income Banks and financial institutions Loans and advances to customers Bank acceptances Investments and loans to related parties Tangible fixed assets Intangible fixed assets Other assets Regularization accounts and other debit accounts Goodwill TOTAL ASSETS 53,132 23,526 15,075 6,304,058 1,421,873 7,817, ,500 12,173 77, , ,809 1,409, , ,076 28, , ,964 1,932, , ,917 51, , ,263 1,933,086 2,401,613 1,822, , ,461 4,619, , ,574 54,133 6,301 86,925 1,193,874 1,426,090 74,353 5,876 8, , , ,260 3, ,372 2,845 33,715 61,408 63,980 2,517,685 6,246,406 3,474, , ,754,284 2,996, ,260 3, ,372 2,845 33,715 61,408 63,980 21,424,611 LIABILITIES AND EQUITY Banks and financial institutions Customers deposits Engagements by acceptances Other liabilities Regularization accounts and other credit accounts Provisions for risks and charges Shareholders' equity 1,123,330 11,353,495 13,808 3,321,788 12,390 1,051,578 5, ,316 1,958, , , ,869 64,646 1,916,544 1,308,844 17,690, , , ,869 64,646 1,916,544 TOTAL LIABILITIES AND EQUITY 12,476,825 3,335,596 1,063,968 5,287 4,542,935 21,424,611 Total interest rate sensitivity gap (4,659,161) (1,925,936) 868,857 1,927,799 4,619,817 1,193,874 (2,025,250) Cumulative interest rate sensitivity gap (4,659,161) (6,585,097) (5,716,240) (3,788,441) 831,376 2,025,
159 50. RISK MANAGEMENT Currency risk 158 Currency risk is the risk that the value of a financial instrument will fluctuate due to changes in foreign exchange rate. The Bank protects its capital and reserves by holding a foreign currency position in US Dollars representing 60% of its shareholders equity after adjustment according to specific requirements set by the Bank of Lebanon. The Bank is also allowed to hold a net trading position not to exceed 1 percent of its net shareholders equity, as long as the global foreign position does not exceed, at the same time, 40 percent of its net shareholders equity, and that the related banks are abiding in a timely and consistent manner with the required solvency rate (Bank of Lebanon circular number 32). The table below indicates the consolidated balance sheet detailed by currency. The following consolidated balance sheet as of 31 December, is detailed in Lebanese Lira (LL) and foreign currencies, translated into LL. ASSETS Cash and balances with the Central Banks Lebanese and other governmental treasury bills and bonds Bonds and financial assets with fixed income Shares, securities and financial assets with variable income Banks and financial institutions Loans and advances to customers Bank acceptances Investments and loans to related parties Tangible fixed assets Intangible fixed assets Other assets Regularization accounts and other debit accounts Goodwill TOTAL ASSETS OFFBALANCE SHEET ITEMS Financial assets sold with an option to repurchase Engagements received Bad loans totally provided for Foreign currencies to deliver against foreign currencies to receive Total LIABILITIES Banks and financial institutions Customers deposits Engagements by acceptances Other liabilities Regularization accounts and other credit accounts Provisions for risks and charges Total liabilities NET EXPOSURE OFFBALANCE SHEET ITEMS Financing commitments given to Financial intermediaries Customers Bank guarantees given to Financial intermediaries Customers Commitments on term financial instruments Financial assets bought with an option to resell Fiduciary deposits, assets under management and custody accounts Foreign currencies to receive against foreign currencies to deliver 1,107,807 2,394, , ,369 2, , ,500 23,810 4,077, ,524 6, ,960 32,367 3,298,803 52, ,103 25,241 3,558, ,400 22,322 22,322 9,172 31,494 US Dollars in 3,622,031 2,335,517 1,079,976 7,079 5,103,048 2,146, ,950 22,658 8, ,783 35,365 14,542, ,647 5,017,484 18, ,891 5,869, ,010 13,073, ,950 82,240 19,400 1,849 13,533,951 1,008, ,045 18, , ,216 94, , ,647 3,338, ,806 4,830,111 Foreign currencies in Lebanese Lira Euro in Other foreign currencies 71, ,103 22, ,905, ,940 35, , ,497 2,457,310 80,626 3, , ,368 1,202,947 1,296,025 35,335 16,227 1, ,552,515 (95,205) 47, , ,862 85,635 64,227 34,142 89, , ,014 1,528, ,160 62,348 4, ,046 1,398,545 34,072 1, ,154 3,146 21,874 52,815 60,586 3,990,206 1,325,884 1,631,898 2,957, ,590 3,040,186 34,072 43,637 18,591 53,193 3,329, ,937 27,138 1,638 25, ,596 16, , ,355 1,739,136 2,506,225 Total foreign currencies 5,222,224 2,685,780 1,165,140 11,364 7,468,375 3,849, ,357 24, ,198 3,634 27,716 95,677 60,586 20,989, ,647 6,423,994 21,876 2,939,186 9,528,703 1,523,547 17,409, , ,104 39,689 55,325 19,415,735 1,574, ,374 21, , , , ,296 34, ,647 3,949,964 2,942,549 8,194,350 Total 6,330,031 5,080,323 1,165,140 11,725 7,536,533 4,179, ,357 27, ,642 4,459 34, ,487 60,586 25,067, ,647 7,088,518 28,312 2,939,186 10,199,663 1,555,914 20,708, , , ,792 80,566 22,974,605 2,092, ,374 21, , , , ,618 34, ,647 3,959,136 2,942,549 8,225,844
160 NOTES TO THE CONSOLIDATED FINANCIAL STATEMENTS At 31 December The following consolidated balance sheet as of 31 December 2006, is detailed in Lebanese Lira (LL) and foreign currencies, translated into LL. ASSETS Cash and balances with the Central Banks Lebanese and other governmental treasury bills and bonds Bonds and financial assets with fixed income Shares, securities and financial assets with variable income Banks and financial institutions Loans and advances to customers Bank acceptances Investments and loans to related parties Tangible fixed assets Intangible fixed assets Other assets Regularization accounts and other debit accounts Goodwill TOTAL ASSETS OFFBALANCE SHEET ITEMS Engagements received Bad loans totally provided for Foreign currencies to deliver against foreign currencies to receive Total LIABILITIES Banks and financial institutions Customers deposits Engagements by acceptances Other liabilities Regularization accounts and other credit accounts Provisions for risks and charges Total liabilities NET EXPOSURE OFFBALANCE SHEET ITEMS Financing commitments given to Financial intermediaries Customers Bank guarantees given to Financial intermediaries Customers Commitments on term financial instruments Fiduciary deposits, assets under management and custody accounts Foreign currencies to receive against foreign currencies to deliver 1,363,907 1,997, , ,083 2, ,024 6,386 18,230 3,827, ,620 12, ,031 2,113 3,116,951 39, ,154 26,010 3,294, ,953 25, ,372 12,410 38,229 US Dollars in 3,987,084 1,161, ,926 6,437 5,347,351 1,647,814 73,451 9,263 18,514 14,336 12,595,957 4,524,189 28, ,936 5,365, ,162 11,739,074 73,451 60,447 6,451 6,551 12,011, , ,739 12, , ,922 64, ,294 1,375, ,713 2,465,032 Foreign currencies in Lebanese Lira Euro in Other foreign currencies 211,877 89,860 10, ,888, ,707 91, , ,533,470 71,793 2,996 36, ,046 1,081, ,995 91,611 9,642 3,520 3,560 2,182, ,598 55, , ,530 15,913 84,617 17, , , , , ,339 45,377 1, , ,094 8, ,512 2,717 8,542 19,089 62,989 2,467, ,171 1,295,424 1,591, ,025 1,841,361 8,198 31,831 9,744 28,525 2,019, ,172 21, , ,257 15, ,147 1,133,979 1,262,506 2,706,686 Total foreign currencies 4,882,499 1,476, ,100 8,042 7,691,489 2,748, , ,348 2,845 27,329 43,178 63,980 17,597,283 4,892,153 31,494 2,144,617 7,068,264 1,306,731 14,573, , ,920 19,715 38,636 16,213,692 1,383, ,186 13, , ,709 95, ,058 17,659 2,761,950 2,146,755 5,897,259 Total 6,246,406 3,474, ,100 8,403 7,754,284 2,996, ,260 3, ,372 2,845 33,715 61,408 63,980 21,424,611 5,467,773 43,905 2,144,617 7,656,295 1,308,844 17,690, , , ,869 64,646 19,508,067 1,916, ,186 13, , ,528 96, ,430 17,659 2,774,360 2,146,755 5,935,
161 50. RISK MANAGEMENT 51. OPERATIONAL RISK 52. PREPAYMENT RISK 53. CAPITAL MANAGEMENT The table below indicates the extent to which the Group was exposed to currency risk at 31 December on its foreign currency positions. The analysis calculates the effects of a reasonably possible movement of the currency rate against the Lebanese Lira, with all other variables held constant, including the effect of hedging instruments, on the consolidated income statement (due to the fair value of currency sensitive nontrading monetary assets and liabilities) and equity (due to the change in fair value of currency swaps and forward foreign exchange contracts used as cash flow hedges). The effect on equity is not significant. A negative amount in the table reflects a potential net reduction in consolidated income statement or equity, while a positive amount reflects a net potential increase. Change in currency rate % Effect on profit before tax Change in currency rate % 2006 Effect on profit before tax 2006 Currency USD EUR ± 1% ± 1% ± 10,328 ± 500 ± 1% ± 1% ± 8,126 ± OPERATIONAL RISK Operational risk is the risk of loss arising from systems failure, human error, fraud or external events. When controls fail to perform, operational risks can cause damage to reputation, have legal or regulatory implications, or lead to financial loss. The Group cannot expect to eliminate all operational risks, but through a control framework and by monitoring and responding to potential risks, the Group is able to manage the risks. Controls include effective segregation of duties, access, authorization and reconciliation procedures, staff education and assessment processes, including the use of internal audit. 52. PREPAYMENT RISK Prepayment risk is the risk that the Group will incur a financial loss because its customers and counterparties repay or request repayment earlier than expected, such as fixed rate housing loans when interest rate falls. The fixed rate assets of the Group are not significant compared to the total assets. Moreover, other market conditions causing prepayment is not significant in the markets in which the Group operates. Therefore, the Group considers the effect of prepayment on net interest income is not material after taking into account the effect of any prepayment penalties. 160
162 NOTES TO THE CONSOLIDATED FINANCIAL STATEMENTS At 31 December 53. CAPITAL MANAGEMENT The Bank maintains an actively managed capital base to cover risks, inherent in the business. The adequacy of the Bank s capital is monitored using, among other measures, the rules and ratios established by the Bank of Lebanon and the Banking Control commission. The Bank should maintain a required capital adequacy ratio (not less than 12%) based on the total tier one capital over the total risk weighted assets and offbalance sheet items. The Bank manages its capital structure and makes adjustments to it in the light of changes in economic conditions and the risk characteristics of its activities. In order to maintain or adjust the capital structure, the Bank may adjust the amount of dividend payment to shareholders, return capital to shareholders or issue capital securities. No changes were made in the objectives, policies and processes from the previous years. Regulatory capital Tier 1 capital Tier 2 capital Total capital Risk weighted assets Tier 1 capital ratio Total capital ratio 1,839,001 29,224 1,868,225 6,430, % 29.05% ,665,170 36,157 1,701,327 4,714, % 36.09% Regulatory capital consists of Tier 1 capital, which comprises share capital, reserves and premiums, reserves for general banking risks, treasury shares, retained earnings and profit for the year less dividend distributed, intangible assets and goodwill. The other component of regulatory capital Tier 2 capital, which includes revaluation reserves and cumulative changes in fair values. 161
163 54. COMMITMENTS AND CONTINGENCIES 55. COMPARATIVE AMOUNTS 56. SUBSEQUENT EVENTS 54. COMMITMENTS AND CONTINGENCIES a) Due to the nature of its business, the Group is a defendant in various legal proceedings. Management, after discussing with its counselors all such cases and proceedings against the Group, considers that the aggregate liability or loss, if any, resulting from an adverse determination would not have a material effect on the consolidated financial position of the Group. b) The Bank s books in Lebanon have not been reviewed by the tax authorities for the years 2006 and. The ultimate outcome of any review that may take place by the tax authorities cannot be presently determined. c) The Bank s books in Lebanon have not been reviewed by the National Social Security Fund (NSSF) since The ultimate outcome of any review by the NSSF on the Bank s books from 1998 to cannot be presently determined. 55. COMPARATIVE AMOUNTS Except for the correction of an error in note 40 to the financial statements, the following reclassifications were just to enhance the presentation in the current year: Provision for real estate taken in recovery of debt was reclassified from Provisions for risks and charges caption to Tangible fixed assets caption. Comparative amounts totaling to LL 11,715 million were classified accordingly. Other income was reclassified from Net commission income caption to Other operating income caption. Comparative amounts of LL 5,714 million were reclassified accordingly. 56. SUBSEQUENT EVENTS On 26 December, the extraordinary general assembly of the shareholders of Arope Insurance SAL (a subsidiary) resolved to increase the Company s capital from LL 21,600 million to LL 43,200 million. Accordingly, the Bank has subscribed in its share of the subsidiary s capital increase in full (LL 19,129 million) on 11 February On 5 March 2008, the Bank obtained the preliminary approval of the Bank of Lebanon for the redemption of the 750,000 preferred shares issue 2002 amounting to LL 7,500 million. 162

164
165 WORLDWIDE CORRESPONDENT BANKS WORLDWIDE CORRESPONDENT BANKS COUNTRY CORRESPONDENT BANK Australia, Sydney Belgium, Brussels Bahrain, Manama Canada, Toronto Canada, Toronto Denmark, Copenhagen France, Paris Germany, Frankfurt am Main Germany, Frankfurt am Main Germany, Frankfurt am Main Italy, Milan Italy, Rome Japan, Tokyo Japan, Tokyo KSA, Jeddah KSA, Riyadh Kuwait, Kuwait Netherlands, Amesterdam Norway, Oslo Qatar, Doha Spain, Madrid Sweden, Stockholm Switzerland, Geneva Switzerland, Zurich Switzerland, Zurich U.A.E, Dubai U.K, London U.K, London U.S.A, New York U.S.A, New York AUD EUR BHD CAD CAD DKK EUR EUR EUR EUR EUR EUR JPY JPY SAR SAR KWD EUR NOK QAR EUR EUR CHF EUR EUR AED GBP GBP USD USD Commonwealth Bank of Australia Fortis Bank S.A. / N.V. National Bank of Bahrain Royal Bank of Canada Imperial Bank of Commerce (The) Danske Bank A/S BLOM BANK France SA Commerzbank AG Deutsche Bank AG Dresdner Bank AG Banca Intesa San Paolo SPA Banca Nazionale Del Lavoro SPA Bank of TokyoMitsubishi Ltd JP Morgan Chase Bank N.A. The National Commercial Bank Riyad Bank Gulf Bank KSC ABN AMRO Bank N.V. DnB NOR Bank ASA Commercial Bank of Qatar (The) (QSC) Banco Bilbao Vizcaya Argentaria S.A. (BBVA) Skandinaviska Enskilda Banken AB BLOM BANK Switzerland SA Credit Suisse UBS AG BLOM BANK France SA BLOM BANK France SA National WESTMINSTER BANK PLC Bank of New York (The) JP Morgan Chase Bank N.A. 164
166 BLOM BANK GROUP DIRECTORY
167 BLOM BANK GROUP DIRECTORY DIRECTORY BLOM BANK GROUP
168 BLOM BANK GROUP DIRECTORY BLOM BANK GROUP CHAIRMAN: Dr. Naaman AZHARI LEBANON Headquarters Verdun Rachid Karami St, BLOM BANK bldg P.O. Box: Riad ElSolh, Beirut , Lebanon Phone: (9611) Fax: (9611) Telex: Electronic Telex in London: Answerback BLOM G Reuter: BLOM Swift Code: BLOMLBBX blommail@blom.com.lb Domain: Call Center: (9611) MOHAFAZAT BEIRUT BRANCHES Main Branch Verdun, Rachid Karami St, BLOM BANK bldg Phone: (9611) Fax: (9611) blom.mainbranch@blom.com.lb Senior Manager / Branches: Mr. Walid ARISS Achrafieh Sassine Square Phone: (9611) / Fax: (9611) blom.achrafieh@blom.com.lb Branch Manager: Mr. Ara BOGHOSSIAN Ain ElMreisseh Ibn Sina St Phone: (9611) Fax: (9611) blom.ainmraisseh@blom.com.lb Branch Manager: Mr. Mahmoud MARRACH Bliss Bliss St, opposite Hobeish Police Station Ras Beirut Al Rayess Bldg Phone: (9611) /34/42 Fax: (9611) blom.bliss@blom.com.lb Branch Manager: Mr. Ziad SROUJI Burj Abi Haidar Burj Abi Haidar St, Salam Tower Phone: (9611) /8/ Fax: (9611) blom.bourjabihaidar@blom.com.lb Branch Manager: Mr. Mahmoud BAYDOUN Hamra Abdel Aziz St, Daher bldg Phone: (9611) /1/2/ Fax: (961 1) blom.hamra@blom.com.lb Branch Manager: Mr. Sami FARHAT Hamra Retail Branch Abdel Aziz St, Daher bldg Phone: (9611) /59 /60 Fax: (9611) retail.hamra@blom.com.lb Branch Manager: Mrs. Zeina KHATTAB Istiklal Istiklal St, Karakol ElDruze Area, next to Kettaneh Palace, Salhab bldg Phone: (9611) / Fax: (9611) blom.istiklal@blom.com.lb Branch Manager: Mr. Mouhamad SIDANY Jnah Bir Hassan Area, United Nations St, next to Beirut Hospital, Jaber bldg Phone: (9611) /4/5 Fax: (9611) blom.jnah@blom.com.lb Branch Manager: Mr. Abbas KALOT Maarad Emir Bechir St, Hibat el Maarad bldg Downtown Phone: (9611) /1/2/3/4 Fax: (9611) blom.maarad@blom.com.lb Branch Manager: Mr. Amer KAMAL Mar Elias Corniche El Mazraa opposite Helou s barracks, Zantout bldg Phone: (9611) / Fax: (9611) blom.marelias@blom.com.lb Branch Manager: Mr. Mohamad Abd el wahab Al TABSH Mazraa Corniche El Mazraa, Barbir Square Phone: (9611) /1/ Fax: (9611) blom.mazraa@blom.com.lb Branch Manager: Mr. Mohammad MAWASS Noueiri Al Noueiri Station Hamada bldg Phone: (9611) Fax: (9611) blom.noueiry@blom.com.lb Branch Manager: Mr. Yehia ORFALI Raouché Raouche Blvd Al Rayess & Bou Dagher Bldg Phone: (9611) /4/5/6 Fax: (9611) blom.raouche@blom.com.lb Branch Manager: Mr. Mohamad MARRACHE Rmeil Ashrafieh, Orthodox Hospital St, Medica Center Phone: (9611) Fax: (9611) blom.rmeil@blom.com.lb Branch Manager: Mrs. Salma ACHKOUTY Saifi Al Arz Street Akar bldg Phone: (9611) Fax: (9611) blom.saifi@blom.com.lb Branch Manager: Dr. Ousama CHAHINE Sanayeh Chamber of Commerce & Industry bldg Phone: (9611) / Fax: (9611) blom.sanayeh@blom.com.lb Branch Manager: Mrs. Nahida WEHBE Sodeco Retail Branch Sodeco Square, Damascus Road Phone: (9611) /1 Fax: (9611) retail.sodeco@blom.com.lb Branch Manager: Mrs. Souraya N. Bashouti Tabaris Gebran Tueini Square Sursock Tower Phone: (9611) //3/4 Fax: (9611) blom.tabaris@blom.com.lb Senior Manager/Branches: Ms. Claire ABOU MRAD Tariq AlJedideh Al Malaab Al Baladi Square Salim bldg Phone: (9611) / Fax: (9611) blom.tarikjdideh@blom.com.lb Branch Manager: Mr. Khodr MNEIMNEH Verdun Verdun St, opposite F.S.I. Barracks, Abdo bldg Phone: (9611) / Fax: (9611) blom.verdun@blom.com.lb Branch Manager: Mr. Hani BAWAB Verdun Retail Branch Verdun, Rachid Karami St, BLOM BANK bldg Phone: (9611) /1/2/3 blom.retail@blom.com.lb Branch Manager: Mr. Marwan PHARAON MOHAFAZAT MOUNT LEBANON BRANCHES Ain ElRemaneh Chiyah District, Lamaa St, Next to Kasarjian Barracks Phone: (9611) /1/2/3 Fax: (9611) blom.ainremmaneh@blom.com.lb Branch Manager: Mr. Jhonny SALIBI Aley Al Balakine, Property of Faysal Sultane Wahab Phone: (9615) /13 Fax: (9615) blom.aley@blom.com.lb Branch Manager: Mrs. May Bou Alwan Antelias Next to the Armenian Patriarchate Kheirallah bldg Phone: (9614) Fax: (9614) blom.antelias@blom.com.lb Branch Manager: Mr. Laurent CHIBLI 167
169 BLOM BANK GROUP DIRECTORY Aramoun Choueifat Al Koba, Aramoun Road, Zaynab Center Phone: (9615) /2/3/4 Fax: (9615) Branch Manager: Mrs. Nawal Merhi ABOU DIAB Badaro Badaro Main St Damascus Road intersection Buick Khoury bldg Phone: (9611) /19/20/ Fax: (9611) Branch Manager: Mr. Raoul CHERFAN Burj AlBarajneh Ain El Sekka St Rahal bldg Phone: (9611) /2/3/ /7 Fax: (9611) Branch Manager: Dr. Hassan JABAK Burj Hammoud Harboyan Center Phone: (9611) / / Fax: (9611) Branch Manager: Mr. Jean HOMSI Chiyah Chiyah Blvd, Round About Mar Mekhayel, Orient Center Bldg. Phone: (9611) /3/ Fax: (9611) Senior Manager / Branches: Mr. Abbas TLEISS Choueifat AL Omaraa, Main Road, Al Tiro s Junction Phone: (9615) /6 Fax: (9615) blom.choueifat@blom.com.lb Branch Manager: Mr. Kamal SLIM Dora Bawchrieh, Tripoli Road, Banking Center bldg Phone: (9611) /28/32/37/38/39/41 Fax: (9611) blom.dora@blom.com.lb Senior Manager/ Branches: Mrs. Marlène DOUMIT Elissar Beit El Kiko, Antelias Bickfaya Road Phone: (9614) /2/3/4 Fax: (9614) blom.elissar@blom.com.lb Branch Manager: Mr. Joseph GHOUSOUB Furn el Chebbak Retail Branch Furn el Chebbak, Abraj Center, Main Str., Beirut Phone: (9611) /13 Fax: (9611) retail.furnelchebbak@blom.com.lb Branch Manager: Mrs. Alice AHMARANI Ghobeyri Corniche El Ghobeyri Chiah Blvd Tohme & Jaber & Kalot bldg Phone: (9611) Fax: (9611) blom.ghobeiry@blom.com.lb Branch Manager: Mrs. Magida MIKATI Haret Hreik Al Abiad Area, Sayyed Hadi Nasrallah Highway, Abou Taam & Hoteit bldg Phone: (9611) Fax: (9611) blom.harathreik@blom.com.lb Branch Manager: Mr. Ali CHRIEF Hazmieh Damascus Road, Joseph Chahine Center Phone: (9615) /1/2/3/4 Fax: (9615) blom.hazmieh@blom.com.lb Branch Manager: Mr. Ziad KAREH Jbeil Voie 13 Near Mar Charbel Junction Phone: (9619) /3 /4 Fax: (9619) blom.jbail@blom.com.lb Branch Manager: Mr. Zakhia SARKIS Jounieh Facing Palais de Justice Next to Fouad Chehab Playground Phone: (9619) /12/13/14 Fax: (9619) blom.jounieh@blom.com.lb Branch Manager: Mr. Rachad YAGHI Kaslik Kaslik Main St, Debs Center Phone: (9619) / Fax: (9619) blom.kaslik@blom.com.lb Branch Manager: Mr. Charles AOUDE Mansourieh Mansourieh el Maten, Dar El Ain Plaza New Highway Phone: (9614) /7/8 Fax: (9614) blom.mansourieh@blom.com.lb Branch Manager: Mr. Walid LABBAN Sin ElFil Horsh Tabet, Charles De Gaulle St, Tayar Center Phone: (9611) /1/2 Fax: (9611) blom.sinelfil@blom.com.lb Branch Manager: Mr. Fadi EL MIR Zalka Zalka St, Blom BANK bldg, Interior Road Phone: (9614) /5/6 Fax: (9614) blom.zalka@blom.com.lb Branch Manager: Mrs. Denise JALKH Zouk Mousbeh Zouk Mousbih,Main St, Le Paradis Centre, Jeita s cave junction Phone: (9619) /2/3/4/5 Fax: (9619) blom.zoukmosbeh@blom.com.lb Branch Manager: Mr. Joseph KILADJIAN MOHAFAZAT NORTH LEBANON BRANCHES Tripoli Abi Samra AlDinnawi Square, Khaled Darwiche bldg Phone: (9616) /6/7/8/9 Fax: (9616) blom.abisamra@blom.com.lb Branch Manager: Mr. Abdel Rahman HOMSI Tripoli Azmi Azmi St, Fattal bldg Phone: (9616) /1/2 Fax: (9616) blom.azmi@blom.com.lb Branch Manager: Mr. Edmond HAMATI Tripoli Al Tell Abdel Hamid Karameh Square, Ghandour bldg Phone: (9616) / Fax: (9616) blom.tell@blom.com.lb Branch Manager: Mr. China ASSI Tripoli Zahrieh Al Tall St, Alam AL Din & Bissar bldg Phone: (9616) / Fax: (9616) blom.zahrieh@blom.com.lb Branch Manager: Mr. Fouad El HAJJ MOHAFAZAT BEKAA BRANCHES Chtaura Main St, Najim El Din bldg Phone: (9618) / Fax: (9618) blom.chtaura@blom.com.lb Branch Manager: Mr. Elie FREIJI 168
170 BLOM BANK GROUP DIRECTORY Zahleh Manara Center, Fakhoury & Kfoury bldg Phone: (9618) /1/2/3/ Fax: (9618) Branch Manager: Mr. Marwan EL SHAKRA MOHAFAZAT NABATIYEH BRANCH Nabatiyeh Nabatieh That, Hassan Kamel Al Sabbah St, Office 2000 bldg Phone: (9617) /5/6 Fax: (9617) Branch Manager: Mr. Hany HAMOUD MOHAFAZAT SOUTH LEBANON BRANCHES Saida Riad Solh St, Al Zaatari & Fakhoury & Bizri bldg Phone: (9617) Fax: (9617) Branch Manager: Mr. Moufid NAJJAR Tyr Main St, Chehade bldg Phone: (9617) Fax: (9617) Branch Manager: Mrs. Mayssa RAHAL STAND BY BRANCH MANAGERS* Mr. Ziad CHANOUHA Mr. Wassim FAHS Ms. Nelly HARFOUCHE Mr. Antoine MATAR Mr. Ahmad Jamal SINNO Mr. Ahmad Koussai SINNO Mr. Adel THAMINE * by alphabetical order BRANCHES UNDER ESTABLISHMENT Abbasya Tyr Dekwaneh Hadath Mina El Hosn branch Beirut Sin el Fil Retail Branch BLOM BANK BRANCHES ABROAD & REPRESENTATIVE OFFICE CYPRUS Victory House 205Z Archbishop Makarios Ave 3030 Limassol P.O.Box: 53243, 3301 Limassol, Cyprus Phone: (35725) /4/5 Fax: (37525) Swift Code: BLOM CY 21 blom@blom.com.cy Branch Manager: Mr. Ziad EL MURR SYRIA Damascus Free Zone, AlBaramkeh Phone: (96311) /1 Fax: (96311) blomdam@scsnet.org Branch Manager: Mr. Joseph HAYEK ABU DHABI U.A.E. Representative Office Al Bateen Towers Tower C 6 Suite C 9079th floor Al Bateen Bainuna Street Abu Dhabi U.A.E. P.O. Box: Al Bateen Abu Dhabi U.A.E. Phone: Fax: blombank@blombankad.ae Mr. Ramzi AKKARI Chief Representative JORDAN Headquarters Jordan Amman AlCharif Abdel Hamid Sharaf St P.O. Box Shmeisani,Amman Phone: (9626) Fax: (9626) Reuter: BLMJ Swift Code: BLOMJOaAM blommail@blom.com.jo Domain: Regional Management Jordan Dr. Adnan AL AARAJ General Manager Jordan Mr. Adnan SALLAKH Consultant for General Management in Lebanon Heads of Departments and Units Jordan Dr. Mohamed AMRO Treasury and Investment Mr. Mohanad BALBISSI (AL) Financial Control Mr. Yaccoub ALEM (EL) Credit Mr. Moder KHOURDY (AL) Client Relationship Mr. Ihab KHALIL Sales & Retail Marketing Ms. Nahla ALLOUSH IT Operations Mr. Mohamed ALLAN Central Operations Mr. Said OBEIDALLAH Internal Audit Mr. Nabil OBALI Risk Management Mr. Maan ZOABI Compliance Mr. Hani DIRANI Legal and Collection Ms. Mona KHOUZAI Personnel BRANCHES IN JORDAN Shmeisani Amman AlCharif Abdel Hamid Sharaf St P.O. Box Shmeisani Amman Phone: (9626) Fax: (9626) shmeisani@blom.com.jo Branch Manager: : Mr. Abdeljawad Al Owaisi Sweifieh Branch Abed Al Rahim Al Hajj Mohammad St P.O. Box Amman Phone: (9626) Fax: (9626) sweifieh@blom.com.jo Branch Manager: Baker Haddadin Mecca Street Tlaa El Aali Makka Str. P.O.Box 1191, Amman, Jordan Phone: (9626) /1/2/3/4/5 Fax: (9626) mecca@blom.com.jo Branch Manager: Mohannad Younes Wihdat Al Amir Hassan St, Oum Heiran Amman Change to P.O. Box Amman Phone: (9626) Fax: (9626) wihdat@blom.com.jo Branch Manager: Mr. Mahmoud Sadaka Jubeiha Mefleh Allozi st.,amman P.O Box 2435 Amman Phone: (9626) Fax: (9626) Branch Manager: Mr. Omar Abu Assaf Irbid AlQubba CircleIrbid P.O Box 4345 Irbid Phone: (9622) Fax: (9622) Irbid@blom.com.jo Branch Manager: Mr. Ahmad DABAAN Branch Under Establishment in Jordan Aakaba 169
171 BLOM BANK GROUP DIRECTORY AFFILIATED BANKS & INSURANCE COMPANIES FRANCE Headquarters 3840 avenue des ChampsElysées Paris France Phone: (331) Fax: (331) Telex : F BANOPAR Reuter : BANO Swift : BLOM FRPP E.mail : blomfrance@blomfrance.fr Website : Board of Directors Mr. Samer AZHARI Chairman & General Manager Dr. Naaman AZHARI Honorary President and Permanent Representative of BLOM BANK S.A.L Directors HE Sheikh Ghassan Ibrahim SHAKER (Grand officier de la légion d Honneur) Mr. Christian DE LONGEVIALLE Mr. JeanPaul DESSERTINE Mr. Marwan JAROUDI General Management Mr. Michel ADWAN Deputy General Manager Mr. Gilbert MOINE Senior Manager Mr. Iskandar ARAMAN Manager Head Office Mr. Amr TURK Senior Manager London Mr. Bassem ARISS Regional Manager UAE Mr. JeanPierre BAAKLINI General Manager Romania BLOM BANK FRANCE BRANCHES ABROAD UNITED ARAB EMIRATES Dubai Deira, Al Maktoum St Sheikh Ahmad Ben Rached al Maktoum bldg P.O. Box 4370 Dubai United Arab Emirates Phone: (9714) General (9714) Forex Fax: (9714) Telex : BANO EM General BANO FX EM Forex Swift : BLOM AE AD E.mail : info@blombank.ae Branch Manager: Mr. Samir Hobeika Sharjah Khaled Lagoon, Corniche al Buhairah Sheikh Nasser Bin Hamad al Thani bldg P.O. Box 5803 Sharjah United Arab Emirates Phone: (9716) Fax: (9716) Telex : BANO EM E.mail : info@blombank.ae Branch Manager : Mr. Mokhtar KASSEM UNITED KINGDOM London Brompton Road London SW3 1LZ England Phone: (4420) Fax: (4420) Swift : BLOM GB 2L E.mail : blom@blombanklondon.co.uk Senior Manager : Mr. Amr TURK ROMANIA Headquarters Bucharest 66 Unirii Boulevard, Bloc K3, Sector 3, Bucharest P.O. BOX 1850 Bucharest Phone: (004) 021/ Fax: (004) 021/ Swift : BLOM RO BU office@blombank.ro General Management Mr. Jean Pierre BAAKLINI General Manager Mrs. Veronika PETERESCU Deputy General Manager Branches Head Office Bucharest 66 Unirii Boulevard, Bloc K3, Sector 3, Bucharest P.O. BOX 1850 Bucharest Phone: (004) 021/ Fax: (004) 021/ Swift : BLOM RO BU unirii@blombank.ro Branch Manager: Mrs. Florentina DELLA Victoria (Bucharest) 72 Buzesti St., Bucharest Phone: (004) 021/ Fax: (004) 021/ victoria@blombank.ro Branch Manager: Mr. Marius VOICULET Bucharest Hotel 4 Prel. George Enescu St., Bucharest Hotel P.O. Box 1850 Phone: (004) 021/ Fax: (004) 021/ hotel@blombank.ro Branch Manager: Mrs. Monica FILIP Constanta 25 Bis Mamaia Boulevard, Constanta P.O. Box 289 Phone: (004) 0241/ Fax: (004) 0241/ constanta@blombank.ro Branch Manager: Mr. Mihai BUTCARU Brasov 23 Mihail Kogalniceanu St., Bloc C7, Brasov Phone: (004) 0268/ Fax: (004) 0268/ brasov@blombank.ro Branch Manager: Mr. Hosny HESHAM Cluj 11 T. Cipariu St., Cluj Phone: (004) 0364/ Fax: (004) 0264/ cluj@blombank.ro Regional Manager: Mr. Mircea CHIOREAN General Management 1, Rue de la Rôtisserie, Geneva, Switzerland P.O. Box: 3040 CH 1211 Geneva 3 Switzerland Phone: (4122) (General) Fax: (4122) SWIFT: BLOMCHGG dir.administr@blombank.ch Website: Board of Directors Dr. Naaman AZHARI Honorary Chairman of the Board Mr. Saad AZHARI Chairman Mr. André CATTIN Vice Chairman Directors Dr. Warner FREY ME. Peter De La GANDARA Mr. Ahmad G. SHAKER Management Committee Mr. Antoine MAZLOUM General Manager Mr. Thierry OTT Manager Mrs. Eléonore DAESCHER Deputy Manager Mr. Salim DIAB Deputy Manager General Management Verdun, Rachid Karami St BLOM BANK bldg P.O. Box: , Riad El Solh, Beirut Lebanon Phone: (9611) Fax: (9611) blominvest@blominvestbank.com Website: Board of Directors Mr. Saad AZHARI Chairman & General Manager Directors Messrs. BLOM BANK SAL Mr. Joseph KHARRAT Mr. Samer AZHARI Mr. Marwan JAROUDI Mr. Habib RAHAL General Management Dr. Fadi OSSEIRAN General Manager Senior Managers* Mr. Elie CHALHOUB Administration Mr. Michel CHIKHANI Asset Management & Structured Products Mr. Georges TABET Private Banking & Wealth Management Managers* Mr. Walid KADRI Organization & Business Development Mr. Marwan MIKHAEL Economic Research Mr. Nicolas PHOTIADES Investment Banking & Corporate Finance Mr. Ramzi TOHME Operations 170 * by alphabetical order
172 BLOM BANK GROUP DIRECTORY Headquarters Damascus Al Harika Bab Barid Lawyers Syndicate Building P.O. Box: 3103 Damascus Syria Phone: (96311) Fax: (96311) Swift: BSOMSYDA Board of Directors Dr. Rateb AL SHALLAH Chairman Mr. Amr AZHARI Vice Chairman Mr. Georges SAYEGH General Manager Directors Dr. Ihsan BAALBAKI Mr. Ibrahim SHEIKH DIB Mr. Mohamed Ramzi CHABANI Mr. Mehran KHWANDA Mr. Habib BETINJANEH Mr. Samer AZHARI Mr. Saad AZHARI Managers Central Departments Mr. Bashir YAKZAN Credit Mr. Georges HADDAD Internal Audit Mr. Samir ASMAR Administration Ms. Inaya SOUBRA International Ms. Rima JAWAD ZEIN Human Resources Mr. Mohamad Yehia KHALED Retail Banking Mr. Salem MAHMOUD InformationTechnology Mr. Michel MANNEH Operations Mr. Shady DIAR BAKERLY Accounting Branches DAMASCUS Harika Damascus Al Harika, Bab Barid Lawyers Syndicate Building P.O. Box: 3103 Damascus Syria Phone: (96311) Fax: (96311) Mobile: (963) Branch Manager: Mr. Samir BASSOUS Damascus (Al Nejmeh Square) Damascus Nejmeh Square Facing Dar As Salam School P.O. Box: 3103 Damascus Syria Phone: (96311) Fax: (96311) Branch Manager: Mr. Fadi ISTWANI Al Kassaa Damascus, Kassaa Brj Al Russ,Facing National Park P.O. Box: 3103 Damascus Syria Phone: (96311) Fax: (96311) Branch Manager: Mr. Omar HAMMOUD MEZZEH Damascus, next to Al Razi Hospital P.O. Box: 3103 Damascus Syria Phone: (96311) Fax: (96311) Branch Manager: Mr. Tarek CHEHAB ALEPPO Al Azizieh Aleppo Aleppo Azizia, Saad el Dine Al Jabiri St P.O. Box: 9966 Aleppo Syria Phone: (96321) Fax: (96321) Branch Manager: Mr. Eddy BECHARA Al Madina Aleppo Sabeh Bahrat St P.O. Box: 9966 Aleppo Syria Phone: (96321) 9961 Fax: (96321) Branch Manager: Mr. Amro KAYAL LATTAKIA Lattakia Lattakia Al Kamilia, 8th March St P.O. Box: 371 Lattakia, Syria Phone: (96341) /9 Fax: (96341) Branch Manager: Mr. Bassem MERHEJ HAMA Hama Hama Kouwatly St P.O. Box: 820 Hama,Syria Phone: (96333) Fax: (963 33) bsohama@bso.com.sy Branch Manager: Mr. Hussein OBEID HOMS Homs Homs, City Center Bldg. P.O. Box: 1377 Homs, Syria Phone: (96331) Fax: (96331) bsohoms@bso.com.sy Branch Manager: Mrs. Anna DIBE TARTOUS Tartous Tartous Al Sawra St P.O. Box: 824 Tartous Syria Phone: (96343) Fax: (96343) bsotartous@bso.com.sy Branch Manager: Mr. Chamel MAKARI SWEIDA Sweida, Tishreen Str. P.O. Box: 74 SWEIDAA Syria Phone: (963 16) 9960 Fax: (96316) bsosweidaa@bso.com.sy Assistant Branch Manager: Mr. Abdullah N. KAMALEDDINE DARAA Daraa Al Mahata, Al Kouwatli Str. P.O.Box: 555 Daraa Syria Phone: (96315) 9960 Fax: (96315) bsodaraa@bso.co.sy Branch Manager: Mr. Anwar EL HARESS BRANCHES UNDER ESTABLISHMENT Kfarsousa Damascus Al Midan Damascus Al Mazraa Damascus Al Mantaka el horra Damascus Al Mouhafaza Aleppo Al Sheikh Najjar Aleppo Al Souleimaniya Aleppo Aadra Headquarters 54 Lebanon St. Mohandessen Tel: (202) Fax: (202) P.O Box : 144 Al Mohandessen Swift: MRBAEGCXXX Website: Board of Directors Mr. Saad AZHARI :Chairman Mr. Alaa El Din Ahmad SAMAHA: Managing Director & Chief Executive Officer Directors Mr. Elias ARACTINGI Dr. Fadi OSSEIRAN Mr. Shaker ABDULLAH Mr. Samir KASSIS Mr. Hani DANA Chairman Advisor & Senior Credit Officer Assistant Managing Directors Mrs. Maya EL KADY Retail Mr. Talal IBRAHIM Total Quality Management Mr. Tarek METWALLY Institutional 171
173 BLOM BANK GROUP DIRECTORY 172 Group Heads Mr. Belal FAROUK Compliance Mr. Talaat ABD EL AAL Al OUMDA Human Resources Mr. Mohamed RASHWAN Internal Audit Mr. Maher ANWAR Legal Affairs Mr. Abdel Aziz ALY General Administration Mr. Khaled ABDEL HAMID Branches Regional Manager Mr. Hazem EL GOHARY Information Technology Mr. Gamal DIAA Medium Size Finance Mr. Ayman EL SHALKANI Retail Sales Manager Mr. Khaled YOUSSRY Financial Institution Mr. Yehia RASHED Risk Management Mr. Imad EL JUNDY Central Operation Mr. Mohamed EL BENDARY Financial Control BRANCHES in Egypt Mohandessen 54 Lebanon St. Mohandessen Tel: (202) Fax: (202) Branch Manager: Mr. Ahmed SABRY Shoubra 232 Shoubra St. EL Khalafawy Tel: (202) Fax: (202) Branch Manager: Mr. Sherif TAHER Mohie Eldin Aboul Ezz 64 Mohie Eldin Aboul Ezz St. Dokki Tel: (202) Fax: (202) Branch Manager: Mrs. Wafaa EZZAT Cairo 15 Abu El Feda St. Zamalik Cairo Tel: (202) Fax: (202) Branch Manager: Mr. Sherif SEIF EL NASR New Cairo 101 City Commercial Center El Tagamoa El Khames New Cairo Tel: (202) Fax: (202) Branch Deputy Manager: Mr. Hazem El Khabeery Oroba 1 Cleopatra St. El Orouba Heliopolis Cairo Tel: (202) Fax: (202) mohamed.hussein@blombankegypt.com Branch Manager: Mr. Mohamed HUSSEIN Khalifa El Maamoun 20 Al Khalifa El Maamoun St. Manshiet El Bakry Tel: (202) Fax: (202) heba.saad@blombankegypt.com Branch Manager: Mrs. Heba SAAD Ismalia 15 Street 144 Teraat Al Ismalia in front of el Rai Bridge Tel: (2064) Fax: (2064) ahmed.abdelaal@blombankegypt.com Branch Manager: Mr. Ahmed ABD EL AAL Heliopolis 31 El Hegaz St. Heliopolis Tel: (202) Fax: (202) mohammed.abdelrahman@blombankegypt.co m Branch Manager: Mr. Mohammed ABD EL RAHMAN Maadi 4 Street 269 from Nasr St. New Maadi Cairo Tel: (202) Fax: (202) Branch Manager: Mr. Moawad AHMED New Maadi 17/5 El Laselky Nasr St. New Maadi Tel: (202) Fax: (202) hanem.fahmy@blombankegypt.com Branch Manager: Mrs. Hanem FAHMY Nasr city El Akkad Mall El Nasr Road Nasr City Tel: (202) Fax: (202) Hossam.abueelsowood@blombankegypt.com Branch Manager: Mr. Hossam ABU EL SOWOOD Opera 4, 4a, 6 Abdel Haak El Sonbaty Opera Square Tel: (202) Fax: (202) ali.khafagy@blombankegypt.com Branch Manager: Mr. Ali Ezzat KHAFAGY 6 th October Central Axis El Madiena Commercial Center Area No.4 1st District 6th October city Tel: (202) Fax: (202) mamdouh.zayed@blombankegypt.com Branch Manager: Mr. Mamdouh ZAYED Abbasia 109 Abbasia St. Tel: (202) Fax: (202) hesham.fouad@blombankegypt.com Branch Manager: Mr. Hesham FOUAD Al Hurghada 7 El Mena St. Saqala Square Hurghada Tel: (2065) Fax: (2065) hussain.elswaify@blombankegypt.com Branch Manager: Mr. Hussein EL SWAIFY Al Mansoura 35 Saad Zaghloul St. Touril Mansoura Tel: (2050) Fax: (2050) mohammed.daader@blombankegypt.com Branch Manager: Mr. Mohammed DAADAR ALEXANDRIA Stadium 1 Soliman Yousri St. ( Loumomba ) Alexandria Tel: (203) Fax: (203) ayman.talaat@blombankegypt.com Branch Manager: Mr. Ayman TALAAT El Shatby 17 Port Said St. El Shatby Alexandria Tel: (203) (10 Lines ) Fax: (203) ashraf.tahio@blombankegypt.com Branch Manager: Mr. Ashraf TAHIO Sporting 273 El Horria Road Sporting Alexandria Tel: (203) Fax: (203) magda.fayed@blombankegypt.com Branch Manager: Mrs. Magda FAYED Montaza 414 Gamal Abd El Naser El Mandara Alexandria Tel: (203) Fax: (203) ibrahim.abaza@blombankegypt.com Branch Manager: Mr. Ibrahim ABAZA Sharm El Sheikh Naama Bay El Amir Abdouallah St. Murray Mall Sharm El Sheik Tel: (2069) Fax: (2069) alaa.metwally@blombankegypt.com Branch Manager: Alaa METWALLY Branches Under Establishment El Mansheya ( opening soon ) 6A Ahmed Orabi Square in front of unknown solider Manshia square Tel: Fax: mohamed.refaat@blombankegypt.com Branch Manager: Mr. Mohamed Refaat Dokki 64 Mohy El Din Abu El Ezz street
174 BLOM BANK GROUP DIRECTORY Headquarters 8 Geziat el Arab st. Mohandeseen Tel: (202 ) Fax: (202) agemei@blomsecurities.com Board of Directors Mr. Alaa El Deen SAMAHA Chairman Mr. Ahmed GEMEI Deputy Chairman & Managing Director Directors Mr. Belal Farouk TAWFEK Mr. Tarek Ibrahim METWALY Mrs. Maya Tawfek AL KADY Mr. Khaled MOHAMED Mr. Mohamed EL BANDARY General Management Mr. Ahmed GEMEI Deputy Chairman & Managing Director Mr. Tawhed ZAHER Chief Operating Manager Mr. Mahmoud EL GAMMAL Compliance Officer Mr. Ahmed A. RAHMAN Financial Control Mr. Emam WAKED Head of Institutional Desk Headquarters Abdel Aziz St, Daher bldg Beirut, Lebanon Phone: (9611) /1/2/3 Fax: (9611) info@blomdevelopmentbank.com Board of Directors Mr. Saad AZHARI: Chairman & General Manager Directors Mr. Nicolas SAADE Dr. Fadi OSSEIRAN General Management General Manager Mr. Mouataz NATAFGI Managers Mr. Tarek HOUSSAMI Main Branch Manager & Head of Retail Department Mr. Mustapha SIBAI Financial Control & Investment * Headquarters: Doha * Under Establishment Headquarters Verdun Rachid Karami St, BLOM BANK bldg, Arope Plaza P.O. Box: Beirut Lebanon Phone: (9611) Fax: (9611) Call Center: (9611) (01) or ( 03) arope@arope.com Domain: Board of Directors Mr. Habib RAHAL Chairman & General Manager Mr. Fateh BEKDACHE Vice Chairman & General Manager Directors Mr. Samer AZHARI SCOR SE (Represented by Mr. Patrick LOISY) Mr. Serge OSOUF Mr. Marwan JAROUDI Mr. Rami HOURIE Mr. Victor PEIGNET General Management Mr. Fateh BEKDACHE General Manager Ms. Faten DOUGLAS Assistant General Manager BRANCHES Aley Al Balakine Phone: (961 5) Fax: (961 5) Aramoun Choueifat Al Koba, Aramoun Road Phone: (961 5) / 2/ 3 Fax: (961 5) Bur Al Barajneh Ain El Sekka Road Phone / Fax: (961 1) Dora Main Road Cebaco Center Phone / Fax: (9611) * Tyr Main Road Phone: (961 7) Fax: (961 7) Zahlé Zahlé Entrance Manarah Center Phone / Fax: (9618) Headquarters Damascus Al Rawda, Zuhair Ben Abi Salma st. Malki Bldg N18 P.O. Box: Phone: (96311) 9279 Fax: (96311) info@aropesyria.com Board of Directors Mr. Amr AZHARI Chairman Mr. Fateh BECKDACHE Vice Chairman Directors Mr. Samer AZHARI Mr. Habib BATENJANI Mr. Ibrahim EL SHEIKH DIB Mr. Marwan JAROUDI Mr. Hassan BAALBAKI General Management Miss Faten DOUGLAS General Manager BRANCHES Aleppo Aleppo Azizieh Majed Al Deen Al Jabri Street Tel: (96321) 9279 Fax: (96321) P. O. Box: 1293 Homs City center Building Tel: (96331) 9279 Lattakia Al Kamilia 8 March Street Tel: (96341) Fax: (96341) Board of Directors Mr. Abdallah Abd Al Latif Ahmad AL FAWZAN Chairman Mr. Mohamed Abd El Aziz Ibrahim AL AKIL Member Mr. Wali Abd El Aziz Saleh AL SAGHIR Member Mr. Saad Naaman AZHARI Member Mr. Fahim Mohamed MOADAD Member Dr. Fadi Toufic OSSEIRAN Member Mr. Marwan Mohamed Toufic AL JAROUDI Member Headquarters: Riyad * Under Establishment Jbeil Voie 13, near Saint Charbel Junction, Phone / Fax: (961 9) Saida Riad Solh Street Fakhoury bldg Phone / Fax: (9617) Tripoli Zehrieh Al Tall Street Byssar bldg Phone / Fax: (9616) Hama Al Ashek Building Al Amin Street Tel: (96333) 9279 Al Kamshli Tel: (96352) Fax: (96352) Dair Al Zoor Tel : (96351)

175
176
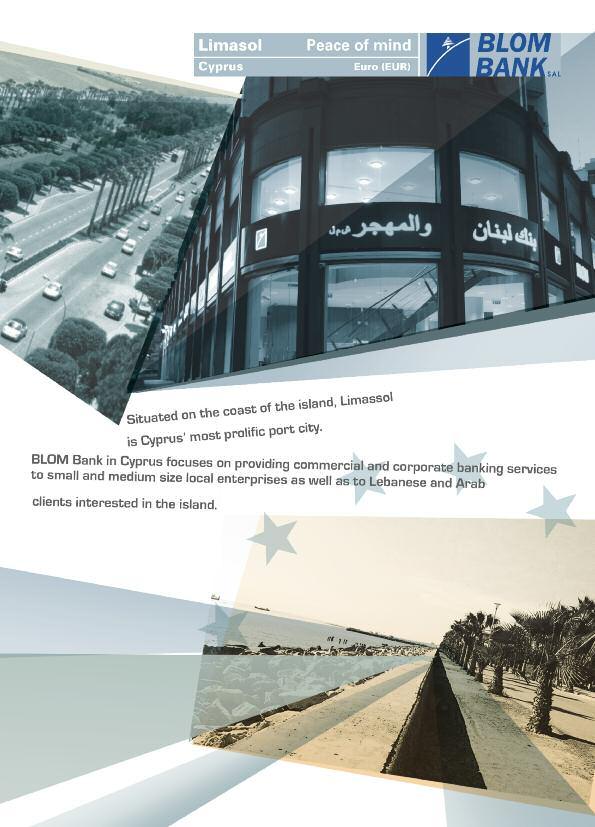
177
BLOM LEBANON INSIDE#1 (C) 9/12/07 9:40 AM Page 1 ANNUAL REPORT 06
 9/12/07 9:40 AM Page 1 ANNUAL REPORT 06") BLOM LEBANON INSIDE#1 (C) 9/12/07 9:40 AM Page 1 > ANNUAL REPORT 06 BLOM LEBANON INSIDE#1 (C) 9/12/07 9:40 AM Page 2 INTRODUCTION > The BLOM BANK Beirut Marathon has, over the past few years, quickly become
BLOM LEBANON INSIDE#1 (C) 9/12/07 9:40 AM Page 1 > ANNUAL REPORT 06 BLOM LEBANON INSIDE#1 (C) 9/12/07 9:40 AM Page 2 INTRODUCTION > The BLOM BANK Beirut Marathon has, over the past few years, quickly become
 Dr. Naaman AZHARI - Chairman of BLOM BANK Group Mr. Saad AZHARI - Chairman and General Manager of BLOM BANK s.a.l. Table of Content Chairman s letter Customers deposits evolution Evolution of main indicators
ANNUAL REPORT 09
 ANNUAL REPORT 09 Introduction A lot can be achieved in a year. At BLOM BANK, we know this more than anyone. Constantly developing and maintaining the highest levels of customer satisfaction has earned
Investor Presentation QIII 2018
 Investor Presentation QIII 2018 1. Introduction 2. Financial Overview 3. Business Overview 4. BLOM s Shares 5. Appendix BLOM Bank at a glance QIII 2018 Overview of BLOM Bank BLOM Bank Shareholders BLOM
Investor Presentation
 Investor Presentation 2018 1. Introduction 2. Financial Overview 3. Business Overview 4. BLOM s Shares 5. Appendix BLOM Bank at a glance 2018 Overview of BLOM Bank BLOM Bank Shareholders BLOM is the most
Management Discussion & Analysis Chairman s Letter 06. Consolidated Financial Statements. Key Figures 08. Organizational Chart 11
 33 46 47 49 52 58 58 66 67 73 75 81 84 87 Chairman s Letter 06 Key Figures 08 Organizational Chart 11 Group Chart 12 Corporate Governance 16 Code of Corporate Governance BLOM BANK S.A.L. Major Common Shareholders
Management Discussion & Analysis Consolidated Financial Statements. Chairman s Letter. Key Figures. Organizational Chart.
 ANNUAL REPORT 2012 ANNUAL REPORT 2012 06 Chairman s Letter 68 Consolidated Financial Statements 08 11 12 Key Figures Organizational Chart Group Chart 70 70 71 72 Consolidated Financial Statements Auditors
Investor Presentation QI 2017
 Investor Presentation QI 2017 1. Overview 2. Financial Information 3. Business Information 4. Share Information Overview QI 2017 Major Highlights Consistent Annual Income Growth ($M) One of the oldest
Chairman s Letter 06. Key Figures 08. Organizational Chart 11. Management Discussion & Analysis Consolidated Financial Statements
 33 40 41 42 45 51 51 58 59 65 67 74 77 81 Chairman s Letter 06 Key Figures 08 Organizational Chart 11 Group Chart 12 Corporate Governance 16 Code of Corporate Governance BLOM BANK S.A.L. Major Common Shareholders
Investor Presentation QI 2016
 Investor Presentation QI 2016 1. Overview 2. Financial Information 3. Business Information 4. Share Information Overview QI 2016 Major Highlights Consistent Annual Income Growth ($M) One of the oldest
LEBANON WEEKLY REPORT
 ECONOMY Beirut recorded the 3 rd lowest occupancy rate among Arab markets. The average room rate in Beirut hotels was USD 169 in 2013, down from USD 201 in 2012. OCCUPANCY RATE AT BEIRUT HOTELS REACHES
Beirut, October 30, 2018
 Bank Audi Consolidated Activity Highlights as at End-September 2018 Sustained profits growth with strengthening balance sheet in an adverse environment Beirut, October 30, 2018 Sustained profits growth
LEBANON BANKING SECTOR REPORT
 SECTOR REPORT A LUCRATIVE YEAR FOR LEBANESE BANKS THAT STRENGTHENED THEIR ACTIVITY FUNDAMENTALS AND RISK METRICS TABLE OF CONTENTS Executive Summary 1 Consolidated Activity Growth 2 Liquidity & Sovereign
Regionalization of the Lebanese Banking Industry in the Arab World
 Regionalization of the Lebanese Banking Industry in the Arab World Mr. Saad Azhari Chairman and General Manager,BLOM Bank Lebanese Banking Day in London November 10 th,2010 Peace of Mind Agenda Table of
BLOM Bank QI Results Conference Call Transcript 24 May, 2017 Beirut time 15:00
 BLOM Bank QI Results Conference Call Transcript 24 May, 2017 Beirut time 15:00 Anas Aboul-Hosn: Good afternoon, everyone, and thank you for joining us today. This is Anas Aboul-Hosn from Arqaam Capital.
LEBANON WEEKLY REPORT
 Lebanon s major entrepreneurship weakness is in product innovation, being the ability to provide unique products or services. The country s greatest strength in entrepreneurship is found in its perception
Total Assets. Bank's Financial Analysis
 Bank's Financial Analysis Political crises in Lebanon and the Arab region during the last years had largely affected all financial and economic indicators. Therefore, the bank works on maintaining the
Lebanon Weekly Report
 ECONOMY World Bank forecasts Lebanon real GDP growth at 2% in 2015 and 2.5% in 2016 The World Bank said that Lebanon s economic activity continues to tick along at a modest pace despite the political dysfunctionality.
Press Release. Bank Audi Consolidated Activity Highlights as at End-March Beirut, April 27, 2017
 Press Release Bank Audi Consolidated Activity Highlights as at End-March 2017 Beirut, April 27, 2017 US$ 43.9 billion of assets US$ 36.0 billion of customers deposits US$ 17.0 billion of loans to customers
The LEBANON WEEKLY MONITOR
 CONTACTS The LEBANON WEEKLY MONITOR Treasury & Capital Markets Bechara Serhal (961-1) 977421 bechara.serhal@bankaudi.com.lb Nadine Akkawi (961-1) 977401 nadine.akkawi@bankaudi.com.lb Private Banking Toufic
LEBANON WEEKLY REPORT
 Beirut recorded the 2 nd lowest occupancy rate among Arab markets. The average room rate in Beirut hotels dropped to USD 167 in January 2014, compared to USD 173 in January 2013. Occupancy rate at Beirut
IN THIS ISSUE ECONOMY
 IN THIS ISSUE ECONOMY Coincident Indicator Improves by 5.8% Y-O-Y in October 2013 Fiscal Deficit Widened by 32% to USD 3,519 Million in the First Ten Months of 2013 Trade Deficit Goes up on a Yearly Basis
The Economic Letter September 2018
 ASSOCIATION OF BANKS IN LEBANON Research & Statistics Department The Economic Letter September 2018 Summary: In the first three quarters of 2018, most real sector indicators retreated in relation to the
The Economic Letter March 2018
 ASSOCIATION OF BANKS IN LEBANON Research & Statistics Department The Economic Letter March 2018 Summary: In the first quarter 2018, most real sector indicators retreated with regard to the corresponding
THE LEBANESE ECONOMY IN 2016 BYBLOS BANK ECONOMIC RESEARCH AND ANALYSIS DEPARTMENT
 THE LEBANESE ECONOMY IN 2016 BYBLOS BANK ECONOMIC RESEARCH AND ANALYSIS DEPARTMENT ECONOMIC ACTIVITY Economic activity in Lebanon remained below potential in 2016, in line with the previous five years.
The Economic Letter December 2010
 ASSOCIATION OF BANKS IN LEBANON Research & Statistics Department The Economic Letter December 2010 Summary: Despite the deceleration in the activities of a number of economic sectors in the fourth quarter,
Audi Private Bank sal
 Audi Private Bank sal CONTENTS 01 BOARD OF DIRECTORS AND MANAGEMENT 06 02 CHAIRMAN S LETTER 07 03 STATEMENT OF FINANCIAL POSITION 08 04 OFF-BALANCE SHEET 10 05 INCOME STATEMENT 11 06 FINANCIAL HIGHLIGHTS
Total Assets 1,588,345 1,462,416 1,363,214 1,459,619 1,419,288
 C- Bank's Financial Analysis Political crises in Lebanon and the Arab region during the last years had largely affected all financial and economic indicators. Accordingly, the bank works on maintaining
LEBANON BANKING SECTOR REPORT
 SECTOR REPORT TABLE OF CONTENTS Executive Summary 1 Consolidated Activity Growth 2 Liquidity & Sovereign Exposure 3 Lending Quality & Provisioning 6 Capital Adequacy & Solvency 8 Profitability & Efficiency
The Economic Letter December 2016
 ASSOCIATION OF BANKS IN LEBANON Research & Statistics Department The Economic Letter December 2016 Summary: In 2016, real sector indicators were mixed and their varied performance pointed to another year
Unaudited Consolidated Financial Results March 31, 2018:
 Unaudited Consolidated Financial Results March 31, 2018: BLOM BANK S.A.L. publishes its Unaudited Consolidated Financial Results for the period ended March 31, 2018. Report can be accessed by using the
4 th Quarter of Head of Research: Nadim Kabbara, CFA
 4 th Quarter of 2014 Contacts Head of Research: Nadim Kabbara, CFA n.kabbara@ffaprivatebank.com +961 1 985195 Analyst: Rima Gedeon r.gedeon@ffaprivatebank.com +961 1 985195 Sales and Trading, FFA Private
Abu Dhabi Islamic Bank posts an increase of 2.3% in Group Net Profit to AED million for the second quarter of 2012
 MANAGEMENT DISCUSSION & ANALYSIS FOR THE QUARTER ENDING 30 JUNE 2012 Abu Dhabi Islamic Bank posts an increase of 2.3% in Group Net Profit to AED 322.6 million for the second quarter of 2012 Group Financial
Abu Dhabi Islamic Bank net profit for 2012 increases 4.0% to AED billion after provisions of AED 802 million
 MANAGEMENT DISCUSSION & ANALYSIS FOR THE YEAR ENDING 31 DECEMBER 2012 Abu Dhabi Islamic Bank net profit for 2012 increases 4.0% to AED 1.201 billion after provisions of AED 802 million Total assets at
LEBANON WEEKLY REPORT
 Total imports decreased by a yearly 5% to reach USD 8,713 million in the first five months of 2014, while total exports dropped by 30% to reach USD 1,387 million. Imports from China accounted for the largest
 Unaudited Financial Results March 31, 2018: Byblos Bank SAL publishes its Consolidated Unaudited Financial Results for the period ended March 31, 2018. Report can be accessed by using the following URL:
Dubai Islamic Bank Group announces Quarter 1, 2016 Financial Results
 Press Release: Dubai Islamic Bank Group announces Quarter 1, 2016 Financial Results Q1 2016 net profit up by 18 per cent to over AED 1 billion Dubai, April 27, 2016 Dubai Islamic Bank (DFM: DIB), the first
The Economic Letter November 2018
 ASSOCIATION OF BANKS IN LEBANON Research & Statistics Department The Summary: In November 2018, the majority of real sector indicators regressed in relation to the previous month. Imports and exports of
The Economic Letter January 2018
 ASSOCIATION OF BANKS IN LEBANON Research & Statistics Department The Economic Letter January 2018 Summary: In the first month of 2018, most real sector indicators retreated in relation to the preceding
The Economic Letter July 2018
 ASSOCIATION OF BANKS IN LEBANON Research & Statistics Department The Economic Letter July 2018 Summary: In July 2018, real sector indicators progressed in relation to the preceding month. Both imports
Audi Private Bank sal
 Audi Private Bank sal CONTENTS 01 BOARD OF DIRECTORS AND MANAGEMENT 06 02 CHAIRMAN S LETTER 07 03 STATEMENT OF FINANCIAL POSITION 08 04 OFF-BALANCE SHEET 10 05 INCOME STATEMENT 11 06 FINANCIAL HIGHLIGHTS
Obstacles Encountered by an Emerging Economy in Implementing Basel II : The Lebanese Experience
 W.B./I.M.F/Fed. Seminar for Senior Bank Supervisors from Emerging Economies October 16 27, 2006 Obstacles Encountered by an Emerging Economy in Implementing Basel II : The Lebanese Experience Dr Amine
BLOM Bank QI 2018 Earnings Conference Call Hosted by Exotix. 22 May 2018
 BLOM Bank QI 2018 Earnings Conference Call Hosted by Exotix 22 May 2018 Hello and welcome to BLOM Bank Q1 2018 results conference call. My name is Amelia and I'll be your coordinator for today's conference.
The Economic Letter May 2018
 ASSOCIATION OF BANKS IN LEBANON Research & Statistics Department The Economic Letter May 2018 Summary: In May 2018, real sector indicators were mixed with reference to the preceding month. Imports of goods
The Lebanese insurance Sector
 BLOMINVEST BANK Top Premium Growth in 2011 March 24, 2012 Contact Information Research Department research@blominvestbank.com Head of Research: Marwan Mikhael marwan.mikhael@blominvestbank.com Source:
Emirates NBD Announces First Quarter 2018 Results
 For immediate release Emirates NBD Announces First Quarter 2018 Results Net profit up 27% y-o-y and 10% q-o-q to AED 2.4 billion Dubai, 18 April 2018 Emirates NBD (DFM: EmiratesNBD), a leading bank in
The Commercial Bank (P.S.Q.C.) Announces. Net profit of QAR Million for the Full Year Ended 31 December 2016
 Announces. Net profit of QAR Million for the Full Year Ended 31 December 2016") The Commercial Bank (P.S.Q.C.) Announces Net profit of QAR 501.4 Million for the Full Year Ended 31 December 2016 21 Feb 2017, Doha, Qatar: The Commercial Bank (P.S.Q.C.) ( the Bank ), its subsidiaries
The Commercial Bank (P.S.Q.C.) Announces Net profit of QAR 501.4 Million for the Full Year Ended 31 December 2016 21 Feb 2017, Doha, Qatar: The Commercial Bank (P.S.Q.C.) ( the Bank ), its subsidiaries
Lebanon Weekly Report
 Lebanon ranks 98 th most prosperous country in the world The Legatum Prosperity Index defines prosperity as a combination of wealth and wellbeing, benchmarking 142 countries in eight categories. In the
ASSOCIATION OF BANKS IN LEBANON. 5- Balance of Trade in Goods = (4) - (3) (16,738) (1,591) (1,224) n.a.
 - (3) (16,738) (1,591) (1,224) n.a.") Key Indicators ASSOCIATION OF BANKS IN LEBANON Issue: October / November 08 LBP= Lebanese Pound; USD= US Dollar; FC= Foreign Currency; ( ) indicates a negative number; CD= Certificate of Deposit; BDL=
Key Indicators ASSOCIATION OF BANKS IN LEBANON Issue: October / November 08 LBP= Lebanese Pound; USD= US Dollar; FC= Foreign Currency; ( ) indicates a negative number; CD= Certificate of Deposit; BDL=
QNB Investor Relations Presentation June 2011
 QNB Investor Relations Presentation June 211 Forward Looking Statement This presentation and subsequent discussion may contain certain forward-looking statements with respect to the financial condition,
Abu Dhabi Islamic Bank net profit for 2013 increases 20.7% to AED billion
 MANAGEMENT DISCUSSION & ANALYSIS FOR THE YEAR ENDING 31 DECEMBER Abu Dhabi Islamic Bank net profit for increases 20.7% to AED 1.450 billion Total assets increased 19.8% to AED 103.2 billion Group Financial
Arab Bank Group. Investor Relations Presentation June 30, 2016
 Arab Bank Group Investor Relations Presentation June 30, 2016 1 General Information Financial Data & KPIs Q2 2016 Key Performance Extracts Credit Rating Table of Contents Stock Information Corporate Governance
Bank Audi. A Leading Regional 1 Banking Group. Consolidated Activity Highlights as at End-December 2014
 A Leading Regional 1 Banking Group US$ 42 billion in total assets as at 31/12/2014 Of which 47% from entities outside Lebanon and 33% in investment grade countries Consolidated Activity Highlights as at
ABU DHABI COMMERCIAL BANK PJSC REPORTS FIRST QUARTER 2018 NET PROFIT OF AED BILLION, AN INCREASE OF 13% QUARTER ON QUARTER, AND 9% YEAR ON YEAR
 Abu Dhabi Commercial Bank Sheikh Zayed Bin Sultan Street P. O. Box: 939, Abu Dhabi http://www.adcb.com ABU DHABI COMMERCIAL BANK PJSC REPORTS FIRST QUARTER 2018 NET PROFIT OF AED 1.207 BILLION, AN INCREASE
Lebanomics 1st. Mfcbopo t Ebticpbse pg!fdpopnjd Joejdbupst. Quarter of 2011
 Lebanomics 1st Quarter of 2011 Mfcbopo t Ebticpbse pg!fdpopnjd Joejdbupst Contacts Head of Research: Nadim Kabbara, CFA n.kabbara@ffaprivatebank.com +961 1 985195 Sales and Trading, FFA Private Bank (Beirut)
The LEBANON WEEKLY MONITOR
 CONTACTS Treasury & Capital Markets Micky Chebli (961-1) 977419 micky.chebli@banqueaudi.com Nadine Akkawi (961-1) 977401 nadine.akkawi@banqueaudi.com Bechara Serhal (961-1) 977421 bechara.serhal@banqueaudi.com
ASSOCIATION OF BANKS IN LEBANON. 5- Balance of Trade in Goods = (4) - (3) (16,738) (1,401) (2,100) (1,591)
 - (3) (16,738) (1,401) (2,100) (1,591)") Key Indicators ASSOCIATION OF BANKS IN LEBANON Issue: August / September 08 LBP= Lebanese Pound; USD= US Dollar; FC= Foreign Currency; ( ) indicates a negative number; CD= Certificate of Deposit; BDL=
Key Indicators ASSOCIATION OF BANKS IN LEBANON Issue: August / September 08 LBP= Lebanese Pound; USD= US Dollar; FC= Foreign Currency; ( ) indicates a negative number; CD= Certificate of Deposit; BDL=
A N N U A L R E P O R T
 ANNUAL REPORT 2013 ANNUAL REPORT 2013 BOARD OF DIRECTORS AND MANAGEMENT CHAIRMAN S LETTER Board of Directors Mr. Fady G. AMATOURY Chairman Mr. Toufic R. AOUAD Dr. Khalil M. BITAR Chair Mrs. Wafaa S. DAOUK
ASSOCIATION OF BANKS IN LEBANON. 5- Balance of Trade in Goods = (4) - (3) (16,738) (2,100) (1,591) n.a.
 - (3) (16,738) (2,100) (1,591) n.a.") Key Indicators ASSOCIATION OF BANKS IN LEBANON Issue: August / September 08 LBP= Lebanese Pound; USD= US Dollar; FC= Foreign Currency; ( ) indicates a negative number; CD= Certificate of Deposit; BDL=
Key Indicators ASSOCIATION OF BANKS IN LEBANON Issue: August / September 08 LBP= Lebanese Pound; USD= US Dollar; FC= Foreign Currency; ( ) indicates a negative number; CD= Certificate of Deposit; BDL=
July 31, 2015 ECONOMY. Lebanon ranks 19 th worldwide and 2 nd in the Arab world in gold holdings
 ECONOMY Lebanon ranks 19 th worldwide and 2 nd in the Arab world in gold holdings Lebanon s gold reserves reached 287 tons, accounting for 21% of the country s total foreign reserves. The July 2015 edition
2nd Quarter of Head of Research: Nadim Kabbara, CFA
 2nd Quarter of 2012 Contacts Head of Research: Nadim Kabbara, CFA n.kabbara@ffaprivatebank.com +961 1 985195 Analyst: Laura El Makary l.elmakary@ffaprivatebank.com +961 1 985195 Sales and Trading, FFA
Investor Presentation JUNE 2014
 Investor Presentation JUNE 2014 Contents I. UNB Introduction 1 II. UAE Banking Industry 3 III. UNB Business Overview 5 IV. UNB Strategy 10 V. Risk Management 11 VI. Financial Highlights and Performance
BLOMINVEST BANK S.A.L.
 BLOMINVEST BANK S.A.L. Economic Research Department The Lebanon Brief can be accessed via Internet at the following web address: http://www.blom.com.lb EQUITY MARKET Financial Markets Stock Market 25/1/02
Economic Update 4 July 2017
 Economic Update July 17 Macroeconomic outlook UAE: Growth set to moderate slightly in 17 amid crude oil cuts > Dana Al-Fakir Economist +9 9 373, danafakir@nbk.com > Nemr Kanafani Senior Economist +9 9
FGB reports net profit of AED 2.87 Billion in the first half of 2015, up by 7%
 Press Release FGB reports net profit of AED 2.87 Billion in the first half of 2015, up by 7% FGB achieved a H1 2015 Group Net Profit of AED 2.87 Billion, up 7% from H1 2014. Second quarter net profit up
Dubai Islamic Bank 1st Quarter 2017 Net Profit reaches AED Billion
 Press Release: Dubai Islamic Bank 1st Quarter 2017 Net Profit reaches AED 1.042 Billion Net profit up by 4% compared to same period in 2016 Financing assets up by 6% to AED 121.4 billion Deposits up by
2014 Fiscal Balance: Short-Term Improvement
 BLOMINVEST BANK In June 2014, oil prices were slashed from a high of $112 to a low of $58 in December 2014. This bearish trend meant different things to the fiscal balances of oil importing countries and
ASSOCIATION OF BANKS IN LEBANON. Indicators of Economic Activity (million USD unless otherwise mentioned)
") Key Indicators ASSOCIATION OF BANKS IN LEBANON Issue: December 2016 / January 2017 LBP= Lebanese Pound; USD= US Dollar; FC= Foreign Currency; ( ) indicates a negative number; CD= Certificate of Deposit;
Key Indicators ASSOCIATION OF BANKS IN LEBANON Issue: December 2016 / January 2017 LBP= Lebanese Pound; USD= US Dollar; FC= Foreign Currency; ( ) indicates a negative number; CD= Certificate of Deposit;
ABU DHABI COMMERCIAL BANK PJSC REPORTS FIRST HALF 2017 NET PROFIT OF AED BILLION, SECOND QUARTER 2017 NET PROFIT OF AED 1.
 Abu Dhabi Commercial Bank Sheikh Zayed Street P. O. Box: 939, Abu Dhabi http://www.adcb.com Press Release: Immediate Release ABU DHABI COMMERCIAL BANK PJSC REPORTS FIRST HALF 2017 NET PROFIT OF AED 2.114
Dubai Islamic Bank Group 1 st Half 2016 Financial Results H net profit up by 11% to over AED 2 billion
 Press Release: Dubai Islamic Bank Group 1 st Half 2016 Financial Results H1 2016 net profit up by 11% to over AED 2 billion Dubai, July 27, 2016 Dubai Islamic Bank (DFM: DIB), the first Islamic bank in
Lebanon s Economic Outlook and the Mixed Bag of International Estimates
 BLOMINVEST BANK Evolution of Lebanon s Real GDP Growth Rates (In)% May 02, 2015 Contact Information Research Analyst: Mirna Chami mirna.chami@blominvestbank.com Head of Research: Marwan Mikhael marwan.mikhael@blominvestbank.com
ASSOCIATION OF BANKS IN LEBANON Sep-2017 Oct-2017 Nov Building permits (000 m 2 ) 12, ,
 12, ,") Key Indicators ASSOCIATION OF BANKS IN LEBANON Issue: November / December 07 LBP= Lebanese Pound; USD= US Dollar; FC= Foreign Currency; ( ) indicates a negative number; CD= Certificate of Deposit; BDL=
Key Indicators ASSOCIATION OF BANKS IN LEBANON Issue: November / December 07 LBP= Lebanese Pound; USD= US Dollar; FC= Foreign Currency; ( ) indicates a negative number; CD= Certificate of Deposit; BDL=
ASSOCIATION OF BANKS IN LEBANON. Indicators of Economic Activity (million USD unless otherwise mentioned)
") Key Indicators ASSOCIATION OF BANKS IN LEBANON Issue: September / October 07 LBP= Lebanese Pound; USD= US Dollar; FC= Foreign Currency; ( ) indicates a negative number; CD= Certificate of Deposit; BDL=
Key Indicators ASSOCIATION OF BANKS IN LEBANON Issue: September / October 07 LBP= Lebanese Pound; USD= US Dollar; FC= Foreign Currency; ( ) indicates a negative number; CD= Certificate of Deposit; BDL=
IMPACT OF FINANCIAL REFORMS: EXPERIENCES IN THE EURO- MEDITERRANEAN AREA. MOHAMAD JABRI Executive Director Training and Development Department
 IMPACT OF FINANCIAL REFORMS: EXPERIENCES IN THE EURO- MEDITERRANEAN AREA MOHAMAD JABRI Executive Director Training and Development Department OUTLINE A. Economic cooperation between Lebanon and the EU
ABU DHABI COMMERCIAL BANK PJSC REPORTS NINE MONTH 2017 NET PROFIT OF AED BILLION, UP 2% YEAR ON YEAR
 Abu Dhabi Commercial Bank Sheikh Zayed Street P. O. Box: 939, Abu Dhabi http://www.adcb.com ABU DHABI COMMERCIAL BANK PJSC REPORTS NINE MONTH 2017 NET PROFIT OF AED 3.206 BILLION, UP 2% YEAR ON YEAR THIRD
Dubai Islamic Bank Group 1 st half 2015 Financial Results H net profit up by 35% to AED 1,801 million
 Press Release: Dubai Islamic Bank Group 1 st half Financial Results H1 net profit up by 35% to AED 1,801 million Dubai, July 29, Dubai Islamic Bank (DFM: DIB), the first Islamic bank in the world and the
ABU DHABI COMMERCIAL BANK PJSC REPORTS FIRST QUARTER 2017 NET PROFIT OF AED BILLION, AN INCREASE OF 10% QUARTER ON QUARTER, AND 8% YEAR ON YEAR
 Abu Dhabi Commercial Bank Sheikh Zayed Street P. O. Box: 939, Abu Dhabi http://www.adcb.com Press Release: Immediate Release ABU DHABI COMMERCIAL BANK PJSC REPORTS FIRST QUARTER 2017 NET PROFIT OF AED
ABU DHABI COMMERCIAL BANK PJSC REPORTS FIRST HALF 2018 NET PROFIT OF AED BILLION, SECOND QUARTER 2018 NET PROFIT OF AED 1.
 Abu Dhabi Commercial Bank Sheikh Zayed Bin Sultan Street P. O. Box: 939, Abu Dhabi http://www.adcb.com ABU DHABI COMMERCIAL BANK PJSC REPORTS FIRST HALF 2018 NET PROFIT OF AED 2.332 BILLION, SECOND QUARTER
Sep 18, 2015 ECONOMY. IIF revises Lebanon s GDP growth rate down to 1.1% in 2015
 ECONOMY IIF revises Lebanon s GDP growth rate down to 1.1% in 2015 IIF states that economic activity remains weak, reflecting policy inaction amid a protracted political crisis and rising regional insecurity.
The LEBANON WEEKLY MONITOR
 CONTACTS The LEBANON WEEKLY MONITOR Treasury & Capital Markets Bechara Serhal (961-1) 977421 bechara.serhal@bankaudi.com.lb Nadine Akkawi (961-1) 977401 nadine.akkawi@bankaudi.com.lb Private Banking Toufic
ABL Quarterly Newsletter Issue n 5 April 2015 ABL s Economic Letter free registration is available here:
 Introducing the new Sanctions & embargoes Program to banks On Thursday the 29 th of January 2015, the AML Committee of the Association of Banks ( ABL ) held a meeting at the ABL s premises in Beirut, to
Lebanon s Monetary Overview 2017
 BLOMINVEST BANK February 23 rd, 2018 Contact Information Research Analyst: Riwa Daou Head of Research: Marwan Mikhael Confidence: the underlying driver behind every market s boom or bust. Currencies are
FIRST GULF BANK Q3/9M 13 EARNINGS PRESENTATION
 FIRST GULF BANK Q3/9M 13 EARNINGS PRESENTATION DISCLAIMER This presentation provides information in summary form only and is not intended to be complete. It is not intended to be relied upon as advice
GROSS PROFIT NET PROFIT
 RAYA CONTACT CENTER REPORTS FY2017 RESULTS STELLAR FINANCIAL & OPERATIONAL PERFORMANCE, DIVIDEND PAYOUT OF EGP0.62 / SHARE REVENUES EGP 760.6 MN 44.0% y-o-y GROSS PROFIT EGP 323.8 MN 31.5% y-o-y EBITDA
Head Office. Branch. Sin El Fil - Mkalles Round About - Sar Bldg. Tel: (00961) / 2 / /1 Fax: (00961)
 / 2 / /1 Fax: (00961)") Head Office List of banks: 62 Beirut, Justinian st., Aresco Center P.O.Box: 119575, Beirut, Lebanon C.R.30199BEIRUT Cable: LITUBAN Swift: NACBLBBE Tel: (00961)1759000 Fax: (00961)1759099 346322 Email:
Head Office List of banks: 62 Beirut, Justinian st., Aresco Center P.O.Box: 119575, Beirut, Lebanon C.R.30199BEIRUT Cable: LITUBAN Swift: NACBLBBE Tel: (00961)1759000 Fax: (00961)1759099 346322 Email:
Equity Research - Lebanese Banks - Q3/15 Preview
 EQUITY RESEARCH LEBANESE BANKS - October Q3/15 PREVIEW 13, 2015 1 Equity Research - Lebanese Banks - Q3/15 Preview Domestic banking sector deposits grew +5% YoY in July 2015 supported by non-residents
ADIB 2017 Net Profit rises 17.7% to AED 2.3 billion
 MANAGEMENT DISCUSSION & ANALYSIS FOR THE YEAR ENDED 31 DECEMBER 2017 ADIB 2017 Net Profit rises 17.7% to AED 2.3 billion Group Financial Highlights Income Statement: FYR 2017 vs. FYR Group net revenues
Investor Presentation MARCH 2014
 Investor Presentation MARCH 2014 Contents I. UNB Introduction 1 II. UAE Banking Industry 3 III. UNB Business Overview 5 IV. UNB Strategy 10 V. Risk Management 11 VI. Financial Highlights and Performance
Abu Dhabi Commercial Bank PJSC ( ADCB or the Bank ) today reported its financial results for the year ended 31 December 2017.
 today reported its financial results for the year ended 31 December 2017.") Abu Dhabi Commercial Bank Sheikh Zayed Bin Sultan Street P. O. Box: 939, Abu Dhabi http://www.adcb.com ABU DHABI COMMERCIAL BANK PJSC REPORTS FULL YEAR NET PROFIT OF 4.278 BILLION, UP 3% YEAR ON YEAR FOURTH
Abu Dhabi Commercial Bank Sheikh Zayed Bin Sultan Street P. O. Box: 939, Abu Dhabi http://www.adcb.com ABU DHABI COMMERCIAL BANK PJSC REPORTS FULL YEAR NET PROFIT OF 4.278 BILLION, UP 3% YEAR ON YEAR FOURTH
BLOM Bank 2017 Earnings Conference Call Hosted by Exotix. 21 February 2018
 BLOM Bank 2017 Earnings Conference Call Hosted by Exotix 21 February 2018 Hello, ladies and gentlemen, and welcome to the BLOM Bank 2017 Results Conference Call. My name is Operator, and I ll be your coordinator
CLSA Investors Forum September Mrs Margaret Leung Vice-Chairman and Chief Executive Hang Seng Bank
 CLSA Investors Forum 2011 21 September 2011 Mrs Margaret Leung Vice-Chairman and Chief Executive Hang Seng Bank Good afternoon, ladies and gentlemen. I am delighted to have the opportunity to speak with
Arab Bank Group INVESTOR RELATIONS PRESENTATION. December 31, 2016
 Arab Bank Group INVESTOR RELATIONS PRESENTATION December 31, 2016 1 TABLE OF CONTENTS General Information Financial Data & KPIs Credit Rating Stock Information Corporate Governance Disclaimer Appendix
The Commercial Bank (P.S.Q.C.) Announces. Net Profit of QAR 604 Million for the Full Year Ended 31 December 2017
 Announces. Net Profit of QAR 604 Million for the Full Year Ended 31 December 2017") The Commercial Bank (P.S.Q.C.) Announces Net Profit of QAR 604 Million for the Full Year Ended 31 December 2017 29 January 2018, Doha, Qatar: The Commercial Bank (P.S.Q.C.) ( the Bank ), its subsidiaries
The Commercial Bank (P.S.Q.C.) Announces Net Profit of QAR 604 Million for the Full Year Ended 31 December 2017 29 January 2018, Doha, Qatar: The Commercial Bank (P.S.Q.C.) ( the Bank ), its subsidiaries
BANK OF SYRIA AND OVERSEAS S.A. FINANCIAL STATEMENTS AND AUDITOR S REPORT YEAR ENDED DECEMBER 31, 2007
 BANK OF SYRIA AND OVERSEAS S.A. FINANCIAL STATEMENTS AND AUDITOR S REPORT YEAR ENDED DECEMBER 31, 2007 BANK OF SYRIA AND OVERSEAS S.A. FINANCIAL STATEMENTS AND AUDITOR S REPORT YEAR ENDED DECEMBER 31,
The LEBANON WEEKLY MONITOR
 CONTACTS The LEBANON WEEKLY MONITOR Treasury & Capital Markets Bechara Serhal (961-1) 977421 bechara.serhal@bankaudi.com.lb Nadine Akkawi (961-1) 977401 nadine.akkawi@bankaudi.com.lb Private Banking Toufic
Disclosure Prudential Disclosure Report. 12/31/2017 Derayah Financial
 Derayah - Pillar III Disclosure -2017 Prudential Disclosure Report 12/31/2017 Derayah Financial Table of Contents 1. OVERVIEW... 2 2. CAPITAL STRUCTURE... 2 2.1. Disclosure on Capital Base... 3 3. CAPITAL
Nominal GDP and Real GDP Growth
 BLOMINVEST BANK December 14, 2018 Contact Information Junior Analyst: Dina Antonios dina.antonios@blominvestbank.com Head of Research: Marwan Mikhael marwan.mikhael@blominvestbank.com Nominal GDP and Real
2016: Deterioration of Lebanon s Fiscal Performance
 BLOMINVEST BANK June 17, 2017 Contact Information Jr. Analyst: Rouba Chbeir rouba.chbeir@blominvestbank.com Head of Research: Marwan Mikhael marwan.mikhael@blominvestbank.com Research Department Tel: +961
BANKMED S.A.L. (FORMERLY BANQUE DE LA MEDITERRANEE S.A.L.) AND SUBSIDIARIES
 AND SUBSIDIARIES") BANKMED S.A.L. (FORMERLY BANQUE DE LA MEDITERRANEE S.A.L.) AND SUBSIDIARIES CONSOLIDATED FINANCIAL STATEMENTS AND AUDITOR S REPORT YEAR ENDED DECEMBER 31, 2005 BANKMED S.A.L. (FORMERLY BANQUE DE LA MEDITERRANEE
BANKMED S.A.L. (FORMERLY BANQUE DE LA MEDITERRANEE S.A.L.) AND SUBSIDIARIES CONSOLIDATED FINANCIAL STATEMENTS AND AUDITOR S REPORT YEAR ENDED DECEMBER 31, 2005 BANKMED S.A.L. (FORMERLY BANQUE DE LA MEDITERRANEE
ARAB BANK BLOMINVEST BANK S.A.L.
 BLOMINVEST BANK S.A.L. Update for Q3 2014 Share Price (JOD): 7.15 Sector: Banking Target Price (JOD): 7.72 Country: Jordan Upside: 8.0% Date: November 10, 2014 Recommendation: HOLD Risk: Medium Issuing