Annual Presentation 2017
|
|
|
- Ezra Parsons
- 5 years ago
- Views:
Transcription
1 Annual Presentation 1
2 Disclosure In this strategic presentation, the terms "Atari and/or the "Company" mean Atari. The term "Group" means the group of companies belonging to the parent Company and all companies within its consolidation s scope. This strategic presentation contains statements relating to ongoing or future projects, future financial and operating results and other statements about Atari s managements future expectations, beliefs, goals, plans or prospects that are based on current expectations, estimates, forecasts and projections about Atari, as well as company s future performance and the industries in which Atari operate will operate, in addition to managements assumptions. Words such as expects, anticipates, targets, goals, projects, intends, plans, believes, seeks, estimates, variations of such words and similar expressions are intended to identify such forward-looking statements which are not statements of historical facts. These forward-looking statements are not guarantees of future performance and involve certain risks, uncertainties and assumptions that are difficult to assess. Therefore, actual outcomes and results may differ materially from what is expressed or forecasted in such forward-looking statements. These risks and uncertainties are based upon a number of important factors including, among others: political and economic risks of our respective global operations; changes to existing regulations or technical standards; existing and future litigation; difficulties and costs in protecting intellectual property rights and exposure to infringement claims by others summarized in chapter 8 of the company s annual report registered to the AMF under the number D on 3,. For a more complete list and description of such risks and uncertainties, refer to Chapter 8 in Atari s annual report. Except as required by the rules and regulations of the AMF, Atari disclaims any intention or obligation to update any forward-looking statements after the distribution of this document, whether as a result of new information, future events, developments, changes in assumptions or otherwise. Any investment in Atari shares, which have a highly volatile stock price, represents a significant risk. 2


3 ATARI Management Frederic Chesnais C.E.O. Largest shareholder of the Atari Group Deputy CEO and Financial Chief Financial Officer of Atari Group from 2001 to 2004, CEO of Atari Interactive until 2007 Came back early 2013 Huge experience in Executive production Todd Shallbetter C.O.O. Strong knowledge of Atari s historical and future businesses Game production background in digital and physical products Leads Business Development efforts Philippe Mularski C.F.O. Chartered Accountant and Auditor Joined the Group in
4 Table of Contents 1 ATARI At a Glance : Turnaround 3 Summary Financials March 4 Strategy & Outlook 5 Questions Answers 4
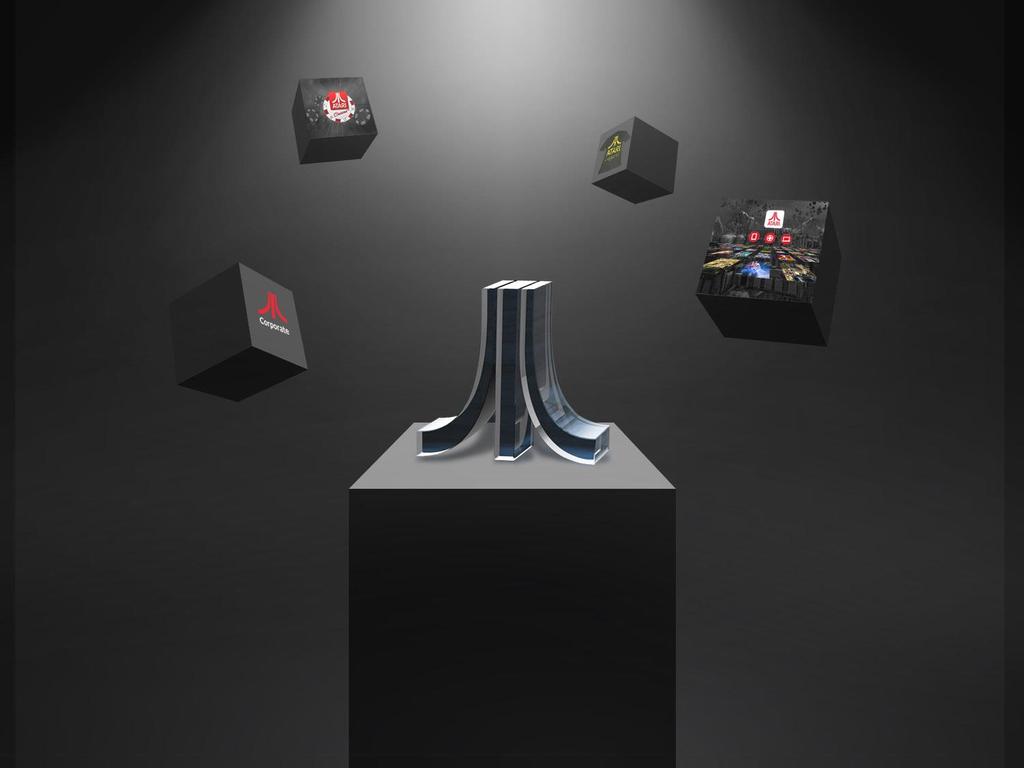
5 1 ATARI at a glance Much More Than Video Games 5


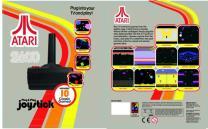
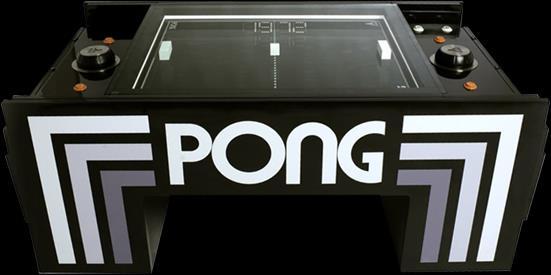
6 Brand Power is Intact (Released in ) (Released in 1982) 6

7 Much More Than Video Games Pong! Atari celebrates its 40 years of Gaming Time Magazine s, 50 Best Websites

8 Much More Than Video Games 8

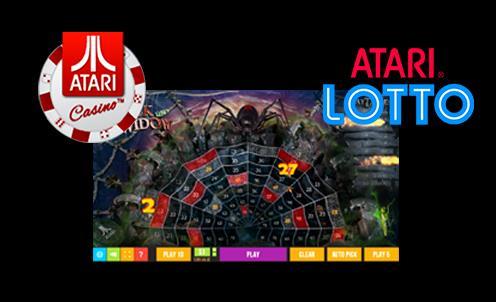
9 Strategic Priorities 5 business lines that combine direct exploitation and partnerships Video games Online casino gaming Multimedia production (TV) Connected devices Licensing Professional expertise Audience overlap Marketing synergies Atari Group capitalizes on the awareness of the Atari brand to promote Atari Ventures, by taking stakes in high-growth start-ups in exchange for an Atari brand license and limited cash investments. 9

10 2 ATARI : Turnaround 10
11 : Turnaround 2013 January US subsidiaries filed for bankruptcy protection (Chapter 11), February Frédéric Chesnais and Alden Capital fund took over, December Exit of the US subsidiaries from the Chapter 11 process Re-launch of game production, Implementation of a robust turnaround strategy, New partnerships. 2015/2016 Launch of new games, Development of licensing activities, Optimization of financial structure. Opportunities outside of the video game industry Cap table and organization simplified Turnaround, improved financial structure Atari is Back to Profitability 11
12 A Simple and Very Efficient Structure Atari SA French listed entity on Euronext Paris 100%-owned subsidiaries Atari Europe Atari US The CEO is the largest shareholder An executive production team based in New York with 3rd-party development studios in the US and in Europe. Products are primarily sold digitally worldwide. Third parties are used to manufacture and distribute physical boxed product. A streamlined and flexible corporate structure built with on a set of key partners 12
13 Old Value Chain Rights Prod / Dev Publishing Integration of key functions, Limited use of third-party studios; Great dependence on physical distribution; Limited level of ancillary revenue (digital, licences, merchandising and others). Distribution Atari no longer operating like this 13
14 Current Business Model The New Atari External studios Team IPs Diversification of the distribution channel Executive Production External Studios Digital distribution Multimedia Digital Licensing Box distribution 14
15 Current Business Model Atari is a content production company aimed at maximizing the value of its brands and IP portfolio in the interactive entertainment industry. STRONG ASSETS A huge IP portfolio Efficient production and operations Effective digital marketing management An experienced Management Team TO MAXIMIZE PROFITS Fixed costs are at the lowest levels and the production management is externalized Co-investments are favored with studios or third parties Global digital distribution is fully implemented and deployed 15


16 Broad, Diversified Platforms ATARI : Strong set of partners enables worldwide operations with a small team. PC Download Digital Console Streaming Mobile Partnership/Online Casino Advertising 16

17 3 ATARI Summary Financials as at March 31, 17
18 Key Events of the Fiscal Year Resolution of the litigation with Alden. Complete reimbursement of the Alden debt: as part of financing the repurchase of the Alden debt, the Group proceeded with two capital increases during the second half of 2016 for a total amount, including share premium, of 8.1 million, of which 2.0 million subscribed by Ker Ventures, 2.0 million by Financière Arbevel and 0.5 million by Alex Zyngier. Continuation of partnerships in the casino business : Pariplay and Kizzang. Launch of new games : particularly RollerCoaster Tycoon Touch Mobile. Sale of the Test Drive Unlimited franchise to Bigben Interactive. Extension of the Roller Coaster Tycoon licence until Announcement of a new hardware product. 18
19 Key Figures Significant growth In turnover Improvement of Positive consolidated shareholders' equity profitability Significant reduction of the net debt 19
20 2013- : Turnaround Achieved ( In million) Revenue 1,2 3,3 7,6 11,9 15,4 Current operating income 0,6 0,9 0,2 1,4 1,9 Operating income (2,0) 1,3 1,5 0,0 8,9 Net income (loss) (35,8) (2,5) 1,2 (0,1) 8,0 Shareholders' equity (34,9) (31,3) (13,1) (10,6) 7,7 Net financial debt (31,4) (24,8) (11,0) (13,3) (0,9) (Years ending as at March 31) March 2013 to March : Revenue: From 1,2 M to 15,4 M Net Income: From a net loss of 35,8 M To a net profit of 7,7 M Equity: From (34,9) M To + 7,4 M Net Debt: From (31,4) M To (0,9) M 20
21 Debt Repayment of July 2016 Alden loan of Euro 12.6 million re-purchased for Euro 5.3 million in July Sources of funds (Euro 5.3) : Euro 2.0 million in new shares issued to Financière Arbevel Euro 0.8 million in new shares issued to Alden Euro 2.5 million through a bridge loan with warrants purchased by Ker ventures (holding of Fred Chesnais) and Alex Zyngier Atari has fully repaid the bridge loan in November
22 Consolidated Statements as at March 31, (M ) (1) Revenue 15,4 11,9 Cost of goods sold (3,9) (1,8) GROSS MARGIN 11,5 10,1 in % of Revenue 83,7% 83,8% CURRENT OPERATING INCOME (LOSS) 1,9 1,4 in % of Revenue 14,1% 2,3% OPERATING INCOME (LOSS) 8,5 0,0 in % of Revenue 3,5% 20,2% NET INCOME (LOSS) FOR THE YEAR 7,7 (0,1) (1) Restated under IAS 8 Net revenue: 15,4 M An increase in turnover of 29%. Current operating income: + 1,9 M An increase of more than 36% Operating Income: + 8,5 M Other operating income: +6,6 M including +7,1 M related to the gain of the redemption of the Alden loan. Net consolidated income: + 7,7 M Cost of debt: - 0,8 M (in annual trend: 0,1 M ) Other financial income: + 0,0 M 22
23 Consolidated Statements as at March 31, (M ) (1) 0 Revenue 15,4 11,9 Cost of goods sold (3,9) (1,8) GROSS MARGIN 11,5 10,1 Research and development expenses (3,8) (3,3) Marketing and selling expenses (2,0) (1,3) General and administrative expenses (4,1) (4,0) Other operating income (expense) 0,3 (0,2) CURRENT OPERATING INCOME (LOSS) 1,9 1,4 (1) Restated under IAS 8 Current operating income: + 1,9 M, an increase of more than 36% R&D expenses: - 3,8 M Marketing costs: - 2,0 M Overhead costs: - 4,1 M Other operating income: +0,3 M 23
24 Consolidated Statements as at March 31, ASSETS (M ) (1) 0 Intangible assets 6,9 5,0 Property, plant and equipment 0,0 0,0 Non-current financial assets 3,0 0,2 Deferred tax assets 0,5 0,5 Non-current assets 10,5 5,7 Inventories - - Trade receivables 7,3 6,0 Current tax assets - - Other current assets 0,7 0,7 Cash and cash equivalents 1,1 1,2 Assets held for sale 0,4 - Current assets 9,6 7,9 Total assets 20,0 13,6 (1) Restated under IAS 8 Development costs capitalized for 6,8 M including: RollerCoaster Tycoon World & Touch for 5,8 M Trade receivables 7,3 M : Invoicing from February - March RCTW, RCTT and Atari Vault Trade receivables licensing casino 2,0 M (see other current liabilities) 24
25 Consolidated Statements as at March 31, EQUITY & LIABILITIES (M ) (1) Capital stock 2,3 1,8 Share premium 7,5 407,5 Consolidated reserves (10,1) (419,8) Net income (loss) Group share 7,7 (0,1) Shareholders' equity 7,4 (10,6) Minority interests 0,0 0,0 Total equity 7,4 (10,6) Provisions for non-current contingencies and losses 0,3 0,1 Non-current financial liabilities 2,0 14,4 Deferred tax liabilities - - Other non-current liabilities 0,0 0,1 Non-current liabilities 2,3 14,5 Provisions for current contingencies and losses 0,4 1,2 Current financial liabilities - 0,2 Trade payables 6,3 4,8 Current tax liabilities 0,0 - Other current liabilities 3,6 3,6 Current liabilities 10,3 9,7 Total equity and liabilities 20,0 13,6 (1) Restated under IAS 8 Positive Shareholders equity: 7,4 M Net cash position: - 0,9 M Against -13,3 M as at March 31, 2016 Other current liabilities: 10,3 M including 6,3 M of trade payables and 1,8 M of deferred revenue of casino license fees. 25
26 A Very Significant Reduction of the Net Debt ( million) March 31, 2013 March 31, 2014 March 31, 2015 March 31, 2016 March 31, OCEANEs 2019 (18,4) ORANES (1,7) OCEANEs (0,6) (0,6) (0,6) (0,6) (0,6) OCEANEs (1,2) (1,3) (1,4) Alden loan (22,7) (11,5) (12,1) (12,5) - Others (8,4) (0,7) (0,2) - Gross Financial Debt (33,4) (30,5) (14,6) (14,5) (2,0) Cash and cash equivalents 2,0 5,8 3,7 1,2 1,1 Net Financial Debt (31,4) (24,8) (11,0) (13,3) (0,9) Net debt significantly reduced Net financial debt decreased from -31,4 M in March 2013 to - 0,9 M. Debt-free save for a small 2020 convertible bond. 26
27 Deferred Tax Assets In France, tax loss carry-forwards come to 735 million euros. Potential tax savings: circa 245 million euros, subject to usual applicable tax limitations. Potential tax savings per share: circa 1,08 (calculated on the basis of shares outstanding as at March 31, less treasury shares). In the United States, the US tax authorities confirmed at the beginning of the year the tax-loss carry-forwards of nearly 600 million US dollars. Potential tax savings: circa 200 million US dollars, subject to normal and applicable tax limitations. Potential tax savings per share: circa 0,88 $ (calculated on the basis of shares outstanding as at March 31, less treasury shares). 27

28 4 ATARI Strategy and Outlook 28


29 A Profitable Growth Strategy Efficient business model: No fixed cost / Build portfolio value Highly skilled management, financially involved Atari is an Iconic brand with a worldwide appeal across generations Sector with strong growth and multiple opportunities. Video games Hardware / consoles TV (scripted series, unscripted series) Connected devices Web series Movies Comic books Merchandising 29


30 Business Lines The Atari Group focuses on the development of the following business lines: Video games Online gaming Connected devices Multimédia productions Licensing 30
31 Video Games Key items Significant successes with simulation games. The RollerCoaster Tycoon License Extension to 2022 allows for continued development and growth. New game products under development, across multiple platforms, for near-term releases. 31


32 Recent Products 32

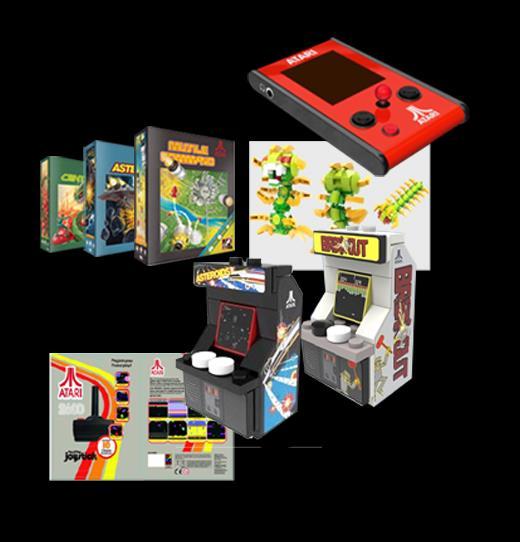

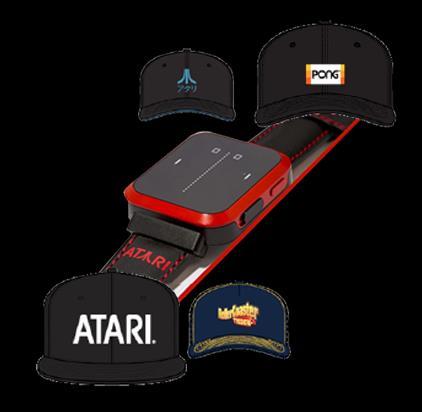


33 Upcoming Products (including Licenses) Atari Casino Games Atari Connected Wearables Atari Licensed Products Atari GameBox Project 33


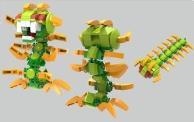

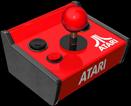

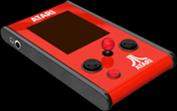

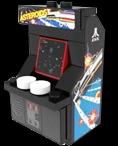

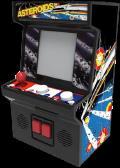

34 Upcoming Products (including Licenses) Handhelds Board Games Construction toy arcade machines and Centipede Mini Arcades and Plug-N-Play Joystick Fidget Spinners Pong Table 34

35 5 ATARI Questions - Answers 35 35
36 Thank You For Your Attention 36
STRATEGIC PRESENTATION. September 2016
 STRATEGIC PRESENTATION Réunion SFAF 27 janvier 2016 Disclosure In this strategic presentation, the terms "Atari and/or the "Company" mean Atari. The term "Group" means the group of companies belonging
Annual results as at March 31, 2017: Significant improvement in profitability against a backdrop of significant growth
 Annual results as at March 31, 2017: Significant improvement in profitability against a backdrop of significant growth Accounts adopted by the Board of Directors on June 27, 2017. The audit procedures
ATARI April 2018 April
 ATARI 1 Disclosure In this strategic presentation, the terms "Atari and/or the "Company" mean Atari. The term "Group" means the group of companies belonging to the parent Company and all companies within
Profitable annual results as at March 31, 2018 Continuation of the long-term development and profitable growth strategy of the Atari Group
 Profitable annual results as at March 31, 2018 Continuation of the long-term development and profitable growth strategy of the Atari Group Increase in video games and licenses Revenue up +23.6% at constant
1 st half results of : Strong organic growth in revenues (+43%) and in current operating profit to 1.2 million (14% of revenues)
 and in current operating profit to 1.2 million (14% of revenues)") 1 st half results of 2017-2018: Strong organic growth in revenues (+43%) and in current operating profit to 1.2 million (14% of revenues) Current operating profit multiplied by 4 Net profit, Group share:
1 st half results of 2017-2018: Strong organic growth in revenues (+43%) and in current operating profit to 1.2 million (14% of revenues) Current operating profit multiplied by 4 Net profit, Group share:
Results of the first half of Continued profitable growth, with strong growth in revenues (+27%) and current operating income (+87%)
 and current operating income (+87%)") Results of the first half of 2018-2019 Continued profitable growth, with strong growth in revenues (+27%) and current operating income (+87%) Turnover of 10.8 million euros (+27% at current exchange rate,
Results of the first half of 2018-2019 Continued profitable growth, with strong growth in revenues (+27%) and current operating income (+87%) Turnover of 10.8 million euros (+27% at current exchange rate,
INTERIM REPORT FIRST HALF OF FISCAL 2012/2013 (6 months ended September 30, 2012)
") A French corporation (société anonyme) with capital of 14,765,685.50 euros Principal office: 78 Rue Taitbout, 75009 Paris, France Paris Trade and Companies Registry no. 341 699 106 INTERIM REPORT FIRST
A French corporation (société anonyme) with capital of 14,765,685.50 euros Principal office: 78 Rue Taitbout, 75009 Paris, France Paris Trade and Companies Registry no. 341 699 106 INTERIM REPORT FIRST
INTERIM REPORT FIRST HALF OF 2011/2012 (6 months to September 30, 2011)
") A French corporation (société anonyme) with capital of 25.034.035 euros Principal office: 78 rue Taitbout 75009 PARIS - France Paris Trade and Companies Registry no. 341 699 106 INTERIM REPORT FIRST HALF
A French corporation (société anonyme) with capital of 25.034.035 euros Principal office: 78 rue Taitbout 75009 PARIS - France Paris Trade and Companies Registry no. 341 699 106 INTERIM REPORT FIRST HALF
ANNUAL AND EXTRAORDINARY SHAREHOLDERS MEETING. September 30, nd notice
 ANNUAL AND EXTRAORDINARY SHAREHOLDERS MEETING September 30, 2011 2 nd notice 1 AGENDA OF THE MEETING 2 Agenda of the annual shareholders meeting (1/2) 1. Approval of the company financial statements for
UBISOFT REPORTS FULL-YEAR SALES AND EARNINGS FIGURES
 UBISOFT REPORTS FULL-YEAR 2015-16 SALES AND EARNINGS FIGURES Sales and earnings exceed revised targets - Sales: 1,394 million - Non-IFRS operating income: 169 million - A further rise in profitability:
Basic earnings per common share $ 0.16 $ 0.29 $ 0.50 $ 0.71 Weighted average common shares outstanding 1,109 1,141 1,115 1,157
 1 CONDENSED CONSOLIDATED STATEMENTS OF OPERATIONS (Unaudited) (Amounts in millions, except per share data) Three Months Ended June 30, Six Months Ended June 30, 2012 2011 2012 2011 Net revenues: Product
ACTIVISION BLIZZARD ANNOUNCES RECORD FOURTH QUARTER AND FULL YEAR EARNINGS PER SHARE. Exceeds Outlook for Fourth Quarter and Full Year 2014
 FOR IMMEDIATE RELEASE ACTIVISION BLIZZARD ANNOUNCES RECORD FOURTH QUARTER AND FULL YEAR EARNINGS PER SHARE Exceeds Outlook for Fourth Quarter and Full Year 2014 Achieved More Than 50% Non GAAP Earnings
Consolidated Financial Results for the Fiscal Year Ended March 31, 2012 (Japan GAAP)
") Consolidated Financial Results for the Fiscal Year Ended March 31, 2012 (Japan GAAP) May 14, 2012 Company name: SQUARE ENIX HOLDINGS CO., LTD. Shares traded: Tokyo Stock Exchange, First Section Company
Consolidated Financial Results for the Fiscal Year Ended March 31, 2012 (Japan GAAP) May 14, 2012 Company name: SQUARE ENIX HOLDINGS CO., LTD. Shares traded: Tokyo Stock Exchange, First Section Company
Ubisoft reports first half results
 Ubisoft reports first half 2008-09 results Sales 1 up 32% Strong increase in profitability: o Current operating income 2 : 9.6% of sales o Net income: 24 million 2008-09 targets confirmed Paris, November
Consolidated financial results for the 9 months of the fiscal year ending March 31, 2018 (Japan GAAP - Unaudited)
") Company name: Code number: Representative: Contact person: Filing date for financial report : Consolidated financial results for the 9 months of the fiscal year ending March 31, 2018 (Japan GAAP - Unaudited)
Company name: Code number: Representative: Contact person: Filing date for financial report : Consolidated financial results for the 9 months of the fiscal year ending March 31, 2018 (Japan GAAP - Unaudited)
Ubisoft reports full-year results
 Ubisoft reports full-year 2007-08 results Sales 1 up 36% (43% at constant exchange rates). Record-high profitability and net cash position: o Current operating income 2 : 14.3% of sales. o Cash flow from
Basic earnings (loss) per common share $ 0.09 $ (0.20) $ 0.93 $ 0.34 Weighted average common shares outstanding 1,139 1,198 1,148 1,222
 per common share $ 0.09 $ (0.20) $ 0.93 $ 0.34 Weighted average common shares outstanding 1,139 1,198 1,148 1,222") 1 CONDENSED CONSOLIDATED STATEMENTS OF OPERATIONS (Unaudited) (Amounts in millions, except per share data) Three Months Ended December 31, Year Ended December 31, 2011 2010 2011 2010 Net revenues: Product
1 CONDENSED CONSOLIDATED STATEMENTS OF OPERATIONS (Unaudited) (Amounts in millions, except per share data) Three Months Ended December 31, Year Ended December 31, 2011 2010 2011 2010 Net revenues: Product
Maximum 1,070,000 RCT Revenue Participation Units ($1,070,000) Minimum 10,000 RCT Revenue Participation Units ($10,000)
 Minimum 10,000 RCT Revenue Participation Units ($10,000)") OFFERING MEMORANDUM PART II OF OFFERING STATEMENT (EXHIBIT A TO FORM C) ATARI GAME PARTNERS, CORP. 286 Madison Avenue, 8th Floor New York, NY 10017 www.atarigamepartners.com A crowdfunding investment involves
OFFERING MEMORANDUM PART II OF OFFERING STATEMENT (EXHIBIT A TO FORM C) ATARI GAME PARTNERS, CORP. 286 Madison Avenue, 8th Floor New York, NY 10017 www.atarigamepartners.com A crowdfunding investment involves
Activision Blizzard Announces Record Fourth Quarter and Calendar Year 2011 Earnings
 Activision Blizzard Announces Record Fourth Quarter and Calendar Year 2011 Earnings FINANCIAL HIGHLIGHTS - CY 2011 EPS Grows by More than 17% Establishing New Company Record - Company Achieves Record GAAP
Q1 FY2013 Consolidated Financial Results
 Q1 FY2013 Consolidated Financial Results (Three months ended June 30, 2013) Sony Corporation Highlights Primarily due to the strong performances of the smartphone business and the Financial Services segment,
Disclaimer: This document is a free translation of and extract from the original French Financial Annual Report for 2016 and the French consolidated
 Disclaimer: This document is a free translation of and extract from the original French Financial Annual Report for 2016 and the French consolidated financial statements. Only the French version is legally
H1 08 H1 08 pro forma
 PRESS RELEASE H1 2009 RESULTS Neuilly sur Seine August 26, 2009 Strong increase in gross margin 1 to 39.2% of revenue in H1 09 (+2.5 points) Operating expenses under control Adjusted operating margin 2
Basic earnings (loss) per common share $ (0.20) $ (0.23) $ 0.34 $ 0.09 Weighted average common shares outstanding 1,198 1,265 1,222 1,283
 per common share $ (0.20) $ (0.23) $ 0.34 $ 0.09 Weighted average common shares outstanding 1,198 1,265 1,222 1,283") CONDENSED CONSOLIDATED STATEMENTS OF OPERATIONS (Unaudited) (Amounts in millions, except per share data) Three Months Ended December 31, Year Ended December 31, 2010 2009 2010 2009 Net revenues: Product
CONDENSED CONSOLIDATED STATEMENTS OF OPERATIONS (Unaudited) (Amounts in millions, except per share data) Three Months Ended December 31, Year Ended December 31, 2010 2009 2010 2009 Net revenues: Product
Activision Blizzard Announces Better-Than-Expected Second Quarter 2011 Financial Results
 Activision Blizzard Announces Better-Than-Expected Second Quarter 2011 Financial Results - Q2 Up Year Over Year; Record EPS Increases Over 66% Year Over Year - - For Six-Month Period Up; Record EPS Increases
Case Study: Life Cycle of a Successful VC- Funded Global High-Tech Venture
 Case Study: Life Cycle of a Successful VC- Funded Global High-Tech Venture 2015 Bierce & Kenerson, P.C. CASE STUDY Life Cycle of a Successful VC-Funded Global High-Tech Venture or How a small, privately
F O U R T H Q U A R T E R R E S U L T S February 6, 2018
 F O U R T H Q U A R T E R 2 0 1 7 R E S U L T S February 6, 2018 Safe Harbor for Forward-Looking Statements Certain statements in this presentation are forward-looking statements within the meaning of
Investors Presentation
 Investors Presentation (Based on Third Quarter 2014 Results) November 5, 2014 Safe Harbor for Forward-Looking Statements Certain statements in this presentation are forward-looking statements within the
FINANCIALS VINCENT PILETTE CFO
 FINANCIALS VINCENT PILETTE CFO FORWARD-LOOKING STATEMENTS This presentation includes forward-looking statements within the meaning of the U.S. federal securities laws, including, without limitation, statements
Product sales $ 768 $ 643 $ 1,829 $ 1,629 Subscription, licensing and other revenues Total net revenues 1, ,595 2,275
 CONDENSED CONSOLIDATED STATEMENTS OF OPERATIONS (Unaudited) (Amounts in millions, except per share data) Net revenues: Three Months Ended June 30, Six Months Ended June 30, 2011 2010 2011 2010 Product
UBISOFT REPORTS FULL-YEAR SALES AND EARNINGS FIGURES
 UBISOFT REPORTS FULL-YEAR 2014-15 SALES AND EARNINGS FIGURES Record annual performance, beating targets - Sales: 1,464 million - Non-IFRS operating income: 171 million - Cash-flows from operating activities
ADLPartner 2013 annual report 0
 Disclaimer: This document is a free translation and an extract of the original French Financial Annual Report 2013 and of the French consolidated financial statements. Only the French version is legally
Frontier Developments plc
 24 February 2015 Frontier Developments plc Half Yearly Results Frontier Developments plc (AIM: FDEV; Frontier or the Group ), a leading independent developer of video games has published its results for
Consolidated Financial Results for the Three-Month Period Ended June 30, 2018 (Japan GAAP) August 7, 2018
 August 7, 2018") Consolidated Financial Results for the Three-Month Period Ended June 30, 2018 (Japan GAAP) August 7, 2018 Company name: SQUARE ENIX HOLDINGS CO., LTD. Shares traded: Tokyo Stock Exchange, First Section
Consolidated Financial Results for the Three-Month Period Ended June 30, 2018 (Japan GAAP) August 7, 2018 Company name: SQUARE ENIX HOLDINGS CO., LTD. Shares traded: Tokyo Stock Exchange, First Section
TECHNICOLOR 2017 CONSOLIDATED FINANCIAL STATEMENTS
 TECHNICOLOR 2017 CONSOLIDATED FINANCIAL STATEMENTS The audit procedures of the consolidated financial statements have been performed. The audit report will be issued in the following days after finalization
First Half 2002 results
 Press Release First Half 2002 results Operating income at 242 million euros ahead of expectations Strong revenue and operating income performances at Digital Media Solutions and Patents & Licensing Operating
Gannett Company Overview
 Gannett Company Overview February 2016 Forward-Looking Statements Certain statements in this presentation may be forward looking in nature or constitute forwardlooking statements as defined in the Private
2011 FOURTH-QUARTER EARNINGS
 2011 FOURTH-QUARTER EARNINGS Revenues: 71.7 million euros, up 6.3% in relation to the fourth quarter of 2010. Gross margin: 53.7%, up 4.3 points thanks to the impact of a favorable product mix. Income
ELECTRONIC ARTS REPORTS Q4 FY12 AND FY12 FINANCIAL RESULTS
 ELECTRONIC ARTS REPORTS Q4 FY12 AND FY12 FINANCIAL RESULTS All-Time High Non-GAAP Net Revenue of $4.2 Billion in Fiscal 12 Annual Digital Non-GAAP Revenue Up 47% to $1.2 Billion Digital Revenue Driving
Corus Entertainment Annual Report
 MANAGEMENT S DISCUSSION AND ANALYSIS Management s Discussion and Analysis of the financial position and results of operations for the year ended August 31, 2017 is prepared at November 17, 2017. The following
THE WALT DISNEY COMPANY REPORTS FIRST QUARTER EARNINGS
 FOR IMMEDIATE RELEASE February 9, THE WALT DISNEY COMPANY REPORTS FIRST QUARTER EARNINGS BURBANK, Calif. The Walt Disney Company today reported earnings for its first fiscal quarter ended January 2,. Diluted
Consolidated Financial Forecast for the Fiscal Year Ending March 31, 2019 Year ending Mar Profit attributable to Net sales Operating profit Ordi
 CONSOLIDATED FINANCIAL STATEMENTS April 26, 2018 Nintendo Co., Ltd. 111 Hokotatecho, Kamitoba, Minamiku, Kyoto 6018501 Consolidated Results for the Years Ended March 31, 2017 and 2018 (1) Consolidated
ACTIVISION BLIZZARD ANNOUNCES BETTER-THAN-EXPECTED FIRST QUARTER 2014 FINANCIAL RESULTS
 FOR IMMEDIATE RELEASE ACTIVISION BLIZZARD ANNOUNCES BETTER-THAN-EXPECTED FIRST QUARTER 2014 FINANCIAL RESULTS Company Delivered Record Q1 Non-GAAP Digital Revenues and Record Q1 Non-GAAP EPS Company Increases
Nintendo Co., Ltd. CONSOLIDATED FINANCIAL HIGHLIGHTS January 31, 2019 Nintendo Co., Ltd Hokotate-cho, Kamitoba, Minami-ku, Kyoto Japan
 CONSOLIDATED FINANCIAL HIGHLIGHTS January 31, 2019 11-1 Hokotate-cho, Kamitoba, Minami-ku, Kyoto 601-8501 Consolidated Results for the Nine Months Ended December 31, 2017 and 2018 (1) Consolidated operating
Phoenix New Media Reports Fourth Quarter and Fiscal Year 2017 Unaudited Financial Results
 Phoenix New Media Reports Fourth Quarter and Fiscal Year 2017 Unaudited Financial Results Live Conference Call to be Held at 9:00 PM U.S. Eastern Time on March 12, 2018 BEIJING, China, March 13, 2018 Phoenix
2012: FIRST HALF RESULTS 25 July 2012
 2012: FIRST HALF RESULTS 25 July 2012 DISCLAIMER Statements contained in this document, particularly those concerning forecasts on future Groupe M6 performance, are forward-looking statements that are
Gannett. Company Overview July 2016
 Gannett Company Overview July 2016 FORWARD-LOOKING STATEMENTS Certain statements in this presentation may be forward looking in nature or constitute forward-looking statements as defined in the Private
ACTIVISION BLIZZARD ANNOUNCES BETTER-THAN-EXPECTED SECOND QUARTER 2014 FINANCIAL RESULTS. Company Increases CY 2014 Full-Year Revenue and EPS Outlook
 FOR IMMEDIATE RELEASE ACTIVISION BLIZZARD ANNOUNCES BETTER-THAN-EXPECTED SECOND QUARTER 2014 FINANCIAL RESULTS Company Increases CY 2014 Full-Year Revenue and EPS Outlook Company Expects to Deliver Record
Ubisoft reports first-half results
 Ubisoft reports first-half 2009-10 results Sales 1 : 166 million Current operating loss 2 of 78 million, in line with guidance 2009-10 targets confirmed Paris, November 30, 2009 Today, Ubisoft released
ACTIVISION BLIZZARD ANNOUNCES BETTER-THAN-EXPECTED THIRD QUARTER 2012 FINANCIAL RESULTS
 FOR IMMEDIATE RELEASE ACTIVISION BLIZZARD ANNOUNCES BETTER-THAN-EXPECTED THIRD QUARTER 2012 FINANCIAL RESULTS Company Had Three of the Top Four Best-Selling Games in North America and Europe for the First
Ubisoft announces its results for the first half of the fiscal year
 Ubisoft announces its results for the first half of the 2007-08 fiscal year Sales 1 up 52%. Marked improvement in profitability: o Current operating income 2 up 43 million to a positive 9 million. o Net
Gannett Company Overview
 Gannett Company Overview August 2015 Forward-Looking Statements Certain statements in this presentation may be forward looking in nature or constitute forwardlooking statements as defined in the Private
Ubisoft announces its results for the first half of the fiscal year
 Ubisoft announces its results for the first half of the 2006-07 fiscal year Sales up 13% to 172.1 million Marked improvement in current operating income 1 : - 33.6 million compared with - 42.4 million
NASDAQ 38th Investor Conference
 NASDAQ 38th Investor Conference Mark Long Chief Financial Officer June 12, 2018 1 Forward-Looking Statements Safe Harbor Disclaimers This presentation contains forward-looking statements that involve risks
Zynga Announces Fourth Quarter and 2014 Financial Results
 February 12, 2015 Zynga Announces Fourth Quarter and 2014 Financial Results Delivers $182.4M in Bookings and $9.4M in Adjusted EBITDA Announces Entrance into Mobile Action Strategy Category with Upcoming
Deutsche Bank 24 th Annual Media, Internet & Telcom Conference. March 8, 2016
 Deutsche Bank 24 th Annual Media, Internet & Telcom Conference March 8, 2016 Safe Harbor for Forward-Looking Statements Certain statements in this presentation are forward-looking statements within the
Accounting Report for the Third Quarter of Fiscal Year Ending March 2009 (October 1, December 31, 2008)
") January 30, 2009 Company: Representative: Contact: JVC KENWOOD Holdings, Inc. Haruo Kawahara, Chairman and CEO (Code: 6632; 1st Section of Tokyo Stock Exchange) Hiroshi Odaka, Deputy President and CFO
January 30, 2009 Company: Representative: Contact: JVC KENWOOD Holdings, Inc. Haruo Kawahara, Chairman and CEO (Code: 6632; 1st Section of Tokyo Stock Exchange) Hiroshi Odaka, Deputy President and CFO
FOR IMMEDIATE RELEASE
 FOR IMMEDIATE RELEASE ACTIVISION BLIZZARD ANNOUNCES BETTER-THAN-EXPECTED FOURTH QUARTER AND CALENDAR YEAR 2013 RESULTS Company Generated More Than $1.26 Billion in Operating Cash Flow in 2013 Board of
THE WALT DISNEY COMPANY REPORTS INCREASED THIRD QUARTER EARNINGS
 FOR IMMEDIATE RELEASE July 30, THE WALT DISNEY COMPANY REPORTS INCREASED THIRD QUARTER EARNINGS BURBANK, Calif. The Walt Disney Company today reported earnings for the third fiscal quarter and nine months
Consolidated financial results for the 3 months of the fiscal year ending March 31, 2019 (Japan GAAP - Unaudited)
") Company name: Code number: Representative: Contact person: Filing date for financial report : Consolidated financial results for the 3 months of the fiscal year ending March 31, 2019 (Japan GAAP Unaudited)
Company name: Code number: Representative: Contact person: Filing date for financial report : Consolidated financial results for the 3 months of the fiscal year ending March 31, 2019 (Japan GAAP Unaudited)
Summary (Translation)
") Summary (Translation) Fields Corporation Summary of Financial Information and Business Results (Consolidated) for the Third Quarter of the Year Ending March 31, 2013 (Japan GAAP) February 5, 2013 Listed
Summary (Translation) Fields Corporation Summary of Financial Information and Business Results (Consolidated) for the Third Quarter of the Year Ending March 31, 2013 (Japan GAAP) February 5, 2013 Listed
Activision Reports Fiscal 2006 Year End Results
 Activision Reports Fiscal 2006 Year End Results May 4, 2006 SANTA MONICA, Calif., May 4, 2006 /PRNewswire-FirstCall via COMTEX News Network/ -- Activision, Inc. (Nasdaq: ATVI) today announced record net
LIVEWIRE MOBILE, INC. ANNUAL FINANCIAL STATEMENTS AND RELATED FOOTNOTES
 LIVEWIRE MOBILE, INC. ANNUAL FINANCIAL STATEMENTS AND RELATED FOOTNOTES FOR THE YEARS ENDED DECEMBER 31, 2011 AND 2010 Table of Contents Independent Auditor s Report 1 Consolidated Balance Sheets as of
KONAMI HOLDINGS CORPORATION
 KONAMI HOLDINGS CORPORATION Quarterly Condensed Consolidated Financial Statements for the Nine Months Ended English translation and a part of summary of the Quarterly Securities Report (Shihanki Hokokusho)
published % % % %
 Synergies from the Sagem Monetel merger greater than expected PRESS RELEASE 2009 ANNUAL RESULTS Solid results in 2009: Reduction of operating expenses in line with cost savings plan 15.0% EBITDA 1 margin
Vivendi Reports Earnings for the First Half of 2007 Double Digit Growth in Operating Performance Confirms 2007 Outlook
 Paris, August 31, Note: This press release contains unaudited consolidated earnings established under IFRS, reviewed by auditors and Vivendi s audit committee. Vivendi Reports Earnings for the First Half
ACTIVISION BLIZZARD ANNOUNCES BETTER-THAN-EXPECTED THIRD QUARTER 2013 FINANCIAL RESULTS. Company Raises 2013 Net Revenues and EPS Outlook
 FOR IMMEDIATE RELEASE ACTIVISION BLIZZARD ANNOUNCES BETTER-THAN-EXPECTED THIRD QUARTER 2013 FINANCIAL RESULTS Company Raises 2013 Net Revenues and EPS Outlook Santa Monica, CA November 6, 2013 Activision
LIONSGATE REPORTS RESULTS FOR FISCAL 2016
 LIONSGATE REPORTS RESULTS FOR FISCAL 2016 Revenue is $2.35 Billion; Net Income Attributable to Lionsgate Shareholders is $50.2 Million or EPS of $0.34; Adjusted EBITDA is $162.3 Million Record Television
ACTIVISION BLIZZARD ANNOUNCES THIRD-QUARTER 2018 FINANCIAL RESULTS. Better-Than-Expected Q3 Results
 ACTIVISION BLIZZARD ANNOUNCES THIRD-QUARTER 08 FINANCIAL RESULTS Better-Than-Expected Q Results Santa Monica, CA November 8, 08 Activision Blizzard, Inc. (Nasdaq: ATVI) today announced third-quarter 08
DISCOVERY, INC. REPORTS SECOND QUARTER 2018 RESULTS
 REPORTS SECOND QUARTER 2018 RESULTS Silver Spring, MD August 7, 2018: Discovery, Inc. ( Discovery or the Company ) (NASDAQ: DISCA, DISCB, DISCK) today reported financial results for the second quarter
Annual Report 2005 A HISTORY OF GROWTH
 Annual Report 2005 A HISTORY OF GROWTH RESULTS THROUGH EXECUTION $ 1.4 billion 92 net revenues 93 94 95 9 6 97 98 9 9 0 0 01 02 03 04 05 W E E N T E R E D F I S C A L 2 0 0 6 W I T H A S T R O N G R E
MAISONS DU MONDE: FULL-YEAR 2018 RESULTS
 PRESS RELEASE MAISONS DU MONDE: FULL-YEAR 2018 RESULTS Strong performance in line with targets Continued solid momentum in online and international sales Focus on strategic pillars to deliver further profitable
FORWARD-LOOKING STATEMENTS
 WWE Q4 AND FULL YEAR 208 RESULTS FEBRUARY 7, 209 FORWARD-LOOKING STATEMENTS This presentation contains forward-looking statements pursuant to the safe harbor provisions of the Securities Litigation Reform
Third Quarter FY2004. Consolidated Results. (Three months ended December 31, 2004)
") Third Quarter FY2004 Consolidated Results (Three months ended December 31, 2004) Statements made in this presentation with respect to Sony s current plans, estimates, strategies and beliefs and other statements
Third Quarter FY2004 Consolidated Results (Three months ended December 31, 2004) Statements made in this presentation with respect to Sony s current plans, estimates, strategies and beliefs and other statements
Consolidated Financial Results for the Six-Month Period Ended September 30, 2012 (Japan GAAP)
") Consolidated Financial Results for the Six-Month Period Ended September 30, 2012 (Japan GAAP) November 6, 2012 Company name: SQUARE ENIX HOLDINGS CO., LTD. Shares traded: Tokyo Stock Exchange, First Section
Consolidated Financial Results for the Six-Month Period Ended September 30, 2012 (Japan GAAP) November 6, 2012 Company name: SQUARE ENIX HOLDINGS CO., LTD. Shares traded: Tokyo Stock Exchange, First Section
Half year financial report
 Half year financial report Six-month period ended June 30, 2016 Condensed Consolidated Financial Statements Management Report CEO Attestation Statutory Auditors Review Report Table of contents Condensed
Electronic Arts Reports Q2 FY19 Financial Results
 Electronic Arts Reports Q2 FY19 Financial Results REDWOOD CITY, CA October 30, 2018 Electronic Arts Inc. (NASDAQ: EA) today announced preliminary financial results for its second fiscal quarter ended September
QUEBECOR INC. AND ITS SUBSIDIARIES
 Consolidated financial statements of QUEBECOR INC. AND ITS SUBSIDIARIES CONSOLIDATED FINANCIAL STATEMENTS Management s responsibility for financial statements Auditor s report to the shareholders of Quebecor
HALF-YEAR RESULTS 2013
 HALF-YEAR RESULTS 2013 Anke Schäferkordt & Guillaume de Posch, Co-CEOs Elmar Heggen, CFO Luxembourg, 22 August 2013 The leading European entertainment network Disclaimer This presentation is not an offer
Fiscal 2018 Third Quarter Earnings Conference Call. Wednesday, June 27, a.m. ET
 Fiscal 2018 Third Quarter Earnings Conference Call Wednesday, June 27, 2018 8 a.m. ET Safe Harbour Disclosure Forward-looking Statements This presentation contains forward-looking information and should
Consolidated Financial Results for the Nine-Month Period Ended December 31, 2014 (Japan GAAP)
") Consolidated Financial Results for the Nine-Month Period Ended December 31, 2014 (Japan GAAP) February 4, 2015 Company name: SQUARE ENIX HOLDINGS CO., LTD. Shares traded: Tokyo Stock Exchange, First Section
Consolidated Financial Results for the Nine-Month Period Ended December 31, 2014 (Japan GAAP) February 4, 2015 Company name: SQUARE ENIX HOLDINGS CO., LTD. Shares traded: Tokyo Stock Exchange, First Section
LOGITECH INTERNATIONAL S.A. (Exact name of Registrant as specified in its charter)
") File Number: 0-29174 SECURITIES AND EXCHANGE COMMISSION Washington, D.C. 20549 FORM 6-K REPORT OF FOREIGN PRIVATE ISSUER PURSUANT TO RULE 13a-16 OR 15d-16 OF THE SECURITIES EXCHANGE ACT OF 1934 For the
File Number: 0-29174 SECURITIES AND EXCHANGE COMMISSION Washington, D.C. 20549 FORM 6-K REPORT OF FOREIGN PRIVATE ISSUER PURSUANT TO RULE 13a-16 OR 15d-16 OF THE SECURITIES EXCHANGE ACT OF 1934 For the
Electronic Arts Inc. Q3 FY 2017 Results. January 31, 2017
 Electronic Arts Inc. Q3 FY 2017 Results January 31, 2017 Safe Harbor Statement Please review our risk factors on Form 10-Q filed with the SEC. Some statements set forth in this document, including the
Consolidated Financial Results for the Three-Month Period Ended June 30, 2015 (Japan GAAP)
") Consolidated Financial Results for the Three-Month Period Ended June 30, 2015 (Japan GAAP) August 6, 2015 Company name: SQUARE ENIX HOLDINGS CO., LTD. Shares traded: Tokyo Stock Exchange, First Section
Consolidated Financial Results for the Three-Month Period Ended June 30, 2015 (Japan GAAP) August 6, 2015 Company name: SQUARE ENIX HOLDINGS CO., LTD. Shares traded: Tokyo Stock Exchange, First Section
Vivendi: Revenues up 23.7% EBITA up 15.8% 2009 Outlook Confirmed
 Paris, May 14, 2009 Note: This press release contains unaudited consolidated earnings established under IFRS. Vivendi: Revenues up 23.7% EBITA up 15.8% 2009 Outlook Confirmed First quarter of 2009 Revenues:
Half-Year Financial Report 2018 Half-year ending June 30, 2018
 Half-Year Financial Report 2018 Half-year ending June 30, 2018 Europcar Mobility Group S.A. A French public limited company (société anonyme) with share capital of 161,030,883 Headquarters: 13 ter boulevard
Inspired Reports Results For The Three-Month Period Ended December 31, 2018
 Inspired Reports Results For The Three-Month Period Ended December 31, 2018 February 11, 2019 NEW YORK, Feb. 11, 2019 /PRNewswire/ -- Total Revenue for the Transitional Period Ended December 31, 2018 of
Ubisoft reports full-year results
 Ubisoft reports full-year 2010-11 results Full-year sales up 19% to 1,039 million Stronger financial performance: - Current operating income 1 : 29 million - Net Income excluding non-recurring items 1
0 ADLPartner Rapport financier annuel 2014
 0 ADLPartner Rapport financier annuel 2014 Disclaimer: This document is a free translation of and extract from the original French Financial Annual Report for 2014 and the French consolidated financial
Quebecor Inc. For the year ending December 31, 2004
 Quebecor Inc. For the year ending December 31, 2004 TSX/S&P Industry Class = 25 2004 Annual Revenue = Canadian $10,982.4 million 2004 Year End Assets = Canadian $14,404.5 million Web Page (October, 2005)
SIGNIFICANT CASH FLOW GENERATION SUPPORTING VERY HIGH LEVEL OF INVESTMENTS IN THE BUSINESS
 2016 ANNUAL RESULTS AND FOURTH-QUARTER 2016 SALES SIGNIFICANT CASH FLOW GENERATION SUPPORTING VERY HIGH LEVEL OF INVESTMENTS IN THE BUSINESS Full-year 2016 sales down -2.7%, organic sales growth down -2.1%
ELECTRONIC ARTS INC.
 UNITED STATES SECURITIES AND EXCHANGE COMMISSION Washington, D.C. 20549 FORM 8-K CURRENT REPORT Pursuant to Section 13 or 15(d) of The Securities Exchange Act of 1934 Date of report (Date of earliest event
UBISOFT REPORTS FIRST-HALF SALES AND EARNINGS FIGURES
 UBISOFT REPORTS FIRST-HALF 2012-13 SALES AND EARNINGS FIGURES First-half sales outstrip targets, coming in at 279 million Current operating loss 1 : 58 million Net loss excluding non-recurring items 1
Q Financial Results Conference Call Slides
 Q4 2015 Financial Results Conference Call Slides This presentation may contain forward-looking statements which are inherently difficult to predict. Actual results could differ materially for a variety
SPE has Built a Strong and Meaningful Networks Presence in India
 SPE has Built a Strong and Meaningful Networks Presence in India SPE launched its network presence in India 17 years ago with SET Between 2000-2007, SET faced multiple challenges In early 2009, new management
INVESTOR PRESENTATION
 INVESTOR PRESENTATION Natixis Mid Caps Conference - 2017 PHILIPPE CHEVALLIER CFO & Deputy CEO 1 INVESTOR PRESENTATION - NATIXIS MID CAPS CONFERENCE Disclaimer This presentation includes forward-looking
2015 Annual Results Sales of 256.2M, up 13% Gross profit up 16% Current operating income of 2.1M Net cash of 36.9M
 2015 Annual Results Sales of 256.2M, up 13% Gross profit up 16% Current operating income of 2.1M Net cash of 36.9M Paris (France), March 21, 2016 Gameloft, a leading digital and social game developer,
VIACOM REPORTS THIRD QUARTER 2008 RESULTS
 VIACOM REPORTS THIRD QUARTER 2008 RESULTS were $0.62; Adjusted Diluted EPS were $0.55 New York, New York, November 3, 2008 Viacom Inc. (NYSE: VIA and VIA.B) today reported financial results for the third
UBISOFT REPORTS FULL-YEAR RESULTS
 UBISOFT REPORTS FULL-YEAR 20-2 RESULTS Full-year sales:,06 million Ongoing improvement in profitability: - Current operating income : 56.0 million - Net income excluding non-recurring items : 37.4 million
TABLE OF CONTENTS BASIS OF PREPARATION AND FORWARD LOOKING STATEMENTS SUPPLEMENTAL INFORMATION ON NON-IFRS MEASURES
 THI RDQUARTERREPORT FI SCAL201 6 Fort het hr eemont handni nemont hper i odsendeddecember31, 201 5 TABLE OF CONTENTS Overview 3 Key performance indicators 3 Financial and business highlights 4 Selected
Alliance Atlantis Communications Inc. For the year ending December 31, 2004
 For the year ending December 31, 2004 TSX/S&P Industry Class = 25 2004 Annual Revenue = Canadian $1,017.5 million 2004 Year End Assets = Canadian $1,529.4 million Web Page (October, 2005) = www.allianceatlantis.com