GLOBAL MEDIUM-TERM NOTES, SERIES I Senior Notes
|
|
|
- Ralph Alfred Stephens
- 5 years ago
- Views:
Transcription
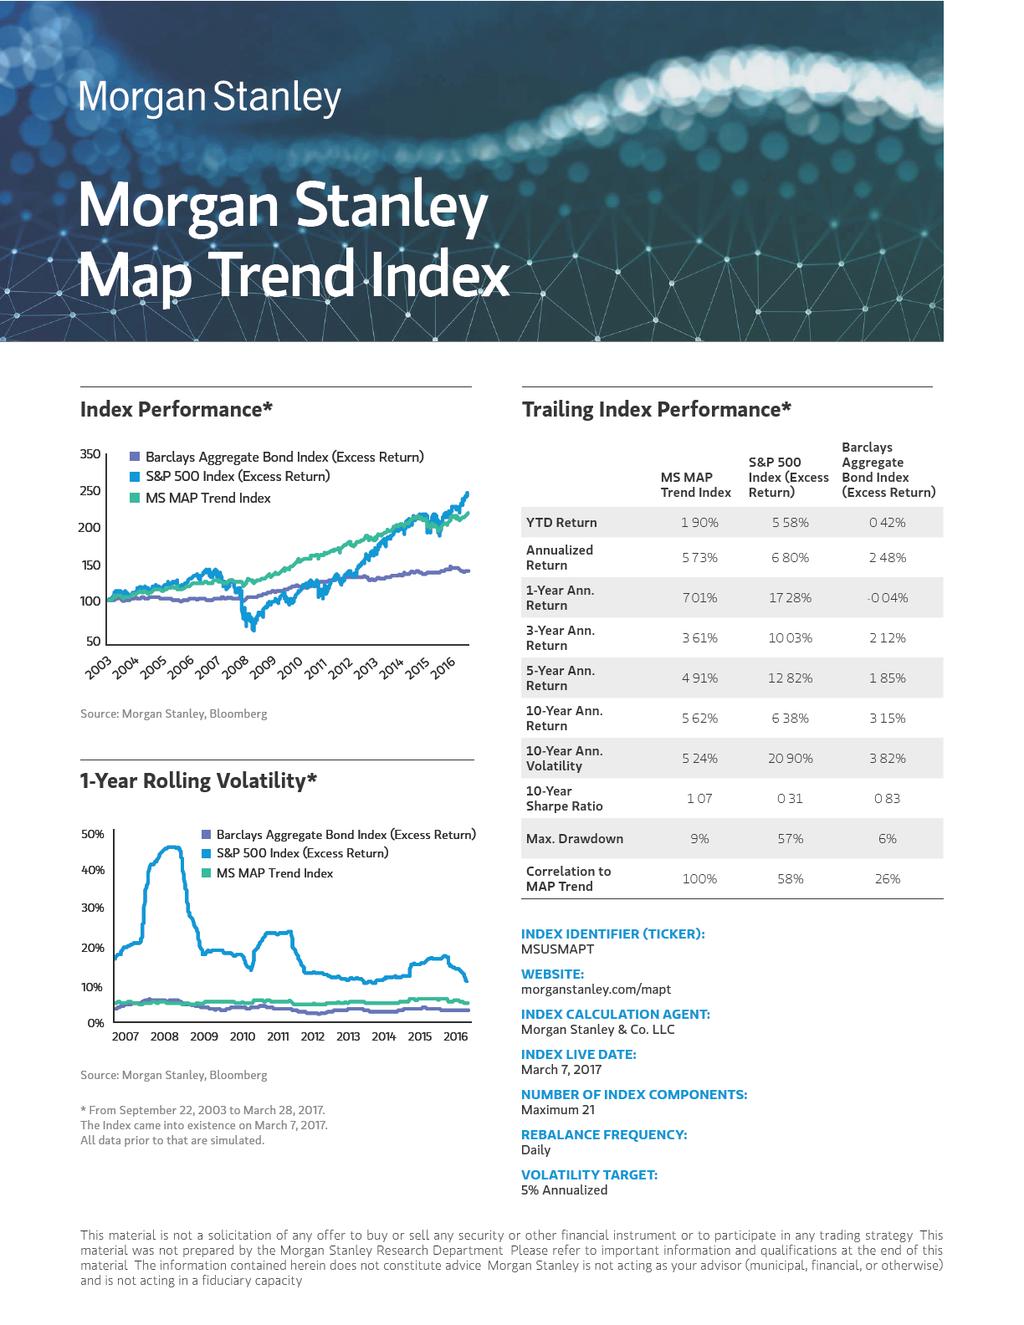
1 MORGAN STANLEY MAP TREND INDEX SUPPLEMENT (To Prospectus dated February 16, 2016) GLOBAL MEDIUM-TERM NOTES, SERIES I Senior Notes Morgan Stanley Finance LLC GLOBAL MEDIUM-TERM NOTES, SERIES A Senior Notes Fully and Unconditionally Guaranteed by Morgan Stanley Morgan Stanley MAP Trend Index Information For a summary of the Morgan Stanley MAP Trend Index, see Summary of the Index on page 11. Investing in the securities involves risks not associated with an investment in ordinary debt securities. See Risk Factors beginning on page 11 and in the relevant preliminary terms or pricing supplement, the accompanying product supplement and the accompanying prospectus. The Securities and Exchange Commission and state securities regulators have not approved or disapproved these securities, or determined if this index supplement, the accompanying product supplement or the accompanying prospectus is truthful or complete. Any representation to the contrary is a criminal offense. These securities are not deposits or savings accounts and are not insured by the Federal Deposit Insurance Corporation or any other governmental agency or instrumentality, nor are they obligations of, or guaranteed by, a bank. MORGAN STANLEY May 1, 2017
2
3 ! "#$ %$ &' "& %$ ( )$ ' & * +#, - (- +*-. - / 0 1!" #$ % * #2 (*3$ " && '&&
4
5
6
7
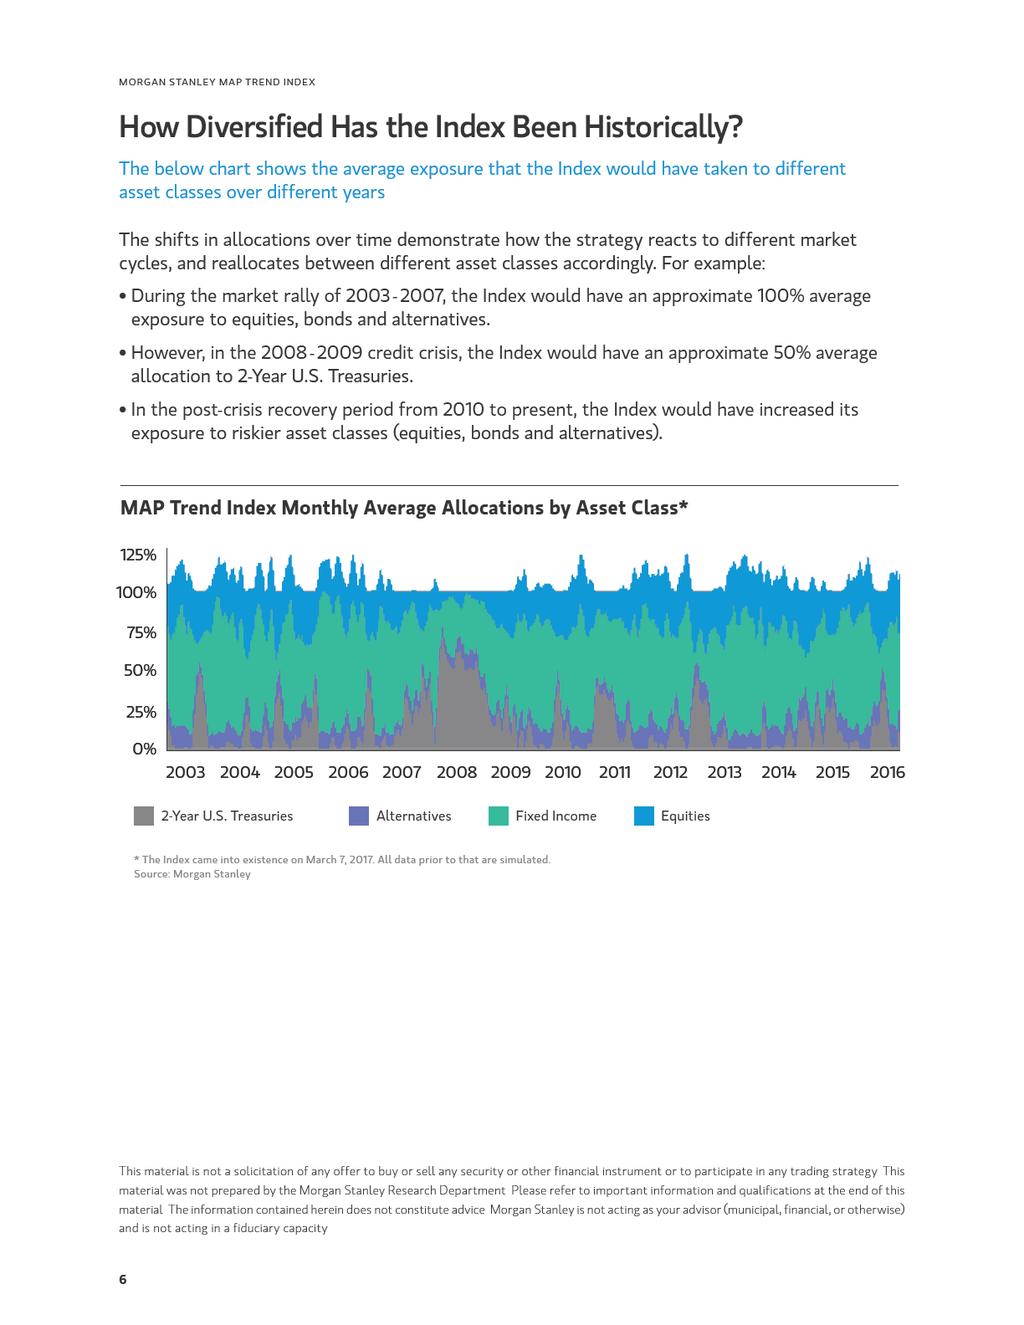
8
9 MORGAN STANLEY MAP TREND INDEX How Does the Volatility Target Work? The Index aims to maximize returns across a diversified portfolio of assets for a defined level of risk. On a daily basis, the Index methodology monitors the volatility of this portfolio and adjusts the exposure so that the targeted annualized volatility of the Index remains around 5%. This means that in higher volatility environments, the Index will take less exposure to the portfolio and more exposure to 2-Year U.S. Treasuries. As volatility falls, the Index will take more exposure to the portfolio (up to the maximum limit of 125%) and reduce exposure to 2-Year U.S. Treasuries. The overall goal of this volatility target mechanism is for the returns of the Index to be smoother than they would be otherwise. What is the Exposure to the Portfolio of Index Components in Different Market Conditions? 3% REALIZED VOLATILITY 5% REALIZED VOLATILITY 10% REALIZED VOLATILITY MAXIMUM OF 125% EXPOSURE TO ASSET PORTFOLIO 100% EXPOSURE TO ASSET PORTFOLIO INDEX 50% EXPOSURE TO ASSET PORTFOLIO Source: Morgan Stanley, illustrative only Volatility Target Mechanism The aim of the volatility target mechanism is to stabilize the realized volatility of the Index at approximately 5%, by adjusting the allocation between the portfolio of Index Components and 2-Year U.S. Treasuries. The minimum and maximum exposure of the Index to the portfolio of Index Components are 0% and 125%, respectively. The allocation to 2-Year U.S. Treasuries will be the difference between 100% and the actual exposure to the ETFs. What is Volatility? Volatility is a measure for how much the price of an asset has changed over time. An asset with low volatility will typically have a stable price, whereas an asset with high volatility will have a price that can fluctuate quite frequently and sharply. Higher volatility is therefore typically associated with higher risk. Historic volatility (also called realized volatility ) is calculated by looking at historical prices for an asset over a set period, and measuring how much these historical prices vary from the average historical price over that same period. Historically, realized volatility tends to be higher when markets are falling. The realized volatility of a portfolio can be decreased by reducing the allocation to volatile assets and replacing it with exposure to the 2-year U.S. Treasury Index, which has a very low volatility. This material is not a solicitation of any offer to buy or sell any security or other financial instrument or to participate in any trading strategy This material was not prepared by the Morgan Stanley Research Department Please refer to important information and qualifications at the end of this material The information contained herein does not constitute advice Morgan Stanley is not acting as your advisor (municipal, financial, or otherwise) and is not acting in a fiduciary capacity 7
10
11
12
13 MORGAN STANLEY MAP TREND INDEX Summary of the Index Index ) has been developed by and is calculated, published and maintained by Index Methodology In addition, the strategy imposes an overall volatility targeting feature upon the resulting portfolio The goal of the Index is to maximize returns for a given level of risk based upon recent trends in the underlying assets The underlying investment assumption and that past trends are likely to continue to be a good indicator of the future performance of that portfolio fixed income securities, commodities and real estate, and (ii) the Morgan Stanley Two Year Treasury Index (collectively, the Index Components ) The notional portfolio constructed by the Index Methodology of Index Components is referred to as the Asset Portfolio ( Volatility Target ) The Index is calculated on an excess return basis, and therefore the level is determined by the weighted return The Index is rebalanced each Strategy Business Day ( Daily Rebalancing ) Upon each Daily Rebalancing for the Index, the Index The Index Methodology then calculates a signal based on the upward or downward trend of each ETF ( Trend Signal ) The Index for each respective ETF A Trend Signal that converges towards one indicates an upward trend and a Trend Signal that converges towards zero indicates a downward trend Once the trend signal is calculated for each ETF, the previously determined base allocations are scaled by the Trend Signal for each ETF by allocating more upward trending securities to the Asset Portfolio The magnitude Risk Factors to the Index If you are considering purchasing or investing in a product linked to the performance of the Index, you should read and be aware of the risks inherent to this Index You should also consult with your investment, legal, tax, accounting and other advisors prior to investing or purchasing such products The Level of the Index Can Go Down As Well As Up. There can be no assurance that the Index will achieve positive returns methodology that selects a hypothetical portfolio of underlying assets to track The performance of the Index will depend on the performance of that hypothetical portfolio minus the sum of the hypothetical portfolio declines in value, the Index value will also decline Even if the hypothetical portfolio increases in value, the Index value will nevertheless decline if the increase in the value of the portfolio is not sufficient to overcome the deduction of The Allocation of ETFs in the Asset Portfolio is Determined in Reference to each ETF s Risk Budget and Volatility. The allocation of each ETF in the asset portfolio is determined in change during the life of the Index and there is no guarantee that the risk budget allocated to each ETF is the optimal allocation A higher or lower risk budget could result in increased investment in an ETF that performs poorly or insufficient investment in an ETF that performs well over the life of the Index Volatility calculations based on historical volatility presume that historical volatility is an accurate indication of current volatility There is a time lag associated with the volatility calculation and there is no guarantee that the volatility in the preceding period is representative of the current volatility of the ETFs There Are Risks Associated with the Index s Momentum Investment Strategy. The Index is constructed using what is positive trends in the prices of assets As such, the composition of the Index is based on the historical performance of the ETFs no guarantee that trends existing in the preceding periods will continue in the future Low Volatility in the Index Is Not Synonymous with Low Risk in an Investment Linked to the Index. For example, even if the volatility of the Index were to be in line with the volatility target, the level of the Index may decrease over time While the Index Has a Volatility Target of 5%, There Can Be No Guarantee, Even If the Asset Portfolio Is Rebalanced Daily, That the Realized Volatility of the Index Will Not be Less Than or Greater Than 5%. Although the Index aims to ensure that its that it will successfully do so There is also a time lag associated 11
14 MORGAN STANLEY MAP TREND INDEX volatility is measured over either approximately the prior month or two months for purposes of the volatility control feature, it may be some period of time before a recent increase in the volatility of the ETFs in the Index is sufficiently reflected in the calculation of realized volatility to cause a compensating reallocation in the asset portfolio There Can Be No Assurance That the Actual Volatility of the Index Will Be Lower Than the Volatility of Any or All of the Index Components. mechanism looks to trends that have occurred in the past to then make adjustments to future positions, it is unlikely that the Index will achieve the target volatility in any Index Component for any given period of time The actual volatility achieved by the Index overall, as well as the volatility achieved for each Index Component, will likely differ perhaps significantly from the volatility target The Volatility Target Feature of the Index May Dampen its Performance in Bullish Markets. The Index is designed to achieve a in the market Therefore, in bullish markets, if the realized volatility is higher than the volatility target, the adjustments to the asset portfolio of the Index through daily rebalancing might dampen the performance of the Index The selection of the Index Components, as well as the volatility target feature, may cause the Index to underperform one or more of the Index Components Each Sub-Index s Portfolio of Index Components Is Varied and Represents a Number of Different Asset Classes in a Number of Different Sectors. Prospective investors should be experienced with respect to, and be able to evaluate and understand the accounting and other advisors), transactions in investments the values of which are derived from different asset classes and sectors The Future Performance of the Index May Bear Little or No Relation to the Historical or Hypothetical Retrospective Performance of the Index. Among other things, the trading prices of the ETFs and the dividends paid on the ETFs will impact the level and the volatility of the Index It is impossible to predict whether the level of the Index will rise or fall The fact that a given allocation among the asset portfolio performed well over any to perform well in the future Future market conditions may differ from past market conditions, and the conditions that may have caused the favorable historical performance may no longer exist Furthermore, by continually seeking to track the asset portfolio too late, and it may perpetually buy high By the time the Index hypothetically invests in a portfolio of ETFs, the ETFs in that portfolio may already have experienced significant appreciation The Index may therefore perpetually make hypothetical investments in portfolios when they are expensive, which may lead to poor returns The Index Is Particularly Susceptible to Choppy Markets. Past performance is particularly likely to be a poor indicator of future trends In such markets, strategies that use past performance as an indicator of future performance, such as that followed by the Index, are subject to whipsaws, which occur when the market reverses and does the opposite of what is indicated by past performance The Index may experience significant declines in such markets The Index Has Fixed Weighting Constraints. The Index applies limits to the weight that may be assigned to each ETF These limits are fixed and may skew the allocations among the ETFs in a way that reduces the potential performance of the Index For example, because of the weighting constraints, the Index may not allocate all of its exposure to the single ETF with the best performance over the prior six months, even if that ETF had a realized volatility of to spread its exposure over all the ETFs, even if one or more of period Additionally, the weighting constraints mean that the Index must have some exposure to all of the ETFs at all times, even when there is no asset portfolio that would be expected to appreciate because all are in decline The Index will not take a short position in any Index Component, even if the relevant Index Component The Index Was Established on March 7, 2017 and Therefore Has a Very Limited History. The performances of the Index and some of the component data have been retrospectively simulated for the period from September 22, 2003 to March 7, 2017 As such, performance for periods prior to the establishment of the Index has been retrospectively simulated by Morgan Stanley & Co LLC on a hypothetical basis A retrospective simulation means that no actual investment which allowed a tracking of the performance of the Index existed at any time during the period of the retrospective simulation The methodology and the Index used for the calculation and retrospective simulation of the Index has been developed with the advantage of hindsight In reality, it is not possible to invest with the advantage of hindsight and therefore this historical performance is purely theoretical and U S Treasury Note Index and certain ETFs included in the Index substitute data has been used for portions of the simulation Wherever data for the Morgan Stanley Two Year Treasury Index or one or more ETFs did not exist, the simulation has included (i) the value of the Morgan Stanley Two Year Treasury Index based on simulated historical performance and (ii) the value of each ratio The ETFs (and corresponding fund inception dates) for which substitute data has been used for all periods prior to the relevant inception date are: USMV (October 20, 2011), DVY (November 7, 2003), HYG (April 11, 2007), AGG (September 26, 2003), EMB (December 19, 2007), TIP (December 5, 2003), PFF (March 30, 2007), GLD (November 18, 2004), USO (April 10, 2006), VNQ (September 29, 2004) and UUP (February 20, 2007) The Index is Calculated on an Excess Return Basis. The level of the Index is calculated as the excess of the weighted return of the asset portfolio over an equivalent cash investment receiving cash investment, and is less than the return on the weighted asset 12
15 MORGAN STANLEY MAP TREND INDEX negatively affect the value of the Index The Index Contains Embedded Costs. The Index contains an daily basis Such cost is deducted when calculating the level of the Index and will thus reduce the return of the Index An Investment in Instruments Linked to the Index Involves Risks Associated with Emerging Markets Equities and Bonds, Currency Exchange Rates and Commodities. Changes in the Value of the Index Components May Offset Each Other. Because the Index Components represent a range of asset classes and geographic regions, price movements of Index Components representing different asset classes or geographic regions may not correlate with each other The Morgan Stanley Two Year Treasury Index Can Produce Negative Returns, Which May Have an Adverse Effect on the Level of the Index. Adjustments to the Index Could Adversely Affect the Value of Instruments Linked to the Index. Morgan Stanley & Co LLC, as the Calculation Agent and the Index Sponsor, can add, delete and/or substitute the Index Components, and can make other methodological changes required by certain events relating to the Index Components Any of these actions could adversely affect the value of instruments linked to the Index Reliance on Information. Unless otherwise stated, all calculations sources Morgan Stanley has relied on these sources and not independently verified the information extracted from these sources Morgan Stanley shall not be liable in any way for any calculations it performs in reliance on such information The information used to undertake the Daily Rebalancings for the Research. Morgan Stanley may issue research reports on securities that are, or may become, constituents of an Index Component or an Index Component Conflicts of Interest. Morgan Stanley, MSFL and their affiliates may from time to time engage in transactions involving constituents of an Index Component or one of the Index Components for their proprietary accounts and/or for accounts of their clients, may underwriting, banking, advisory or other services to the issuers of such constituents Such activities may not be for the benefit of the holders of investments related to the Index and may have a positive or negative effect on the value of the constituents or Index Components and consequently on the value of the Index IMPORTANT INFORMATION AND QUALIFICATIONS LLC, Morgan Stanley & Co International PLC, Morgan Stanley MUFG Securities Co, Ltd, Morgan Stanley Capital Group Inc and/or Morgan Stanley Asia Limited (together with their affiliates, hereinafter Morgan Stanley ), but is not a product of the Morgan Stanley Research Department This communication is a marketing communication and is not a research report For additional information and important disclosures, see morganstanley com/disclaimers Morgan Stanley is not acting as a municipal advisor and the opinions or views contained herein are not intended to be, and do not constitute, should not be construed to be) investment advice (as defined under ERISA or similar concepts under applicable law) from Morgan Stanley with respect to an employee benefit plan or to any person acting as a fiduciary for an employee benefit plan, or as a primary basis for any particular plan investment decision The information provided herein has been prepared solely for informational purposes and is not an offer to buy or sell or a solicitation of an offer to buy or sell any securities or instruments or to participate in any particular trading strategy No representation is given with respect to accuracy or completeness, and they may change without notice Morgan Stanley on its own behalf and on behalf of its affiliates disclaims any and all liability relating to these materials, including, without limitation, any express or implied representations or warranties for statements or errors contained in, or omissions from, these materials Morgan Stanley and others associated with it may make markets or specialize in, have or may in the future enter into principal positions (long or short) in and effect transactions in securities or trading strategies mentioned or described herein Unless stated otherwise, the material contained herein has not been based on a consideration of any individual client circumstances and as such should not be considered to be a personal recommendation We remind investors that these investments are subject to market risk and will fluctuate in value Any investments discussed in this communication may be unsuitable for investors depending upon their specific investment objectives have an adverse effect on the value, price of, or income derived from the investment The performance data quoted represents past performance Past performance is not indicative of future returns No representation or warranty is made that any returns indicated will be achieved Certain assumptions may have been made in this analysis, which have resulted in any returns detailed herein Transaction costs (such as commissions) are not included in the calculation of returns Changes to the assumptions may have a material impact on any returns detailed Potential investors should be aware that certain legal, accounting and tax restrictions, margin requirements, commissions and other transaction costs and changes to the assumptions set forth herein may significantly affect the economic consequences of the transactions discussed herein The information and analyses contained herein are not intended as tax, legal or investment advice and may not be suitable for your specific circumstances By submitting this communication to you, Morgan Stanley is not advising you to take any particular action based on the information, opinions or views contained herein, and acceptance of such document will be deemed by you acceptance of these conclusions You should consult with your own municipal, financial, accounting and legal advisors regarding the information, opinions or views contained in this communication HYPOTHETICAL PERFORMANCE RESULTS HAVE MANY INHERENT LIMITATIONS, SOME OF WHICH ARE DESCRIBED HEREIN NO REPRESENTATION IS BEING MADE THAT ANY ACCOUNT WILL OR IS LIKELY TO ACHIEVE PROFITS OR LOSSES SIMILAR TO THOSE SHOWN IN FACT, THERE ARE FREQUENTLY SHARP DIFFERENCES BETWEEN HYPOTHETICAL PERFORMANCE RESULTS AND THE ACTUAL RESULTS SUBSEQUENTLY ACHIEVED BY ANY PARTICULAR TRADING PROGRAM ONE OF THE LIMITATIONS OF HYPOTHETICAL PERFORMANCE RESULTS IS THAT THEY ARE GENERALLY PREPARED WITH THE BENEFIT OF HINDSIGHT IN ADDITION, HYPOTHETICAL TRADING DOES NOT INVOLVE FINANCIAL RISK, AND NO HYPOTHETICAL TRADING RECORD CAN COMPLETELY ACCOUNT FOR THE IMPACT OF FINANCIAL RISK IN ACTUAL TRADING FOR EXAMPLE, THE ABILITY TO WITHSTAND LOSSES OR TO ADHERE TO A PARTICULAR TRADING STRATEGY IN SPITE OF TRADING LOSSES ARE MATERIAL POINTS WHICH CAN ALSO ADVERSELY AFFECT ACTUAL TRADING RESULTS THERE ARE NUMEROUS OTHER FACTORS RELATED TO THE MARKETS IN GENERAL OR TO THE IMPLEMENTATION OF ANY SPECIFIC TRADING PROGRAM WHICH CANNOT BE FULLY ACCOUNTED FOR IN THE PREPARATION OF HYPOTHETICAL PERFORMANCE RESULTS AND ALL OF WHICH CAN ADVERSELY AFFECT ACTUAL TRADING RESULTS Copyright by Morgan Stanley 2017, all rights reserved 2017 Morgan Stanley Smith Barney LLC Member SIPC CS /17
16

17
18 Monthly Returns* Jan Feb Mar Apr May Jun Jul Aug Sep Oct Nov Dec Full Year * Please see Notes on Simulated Returns. 1 Up until Mar 28, 2017 Source: Morgan Stanley, Bloomberg Certain Key Risks The level of the Index can go down as well as up. There can be no assurance that the Index will achieve positive returns. The base allocation of ETFs in the asset portfolio is determined in reference to each ETF s risk budget and volatility and may not result in optimal allocation. There are risks associated with a momentum based investment strategy. If market conditions do not represent a continuation of prior-observed trends, the performance of the Index, which is rebalanced based on prior trends, may be adversely affected. Low volatility is not synonymous with low risk in an investment linked to the Index. While the Index has a volatility target of 5%, it may not achieve its target volatility, even if the asset portfolio is rebalanced daily. There can be no assurance that the actual volatility of the Index will be lower than the volatility of any or all of the index components. The volatility target feature of the Index may dampen its performance in bullish markets. The future performance of the Index may bear little or no relation to the historical or hypothetical retrospective performance of the Index. The Index is particularly susceptible to choppy markets. The Index was established on March 7, 2017 and therefore has a very limited history. As the Index is new and has very limited actual historical performance, any investment in the Index may involve greater risk than an investment in an Index with longer actual historical performance and a proven track record. The Index is calculated on an excess return basis. The level of the Index is calculated as the excess of the weighted return of the asset portfolio over an equivalent cash investment receiving the 3-month LIBOR. The level of the Index will include the deduction of a fee of 0.85% per annum. An investment in instruments linked to the Index involves risks associated with emerging markets equities and bonds, currency exchange rates and commodities. Please see the full set of risk factors included in any disclosure materials relating to instruments linked MORGAN STANLEY
19 Note on Simulated Returns -
Morgan Stanley Target Equity Balanced Index
 Morgan Stanley Target Equity Balanced Index Targeting Equity and Bond Allocation in a Balanced Way The Target Equity Balanced Index (the TEBI Index ) invests dynamically between Equities and Bonds in order
Morgan Stanley ETF-MAP 2 Index Information
 Morgan Stanley ETF-MAP 2 Index Information Investing in instruments linked to the Morgan Stanley ETF-MAP 2 Index involves risks not associated with an investment in other instruments. See Risk Factors
HSBC Vantage5 Index Methodology Guide
 HSBC Vantage5 Index Methodology Guide Table of contents Index overview 1 Index components 2 Vantage5 Index methodology 3 Monthly rebalancing process 4 Simulated historic volatility 5 Simulated portfolio
HSBC Vantage5 Index Guide
 HSBC Vantage5 Index Guide Table of contents HSBC Vantage5 Index 1 In brief 2 HSBC Vantage5 performance 3 Comparative results 5 Key drivers 6 HSBC Vantage5 strategy 7 Strategic allocation 8 Achieving balance
Citi Dynamic Asset Selector 5 Excess Return Index
 Multi-Asset Index Factsheet & Performance Update - 31 st August 2016 FOR U.S. USE ONLY Citi Dynamic Asset Selector 5 Excess Return Index Navigating U.S. equity market regimes. Index Overview The Citi Dynamic
Morgan Stanley Dynamic Balance Index
 Morgan Stanley Dynamic Balance Index Return MORGAN STANLEY DYNAMIC BALANCE INDEX Morgan Stanley Dynamic Balance Index A rules-based index offering risk-controlled exposure to a broad range of asset classes
J.P. Morgan Structured Investments
 July 2017 J.P. Morgan Structured Investments ent JPMORGAN EFFICIENTE (USD) INDEX STRATEGY GUIDE The JPMorgan ETF Efficiente 5 Index Strategy Guide Important Information The information contained in this
Performance Notes Linked to the HSBC Vantage5 Index (USD) Excess Return
 Excess Return") Filed Pursuant to Rule 433 Registration No. 333-202524 January 2, 2018 FREE WRITING PROSPECTUS (To Prospectus dated March 5, 2015, Prospectus Supplement dated March 5, 2015, Equity Index Underlying Supplement
Filed Pursuant to Rule 433 Registration No. 333-202524 January 2, 2018 FREE WRITING PROSPECTUS (To Prospectus dated March 5, 2015, Prospectus Supplement dated March 5, 2015, Equity Index Underlying Supplement
Index Information on Morgan Stanley SmartInvest Indices
 INDEX SUPPLEMENT (To Prospectus dated November 19, 2014) Filed Pursuant to Rule 424(b)(2) Registration Statement No. 333-200365 GLOBAL MEDIUM-TERM SECURITIES, SERIES F Senior Securities Index Information
July J.P. Morgan Structured Investments. The J.P. Morgan Efficiente Plus 5 Index (Net ER) Strategy Guide
 Strategy Guide") July 2017 J.P. Morgan Structured Investments The J.P. Morgan Efficiente Plus 5 Index (Net ER) Strategy Guide Important Information The information contained in this document is for discussion purposes
July 2017 J.P. Morgan Structured Investments The J.P. Morgan Efficiente Plus 5 Index (Net ER) Strategy Guide Important Information The information contained in this document is for discussion purposes
Global Tactical Asset Allocation
 Global Tactical Asset Allocation This material is solely for informational purposes to be viewed in conjunction with this presentation. The information presented should not be construed as representative
Understanding the JPMorgan ETF Efficiente 5 Index
 Fact Sheet Understanding the JPMorgan ETF Efficiente 5 Index Not a bank or credit union deposit, obligation or guarantee May lose value Not FDIC or NCUA/NCUSIF insured Not insured by any federal government
RISK FACTORS RELATING TO THE CITI FLEXIBLE ALLOCATION 6 EXCESS RETURN INDEX
 RISK FACTORS RELATING TO THE CITI FLEXIBLE ALLOCATION 6 EXCESS RETURN INDEX The following discussion of risks relating to the Citi Flexible Allocation 6 Excess Return Index (the Index ) should be read
J.P. Morgan Structured Investments
 October 2009 J.P. Morgan Structured Investments The JPMorgan Efficiente (USD) Index Strategy Guide Important Information The information contained in this document is for discussion purposes only. Any
Asset Class Review APR. 24, Master Limited Partnerships
 APR. 24, 2013 INVESTOR EDUCATION GLOBAL INVESTMENT COMMITTEE Asset Class Review OVERVIEW AUTHOR Master Limited Partnerships DESCRIPTION. Master limited partnerships (MLPs) operate physical assets such
STRUCTURED INVESTMENTS Opportunities in U.S. and International Equities
 October 2014 Preliminary Pricing Supplement No. 1,645 Registration Statement No. 333-178081 Dated September 30, 2014 Filed pursuant to Rule 424(b)(2) STRUCTURED INVESTMENTS Opportunities in U.S. and International
Factor Mixology: Blending Factor Strategies to Improve Consistency
 May 2016 Factor Mixology: Blending Factor Strategies to Improve Consistency Vassilii Nemtchinov, Ph.D. Director of Research Equity Strategies Mahesh Pritamani, Ph.D., CFA Senior Researcher Factor strategies
Morgan Stanley Finance LLC
 June 2016 Preliminary Pricing Supplement No. 956 Registration Statement Nos. 333-200365; 333-200365-12 Dated June 3, 2016 Filed pursuant to Rule 424(b)(2) STRUCTURED INVESTMENTS Opportunities in U.S. Equities
BROAD COMMODITY INDEX
 BROAD COMMODITY INDEX COMMENTARY + STRATEGY FACTS JANUARY 2018 100.00% 80.00% 60.00% 40.00% 20.00% 0.00% -20.00% -40.00% -60.00% CUMULATIVE PERFORMANCE ( SINCE JANUARY 2007* ) -80.00% ABCERI S&P GSCI ER
STRUCTURED INVESTMENTS Opportunities in U.S. and International Equities
 January 2016 Preliminary Pricing Supplement No. 727 Registration Statement No. 333-200365 Dated December 29, 2015 Filed pursuant to Rule 424(b)(2) STRUCTURED INVESTMENTS Opportunities in U.S. and International
Preliminary Pricing Supplement No. 731 Registration Statement No Dated December 29, 2015 Filed pursuant to Rule 424(b)(2) January 2016
(2) January 2016") January 2016 Preliminary Pricing Supplement No. 731 Registration Statement No. 333-200365 Dated December 29, 2015 Filed pursuant to Rule 424(b)(2) STRUCTURED INVESTMENTS Opportunities in U.S. Equities
January 2016 Preliminary Pricing Supplement No. 731 Registration Statement No. 333-200365 Dated December 29, 2015 Filed pursuant to Rule 424(b)(2) STRUCTURED INVESTMENTS Opportunities in U.S. Equities
MUFG Union Bank, N.A. Market-Linked Certificates of Deposit, due July 31, 2018 (MLCD No. 377) Quarterly Capped Return Linked to the S&P 500 Index
 Quarterly Capped Return Linked to the S&P 500 Index") FINAL DISCLOSURE SUPPLEMENT Dated July 28, 2015 To the Disclosure Statement dated March 30, 2015 MUFG Union Bank, N.A. Market-Linked Certificates of Deposit, due July 31, 2018 (MLCD No. 377) Quarterly
FINAL DISCLOSURE SUPPLEMENT Dated July 28, 2015 To the Disclosure Statement dated March 30, 2015 MUFG Union Bank, N.A. Market-Linked Certificates of Deposit, due July 31, 2018 (MLCD No. 377) Quarterly
Investment Perspectives. From the Global Investment Committee
 Investment Perspectives From the Global Investment Committee Crude Prices Have Declined Significantly Long-Term WTI Crude Price 1 and Month-Over-Month Change As of March 31, 2016 WTI Crude Spot Price and
November 2018 Preliminary Terms No. 1,178 Registration Statement Nos ; Dated October 31, 2018 Filed pursuant to Rule 433
 November 2018 Preliminary Terms No. 1,178 Registration Statement Nos. 333-221595; 333-221595-01 Dated October 31, 2018 Filed pursuant to Rule 433 Morgan Stanley Finance LLC STRUCTURED INVESTMENTS Opportunities
Citigroup Global Markets Holdings Inc.
 The information in this preliminary pricing supplement is not complete and may be changed. A registration statement relating to these securities has been filed with the Securities and Exchange Commission.
MANAGED FUTURES INDEX
 MANAGED FUTURES INDEX COMMENTARY + STRATEGY FACTS JUNE 2018 CUMULATIVE PERFORMANCE ( SINCE JANUARY 2007* ) 120.00% 100.00% 80.00% 60.00% 40.00% 20.00% 0.00% AMFERI BARCLAY BTOP50 CTA INDEX S&P 500 S&P
Please refer to For more information regarding the index. July 2017
 BNP Paribas Momentum Multi Asset 5 Index Please refer to http://momentum5index.bnpparibas.com For more information regarding the index July 07 Introducing the BNP Paribas Momentum Multi Asset 5 Index Index
Morgan Stanley Finance LLC
 February 2019 Preliminary Pricing Supplement No. 1,576 Registration Statement Nos. 333-221595; 333-221595-01 Dated February 1, 2019 Filed pursuant to Rule 424(b)(2) STRUCTURED INVESTMENTS Opportunities
BROAD COMMODITY INDEX
 BROAD COMMODITY INDEX COMMENTARY + STRATEGY FACTS JUNE 2017 80.00% CUMULATIVE PERFORMANCE ( SINCE JANUARY 2007* ) 60.00% 40.00% 20.00% 0.00% -20.00% -40.00% -60.00% -80.00% ABCERI S&P GSCI ER BCOMM ER
GS Momentum Builder Multi-Asset 5S ER Index-Linked CDs Due 2024
 GS Momentum Builder Multi-Asset 5S ER Index-Linked CDs Due 2024 OVERVIEW The CDs do not bear interest. At maturity an investor in the CDs will be paid an amount in cash equal to the face amount of their
BROAD COMMODITY INDEX
 BROAD COMMODITY INDEX COMMENTARY + STRATEGY FACTS JULY 2018 100.00% 80.00% 60.00% 40.00% 20.00% 0.00% -20.00% -40.00% -60.00% CUMULATIVE PERFORMANCE ( SINCE JANUARY 2007* ) -80.00% ABCERI S&P GSCI ER BCOMM
Interest Sensitive Fixed Income Market Data
 Interest Sensitive Fixed Income Market Data April 2013 NORTH AMERICA KEVIN FLANAGAN Morgan Stanley Wealth Management Chief Fixed Income Strategist Managing Director kevin.flanagan@morganstanley.com +1
J.P. Morgan Structured Investments
 Free Writing Prospectus Filed Pursuant to Rule 433 Registration Statement No. 333-177923 Dated October 25, 2013 J.P. Morgan Structured Investments V The J.P. Morgan U.S. Sector Rotator 8 Index Strategy
BROAD COMMODITY INDEX
 BROAD COMMODITY INDEX COMMENTARY + STRATEGY FACTS APRIL 2017 80.00% CUMULATIVE PERFORMANCE ( SINCE JANUARY 2007* ) 60.00% 40.00% 20.00% 0.00% -20.00% -40.00% -60.00% -80.00% ABCERI S&P GSCI ER BCOMM ER
J.P. Morgan Structured Investments
 April 2013 J.P. Morgan Structured Investments T H E J. P. M O R G A N E F F I C I E N T E E M 5 I N D E X S T R A T E G Y G U I D E The J.P. Morgan Efficiente EM 5 Index Strategy Guide Important Information
MANAGED FUTURES INDEX
 MANAGED FUTURES INDEX COMMENTARY + STRATEGY FACTS JULY 2017 CUMULATIVE PERFORMANCE ( SINCE JANUARY 2007* ) 120.00% 100.00% 80.00% 60.00% 40.00% 20.00% 0.00% AMFERI BARCLAY BTOP50 CTA INDEX S&P 500 S&P
Interest Sensitive Fixed Income Market Data
 Interest Sensitive Fixed Income Market Data NORTH AMERICA April 2014 KEVIN FLANAGAN Morgan Stanley Wealth Management Chief Fixed Income Strategist Managing Director kevin.flanagan@morganstanley.com +1
Credit Sensitive Fixed Income Market Data
 Credit Sensitive Fixed Income Market Data April 2013 NORTH AMERICA KEVIN FLANAGAN Morgan Stanley Wealth Management Chief Fixed Income Strategist Managing Director kevin.flanagan@morganstanley.com +1 914
Risk Factors Citi Volatility Balanced Beta (VIBE) Equity US Gross Total Return Index
 Equity US Gross Total Return Index") Risk Factors Citi Volatility Balanced Beta (VIBE) Equity US Gross Total Return Index The Methodology Does Not Mean That the Index Is Less Risky Than Any Other Equity Index, and the Index May Decline The
Risk Factors Citi Volatility Balanced Beta (VIBE) Equity US Gross Total Return Index The Methodology Does Not Mean That the Index Is Less Risky Than Any Other Equity Index, and the Index May Decline The
5 Year Certificates of Deposit Linked to the HSBC Vantage5 Index
 5 Year Certificates of Deposit Linked to the HSBC Vantage5 Index Overview The CDs provide at least 175% exposure (to be determined on the Pricing Date) to any positive return of the HSBC Vantage5 Index.
Citigroup Global Markets Holdings Inc.
 The information in this preliminary pricing supplement is not complete and may be changed. A registration statement relating to these securities has been filed with the Securities and Exchange Commission.
MANAGED FUTURES INDEX
 MANAGED FUTURES INDEX COMMENTARY + STRATEGY FACTS JANUARY 2019 CUMULATIVE PERFORMANCE ( SINCE JANUARY 2007* ) 140.00% 120.00% 100.00% 80.00% 60.00% 40.00% 20.00% 0.00% AMFERI BARCLAY BTOP50 CTA INDEX S&P
BNP PARIBAS MULTI ASSET DIVERSIFIED 5 INDEX
 BNP PARIBAS MULTI ASSET DIVERSIFIED 5 INDEX Please refer to http://madindex.bnpparibas.com For more information regarding the index 20477 (12/17) Introducing the BNP Paribas Multi Asset Diversified (MAD)
January-----, 2017 Medium-Term Senior Notes, Series N
 The information in this preliminary pricing supplement is not complete and may be changed. A registration statement relating to these securities has been filed with the Securities and Exchange Commission.
FACTSHEET August 30, 2018 Motif Capital National Defense 7 ER Index
 DESCRIPTION The (the Index ): Provides exposure to stocks of certain companies concentrated in the aerospace & defense, construction & engineering, construction machinery & heavy trucks, IT consulting
ETFs: Regulatory (High) Impact. Commerzbank, leaders in ETF February 2018
 Impact. Commerzbank, leaders in ETF February 2018") ETFs: Regulatory (High) Impact Commerzbank, leaders in ETF February 2018 What are ETFs? Securities that track the value of an index, commodities or a basket of assets and trade like a stock on the exchange
ETFs: Regulatory (High) Impact Commerzbank, leaders in ETF February 2018 What are ETFs? Securities that track the value of an index, commodities or a basket of assets and trade like a stock on the exchange
MANAGED FUTURES INDEX
 MANAGED FUTURES INDEX COMMENTARY + STRATEGY FACTS JANUARY 2018 CUMULATIVE PERFORMANCE ( SINCE JANUARY 2007* ) 120.00% 100.00% 80.00% 60.00% 40.00% 20.00% 0.00% AMFERI BARCLAY BTOP50 CTA INDEX S&P 500 S&P
Dividend Report. December 2018
 Warning: Aberdeen Global has the discretion to determine the and rate of dividend to be distributed. The dividends are not guaranteed and may be investment income, gains or at the discretion of the Board
MANAGED FUTURES INDEX
 MANAGED FUTURES INDEX COMMENTARY + STRATEGY FACTS SEPTEMBER 2018 CUMULATIVE PERFORMANCE ( SINCE JANUARY 2007* ) 140.00% 120.00% 100.00% 80.00% 60.00% 40.00% 20.00% 0.00% AMFERI BARCLAY BTOP50 CTA INDEX
Understanding Investment Risk
 Understanding Investment Risk Investments and services offered through Morgan Stanley Smith Barney LLC, and accounts carried by Morgan Stanley & Co. Incorporated; members SIPC. 2009 Morgan Stanley Smith
Alpha Bonds Strategy
 Alpha Bonds Strategy Strategy Overview The Alpha Bonds Strategy combines conservative bond funds with Alpha s fourth quarter power periods to create what we believe is a unique solution to the conservative
MANAGED FUTURES INDEX
 MANAGED FUTURES INDEX COMMENTARY + STRATEGY FACTS NOVEMBER 2018 CUMULATIVE PERFORMANCE ( SINCE JANUARY 2007* ) 140.00% 120.00% 100.00% 80.00% 60.00% 40.00% 20.00% 0.00% AMFERI BARCLAY BTOP50 CTA INDEX
FTSE Nareit All Equity REITs equity market capitalization = $986.8 billion
 Nareit REIT Industry Fact Sheet Data as of, except where noted. Unless otherwise noted, all data are derived from, and apply only to, publicly traded US REITs. Industry Size FTSE Nareit All REITs equity
MANAGED FUTURES INDEX
 MANAGED FUTURES INDEX COMMENTARY + STRATEGY FACTS JULY 2018 CUMULATIVE PERFORMANCE ( SINCE JANUARY 2007* ) 120.00% 100.00% 80.00% 60.00% 40.00% 20.00% 0.00% AMFERI BARCLAY BTOP50 CTA INDEX S&P 500 S&P
Wells Fargo & Company
 AMENDED AND RESTATED PRICING SUPPLEMENT No. 420 dated April 21, 2014 (To Prospectus Supplement dated April 13, 2012 and Prospectus dated April 13, 2012) Wells Fargo & Company Medium-Term Notes, Series
BROAD COMMODITY INDEX
 BROAD COMMODITY INDEX COMMENTARY + STRATEGY FACTS AUGUST 2018 120.00% 100.00% 80.00% 60.00% 40.00% 20.00% 0.00% -20.00% -40.00% -60.00% CUMULATIVE PERFORMANCE ( SINCE JANUARY 2007* ) -80.00% ABCERI S&P
INDEX PERFORMANCE HISTORY MARKET CYCLE ANALYSIS*
 Jun 09 Dec 09 Jun 10 Dec 10 Jun 11 Dec 11 Jun 12 Dec 12 Jun 13 Dec 13 Jun 14 Dec 14 Jun 15 Dec 15 Jun 16 Dec 16 Jun 17 Dec 17 Jun 18 Dec 18 Dec 07 Jan 08 Feb 08 Mar 08 Apr 08 May 08 Jun 08 Jul 08 Aug 08
JPMorgan Chase Bank, National Association $6,970,000 Certificates of Deposit Linked to the J.P. Morgan ETF Efficiente DS 5 Index due January 29, 2021
 Disclosure supplement To disclosure statement dated September 21, 2012 and underlying supplement no. CD-6-I dated December 7, 2012 JPMorgan Chase Bank, National Association $6,970,000 due January 29, 2021
GS Momentum Builder Multi-Asset 5 ER Index-Linked Certificates of Deposit Due 2021
 GS Momentum Builder Multi-Asset 5 ER Index-Linked Certificates of Deposit Due 2021 OVERVIEW The CDs do not bear interest. At maturity an investor in the CDs will be paid an amount in cash equal to the
Structured Investments. $ Principal Protected Notes Linked to the JPMorgan Efficiente (USD) Index due December 31, 2014
 Index due December 31, 2014") Term sheet To prospectus dated November 21, 2008, prospectus supplement dated November 21, 2008 and product supplement no. 158-A-II dated November 30, 2009 Term Sheet to Product Supplement 158-A-II Registration
Term sheet To prospectus dated November 21, 2008, prospectus supplement dated November 21, 2008 and product supplement no. 158-A-II dated November 30, 2009 Term Sheet to Product Supplement 158-A-II Registration
Credit Suisse. Financial Products
 The information in this preliminary pricing supplement is not complete and may be changed. This preliminary pricing supplement is not an offer to sell these securities and it is not soliciting an offer
Technical Analysis: Market Insight
 Technical Analysis: Market Insight October 1987 vs. October 2017 Today (Oct. 19, 2017) marks the 30 th anniversary of Black Monday a global market crash during which the S&P 500 dropped 20% in one day.
INDEX PERFORMANCE HISTORY MARKET CYCLE ANALYSIS*
 OVERVIEW Index Name: Helios Diversified Index Ticker: Inception Date: September 30, 2003 S&P Launch Date: March 3, 2017 : 45% MSCI ACWI / 25% BBgBarc Agg Bond / 30% Morningstar Div Alts Morningstar SecID:
Morgan Stanley Finance LLC
 STRUCTURED INVESTMENTS Opportunities in U.S. Equities March 2017 Preliminary Terms No. 1,378 Registration Statement Nos. 333-200365; 333-200365-12 Dated March 1, 2017 Filed pursuant to Rule 433 Contingent
STRUCTURED INVESTMENTS Opportunities in U.S. Equities
 January 2017 Preliminary Terms No. 1,251 Registration Statement Nos. 333-200365; 333-200365-12 Dated January 3, 2017 Filed pursuant to Rule 433 STRUCTURED INVESTMENTS Opportunities in U.S. Equities Fully
INDEX PERFORMANCE HISTORY MARKET CYCLE ANALYSIS*
 OVERVIEW Index Name: Helios Dynamic Risk 13% Index Ticker: Inception Date: February 28, 2005 S&P Launch Date: March 3, 2017 Benchmark: 65% MSCI ACWI / 35% BBgBarc Agg Bond Morningstar SecID: F00000YYHJ
TriVystaTM. Fixed Indexed Annuity. Navigating the retirement landscape.
 TriVystaTM Fixed Indexed Annuity Navigating the retirement landscape. TriVystaTM Navigating the retirement landscape. Fixed Indexed Annuity The retirement landscape is changing. The days of the secure
Grant Park Multi Alternative Strategies Fund. Why Invest? Profile Since Inception. Consider your alternatives. Invest smarter.
 Consider your alternatives. Invest smarter. Grant Park Multi Alternative Strategies Fund GPAIX Executive Summary November 206 Why Invest? 30 years of applied experience managing funds during multiple market
VelocityShares Equal Risk Weighted Large Cap ETF (ERW): A Balanced Approach to Low Volatility Investing. December 2013
: A Balanced Approach to Low Volatility Investing. December 2013") VelocityShares Equal Risk Weighted Large Cap ETF (ERW): A Balanced Approach to Low Volatility Investing December 2013 Please refer to Important Disclosures and the Glossary of Terms section of this material.
VelocityShares Equal Risk Weighted Large Cap ETF (ERW): A Balanced Approach to Low Volatility Investing December 2013 Please refer to Important Disclosures and the Glossary of Terms section of this material.
The Goldman Sachs Group, Inc. $ GS Momentum Builder Multi-Asset 5 ER Index-Linked Notes due
 Filed Pursuant to Rule 424(b)(2) Registration Statement No. 333-198735 The information in this preliminary prospectus supplement is not complete and may be changed. This preliminary prospectus supplement
2.5-Year Notes Linked to the BNP Paribas Multi Asset Diversified 5 Index
 2.5-Year Notes Linked to the BNP Paribas Multi Asset Diversified 5 Index An investment in the Notes may not be suitable for all investors and involves significant risks not associated with similar investments
AlphaSolutions Multi-Sector Fixed Income Model
 AlphaSolutions Multi-Sector Fixed Income Model A fixed income model based on trending and momentum strategies Portfolio Goals Primary: Seeks to invest in highranked sectors within the fixed income market
NOTICE TO INVESTORS: THE NOTES ARE SIGNIFICANTLY RISKIER THAN CONVENTIONAL DEBT INSTRUMENTS.
 PRICING SUPPLEMENT Filed Pursuant to Rule 424(b)(2) Registration Statement No. 333-208507 Dated January 27, 2017 Royal Bank of Canada Trigger Autocallable Contingent Yield Notes $3,556,500 Notes Linked
Client Conversations GLOBAL INVESTMENT COMMITTEE. Why does the Fed intend to raise interest rates, and what will it mean for my investments?
 Client Conversations Why does the Fed intend to raise interest rates, and what will it mean for my investments? Fed Will Likely Begin Raising Rates Soon As of November 10, 2015 We believe that the Fed
Wealth Management Perspectives
 Wealth Management Perspectives Covered Calls 1 Can Provide Downside Support CBOE S&P 500 Buy Write Index vs S&P 500 Dispersion of Returns Data as of June 1, 1989 to October 31, 2016 160 140 144 120 Count
QXRR Fund Profile. Liquidity. QuantX Risk Managed Real Return ETF. Allocation Category Real Assets & Commodities
 QRR Fund Profile Quant Risk Managed Real Return ETF Allocation Category Real Assets & Commodities Strategy Overview Quant Risk Managed Real Return is a liquid compliment to a core real asset allocation
J.P. Morgan Alternative Index Multi-Strategy 5 (USD)
") J.P. Morgan Alternative Index Multi-Strategy 5 (USD) Structured Investments January 18, 2010 Benefit or brief highlights Important Information The information contained in this document is for discussion
J.P. Morgan Alternative Index Multi-Strategy 5 (USD) Structured Investments January 18, 2010 Benefit or brief highlights Important Information The information contained in this document is for discussion
Credit Suisse AG ( Credit Suisse ), acting through its London branch
, acting through its London branch") The information in this preliminary pricing supplement is not complete and may be changed. This preliminary pricing supplement is not an offer to sell these securities and it is not soliciting an offer
The information in this preliminary pricing supplement is not complete and may be changed. This preliminary pricing supplement is not an offer to sell these securities and it is not soliciting an offer
Filed pursuant to Rule 433 Registration Statement Nos and FINANCIAL PRODUCTS FACT SHEET (U1627)
") Filed pursuant to Rule 433 Registration Statement Nos. 333 202913 and 333 180300 03 FINANCIAL PRODUCTS FACT SHEET (U1627) Offering Period: June 13, 2016 June 16, 2016 12.75% per annum Contingent Coupon
Filed pursuant to Rule 433 Registration Statement Nos. 333 202913 and 333 180300 03 FINANCIAL PRODUCTS FACT SHEET (U1627) Offering Period: June 13, 2016 June 16, 2016 12.75% per annum Contingent Coupon
Structured Investments
 J.P. Morgan Structured Products B.V. Pricing Supplement dated 22 April 2016 Guaranteed by JPMorgan Chase Bank, N.A. ISIN: XS1344606527 Structured Products Programme for the Common Code: 134460652 issuance
An introduction to Invesco s Equity Long/Short Strategies
 An introduction to Invesco s Equity Long/Short Strategies This marketing document is exclusively for use by Professional Clients and Financial Advisers in Germany. This document is not for consumer use,
THOMSON REUTERS - MCX INDIA COMMODITY INDICES (icomdex)
") THOMSON REUTERS - MCX INDIA COMMODITY INDICES (icomdex) METHODOLOGY January 2018 Published: 22 January 2018 2018 Thomson Reuters and Multi Commodity Exchange of India Ltd. All Rights Reserved. Thomson
THOMSON REUTERS - MCX INDIA COMMODITY INDICES (icomdex) METHODOLOGY January 2018 Published: 22 January 2018 2018 Thomson Reuters and Multi Commodity Exchange of India Ltd. All Rights Reserved. Thomson
THOMSON REUTERS - MCX INDIA COMMODITY INDICES (icomdex)
") THOMSON REUTERS - MCX INDIA COMMODITY INDICES (icomdex) METHODOLOGY September 2017 Published: 26 September 2017 2017 Thomson Reuters and Multi Commodity Exchange of India Ltd. All Rights Reserved. Thomson
THOMSON REUTERS - MCX INDIA COMMODITY INDICES (icomdex) METHODOLOGY September 2017 Published: 26 September 2017 2017 Thomson Reuters and Multi Commodity Exchange of India Ltd. All Rights Reserved. Thomson
Wells Fargo & Company
 PRICING SUPPLEMENT No. 284 dated February 15, 2013 (To Prospectus Supplement dated April 13, 2012 and Prospectus dated April 13, 2012) Wells Fargo & Company Medium-Term Notes, Series K Equity Linked Securities
US$ Senior Medium-Term Notes, Series C Contingent Risk Absolute Return Notes due December 31, 2021 Linked to the SPDR Dow Jones Industrial Average ETF
 The information in this preliminary pricing supplement is not complete and may be changed. This preliminary pricing supplement is not an offer to sell nor does it seek an offer to buy these securities
MULTI-ASSET DIVERSIFIED GLOBAL CERTIFICATE 11
 JANUARY 2018 MULTI-ASSET DIVERSIFIED GLOBAL CERTIFICATE 11 Gain exposure to a broadly diversified investment universe through the BNP Paribas Multi-Asset Diversified vol 8 USD FX Hedged Future Index Issued
J.P. Morgan Structured Investments
 Free Writing Prospectus Filed Pursuant to Rule 433 Registration Statement No. 333-155535 April 7, 2010 April 2010 J.P. Morgan Structured Investments T H E S & P 5 0 0 R I S K C O N T R O L 1 0 % E X C
DESCRIPTION OF THE CITI VOLATILITY BALANCED BETA (VIBE) EQUITY US GROSS TOTAL RETURN INDEX
 EQUITY US GROSS TOTAL RETURN INDEX") General DESCRIPTION OF THE CITI VOLATILITY BALANCED BETA (VIBE) EQUITY US GROSS TOTAL RETURN INDEX The Citi Volatility Balanced Beta (VIBE) Equity US Gross Total Return Index (the Index ) is an equity-linked
General DESCRIPTION OF THE CITI VOLATILITY BALANCED BETA (VIBE) EQUITY US GROSS TOTAL RETURN INDEX The Citi Volatility Balanced Beta (VIBE) Equity US Gross Total Return Index (the Index ) is an equity-linked
Union Bank, N.A. Market-Linked Certificates of Deposit, due June 28, 2018 (MLCD No. 283) Quarterly Capped Return Linked to the S&P 500 Index
 Quarterly Capped Return Linked to the S&P 500 Index") FINAL DISCLOSURE SUPPLEMENT Dated June 25, 2013 To the Disclosure Statement dated January 30, 2013 Union Bank, N.A. Market-Linked Certificates of Deposit, due June 28, 2018 (MLCD No. 283) Quarterly Capped
FINAL DISCLOSURE SUPPLEMENT Dated June 25, 2013 To the Disclosure Statement dated January 30, 2013 Union Bank, N.A. Market-Linked Certificates of Deposit, due June 28, 2018 (MLCD No. 283) Quarterly Capped
INDEX PERFORMANCE HISTORY MARKET CYCLE ANALYSIS*
 OVERVIEW Index Name: Helios Alpha Index Ticker: Inception Date: September 30, 2003 S&P Launch Date: March 3, 2017 Benchmark: MSCI ACWI Index INDEX PERFORMANCE HISTORY As of: October 31, 2018 DESCRIPTION
CALLABLE BONDS: FRIEND AND FOE GIOA INVESTMENT CONFERENCE George E.A. Barbar Mesirow Financial William M. Quinn, CFA FTN Financial
 CALLABLE BONDS: FRIEND AND FOE GIOA INVESTMENT CONFERENCE 2017 George E.A. Barbar Mesirow Financial William M. Quinn, CFA FTN Financial GSE Callables Market Update Quick Refresh Why? and Why Not? Friend
Notes Linked to the S&P Economic Cycle Factor Rotator Index due April 30, 2025
 The information in this preliminary pricing supplement is not complete and may be changed. This preliminary pricing supplement is not an offer to sell nor does it seek an offer to buy these securities
AlphaSolutions Sector Rotation Model
 AlphaSolutions Sector Rotation Model An investment model based on trending and momentum strategies Portfolio Goals Primary: Seeks long term growth of capital by investing in highranked U.S. Equity Sectors
Algo Trading System RTM
 Year Return 2016 15,17% 2015 29,57% 2014 18,57% 2013 15,64% 2012 13,97% 2011 55,41% 2010 50,98% 2009 48,29% Algo Trading System RTM 89000 79000 69000 59000 49000 39000 29000 19000 9000 2-Jan-09 2-Jan-10
QXMI Fund Profile. QuantX Risk Managed Multi-Asset Income ETF. Allocation Category Diversified Fixed Income / Credit
 Fund Profile Quant Allocation Category Diversified Fixed / Credit Strategy Overview Quant is a diversified income solution that targets higher levels of income and capital appreciation and reduced volatility
STRUCTURED INVESTMENTS Opportunities in U.S. Equities
 STRUCTURED INVESTMENTS Opportunities in U.S. Equities March 2014 Preliminary Terms No. 1,300 Registration Statement No. 333-178081 Dated February 28, 2014 Filed pursuant to Rule 433 Buffered Jump Securities
Man AHL Diversified (Guernsey) USD
 USD") Product fact sheet at 31 March 2014 NAV per unit USD 1.0849 Total NAV USD 243,448,833 Risk/return profile 1 The share class will aim to deliver target double-digit annualised return, for a target annualised
Product fact sheet at 31 March 2014 NAV per unit USD 1.0849 Total NAV USD 243,448,833 Risk/return profile 1 The share class will aim to deliver target double-digit annualised return, for a target annualised
$2,000,000, Year Fixed Rate Notes, Due 2021
 EXECUTION VERSION $2,000,000,000 10-Year Fixed Rate Notes, Due 2021 Terms used in this Pricing Supplement are described or defined in the attached Product Supplement. The Notes will have terms described
Maturity date: March 30, 2023 Underlying index:
 March 2018 Preliminary Terms No. 335 Registration Statement Nos. 333-221595; 333-221595-01 Dated February 28, 2018 Filed pursuant to Rule 433 STRUCTURED INVESTMENTS Opportunities in International Equities
BNP PARIBAS CATALYST SYSTEMATIC ALPHA INDEX
 BNP PARIBAS CATALYST SYSTEMATIC ALPHA INDEX The bank for a changing world INTRODUCING BNP Paribas Catalyst Systematic Alpha Index For more information about the index please visit: casaindex.bnpparibas.com