EPRA European Listed RE market
|
|
|
- Marjorie McCormick
- 5 years ago
- Views:
Transcription
1 EPRA European Listed RE market April 4th, 2016 Tel Aviv Ali Zaidi
2 What are REITs? REITs smell like real estate, look like bonds and walk like equity Greg Whyte, Analyst, Morgan Stanley
3 REAL ESTATE INVESTMENT TRUSTS REITs are focused real estate investment companies that are pre-dominantly active in owning and leasing commercial real estate. Regulated by the tax authorities, stock exchange and financial regulatory bodies. Exempted from corporate tax or subject to lower tax rates depending on the juristiction. Limits on leverage and property development Must pay out dividends upto 90% of net income Should limit themselves to the commercial leasing business with limited allowance for development and trading of property.
4 Brief History Established US (1960), Australia (1971) Netherlands (1969) Conversion - UK (2007), France (2003) Parallel Japan (2000), Singapore (2002) Hong Kong (2003), Germany (2007), Italy (2007). Potential REIT markets -India, China, Brazil, Nigeria Main Characteristics Ownership Assets Leverage Distribution
 Non-Listed www.")
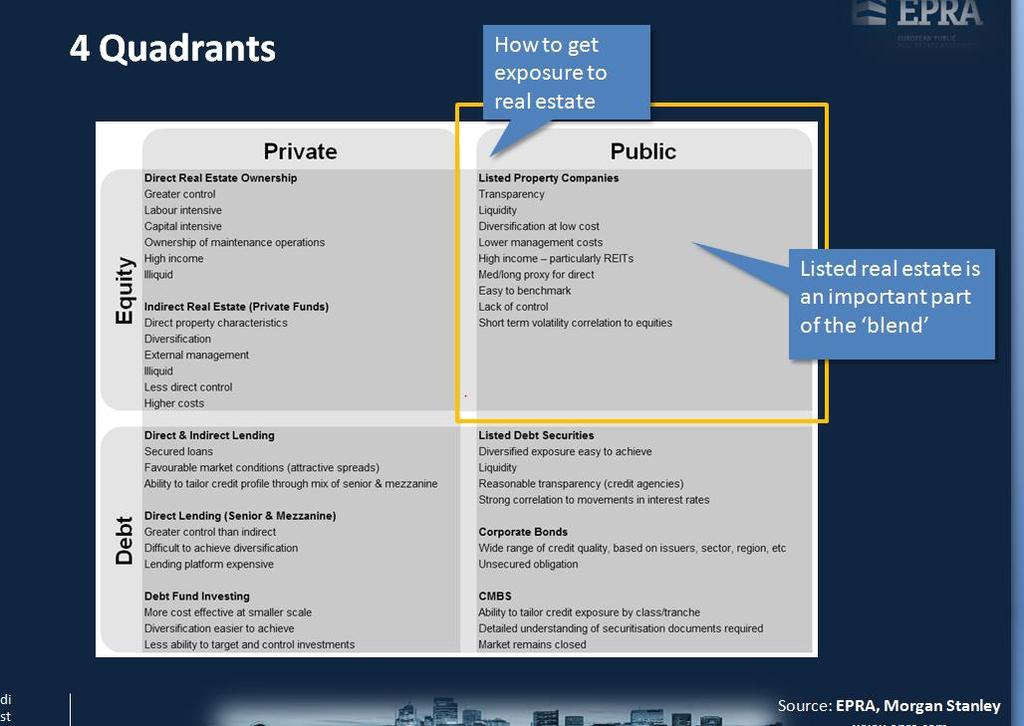
5 Real Estate Investment Real Estate Investment Direct Indirect Form of investment is determined by investor s specific requirements and constraints Listed (REITs) Non-Listed
6 Performance slide
7 Frequently used attributes of REITs Attractions vs. direct or unlisted: Same underlying real estate returns (over 3 years +) but with the benefit of: Higher Liquidity, provided by daily trading Lower cost Ability to refinance and recapitalize Opportunity for tactical exposure to real estate As an Asset Class: Low correlation and beta with other assets, providing diversification benefits Parallel asset pricing provides additional benchmark for pricing Inflation hedging qualities Superior initial income Greater security and visibility of long term cash flows


8 Transparency & Analysts Smaller = less transparent Company Country Analysts Unibail France 35 Land Secs UK 20 British Land UK 23 Hammerson UK 23 PSP Switzerland 12 Cap Shops UK 23 Swiss Prime Switzerland 6 Klepierre France 27 Derwent London UK analysts cover 105 Europe listed companies 8
9 FTSE EPRA/NAREIT Global Index Global Developed Global Emerging Global North America Developed EMEA Developed Asia Emerging Americas Emerging EMEA Emerging Asia Developed Europe Developed MEA Emerging Europe Emerging MEA 2 Countries 16 Countries 1 Country 6 Countries 5 Countries 5 Countries 3 Countries 8 Countries Sector Inc. offices, retail, etc. (9) Focus (Rental / Non- Rental) Status (REIT / Non- REIT) AIM Index Liquid 40 Dividend Specific Customized Index Variations 9
10 Regional Breakdowns Developed Emerging 18% 11% 26% North America Asia EMEA 15% 56% Asia Pacific EMEA Americas 74% Sources: FTSE, EPRA, NAREIT Data as of: December 31,

11 Global Index Asset Exposure EUR 1.9 Trillion Green = North America listed Blue = Europe listed Red = Asia-Pacific Based on the Top 15 Property Stocks in each region Region Companies No. Assets Top 10 Assets Asia- Pacific 76 5, Europe ,300 1,500 North America ,600 7,200

12 Commercial Real Estate Asset Class Country Commercial RE (BN USD) Listed (BN USD) Ratio North America 8, % Europe 8, % Asia 4, % Emerging Market 7, % Global 28,108 2, % Monthly Statistcal Bulletin EPRA
13 Listed RE Investors Investor Types Generalists - 15% Specialists - 85% Active - 90% Passive - 10% Institutional Equity investors who hold stake in REITs in a diversified portfolios. Hedge Funds Soverign wealth & Pension Funds Market level trackers Based on Developed Europe Index- excluding retail investors Instituitional Investors who invest in listed RE as part of their property investments Soverignwealth & pension funds Deidcated property investers and wealth managers Investment banks ETFs


14 Empirical Research Blended Real Estate Allocations Examines the impact of combining 70/30 UK unlisted and global listed real estate exposures Highlights liquidity, cost and ease of implementation advantages 1% p.a. annualised return enhancement 19% over 15 years Little impact on Sharpe Ratio - increased return covers volatility Rolling 12m total returns 14
15 Net Asset Value A simplified example of a listed company s share value Gross Assets 100m Debt 60m Shareholders Funds = Gross Assets less Debt 40m or Net Asset Value ( NAV ) Assume Share price 30p and Shares in issue 100m NAV per share = 40m / 100m = 40p Market capitalization = 100 x 30p or 0.3 = 30m Valuation NAV i.e. ((30p/40p)-1) x 100 = = 0.25 x 100 = 25% discount to NAV Listed companies tend to only issue equity when trading at a premium
16 NAV Valuations (March 2016) 50% Italy Finland Norway Austria UK Greece France Ireland Spain Switzerland Sweden Germany Belgium 30% 10% 1.3% 11.0% 12.7% 17.5% -10% -2.2% -1.8% -1.7% -18.9% -17.8% -16.3% -12.9% -30% -26.1% -33.8% -50% -70%
17 Net Asset Valuation Used more actively in Europe than other regions Simple and useful measure of spot value of a share Criticism Theoretical and does not account for transaction cost Based on reported value vs. daily pricing creating a lag Smoothing effect of valuations NAV works only under the going concern setting and will differ significantly for large and specialized companies


18 The European REITS Market Europe North America REITS, 98% Non-REITS, 40% REITS, 60% Europe lags behind the more advanced REITs market of North America
19 Differences in Europe Country Commercial RE (BN USD) Listed (BN USD) Ratio Germany 1, % Spain % Italy % UK 1, % France 1, % Monthly Statistcal Bulletin EPRA


20 European listed market The EPRA Europe Index Mcap EUR 187 billion Dividend yield 2.55% 13 countries 10 sectors Europe, 18% The EPRA Europe REITs index Mcap EUR 114 billion Dividend yield 3.05% 9 countries 10 sectors Data as of March 2016
21 Strong long term performance Europe Listed Real Estate Global Government Bonds Global General Equities 1 year -3.2% 2.9% -4.2% 3 year 17.4% 4.1% 8.7% 5 year 12.9% 4.8% 8.1% 10 year 2.9% 4.4% 4.9% 15 year 8.3% 4.3% 5.2% 20 year 9.6% 5.0% 6.7%

22 Strong Long Term Performance 15-year annualised total return in local currency 9.0% 8.8% 8.0% 7.0% 6.0% 6.2% 5.0% 5.5% 4.0% 3.0% 3.2% 2.0% 1.0% 1.7% 0.0% Europe Inflation Europe equities Europe bonds Europe real estate Europe listed real estate EPRA 2013 Sources: Eurostat, JP Morgan, FTSE, IPD, Bloomberg, EPRA, NAREIT Data as of: December 31,

23 Property Stocks Correlation vs. Equities Market Cohen & Steers Research Investigated the correlation between listed and direct property. The correlation significantly rises with investment horizon.
24 Listed Real Estate Correlation 100% 80% Correlation declines with equities and increases with direct real estate 60% EPRA Developed Europe Index 40% 20% Listed Real Estate vs. General Equities Listed Real Estate vs. Direct Real Estate 0% 3 Months 6 Months 1 Year 2 Years 3 Years 4 Years 5 Years 80% FTSE 100 vs. EPRA Europe 100% DTZ vs. EPRA Europe 60% 75% 40% 50% 20% 25% 0% 3 Months 6 Months 1 Year 2 Years 0% 3 Months 6 Months 1 Year 2 Years Sources: Bloomberg, DTZ, EPRA Data as of: 30 June


25 Attractive Dividend Yield 5-year average yield 5.0% 4.5% 4.5% 4.0% 3.5% 3.5% 3.6% 3.9% 3.0% 3.1% 2.5% 2.0% 1.5% 1.0% 0.5% 0.6% 0.0% ECB Refinancing rate FTSE Government Bonds >10 year Europe FTSE Corporate Bonds >10 year Europe FTSE All World Europe FTSE EPRA/NAREIT Developed Europe Index FTSE EPRA/NAREIT Developed Europe REITS Index Sources: ECB, FTSE, EPRA, NAREIT Data as of: December 31,


26 Allocations Investors allocations Value of financial assets 2010 hedge funds 6% international stocks 18% other assets 3% private equity 6% bonds 20% equities 33% fixed income 22% real estate 10% cash 1% real estate 14% private equity 1% McKinsey Survey domestic stocks 34% Room for allocation growth private debt 32%

27 Long run Dividends and REITs 10% Enactment year 9% 8% 1999 REITs Dividend Yield Non-REITs Dividend Yield 7% 6% 5% % 3% % 1% 0% Establishment of REITs in Europe
28 Feb-91 Dec-91 Oct-92 Aug-93 Jun-94 Apr-95 Feb-96 Dec-96 Oct-97 Aug-98 Jun-99 Apr-00 Feb-01 Dec-01 Oct-02 Aug-03 Jun-04 Apr-05 Feb-06 Dec-06 Oct-07 Aug-08 Jun-09 Apr-10 Feb-11 Dec-11 Oct-12 Aug-13 Jun-14 Apr-15 Feb-16 Graph 49: Relative Strength Indicator - Europe Overbought Neutral Oversold 0
29 The sensitivity of European publically-listed real estate to interest rates (Lee, Akimov, Stevenson) REITs are less sensitive to interest rate risk compared with real estate operating companies European real estate stocks, particularly REITs with low gearing, are less sensitive to interest rate volatility, though it is dependent to market conditions Asset structure is strongly related to long-term interest rate shocks Firms with high opportunities for growth are likely to be less exposed to long-term interest rates only since the financial crisis Firms with low leverage, low market-to-book ratio, high level of property investment and high liquidity are less sensitive to interest rate shocks
30 BLN Debt Maturity Schedule EPRA Europe % % 12% 10% 6.0 8% % 4% 2% %
31 BLN Capital raised & cost of debt EPRA Europe % % 7% 16.1% % 6% % 18.9% 8.0 4% % 11.8% 30.6% 3% % 61.3% 12.2% 3.6% 28.6% 36.8% 21.5% 21.8% 39.0% 2% 1% % Non-convertible Convertible Weighted coupon rate
32 Making the most of the low cost of capital EPRA Developed Europe Index constituents average 26% of total outstanding debt maturing in next 12 months EPRA European Constituents Debt Maturity Schedule (%) Low yield environment has enabled European companies to refinance at record low levels. The average maturity for EPRA Europe companies stands at 7.3 years % Debt Due in Next Twelve Months Debt Due in 1-5 Years Debt Due Thereafter Adjustments to Debt Schedule Based on the most recently reported debt maturity data. If values were not reported for the most recent period, most recent year values were used. Source: SNL Financial
33 Dividends: 3.58% growth in annual dividends over 15 years 5.0% % 160 Annualized compound dividend growth since 1999 = 3.58% 4.0% % % % % 60 Annualized compound CPI since 1999 = 1.84% 1.5% % % Dividend index (December 1999 = 100) 0.0%


34 Academic research Actively engage in calling for/promoting/funding academic research in the field of listed real estate EPRA Research Committee Investors (i.e. Pension Funds Boards) prefer academic research

35 Thank you
FTSE EPRA Nareit Developed Investment Focus Indices
 FTSE Russell Factsheet Investment Focus Data as at: 31 December 2018 Indices FEATURES bmktitle1 The FTSE EPRA Nareit Global Real Estate Index Series is designed to represent general trends in eligible
FTSE EPRA/NAREIT Developed Investment Focus Indices
 FTSE Russell Factsheet Investment Focus Indices FEATURES Data as at: 31 July 2018 bmktitle1 The FTSE EPRA/NAREIT Global Real Estate Index Series is designed to represent general trends in eligible real
FTSE EPRA/NAREIT Developed REITs and Non-
 FTSE Russell Factsheet and Non- Data as at: 31 August 2018 Indices FEATURES bmktitle1 The FTSE EPRA/NAREIT Global Real Estate Index Series is designed to represent general trends in eligible real estate
FTSE EPRA Nareit Developed REITs and Non- REITs Indices
 FTSE Russell Factsheet FTSE EPRA Nareit Developed and Non- Indices FEATURES Data as at: 31 October 2018 bmktitle1 The FTSE EPRA Nareit Global Real Estate Index Series is designed to represent general trends
Sponda CMD 15 May 2013 Helsinki
 Sponda CMD 15 May Helsinki Matt Fletcher, Investor Outreach Maikel Speelman, Research & Indices 1 Strategy Research, Indices & Investor Outreach Reporting & Regulation Events/Networking Member No. % Property
Mercados Globales Larrain Vial
 Mercados Globales Larrain Vial Investec Asset Management Thanos Papasavvas Head of Currency Management March 2007 Currency Management an alternative source of alpha This presentation has been prepared
JP Morgan Diversified Factor Global Developed Equity Index
 FTSE Russell Factsheet JP Morgan Diversified Factor Global Developed Equity Index FEATURES Data as at: 31 January 2019 bmktitle1 The JP Morgan Diversified Factor Indexes are comprised of large and mid-cap
REITs in Europe Industry Overview
 REITs in Europe Industry Overview Tobias Steinmann & Laurent Ternisien Lisbon, December 6th, 2016 EPRA: European Public Real Estate Association Member No. % Property Companies & REITs 122 55 Investors*
San Francisco Retiree Health Care Trust Fund Education Materials on Public Equity
 M E K E T A I N V E S T M E N T G R O U P 5796 ARMADA DRIVE SUITE 110 CARLSBAD CA 92008 760 795 3450 fax 760 795 3445 www.meketagroup.com The Global Equity Opportunity Set MSCI All Country World 1 Index
EPRA Total Markets Table. June 2017
 EPRA Total Markets Table June 2017 Size of the total commercial real estate market Contents Total Market Table Economic Regions (Continued) Commentary 1 Eurozone (USD) 10 Market Activity & Corporate Actions
A CASE FOR GLOBAL LISTED REAL ESTATE SECURITIES IN A MIXED ASSET PORTFOLIO
 A CASE FOR GLOBAL LISTED REAL ESTATE SECURITIES IN A MIXED ASSET PORTFOLIO MAY 2015 EXECUTIVE SUMMARY Access to Growing Global Markets The number of listed real estate companies world-wide continues to
FTSE Developed ex US Comprehensive Factor Index
 FTSE Russell Factsheet Comprehensive Index FEATURES Data as at: 31 October 2018 bmktitle1 The Comprehensive Index is a benchmark designed to capture exposure to five factors Quality, Value, Momentum, Low
FTSE Global All Cap Index
 FTSE Russell Factsheet FTSE Global All Cap Index bmktitle1 The FTSE Global All Cap Index is a market-capitalisation weighted index representing the performance of the large, mid and small cap stocks globally.
DIVERSIFICATION. Diversification
 Diversification Helps you capture what global markets offer Reduces risks that have no expected return May prevent you from missing opportunity Smooths out some of the bumps Helps take the guesswork out
FTSE Global All Cap Index
 FTSE Russell Factsheet FTSE Global All Cap Index bmktitle1 The FTSE Global All Cap Index is a market-capitalisation weighted index representing the performance of the large, mid and small cap stocks globally.
FTSE Global Equity Index Series
 FTSE Global Equity Index Series THE FTSE GLOBAL EQUITY INDEX SERIES With an unparalleled record of flexibility, transparency, consistent accuracy and the ability to meet any mandate, FTSE indices are already
The role of inflation-linked bonds. September 2004
 The role of inflation-linked bonds September 2004 Table of contents Who we are & our experience Inflation linked bonds: characteristics Performance and risks Applications in a portfolio Simulations and
JPMorgan Europe Strategic Dividend Fund
 AVAILABLE FOR PUBLIC CIRCULATION NEW JPMorgan Europe Strategic Dividend Fund Asset Management Company of the Year, Asia + Important information 1. The Fund invests at least 70% in equity securities of
FTSE Global Small Cap Index
 FTSE Russell Factsheet FTSE Global Small Cap Index bmktitle1 The FTSE Global Small Cap Index is derived from FTSE's flagship Global Equity Series universe, which comprises around 7,000 securities worldwide,
DFA Global Equity Portfolio (Class F) Quarterly Performance Report Q2 2014
 Quarterly Performance Report Q2 2014") DFA Global Equity Portfolio (Class F) Quarterly Performance Report Q2 2014 This presentation has been prepared by Dimensional Fund Advisors Canada ULC ( DFA Canada ), manager of the Dimensional Funds.
DFA Global Equity Portfolio (Class F) Quarterly Performance Report Q2 2014 This presentation has been prepared by Dimensional Fund Advisors Canada ULC ( DFA Canada ), manager of the Dimensional Funds.
DFA Global Equity Portfolio (Class F) Performance Report Q2 2017
 Performance Report Q2 2017") DFA Global Equity Portfolio (Class F) Performance Report Q2 2017 This presentation has been prepared by Dimensional Fund Advisors Canada ULC ( DFA Canada ), manager of the Dimensional Funds. This presentation
DFA Global Equity Portfolio (Class F) Performance Report Q2 2017 This presentation has been prepared by Dimensional Fund Advisors Canada ULC ( DFA Canada ), manager of the Dimensional Funds. This presentation
DFA Global Equity Portfolio (Class F) Performance Report Q3 2018
 Performance Report Q3 2018") DFA Global Equity Portfolio (Class F) Performance Report Q3 2018 This presentation has been prepared by Dimensional Fund Advisors Canada ULC ( DFA Canada ), manager of the Dimensional Funds. This presentation
DFA Global Equity Portfolio (Class F) Performance Report Q3 2018 This presentation has been prepared by Dimensional Fund Advisors Canada ULC ( DFA Canada ), manager of the Dimensional Funds. This presentation
DFA Global Equity Portfolio (Class F) Performance Report Q4 2017
 Performance Report Q4 2017") DFA Global Equity Portfolio (Class F) Performance Report Q4 2017 This presentation has been prepared by Dimensional Fund Advisors Canada ULC ( DFA Canada ), manager of the Dimensional Funds. This presentation
DFA Global Equity Portfolio (Class F) Performance Report Q4 2017 This presentation has been prepared by Dimensional Fund Advisors Canada ULC ( DFA Canada ), manager of the Dimensional Funds. This presentation
FTSE Global Small Cap
 FTSE Russell Factsheet FTSE Global Small Cap ex US Index Data as at: 31 August 2018 bmktitle1 The FTSE Global Small Cap ex US Index is a market-capitalization weighted index representing the performance
DFA Global Equity Portfolio (Class F) Performance Report Q3 2015
 Performance Report Q3 2015") DFA Global Equity Portfolio (Class F) Performance Report Q3 2015 This presentation has been prepared by Dimensional Fund Advisors Canada ULC ( DFA Canada ), manager of the Dimensional Funds. This presentation
DFA Global Equity Portfolio (Class F) Performance Report Q3 2015 This presentation has been prepared by Dimensional Fund Advisors Canada ULC ( DFA Canada ), manager of the Dimensional Funds. This presentation
RUSSIAN ECONOMIC OUTLOOK AND MONETARY POLICY CHALLENGES RUSSIAN ECONOMIC OUTLOOK AND MONETARY POLICY CHALLENGES. Bank of Russia.
 RUSSIAN ECONOMIC OUTLOOK AND MONETARY POLICY CHALLENGES Bank of Russia July 218 < -1% -1-9% -9-8% -8-7% -7-6% -6-5% -5-4% -4-3% -3-2% -2-1% -1 % 1% 1 2% 2 3% 3 4% 4 5% 5 6% 6 7% 7 8% 8 9% 9 1% 1 11% 11
July 2012 Chartbook The Halftime Report
 Average Daily $VA LUE Traded ($Billions ) $Billions (212 ( US China Japan CHI-X London Hong Kong Germany France Canada Korea Australia Brazil Taiwan Spain India Italy $billions Switzerland Sweden Amsterdam
FTSE All-World High Dividend Yield
 FTSE Russell Factsheet High Dividend Index Data as at: 31 August 2018 bmktitle1 The High Dividend Index comprises stocks that are characterized by higherthan-average dividend yields, and is based on the
NORTH AMERICAN UPDATE
 NORTH AMERICAN UPDATE December 6 th, 2018 INNOVATION INSIGHT GROWTH SINCE 1968 TOUGH YEAR FOR RETURNS AROUND THE WORLD Index Year-to-date Performance MSCI World -1.2% MSCI USA 3.9% MSCI Canada -3.9% MSCI
FTSE All-World GDP Weighted
 FTSE Russell Factsheet FTSE All-World GDP Weighted Indices Data as at: 31 August 2018 bmktitle1 The FTSE GDP Weighted Index Series is designed to reflect the performance of constituent companies in an
HOW DO YOU DEFINE YOUR BORDERS? THE MODERN INDEX STRATEGY. msci.com
 HOW DO YOU DEFINE YOUR BORDERS? THE MODERN INDEX STRATEGY msci.com MSCI DELIVERS THE MODERN INDEX STRATEGY The MSCI EAFE Index is designed to represent the performance of large- and mid-cap securities
FTSE All-World GDP Weighted
 FTSE Russell Factsheet FTSE All-World GDP Weighted Indices Data as at: 30 April 2018 bmktitle1 The FTSE GDP Weighted Index Series is designed to reflect the performance of constituent companies in an index
FTSE Environmental Opportunities Index Series
 FTSE Russell Factsheet Opportunities Index Series Data as at: 29 June 2018 bmktitle1 The Opportunities Index Series measures the performance of global companies that have significant involvement in environmental
Country Size Premiums and Global Equity Portfolio Structure
 RESEARCH Country Size Premiums and Global Equity Portfolio Structure This paper examines the relation between aggregate country equity market capitalizations and country-level market index returns. Our
Emerging market equities
 November 22, 2010 Emerging market equities Jean-Pierre Talon, FSA, FICA Introduction Focus of this presentation is to set out the rationale for a strategic bias toward emerging market equities Consider
Quarterly Investment Update First Quarter 2017
 Quarterly Investment Update First Quarter 2017 Market Update: A Quarter in Review March 31, 2017 CANADIAN STOCKS INTERNATIONAL STOCKS Large Cap Small Cap Growth Value Large Cap Small Cap Growth Value Emerging
MFS Investment Management 500 Boyleston Street Boston, Massachusetts 02116
 Investment Management 500 Boyleston Street Boston, Massachusetts 02116 MANAGER'S INVESTMENT PROCESS RISK CONSIDERATIONS Bottom-up idea generation within a sector-neutral framework, managed by a team of
NASDAQ Global Index. More information about the Index can be found at
 NASDAQ Global Index The NASDAQ Global Index is a float adjusted market capitalization-weighted index designed to track the performance of global equities covering over 98% of the entire listed market capitalization
BlackRock Developed World Index Sub-Fund
 KEY INVESTOR INFORMATION BlackRock Developed World Index Sub-Fund A sub-fund of BlackRock Index Selection Fund Objectives and Investment Policy This document provides you with key investor information
Summit Strategies Group
 May, 208 US Equity: All Cap Russell 000 Index 2.82.4 2.55 5.06 0.72 2.85 2.6 9.2 Dow Jones US Total Stock Market Index 2.8.5 2.57 5.09 0.68 2.78 2.58 9.27 US Equity: Large Cap Russell 000 Index 2.55 0.57
Summit Strategies Group
 June 0, 208 US Equity: All Cap Russell 000 Index 0.65.89.22 4.78.58.29.0 0.2 Dow Jones US Total Stock Market Index 0.66.87.25 4.79.56.22 2.98 0.28 US Equity: Large Cap Russell 000 Index 0.65.57 2.85 4.54.64.7.2
Summit Strategies Group
 August, 208 US Equity: All Cap Russell 000 Index.5 7.65 0.9 20.25 5.86 4.25 5.50 0.89 Dow Jones US Total Stock Market Index.48 7.64 0.4 20.26 5.82 4.2 5.45 0.94 US Equity: Large Cap Russell 000 Index.45
Summit Strategies Group
 October, 208 US Equity: All Cap Russell 000 Index -7.6 -.95 2.4 6.60.27 0.8.8.5 Dow Jones US Total Stock Market Index -7.4-4.04 2.9 6.56.24 0.76.75.6 US Equity: Large Cap Russell 000 Index -7.08 -.5 2.67
IT ONLY TAKES ONE INDEX TO CAPTURE THE WORLD THE MODERN INDEX STRATEGY. msci.com
 IT ONLY TAKES ONE INDEX TO CAPTURE THE WORLD THE MODERN INDEX STRATEGY msci.com MSCI DELIVERS THE MODERN INDEX STRATEGY The MSCI ACWI Index, MSCI s flagship global equity benchmark, is designed to represent
Global Select International Select International Select Hedged Emerging Market Select
 International Exchange Traded Fund (ETF) Managed Strategies ETFs provide investors a liquid, transparent, and low-cost avenue to equities around the world. Our research has shown that individual country
Calamos Phineus Long/Short Fund
 Calamos Phineus Long/Short Fund Performance Update SEPTEMBER 18 FOR INVESTMENT PROFESSIONAL USE ONLY Why Calamos Phineus Long/Short Equity-Like Returns with Superior Risk Profile Over Full Market Cycle
INVESTMENT MARKET UPDATE UBC FACULTY PENSION PLAN
 INVESTMENT MARKET UPDATE UBC FACULTY PENSION PLAN MIKE LESLIE, FACULTY PENSION PLAN NEIL WATSON, LEITH WHEELER FEBRUARY 11, 2015 Presenters Mike Leslie Executive Director, Investments Faculty Pension Plan
NORTHERN EQUITY INDEX FUNDS YOUR PROSPECTUS INSIDE
 NORTHERN EQUITY INDEX FUNDS YOUR PROSPECTUS INSIDE JULY 31, 2009 NORTHERN FAMILY OF FUNDS RISK/REWARD POTENTIAL When building a sound Northern Funds investment strategy, you ll want to select a mix of
Second estimate for the third quarter of 2008 EU27 current account deficit 39.5 bn euro 19.3 bn euro surplus on trade in services
 STAT/09/12 22 January 2009 Second estimate for the third quarter of 20 EU27 current account deficit 39.5 bn euro 19.3 bn euro surplus on trade in According to the latest revisions1, the EU272 external
Decomposing volatility
 MARKET RESEARCH Decomposing volatility FTSE EPRA/NAREIT Developed Europe Index S e p t e m b e r 217 Content table Executive Summary 3 Indices & stocks: Volatility evolution and key facts 3 Data and Methodoogy
INVESTMENT MARKET UPDATE UBC FACULTY PENSION PLAN
 INVESTMENT MARKET UPDATE UBC FACULTY PENSION PLAN MIKE LESLIE, FACULTY PENSION PLAN NEIL WATSON, LEITH WHEELER FEBRUARY 12, 2014 Presenters Mike Leslie Executive Director, Investments Faculty Pension Plan
DEALING AND TREASURY SERVICE
 FEE SCHEDULE - STONEHAGE FLEMING DEALING AND TREASURY SERVICE ASSET CLASS Below does not include any third party fees, VAT, stamp duty, taxes or charges FOREIGN EXCHANGE UP TO SPOT Band in GBP % of Spot
FTSE All-World ex Fossil Fuels Index Series
 FTSE Russell Factsheet FTSE All-World ex Fossil Fuels Index Series Data as at: 31 August 2018 bmktitle1 Market participants are increasingly looking to manage carbon exposure in their investments, and
Summit Strategies Group
 US Equity: All Cap Russell 000 Index -.69 2.40.9 6.22 0.59 4.7 2.79 9.78 Dow Jones US Total Stock Market Index -.70 2.4.4 6.2 0.55 4.2 2.76 9.8 US Equity: Large Cap Russell 000 Index -.67 2.75.62 6.70
Summit Strategies Group
 US Equity: All Cap Russell 000 Index.72 7.7 5.67 26.29 9.92.85.87 7.64 Dow Jones US Total Stock Market Index - - - - - - - - US Equity: Large Cap Russell 000 Index.87 7.95 5.96 25.5 0.9.94.9 7.69 Russell
FTSE Renaissance Global IPO
 FTSE Russell Factsheet FTSE Renaissance Global IPO Index Series Data as at: 31 January 2019 bmktitle1 FTSE and Renaissance Capital International LLC have developed the FTSE Renaissance Global IPO Index
FTSE All-World ex Fossil Fuels Index Series
 FTSE Russell Factsheet FTSE All-World ex Fossil Fuels Index Series Data as at: 31 October 2018 bmktitle1 Market participants are increasingly looking to manage carbon exposure in their investments, and
FTSE4Good Index Series
 FTSE Russell Factsheet Index Series bmktitle1 Launched in 2001, the Index Series is a series of benchmark and tradable indexes for ESG (Environmental, Social and Governance) investors. The index series
Total Markets Table Q3-2017
 Total s Table Q3-2017 Contents Total s Table Developed s vs. EPRA Index Commentary 1 Europe 15 Activity & Corporate Actions 2 Middle East & Africa 15 North America 16 of Developed s Asia-Pacific 16 Europe
AllianceBernstein: Tradition and Change Citigroup Financial Services Conference
 March 10, 2011 AllianceBernstein: Tradition and Change Citigroup Financial Services Conference David A. Steyn Chief Operating Officer Cautions Regarding Forward-Looking Statements Certain statements provided
Summit Strategies Group
 April 0, 205 US Equity: All Cap Russell 000 Index 0.45 5.9 2.26 2.74 6.86 4. 8.68 8.66 Dow Jones US Total Stock Market Index 0.46 5.9 2.27 2.67 6.78 4.7 8.78 8.8 US Equity: Large Cap Russell 000 Index
HOW DO YOU DEFINE YOUR BORDERS? THE MODERN INDEX STRATEGY. msci.com
 HOW DO YOU DEFINE YOUR BORDERS? THE MODERN INDEX STRATEGY msci.com MSCI DELIVERS THE MODERN INDEX STRATEGY The MSCI EAFE Index is designed to represent the performance of large- and mid-cap securities
Quarterly Investment Update First Quarter 2018
 Quarterly Investment Update First Quarter 2018 Dimensional Fund Advisors Canada ULC ( DFA Canada ) is not affiliated with [insert name of Advisor]. DFA Canada is a separate and distinct company. Market
Endowment Management Review
 Endowment Management Review Asset Allocation Review UNIVERSITY LVX 1861 SIT WASHINGTON OF July 19, 2007 Published by the Treasury Office July 2007 Annual Asset Allocation Review Table of Contents Summary
1.1. STOXX TOTAL MARKET INDICES
 STOXX INDEX LIST A-Z 1. TOTAL MARKET INDICES 1/14 1.1. STOXX TOTAL MARKET INDICES Regional indices STOXX BRIC TMI STOXX Developed and Emerging Markets TMI STOXX Developed Markets TMI STOXX Emerging Markets
Market Overview As of 1/31/2019
 Asset Class Leadership Periodic Table Worst Best 78.51 58.21 41.45 37.21 34.47 27.45 26.46 20.58 19.69 29.09 27.58 2 18.88 16.71 15.51 15.12 15.06 11.15 7.84 7.28 4.98 2.64 2.11 0.39-2.91-5.50-13.71 20.14
Summit Strategies Group
 October, 208 US Equity: All Cap Russell 000 Index -7.6 -.95 2.4 6.60.27 0.8.8.5 Dow Jones US Total Stock Market Index -7.4-4.04 2.9 6.56.24 0.76.75.6 US Equity: Large Cap Russell 000 Index -7.08 -.5 2.67
HSBC FTSE EPRA/NAREIT DEVELOPED UCITS ETF Supplement. 17 February 2017
 HSBC FTSE EPRA/NAREIT DEVELOPED UCITS ETF Supplement 17 February 2017 The Company and the Directors of HSBC ETFs PLC (the Directors ) listed in the Prospectus in the Management and Administration section,
Market Overview As of 4/30/2018
 Asset Class Leadership Periodic Table Worst Best 5.24-26.16-28.92-36.85-37.00-37.34-38.44-38.54-45.53 78.51 58.21 41.45 37.21 34.47 27.45 26.46 20.58 19.69 29.09 27.58 24.50 18.88 16.71 15.51 15.12 15.06
Market Overview As of 11/30/2018
 Asset Class Leadership Periodic Table Worst Best 5.24-26.16-28.92-36.85-37.00-37.34-38.44-38.54-45.53 78.51 58.21 41.45 37.21 34.47 27.45 26.46 20.58 19.69 29.09 27.58 24.50 18.88 16.71 15.51 15.12 15.06
1000G 1000G HY
 Asset Class Leadership Periodic Table Worst Best 5.24-26.16-28.92-36.85-37.00-37.34-38.44-38.54-45.53 78.51 58.21 41.45 37.21 34.47 27.45 26.46 20.58 19.69 29.09 27.58 24.50 18.88 16.71 15.51 15.12 15.06
Global Dividend-Paying Stocks: A Recent History
 RESEARCH Global Dividend-Paying Stocks: A Recent History March 2013 Stanley Black RESEARCH Senior Associate Stan earned his PhD in economics with concentrations in finance and international economics from
Market Overview As of 8/31/2017
 Asset Class Leadership Periodic Table Worst Best 39.42 16.65 11.81 7.05 6.97 5.49 1.87-0.17-9.78 5.24-26.16-28.92-36.85-37.00-37.34-38.44-38.54-45.53 78.51 58.21 41.45 37.21 34.47 27.45 26.46 20.58 19.69
Market Overview As of 10/31/2017
 Asset Class Leadership Periodic Table Worst Best 39.42 16.65 11.81 7.05 6.97 5.49 1.87-0.17-9.78 5.24-26.16-28.92-36.85-37.00-37.34-38.44-38.54-45.53 78.51 58.21 41.45 37.21 34.47 27.45 26.46 20.58 19.69
1.1. STOXX TOTAL MARKET INDICES
 1. BROAD TOTAL MARKET INDICES/BENCHMARK INDICES, EQUAL WEIGHT INDICES 1/15 1.1. STOXX TOTAL MARKET INDICES Regional indices STOXX BRIC TMI STOXX Developed and Emerging Markets TMI STOXX Developed Markets
FTSE Core Infrastructure 50/50 Indexes
 FTSE Russell Factsheet FTSE Core Indexes Data as at: 31 December 2018 bmktitle1 The Index and Index give participants an industry-defined interpretation of infrastructure and adjust the exposure to certain
Summit Strategies Group
 As of December 3, 203 US Equity: All Cap Russell 3000 Index 2.64 0.0 33.55 33.55 6.24 8.7 6.50 7.88 7.09 Dow Jones US Total Stock Market Index 2.63 0. 33.47 33.47 6.23 8.86 6.68 8.0 6.90 US Equity: Large
The Scientific Beta Report
 The Scientific Beta Report SCIU United States SCID Europe SCIX Asia ex-japan SCIJ Japan Don t just be smart. Be Scientific. OVERVIEW The ETFs are a family of funds that provide core equity exposure to
Wells Fargo Target Date Funds
 All information is as of 9-30-17 unless otherwise indicated. Overview General fund information Portfolio managers: Kandarp Acharya, CFA, FRM; Christian Chan, CFA; and Petros Bocray, CFA, FRM Subadvisor:
Trends and opportunities across regions: Europe
 Trends and opportunities across regions: Europe Monday, 6 June 2011 Head of Institutional Fixed Income Europe Three themes shaping global opportunities I. Long term: Spheres of influence are shifting among
First Quarter 2018 (as of December 31, 2017) The Factor Report. What s driving factor performance?
 The Factor Report. What s driving factor performance?") First Quarter 2018 (as of December 31, 2017) The Factor Report What s driving factor performance? Table of Contents Page Q4 Summary..................................................................................
First Quarter 2018 (as of December 31, 2017) The Factor Report What s driving factor performance? Table of Contents Page Q4 Summary..................................................................................
RECENT EVOLUTION AND OUTLOOK OF THE MEXICAN ECONOMY BANCO DE MÉXICO OCTOBER 2003
 OCTOBER 23 RECENT EVOLUTION AND OUTLOOK OF THE MEXICAN ECONOMY BANCO DE MÉXICO 2 RECENT DEVELOPMENTS OUTLOOK MEDIUM-TERM CHALLENGES 3 RECENT DEVELOPMENTS In tandem with the global economic cycle, the Mexican
Nimbus 9 PORTFOLIO MANAGEMENT
 For Qualified Domestic Institutional Investors Only. Not for further distribution. Nimbus 9 STRATEGY HIGHLIGHTS As of 31 March 2018 Global Real Estate Equity Strategy Total Global Real Estate Strategy
FTSE Eurozone GDP Weighted
 FTSE Russell Factsheet an GDP Indices Data as at: 29 December 2017 bmktitle1 The FTSE GDP Index Series is designed to reflect the performance of constituent companies in an index where country weightings
NASDAQ OMX Green Economy Europe USD
 NASDAQ OMX Green Economy Europe USD The NASDAQ OMX Green Economy Europe Index is a market-capitalization weighted designed to track the performance of companies across the spectrum of industries most closely
How Hedging Can Substantially Reduce Foreign Stock Currency Risk
 Possible losses from changes in currency exchange rates are a risk of investing unhedged in foreign stocks. While a stock may perform well on the London Stock Exchange, if the British pound declines against
1. Global Money Market Fund
 1. Global Money Market Fund Conservative investment approach Higher return than overseas bank account - minimal risk, lower entry levels Focus is on retention of capital Invests in short-term interest
Auscap Long Short Australian Equities Fund Newsletter June 2018
 Auscap Long Short Australian Equities Fund Auscap Asset Management Limited Disclaimer: This newsletter contains performance figures and information in relation to the Auscap Long Short Australian Equities
FTSE Eurozone GDP Weighted
 FTSE Russell Factsheet an GDP Indices Data as at: 30 April 2018 bmktitle1 The FTSE GDP Index Series is designed to reflect the performance of constituent companies in an index where country weightings
FTSE Global Equity Index Series
 Methodology overview FTSE Global Equity Index Series Built for the demands of global investors Indexes for a global market The FTSE Global Equity Index Series (FTSE GEIS) includes objective, rules-based
FTSE4Good Index Series
 FTSE Russell Factsheet Index Series bmktitle1 Launched in 2001, the Index Series is a series of benchmark and tradable indexes for ESG (Environmental, Social and Governance) investors. The index series
Less is More: Private Equity Investments` Benefits
 Real Estate as a Strategic Asset Class The Benefits of Illiquid Investments Real estate, a key asset class in a portfolio, can offer stable income returns, partial protection against inflation, and good
JULY 31, ANNUAL REPORT
 JULY 31, 2017 2017 ANNUAL REPORT ishares Trust ishares Currency Hedged MSCI Europe Small-Cap ETF HEUS BATS ishares Edge MSCI Min Vol EAFE Currency Hedged ETF HEFV BATS ishares Edge MSCI Min Vol EAFE ETF
FTSE Core Infrastructure 50/50 Indexes (AUD)
") FTSE Russell Factsheet FTSE Core Indexes (AUD) Data as at: 28 February 2019 bmktitle1 The Index and Index give participants an industry-defined interpretation of infrastructure and adjust the exposure
FTSE Russell Factsheet FTSE Core Indexes (AUD) Data as at: 28 February 2019 bmktitle1 The Index and Index give participants an industry-defined interpretation of infrastructure and adjust the exposure
Quarterly Investment Update
 Quarterly Investment Update Third Quarter 2017 Dimensional Fund Advisors Canada ULC ( DFA Canada ) is not affiliated with The CM Group DFA Canada is a separate and distinct company Market Update: A Quarter
FTSE Core Infrastructure Indexes
 FTSE Russell Factsheet FTSE Core Infrastructure Indexes Data as at: 30 April 2018 bmktitle1 The FTSE Infrastructure Index Series is a comprehensive set of nine cap-weighted indexes, diversified across
GOVERNMENT PENSION FUND GLOBAL
 GOVERNMENT PENSION FUND GLOBAL THIRD QUARTER 218 26 OCTOBER 218 26/1/218 Market value increased to 8,478 billion kroner Billions of kroner. As at 3.9.218 9, Value Percentage share 9, 8, Equity investments
What s Inside. Geographic Analysis. Constituent Analysis. Performance as of 12/31/16. Three Month
 COHEN & STEERS GLOBAL REALTY MAJORS ETF QUARTERLY SCORECARD GRI ETF Stats Ticker: GRI CUSIP: 00162Q 106 NAV per Share^: $41.94 Number of Holdings: 75 Dividend Freqency: Quarterly Gross Expense Ratio: 0.55%
NCREIF Fall Conference 2011
 Courtland dpartners, Ld Ltd. NCREIF Fall Conference 2011 November 9, 2011 Courtland Partners, Ltd. 200 Public Square, Suite 2530 10866 Wilshire Blvd., Suite 830 Cleveland, OH 44114 Los Angeles, CA 90024
Deutsche Global Infrastructure Fund (TOLLX)
") Global Infrastructure Fund (TOLLX) A step beyond MLPs Important risk information Any fund that concentrates in a particular segment of the market will generally be more volatile than a fund that invests
Global Infrastructure Fund (TOLLX) A step beyond MLPs Important risk information Any fund that concentrates in a particular segment of the market will generally be more volatile than a fund that invests