BUFFALO WILD WINGS, INC.
|
|
|
- Homer Oliver
- 6 years ago
- Views:
Transcription

1
2

3

4
5 UNITED STATES SECURITIES AND EXCHANGE COMMISSION Washington, DC FORM 10-K È Annual Report Pursuant to Section 13 or 15(d) of the Securities Exchange Act of 1934 for the fiscal year ended December 26, 2004 or Transition Report Under Section 13 or 15(d) of the Securities Exchange Act of 1934 for the transition period from to. Commission File Number: BUFFALO WILD WINGS, INC. (Exact name of registrant as specified in its charter) Minnesota No (State or Other Jurisdiction of (IRS Employer Incorporation or Organization) Identification No.) 1600 Utica Avenue South, Suite 700, Minneapolis, MN (Address of Principal Executive Offices) Registrant s telephone number (952) Securities registered under Section 12(b) of the Exchange Act: None Securities registered under Section 12(g) of the Exchange Act: Common Stock, no par value Indicate by check mark whether the registrant (1) filed all reports required to be filed by Section 13 or 15(d) of the Exchange Act during the past 12 months (or for such shorter period that the registrant was required to file such reports), and (2) has been subject to such filing requirements for the past 90 days. YES È NO Indicate by check mark if there is no disclosure of delinquent filers in response to Item 405 of Regulation S-K contained in this form, and no disclosure will be contained, to the best of registrant s knowledge, in definitive proxy or information statements incorporated by reference in Part III of this Form 10-K or any amendment to this Form 10-K. È Indicate by check mark whether the registrant is an accelerated filer (as defined in Exchange Act Rule 12b-2). YES È NO The aggregate market value of the voting stock held by non-affiliates was $197 million based on the closing sale price of the Company s Common Stock as reported on the NASDAQ Stock Market on June 25, The number of shares outstanding of the registrant s common stock as of March 16, 2005: 8,421,570 shares. DOCUMENTS INCORPORATED BY REFERENCE Portions of the Proxy Statement for the 2005 Annual Meeting of Shareholders are incorporated by reference into Part III of this report.
6 TABLE OF CONTENTS PART I Page Item 1. Business... 3 Item 2. Properties Item 3. Legal Proceedings PART II Item 5. Market for Registrant s Common Equity, Related Stockholder Matters and Issuer Purchases of Equity Securities Item 6. Selected Financial Data Item 7. Management s Discussion and Analysis of Financial Condition and Results of Operations Item 7A. Quantitative and Qualitative Disclosures About Market Risk Item 8. Financial Statements and Supplementary Data Item 9. Changes in and Disagreements with Accountants on Accounting and Financial Disclosure Item 9A. Controls and Procedures Item 9B. Other Information PART III Item 10. Directors and Executive Officers of the Registrant Item 11. Executive Compensation Item 12. Security Ownership of Certain Beneficial Owners and Management and Related Stockholder Matters Item 13. Certain Relationships and Related Transactions Item 14. Principal Accountant Fees and Services PART IV Item 15. Exhibits and Financial Statement Schedules Signatures
7 PART I ITEM 1. BUSINESS General References in this document to Buffalo Wild Wings, company, we, us and our refer to the business of Buffalo Wild Wings, Inc. and our subsidiaries. We maintain an Internet website address at We make available free of charge through our website our annual report on Form 10-K, quarterly reports on Form 10-Q, current reports on Form 8-K, and all amendments to those reports as soon as they are reasonably available after these materials are electronically filed with or furnished to the Securities and Exchange Commission, or SEC. We are an established and growing owner, operator and franchisor of restaurants featuring a variety of boldly flavored, made-to-order menu items including our Buffalo, New York-style chicken wings spun in any of our 12 signature sauces. Our restaurants create an inviting neighborhood atmosphere that includes an extensive multi-media system, a full bar and an open layout, which appeals to sports fans and families alike. Our concept offers elements of the quick casual and casual dining restaurant concepts featuring a flexible service model that allows our guests to choose among convenient dining options such as quick casual counter service, casual dining table service or take-out. Our award-winning food and inviting atmosphere, combined with our guests ability to customize their dining experience, drives guest visits and loyalty. The widespread appeal of our concept establishes our restaurants as a neighborhood destination with 306 restaurants in 31 states as of December 26, Our menu, competitively priced between the quick casual and casual dining segments, features fresh chicken wings and other items including boneless wings, chicken tenders, popcorn shrimp, specialty hamburgers and sandwiches, wraps, Buffalito soft tacos, finger foods and salads. Our made-to-order menu items are enhanced by the bold flavor profile of our 12 signature sauces, from mild Teriyaki to Blazin. Our restaurants serve approximately 20 domestic and imported beers on tap, generally featuring several local or regional micro-brews and a wide selection of bottled beers and liquor. The inviting and energetic environment of our restaurants is complemented by furnishings that can be easily rearranged to accommodate parties of various sizes. Our guests have the option of watching various sporting events or other popular programs on our projection screens and up to 40 additional televisions, playing National Trivia Network or video games. The open layout of our restaurants offers dining and bar areas that provide distinct seating choices for sports fans and families. Our unique service model, providing the flexibility of ordering at the counter or table, allows our guests to customize their Buffalo Wild Wings experience to meet the different time demands or service preferences of a workday lunch, a dine-in dinner, a take-out meal, an afternoon or evening enjoying a sporting event or a late-night craving. We have established our brand through coordinated marketing and operational execution that ensures brand recognition and the quality and consistency of our concept. These efforts include marketing programs and irreverent, award-winning advertising to support both our company-owned and franchised restaurants. We also prominently feature our trademark Buffalo insignia and yellow and black colors in our restaurants and brand our company materials. Our concept is further strengthened by our emphasis on operational excellence supported by stringent operating guidelines and comprehensive employee training in both company-owned and franchised restaurants. Buffalo Wild Wings was founded in 1982 by Jim Disbrow and Scott Lowery at a location near The Ohio State University. Our original name was Buffalo Wild Wings & Weck and we became more popularly known as bw-3. In 1991, we began our franchising program. In November, we completed an initial public offering and became a publicly held company. 3
8 Our Concept and Business Strategy Our goal is to continue to grow and develop the Buffalo Wild Wings Grill & Bar concept into a leading national restaurant chain. To do so, we plan to execute the following strategies: Open restaurants in new and existing markets. Offer a boldly flavored menu with broad appeal. Create an inviting, neighborhood atmosphere. Enable our guests to customize their dining experience. Continue to strengthen the Buffalo Wild Wings brand. Focus on operational excellence. Increase same-store sales and average unit volumes. Growth Strategy Our growth strategy involves opening company-owned and franchised restaurants in both new and existing markets. We believe that we have established the necessary infrastructure and control systems to support our disciplined growth strategy and that our concept can support over 1,000 restaurants in the United States. We have developed procedures for identifying new market opportunities, determining our company and franchising strategy in those markets and identifying sites for company-owned and franchised restaurants. Our growth strategy for the near-term projects a mix of approximately one-third company-owned restaurants and approximately two-thirds franchised restaurants. We intend to build additional company-owned restaurants in both new and existing markets. Within our existing markets, we plan to continue to develop new company-owned restaurants until a market is fully penetrated, enabling us to gain marketing and cost efficiencies. We intend to enter new markets by opening several restaurants within a one-year period to quickly build our brand awareness. We intend to grow our franchise system through the development of new restaurants by existing and new franchisees, focusing on multiple-unit area development agreements. The Buffalo Wild Wings Menu Our restaurants feature a variety of menu items including our Buffalo, New York-style chicken wings spun in any of our 12 signature sauces (from mildest to hottest: Teriyaki, Sweet BBQ, Smoky Southwestern, Mild, Medium, Spicy Garlic, Caribbean Jerk, Thai, Hot BBQ, Hot, Wild and Blazin ). Our fresh chicken wings can be ordered in sizes ranging from six to 100 wings, with larger orders available for parties. Our sauces complement and distinguish our chicken wings to create a bold flavor profile for our guests. In addition to chicken wings, our menu features a wide variety of food items including boneless wings, chicken tenders, popcorn shrimp, specialty hamburgers and sandwiches, wraps, Buffalito soft tacos, finger foods and salads. We also provide a 12 & Under Menu for children. Our restaurants feature a full bar which offers an extensive selection of approximately 20 domestic and imported beers on tap as well as bottled beers, wine and liquor. Additionally, in order to continually improve our menu, we have a research and development department that tests and implements new menu items. Our goal is to balance the established menu offerings that appeal to our loyal guests with new menu items that increase guest frequency and attract new guests. Restaurant Atmosphere and Layout Our restaurants are designed to provide an inviting neighborhood atmosphere and allow our guests the flexibility to customize their dining experience. The inviting and energetic environment of our restaurants is 4
9 created using furnishings that can be easily rearranged to accommodate parties of various sizes. Our restaurants also feature distinct dining and bar areas and select restaurants have patio seating. We strategically place up to 40 televisions and up to five projection screen televisions throughout the restaurant to allow for easy viewing. These televisions, combined with our sound system, National Trivia Network and assorted video games, provide a source of entertainment for our guests and reinforce the energetic nature of our concept. We tailor the content and volume of our video and audio programming in each dining area to reflect our guests tastes. We believe the design of our restaurants enhances our guests experiences, drives repeat visits and solidifies the broad appeal of our concept. All of our menu items are made-to-order and are available for take-out, which approximates 17% of restaurant sales for company-owned restaurants. Many of our restaurants maintain separate parking for our takeout guests. Current Restaurant Locations As of December 26, 2004, we owned or franchised 306 Buffalo Wild Wings restaurants in 31 states, of which 103 were company-owned and 203 were franchised. In 2005, we plan to open new company-owned restaurants and new franchised restaurants. Our company-owned restaurants range in size from 4,000 to 7,600 square feet, with an average of approximately 5,500 square feet. We anticipate that future restaurants, similar to the 19 opened in 2004, will range in size from 5,000 square feet to 6,400 square feet with an average cash investment per restaurant of approximately $1,000,000, excluding preopening expenses of approximately $90,000. From time to time, we expect that sites may be smaller or larger or cost more or less than our targeted range, depending on the particular circumstances. Also, from time to time, we expect to purchase the building or the land and building for certain restaurants, in which case the cash investment would be significantly higher. Our restaurants are typically open on a daily basis from 11 a.m. to 2 a.m. Closing times vary depending on the day of the week and city and state regulations governing the sale of alcoholic beverages. Our franchise agreements require franchisees to operate their restaurants for a minimum of 12 hours a day. Our kitchen remains open during the entire period the restaurant is open. Site Selection and Development Our site selection process is integral to the successful execution of our growth strategy. We have formalized internal guidelines for identifying, analyzing and approving new markets, as defined by the A.C. Nielson designated market areas in the United States. In selecting designated market areas, we collect and review restaurant industry data relating to restaurant sales, spending on food away from home and expected restaurant growth in the market, as well as market demographics, population data and relative media costs for radio and television advertising. Once a market is identified, we use a state-of-the-art trade area and site selection evaluation system which is designed and written specifically for the requirements of the Buffalo Wild Wings system to assist in identifying suitable trade areas within that market and suitable sites within identified trade areas. Criteria examined to determine appropriate trade areas include the presence of a casual dining corridor, projected growth within the trade area, the locations of key big box retailers in the neighborhood, key demographics and population density, drive time and trade area analysis and other quantitative and qualitative measures. Once a suitable trade area is identified, we examine site-specific details including visibility, signage, access and parking. Final approval by one or more members of our executive management team is required for each company-owned and franchised site. Marketing and Advertising We have created a unique marketing program designed to communicate a distinctive and consistent brand that differentiates Buffalo Wild Wings from our competitors and that showcases our food in a fun and energetic 5
10 atmosphere. These efforts include marketing programs and irreverent, award-winning advertising to support both our company-owned and franchised restaurants. The goal of these efforts is to: i) drive positive same-store sales through additional visits by our existing guests and encourage visits by new guests, ii) increase margins, iii) increase average order size, iv) facilitate strong restaurant openings, and v) build brand awareness. Marketing Campaigns. Our primary marketing campaigns focus on a particular menu item, day or daypart in an attempt to drive traffic. For example, in 2004 we developed a campaign to promote the rollout of our new Popcorn Shrimp menu item. Our secondary marketing campaigns focus on reaching beyond the core Buffalo Wild Wings guest. Given our strategy to be a neighborhood destination, local area marketing is also a key to developing brand awareness in each market. Our restaurants actively sponsor local sporting teams and sporting events to drive guest traffic associated with those activities. Advertising. Our media advertising focuses on positioning the Buffalo Wild Wings brand as an inviting neighborhood dining location. Our commercials, print advertisements and radio spots are irreverent by design and have been recognized in the restaurant and advertising industries for their creativity. Franchise Involvement. System-wide campaigns and promotions are developed and implemented with input from the Buffalo Wild Wings National Advertising Advisory Board. This volunteer franchisee board is elected by franchisees annually and meets regularly to review marketing strategies, provide input on advertising messages and vendor co-op programs, and discuss marketing objectives. Operations Our management team strives for operational excellence by recruiting, training and supporting the highest quality management teams and employees and through the implementation of operational best practices within our restaurants. Restaurant Management. Our management structure consists of a general manager, one assistant general manager and up to three managers depending on restaurant sales volume. We utilize regional managers to oversee our general managers, ensuring that they receive the training and support necessary to effectively operate their restaurants. Currently, we have 16 regional managers who oversee 4 to 9 restaurants each. As we expand geographically, we expect to add additional regional managers. Kitchen Operations. An important aspect to our concept is the efficient design, layout and execution of our kitchen operations. Owing to the relatively simple preparation of our menu items, the kitchen consists of fryers, grill and food prep stations that are arranged assembly-line style for maximum productivity. Given our menu and kitchen design, we are able to staff our kitchen with hourly employees who require only basic training before reaching full productivity. Additionally, we do not require the added expense of an on-site chef. The ease and simplicity of our kitchen operations allows us to achieve our goal of preparing casual dining quality food with minimal wait times. We also believe the ease of our kitchen operations is a significant factor in attracting franchisees. Training. We provide extensive training for management and hourly employees at company-owned restaurants, with the goal of providing an excellent guest experience based on our service, food preparation and facilities maintenance. Further, we require each franchisee to send its general manager, assistant manager and control person, to attend our management training program. Managers of our company-owned restaurants are trained using a two-step process that includes both in-class and hands-on sessions during an intensive five-week course at one of our certified training restaurants. During this training period, our manager trainees will work in every aspect of the business, including line cook, server and manager. Our hourly employees in company-owned restaurants complete a comprehensive position certification process. A station certification process requires 16 to 20 hours of classroom and hands-on training. In addition, 6
11 our hourly employees are encouraged to participate in an on-the-job training program called the Wing Certified Trainer, or WCT, program that utilizes both detailed training guides and hands-on instruction by restaurant management. The certification process requires that the employee have a high level of knowledge of all 10 components of the restaurant s operations manual. These 10 components represent the six different job positions in our restaurant: cashier and greeter, bartender, server, expedite station, grill and southwest station, and chip and shake station. Monetary incentives and additional benefits are used to encourage employees to participate in this certification process. Our objective is to have at least four WCTs at each company-owned and franchised restaurant. Career Opportunities. We attempt to motivate and retain our field operations team by providing them with opportunities for increased responsibilities and advancement. In addition, we offer performance-based cash incentives tied to sales, profitability and qualitative measures such as mystery shop scores. It is our preference to promote from within whenever possible. Recruiting. We actively recruit and select individuals who demonstrate enthusiasm and dedication and who share our passion for high quality guest service delivered through teamwork and commitment. To attract high caliber managers, we have developed a competitive compensation plan that includes a base salary and an attractive benefits package, including participation in a management incentive plan that rewards managers for achieving performance objectives. Food Preparation, Quality Control and Purchasing We strive to maintain high food quality standards. Our systems are designed to protect our food supply throughout the preparation process. We provide detailed specifications to suppliers for our food ingredients, products and supplies. Our restaurant managers are certified in a comprehensive food safety and sanitation course, ServSafe, developed by the National Restaurant Association Education Foundation. We negotiate directly with independent suppliers for our supply of food and paper products. We use members of UniPro Food Services, Inc., a national cooperative of independent food distributors, to distribute these products from the suppliers to our restaurants. To maximize our purchasing efficiencies and obtain the lowest possible prices for our ingredients, products and supplies, our purchasing team negotiates prices based on system-wide usage for both company-owned and franchised restaurants. The kitchen manager for each restaurant places orders with approved local suppliers and their UniPro distributor and orders are inspected at delivery. We believe that competitively priced, high quality alternative manufacturers, suppliers, growers and distributors are available should the need arise. We utilize T. Marzetti Company, an industry-leading supplier of restaurant food products, for the production of our signature sauces. They maintain sufficient inventory levels to ensure consistent supply to our restaurants. We have a confidentiality agreement with Marzetti that prevents our sauces from being supplied to, or manufactured for, anyone else. Fresh chicken wings are an important component of our cost of sales. Prices are generally based on the underlying commodity price of chicken wings plus additional costs for handling and distribution. Fresh chicken wings accounted for approximately 28%, 31%, and 34% of our cost of sales in 2002,, and 2004, respectively. We ensure consistent supply of high quality chicken wings by utilizing four to six suppliers, with Peco Foods, Inc. currently accounting for approximately 50% of the total system-wide supply. Given our multiple suppliers and the commodity nature of fresh chicken wings, we believe we have sufficient supplier flexibility to maintain a consistent chicken wing supply. We regularly review our buying procedures to ensure quality and cost optimization. Restaurant Franchise Operations Our concept continues to attract a strong group of franchisees including franchisees of other successful casual dining and quick service restaurant chains. 7
12 Our franchisees execute a separate franchise agreement for each restaurant opened, typically providing for a 15 to 20-year initial term, with an opportunity to enter into a renewal franchise agreement subject to certain conditions. Our agreement currently requires franchisees to pay an initial franchise fee of $42,500 for the first restaurant opened and $32,500 for each additional restaurant they open. The $32,500 fee is reduced to $12,500 if the additional restaurant is in the designated area of the franchisee s existing restaurant. If a franchisee has entered into an area development agreement with us, the initial franchise fee is $42,500 for the first restaurant, $32,500 for the second restaurant and $27,500 for each subsequent restaurant. These amounts are reduced to $32,500 for the first restaurant and $12,500 for each subsequent restaurant if the franchisee is an existing area developer signing an additional area development agreement. If the franchisee is an existing franchisee that subsequently signs an area development agreement, the franchise fee is $32,500 for the first restaurant and $22,500 for each subsequent restaurant. Franchisees also pay us a royalty fee of 5.0% of their restaurant sales. Franchise agreements typically allow us to assess franchisees an advertising fee in the amount of 3.0% of their restaurant sales, of which 2.5% is contributed to our Advertising Fund and the remaining 0.5% is spent directly by the franchisee in the applicable local market. Our current form of franchise agreement permits us to increase the required contribution to the Advertising Fund by 0.5% once every three years. All of our franchise agreements require that each franchised restaurant be operated in accordance with our defined operating procedures, adhere to the menu established by us, meet applicable quality, service, health and cleanliness standards and comply with all applicable laws. We ensure these high standards are being followed through a variety of means including mystery shoppers and unannounced quality assurance inspections. We also employ franchise consultants to assist our franchisees in developing profitable operations and maintaining our operating standards. We may terminate the franchise rights of any franchisee who does not comply with our standards and requirements. We believe that maintaining superior food quality, an inviting and energetic atmosphere and excellent guest service are critical to the reputation and success of our concept; therefore, we aggressively enforce the contractual requirements of our franchise agreements. The area development agreement establishes the number of restaurants that must be developed in a defined geographic area and the deadlines by which these restaurants must open. For area development agreements covering three to seven restaurants, restaurants are usually required to open in 12-month intervals. For larger development agreements, the interval is typically shorter. The area development agreement can be terminated by us if, among other reasons, the area developer fails to open restaurants on schedule. Management Information Systems We have our core management information systems in place and believe they are scalable to support our future growth plans. We utilize a standard point-of-sale system in all of our company-owned restaurants that helps facilitate the operation of the restaurants by recording sales, cost of sales, labor and other operating metrics and allows managers to create various reports. We currently are reviewing the capabilities of the point-of-sale system to ensure it is sufficient to support our planned expansion. Certain information from the point-of-sale system is transferred to our headquarters on a daily basis and is reported daily to various levels of management through our corporate and intranet. Franchisees are required to report sales on a daily basis through an on-line reporting network and submit their restaurant-level financial statements on a quarterly or annual basis. Competition The restaurant industry is intensely competitive. We compete on the basis of the taste, quality and price of food offered, guest service, ambience, location, and overall dining experience. We believe that our attractive price-value relationship, our flexible service model and the quality and distinctive flavor of our food enable us to differentiate ourselves from our competitors. We believe we compete primarily with local and regional sports bars and casual dining and quick casual establishments, as well as with quick service restaurants such as wingbased take-out concepts. Many of our direct and indirect competitors are well-established national, regional or local chains and some have substantially greater financial and marketing resources than we do. We also compete with many restaurant and retail establishments for site locations and restaurant employees. 8
13 Proprietary Rights We own the rights to the Buffalo Wild Wings service mark and to certain other service marks and trademarks used in our system. We attempt to protect our sauce recipes as trade secrets by, among other things, requiring a confidentiality agreement with our sauce supplier and executive officers. It is possible that competitors could develop recipes and procedures that duplicate or closely resemble our recipes and procedures. We believe that our trademarks, service marks and other proprietary rights have significant value and are important to our brand-building efforts and the marketing of our restaurant concept. We vigorously protect our proprietary rights. We cannot predict, however, whether steps taken by us to protect our proprietary rights will be adequate to prevent misappropriation of these rights or the use by others of restaurant features based upon, or otherwise similar to, our concept. It may be difficult for us to prevent others from copying elements of our concept and any litigation to enforce our rights will likely be costly and may not be successful. Although we believe that we have sufficient rights to all of our trademarks and service marks, we may face claims of infringement that could interfere with our ability to market our restaurants and promote our brand. Any such litigation may be costly and divert resources from our business. Moreover, if we are unable to successfully defend against such claims, we may be prevented from using our trademarks or service marks in the future and may be liable for damages. Government Regulation The restaurant industry is subject to numerous federal, state and local governmental regulations, including those relating to the preparation and sale of food and alcoholic beverages, sanitation, public health, fire codes, zoning and building requirements. Each restaurant requires appropriate licenses from regulatory authorities allowing it to sell liquor, beer and wine, and each restaurant requires food service licenses from local health authorities. Our licenses to sell alcoholic beverages must be renewed annually and may be suspended or revoked at any time for cause, including violation by us or our employees of any law or regulation pertaining to alcoholic beverage control, such as those regulating the minimum age of patrons or employees, the over-serving of alcohol to patrons, advertising, wholesale purchasing and inventory control. The failure of a restaurant to retain liquor or food service licenses could have a material adverse effect on our operations. In order to reduce this risk, restaurant employees are trained in standardized operating procedures designed to assure compliance with all applicable codes and regulations. We and our franchisees are also subject to laws governing our relationships with employees, including laws and regulations relating to benefits, wages, hours, workers compensation insurance rates, unemployment and other taxes, working and safety conditions and citizenship or immigration status. We may be subject in certain states to dram-shop statutes, which generally provide a right of action against the provider of alcoholic beverages for injuries caused by an intoxicated patron. In addition, we are subject to various state and federal laws relating to the offer and sale of franchises and the franchisor-franchisee relationship. In general, these laws and regulations impose specific disclosure and registration requirements prior to the sale and marketing of franchises and regulate certain aspects of the relationship between franchisor and franchisee. Employees As of December 26, 2004, we employed 4,532 employees. We have 982 full-time and 3,438 part-time employees working in our company-owned restaurants and 112 employees based out of our home office or in the field. Our employees are not covered by any collective bargaining agreement and we have never experienced an organized work stoppage or strike. We believe that our working conditions and compensation packages are competitive and consider our relations with our employees to be good. Our executive officers as of March 16, 2005 are as follows: Sally J. Smith has served as our Chief Executive Officer and President since July 1996, as a director since August 1996 and as our Chief Financial Officer from 1994 to Prior to joining the company, she was the 9
14 Chief Financial Officer of Dahlberg, Inc., the manufacturer and franchisor of Miracle-Ear hearing aids, from 1983 to Ms. Smith began her career with KPMG LLP, an international accounting and auditing firm. Ms. Smith is a CPA. Ms. Smith serves on the board of the National Restaurant Association. Mary J. Twinem has served as our Executive Vice President, Chief Financial Officer and Treasurer since July 1996 and as our Controller from January 1995 to July Ms. Twinem also served as a director of the company from June 2002 to September. Prior to joining the company, she served as the Director of Finance/Controller of Dahlberg, Inc., from 1989 to December Ms. Twinem began her career in public accounting and is a CPA. Kathleen M. Benning has served as our Senior Vice President, Marketing and Brand Development since January 2002 and as Vice President of Marketing since March Prior to joining us, Ms. Benning was employed by Nemer, Fieger & Associates, an advertising agency, from 1992 to 1997, and she was a partner from 1994 to Craig W. Donoghue has served as our Senior Vice President, Information Systems since January, prior to which he served as our Director and later as Vice President of Information Systems from August 1998 to January. From November 1996 until August 1998, Mr. Donoghue was a self-employed computer consultant, using the trade name of Excelsior Information Systems. From January 1996 until November 1996, Mr. Donoghue was Manager of Information Systems for Varitronic Systems, Inc. Lee Sanders has served as our Senior Vice President, Development and Franchising since January 2002 and as Vice President of Franchising since August Prior to joining us, Mr. Sanders was National Director of Franchising of Allied Domecq Quick Service Restaurants, a franchisor of Dunkin Donuts, Togo s Eateries and Baskin-Robbins from September 1998 to August From 1988 to 1998, Mr. Sanders was a Manager of Branded Retail Systems for General Mills. James M. Schmidt has served as our Senior Vice President and General Counsel since January and as Vice President and General Counsel since April Mr. Schmidt has also served as our Secretary since September 2002, and served as a director of the company from 1994 to September. Mr. Schmidt has been a practicing attorney since 1985, most recently with the law firm of Robbins, Kelly, Patterson & Tucker, which provides legal services to us from time to time. Judith A. Shoulak has served as our Senior Vice President, Operations since March 2004, as our Senior Vice President, Human Resources from January to February 2004, and as Vice President of Human Resources from October 2001 to January. From 1993 to 2001, Ms. Shoulak served as Vice President of Field Human Resources of Office Max, where she was responsible for human resources leadership to field operations. Ms. Shoulak is a member of the board of the Minnesota Restaurant Association. Risk Factors/Forward-Looking Statements The foregoing discussion and the discussion contained in Item 7 of this Form 10-K contain various forward-looking statements within the meaning of Section 27A of the Securities Act of 1933, as amended, and Section 21E of the Securities Exchange Act of 1934, as amended. Forward-looking statements are based on current expectations or beliefs concerning future events. Such statements can be identified by the use of terminology such as anticipate, believe, estimate, expect, intend, may, could, possible, plan, project, will, forecast and similar words or expressions. The Company s forward-looking statements generally relate to its growth strategy, financial results, sales efforts, acquisition plans and cash requirements. Although it is not possible to foresee all of the factors that may cause actual results to differ from the Company s forward-looking statements, such factors include, among others, the risk factors that follow. Investors are cautioned that all forward-looking statements involve risks and uncertainties. 10
15 Fluctuations in chicken wing prices could reduce our operating income. The primary food product used by our company-owned and franchised restaurants is fresh chicken wings. We purchase fresh chicken wings based on current market prices that are subject to fluctuations. Any material increase in the cost of fresh chicken wings could adversely affect our operating results. Fresh chicken wing prices are near all-time highs, with prices at the end of February 2005 at $1.52 per pound as compared to the average annual per pound price of $1.39 in 2004, which itself was the highest annual price we have experienced. Unless there is a reduction in the price of fresh chicken wings, or we are able to successfully adjust menu prices or menu mix or otherwise make operational adjustments to account for the high wing prices, our operating results could be adversely affected. For example, fresh chicken wings accounted for approximately 28%, 31%, and 34% of our cost of sales in 2002,, and 2004, respectively, with an annual average price per pound of $0.89, $1.06, and $1.39, respectively. If we had experienced a further 10% increase in fresh chicken wing costs during 2004, restaurant cost of sales would have increased by approximately $1.8 million for fiscal Additional information related to chicken wing prices is included in Item 7 under Results of Operations. If we are unable to successfully open new restaurants, our revenue growth rate and profits may be reduced. To successfully expand our business, we must open new Buffalo Wild Wings restaurants on schedule and in a profitable manner. In the past, we and our franchisees have experienced delays in restaurant openings and we may experience similar delays in the future. Delays or failures in opening new restaurants could hurt our ability to meet our growth objectives, which may affect our results of operations, the expectations of securities analysts and shareholders and thus our stock price. We cannot guarantee that we or our franchisees will be able to achieve our expansion goals or that new restaurants will be operated profitably. Further, any restaurants that we or our franchisees open may not obtain operating results similar to those of our existing restaurants. Our ability to expand successfully will depend on a number of factors, many of which are beyond our control. These factors include: locating suitable restaurant sites in new and existing markets; negotiating acceptable lease or purchase terms of new restaurants; recruiting, training and retaining qualified home office, field and restaurant personnel and management; attracting and retaining qualified franchisees; cost effective and timely planning, design and build-out of restaurants; obtaining and maintaining required local, state and federal governmental approvals and permits related to the construction of the sites and the sale of food and alcoholic beverages; creating guest awareness of our restaurants in new markets; competition in our markets; and general economic conditions. We must identify and obtain a sufficient number of suitable new restaurant sites for us to sustain our revenue growth rate. We require that all proposed restaurant sites, whether for company-owned or franchised restaurants, meet site-selection criteria established by us. We may make errors in selecting these criteria or we or our franchisees may not be able to find sufficient new restaurant sites that satisfy these criteria to support our planned expansion in future periods. We face significant competition from other restaurant companies and retailers for sites that meet our criteria and the supply of sites may be limited in some markets. As a result of these factors, our costs to obtain and lease sites may increase, or we may not be able to obtain certain sites due to unacceptable costs. Our inability to obtain suitable restaurant sites at reasonable costs may reduce our growth rate. 11
16 Our restaurants may not achieve market acceptance in the new geographic regions we enter. Our expansion plans depend on opening restaurants in new markets where we or our franchisees have little or no operating experience. The success of these new restaurants will be affected by the different competitive conditions, consumer tastes and discretionary spending patterns of the new markets as well as our ability to generate market awareness of the Buffalo Wild Wings brand. Sales at restaurants opening in new markets may take longer to reach average annual restaurant sales, if at all, thereby affecting the profitability of these restaurants. We may not be successful in operating our restaurants in new markets on a profitable basis. New restaurants added to our existing markets may take sales from existing restaurants. We and our franchisees intend to open new restaurants in our existing markets, which may reduce sales performance and guest visits for existing restaurants in those markets. In addition, new restaurants added in existing markets may not achieve sales and operating performance at the same level as established restaurants in the market. Implementing our expansion strategy may strain our resources. Our expansion strategy may strain our management, financial and other resources. We must attract and retain talented operating personnel to maintain the quality and service levels at our existing and future restaurants. We must also continue to enhance our operational, financial and management systems. We may not be able to effectively manage these or other aspects of our expansion. If we fail to do so, our business, financial condition, operating results and cash flows could suffer. We are dependent on franchisees and their success. Currently, approximately 66% of our restaurants are franchised. Franchising royalties and fees represented approximately 11% of our revenues during fiscal 2002, and Our performance depends upon i) our ability to attract and retain qualified franchisees and ii) the franchisees ability to execute our concept and capitalize upon our brand recognition and marketing. We may not be able to recruit franchisees who have the business abilities or financial resources necessary to open restaurants on schedule, or who will conduct operations in a manner consistent with our concept and standards. Also, our franchisees may not be able to operate restaurants in a profitable manner. Our franchisees may take actions that could harm our business. Franchisees are independent contractors and are not our employees. We provide training and support to franchisees, but the quality of franchised restaurant operations may be diminished if franchisees do not operate restaurants in a manner consistent with our standards and requirements, or if they do not hire and train qualified managers and other restaurant personnel. If franchisees do not adequately manage their restaurants, our image and reputation, and the image and reputation of other franchisees, may suffer materially and system-wide sales could significantly decline. In addition, we may also face potential claims and liabilities due to the acts of our franchisees based on agency or vicarious liability theories. We could face liability from our franchisees. A franchisee or government agency may bring legal action against us based on the franchisee/franchisor relationships. Various state and federal laws govern our relationship with our franchisees and our potential sale of a franchise. If we fail to comply with these laws, we could be liable for damages to franchisees and fines or other penalties. Expensive litigation with our franchisees or government agencies may adversely affect both our profits and our important relations with our franchisees. 12
17 We may be unable to compete effectively in the restaurant industry. The restaurant industry is intensely competitive. We believe we compete primarily with regional and local sports bars, casual dining and quick casual establishments, and quick service wing-based take-out concepts. Many of our direct and indirect competitors are well established national, regional or local chains with a greater market presence than us. Further, some competitors have substantially greater financial, marketing and other resources than us. In addition, independent owners of local or regional establishments may enter the wing-based restaurant business without significant barriers to entry and such establishments may provide price competition for our restaurants. Competition in the casual dining, quick casual and quick service segments of the restaurant industry is expected to remain intense with respect to price, service, location, concept and the type and quality of food. We also face intense competition for real estate sites, qualified management personnel and hourly restaurant staff. A reduction in vendor allowances currently received could affect our costs of goods sold. During fiscal 2002, and 2004, vendor allowances were recorded as a reduction in inventoriable costs and cost of sales was reduced by $1.8 million, $2.3 million, and $3.9 million, respectively. If the amount of vendor rebates is reduced, inventoriable costs may increase, as may the cost of sales. Our quarterly operating results may fluctuate due to the timing of special events and other factors. Our quarterly operating results depend, in part, on special events, such as the Super Bowl and other popular sporting events, and thus are subject to fluctuations based on the dates for such events. Historically, sales in most of our restaurants have been higher during fall and winter months based on the relative popularity of national, regional and local sporting and other events. Further, our quarterly operating results may fluctuate significantly because of other factors, including: increases or decreases in same-store sales; fluctuations in food costs, particularly fresh chicken wings; the timing of new restaurant openings, which may impact margins due to the related preopening costs and initially higher restaurant level operating expense ratios; the timing and amount of asset impairment and restaurant closing charges; labor availability and costs for hourly and management personnel; changes in competitive factors; disruption in supplies; general economic conditions and consumer confidence; claims experience for self-insurance programs; and volatility of stock-based compensation plans. As a result of the factors discussed above, our quarterly and annual operating results may fluctuate significantly. Accordingly, results for any one quarter are not necessarily indicative of results to be expected for any other quarter or for any year. In the future, operating results may fall below the expectations of securities analysts and investors. In that event, the price of our common stock would likely decrease. We may not be able to attract and retain qualified personnel to operate and manage our restaurants. Our success and the success of our individual restaurants depends on our ability to attract, motivate and retain a sufficient number of qualified restaurant employees, including restaurant managers, kitchen staff and 13
18 wait staff. The inability to recruit and retain these individuals may delay the planned openings of new restaurants or result in high employee turnover in existing restaurants. This could inhibit our expansion plans and business performance and, to the extent that a labor shortage may force us to pay higher wages, harm our profitability. Further, the loss of any of our executive officers could adversely impact us. We may not be able to obtain and maintain licenses and permits necessary to operate our restaurants. The restaurant industry is subject to various federal, state and local government regulations, including those relating to the sale of food and alcoholic beverages. The failure to obtain and maintain these licenses, permits and approvals, including food and liquor licenses, could adversely affect our operating results. Difficulties or failure to obtain the required licenses and approvals could delay or result in our decision to cancel the opening of new restaurants. Local authorities may revoke, suspend or deny renewal of our food and liquor licenses if they determine that our conduct violates applicable regulations. Various federal and state labor laws govern our relationship with our employees and affect operating costs. These laws include minimum wage requirements, overtime pay, unemployment tax rates, workers compensation rates, citizenship requirements and sales taxes. A number of factors could adversely affect our operating results, including additional government-imposed increases in minimum wages, overtime pay, paid leaves of absence and mandated health benefits, increased tax reporting and tax payment requirements for employees who receive gratuities, a reduction in the number of states that allow tips to be credited toward minimum wage requirements and increased employee litigation including claims relating to the Fair Labor Standards Act. The Americans with Disabilities Act is a federal law that prohibits discrimination on the basis of disability in public accommodations and employment. Although our restaurants are designed to be accessible to the disabled, we could be required to make modifications to our restaurants to provide service to, or make reasonable accommodations for disabled persons. We are susceptible to adverse trends and economic conditions in Ohio. As of December 26, 2004, 80, or approximately 26%, of our company-owned and franchised restaurants are located in Ohio. As a result, we are susceptible to adverse trends and economic conditions in that state. In addition, given our geographic concentration in the Midwest, negative publicity regarding any of our restaurants could have a material effect on our business and operations throughout the region, as could other regional occurrences such as local strikes, new or revised laws or regulations, or disruptions in the supply of food products. Changes in consumer preferences or discretionary consumer spending could harm our performance. Our success depends, in part, upon the continued popularity of Buffalo, New York-style chicken wings, our other menu items, sports bars and casual dining restaurant styles. We also depend on trends toward consumers eating away from home more often. Shifts in these consumer preferences could negatively affect our future profitability. Such shifts could be based on health concerns related to the cholesterol, carbohydrate or fat content of certain food items, including items featured on our menu. Negative publicity over the health aspects of such food items may adversely affect consumer demand for our menu items and could result in a decrease in guest traffic to our restaurants. A decrease in guest traffic could materially harm our business. Smoking bans imposed by state or local laws could also adversely impact our restaurants performance. In addition, our success depends to a significant extent on numerous factors affecting discretionary consumer spending, including economic conditions, disposable consumer income and consumer confidence. A decline in consumer spending or in economic conditions could reduce guest traffic or impose practical limits on pricing, either of which could harm our business, financial condition, operating results or cash flow. A decline in visitors to any of the business districts near the locations of our restaurants could negatively affect our restaurant sales. Some of our restaurants are located near high activity areas such as retail centers, big box shopping centers 14
19 and entertainment centers. We depend on high visitor rates at these business districts to attract guests to our restaurants. If visitors to these centers decline due to economic conditions, road construction, changes in consumer preferences or shopping patterns, changes in discretionary consumer spending or otherwise, our restaurant sales could decline significantly and adversely affect our results of operations. The acquisition of existing restaurants from our franchisees may have unanticipated consequences that could harm our business and our financial condition. We may seek to selectively acquire existing restaurants from our franchisees. To do so, we would need to identify suitable acquisition candidates, negotiate acceptable acquisition terms and obtain appropriate financing. Any acquisition that we pursue, whether or not successfully completed, may involve risks, including: material adverse effects on our operating results, particularly in the fiscal quarters immediately following the acquisition as the acquired restaurants are integrated into our operations; risks associated with entering into markets or conducting operations where we have no or limited prior experience; and the diversion of management s attention from other business concerns. Future acquisitions of existing restaurants from our franchisees, which may be accomplished through a cash purchase transaction, the issuance of our equity securities or a combination of both, could result in potentially dilutive issuances of our equity securities, the incurrence of debt and contingent liabilities and impairment charges related to goodwill and other intangible assets, any of which could harm our business and financial condition. Improper food handling may affect our business adversely. There are health risks associated with eating contaminated or improperly handled or prepared food items. Negative publicity over illness caused by improper handling or preparation of food items could harm our future revenue and profitability. While we currently maintain insurance for these types of incidents, we cannot guarantee our insurance is sufficient to cover all adverse outcomes. Complaints or litigation may hurt us. Occasionally, our guests file complaints or lawsuits against us alleging that we are responsible for some illness or injury they suffered at or after a visit to our restaurants. We are also subject to a variety of other claims arising in the ordinary course of business, including personal injury claims, contract claims, employment-related claims, claims by franchisees, and claims arising from an incident at a franchised restaurant. The restaurant industry has also been subject to a growing number of claims that the menus and actions of restaurant chains have led to the obesity of certain of their guests. In addition, we are subject to dram shop statutes. These statutes generally allow a person injured by an intoxicated person to recover damages from an establishment that wrongfully served alcoholic beverages to the intoxicated person. Recent litigation against restaurant chains has resulted in significant judgments and settlements under dram shop statutes. Because the plaintiff is seeking punitive damages, which may not be covered by insurance, this action could have an adverse impact on our financial condition and results of operations. See Legal Proceedings. Regardless of whether any claims against us are valid or whether we are liable, claims may be expensive to defend and may divert time and money away from our operations and hurt our performance. A judgment significantly in excess of our insurance coverage for any claims could materially adversely affect our financial condition or results of operations. Further, adverse publicity resulting from these allegations may materially adversely affect us and our restaurants. Our current insurance may not provide adequate levels of coverage against claims. We currently maintain insurance customary for businesses of our size and type. However, there are types of losses we may incur that cannot be insured against or that we believe are not economically reasonable to insure, such as losses due to natural disasters. Such damages could have a material adverse effect on our business and results of operations. 15
20 We may not be able to protect our trademarks, service marks or trade secrets. We place considerable value on our trademarks, service marks and trade secrets. We intend to actively enforce and defend our marks and if violations are identified, to take appropriate action to preserve and protect our goodwill in our marks. We attempt to protect our sauce recipes as trade secrets by, among other things, requiring confidentiality agreements with our sauce suppliers and executive officers. However, we cannot be sure that we will be able to successfully enforce our rights under our marks or prevent competitors from misappropriating our sauce recipes. We can also not be sure that: i) our marks are valuable, ii) using our marks does not, or will not, violate others marks, iii) the registrations of our marks would be upheld if challenged, or iv) we would not be prevented from using our marks in areas of the country where others might have already established rights to them. Any of these uncertainties could have an adverse effect on us and our expansion strategy. 16
21 ITEM 2. PROPERTIES We are headquartered in Minneapolis, Minnesota. Our home office has 17,198 square feet of office space. We occupy this facility under a lease that terminates on November 1, 2007 with options to renew for two successive five-year terms. As of December 26, 2004, we owned and operated 103 restaurants. We lease the land and building for nearly all of these sites. The majority of our existing leases are for 10 or 15-year terms, generally including options to extend the terms. We typically lease our restaurant facilities under triple net leases that require us to pay minimum rent, real estate taxes, maintenance costs and insurance premiums and, in some instances, percentage rent based on sales in excess of specified amounts. In addition, most of our leases include exclusive use provisions prohibiting our landlords from leasing space to other restaurants that fall within certain specified criteria. Under our franchise agreements, we have certain rights to gain control of a restaurant site in the event of default under the lease or franchise agreement. The following table sets forth the 31 states in which Buffalo Wild Wings restaurants are located and the number of restaurants in each state as of December 26, 2004: Number of Restaurants Open Company-owned Franchised Total Alabama Arizona Colorado Delaware Florida Georgia Illinois Indiana Iowa Kansas Kentucky Louisiana Michigan Minnesota Mississippi Missouri Nebraska Nevada NewYork NorthCarolina NorthDakota Ohio Oklahoma Pennsylvania South Carolina South Dakota Tennessee Texas Virginia WestVirginia Wisconsin Total
22 ITEM 3. LEGAL PROCEEDINGS Occasionally, we are a defendant in litigation arising in the ordinary course of our business, including claims arising from personal injuries, contract claims, franchise-related claims, dram shop claims, employmentrelated claims and claims from guests or employees alleging injury, illness or other food quality, health or operational concerns. To date, none of these types of litigation, most of which are typically covered by insurance, has had a material effect on us. We have and continue to insure against most of these types of claims. A judgment on any claim not covered by or in excess of our insurance coverage could adversely affect our financial condition or results of operations. On August 8,, an action captioned Ritter v. Buffalo Wild Wings, Inc. was brought in Pennsylvania state court by the representative of the estate of a 23-year-old decedent alleging that we acted improperly by serving alcohol to an individual who later lost control of his vehicle and struck and killed the decedent and one other individual. The case was settled in February The settlement was fully covered by insurance. 18
23 PART II ITEM 5. MARKET FOR REGISTRANT S COMMON EQUITY, RELATED STOCKHOLDER MATTERS AND ISSUER PURCHASES OF EQUITY SECURITIES Market Information Our Common Stock began trading on November 21, on the NASDAQ National Stock Market under the symbol BWLD in connection with our initial public offering. Prior to November 21,, there was no public market for our Common Stock. The following table sets forth, the high and low closing sale prices of our Common Stock beginning on November 21,. These quotations represent inter-dealer prices and do not include retail mark-ups, markdowns or commissions and may not necessarily represent actual transactions High Low High Low First Quarter... $27.98 $23.29 Second Quarter... $34.05 $25.93 Third Quarter... $31.49 $26.20 Fourth Quarter... $37.53 $27.33 $24.21 $21.30 Holders As of March 16, 2005, there were approximately 95 record holders of the Company s Common Stock, excluding shareholders whose stock is held either in nominee name and/or street name brokerage accounts. Based on information which we have obtained from our transfer agent, there are approximately 1,908 holders of our Common Stock whose stock is held either in nominee name and/or street name brokerage accounts. Dividends The Company has never declared or paid cash dividends on its capital stock and does not anticipate declaring or paying any cash dividends in the foreseeable future. The Company intends to retain future earnings for the development of its business. Securities authorized for issuance under equity compensation plans For information on our equity compensation plans, refer to Item 12, Security Ownership of Certain Beneficial Owners and Management. Initial Public Offering and Use of Proceeds We completed an initial public offering of 3,450,000 shares of common stock, of which 3,250,000 shares were offered by us and 200,000 were offered by selling shareholders, at an aggregate offering price of $58.7 million or $17.00 per share pursuant to registration statement No , which was declared effective on November 20,. The managing underwriters for the IPO were RBC Capital Markets, SG Cowen and McDonald Investments Inc. We received net proceeds, after expenses, from the IPO of $49.7 million. Offering expenses related to the IPO included an underwriting discount of $3.9 million and other offering expenses of $1.6 million. We used $10.6 million of the net proceeds for the repayment of capital leases and bank notes. The remaining proceeds are expected to be used for general corporate purposes, including opening new restaurants and renovation and maintenance of existing restaurants, acquiring existing restaurants from franchisees, research and development, working capital, and capital expenditures. We invest our cash balances in short-term investment instruments with the focus on protection of principal, adequate liquidity and maximization of after-tax returns. These investments include, but are not limited to high quality money market funds, commercial paper, U.S. government-backed instruments, repurchase agreements, municipal securities, and asset-backed securities. We experienced strong same store sales and financial performance in 2004 with cashflow from operations of $21.4 million. These amounts, along with cashflows from financing, were adequate to fund corporate expansion of 19 new company-owned restaurants. 19
24 ITEM 6. SELECTED FINANCIAL DATA The following summary information should be read in conjunction with the Consolidated Financial Statements and related notes thereto set forth in Item 8 of this Form 10-K. Dec. 31, 2000 (1) Dec. 30, 2001 Fiscal Years Ended Dec. 29, 2002 Dec. 28, Dec. 26, 2004 (in thousands, except share and per share data) Consolidated Statements of Earnings Data: Revenue: Restaurant sales... $ 46,244 $ 66,351 $ 85,493 $ 112,965 $ 152,221 Franchising royalties and fees... 6,931 8,219 10,614 13,532 18,827 Totalrevenue... 53,175 74,570 96, , ,048 Costs and expenses: Restaurant operating costs: Cost of sales... 13,935 21,133 24,983 35,423 51,507 Labor... 12,754 18,563 24,640 32,684 43,853 Operating... 6,649 10,328 13,311 17,559 23,080 Occupancy... 2,851 4,262 5,734 7,738 10,259 Depreciation and amortization... 2,590 4,096 5,528 7,021 9,717 General and administrative... 9,020 10,333 14,133 16,926 19,372 Preopening ,085 1,155 2,042 Restaurant closures and impairment Totalcostsandexpenses... 48,709 69,657 90, , ,403 Income from operations... 4,466 4,913 5,985 7,123 10,645 Other income (expense), net... (304) (713) (878) (1,246) 671 Earningsbeforeincometaxes... 4,162 4,200 5,107 5,877 11,316 Incometaxexpense... 1,600 1,499 2,030 2,294 4,115 Net earnings... 2,562 2,701 3,077 3,583 7,201 Accretion resulting from cumulative dividend and mandatory redemption feature of preferred stock... 1,209 1,317 1,457 1,452 Net earnings available to common stockholders... $ 1,353 $ 1,384 $ 1,620 $ 2,131 $ 7,201 Earnings per common share basic... $ 0.55 $ 0.56 $ 0.64 $ 0.66 $ 0.88 Weighted average shares outstanding basic... 2,429,000 2,469,000 2,529,000 3,222,000 8,165,000 Earningspercommonshare diluted... $ 0.52 $ 0.50 $ 0.54 $ 0.55 $ 0.84 Weighted average shares outstanding diluted... 2,583,000 2,781,000 2,976,000 3,842,000 8,603,000 Consolidated Statements of Cash Flow Data: Net cash provided by operating activities... $ 5,227 $ 11,870 $ 10,337 $ 17,753 $ 21,362 Net cash used in investing activities... (8,133) (7,853) (9,592) (10,739) (59,915) Net cash provided by (used in) financing activities (1,267) (3,481) 37,872 1,572 As Of Dec. 31, 2000 (1) Dec. 30, 2001 Dec. 29, 2002 Dec. 28, Dec. 26, 2004 (in thousands) Consolidated Balance Sheets Data: Total current assets... $ 8,868 $ 12,469 $ 12,656 $ 55,663 $ 57,021 Total assets... 31,872 40,971 50, , ,985 Total current liabilities... 7,865 13,003 14,827 15,641 18,327 Total liabilities... 17,469 23,717 30,390 28,932 33,278 Mandatorily redeemable Series A Preferred Stock... 9,014 10,331 11,788 Retained earnings... 3,697 5,081 6,701 8,832 16,033 Total common stockholders equity... 5,389 6,923 8,563 75,067 85,707 (1) The Company utilizes a 52- or 53-week accounting period that ends on the last Sunday in December. The fiscal years ended December 30, 2001, December 29, 2002, December 28,, and December 26, 2004 were comprised of 52 weeks. The fiscal year ended December 31, 2000 was comprised of 53 weeks. 20
25 ITEM 7. MANAGEMENT S DISCUSSION AND ANALYSIS OF FINANCIAL CONDITION AND RESULTS OF OPERATIONS The following discussion and analysis of our financial condition and results of operations should be read in conjunction with our consolidated financial statements and related notes. This discussion and analysis contains certain statements that are not historical facts, including, among others, those relating to our anticipated financial performance for fiscal 2005 and our expected store openings. Such statements are forward-looking and involve risks and uncertainties including but not limited to those discussed in Item 1 of this 10-K under Risk Factors/ Forward-Looking Statements. Information included in this discussion and analysis includes commentary on franchised restaurant units, restaurant sales, same-store sales, and average weekly sales volumes. Management believes such sales information is an important measure of our performance, and is useful in assessing consumer acceptance of the Buffalo Wild Wings Grill & Bar concept and the overall health of the concept. Franchise information also provides an understanding of the Company s revenues as franchise royalties and fees are based on the opening of franchise units and their sales. However, franchise sales and same-store sales information does not represent sales in accordance with U. S. Generally Accepted Accounting Principles (GAAP), should not be considered in isolation or as a substitute for other measures of performance prepared in accordance with GAAP and may not be comparable to financial information as defined or used by other companies. On February 7, 2005, the Office of the Chief Accountant of the SEC sent a letter to the Center For Public Audit Firms of the American Institute of Certified Public Accountants, or AICPA, regarding certain lease accounting practices. The Office of the Chief Accountant concluded that companies were incorrectly accounting for certain lease expenses and that such errors required correction. In order to make these corrections, a number of companies, including us, would be required to restate previously issued financial statements if the corrections were deemed to be material. On March 3, 2005, members of our management and our independent registered public accounting firm met with our Audit Committee to discuss the views expressed by the Office of the Chief Accountant. During this meeting, management reached the preliminary conclusion that we had not historically deemed the build-out periods for restaurants to be rent holidays, but rather had expensed rent beginning as of the commencement of the lease term, which typically is the earlier of the commencement of operations or commencement of the lease term. Accordingly, on March 7, 2005, we issued a press release and filed a Form 8-K with the SEC announcing that our previously issued financial statements, including those in our Annual Report on Form 10-K for the fiscal year ended December 28, and the related independent public accountants report, and those in our Quarterly Reports on Form 10-Q for the quarters ended March 28, 2004, June 27, 2004 and September 26, 2004, should no longer be relied upon. Further, we had determined that our unaudited financial results included in our press release issued on February 10, 2005 should no longer be relied upon. Since the March 7 press release, the SEC has provided further guidance regarding the accounting for construction period and preopening lease costs. As a result of this guidance, we adopted an accounting policy to capitalize lease costs during the construction period and adjusted the fourth quarter financial results disclosed in its February 10, 2005 press release, and therefore will not need to restate our prior year financial statements. Overview As of December 26, 2004, we owned and operated 103 and franchised an additional 203 Buffalo Wild Wings Grill & Bar restaurants in 31 states. Of the 306 system-wide restaurants, 80 of those restaurants are located in Ohio. The restaurants have elements of both the quick casual and casual dining styles, both of which are part of a growing industry, with consumer spending in the quick casual segment increasing at a rate greater than in quick service or casual dining, and the grill and bar segment generally considered the largest and a growing sub-segment of the casual dining industry. Our long-term focus is to grow to a national chain of 1,000 21
26 locations, with 20-25% annual unit growth in the next several years, continuing the strategy of developing both company-owned and franchised restaurants. Our growth and success depend on several factors and trends. First, we continue to monitor and react to our cost of goods sold. The costs of goods sold is difficult to predict, as it ranged 32.4% to 35.0% quarter to quarter in 2004, mostly due to the price fluctuation in chicken wings. We are working to counteract the all-time high prices of chicken wings with the introduction of popular new menu items, effective marketing promotions and menu price increases. We will continue to monitor the cost of fresh chicken wing prices, as it can significantly change our cost of sales and cash flow from company-owned restaurants. We also are exploring purchasing strategies to lessen the severity of cost increases and fluctuations, and are reviewing menu additions and other strategies that may decrease the percentage that fresh chicken wings represent in terms of total restaurant sales. The chart below illustrates the fluctuation in fresh chicken wing prices from quarter to quarter in the last five years. A second factor is our success in new markets. In 2005, we do not plan to enter any markets in which we do not already have a presence, although we are opening new corporate restaurants in markets where we already have franchise locations. We will, however, continue our development efforts in the markets we entered in 2004, including new company-owned restaurants in the Dallas and Denver markets, which have met our expectations, and will focus on improving performance in the Atlanta market. Third, we will continue our focus on trends in company-owned and franchised same-store sales as an indicator of the continued acceptance of our concept by consumers. We also review the overall trend in average weekly sales as an indicator of our ability to increase the sales volume, and therefore cash flow per location. We remain committed to high quality operations and guest hospitality, as evidenced by the implementation of our new service style in company-owned and franchised restaurants. 22
27 Our revenue is generated by: Sales at our company-owned restaurants, which represented 89% of total revenue in Food and nonalcoholic beverages accounted for 71% of restaurant sales. The remaining 29% of restaurant sales were from alcoholic beverages. The menu item with the highest sales volume is chicken wings at 29% of total restaurant sales. Royalties and franchise fees received from our franchisees. We generate cash from the operation of our company-owned restaurants and also from franchise royalties and fees. We highlight the specific costs associated with the operations of our company-owned restaurants in the statement of earnings under Restaurant operating costs. Nearly all of our depreciation expense relates to assets used by our company-owned restaurants. Preopening costs are those costs associated with opening new company-owned restaurants and will vary annually based on the number of new locations opened. Restaurant closures and impairment expense is related to company-owned restaurants, and includes the write-down of poor performing locations, the costs associated with closures of locations and normal asset retirements. Certain other expenses, such as general and administrative, relate to both company-owned restaurant and franchising operations. As a growing company, we review our trend in general and administrative expenses, and are focused on reducing this expense as a percentage of revenue. We operate on a 52 or 53-week fiscal year ending on the last Sunday in December. Our fiscal 2000 was a 53-week year. For the purposes of annual comparisons, unless otherwise noted, we have not adjusted for this difference. Critical Accounting Policies and Use of Estimates Our significant accounting policies are described in Note 1 of the Consolidated Financial Statements, which were prepared in accordance with GAAP. Critical accounting policies are those that we believe are both important to the portrayal of our financial condition and results and require our most difficult, subjective or complex judgments, often as a result of the need to make estimates about the effect of matters that are inherently uncertain. We believe that the following discussion represents our more critical accounting policies and estimates used in the preparation of our consolidated financial statements, although it is not inclusive. Valuation of Long-Lived Assets and Store Closing Reserves We review long-lived assets quarterly to determine if the carrying value of these assets may not be recoverable based on estimated future cash flows. Assets are reviewed at the lowest level for which cash flows can be identified, which is at the restaurant level. Restaurants are included in the impairment analysis after they have been open for 15 months. We evaluate each long-lived asset, including leasehold improvements, equipment and fixtures over its remaining lease term, after considering the potential impact of planned operational improvements and marketing programs. In determining future cash flows, significant estimates are made by us with respect to future operating results of each restaurant over its remaining lease term. If assets are determined to be impaired, the impairment charge is measured by calculating the amount by which the asset carrying amount exceeds its fair value. The determination of asset fair value is also subject to significant judgment. During fiscal 2002, and 2004, we recognized $309,000, $621,000 and $453,000, respectively, of asset impairment charges. In addition to the valuation of long-lived assets, we also record a store-closing reserve when a restaurant is abandoned. The store closing reserve is subject to significant judgment as accruals are made for lease payments on abandoned leased facilities. Many factors, including the local business environment, other available lease sites, and the willingness of lessors to negotiate lease buyouts are considered in making the accruals. We estimate 23
28 future lease obligations based on these factors and quarterly evaluate the adequacy of the estimated reserve based on current market conditions. During 2002, we recorded a store-closing reserve of $243,000 to accrue obligations for an underperforming restaurant that was closed in During, we recorded a reserve of $163,000, which included charges of $87,000 for a restaurant closed in and an additional charge of $76,000 for the restaurant closed in The reconciliation of the store closing reserve for the year ended December 29, 2002, December 28,, and December 26, 2004 is as follows: Balance Dec. 30, provision Costs incurred Balance Dec. 29, 2002 Remaining lease obligation and utilities... $ $185 $ (21) $164 Broker fees $ $243 $ (21) $222 Balance Dec. 29, 2002 provision Costs incurred Balance Dec. 28, Remaining lease obligation and utilities... $164 $210 $(163) $211 Broker fees (47) 11 $222 $163 $(163) $222 Balance Dec. 28, 2004 provision Costs incurred Balance Dec. 26, 2004 Remaining lease obligation and utilities... $211 $ 1 $ (76) $136 Broker fees (11) $222 $ (10) $ (76) $136 Vendor Allowances Vendor allowances include allowances, rebates and other funds received from vendors. Certain of these funds are determined based on various quantitative contract terms. We also receive vendor rebates from certain manufacturers and distributors calculated based upon purchases made by franchisees. Amounts expected to be received from vendors are recognized as a reduction of inventoriable costs as product purchases are made from vendors. Amounts that represent a reimbursement of costs incurred, such as advertising, are recorded as a reduction of the related expense. We record an estimate of earned vendor rebates and allowances that are calculated based upon monthly purchases. We generally receive payment from vendors approximately 30 days from the end of a month for that month s purchases. During fiscal 2002, and 2004, vendor allowances were recorded as a reduction in inventoriable costs and cost of sales was reduced by $1.8 million, $2.3 million, and $3.9 million, respectively. Revenue Recognition Franchise Operations Our franchise agreements have terms ranging from 10 to 20 years. These agreements also convey extension terms of five or 10 years depending on contract terms and if certain conditions are met. We provide training, preopening assistance and restaurant operating assistance in exchange for area development fees, franchise fees and royalties of 5% of the franchised restaurant s sales. Franchise fee revenue from individual franchise sales is recognized upon the opening of the restaurant when all our material obligations and initial services to be provided by us have been performed. Area development fees are dependent upon the number of restaurants 24
29 granted in the agreement as are our obligations under the area development agreement. Consequently, as our obligations are met, area development fees are recognized in relation to the expenses incurred with the opening of each new restaurant and any royalty free periods. Royalties are accrued as earned and are calculated each period based on reported franchisees sales. Results of Operations Our operating results for 2002, and 2004 are expressed as a percentage of total revenue below, except for the components of restaurant operating costs, which are expressed as a percentage of restaurant sales. Dec. 29, 2002 Fiscal Years Ended Dec. 28, Dec. 26, 2004 Revenue: Restaurant sales % 89.3% 89.0% Franchising royalties and fees Totalrevenue Costs and expenses: Restaurant operating costs: Cost of sales Labor Operating Occupancy Depreciation General and administrative Preopening Restaurant closures and impairment Totalcostsandexpenses Income from operations Other income (expense): Interest income Interest expense... (1.0) (0.8) Costofdebtextinguishment... (0.3) Totalotherincome(expense),net... (0.9) (1.0) 0.4 Earningsbeforeincometaxes Incometaxexpense Net earnings Accretion resulting from cumulative dividend and mandatory redemption feature of preferred stock Net earnings available to common stockholders % 1.7% 4.2% The number of company-owned and franchised restaurants open are as follows: Dec. 29, 2002 As of Dec. 28, Dec. 26, 2004 Company-owned restaurants Franchised restaurants
30 The restaurant sales for company-owned and franchised restaurants are as follows (in thousands of dollars): Dec. 29, 2002 Fiscal Years Ended Dec. 28, Dec. 26, 2004 Company-owned restaurant sales... $ 85,493 $112,965 $152,221 Franchised restaurant sales , ,165 $359,175 Increases in comparable same-store sales are as follows (based on restaurants operating at least fifteen months): Dec. 29, 2002 Fiscal Years Ended Dec. 28, Dec. 26, 2004 Company-owned same-store sales % 4.3% 9.7% Franchised same-store sales The annual average prices paid per pound for fresh chicken wings are as follows: Dec. 29, 2002 Fiscal Years Ended Dec. 28, Dec. 26, 2004 Annual average price per pound... $.89 $1.06 $1.39 Fiscal Year 2004 Compared to Fiscal Year Restaurant sales increased by $39.3 million, or 34.8%, to $152.2 million in 2004 from $113.0 million in. The increase in restaurant sales was due to a $29.3 million increase associated with the opening of 19 new company-owned restaurants in 2004 and the 24 company-owned restaurants opened before 2004 that did not meet the criteria for same-store sales and $10.0 million related to a 9.7% increase in same-store sales. The increase in same-store sales from 4.3% in to 9.7% in 2004 was due to additional marketing media and promotions, new menu items, and menu price increases. Franchise royalties and fees increased by $5.3 million, or 39.1%, to $18.8 million in 2004 from $13.5 million in. The increase was due primarily to additional royalties collected from the 42 new franchised restaurants that opened in 2004 and a full year of operations for the 36 franchised restaurants that opened in. Same-store sales for franchised restaurants increased 7.6%. Cost of sales increased by $16.1 million, or 45.4%, to $51.5 million in 2004 from $35.4 million in due primarily to more restaurants being operated in Cost of sales as a percentage of restaurant sales increased to 33.8% in 2004 from 31.4% in. The increase in cost of sales as a percentage of restaurant sales was primarily due to higher fresh chicken wing costs. Fresh chicken wings were 34% of cost of goods sold in 2004 compared to 31% in. This increase was primarily due to the rise in average wing costs to $1.39 per pound in 2004 from $1.06 per pound in. Labor expenses increased by $11.2 million, or 34.2%, to $43.9 million in 2004 from $32.7 million in due primarily to more restaurants being operated in Labor expenses as a percentage of restaurant sales were essentially flat year over year, at 28.8% in 2004 compared to 28.9% in. Labor trends in our restaurants opened 15 months or longer were better than prior year but were offset by a tripling of our worker s compensation rates under the state-run insurance program for our 21 Ohio stores. Our labor trends for companyowned restaurants opened less than 15 months remain high as we continue to build our brand in new markets. Operating expenses increased by $5.5 million, or 31.4%, to $23.1 million in 2004 from $17.6 million in due primarily to more restaurants being operated in Operating expenses as a percentage of restaurant sales decreased to 15.2% in 2004 from 15.5% in. The decrease in operating expenses as a percentage of 26
31 restaurant sales was primarily due to the fact that expenses for local store marketing and supplies, insurance costs, and cable subscriptions on sports packages did not increase at the same rate relative to our sales growth. Occupancy expenses increased by $2.5 million, or 32.6%, to $10.3 million in 2004 from $7.7 million in due primarily to more restaurants being operated in Occupancy expenses as a percentage of restaurant sales decreased to 6.7% in 2004 from 6.9% in, primarily due to sales increasing faster than rent expense. Depreciation and amortization increased by $2.7 million, or 38.4%, to $9.7 million in 2004 from $7.0 million in. The increase was primarily due to the additional depreciation on 19 new restaurants in 2004 and 15 new restaurants opened in and operated for a full year in General and administrative expenses increased by $2.4 million, or 14.5%, to $19.4 million in 2004 from $16.9 million in. General and administrative expenses as a percentage of total revenue decreased to 11.3% in 2004 from 13.4% in. This decrease was primarily due to a planned decrease in general and administrative expense growth relative to sales growth, and to our ability to leverage existing corporate infrastructure. However, this decrease was partially offset by $909,000 of stock-based compensation related to the restricted stock plan implemented in Preopening costs increased by $887,000, or 76.8%, to $2.0 million in 2004 from $1.2 million in. In 2004, we opened 19 new company-owned restaurants, incurred costs of approximately $100,000 for restaurants opening in 2005, and incurred costs of approximately $30,000 for restaurants that opened in. In, we opened 15 new company-owned restaurants and incurred cost of approximately $39,000 for 5 restaurants that opened in Average preopening cost per restaurant was $94,000 and $77,000 in 2004 and, respectively. Restaurant closures and asset impairment decreased by $295,000, or 34.0%, to $573,000 in 2004 from $868,000 in. The expense in 2004 represented the asset impairment of two underperforming restaurants, additional reserves related to a restaurant which closed in 2002, and the write-off of miscellaneous equipment. The expense in represented the asset impairment of one underperforming restaurant, closure of one restaurant, additional reserves related to a restaurant which closed in 2002, and impairment of liquor licenses in Ohio. Interest income increased by $559,000 to $671,000 in 2004 from $112,000 in. The increase was due to interest income generated on the higher cash balances as a result of the initial public offering of common stock in November. Cash and marketable securities balances at the end of the year were $49.0 million in 2004 compared to $49.5 million in. Interest expense decreased to zero in 2004 from $947,000 in. All long-term debt and capital lease obligations were repaid in early December with proceeds from the initial public offering. In addition to the interest expense, we incurred a cost of debt extinguishment of $411,000 in relating to the repayment. Provision for income taxes increased $1.8 million to $4.1 million in 2004 from $2.3 million in. The effective tax rate as a percentage of income before taxes decreased from 39.0% in to 36.4% in The rate decrease was primarily a result of favorable resolutions of prior year state income tax matters and an increase in FICA tax credits for employee-reported tips. For 2005, we believe our effective tax rate will be between 37% and 38%. Fiscal Year Compared to Fiscal Year 2002 Restaurant sales increased by $27.5 million, or 32.1%, to $113.0 million in from $85.5 million in The increase in restaurant sales was due to a $24.2 million increase associated with the opening of 15 new company-owned restaurants in and the 8 company-owned restaurants opened before that did not meet the criteria for same-store sales and $3.3 million related to a 4.3% increase in same-store sales. The increase in 27
32 same-store sales from 1.6% in 2002 to 4.3% in was due to more effective marketing promotions, better economic conditions, and the lower level of same-store sales growth in Franchise royalties and fees increased by $2.9 million, or 27.5%, to $13.5 million in from $10.6 million in The increase was due primarily to additional royalties collected from the 36 new franchised restaurants that opened in and a full year of operations for the 28 franchised restaurants that opened in Same-store sales for franchised restaurants increased 5.6%. Cost of sales increased by $10.4 million, or 41.8%, to $35.4 million in from $25.0 million in 2002 due primarily to more restaurants being operated in. Cost of sales as a percentage of restaurant sales increased to 31.4% in from 29.2% in The increase in cost of sales as a percentage of restaurant sales was primarily due to higher fresh chicken wing costs. We are susceptible to wing price fluctuations. Annual average wing prices have ranged from $0.89 to $1.18 per pound during the last three years. For, wing prices averaged $1.06 per pound which was a 19.1% increase over Labor expenses increased by $8.0 million, or 32.7%, to $32.7 million in from $24.6 million in 2002 due primarily to more restaurants being operated in. Labor expenses as a percentage of restaurant sales were essentially flat year over year, at 28.9% in compared to 28.8% in Operating expenses increased by $4.2 million, or 31.9%, to $17.6 million in from $13.3 million in 2002 due primarily to more restaurants being operated in. Operating expenses as a percentage of restaurant sales decreased to 15.5% in from 15.6% in The decrease in operating expenses as a percentage of restaurant sales was primarily due to lower restaurant repairs and maintenance. Occupancy expenses increased by $2.0 million, or 35.0%, to $7.7 million in from $5.7 million in 2002 due primarily to more restaurants being operated in. Occupancy expenses as a percentage of restaurant sales increased to 6.9% in from 6.7% in 2002, primarily due to higher rent expense on new free-standing restaurants opened in and increasing common area maintenance costs for all restaurants. Depreciation and amortization increased by $1.5 million, or 27.0%, to $7.0 million in from $5.5 million in The increase was primarily due to the additional depreciation on 15 new restaurants in and 18 new restaurants opened in 2002 and operated for a full year in. General and administrative expenses increased by $2.8 million, or 19.8%, to $16.9 million in from $14.1 million in 2002 due to higher corporate headcount. General and administrative expenses as a percentage of total revenue decreased to 13.4% in from 14.7% in This decrease was primarily due to a planned decrease in general and administrative expense growth relative to sales growth, and to our ability to leverage existing corporate infrastructure. Preopening costs increased by $70,000, or 6.5%, to $1.2 million in from $1.1 million in The Company opened 15 new restaurants in versus 18 new restaurants in Preopening costs per restaurant opened increased in due to higher labor and training costs. Restaurant closures and asset impairment increased by $160,000, or 22.5%, to $868,000 in from $708,000 in The expense in represented the asset impairment of one underperforming restaurant, closure of one restaurant, additional reserves related to a restaurant which closed in 2002, and impairment of liquor licenses in Ohio. The expense in 2002 represents the impairment and closure of an underperforming restaurant and impairment of liquor licenses in Pennsylvania. Interest income increased by $23,000, or 26.5%, to $112,000 in from $88,000 in The increase was due to interest income generated on the higher cash balances as a result of the initial public offering of common stock. Cash balances at the end of the year were $49.5 million in compared to $4.6 million in Interest expense decreased by $19,000, or 2.0%, to $947,000 in from $966,000 in We repaid all long-term debt and capital lease obligations in early December with proceeds from the initial public 28
33 offering. The decrease was due to debt being held for the full year in 2002 versus 11 months in. In addition to the interest expense noted earlier, we incurred a cost of debt extinguishment of $411,000 relating to the repayment. Provision for income taxes increased $264,000, or 13.0%, to $2.3 million in from $2.0 million in The effective tax rate as a percentage of income before taxes decreased to 39.0% in from 39.8% in Our effective tax rate reflects the full federal and state statutory rates on taxable income. The reduction in our effective tax rate period over period was due to more restaurants being added in states with lower effective rates. Liquidity and Capital Resources Our primary liquidity and capital requirements have been for new restaurant construction, remodeling and maintaining our existing company-owned restaurants, working capital and other general business needs. Our main sources of liquidity and capital are cash flows from operations and the issuance of common stock through an initial public offering in November. The cash and marketable securities balance at the fiscal year ended 2004 was $49.0 million. We invest our cash balances in debt securities with the focus on protection of principal, adequate liquidity and maximization of after-tax returns. These investments include, but are not limited to, high quality money market funds, commercial paper, US government-backed instruments, repurchase agreements, municipal securities, and asset-backed securities. We repaid all long-term capital lease obligations and long-term debt in December. During fiscal 2002, and 2004, net cash provided by operating activities was $10.3 million, $17.8 million, and $21.4 million, respectively. Net cash provided by operating activities in 2004 consisted primarily of net earnings adjusted for non-cash expenses and an increase in unearned franchise fees, accounts payable, and accrued expenses partially offset by an increase in accounts receivable and income tax receivables. The increase in unearned franchise fees was due to a number of area development and franchise agreements sold but for which the restaurants had not yet opened. The increase in accounts payable was due to an increased number of invoices as a result of the larger restaurant base. The increase in accrued expenses was due primarily to higher incentive compensation costs resulting from company performance, higher professional fees resulting from SOX 404 implementation, and a higher gift card liability due to strong fourth quarter gift card sales. The increase in accounts receivable was primarily due to higher credit card receivables partially offset by lower landlord receivables for tenant improvements. The increase in income tax receivables was due to the timing of payments. Net cash provided by operating activities in consisted primarily of net earnings adjusted for non-cash expenses, an increase in accounts payable, accrued expenses, and unearned franchise fees partially offset by an increase in prepaid expenses. The increase in accounts payable was due to more restaurants under construction and due to an increased number of invoices as a result of the larger restaurant base. The increase in accrued expenses was due to larger gift card liabilities, professional fees, and relocation costs. The increase in unearned franchise fees was due to an increased number of franchise agreements sold but not yet opened. The increase in prepaid expenses was due to higher insurance costs as we completed our initial public offering. Net cash provided by operating activities in 2002 consisted primarily of net earnings adjusted for non-cash expenses and an increase in accrued expenses, partially offset by an increase in accounts receivable and the timing of income tax payments which reduced income taxes payable. The increase in accrued expenses was due primarily to higher incentive compensation costs resulting from additional corporate headcount and improved company performance. The increase in accounts receivable was primarily the result of higher amounts of purchased restaurant furniture and fixtures that were pending funding from a third-party lessor, which funding was received in early. Net cash used in investing activities for 2002,, and 2004 was $9.6 million, $10.7 million, and $59.9 million, respectively. Investing activities included purchases of property and equipment related to the opening of new restaurants in all periods. In 2002, and 2004, we opened 18, 15, and 19 new restaurants, respectively. We expect capital expenditures to increase to approximately $23-24 million in fiscal 2005 due to the addition of new company-owned restaurants and the renovation and maintenance of existing restaurants. In 2005, we plan to open new company-owned restaurants and new franchised restaurants. During 29
34 2004, the Company began investing in marketable securities with maturities longer than 90 days. In 2004, the Company purchased $95.5 million of marketable securities and received proceeds of $58.9 million as investments in marketable securities matured. Net cash provided by (used in) financing activities for 2002, and 2004 was ($3.5 million), $37.9 million, and $1.6 million, respectively. Net cash provided by financing activities for 2004 resulted primarily from the issuance of common stock for warrants exercised, stock options exercised, and employee stock purchases of $1.6 million. No additional funding from the issuance of common stock (other than from the exercise of options and employee stock purchases) is anticipated in Net cash provided by financing activities for resulted primarily from the issuance of common stock from the initial public offering ($49.8 million), proceeds from the exercise of warrants and stock options ($1.2 million), partially offset by payments and payoff of all long-term debt and capital lease obligations ($13.2 million). Net cash used in financing activities for 2002 resulted primarily from payments made on capital lease obligations. Our liquidity is impacted by minimum cash payment commitments resulting from operating lease obligations for our restaurants and our corporate offices. Lease terms are generally 10 to 15 years with renewal options and generally require us to pay a proportionate share of real estate taxes, insurance, common area maintenance and other operating costs. Some restaurant leases provide for contingent rental payments based on sales thresholds. Except for one restaurant building, we do not currently own any of the properties on which our restaurants operate and therefore do not have the ability to enter into sale-leaseback transactions as a potential source of cash. The following table presents a summary of our contractual operating lease obligations and commitments as of December 26, 2004: Total Payments Due By Period (in thousands) Less than One year 1-3 years 3-5 years After 5 years Operating lease obligations... $ 99,118 11,023 21,930 19,576 46,589 Commitments for restaurants under development... 32,306 1,334 4,481 4,579 21,912 Total... $131,424 12,357 26,411 24,155 68,501 Prior to our initial public offering, we operated with a net working capital deficit utilizing our cash from operations and proceeds from equity financings and equipment leasing to fund our operations and our expansion. We believe the cash flows from our operating activities and the proceeds from our initial public offering will be sufficient to fund our operations and meet our obligations for the foreseeable future. Recent Accounting Pronouncements In December 2004, the Financial Accounting Standards Board (FASB) issued Statement of Accounting Standards No. 123 (Revised 2004) (SFAS No. 123R), Shared-Based Payment. SFAS No. 123R is a revision of FASB Statement No. 123, Accounting for Stock-Based Compensation and supersedes Accounting Principles Board (APB) Opinion No. 25, Accounting for Stock Issued to Employees and its related implementation guidance. The Statement focuses primarily on accounting for transactions in which an entity obtains employee services through share-based payment transactions. SFAS No 123R requires a public entity measure the cost of employee services received in exchange for the award of equity instruments based on the fair value of the award at the date of grant. The cost will be recognized over the period during which an employee is required to provide services in exchange for the award. SFAS No. 123R is effective as of the beginning of the first interim or annual reporting period that begins after June 15, 2005 and the Company is required to adopt the standard in the third 30
35 quarter of fiscal year While the Company cannot precisely determine the impact on net earnings as a result of the adoption of SFAS No 123R, estimated compensation expense related to prior periods can be found in Note 1(w) to the financial statements included in this Form 10-K. The ultimate amount of increased compensation expense will be dependent on the number of option shares granted during the year, their timing and vesting period and the method used to calculate the fair value of the awards, among other factors. Quarterly Results of Operations The following table sets forth, by quarter, the unaudited quarterly results of operations for the two most recent years, as well as the same data expressed as a percentage of our total revenue for the periods presented. Restaurant operating costs are expressed as a percentage of restaurant sales. The information for each quarter is unaudited and we have prepared it on the same basis as the audited financial statements appearing elsewhere in this document. In the opinion of management, all necessary adjustments, consisting only of normal recurring adjustments, have been included to present fairly the unaudited quarterly results. All amounts, except per share amounts, are expressed in thousands. Quarterly and annual operating results may fluctuate significantly as a result of a variety of factors, including increases or decreases in same-store sales, changes in fresh chicken wing prices, the timing and number of new restaurant openings and their related expenses, asset impairment charges, store closing charges, general economic conditions and seasonal fluctuations. As a result, our quarterly results of operations are not necessarily indicative of the results that may be achieved for any future period. In the fourth quarter of 2004, the Company had favorable resolutions of prior year tax matters. The result was a lower effective tax rate for the quarter of 30.4%. 31
36 Results of Quarterly Operations Mar. 30, Jun. 29, Sep. 28, Dec. 28, Mar. 28, 2004 Jun. 27, 2004 Sep. 26, 2004 Dec. 26, 2004 Revenue: Restaurant sales... $26,587 $25,974 $27,876 $32,528 $35,926 $35,291 $37,900 $43,104 Franchise royalties and fees... 2,988 3,120 3,223 4,201 4,257 4,261 4,807 5,502 Total revenue... 29,575 29,094 31,099 36,729 40,183 39,552 42,707 48,606 Costs and expenses: Restaurant operating costs: Cost of sales... 8,128 8,087 8,701 10,507 12,427 12,342 12,755 13,983 Labor... 7,775 7,662 8,135 9,112 9,959 10,095 11,203 12,596 Operating... 4,282 3,939 4,349 4,989 5,422 5,358 5,925 6,375 Occupancy... 1,792 1,929 1,906 2,111 2,293 2,582 2,719 2,665 Depreciation... 1,648 1,732 1,744 1,897 2,033 2,156 2,245 3,283 General and administrative... 3,641 4,238 4,209 4,838 4,054 4,569 5,009 5,740 Preopening Restaurant closures and impairment Total costs and expenses... 27,547 28,384 29,283 34,160 36,542 37,581 40,949 45,331 Income from operations... 2, ,816 2,569 3,641 1,971 1,758 3,276 Other income (expense): Interest income Interest expense... (252) (270) (247) (178) Cost of debt extinguishment... (411) Total other income (expense), net... (240) (249) (226) (531) Earnings before income taxes... 1, ,590 2,038 3,774 2,126 1,932 3,485 Income tax expense , ,061 Net earnings... 1, ,241 2,302 1,297 1,179 2,424 Accretion resulting from cumulative dividend and mandatory redemption feature of preferred stock Net earnings (loss) available to common shareholders... $ 690 $ (121) $ 568 $ 994 $ 2,302 $ 1,297 $ 1,179 $ 2,424 Earnings per common share basic... $ 0.27 (0.04) Earnings per common share diluted (0.04) Weighted average shares outstanding basic... 2,552 2,720 2,755 4,875 7,815 8,097 8,253 8,318 Weighted average shares outstanding diluted... 3,161 2,720 3,386 5,459 8,382 8,575 8,599 8,645 32
37 Results of Quarterly Operations Mar. 30, Jun. 29, Sep. 28, Dec. 28, Mar. 28, 2004 Jun. 27, 2004 Sep. 26, 2004 Dec. 26, 2004 Revenue: Restaurant sales % 89.3% 89.6% 88.6% 89.4% 89.2% 88.7% 88.7% Franchise royalties and fees Total revenue Costs and expenses: Restaurant operating costs: Cost of sales Labor Operating Occupancy Depreciation General and administrative Preopening Restaurant closures and impairment Total costs and expenses Income from operations Other income (expense): Interest income Interest expense... (0.9) (0.9) (0.8) (0.5) Cost of debt extinguishment... (1.1) Total other income (expense), net... (0.8) (0.9) (0.7) (1.5) Earnings before income taxes Income tax expense Net earnings Accretion resulting from cumulative dividend and mandatory redemption feature of preferred stock Net earnings (loss) available to common shareholders % (0.4)% 1.8% 2.7% 5.7% 3.3% 2.8% 5.0% 33
38 ITEM 7A. QUANTITATIVE AND QUALITATIVE DISCLOSURES ABOUT MARKET RISK We are exposed to market risk related to our cash and cash equivalents. We invest our excess cash in highly liquid short-term investments with maturities of less than one year. These investments are not held for trading or other speculative purposes. Changes in interest rates affect the investment income we earn on our cash and cash equivalents and, therefore, impact our cash flows and results of operations. Many of the food products purchased by us are affected by weather, production, availability and other factors outside our control. We believe that almost all of our food and supplies are available from several sources, which helps to control food product risks. We negotiate directly with independent suppliers for our supply of food and paper products. We use members of UniPro Food Services, Inc., a national cooperative of independent food distributors, to distribute these products from the suppliers to our restaurants. We have minimum purchase requirements with some of our vendors, but the terms of the contracts and nature of the products are such that our purchase requirements do not create a market risk. The primary food product used by company-owned and franchised restaurants is fresh chicken wings. We purchase fresh chicken wings based on current market prices that are subject to weekly fluctuation. A material increase in fresh chicken wing costs may adversely affect our operating results. Fresh chicken wing prices are near all-time highs, with prices as of the end of February 2005 at $1.52 per pound compared to the average per pound price of $1.39 in Unless there is a reduction in the price of fresh chicken wings, or we are able to successfully adjust menu prices or menu mix or otherwise make operational adjustments to account for the high wing prices, our operating results could be adversely affected. Fresh chicken wings accounted for approximately 28%, 31%, and 34% of our cost of sales in 2002,, and 2004, respectively, with an annual average price per pound of $.89, $1.06, and $1.39, respectively. If we had experienced an additional 10% increase in fresh chicken wing costs during 2004, restaurant cost of sales would have increased by approximately $1.8 million for fiscal Additional information related to chicken wing prices is included in Item 7 under Results of Operations. Inflation The primary inflationary factors affecting our operations are food, labor, and restaurant operating costs. Substantial increases in these costs could impact operating results to the extent that such increases cannot be passed along through higher menu prices. A large number of our restaurant personnel are paid at rates based on the applicable federal and state minimum wages, and increases in the minimum wage rates could directly affect our labor costs. Many of our leases require us to pay taxes, maintenance, repairs, insurance and utilities, all of which are generally subject to inflationary increases. We believe inflation has not had a material impact on our results of operations in recent years. Financial Instruments Financial instruments that potentially subject the Company to concentrations of credit risk consist principally of investments. The counterparties to the instruments consist of government agencies and various major corporations of investment grade credit standing. The Company does not believe there is a significant risk of non-performance by these counterparties because of Company limitations as to acceptable investment vehicles. 34
39 ITEM 8. FINANCIAL STATEMENTS AND SUPPLEMENTARY DATA BUFFALO WILD WINGS, INC. Index to Consolidated Financial Statements Report of Independent Registered Public Accounting Firm Consolidated Balance Sheets as of December 28, and December 26, Consolidated Statements of Earnings for the Years Ended December 29, 2002, December 28,, and December 26, Consolidated Statements of Stockholders Equity for the Years Ended December 29, 2002, December 28,, and December 26, Consolidated Statements of Cash Flows for the Years Ended December 29, 2002, December 28,, and December 26, Notes to Consolidated Financial Statements
40 Report of Independent Registered Public Accounting Firm The Board of Directors and stockholders Buffalo Wild Wings, Inc.: We have audited the accompanying consolidated balance sheets of Buffalo Wild Wings, Inc. and subsidiaries (the Company) as of December 28, and December 26, 2004, and the related consolidated statements of earnings, stockholders equity, and cash flows for each of the fiscal years in the three-year period ended December 26, These consolidated financial statements are the responsibility of the Company s management. Our responsibility is to express an opinion on these consolidated financial statements based on our audits. We conducted our audits in accordance with the standards of the Public Company Accounting Oversight Board (United States). Those standards require that we plan and perform the audit to obtain reasonable assurance about whether the financial statements are free of material misstatement. An audit includes examining, on a test basis, evidence supporting the amounts and disclosures in the financial statements. An audit also includes assessing the accounting principles used and significant estimates made by management, as well as evaluating the overall financial statement presentation. We believe that our audits provide a reasonable basis for our opinion. In our opinion, the consolidated financial statements referred to above present fairly, in all material respects, the financial position of Buffalo Wild Wings, Inc. and subsidiaries as of December 28, and December 26, 2004, and the results of their operations and their cash flows for each of the fiscal years in the three-year period ended December 26, 2004, in conformity with U.S. generally accepted accounting principles. We have also audited, in accordance with the standards of the Public Company Accounting Oversight Board (United States), the effectiveness of the Company s internal control over financial reporting as of December 26, 2004, based on the criteria established in Internal Control Integrated Framework issued by the Committee of Sponsoring Organizations of the Treadway Commission ( COSO ), and our report dated March 25, 2005 expressed an unqualified opinion. /S/ KPMG LLP Minneapolis, Minnesota March 25,
41 BUFFALO WILD WINGS, INC. AND SUBSIDIARIES CONSOLIDATED BALANCE SHEETS December 28, and December 26, 2004 (Dollar amounts in thousands) December 28, December 26, 2004 Assets Current assets: Cash and cash equivalents... $ 49,538 12,557 Marketable securities... 36,454 Accounts receivable franchisees, net of allowance of $ Accounts receivable other... 1,634 2,077 Inventory ,207 Income taxes receivable ,727 Prepaidexpenses... 1,230 1,470 Deferred income taxes... 1, Total current assets... 55,663 57,021 Property and equipment, net... 44,450 59,649 Restricted cash... 2, Other assets Goodwill Total assets... $103, ,985 Liabilities and Stockholders Equity Current liabilities: Unearned franchise fees... $ 1,959 2,433 Accounts payable... 4,941 5,383 Accrued compensation and benefits... 4,670 6,339 Accrued expenses... 3,580 3,663 Current portion of deferred lease credits Total current liabilities... 15,641 18,327 Long-term liabilities: Marketing fund payables... 2, Deferred income taxes... 4,733 6,298 Deferred lease credits, net of current portion... 6,133 7,871 Total liabilities... 28,932 33,278 Commitments and contingencies (notes 4 and 14) Stockholders equity: Undesignated stock, 5,600,000 shares authorized... Common stock, no par value. Authorized 15,600,000 shares; issued and outstanding 7,981,945, and 8,425,771, respectively... 66,235 71,491 Deferred compensation... (1,817) Retained earnings... 8,832 16,033 Total stockholders equity... 75,067 85,707 Total liabilities and stockholders equity... $103, ,985 See accompanying notes to consolidated financial statements. 37
42 BUFFALO WILD WINGS, INC. AND SUBSIDIARIES CONSOLIDATED STATEMENTS OF EARNINGS Fiscal years ended December 29, 2002, December 28,, and December 26, 2004 (Dollar amounts in thousands except share and per share data) Revenue: December 29, 2002 Fiscal years ended December 28, December 26, 2004 Restaurant sales... $ 85, , ,221 Franchise royalties and fees... 10,614 13,532 18,827 Totalrevenue... 96, , ,048 Costs and expenses: Restaurant operating costs: Cost of sales... 24,983 35,423 51,507 Labor... 24,640 32,684 43,853 Operating... 13,311 17,559 23,080 Occupancy... 5,734 7,738 10,259 Depreciation... 5,528 7,021 9,717 General and administrative... 14,133 16,926 19,372 Preopening... 1,085 1,155 2,042 Restaurant closures and impairment Totalcostsandexpenses... 90, , ,403 Income from operations... 5,985 7,123 10,645 Other income (expense): Interest income Interest expense... (966) (947) Costofdebtextinguishment... (411) Total other income (expense), net... (878) (1,246) 671 Earningsbeforeincometaxes... 5,107 5,877 11,316 Incometaxexpense... 2,030 2,294 4,115 Net earnings... 3,077 3,583 7,201 Accretion resulting from cumulative dividend and mandatory redemption feature of preferred stock... 1,457 1,452 Net earnings available to common stockholders... $ 1,620 2,131 7,201 Earnings per common share basic... $ Earnings per common share diluted Weighted average shares outstanding basic... 2,529,094 3,222,445 8,165,078 Weighted average shares outstanding diluted... 2,976,093 3,841,961 8,603,881 See accompanying notes to consolidated financial statements. 38
43 BUFFALO WILD WINGS, INC. AND SUBSIDIARIES CONSOLIDATED STATEMENTS OF STOCKHOLDERS EQUITY Fiscal years ended December 29, 2002, December 28,, and December 26, 2004 (Dollar amounts in thousands) Common Stock Deferred Retained Shares Amount Comp earnings Total Balance at December 30, ,528,929 $ 1,842 5,081 6,923 Net earnings... 3,077 3,077 Accretion resulting from cumulative dividend and mandatory redemption feature of preferred stock... (1,457) (1,457) Exercise of stock options... 6, Balance at December 29, ,534,929 1,862 6,701 8,563 Net earnings... 3,583 3,583 Accretion resulting from cumulative dividend and mandatory redemption feature of preferred stock... (1,452) (1,452) Conversion of preferred stock... 1,849,415 13,240 13,240 Issuance of common stock... 3,250,000 49,766 49,766 Exercise of warrants , Exercise of stock options , Tax benefit from stock issued Stock-based compensation Balance at December 28,... 7,981,945 66,235 8,832 75,067 Net earnings... 7,201 7,201 Shares issued under employee stock purchase plan... 28, Net issuances of restricted stock... 78,639 2,726 (2,726) Exercise of warrants , Exercise of stock options , Tax benefit from stock issued Stock-based compensation Balance at December 26, ,425,771 $71,491 (1,817) 16,033 85,707 See accompanying notes to consolidated financial statements. 39
44 BUFFALO WILD WINGS, INC. AND SUBSIDIARIES CONSOLIDATED STATEMENTS OF CASH FLOWS Fiscal years ended December 29, 2002, December 28,, and December 26, 2004 (Dollar amounts in thousands) December 29, 2002 Fiscal years ended December 28, December 26, 2004 Cash flows from operating activities: Net earnings... $ 3,077 3,583 7,201 Adjustments to reconcile net earnings to cash provided by operations: Depreciation... 5,528 7,021 9,717 Amortization Restaurant closures and impairment Deferred lease credits... 1,649 1, Deferred income taxes... 2, ,947 Tax benefit from stock issuance Stock-based compensation Change in operating assets and liabilities: Accounts receivable... (1,921) (15) (1,023) Inventory... (133) (194) (229) Prepaidexpenses... 7 (697 (240) Other assets... (206) (21) (72) Unearned franchise fees Accounts payable , Incometaxes... (1,956) 478 (1,360) Accrued expenses... 1,084 1,635 1,772 Net cash provided by operating activities... 10,337 17,753 21,362 Cash flows from investing activities: Acquisition of property and equipment... (9,592) (10,739) (23,310) Purchase of marketable securities... (95,475) Proceeds of marketable securities... 58,870 Net cash used in investing activities... (9,592) (10,739) (59,915) Cash flows from financing activities: Issuance of common stock ,110 1,572 Paymentsonnotespayable... (179) (706) Payments on capital lease obligations... (3,322) (12,532) Net cash provided by (used in) financing activities... (3,481) 37,872 1,572 Net increase (decrease) in cash and cash equivalents... (2,736) 44,886 (36,981) Cash and cash equivalents at beginning of year... 7,388 4,652 49,538 Cash and cash equivalents at end of year... $ 4,652 49,538 12,557 See accompanying notes to consolidated financial statements. 40
45 BUFFALO WILD WINGS, INC. AND SUBSIDIARIES Notes to Consolidated Financial Statements December 28, and December 26, 2004 (Dollar amounts in thousands, except per-share amounts) (1) Nature of Business and Summary of Significant Accounting Policies (a) Nature of Business The Company was organized for the purpose of operating Buffalo Wild Wings restaurants, as well as selling Buffalo Wild Wings restaurant franchises. In exchange for the initial and continuing franchise fees received, the Company gives franchisees the right to use the name Buffalo Wild Wings. At December 29, 2002, December 28,, and December 26, 2004, the Company operated 70, 84, and 103 respectively, Company-owned restaurants and had 129, 161, and 203 respectively, restaurants in operation by franchisees. (b) Principles of Consolidation The consolidated financial statements include the accounts of Buffalo Wild Wings, Inc. and its wholly owned subsidiaries (collectively, the Company). All significant intercompany accounts and transactions have been eliminated in consolidation. (c) Fiscal Year The Company utilizes a 52- or 53-week accounting period that ends on the last Sunday in December. The fiscal years ended December 29, 2002, December 28,, and December 26, 2004 were comprised of 52 weeks. (d) Restaurant Sales Concentration As of December 26, 2004, the Company operated 21 Company-owned restaurants and had 59 franchised restaurants in the state of Ohio. The Company-owned restaurants in Ohio aggregated 34.1%, 31.9%, and 26.5%, respectively, of the Company s restaurant sales in fiscal 2002,, and The Company is subject to adverse trends and economic conditions in that state. (e) Cash and Cash Equivalents Cash and cash equivalents include highly liquid investments with maturities at purchase of three months or less. (f) Marketable Securities Marketable securities consist of available-for-sale securities that are carried at fair value and held-tomaturity securities that are stated at amortized cost, which approximates market. Available-for-sale securities are classified as current assets based upon our intent and ability to use any and all of the securities as necessary to satisfy the operational requirements of our business. Realized gains and losses from the sale of available-for-sale securities were not material for fiscal Unrealized losses are charged against net earnings when a decline in fair value is determined to be other than temporary. The available-for-sale investments carry short-term repricing features which generally results in these investments having a value at or near par value (cost). 41
46 BUFFALO WILD WINGS, INC. AND SUBSIDIARIES Notes to Consolidated Financial Statements (Continued) December 28, and December 26, 2004 (Dollar amounts in thousands, except per-share amounts) (g) Accounts Receivable Accounts receivable franchisees represents royalty receivables from the Company s franchisees. Accounts receivable other consists primarily of contractually determined receivables for leasehold improvements, credit cards, vendor rebates, and purchased interest on investments. (h) Inventories Inventories are stated at the lower of cost or market. Cost is determined by the first-in, first-out (FIFO) method. The Company purchases its product from a number of suppliers and believes there are alternative suppliers. The Company has no minimum purchase commitments from its vendors. The primary food product used by Company-owned and franchised restaurants is fresh chicken wings. Fresh chicken wings are purchased by the Company based on current market conditions and are subject to fluctuation. Material increases in fresh chicken wing costs may adversely effect the Company s operating results. For fiscal 2002,, and 2004, fresh chicken wings were 28%, 31%, and 34% of restaurant cost of sales. (i) Property and Equipment Property and equipment are recorded at cost. Leasehold improvements include the cost of improvements funded by landlord incentives or allowances and during the build-out period leasehold improvements are amortized using the straight-line method over the lesser of the term of the lease, without consideration of renewal options, or the estimated useful lives of the assets, which range from one to ten years. Furniture and equipment, including equipment under capital leases, are depreciated using the straight-line method over the estimated useful lives of the assets, which range from two to eight years. Maintenance and repairs are expensed as incurred. Upon retirement or disposal of assets, the cost and accumulated depreciation are eliminated from the respective accounts and the related gains or losses are credited or charged to earnings. (j) Impairment of Long-Lived Assets and Long-Lived Assets to Be Disposed of The Company reviews long-lived assets quarterly to determine if the carrying value of these assets may not be recoverable based on estimated future undiscounted cash flows. Assets are reviewed at the lowest level for which cash flows can be identified, which is the restaurant level. In determining future cash flows, significant estimates are made by the Company with respect to future operating results of each restaurant over its remaining lease term. If such assets are considered impaired, the impairment to be recognized is measured by the amount by which the carrying amount of the assets exceeds the fair value of the assets. Fair value is generally determined by estimated future discounted cashflows. (k) Goodwill and Other Assets Goodwill represents the excess of cost over the fair value of identified net assets of business acquired. The Company acquired two restaurants in Goodwill and purchased liquor licenses are subject to an annual impairment analysis. In early 2002, the Company finalized purchase price adjustments resulting in an increase to goodwill of $95. The carrying amount of goodwill related to these acquisitions is $759. The Company identifies potential impairments by comparing the fair value of a reporting unit with its book value, including goodwill. If the fair value of the reporting unit exceeds the carrying amount, the asset is not impaired. If the carrying value exceeds the fair value, the Company calculates the possible impairment by comparing the implied fair value of 42
47 BUFFALO WILD WINGS, INC. AND SUBSIDIARIES Notes to Consolidated Financial Statements (Continued) December 28, and December 26, 2004 (Dollar amounts in thousands, except per-share amounts) the asset with the carrying amount. If the implied value of the asset is less than the carrying value, a write-down is recorded. Based on the Company s analysis, goodwill was recoverable as of December 26, Other intangible assets consist primarily of liquor licenses. These licenses are either amortized over their annual renewal period or, if purchased, are carried at the lower of fair value or cost. In fiscal 2002, the Company recorded an impairment charge for the liquor licenses in the Pittsburgh market. Due to a change in the local law, the licenses market value decreased and a charge of $159 was recorded to reduce the carrying value to fair value. In, a similar decline occurred in Ohio and a charge of $31 was recorded to reduce the carrying value to fair value. The carrying value of the liquor licenses not subject to amortization as of December 26, 2004 was $275 and is included in other assets. (l) Fair Values of Financial Instruments The carrying value of the Company s financial assets and liabilities, because of their short-term nature, approximates fair value. (m) Revenue Recognition Franchise agreements have terms ranging from ten to twenty years. These agreements also convey multiple extension terms of five or ten years, depending on contract terms and if certain conditions are met. The Company provides the use of the Buffalo Wild Wings trademarks, system, training, preopening assistance, and restaurant operating assistance in exchange for area development fees, franchise fees, and royalties of 5% of the franchised restaurant s sales. Franchise fee revenue from individual franchise sales is recognized upon the opening of the franchisee restaurant when all material obligations and initial services to be provided by the Company have been performed. Area development fees are dependent upon the number of restaurants in the territory, as are the Company s obligations under the area development agreement. Consequently, as obligations are met, area development fees are recognized proportionally with expenses incurred with the opening of each new restaurant and any royalty free periods. Royalties are accrued as earned and are calculated each period based on the reporting franchisees sales. Sales from Company-owned restaurant revenues are recognized as revenue at the point of the delivery of meals and services. (n) Franchise Operations The Company enters into franchise agreements with unrelated third parties to build and operate restaurants using the Buffalo Wild Wings brand within a defined geographical area. The Company believes that franchising is an effective and efficient means to expand the Buffalo Wild Wings brand. Franchised restaurants open for a full year averaged $2.0 million in sales in The franchisee is required to operate their restaurants in compliance with their franchise agreement that includes adherence to operating and quality control procedures established by the Company. The Company does not provide loans, leases, or guarantees to the franchisee or the franchisee s employees and vendors. If a franchisee becomes financially distressed, the Company does not provide any financial assistance. If financial distress leads to a franchisee s noncompliance with the franchise agreement and the Company elects to terminate the franchise agreement, the Company has the right but not the obligation to acquire the assets of the franchisee at fair value as determined by an independent appraiser. The 43
48 BUFFALO WILD WINGS, INC. AND SUBSIDIARIES Notes to Consolidated Financial Statements (Continued) December 28, and December 26, 2004 (Dollar amounts in thousands, except per-share amounts) Company receives a 5% royalty of gross sales as defined in the franchise agreement and in most cases, allowances directly from the franchisees vendors that generally are less than 0.5% of the franchisees gross sales. The Company has financial exposure for the collection of the royalty payments. Franchisees generally remit franchise payments weekly for the prior week s sales which substantially minimizes the Company s financial exposure. Historically, the Company has experienced insignificant write-offs of franchisee royalties. Franchise and area development fees are paid upon the signing of the related agreements. (o) Advertising Costs Advertising costs for Company-owned restaurants are expensed as incurred and aggregate $2,762, $3,401, and $4,278, in fiscal years ended 2002,, and 2004, respectively. The Company s advertising costs exclude amounts collected from franchisees as part of the system-wide marketing and advertising fund. (p) Preopening Costs Costs associated with the opening of new stores are expensed as incurred. (q) Payments Received from Vendors Vendor allowances include allowances, rebates, and other funds received from vendors. Certain of these funds are determined based on various quantitative contract terms. The Company also receives vendor rebates from certain manufacturers and distributors calculated based upon purchases made by franchisees. Amounts that represent a reimbursement of costs incurred, such as advertising, are recorded as a reduction of the related expense. Amounts that represent a reduction of inventory purchase costs are recorded as a reduction of inventoriable costs. The Company records an estimate of earned vendor rebates and allowances that are calculated based upon monthly purchases. Payment is generally received from vendors approximately 30 days from end of a month for that month s purchases. During fiscal 2002,, and 2004, such vendor allowances were recorded as a reduction in inventoriable costs, and cost of sales was reduced by $1,804, $2,338, and $3,913, respectively. (r) National Advertising Fund The Company has a system-wide marketing and advertising fund. Company-owned and franchised restaurants are required to remit a designated portion of sales, currently 2.5%, to a separate advertising fund that is used for marketing and advertising efforts throughout the system. Certain payments received from various vendors are deposited into the National Advertising Fund. These funds are used for development and implementation of system-wide initiatives and programs. The Company accounts for cash and receivables of these funds as restricted cash and marketing fund receivables with an offsetting marketing fund payables on its balance sheet. (s) Earnings Per Common Share Basic earnings per common share excludes dilution and is computed by dividing the net earnings available to common stockholders by the weighted average number of common shares outstanding during the period. Diluted earnings per common share include dilutive common stock equivalents consisting of stock options and warrants determined by the treasury stock method and dilutive convertible securities. Both basic and diluted earnings per common share are calculated after deducting the accretion resulting from cumulative dividend 44
49 BUFFALO WILD WINGS, INC. AND SUBSIDIARIES Notes to Consolidated Financial Statements (Continued) December 28, and December 26, 2004 (Dollar amounts in thousands, except per-share amounts) associated with the mandatory redemption feature of the Company s Series A preferred stock, which was converted to common stock in November. (t) Income Taxes Deferred tax assets and liabilities are recognized for the future tax consequences attributable to differences between the balance sheet carrying amounts of existing assets and liabilities and their respective tax bases. Deferred tax assets and liabilities are measured using enacted tax rates expected to apply to taxable income in the years in which those temporary differences are expected to be recovered or settled. (u) Deferred Lease Credits Deferred lease credits consist of reimbursement of costs of leasehold improvements from the Company s lessors. These reimbursements are amortized on a straight-line basis over the term of the applicable lease, without consideration of renewal options. In addition, this account includes adjustments to recognize rent expense on a straight-line basis over the term of the lease commencing at the start of the Company s construction of build-outs, without consideration of renewal options. Leases typically have an initial lease term of between years and contain renewal options under which the Company may extend the terms for periods of three to five years. Certain leases contain rent escalation clauses that require higher rental payments in later years. Leases may also contain rent holidays, or free rents, during the lease term. Rent expense is recognized on a straight-line basis over the initial lease term. Rent expense is recognized over the build-out period is capitalized and depreciated over the economic life of the asset, generally ten years. (v) Accounting Estimates The preparation of financial statements in conformity with U.S. generally accepted accounting principles requires management to make estimates and assumptions that affect the reported amounts of assets and liabilities and disclosure of contingent assets and liabilities at the date of the financial statements and the reported amounts of revenues and expenses during the reporting period. Actual results could differ from those estimates. (w) Stock-Based Compensation The Company adopted a stock performance plan in June 2004 and granted 80,053 restricted stock units. These units are subject to annual vesting upon the Company achieving performance targets established by the Board of Directors. The Company records compensation expense for the restricted stock units if vesting based on the achievement of performance targets is probable. The restricted stock units may vest one-third annually over a ten year period. However, the second third of the restricted stock units is not subject to vesting until the first one-third vests and the final one-third is not subject to vesting until the first two-thirds of the award have vested. An aggregate 26,213 restricted stock units vested in 2004 and 52,426 restricted stock units are subject to vesting in future periods. The Company applies the intrinsic-value method in accounting for its employee stock option grants and records compensation expense for option grants to employees under its stock option plan if the current market value of the underlying stock at the grant date exceeds the stock option exercise price. No such grants have been issued. Accordingly, no compensation cost has been recognized for its stock options in the financial statements. Pro forma disclosure of the net earnings impact of applying an alternative method of recognizing stock compensation expense over the vesting period is based on the fair value of all stock-based awards on the date of 45
50 BUFFALO WILD WINGS, INC. AND SUBSIDIARIES Notes to Consolidated Financial Statements (Continued) December 28, and December 26, 2004 (Dollar amounts in thousands, except per-share amounts) grant. If the Company had elected to recognize compensation cost based on the fair value at the grant date for its stock options under SFAS No. 123, the Company s net earnings would have been decreased to the pro forma amounts indicated in the table below. The impact of calculating compensation cost for stock options under SFAS No. 123 is reflected over the options vesting period, typically four years. December 29, 2002 Fiscal Years Ended December 28, December 26, 2004 Net earnings, as reported... $3,077 3,583 7,201 Add: Total stock-based employee compensation expense included in reported earnings, net of related tax effects Deduct: Total stock-based employee compensation expense determined under fair value-based method for stock option and purchase plans, net of related tax effects Pro forma net earnings... $2,879 3,353 7,043 Net earnings per common share: As reported (basic)... $ Pro forma (basic) As reported (dilutive) Proforma(dilutive) The fair value of each option grant is estimated on the date of grant using the Black-Scholes option-pricing model with the following assumptions: December 29, 2002 Fiscal Years Ended December 28, December 26, 2004 Expected dividend yield % 0.0% 0.0% Expected stock price volatility % 39.0% 38.0% Risk-free interest rate % 2.5% 2.9% Expected life of options... 5years 5 years 5 years The per-share weighted average fair value of stock options granted during 2002,, and 2004 was $2.05, $5.41, and $10.44 respectively. Volatility was calculated based on an analysis of the Company s industry peers and its own stock price since the initial public offering in fiscal. (x) New Accounting Pronouncements In December 2004, the Financial Accounting Standards Board (FASB) issued Statement of Accounting Standards No. 123 (Revised 2004) (SFAS No. 123R), Shared-Based Payment. SFAS No. 123R is a revision of 46
51 BUFFALO WILD WINGS, INC. AND SUBSIDIARIES Notes to Consolidated Financial Statements (Continued) December 28, and December 26, 2004 (Dollar amounts in thousands, except per-share amounts) FASB Statement No. 123, Accounting for Stock-Based Compensation and supersedes Accounting Principles Board (APB) Opinion No. 25, Accounting for Stock Issued to Employees and its related implementation guidance. The Statement focuses primarily on accounting for transactions in which an entity obtains employee services through share-based payment transactions. SFAS No 123R requires a public entity measure the cost of employee services received in exchange for the award of equity instruments based on the fair value of the award at the date of grant. The cost will be recognized over the period during which an employee is required to provide services in exchange for the award. SFAS No. 123R is effective as of the beginning of the first interim or annual reporting period that begins after June 15, 2005 and the Company will adopt the standard in the third quarter of fiscal year While the Company cannot precisely determine the impact on net earnings as a result of the adoption of SFAS No 123R, estimated compensation expense related to prior periods can be found in Note 1(w) to the financial statements included in this Form 10-K. The ultimate amount of increased compensation expense will be dependent on the number of option shares granted during the year, their timing and vesting period and the method used to calculate the fair value of the awards, among other factors. (y) Reclassifications The accompanying consolidated financial statements for prior fiscal years contain certain reclassifications to conform with the presentation used in fiscal These reclassifications included $1,685 and $1,843 for and 2002, respectively, of proceeds from lessors previously included in financing activities and now included in deferred lease credits within operating activities in the consolidated statements of cash flows. Adjustments for lease accounting related to 2004 and prior periods were recorded in the fourth quarter of The adjustments included increases to depreciation expense of $653 and preopening expenses of $200 offset by a reduction of occupancy expenses of $498. These adjustments were considered immaterial to the previous periods presented. (2) Marketable Securities Marketable securities were comprised as follows: December 26, 2004 Held-to-maturity Federal agencies... $ 5,645 Municipal securities... 14,184 19,829 Available-for-sale Municipal securities... 16,625 Total... $36,454 Purchases of available for-sale securities totaled $69.9 million in 2004 with sales totaling $53.2 million. Purchases of held-to-maturity securities totaled $25.5 million in 2004 with proceeds from maturities totaling $5.6 million. All held-to-maturity debt securities are due within one year and had aggregate fair values of $
52 BUFFALO WILD WINGS, INC. AND SUBSIDIARIES Notes to Consolidated Financial Statements (Continued) December 28, and December 26, 2004 (Dollar amounts in thousands, except per-share amounts) million at December 26, The fair value of available-for-sale investments in debt securities by contractual maturities at December 26, 2004, is as follows: Maturity date Fair Value 1-5 years... $ 1, years... 5,548 After 10 years... 9,477 Total... $16,625 (3) Property and Equipment Property and equipment consists of the following: December 28, As of December 26, 2004 Construction in process... $ 1,080 3,088 Leasehold improvements... 37,899 51,736 Furniture, fixtures, and equipment... 27,541 36,296 66,520 91,120 Less accumulated depreciation... (22,070) (31,471) $ 44,450 59,649 (4) Lease Commitments The Company leases all of its restaurants and corporate offices under operating leases that have various expiration dates. In addition to base rents, leases typically require the Company to pay its share of maintenance and real estate taxes and certain leases include provisions for contingent rentals based upon sales. Future minimum rental payments due under noncancelable operating leases for existing restaurants and commitments for restaurants under development as of December 26, 2004 are as follows: Operating leases Restaurants under development Fiscal year ending: $11,023 1, ,034 2, ,896 2, ,160 2, ,416 2,299 Thereafter... 46,589 21,912 Total future minimum lease payments... $99,118 32,306 In 2002,, and 2004, the Company rented office and warehouse space under operating leases which, in addition to the minimum lease payments, require payment of a proportionate share of the real estate taxes and building operating expenses. The Company also rents restaurant space under operating leases, some of which, in 48
53 BUFFALO WILD WINGS, INC. AND SUBSIDIARIES Notes to Consolidated Financial Statements (Continued) December 28, and December 26, 2004 (Dollar amounts in thousands, except per-share amounts) addition to the minimum lease payments and proportionate share of real estate and operating expenses, require payment of percentage rents based upon sales levels. Rent expense, excluding the Company s proportionate share of real estate and operating expenses, was as follows: December 29, 2002 Fiscal Years Ended December 28, December 26, 2004 Minimumrents... $4,869 6,439 8,653 Percentage rents Total... $4,928 6,517 8,791 Equipment and auto leases... $ (5) Income Taxes Income tax expense (benefit) is comprised of the following: December 29, 2002 Fiscal Years Ended December 28, December 26, 2004 Current: Federal... $ (303) 871 1,291 State Deferred: Federal... 1, ,710 State Totaltaxexpense... $2,030 2,294 4,115 A reconciliation of the expected federal income taxes (benefits) at the statutory rate of 34% with the provision for income taxes is as follows: December 29, 2002 Fiscal Years Ended December 28, December 26, 2004 Expected federal income tax expense... $1,736 1,997 3,847 State income tax expense, net of federal effect Nondeductible expenses Taxexemptincome... (115) General business credits... (69) (329) (325) Other (8) (182) $2,030 2,294 4,115 Deferred tax assets and liabilities are classified as current and noncurrent on the basis of the classification of the related asset or liability for financial reporting. Deferred income taxes are provided for temporary differences 49
54 BUFFALO WILD WINGS, INC. AND SUBSIDIARIES Notes to Consolidated Financial Statements (Continued) December 28, and December 26, 2004 (Dollar amounts in thousands, except per-share amounts) between the basis of assets and liabilities for financial reporting purposes and income tax purposes. Temporary differences comprising the net deferred tax assets and liabilities on the balance sheets are as follows: Fiscal Years Ended December 28, December 26, 2004 Deferred tax assets: Unearned franchise fees... $ Accrued vacation Accrued compensation Deferred lease credits Other $1,430 2,289 Deferred tax liability: Depreciation... $4,906 7,320 Prepaidexpense Other Total... $4,941 7,747 The Company believes that, as a result of its historical income and reversal of deferred tax liabilities, it is more likely than not that the Company will realize its deferred tax assets. In the fourth quarter of 2004, the Company had favorable resolutions of prior year tax matters. The result was a lower effective tax rate for 2004 as compared to and (6) Mandatorily Redeemable Preferred Stock In 1999 and 2000, the Company issued 3,082,344 shares of Series A preferred stock (Series A) at $ Series A was entitled to a cumulative dividend of 12% before dividends could be paid on any other class of capital stock. Series A was redeemable at the discretion of its holders in December 2004 for $15,100. The Company increased the carrying value of the Series A over the four-year period for the difference between the issuance price and the redemption value. For fiscal 2002 and, the carrying value of the Series A increased by $1,457 and $1,452, respectively, with a corresponding decrease to retained earnings. Each Series A share was convertible without the accrued dividend into 0.6 shares of common stock at any time or could be automatically converted into common stock upon the issuance of common stock in an underwritten public offering where the gross proceeds received by the Company equal or exceed $15 million and the public offering price equals or exceeds $11.65 per share. In November, the Company completed its public offering of common stock and the Series A shares were automatically converted into 1,849,415 shares of common stock. At the time of conversion, the Series A carrying value, including cumulative dividends in arrears, amounted to $13,240, was reclassed to common stock. (7) Stockholders Equity (a) Stock Options The Company has 1.1 million shares of common stock reserved for issuance under a stock-based compensation plan for employees, officers, and directors. The option price for shares issued under this plan is to 50
55 BUFFALO WILD WINGS, INC. AND SUBSIDIARIES Notes to Consolidated Financial Statements (Continued) December 28, and December 26, 2004 (Dollar amounts in thousands, except per-share amounts) be not less than the fair market value on the date of grant. Incentive stock options become exercisable in four equal installments from the date of the grant and have a contractual life of ten years. Nonqualified stock options issued pursuant to the plan have varying vesting periods from immediately to one year and have a contractual life of ten years. In, the Company s shareholders approved amendments to the plan to allow the granting of restricted stock and extended the plan to Option activity is summarized as follows: Number of shares Weighted average exercise price Outstanding, December 30, ,030 $ 4.25 Granted , Exercised... (6,000) 3.35 Cancelled... (51,300) 5.30 Outstanding, December 29, , Granted... 52, Exercised... (181,132) 4.58 Cancelled... (47,536) 7.14 Outstanding, December 28, , Granted... 11, Exercised... (208,131) 4.09 Cancelled... (39,962) 8.41 Outstanding, December 26, , The following table summarizes the Company s stock options outstanding at December 26, 2004: Range Shares Options outstanding Average remaining contractual life (years) Weighted average exercise price Options exercisable Weighted average exercise Shares price $ , $ ,127 $ , , , , , , , The plan has 224,938 shares available for grant as of December 26, (b) Warrants In connection with various financing activities prior to 2000, the Company granted warrants to acquire an aggregate of 377,685 shares of the Company s common stock at an exercise price of $2.50 to $4.65 per share. During the year ended December 26, 2004, warrants to acquire 132,455 common shares were exercised. No warrants remain outstanding as of December 26,
56 BUFFALO WILD WINGS, INC. AND SUBSIDIARIES Notes to Consolidated Financial Statements (Continued) December 28, and December 26, 2004 (Dollar amounts in thousands, except per-share amounts) (c) Employee Stock Purchase Plan On September 4,, the Company s board of directors adopted the Employee Stock Purchase Plan, which was approved by its shareholders on October 24,. The Company has reserved 300,000 shares of common stock for issuance under the Plan. This Plan is available to substantially all employees subject to employment eligibility requirement. The Plan became effective upon the effective date of the Company s initial public offering (IPO). Participants may purchase the Company s common stock at 85% of the beginning or ending closing price, whichever is lower, for each six-month period ending in May and November. During 2004, the Company issued 28,453 shares of common stock under the plan and has 271,547 available for future sale. (d) Common Stock Offering In November, the Company issued 3,250,000 shares of its common stock realizing proceeds of approximately $51.4 million, net of issuance costs of $1.6 million. The Company used a portion of the proceeds for repayment of long-term debt and capital lease obligations. (8) Earnings Per Common Share The following is a reconciliation of basic and fully diluted earnings per common share for fiscal 2002,, and 2004: Fiscal year ended December 29, 2002 Earnings (numerator) Net earnings... $3,077 Less accretion resulting from cumulative dividend and mandatory redemption feature of preferred stock... (1,457) Shares (denominator) Per-share amount Earningspercommonshare... 1,620 2,529,094 $0.64 Effect of dilutive securities stock options and warrants ,999 Earnings per common share assuming dilution... $1,620 2,976, Earnings (numerator) Net earnings... $3,583 Less accretion resulting from cumulative dividend and mandatory redemption feature of preferred stock... (1,452) Fiscal year ended December 28, Shares (denominator) Per-share amount Earningspercommonshare... 2,131 3,222,445 $0.66 Effect of dilutive securities stock options and warrants ,516 Earnings per common share assuming dilution... $2,131 3,841, Earnings (numerator) Net earnings... $7,201 Fiscal year ended December 26, 2004 Shares (denominator) Per-share amount Earningspercommonshare... 7,201 8,165,078 $0.88 Effect of dilutive securities stock options and warrants ,803 Earnings per common share assuming dilution... $7,201 8,603,
57 BUFFALO WILD WINGS, INC. AND SUBSIDIARIES Notes to Consolidated Financial Statements (Continued) December 28, and December 26, 2004 (Dollar amounts in thousands, except per-share amounts) The following is a summary of those securities outstanding at the end of the respective periods, which have been excluded from the fully diluted calculations because the effect on net earnings per common share would not have been dilutive: As of December 29, 2002 December 28, December 26, 2004 Options ,582 17,500 Series A preferred stock... 1,849,415 Restricted stock... 52,426 (9) Supplemental Disclosures of Cash Flow Information December 29, 2002 Fiscal Years Ended December 28, December 26, 2004 Cash paid during the period for: Interest... $ Incometaxes... 1,901 1,582 2,621 Noncash financing and investing transactions: Capital lease obligations incurred... 4,680 3,879 Increase in cumulative dividend and mandatory redemption feature of preferred stock... 1,457 1,452 Conversion of preferred stock to common stock... 13,240 Goodwill purchase price adjustment Adjustment of restricted stock units to fair value... 2,726 Capitalization of preopening rent expense... 2,199 (10) Restaurant Closures and Impairment In 2002 and, the Company closed restaurants due to poor performance. As a result, a charge was taken for remaining lease obligations, broker fees, and utilities. These charges were recognized as a part of the restaurant closure and impairment and were based on a discounted cash flows basis. The reconciliation of the store closing reserve for the year ended December 29, 2002, December 28,, and December 26, 2004 is as follows: Balance December 30, provision Costs incurred Balance December 29, 2002 Remaining lease obligation and utilities... $ 185 (21) 164 Broker fees $ 243 (21) 222 Balance December 29, 2002 provision Costs incurred Balance December 28, Remaining lease obligation and utilities... $ (163) 211 Broker fees (47) 11 $ (163)
58 BUFFALO WILD WINGS, INC. AND SUBSIDIARIES Notes to Consolidated Financial Statements (Continued) December 28, and December 26, 2004 (Dollar amounts in thousands, except per-share amounts) Balance December 28, 2004 provision Costs incurred Balance December 26, 2004 Remaining lease obligation and utilities... $211 1 (76) 136 Broker fees (11) $222 (10) (76) 136 During 2004, the Company recorded an impairment charge for the assets of two underperforming restaurants. An impairment charge of $453,000 was recorded to the extent that the carrying value of the assets at the two restaurants was not considered recoverable based on estimated discounted future cash flows. A reconciliation of restaurant closures and impairment charges recognized by the Company is as follows: December 29, 2002 Fiscal Years Ended December 28, December 26, 2004 Storeclosingcharges... $ (10) Long-lived asset impairment Other asset write-offs $ (11) Employee Benefit Plan The Company has a defined contribution 401(k) plan whereby eligible employees may contribute pretax wages in accordance with the provisions of the plan. The Company matches 50% of the first 4% of contributions made by eligible employees. Matching contributions of approximately $81, $105, and $128 were made by the Company during 2002,, and 2004, respectively. In 2005, the Company amended the plan and will match 100% of the first 3% and 50% of the next 2% of contributions made by eligible employees. (12) Employment Agreements We have entered into employment agreements with each of our executive officers. These agreements are for a one-year term and include an automatic extension for successive one-year terms. The agreements also include termination and resignation provisions, a confidentiality clause, a noncompete provision and a severance package that includes salary payments for either one year in the case of our Chief Executive Officer and Chief Financial Officer or six months in the case of our Senior Vice Presidents, and a noncompete period of equal duration. Our executive officers are entitled to receive an annual bonus upon the achievement of certain boardestablished performance milestones, including revenue, net income, restaurant openings, same store sales, and employee turnover. Further, under our Management Deferred Compensation Plan, an amount equal to a percentage of an officer s base salary is credited on a monthly basis to that officer s deferred compensation account. The maximum deferral is 7.5% of the base salary of each Vice President, 10% of the base salary of each Senior Vice President, and 12.5% of the base salary of Chief Executive Officer and Chief Financial Officer. Such amounts are subject to certain vesting provisions, depending on length of employment and circumstances of employment termination. The employment agreements further provide that we shall pay our executive officers annual base salary, which will be reviewed not less than annually and may be increased or reduced; provided, (i) any reduction 54
59 BUFFALO WILD WINGS, INC. AND SUBSIDIARIES Notes to Consolidated Financial Statements (Continued) December 28, and December 26, 2004 (Dollar amounts in thousands, except per-share amounts) relating to our Chief Executive Officer or Chief Financial Officer will be permitted only if we reduce the base compensation of our executive employees generally and will not exceed the average percentage reduction for such employees; and (ii) with respect to our other executive officers, any reduction will be permitted only if we reduce the base compensation of our employees generally and will not exceed the average percentage reduction for all such employees. In addition to the base salary, our executive officers are entitled to participate in additional equity incentive plans and other employee benefit plans. Fiscal 2004 annual base salary commitments under employment agreements were $1.6 million. (13) Related Party Transactions It is the Company s policy that all related party transactions must be disclosed and approved by the disinterested directors, and the terms and considerations for such related party transactions are compared and evaluated to terms available or the amounts that would have to be paid or received, as applicable, in arms-length transactions with independent third-parties. The Company subleases a portion of its main offices to Carefree Capital Partners, Limited Partnership (Carefree) on a month-to-month lease on the same rental basis as the Company. A director of the Company is president and sole stockholder of Carefree. The Company paid a service fee of $14 in to Carefree for services provided to the Company by an employee of Carefree. This arrangement was discontinued in June. A member of the board of directors is an officer and director at the Company s primary law firm. Legal fees incurred with this firm were less than 5% of the law firm or the Company s total revenue. The services provided by the law firm were at fair value. (14) Contingencies The Company is involved in various legal matters arising in the ordinary course of business. In the opinion of management, the ultimate disposition of these matters will not have a material adverse effect on the Company s consolidated financial position and results of operations. On August 8,, an action captioned Ritter vs. Buffalo Wild Wings, Inc. was brought in Pennsylvania state court by the representative of the estate of a 23-year-old decedent alleging that we acted improperly by serving alcohol to an individual who later lost control of his vehicle and struck and killed the decedent and one other individual. The case was settled in February The settlement was fully covered by insurance. 55
60 ITEM 9. CHANGES IN AND DISAGREEMENTS WITH ACCOUNTANTS ON ACCOUNTING AND FINANCIAL DISCLOSURE Not applicable. ITEM 9A. CONTROLS AND PROCEDURES Evaluation of Disclosure Controls and Procedures We have established and maintain disclosure controls and procedures that are designed to ensure that material information relating to us and to our subsidiaries required to be disclosed by us in the reports that we file or submit under the Securities Exchange Act of 1934 is recorded, processed, summarized, and reported within the time periods specified in the SEC s rules and forms, and that such information is accumulated and communicated to our management, including our chief executive officer and chief financial officer, as appropriate to allow timely decisions regarding required disclosure. We carried out an evaluation, under the supervision and with the participation of our management, including our chief executive officer and chief financial officer, of the effectiveness of the design and operation of our disclosure controls and procedures as of the end of the period covered by this report. Based on that evaluation, the chief executive officer and chief financial officer concluded that our disclosure controls and procedures were effective as of the date of such evaluation. Management s Report on Internal Control over Financial Reporting Our management is responsible for establishing and maintaining adequate internal control over financial reporting. Internal control over financial reporting is a process designed by, or under the supervision of, our chief executive and chief financial officers and effected by our board of directors, management and other personnel to provide reasonable assurance regarding the reliability of financial reporting and the preparation of financial statements for external purposes in accordance with generally accepted accounting principles and includes those policies and procedures that: pertain to the maintenance of records that in reasonable detail accurately and fairly reflect the transactions and dispositions of our assets; provide reasonable assurance that transactions are recorded as necessary to permit preparation of financial statements in accordance with generally accepted accounting principles, and that our receipts and expenditures are being made only in accordance with the authorizations of our management and directors; and provide reasonable assurance regarding prevention or timely detection of unauthorized acquisition, use or disposition of our assets that could have a material effect on our financial statements. Because of inherent limitations, internal control over financial reporting may not prevent or detect misstatements. Projections of any evaluation of effectiveness to future periods are subject to the risks that controls may become inadequate because of changes in conditions, or that the degree of compliance with policies or procedures may deteriorate. Management assessed the effectiveness of our internal control over financial reporting as of December 26, In making this assessment, management used the criteria set forth by the Committee of Sponsoring Organizations of the Treadway Commission in Internal Control-Integrated Framework. Based on this assessment, our management concluded that our internal control over financial reporting was effective as of December 26, Change in Internal Control Over Financial Reporting There were no changes in the Company s internal control over financial reporting that occurred during the Company s last fiscal quarter that have materially affected, or are reasonably likely to materially affect, the Company s internal control over financial reporting. 56
61 The Company s independent registered public accounting firm, KPMG LLP, has issued an attestation report on management s assessment of the Company s internal control over financial reporting. That report appears below. Report of Independent Registered Public Accounting Firm The Board of Directors and Stockholders Buffalo Wild Wings, Inc.: We have audited management s assessment, included in the accompanying report entitled Management s Report on Internal Control Over Financial Reporting, that Buffalo Wild Wings, Inc. and subsidiaries (the Company) maintained effective internal control over financial reporting as of December 26, 2004, based on criteria established in Internal Control Integrated Framework issued by the Committee of Sponsoring Organizations of the Treadway Commission (COSO). The Company s management is responsible for maintaining effective internal control over financial reporting and for its assessment of the effectiveness of internal control over financial reporting. Our responsibility is to express an opinion on management s assessment and an opinion on the effectiveness of the Company s internal control over financial reporting based on our audit. We conducted our audit in accordance with the standards of the Public Company Accounting Oversight Board (United States). Those standards require that we plan and perform the audit to obtain reasonable assurance about whether effective internal control over financial reporting was maintained in all material respects. Our audit included obtaining an understanding of internal control over financial reporting, evaluating management s assessment, testing and evaluating the design and operating effectiveness of internal control, and performing such other procedures as we considered necessary in the circumstances. We believe that our audit provides a reasonable basis for our opinion. A company s internal control over financial reporting is a process designed to provide reasonable assurance regarding the reliability of financial reporting and the preparation of financial statements for external purposes in accordance with generally accepted accounting principles. A company s internal control over financial reporting includes those policies and procedures that (1) pertain to the maintenance of records that, in reasonable detail, accurately and fairly reflect the transactions and dispositions of the assets of the company; (2) provide reasonable assurance that transactions are recorded as necessary to permit preparation of financial statements in accordance with generally accepted accounting principles, and that receipts and expenditures of the company are being made only in accordance with authorizations of management and directors of the company; and (3) provide reasonable assurance regarding prevention or timely detection of unauthorized acquisition, use, or disposition of the company s assets that could have a material effect on the financial statements. Because of its inherent limitations, internal control over financial reporting may not prevent or detect misstatements. Also, projections of any evaluation of effectiveness to future periods are subject to the risk that controls may become inadequate because of changes in conditions, or that the degree of compliance with the policies or procedures may deteriorate. In our opinion, management s assessment that Buffalo Wild Wings, Inc. and subsidiaries maintained effective internal control over financial reporting as of December 26, 2004, is fairly stated, in all material respects, based on criteria established in Internal Control Integrated Framework issued by the Committee of Sponsoring Organizations of the Treadway Commission (COSO). Also, in our opinion, the Company maintained, in all material respects, effective internal control over financial reporting as of December 26, 2004, based on criteria established in Internal Control Integrated Framework issued by the Committee of Sponsoring Organizations of the Treadway Commission (COSO). We also have audited, in accordance with the standards of the Public Company Accounting Oversight Board (United States), the consolidated balance sheets of Buffalo Wild Wings, Inc. and subsidiaries as of December 28, and December 26, 2004, and the related consolidated statements of earnings, stockholders equity, and cash 57
62 flows for each of the fiscal years in the three-year period ended December 26, 2004, and our report dated March 25, 2005 expressed an unqualified opinion on those consolidated financial statements. /s/ KPMG LLP Minneapolis, Minnesota March 25, 2005 ITEM 9B. OTHER INFORMATION In December 2004, the Compensation Committee of our Board of Directors approved the 2005 compensation and bonus plan for our executive officers, including our Chief Executive Officer. The executive compensation and bonus plan are described in documents filed as exhibits to this report. 58
63 PART III ITEM 10. DIRECTORS AND EXECUTIVE OFFICERS OF THE REGISTRANT The information concerning the Company s directors and executive officers and compliance with Section 16(a) required by this item is contained in Item 1 of this document and the sections entitled Election of Directors and Compliance with Section 16(a) of the Exchange Act, appearing in the Company s Proxy Statement to be delivered to shareholders in connection with the 2005 Annual Meeting of Shareholders. Such information is incorporated herein by reference. Our Board of Directors has adopted a Code of Ethics & Business Conduct for all employees and directors. A copy of this document is available on our website at free of charge, under the Investor Relations section. We will satisfy any disclosure requirements under Item 10 or Form 8-K regarding an amendment to, or waiver from, any provision of the Code with respect to our principal executive officer, principal financial officer, principal accounting officer and persons performing similar functions by disclosing the nature of such amendment or waiver on our website or in a report on Form 8-K. Our Board of Directors has determined that Mr. J. Oliver Maggard, a member of the audit committee and an independent director, is an audit committee financial expert, as defined under 401(h) of Regulation S-K. ITEM 11. EXECUTIVE COMPENSATION The information required by this item is contained in the section entitled Executive Compensation appearing in the Company s Proxy Statement to be delivered to shareholders in connection with the 2005 Annual Meeting of Shareholders. Such information is incorporated herein by reference. ITEM 12. SECURITY OWNERSHIP OF CERTAIN BENEFICIAL OWNERS AND MANAGEMENT AND RELATED STOCKHOLDER MATTERS The information required by this item relating to the security ownership of certain holders is contained in the section entitled Principal Shareholders and Management Shareholdings and Equity Compensation Plan Information appearing in the Company s Proxy Statement to be delivered to shareholders in connection with the 2005 Annual Meeting of Shareholders. Such information is incorporated herein by reference. ITEM 13. CERTAIN RELATIONSHIPS AND RELATED TRANSACTIONS The information required by this item is contained in the section entitled Certain Transactions appearing in the Company s Proxy Statement to be delivered to stockholders in connection with the Annual Meeting of Stockholders to be held on or about May 12, Such information is incorporated herein by reference. ITEM 14. PRINCIPAL ACCOUNTANT FEES AND SERVICES The information required by this item is contained in the section entitled Independent Auditors appearing in the Company s Proxy Statement to be delivered to shareholders in connection with the 2005 Annual Meeting of Shareholders. Such information is incorporated herein by reference. 59
64 PART IV ITEM 15. EXHIBITS AND FINANCIAL STATEMENT SCHEDULES (a) Financial Statements. The following consolidated financial statements of the Company are filed with this report and can be found at Item 8 of this Form 10-K. Report of Independent Registered Public Accounting Firm dated March 25, Consolidated Balance Sheets as of December 28, and December 26, 2004 Consolidated Statements of Earnings for the Years Ended December 29, 2002, December 28,, and December 26, 2004 Consolidated Statements of Stockholders Equity for the Years Ended December 29, 2002, December 28,, and December 26, 2004 Consolidated Statements of Cash Flows for the Years Ended December 29, 2002, December 28,, and December 26, 2004 Notes to Consolidated Financial Statements (b) Financial Statement Schedules. The following schedule is included following the exhibits to this Form 10-K. Schedule II Valuation and Qualifying Accounts Report of Independent Registered Public Accounting Firm on Financial Statement Schedule All other schedules for which provision is made in the applicable accounting regulations of the SEC have been omitted as not required or not applicable, or the information required has been included elsewhere by reference in the financial statements and related notes. (c) Exhibits. See Exhibit Index following the signature page of this Form 10-K for a description of the documents that are filed as Exhibits to this report on Form 10-K or incorporated by reference herein. 60
65 SIGNATURES In accordance with Section 13 or 15(d) of the Exchange Act, the registrant caused this report to be signed on its behalf by the undersigned, thereunto duly authorized. Date: March 28, 2005 BUFFALO WILD WINGS, INC. By /s/ SALLY J. SMITH Sally J. Smith Chief Executive Officer and President In accordance with the Exchange Act, this report has been signed below by the following persons on behalf of the registrant and in the capacities and on the dates indicated below. Each person whose signature appears below constitutes and appoints Sally J. Smith and Mary J. Twinem as the undersigned s true and lawful attorneys-in fact and agents, each acting alone, with full power of substitution and resubstitution, for the undersigned and in the undersigned s name, place and stead, in any and all amendments to this Annual Report on Form 10-K and to file the same, with all exhibits thereto, and other documents in connection therewith, with the Securities and Exchange Commission, granted unto said attorneysin-fact and agents, each acting alone, full power and authority to do and perform each and every act and thing requisite and necessary to be done in and about the premises, as fully to all intents and purposes as the undersigned might or could do in person, hereby ratifying and confirming all said attorneys-in-fact and agents, each acting alone, or his substitute or substitutes, may lawfully do or cause to be done by virtue thereof. Name Title Date /s/ SALLY J. SMITH Sally J. Smith Chief Executive Officer, President and Director (principal executive officer) 3/28/05 /s/ MARY J. TWINEM Mary J. Twinem Executive Vice President, Chief Financial Officer and Treasurer (principal financial and accounting officer) 3/28/05 /s/ /s/ DALE M. APPLEQUIST Dale M. Applequist KENNETH H. DAHLBERG Kenneth H. Dahlberg Director 3/28/05 Director, Chairman of the Board 3/28/05 /s/ /s/ WARREN E. MACK Warren E. Mack J. OLIVER MAGGARD J. Oliver Maggard Director 3/28/05 Director 3/28/05 /s/ ROBERT W. MACDONALD Robert W. MacDonald Director 3/28/05 61
66 Report of Independent Registered Public Accounting Firm on Financial Statement Schedule The Board of Directors and Stockholders Buffalo Wild Wings, Inc.: Under the date of March 25, 2005, we reported on the consolidated balance sheets of Buffalo Wild Wings, Inc. and subsidiaries (the Company) as of December 28, and December 26, 2004 and the related consolidated statements of earnings, stockholders equity, and cash flows for each of the fiscal years in the threeyear period ended December 26, 2004 as contained in the annual report on Form 10-K for fiscal In connection with our audits of the aforementioned consolidated financial statements, we have also audited the related financial statement schedule as listed in the accompanying index. This financial statement schedule is the responsibility of the Company s management. Our responsibility is to express an opinion on the financial statement schedule based on our audits. In our opinion, such financial statement schedule, when considered in relation to the basic consolidated financial statements taken as a whole, presents fairly, in all material respects, the information set forth therein. Minneapolis, Minnesota March 25, 2005 /s/ KPMG LLP Buffalo Wild Wings, Inc. SCHEDULE II VALUATION AND QUALIFYING ACCOUNTS Description Allowance for doubtful accounts Store closing reserves Balance at Beginning of Period Additions Charged to Costs and Expenses Deductions From Reserves Balance at End of Period $ $ 3 12 $ $ (10)
67 BUFFALO WILD WINGS, INC. EXHIBIT INDEX TO FORM 10-K For the Fiscal Year Ended: Commission File No. December 26, Exhibit Number Description 3.1 Restated Articles of Incorporation (1) 3.2 Restated Bylaws (1) 4.1 Form of specimen certificate representing Buffalo Wild Wings, Inc. s common stock (1) 10.1 Equity Incentive Plan and related forms of stock option agreements (1)(2) 10.2 Management Deferred Compensation Plan and Amendment No. 1 (1)(2) 10.3 Employment Agreement, dated as of December 1, 1999 with Sally J. Smith (1)(2) 10.4 Employment Agreement, dated as of December 1, 1999 with Mary J. Twinem (1)(2) 10.5 Employment Agreement, dated as of December 1, 1999 with Kathleen M. Benning (formerly Alberga) (1)(2) 10.6 Employment Agreement, dated as of April 22, 2002 with James M. Schmidt (1)(2) 10.8 Employment Agreement, dated as of August 20, 2001 with Emil Lee Sanders (1)(2) 10.9 Employment Agreement, dated as of February 25, 2002 with Judith A. Shoulak (1)(2) Employment Agreement, dated as of December 1, 1999, with Craig W. Donoghue (1)(2) 10.11* Form of Franchise Agreement 10.12* Form of Area Development Agreement Employee Stock Purchase Plan and Amendment No. 1 (1) (2) Amendment to Management Deferred Compensation Plan, dated as of December 4, (incorporated by reference to Exhibit to our Form 10-K for the fiscal year ended December 28, ) (2) Amendment No. 1 to Equity Incentive Plan (incorporated by reference to Exhibit 10.1 to our Form 10-Q for the fiscal quarter ended June 27, 2004) (2) 10.16* Form of Restricted Stock Agreement currently used under the Equity Incentive Plan (2) 10.17* Director Compensation Arrangements as of June 28, 2004 (2) 10.18* 2004/2005 Executive Bonus Plan (2) 10.19* Compensation Arrangements For Executive Officers for Fiscal Year * List of Subsidiaries 23.1 * Consent of Independent Registered Public Accounting Firm 24.1 * Power of Attorney (included on the signature page) 31.1 * Certification of Chief Executive Officer Pursuant to Section 302 of the Sarbanes-Oxley Act of * Certification of Chief Financial Officer Pursuant to Section 302 of the Sarbanes-Oxley Act of * Certification of Chief Executive Officer Pursuant to Section 906 of the Sarbanes-Oxley Act of * Certification of Chief Financial Officer Pursuant to Section 906 of the Sarbanes-Oxley Act of 2002 * Filed herewith. (1) Incorporated by reference to the corresponding exhibit numbers to our Registration Statement on Form S-1, Reg. No (2) Management agreement or compensatory plan or arrangement. 63
68
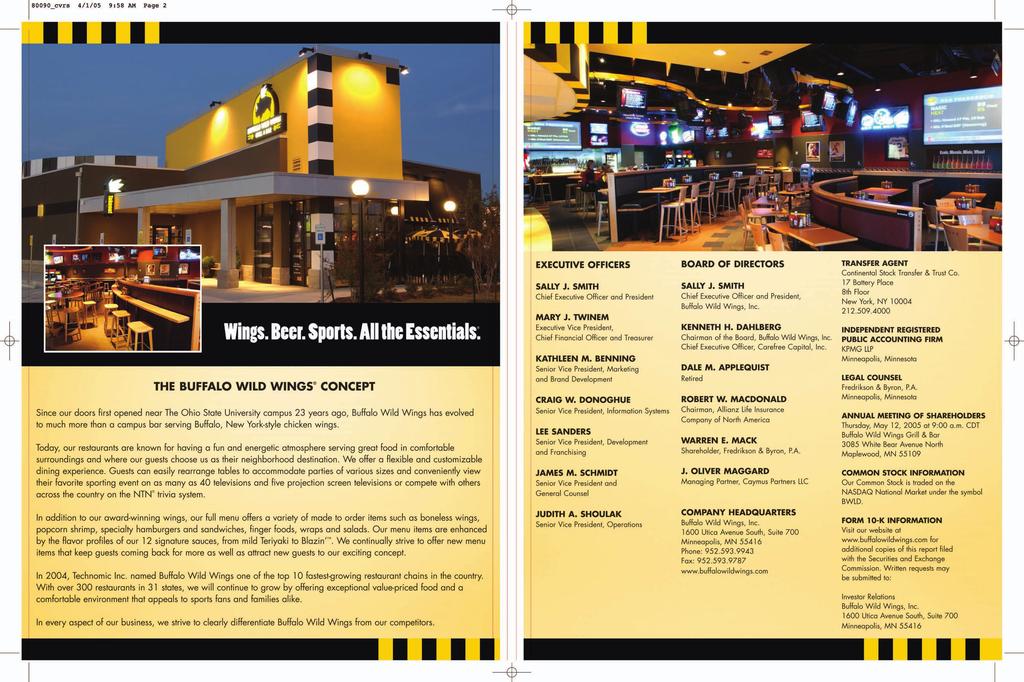
69
BUFFALO WILD WINGS, INC. (Exact name of registrant as specified in its charter)
") UNITED STATES SECURITIES AND EXCHANGE COMMISSION Washington, DC 20549 FORM 10-K Annual Report Pursuant to Section 13 or 15(d) of the Securities Exchange Act of 1934 for the fiscal year ended December 28,
UNITED STATES SECURITIES AND EXCHANGE COMMISSION Washington, DC 20549 FORM 10-K Annual Report Pursuant to Section 13 or 15(d) of the Securities Exchange Act of 1934 for the fiscal year ended December 28,
Buffalo Wild Wings, Inc. Announces Third Quarter Earnings per Share of $1.17 and Adjusted Earnings per Share of $1.36
 Buffalo Wild Wings Inc. Logo Buffalo Wild Wings, Inc. Announces Third Quarter Earnings per Share of $1.17 and Adjusted Earnings per Share of $1.36 October 25, 2017 Increasing 2017 Forecasted GAAP EPS to
Buffalo Wild Wings, Inc. Announces Second Quarter Earnings per Share of $0.55 and Adjusted Earnings per Share of $0.66
 July 26, 2017 Buffalo Wild Wings, Inc. Announces Second Quarter Earnings per Share of $0.55 and Adjusted Earnings per Share of $0.66 -FY2017 Guidance Updated to $4.00 to $4.50 GAAP EPS and $4.50 to $5.00
Buffalo Wild Wings, Inc. Announces Fourth Quarter Earnings per Share of $0.89 and Annual Net Earnings Growth of Over 13% for 2012
 FOR IMMEDIATE RELEASE Investor Relations Contact: Mary Twinem 952.253.0731 Mary Twinem CFO Buffalo Wild Wings, Inc. Announces Fourth Quarter Earnings per Share of $0.89 and Annual Net Earnings Growth of
Buffalo Wild Wings, Inc. Announces Fourth Quarter Earnings per Share of $1.07
 FOR IMMEDIATE RELEASE Investor Relations Contact: Heather Pribyl 952.253.0731 Buffalo Wild Wings, Inc. Announces Fourth Quarter Earnings per Share of $1.07 - Net Earnings Increased 31.5% to $94.1 million
Buffalo Wild Wings, Inc. Announces Second Quarter Earnings per Share of $1.25
 FOR IMMEDIATE RELEASE Investor Relations Contact: Heather Pribyl 952.253.0731 Buffalo Wild Wings, Inc. Announces Second Quarter Earnings per Share of $1.25 - Net Earnings Growth to Exceed 25% and Could
BUFFALO WILD WINGS INC
 BUFFALO WILD WINGS INC FORM 10-Q (Quarterly Report) Filed 05/04/12 for the Period Ending 03/25/12 Address 5500 WAYZATA BOULEVARD SUITE 1600 MINNEAPOLIS, MN 55416 Telephone 6125939943 CIK 0001062449 Symbol
BUFFALO WILD WINGS INC
 BUFFALO WILD WINGS INC FORM 10-Q (Quarterly Report) Filed 05/09/13 for the Period Ending 03/31/13 Address 5500 WAYZATA BOULEVARD SUITE 1600 MINNEAPOLIS, MN 55416 Telephone 6125939943 CIK 0001062449 Symbol
Diversified Restaurant Holdings, Inc. Wedbush Securities 2013 CA Dreamin Consumer Conference December 10, 2013
 Diversified Restaurant Holdings, Inc. Wedbush Securities 2013 CA Dreamin Consumer Conference December 10, 2013 Michael Ansley President, CEO & Board Chairman David G. Burke Chief Financial Officer & Treasurer
Noble Roman s Announces 2018 Results; Discusses Continuing Success with New Craft Pizza & Pub and Growth in Non-Traditional Venue
 NEWS BULLETIN FOR ADDITIONAL INFORMATION, CONTACT: For Media Information: Scott Mobley, President& CEO 317/634-3377 For Investor Relations: Paul Mobley, Executive Chairman 317/634-3377 RE:NOBLE ROMAN'S,
UNITED STATES SECURITIES AND EXCHANGE COMMISSION Washington, D.C FORM 10-Q
 UNITED STATES SECURITIES AND EXCHANGE COMMISSION Washington, D.C. 20549 FORM 10-Q QUARTERLY REPORT PURSUANT TO SECTION 13 OR 15(d) OF THE SECURITIES EXCHANGE ACT OF 1934 For the quarterly period ended
SECURITIES AND EXCHANGE COMMISSION WASHINGTON, D.C FORM 10-Q
 - -------------------------------------------------------------------------------- - -------------------------------------------------------------------------------- SECURITIES AND EXCHANGE COMMISSION
UNITED STATES SECURITIES AND EXCHANGE COMMISSION Washington, D.C FORM 10-Q WINGSTOP INC.
 UNITED STATES SECURITIES AND EXCHANGE COMMISSION Washington, D.C. 20549 FORM 10-Q (Mark one) x QUARTERLY REPORT PURSUANT TO SECTION 13 OR 15(d) OF THE SECURITIES EXCHANGE ACT OF 1934 For the quarterly
Think it s just pancakes?
 Think it s just pancakes? 2006 annual report $277.5 $52.70 97.1 60.8 38.48 41.89 46.91 84.6 24.00 35.0 0.00 2002 2003 2004 2005 2006 return of cash to shareholders (cumulative amount spent on share repurchases
EDGAR Submission Header Summary
 EDGAR Submission Header Summary Submission Type 10-K Live File on Return Copy on Submission Contact RDG Filings Submission Contact Phone Number 1-415-643-6080 Exchange NONE Confirming Copy off Filer CIK
JACK IN THE BOX INC.
 UNITED STATES SECURITIES AND EXCHANGE COMMISSION WASHINGTON, D.C. 20549 FORM 10-K x ANNUAL REPORT PURSUANT TO SECTION 13 OR 15(d) OF THE SECURITIES EXCHANGE ACT OF 1934 FOR THE FISCAL YEAR ENDED OCTOBER
2016 ANNUAL REPORT.
 2016 ANNUAL REPORT www.konagrill.com UNITED STATES SECURITIES AND EXCHANGE COMMISSION WASHINGTON, D.C. 20549 FORM 10-K (Mark one) ANNUAL REPORT PURSUANT TO SECTION 13 OR 15(d) OF THE SECURITIES EXCHANGE
Nourish Thistown Business Plan
 Nourish Thistown Business Plan Franchisee Name(s) Address Phone Number Email Copyright 2015 by Franchise Direct. All rights reserved. This material may not be copied online, reproduced in print or on a
2016 ANNUAL REPORT NASDAQ: SAUC
 2016 ANNUAL REPORT NASDAQ: SAUC Diversified Restaurant Holdings, Inc. ( DRH ) d Restaurant Holdings, Inc. operator ( DRH ) isand a the is a leading restaurant staurant largestwild Wings largest operator
DENNYS CORPORATION 2012 ANNUAL REPORT
 DENNYS CORPORATION 2012 ANNUAL REPORT !"#$%&' () *+*$, *-.*- / *- 0 "12 3 &&' 4' %56 # " *- % %(5& &&' &"*- % % % % " % 0 7 4' 1 # %# ' 2 3 % % 1 # 1 "%& 2 3 # % # %2 38 32 9 % %1 % %1 : ; 8 1% 9 1 % %
UNITED STATES SECURITIES AND EXCHANGE COMMISSION
 UNITED STATES SECURITIES AND EXCHANGE COMMISSION Washington, D.C. 20549 FORM 10-K (Mark One) ANNUAL REPORT PURSUANT TO SECTION 13 OR 15(d) OF THE SECURITIES EXCHANGE ACT OF 1934 For the fiscal year ended
UNITED STATES SECURITIES AND EXCHANGE COMMISSION FORM 10-K. DineEquity, Inc.
 (Mark One) UNITED STATES SECURITIES AND EXCHANGE COMMISSION Washington, D.C. 20549 FORM 10-K ANNUAL REPORT PURSUANT TO SECTION 13 OR 15(d) OF THE SECURITIES EXCHANGE ACT OF 1934 For the fiscal year ended
MEXICAN RESTAURANTS INC
 MEXICAN RESTAURANTS INC FORM 10-K (Annual Report) Filed 03/30/06 for the Period Ending 01/01/06 Address 1135 EDGEBROOK HOUSTON, TX 77034 Telephone 7139437574 CIK 0001009244 Symbol CASA SIC Code 5812 -
U.S. SECURITIES AND EXCHANGE COMMISSION Washington, DC FORM 10-K. (Mark one) Delaware
 Delaware") Sequence: 1 U.S. SECURITIES AND EXCHANGE COMMISSION Washington, DC 20549 FORM 10-K (Mark one) [X] ANNUAL REPORT PURSUANT TO SECTION 13 OR 15(d) OF THE SECURITIES EXCHANGE ACT OF 1934 For the fiscal year
Sequence: 1 U.S. SECURITIES AND EXCHANGE COMMISSION Washington, DC 20549 FORM 10-K (Mark one) [X] ANNUAL REPORT PURSUANT TO SECTION 13 OR 15(d) OF THE SECURITIES EXCHANGE ACT OF 1934 For the fiscal year
The Grand Slam America s Real Breakfast
 The Grand Slam America s Real Breakfast Denny s Corporation 2008 Annual Report Denny s is one of America s largest full-service family restaur ant chains, with more than 1,50 0 locations in 49 states and
SECURITIES AND EXCHANGE COMMISSION WASHINGTON, D. C
 SECURITIES AND EXCHANGE COMMISSION WASHINGTON, D. C. 20549 FORM 10-K (Mark One) [X] Annual Report pursuant to Section 13 or 15(d) of the Securities Exchange Act of 1934For the fiscal year ended June 24,
Del Taco Restaurants, Inc. (Exact name of registrant as specified in its charter)
") UNITED STATES SECURITIES AND EXCHANGE COMMISSION WASHINGTON, DC 20549 FORM 8-K CURRENT REPORT Pursuant to Section 13 or 15(d) of the Securities Exchange Act of 1934 Date of Report (Date of earliest event
UNITED STATES SECURITIES AND EXCHANGE COMMISSION WASHINGTON, DC 20549 FORM 8-K CURRENT REPORT Pursuant to Section 13 or 15(d) of the Securities Exchange Act of 1934 Date of Report (Date of earliest event
FORM 10-K. PIZZA INN HOLDINGS, INC. (Exact name of registrant as specified in its charter)
") (Mark One) SECURITIES AND EXCHANGE COMMISSION WASHINGTON, D. C. 20549 FORM 10-K [X] Annual Report pursuant to Section 13 or 15(d) of the Securities Exchange Act of 1934 For the fiscal year ended June 29,
(Mark One) SECURITIES AND EXCHANGE COMMISSION WASHINGTON, D. C. 20549 FORM 10-K [X] Annual Report pursuant to Section 13 or 15(d) of the Securities Exchange Act of 1934 For the fiscal year ended June 29,
fun! 2007 Annual Report celebrating 30 years CEC ENTERTAINMENT, INC.
 1977-1980 1980-1983 1988-1991 1993-1995 1999-2001 fun! 2007 Annual Report celebrating 30 years CEC ENTERTAINMENT, INC. Our fun! This year marks our 30th anniversary, and time has been more than kind to
Pizza Inn Holdings, Inc Annual Report
 Pizza Inn Holdings, Inc. 2013 Annual Report 1 (Mark One) SECURITIES AND EXCHANGE COMMISSION WASHINGTON, D. C. 20549 FORM 10-K [X] Annual Report pursuant to Section 13 or 15(d) of the Securities Exchange
Noble Roman s Provides First Quarter Strategic Review; Publishes First Quarter 2018 Financial Summary
 NEWS BULLETIN RE: NOBLE ROMAN'S, INC. 1 Virginia Avenue, Suite 300 Indianapolis, IN 46204 FOR ADDITIONAL INFORMATION, CONTACT: For Media Information: Scott Mobley, President& CEO 317/634-3377 For Investor
Q Financial Results. May 4, 2017
 Q1 2017 Financial Results May 4, 2017 Safe Harbor The information made available in this presentation contains forward-looking statements which reflect the Company s current view of future events, results
Comprehensive Plan to Enhance Shareholder Value. December 19, 2013
 Comprehensive Plan to Enhance Shareholder Value December 19, 2013 Forward-Looking Statements During the course of this presentation, Darden Restaurants officers and employees may make forward-looking statements
Commission File Number: PAPA JOHN S INTERNATIONAL, INC. (Exact name of registrant as specified in its charter) Delaware
 Delaware") SECURITIES AND EXCHANGE COMMISSION Washington, D.C. 20549 FORM 10-K (Mark One) [X] Annual report pursuant to Section 13 or 15(d) of the Securities Exchange Act of 1934 For the fiscal year ended December
SECURITIES AND EXCHANGE COMMISSION Washington, D.C. 20549 FORM 10-K (Mark One) [X] Annual report pursuant to Section 13 or 15(d) of the Securities Exchange Act of 1934 For the fiscal year ended December
UNITED STATES SECURITIES AND EXCHANGE COMMISSION Washington, D.C Form 10-K
 UNITED STATES SECURITIES AND EXCHANGE COMMISSION Washington, D.C. 20549 Form 10-K ANNUAL REPORT PURSUANT TO SECTION 13 OR 15(d) OF THE SECURITIES EXCHANGE ACT OF 1934 For the Fiscal Year Ended December
Dougherty & Company Institutional Investor Conference
 Dougherty & Company Institutional Investor Conference September 19, David Burke, Chief Executive Officer Phyllis Knight, Chief Financial Officer Safe Harbor The information made available in this presentation
UNITED STATES SECURITIES AND EXCHANGE COMMISSION. Washington, DC FORM 10-K
 UNITED STATES SECURITIES AND EXCHANGE COMMISSION Washington, DC 20549 FORM 10-K ANNUAL REPORT PURSUANT TO SECTION 13 OR 15(d) OF THE SECURITIES EXCHANGE ACT OF 1934 For the fiscal year ended December 31,
FORM 10-Q. THE WENDY S COMPANY (Exact name of registrants as specified in its charter)
") UNITED STATES SECURITIES AND EXCHANGE COMMISSION Washington, D.C. 20549 FORM 10-Q (X) QUARTERLY REPORT PURSUANT TO SECTION 13 OR 15(d) OF THE SECURITIES EXCHANGE ACT OF 1934 For the quarterly period ended
UNITED STATES SECURITIES AND EXCHANGE COMMISSION Washington, D.C. 20549 FORM 10-Q (X) QUARTERLY REPORT PURSUANT TO SECTION 13 OR 15(d) OF THE SECURITIES EXCHANGE ACT OF 1934 For the quarterly period ended
THE CITY OF MOORE REQUEST FOR PROPOSAL: OLD TOWN DEPOT COFFEE & JUICE SHOP Submissions Due: May 3, 2019
 THE CITY OF MOORE REQUEST FOR PROPOSAL: OLD TOWN DEPOT COFFEE & JUICE SHOP 1900-07 Submissions Due: May 3, 2019 1 THE CITY OF MOORE OLD TOWN DEPOT COFFEE & JUICE SHOP OPERATOR OPPORTUNITY The City of Moore
NEWS BULLETIN. RE: NOBLE ROMAN'S, INC. 1 Virginia Avenue, Suite 300 Indianapolis, IN 46204
 NEWS BULLETIN FOR ADDITIONAL INFORMATION, CONTACT: For Media Information: Scott Mobley, President & CEO 317/634-3377 For Investor Relations: Paul Mobley, Executive Chairman 317/634-3377 RE: NOBLE ROMAN'S,
Florida Department of Revenue Tax Information Publication. TIP 03A01-20 Date Issued: Dec 17, 2003
 Florida Department of Revenue Tax Information Publication TIP 03A01-20 Date Issued: Dec 17, 2003 COUPONS, DISCOUNTS, REBATES, FREE MERCHANDISE, AND OTHER PROMOTIONAL GIFTS Florida law provides that "discounts
Noble Roman s Highlights Third Quarter Events; Announces Financial Results for the Third Quarter and Year-to-Date.
 NEWS BULLETIN FOR ADDITIONAL INFORMATION, CONTACT: For Media Information: Scott Mobley, President & CEO 317/634-3377 For Investor Relations: Paul Mobley, Executive Chairman 317/634-3377 RE: NOBLE ROMAN'S,
30 th Annual Raymond James Institutional Investors Conference March 11, 2009
 30 th Annual Raymond James Institutional Investors Conference March 11, 2009 Safe Harbor Statement Under the Private Securities i Litigation i i Reform Act of 1995 Our presentation includes, and our response
MRS. FIELDS FAMOUS BRANDS, LLC (Exact Name of Registrant Specified in Its Charter)
") UNITED STATES SECURITIES AND EXCHANGE COMMISSION Washington, D.C. 20549 FORM 10-Q (Mark One) QUARTERLY REPORT PURSUANT TO SECTION 13 OR 15(d) OF THE SECURITIES EXCHANGE ACT OF 1934 For the quarterly period
UNITED STATES SECURITIES AND EXCHANGE COMMISSION Washington, D.C. 20549 FORM 10-Q (Mark One) QUARTERLY REPORT PURSUANT TO SECTION 13 OR 15(d) OF THE SECURITIES EXCHANGE ACT OF 1934 For the quarterly period
Meritage Hospitality Group Inc. Quarterly Report
 Meritage Hospitality Group Inc. Quarterly Report For Quarterly Period Ended July 2, 2017 The following information provides updates to the Annual Report for Fiscal Year Ended January 1, 2017. Accordingly,
SECURITIES AND EXCHANGE COMMISSION FORM 10-K405. Annual report pursuant to section 13 and 15(d), Regulation S-K Item 405
, Regulation S-K Item 405") SECURITIES AND EXCHANGE COMMISSION FORM 10-K405 Annual report pursuant to section 13 and 15(d), Regulation S-K Item 405 Filing Date: 2002-02-28 Period of Report: 2001-12-31 SEC Accession No. 0000899243-02-000485
SECURITIES AND EXCHANGE COMMISSION FORM 10-K405 Annual report pursuant to section 13 and 15(d), Regulation S-K Item 405 Filing Date: 2002-02-28 Period of Report: 2001-12-31 SEC Accession No. 0000899243-02-000485
APPLICANT INFORMATION FOR NEW LIQUOR LICENSE
 APPLICANT INFORMATION FOR NEW LIQUOR LICENSE City of Carbondale City Clerk 200 S. Illinois Avenue Carbondale, Illinois 62901 (618) 457-3281 Fax (618) 457-3283 Explorecarbondale.com Below are simplified
Meritage Hospitality Group Inc. Quarterly Report
 Meritage Hospitality Group Inc. Quarterly Report For Quarterly Period Ended April 1, 2018 The following information provides updates to the Annual Report for Fiscal Year Ended December 31, 2017. Accordingly,
UNITED STATES SECURITIES AND EXCHANGE COMMISSION Washington, D.C FORM 8-K
 UNITED STATES SECURITIES AND EXCHANGE COMMISSION Washington, D.C. 20549 FORM 8-K CURRENT REPORT Pursuant to Section 13 or 15(d) of the Securities Exchange Act of 1934 Date of Report (Date of earliest event
DENNY S CORPORATION 2013 ANNUAL REPORT
 DENNY S CORPORATION 2013 ANNUAL REPORT TO OUR VALUED SHAREHOLDERS We are pleased to deliver another year of solid results and continued growth. In 2013, we generated our third consecutive year of positive
Famous Dave's Reports Results for Second Quarter Fiscal 2015
 Famous Dave's Reports Results for Second Quarter Fiscal 2015 August 5, 2015 MINNEAPOLIS, Aug. 5, 2015 (GLOBE NEWSWIRE) -- Famous Dave's of America, Inc. (NASDAQ:DAVE) today reported financial results for
Quarterly Concept Dashboard 2Q:14 Benchmarking for $1B+ Chains and Other Select Concepts System Stats, Unit Sales & Margins, Build Costs, Valuations
 Quarterly Concept Dashboard 2Q:14 Benchmarking for $1B+ Chains and Other Select Concepts System Stats, Unit Sales & Margins, Build Costs, Valuations Casual Buffalo Wild Wings Cheesecake Factory Chili's
Q Financial Results. August 3, 2017
 Q2 2017 Financial Results August 3, 2017 Safe Harbor The information made available in this presentation contains forward-looking statements which reflect the Company s current view of future events, results
Ubiquitech Software Corporation
 Ubiquitech Software Corporation ANNUAL DISCLOSURE REPORT November 30, 2017 1) Name of the Issuer and its predecessors (if any) The name of the Issuer since inception is: Ubiquitech Software Corporation
Noodles & Company Announces Fourth Quarter and Fiscal Year 2014 Financial Results
 February 19, 2015 Noodles & Company Announces Fourth Quarter and Fiscal Year 2014 Financial Results BROOMFIELD, Colo., Feb. 19, 2015 (GLOBE NEWSWIRE) -- Noodles & Company (Nasdaq:NDLS) today announced
AFC Enterprises Reports Financial Results for Third Quarter 2010; Raises Fiscal 2010 Earnings Guidance
 November 10, 2010 AFC Enterprises Reports Financial Results for Third Quarter 2010; Raises Fiscal 2010 Earnings Guidance ATLANTA--(BUSINESS WIRE)-- AFC Enterprises, Inc. (NASDAQ: AFCE), the franchisor
Management s Discussion and Analysis
 1. 2. 3. 4. 5. 6. 7. 8. 9. 10. 11. 12. 13. 14. 15. 16. 17. 18. 19. 20. 21. 22. 23. Forward-Looking Statements Overview Strategic Framework Key Financial Performance Indicators Overall Financial Performance
Investor Presentation January 2013
 Investor Presentation January 2013 Texas Roadhouse, Inc Safe Harbor Statement and Reconciliation of Non-GAAP Financial Measures Under the Private Securities Litigation Reform Act of 1995 Certain statements
RAVE Restaurant Group, Inc Annual Report
 RAVE Restaurant Group, Inc. 2016 Annual Report 1 (Mark One) SECURITIES AND EXCHANGE COMMISSION WASHINGTON, D. C. 20549 FORM 10-K [X] Annual Report pursuant to Section 13 or 15(d) of the Securities Exchange
Investor Presentation
 Investor Presentation November 2014 Michael Ansley President, CEO & Board Chairman David G. Burke Chief Financial Officer & Treasurer Safe Harbor Statement The information made available in this presentation
UNITED STATES SECURITIES AND EXCHANGE COMMISSION. Washington, D.C FORM 8-K CURRENT REPORT
 UNITED STATES SECURITIES AND EXCHANGE COMMISSION Washington, D.C. 20549 FORM 8-K CURRENT REPORT Pursuant to Section 13 or 15(d) of the Securities Exchange Act of 1934 Date of Report (Date of earliest event
FORM 10-Q. INSIGNIA SYSTEMS, INC. (Exact name of registrant as specified in its charter)
") UNITED STATES SECURITIES AND EXCHANGE COMMISSION Washington, D. C. 20549 FORM 10-Q [X] QUARTERLY REPORT PURSUANT TO SECTION 13 OR 15(d) OF THE SECURITIES EXCHANGE ACT OF 1934 for the quarterly period ended
UNITED STATES SECURITIES AND EXCHANGE COMMISSION Washington, D. C. 20549 FORM 10-Q [X] QUARTERLY REPORT PURSUANT TO SECTION 13 OR 15(d) OF THE SECURITIES EXCHANGE ACT OF 1934 for the quarterly period ended
Del Taco Restaurants, Inc. (Exact name of registrant as specified in its charter)
") UNITED STATES SECURITIES AND EXCHANGE COMMISSION WASHINGTON, DC 20549 FORM 8-K CURRENT REPORT Pursuant to Section 13 or 15(d) of the Securities Exchange Act of 1934 Date of Report (Date of earliest event
UNITED STATES SECURITIES AND EXCHANGE COMMISSION WASHINGTON, DC 20549 FORM 8-K CURRENT REPORT Pursuant to Section 13 or 15(d) of the Securities Exchange Act of 1934 Date of Report (Date of earliest event
Investor Presentation. Russ Bendel Chief Executive Officer. Ira Fils Chief Financial Officer. May 2015 AND
 Investor Presentation May 2015 Russ Bendel Chief Executive Officer AND Ira Fils Chief Financial Officer Forward Looking Statements Forward Looking Statements This presentation contains forward looking
BUFFALO WILD WINGS, INC. GAMING COMPLIANCE PLAN ARTICLE I INTRODUCTION
 BUFFALO WILD WINGS, INC. GAMING COMPLIANCE PLAN ARTICLE I INTRODUCTION Buffalo Wild Wings, Inc. (the Company ), is a Minnesota publicly-traded corporation registered with and found suitable by the Nevada
2016 RENEWAL APPLICATION FOR ALCOHOLIC BEVERAGE LICENSE
 2016 RENEWAL APPLICATION FOR ALCOHOLIC BEVERAGE LICENSE INSTRUCTIONS: THIS APPLICATION MUST BE TYPED OR PRINTED LEGIBLY AND EXECUTED UNDER OATH. EACH QUESTION MUST BE ANSWERED COMPLETELY. (If space provided
Investor Presentation. January 2017
 Investor Presentation January 2017 Forward-Looking Statements Forward-Looking Statements This presentation contains forward-looking statements that are subject to risks and uncertainties. All statements
This presentation for Loblaw Companies Limited ( Loblaw ) and Shoppers Drug Mart Corporation ( Shoppers Drug Mart ) contains forward-looking statement
 and Shoppers Drug Mart Corporation ( Shoppers Drug Mart ) contains forward-looking statement") 1 This presentation for Loblaw Companies Limited ( Loblaw ) and Shoppers Drug Mart Corporation ( Shoppers Drug Mart ) contains forward-looking statements about the proposed acquisition by Loblaw of all
1 This presentation for Loblaw Companies Limited ( Loblaw ) and Shoppers Drug Mart Corporation ( Shoppers Drug Mart ) contains forward-looking statements about the proposed acquisition by Loblaw of all
Dunkin' Brands Reports Fourth Quarter and Fiscal Year 2016 Results
 February 9, 2017 Dunkin' Brands Reports Fourth Quarter and Fiscal Year Results CANTON, Mass., Feb. 9, 2017 /PRNewswire/ -- Fiscal year highlights include: Dunkin' Donuts U.S. comparable store sales growth
Dunkin' Brands Reports Fourth Quarter and Full Year 2011 Results
 Dunkin' Brands Reports Fourth Quarter and Full Year 2011 Results Strong finish to 2011 with fourth quarter adjusted net income* up 36.6% driven by 7.4% Dunkin' Donuts U.S. comp store sales increase CANTON,
ACCENTURE LTD 10-Q. Quarterly report pursuant to sections 13 or 15(d) Filed on 04/14/2003 Filed Period 02/28/2003
 Filed on 04/14/2003 Filed Period 02/28/2003") ACCENTURE LTD 10-Q Quarterly report pursuant to sections 13 or 15(d) Filed on 04/14/2003 Filed Period 02/28/2003 UNITED STATES SECURITIES AND EXCHANGE COMMISSION WASHINGTON, D.C. 20549 FORM 10-Q (Mark
ACCENTURE LTD 10-Q Quarterly report pursuant to sections 13 or 15(d) Filed on 04/14/2003 Filed Period 02/28/2003 UNITED STATES SECURITIES AND EXCHANGE COMMISSION WASHINGTON, D.C. 20549 FORM 10-Q (Mark
FORM 10-K ANNUAL REPORT PURSUANT TO SECTION 13 OR 15(d) OF THE SECURITIES EXCHANGE ACT OF 1934
 OF THE SECURITIES EXCHANGE ACT OF 1934") UNITED STATES SECURITIES AND EXCHANGE COMMISSION WASHINGTON, D.C. 20549 FORM 10-K ANNUAL REPORT PURSUANT TO SECTION 13 OR 15(d) OF THE SECURITIES EXCHANGE ACT OF 1934 FOR THE YEAR ENDED DECEMBER 31, 1997
UNITED STATES SECURITIES AND EXCHANGE COMMISSION WASHINGTON, D.C. 20549 FORM 10-K ANNUAL REPORT PURSUANT TO SECTION 13 OR 15(d) OF THE SECURITIES EXCHANGE ACT OF 1934 FOR THE YEAR ENDED DECEMBER 31, 1997
UNITED STATES SECURITIES AND EXCHANGE COMMISSION WASHINGTON, DC FORM 10-K
 UNITED STATES SECURITIES AND EXCHANGE COMMISSION WASHINGTON, DC 20549 FORM 10-K [X] Annual Report Under Section 13 or 15 (d) of the Securities Exchange Act of 1934 For the fiscal year ended September 30,
EVINE Live Inc. (Exact name of registrant as specified in its charter)
") UNITED STATES SECURITIES AND EXCHANGE COMMISSION WASHINGTON, DC 20549 FORM 8-K CURRENT REPORT Pursuant to Section 13 or 15(d) of the Securities Exchange Act of 1934 Date of Report (Date of earliest event
UNITED STATES SECURITIES AND EXCHANGE COMMISSION WASHINGTON, DC 20549 FORM 8-K CURRENT REPORT Pursuant to Section 13 or 15(d) of the Securities Exchange Act of 1934 Date of Report (Date of earliest event
Dine Brands Global, Inc. Investor Presentation. March 5, 2018
 Dine Brands Global, Inc. Investor Presentation March 5, 2018 2 Disclosures Forward-Looking Information: The content contained in this presentation is as of February 21, 2018. The Company assumes no obligation
2014 Annual Report. George Weston Limited
 2014 Annual Report George Weston Limited Footnote Legend (1) See non-gaap financial measures beginning on page 52. (2) For financial definitions and ratios refer to the Glossary beginning on page 138.
UNITED STATES SECURITIES AND EXCHANGE COMMISSION. Washington, D.C FORM 8-K CURRENT REPORT
 UNITED STATES SECURITIES AND EXCHANGE COMMISSION Washington, D.C. 20549 FORM 8-K CURRENT REPORT Pursuant to Section 13 or 15(d) of the Securities Exchange Act of 1934 Date of Report (Date of earliest event
MEXICAN RESTAURANTS INC
 MEXICAN RESTAURANTS INC FORM 8-K (Current report filing) Filed 11/09/06 for the Period Ending 11/09/06 Address 1135 EDGEBROOK HOUSTON, TX 77034 Telephone 7139437574 CIK 0001009244 Symbol CASA SIC Code
F U N C T I O N S A T T H E C H A M B E R L A I N & T A H L U L A
 F U N C T I O N S F U N C T I O N S A T T H E C H A M B E R L A I N & T A H L U L A Thank you for considering The Chamberlain and/or Tahlula for your Function. Enclosed in this pack is everything you need
RISK FACTORS Our future success is dependent on the continued service of our senior management
 RISK FACTORS In addition to all other information set out in this document, the following specific risk factors should be considered carefully by potential investors in evaluating whether to make an investment
CAUTIONARY STATEMENTS
 INVESTOR PRESENTATION NOVEMBER 2017 2 CAUTIONARY STATEMENTS Forward-Looking Statements This presentation includes statements that express our opinions, expectations, beliefs, plans, objectives, assumptions
Oppenheimer 18 th Annual Consumer Conference June 20, 2018
 Oppenheimer 18 th Annual Consumer Conference June 20, 2018 David Burke, Chief Executive Officer Phyllis Knight, Chief Financial Officer 1 Safe Harbor Some of the statements contained in this presentation
Mastercard Incorporated (Exact name of registrant as specified in its charter)
") UNITED STATES SECURITIES AND EXCHANGE COMMISSION Washington, D.C. 20549 Form 10-Q x QUARTERLY REPORT PURSUANT TO SECTION 13 OR 15(d) OF THE SECURITIES EXCHANGE ACT OF 1934 For the quarterly period ended
UNITED STATES SECURITIES AND EXCHANGE COMMISSION Washington, D.C. 20549 Form 10-Q x QUARTERLY REPORT PURSUANT TO SECTION 13 OR 15(d) OF THE SECURITIES EXCHANGE ACT OF 1934 For the quarterly period ended
Red Lobster Seafood Co.
 As filed with the Securities and Exchange Commission on March 10, 2014 File No. UNITED STATES SECURITIES AND EXCHANGE COMMISSION WASHINGTON, D.C. 20549 FORM 10 GENERAL FORM FOR REGISTRATION OF SECURITIES
DARDEN RESTAURANTS INC
 DARDEN RESTAURANTS INC FORM 10-K (Annual Report) Filed 07/22/11 for the Period Ending 05/29/11 Address 1000 DARDEN CENTER DRIVE ORLANDO, FL 32837 Telephone 4072454000 CIK 0000940944 Symbol DRI SIC Code
The information in this supplement outlines the required forms and documents needed for the above type of license. This supplement also lists the
 SUPPLEMENT FOR FULL & LIMITED ON-PREMISES COMMERCIAL LICENSES The information in this supplement outlines the required forms and documents needed for the above type of license. This supplement also lists
UNITED STATES SECURITIES AND EXCHANGE COMMISSION Washington, D.C
 UNITED STATES SECURITIES AND EXCHANGE COMMISSION Washington, D.C. 20549 Form 10-K ANNUAL REPORT PURSUANT TO SECTION 13 OR 15(d) OF THE SECURITIES EXCHANGE ACT OF 1934 n For the fiscal year ended December
Dunkin' Brands Reports Third Quarter 2013 Results
 October 24, Dunkin' Brands Reports Third Quarter Results CANTON, Mass., Oct. 24, /PRNewswire/ -- Third quarter highlights include: Dunkin' Donuts U.S. comparable store sales growth of 4.2% Added 222 net
Wendy s International, Inc Annual Report to Shareholders
 as Wendy s International, Inc. 2006 Annual Report to Shareholders Contents Chairman s Letter to Shareholders...i CEO s Message to Shareholders...ii-iv Annual Report on Form 10-K...pages 1-89 Board of Directors
Dunkin' Brands Reports Third Quarter 2016 Results
 October 20, Dunkin' Brands Reports Third Quarter Results CANTON, Mass., Oct. 20, /PRNewswire/ -- Third quarter highlights include: Dunkin' Donuts U.S. comparable store sales growth of 2.0% Baskin-Robbins
Jack in the Box Inc. Reports First Quarter FY 2015 Earnings; Updates Guidance for FY 2015
 Investor Contact: Carol DiRaimo, (858) 571-2407 FOR IMMEDIATE RELEASE Media Contact: Brian Luscomb, (858) 571-2291 Jack in the Box Inc. Reports First Quarter FY 2015 Earnings; Updates Guidance for FY 2015
McDONALD S CORPORATION
 UNITED STATES SECURITIES AND EXCHANGE COMMISSION Washington, DC 20549 FORM 10-K xannual REPORT PURSUANT TO SECTION 13 OR 15(d) OF THE SECURITIES EXCHANGE ACT OF 1934 For the fiscal year ended December
Yale University Student Organization Standard Guest Artist Contract
 Yale University Student Organization Standard Guest Artist Contract This Agreement is entered as of the day of, 20 by and between (the Organization ), a registered student organization of Yale University,
UNITED STATES SECURITIES AND EXCHANGE COMMISSION Washington, D.C Form 10-K
 UNITED STATES SECURITIES AND EXCHANGE COMMISSION Washington, D.C. 20549 Form 10-K þ ANNUAL REPORT PURSUANT TO SECTION 13 OR 15(d) OF THE SECURITIES EXCHANGE ACT OF 1934 For the Fiscal Year Ended December
Chairman and Members of the Committee of the Whole. Robert Browne, Community Services Director
 TO: FROM: Chairman and Members of the Committee of the Whole Robert Browne, Community Services Director MEETING DATE: July 7, 2003 SUBJECT: Report CSAD03-002 Award of Food Operation Rights for the Memorial
GAP INC. REPORTS FOURTH QUARTER AND FISCAL YEAR 2018 RESULTS. Company outlines plans to restructure specialty fleet and revitalize Gap brand health
 GAP INC. REPORTS FOURTH QUARTER AND FISCAL YEAR 2018 RESULTS Company outlines plans to restructure specialty fleet and revitalize Gap brand health SAN FRANCISCO February 28, 2019 Gap Inc. (NYSE: GPS) today
Good Times Restaurants Inc.
 (Nasdaq Capital Market: GTIM) Investor Presentation June 2015 Disclaimer The information in this presentation does not contain all of the information that a potential investor should review before investing
INTERNATIONAL. Making People Feel Special Annual Report
 B R I N K E R INTERNATIONAL Making People Feel Special 2016 Annual Report To Our Shareholders, Team Members, Guests, Franchise Partners and Supplier Partners: Elevating Our Vision Purposeful investment
INDUSTRIAL INCOME TRUST INC. SUPPLEMENT NO. 1 DATED FEBRUARY 13, 2015 TO THE PROSPECTUS DATED MARCH 12, 2014
 Filed pursuant to 424(b)(3) Registration No. 333-175340 INDUSTRIAL INCOME TRUST INC. SUPPLEMENT NO. 1 DATED FEBRUARY 13, 2015 TO THE PROSPECTUS DATED MARCH 12, 2014 This prospectus supplement (this Supplement