Funds and Advisory. Celsius Funds PLC. An umbrella fund with segregated liability between Sub-Funds
|
|
|
- Vivian Carpenter
- 6 years ago
- Views:
Transcription
1 s and Advisory Celsius s PLC An umbrella fund with segregated liability between Sub-s Annual Report and Audited Financial Statements for the year ended 30 June 2012
2 Celsius s plc Table of Contents General Information 1 Directors Report 5 Independent Auditors Report 8 Custodian s Report 10 Global Commodities Dynamic 11 Investment Manager s Report 11 Portfolio of Investments 12 Asian Real Estate 13 Investment Manager s Report 13 Portfolio of Investments 14 Asian Real Estate (GBP) 15 Investment Manager s Report 15 Portfolio of Investments 16 Global Commodities Delta 17 Investment Manager s Report 17 Portfolio of Investments 18 Equity Select 20 Investment Manager s Report 20 Portfolio of Investments 21 Dynamic Allocation Index 22 Investment Manager s Report 22 Portfolio of Investments 23 Revolution 24 Investment Manager s Report 24 Portfolio of Investments 25 Dynamic Money Builder 26 Investment Manager s Report 26 Portfolio of Investments 27 Sector Rotation 29 Investment Manager s Report 29 Portfolio of Investments 30 Entertainment Select 31 Investment Manager s Report 31 Portfolio of Investments 32 Power Select 33 Investment Manager s Report 33 Bonus Select 34 Investment Manager s Report 34 Portfolio of Investments 35 Bonus Select 36 Investment Manager s Report 36 Portfolio of Investments 37 China Accelerated Growth (HKD) 38 Investment Manager s Report 38 Portfolio of Investments 39 Sector Select 40 Investment Manager s Report 40
3 Celsius s plc Table of Contents cont/d Strategic Select 41 Investment Manager s Report 41 Strategic Select 42 Investment Manager s Report 42 China Accelerated Growth 43 Investment Manager s Report 43 Portfolio of Investments 44 Life Select 45 Investment Manager s Report 45 Portfolio of Investments 46 Global Asset Allocation 47 Investment Manager s Report 47 Portfolio of Investments 48 China Accelerated Growth 49 Investment Manager s Report 49 Portfolio of Investments 50 Investment Legends 51 Investment Manager s Report 51 Portfolio of Investments 52 GEMS 54 Investment Manager s Report 54 Portfolio of Investments 55 Global Agriculture Delta 57 Investment Manager s Report 57 Portfolio of Investments 58 Liquidity Compass (EUR) 60 Investment Manager s Report 60 Dynamic Golden Allocation 61 Investment Manager s Report 61 Fondo Radar 62 Investment Manager s Report 62 Portfolio of Investments 63 HFRX Opportunity 66 Investment Manager s Report 66 Portfolio of Investments 67 Real Return USD 69 Investment Manager s Report 69 Portfolio of Investments 70 RMB Bond 73 Investment Manager s Report 73 Portfolio of Investments 74 Profit and Loss Account 76 Statement of Changes in Net Assets Attributable to Redeemable Participating Shareholders 84 Balance Sheet 92 Notes to the financial statements 101 Other Information 179
4 Celsius s plc General Information The following information is derived from and should be read in conjunction with the full text and definitions section of the Prospectus. Capitalised terms shall bear the meaning as defined in the Prospectus, unless otherwise specified within this document. At 30 June 2012, the Company comprised 25 active Sub-s. The names and initial trading dates of the Sub-s are as follows: Sub- Launch Date Global Commodities Dynamic 24 January 2006 Asian Real Estate 25 April 2006 Asian Real Estate (GBP) 16 June 2006 Global Commodities Delta 18 July 2006 Equity Select 25 July 2006 Dynamic Allocation Index 05 September 2006 Revolution 08 September 2006 Dynamic Money Builder 18 December 2006 Sector Rotation 04 January 2007 Entertainment Select 09 February 2007 Bonus Select 17 April 2007 Bonus Select 17 April 2007 China Accelerated Growth (HKD) 04 July 2007 Strategic Select 24 August 2007 China Accelerated Growth 30 August 2007 Life Select 07 September 2007 Global Asset Allocation 09 October 2007 China Accelerated Growth 30 November 2007 Investment Legends 06 May 2008 GEMS 23 May 2008 Global Agriculture Delta 06 June 2008 Fondo Radar 29 July 2010 HFRX Opportunity 23 December 2010 Real Return USD 06 May 2011 RMB Bond 11 May 2011 Authorised s As at 30 June 2012, only the following Sub-s of Celsius s plc were authorised and launched in Hong Kong (collectively Authorised s ): Global Commodities Delta China Accelerated Growth (HKD) Investment Legends Global Agriculture Delta None of the Sub-s of Celsius s plc, other than the aforementioned Sub-s, are authorised for sale in Hong Kong nor are they available to Hong Kong residents as at 30 June The following Sub-s are registered for sale in Switzerland: Sub-s Real Return USD RMB Bond 1
5 Celsius s plc General Information cont/d Prices The issue price at which of a Sub- will be issued on a Dealing Day is calculated by ascertaining the Net Asset Value ("NAV") per Share of the relevant Class on the relevant Dealing Day. The Net Asset Value per share will differ on each Dealing Day. The Net Asset Value of a Sub- shall be expressed in the currency in which the are designated or in such other currency as the Directors may determine either generally or in relation to a particular Class or in a specific case, and shall be calculated by ascertaining the value of the assets of the Sub- and deducting from such value the liabilities of the Sub- (excluding Shareholders equity) as at the valuation point for such Dealing Day. The Net Asset Value per Share of a Sub- will be calculated by dividing the Net Asset Value of the Sub- by the number of in the Sub- then in issue, or deemed to be in issue, as at the valuation point for such Dealing Day and rounding the result mathematically to two decimal places, or such other number of decimal places as may be determined by the Directors from time to time. In the event the of any Sub- are further divided into Classes, the Net Asset Value per Class shall be determined by notionally allocating the Net Asset Value of the Sub- amongst the Classes making such adjustments for subscriptions, repurchases, fees, distributions, accumulation or distribution of income and the expenses, liabilities or assets attributable to each such Class (including the gains/losses on and costs of financial instruments employed for currency hedging between the currencies in which the assets of the Sub- are designated and the designated currency of the Class, which gains/losses and costs shall accrue solely to that Class) and any other factor differentiating the Classes as appropriate. A Preliminary Charge of up to 5% of the Net Asset Value per Share may be charged by the Company for payment to the Distributor on the issue of. A Repurchase Charge of up to 3% of the Repurchase Price of any Class of of a Sub- may be charged by the Company. The in Power Select * were subject to a Contingent Deferred Sales Charge on the repurchase of by investors, of up to 4% of the lower of the Subscription or Repurchase Price depending on the number of years since purchase. The amount of the Preliminary or Repurchase Charge or Contingent Deferred Sales Charge (if any) will be set out in the relevant Supplement to the Prospectus for each Sub-. The functional currency of each Sub- represents the primary economic environment in which the Sub- operates and is referred to in the Prospectus and Supplements to the Prospectus for each Sub- as the Base Currency. Significant events during the year Launches There were no Sub- launches during the year. Share Classes The following Sub-s launched additional Share Classes during the year. Details of these Share Classes are as follows: Sub-s Launch Date GEMS - Class A 11 July 2011 GEMS - Class B GBP 26 January 2012 Real Return USD - Class U 5 August 2011 Real Return USD - Class K 13 September 2011 Real Return USD - Class M 19 September 2011 Real Return USD - Class H 29 September 2011 Real Return USD - Class G 17 October 2011 Real Return USD - Class AA 1 November 2011 Real Return USD - Class E 1 March 2012 Real Return USD - Class Q 23 April 2012 * This Sub- was fully redeemed during the year ended 30 June
6 Celsius s plc General Information cont/d Significant events during the year cont/d... The following Sub-s were fully redeemed during the year: Sub-s Redemption Date Dynamic Golden Allocation 2 September 2011 Liquidity Compass (EUR) 3 January 2012 Sector Select 29 March 2012 Power Select 17 May 2012 Strategic Select 29 June 2012 The following Sub- redeemed a Share Class during the year. Details of this Share Class are as follows: Sub- Redemption Date GEMS - Class I 26 January 2012 On 1 July 2011, the European Communities (Undertakings for Collective Investment in Transferable Securities) Regulations, 2011 came into operation in Ireland giving effect to Directive 2009/65/EC of the European Parliament and of the Council of 13 July The Company has adopted specific policies and procedures in order to comply with its obligations under these Regulations. On 4 August 2011, Mr. Charlie McCreevy was appointed as Director to the Company. On 12 October 2011, a new Supplement to the Prospectus was issued for Real Return USD. The registered office of the Company changed from 75 St. Stephens Green, Dublin 2, Ireland to 2nd Floor, Beaux Lane House, Mercer Street Lower, Dublin 2, Ireland with effect from 20 October On 12 October 2011, a new Supplement to the Prospectus was issued for Real Return USD. There were no material changes to the Supplement. On 23 December 2011, a new Supplement to the Prospectus was issued for RMB Bond. A material restructuring was undertaken which included, but was not limited to, an amendment of the investment objective and investment policy of the Sub-. This amendment expanded the investment universe from RMB denominated debt securities and deposits to instruments and transactions which in aggregate provide exposure to RMB fixed income and allowed the Sub- to invest in non-rmb denominated instruments. The Shareholders of the Sub- approved of the material restructuring by way of an extraordinary general meeting on 14 November Please refer to the Investment Manager's Report for further details. On 19 March 2012, the Investment Manager changed its name from Capital Solutions to s and Advisory. On that same date, the Distributor and the Promoter changes its name from Capital to. On 29 March 2012, a new Supplement to the Prospectus was issued for Global Asset Allocation. A material restructuring was undertaken which included, but is not limited to, the following amendments: amendment in the Supplement of the definition of the Bond Component to include investment into EUR denominated non-subordinated debt issued by the Republic of Italy, amendment in the Supplement and deed of guarantee to define and amend terms of the guarantee in the case of a Credit Event in respect of the Republic of Italy, amendment in the Supplement to fees and charges and other consequential updates to the Supplement and deed of guarantee. The sole Shareholder in the Sub- approved the material restructuring by way of a Written Resolution of the Shareholders of the Sub-, dated 16 May Please refer to the Investment Manager's Report for further details. The merger of Strategic Select into Real Return USD occurred on the effective date, 29 June As detailed in the Merger Circular sent to Strategic Select Shareholders, Shareholders could redeem out of Strategic Select until the Redemption or Exchange Deadline, 29 June After that date, any remaining assets of Strategic Select were transferred to Real Return USD and the Shareholders of Strategic Select received in Real Return USD that were equal in value to their Strategic Select. The Administrator of Strategic Select, State Street Services (Ireland) Limited, valued the assets being transferred to Real Return USD, in accordance with Celsius s plc Articles of Association and the relevant Central Bank of Ireland rules. 3
7 Celsius s plc General Information cont/d Significant events after the year end Ms. Margaretha Van Der Schyf resigned as a Director on 11 July 2012 and was replaced by Mr. Nick O'Donoghue on the same date. The following Sub-s were fully redeemed after the year end: Sub-s Redemption Date Strategic Select 12 July 2012 Bonus Select 29 July 2012 China Accelerated Growth 20 September 2012 China Accelerated Growth 20 September 2012 The following Sub- was launched after the year end: Sub-s Launch Date Roll Yield Commodities 21 August
8 Celsius s plc Directors Report The Directors submit their report together with the audited financial statements of Celsius s plc (the Company ) for the year ended 30 June Directors responsibilities The Directors are responsible for preparing the annual report and the financial statements in accordance with applicable Irish Law and Generally Accepted Accounting Practice in Ireland, including the accounting standards issued by the Accounting Standards Board and published by the Institute of Chartered Accountants in Ireland. Irish company law requires the Directors to prepare financial statements for each financial period which give a true and fair view of the state of affairs of the Company and of the profit or loss of the Company for that period. In preparing the financial statements, the Directors are required to: Select suitable accounting policies and then apply them consistently; Make judgements and estimates that are reasonable and prudent; and Prepare the financial statements on a going concern basis unless it is inappropriate to presume that the Company will continue in business. The Directors confirm that they have complied with the above requirements in preparing the financial statements. In carrying out the above requirements the Directors have appointed State Street Services (Ireland) Limited to act as Administrator of the Company. The Directors are responsible for the maintenance and integrity of the corporate and financial information included on the Company's website. Legislation in the Republic of Ireland governing the preparation and dissemination of financial statements may differ from legislation in other jurisdictions. They are also responsible for safeguarding the assets of the Company. In this regard they have entrusted the assets of the Company to the Custodian who has been appointed as Custodian to the Company pursuant to the Custodian Agreement. The Directors have general responsibility for taking such steps as are reasonably open to them to prevent and detect fraud and other irregularities. Books of account The Directors are responsible for keeping proper books of account which disclose with reasonable accuracy at any time the financial position of the Company and enable them to ensure that the financial statements are prepared in accordance with accounting standards generally accepted in Ireland and comply with the Irish Companies Acts, 1963 to 2012 and the European Communities (Undertakings for Collective Investment in Transferable Securities) Regulations, The Directors believe that they have complied with the requirements of Section 202 of the Companies Act, 1990, with regard to books of account by employing an experienced Administrator with appropriate expertise and by providing adequate resources to the financial function. The books of account of the Company are maintained by State Street Services (Ireland) Limited at 78 Sir John Rogerson's Quay, Dublin 2, Ireland. Review of performance of the business and future developments of the business Market Summary The aggregate funds under management for the Company decreased from 1,518,009,288 to 1,411,718,046 during the year ended 30 June The issue over the 12 month reporting period that dominated headlines and had repercussions around the world was the ongoing sovereign debt crisis in Europe. During the summer of 2011, many markets fell sharply as fears grew that Greece would default on its debt unless a bail-out package could be agreed. As insecurity and uncertainty increased, other European countries struggling with refinancing debt, such as Spain and Italy, also saw bond yields rise substantially. Supportive comments from monetary authorities and a bail-out and debt forgiveness plan for some of Greece s debt calmed nerves into the autumn of This led to a strong rally in equity markets especially those least affected by Europe s problems such as the US and some commodities including crude oil. However, in the spring of 2012, the eurozone problems resurfaced as debt negotiations in Greece were again needed and elections in Greece and France were seen as being votes for or against the austerity measures being imposed. A banking crisis in Spain, which resulted in the government having to bail out regional banking group Bankia, escalated worries about the collapse and possible end of the euro. Yields in the peripheral, problem markets soared with 10-year government bonds in Spain breaching 7% in June 2012 while there was a flight to safe haven bonds, where yields fell to record lows, for example 1.5% in the US and UK and below 1.2% in Germany. Economic releases in the US were mixed for much of the period, but growth of around 2% was better than in many other developed countries though slower than other US recoveries. Fiscal conditions remained loose and the US Federal Reserve continued to make supportive comments. Corporate confidence was strong as manufacturing companies experienced strong sales and employment numbers improved, though again more slowly than expected. The US equity market was one of the few that rose over the period, with the S&P 500 Index rising 3.1%. Equity indices in Europe fared badly with the Euro Stoxx 50 index falling 20.5%. Within Europe Germany s DAX index fell 13% and the worst of the major markets was Italy s IBEX, down 31.4% over the period closely followed by Spain s IBEX 35 index, down 29.3%. In addition to the worries surrounding Europe, there was growing anxiety about the economic prospects in emerging markets. China s growth slowed to 7.5% (annualised) by the second quarter of 2012, which despite being amongst the strongest in the world, may not be sufficient to maintain job creation. Shanghai s CSI 300 index fell 19% and was among the worst globally. 5
9 Celsius s plc Directors Report cont/d Review of performance of the business and future developments of the business cont/d Market Summary cont/d Growth in Brazil and India was also weaker than expected. To counter this, Brazilian interest rates were cut sharply (from 12% to 8%). However, political paralysis has got in the way of reforms that may improve the outlook for India. The weakness in emerging markets and slower growth in the developed economies has led to a sharp fall in several commodity prices. In the energy sector, WTI crude oil prices fell 15% and natural gas was down 41%. Industrial metals for example aluminium fell 24.5% and silver weakened by over 20%. The defensive qualities of gold combined with central bank buying, as some countries worry about holding too many US dollars in their reserves, led to the gold price rising by 6% over the period. Grain prices surged towards the end of June 2012 as the severe drought conditions in the US mid-west devastated the harvest and there is the prospect of food price inflation going forward. Sub- Performance Given the poor performance and high volatility of equity markets and commodity prices there was a wide range of returns within the Sub-s held on this platform. Individual Sub- returns are detailed within the individual Sub- s Investment Manger s reports. Company Developments There were no Sub- launches during the year. Share Classes The following Sub-s launched additional Share Classes during the year. Details of these Share Classes are as follows: GEMS - Class A GEMS - Class B GBP Real Return USD - Class U Real Return USD - Class K Real Return USD - Class M Real Return USD - Class H Real Return USD - Class G Real Return USD - Class AA Real Return USD - Class E Real Return USD - Class Q The following Sub-s were fully redeemed during the year: Dynamic Golden Allocation Liquidity Compass (EUR) Sector Select Power Select Strategic Select Outlook The past 12 months has witnessed significant turbulence in the financial markets. The eurozone is still deeply ensnared in crisis, but some notable structural progress recently has improved the outlook. The bailout of the Spanish banking system, the election of a pro-europe government in Greece and concessions from Germany at the European Union summit are all good examples. In the US, uncertainty in the run up to the Presidential elections combined with weak growth and the high fiscal deficit may also influence markets. In the autumn, there will be the handover to the next generation of leaders in China, which may influence policy priorities. In the face of these uncertainties asset markets are likely to remain volatile. 6

10

11 Celsius s plc Independent Auditors Report To the Members of Celsius s plc (the Company ) We have audited the Company s financial statements for the year ended 30 June 2012 which comprise the Balance Sheet, the Profit and Loss Account, the Statement of Changes in Net Assets Attributable to Redeemable Participating Shareholders, the Portfolios of Investments and the related notes. These financial statements have been prepared under the accounting policies set out in Note 2. As further explained in Note 2, five of the Sub-s of the Company were fully redeemed during the year and therefore the financial statements in respect of those Sub-s have been prepared on a non-going concern basis. Respective responsibilities of the Directors and the auditors The Directors responsibilities for preparing the Annual Report and the financial statements in accordance with applicable Irish law and the accounting standards issued by the Accounting Standards Board and published by the Institute of Chartered Accountants in Ireland (Generally Accepted Accounting Practice in Ireland) are set out in the Directors Report. Our responsibility is to audit the financial statements in accordance with the relevant legal and regulatory requirements and International Standards on Auditing (UK and Ireland). This report, including the opinion, has been prepared for and only for the Company s Members as a body in accordance with Section 193 of the Companies Act, 1990 and for no other purpose. We do not, in giving this opinion, accept or assume responsibility for any other purpose or to any other person to whom this report is shown or into whose hands it may come save where expressly agreed by our prior consent in writing. We report to you our opinion as to whether the financial statements give a true and fair view in accordance with Generally Accepted Accounting Practice in Ireland, and are properly prepared in accordance with Irish Statute comprising the Companies Acts, 1963 to 2012, the European Communities (Undertakings for Collective Investment in Transferable Securities) Regulations, 2011 and, where applicable, the Hong Kong Code on Unit Trusts and Mutual s. We state whether we have obtained all the information and explanations we consider necessary for the purposes of our audit, and whether the financial statements are in agreement with the books of account. We also report to you our opinion as to: whether the Company has kept proper books of account; and whether the Directors Report is consistent with the financial statements. We also report to you if, in our opinion, any information specified by law regarding Directors remuneration and Directors transactions is not disclosed and where practicable, include such information in our report. We read the other information contained in the Annual Report, and consider whether it is consistent with the audited financial statements. We consider the implications for our report if we become aware of any apparent misstatements or material inconsistencies with the financial statements. Our responsibilities do not extend to any other information. Basis of audit opinion We conducted our audit in accordance with International Standards on Auditing (UK and Ireland) issued by the Auditing Practices Board. An audit includes examination, on a test basis, of evidence relevant to the amounts and disclosures in the financial statements. It also includes an assessment of the significant estimates and judgements made by the Directors in the preparation of the financial statements, and of whether the accounting policies are appropriate to the Company s circumstances, consistently applied and adequately disclosed. We planned and performed our audit so as to obtain all the information and explanations which we considered necessary in order to provide us with sufficient evidence to give reasonable assurance that the financial statements are free from material misstatement, whether caused by fraud or other irregularity or error. In forming our opinion we also evaluated the overall adequacy of the presentation of information in the financial statements. Opinion In our opinion the financial statements: give a true and fair view in accordance with Generally Accepted Accounting Practice in Ireland, of the state of the Company s affairs at 30 June 2012 and of its results for the year then ended; and have been properly prepared in accordance with the requirements of the Companies Acts, 1963 to 2012, the European Communities (Undertaking for Collective Investment in Transferable Securities) Regulations, 2011 and, where applicable, the Hong Kong Code on Unit Trusts and Mutual s. 8


12


13
14 Celsius s plc Global Commodities Dynamic Investment Manager s Report for the year ended 30 June 2012 (Unaudited) Investment Objective The investment objective of the Sub- is to provide Shareholders with a return linked to the performance of the Underlying, which is the RICI TM SGD Dynamic Portfolio, and a payment of at least 100% of the Shareholders initial investment during the Initial Offer Period as at the Maturity Date. Investment Strategy The Sub- will offer Shareholders exposure to the RICI SGD Index and the money market investments the SGD Zero Bond in accordance with the Constant Proportion Portfolio Insurance ( CPPI ) strategy, that dynamically allocates between assets, in order to capture gains and prevent losses. The strategy aims to maximise allocation to the RICI SGD Index while providing for capital preservation. In the event of a significant decline in commodity prices, the invested capital will be fully allocated to a SGD Zero Bond. Bank plc guarantees 100% of the initial investment at maturity. Sub- Performance Summary % 1 Month 3 Months 6 Months 12 Months Since Inception Sub- Performance Year ended 30 June 2012 High Low Latest At Inception NAV The Investment Manager s Report has been prepared up to the last valuation point whereas the financial statements have been prepared to the year ended 30 June This may result in differences between figures quoted in the Investment Manager s Report and the financial statements. 11
15 Celsius s plc Global Commodities Dynamic Portfolio of Investments as at 30 June 2012 Financial assets at fair value through profit or loss: 99.45% (30/06/11: 99.48%) Financial Derivative Instruments: 99.45% (30/06/11: 99.48%) ed Swap*: 99.45% (30/06/11: 99.48%) CCY Notional Amount Description Maturity Date Fair Value % of Sub- SGD 5,808, Year SGD Swap RICI TRS 29/12/2012 5,841, ed Swap at positive fair value 5,841, Total Financial Derivative Instruments 5,841, Total Financial Assets at fair value through profit or loss 5,841, Cash and cash equivalents (30/06/11: 0.44%) 5, Deposits with credit institutions (30/06/11: 0.04%) 2, Debtors (30/06/11: 0.90%) 96, Creditors (30/06/11: (0.86%)) (72,975) (1.25) Net Assets Attributable to Redeemable Participating Shareholders 5,873, /06/ /06/ /06/2010 Net Assets Attributable to Redeemable Participating Shareholders 5,873,225 7,066,991 8,414,596 Number of Redeemable Participating in Issue 5,644,466 7,045,335 8,740,575 Net Asset Value per Redeemable Participating Share Classification Financial derivative instruments at fair value through profit or loss are traded over the counter (OTC). Analysis of Total Gross Assets (Unaudited) % of Total Gross Assets OTC Financial Derivative Instruments Current Assets 1.77 The Counterparty for the ed Swap is Bank plc * The ed Swap exposes the Sub- to the performance of the Underlying (as defined in the Termsheet executed with the Approved Counterparty). 12
16 Celsius s plc Asian Real Estate Investment Manager s Report for the year ended 30 June 2012 (Unaudited) Investment Objective The investment objective of the Sub- seeks to derive income from a basket of 25 Asian real estate shares (the Basket ) with high dividend yields, while implementing disciplined profit taking and downside stop-loss measures. Investment Strategy The Sub- will offer Shareholders exposure to the performance of an equity trading strategy that aims to generate quarterly returns by (i) notionally holding a diversified universe of 25 Asian real estate equities which are expected to receive dividends and (ii) by selling call options on these equities. This strategy also seeks protection by acquiring put options on these. Sub- Performance Summary % 1 Month 3 Months 6 Months 12 Months Since Inception* Sub- Performance (0.52) (22.81) Year ended 30 June 2012 High Low Latest At Inception NAV * The since inception figure includes any distributions reinvested since inception. The Investment Manager s Report has been prepared up to the last valuation point whereas the financial statements have been prepared to the year ended 30 June This may result in differences between figures quoted in the Investment Manager s Report and the financial statements. 13
17 Celsius s plc Asian Real Estate Portfolio of Investments as at 30 June 2012 Financial assets at fair value through profit or loss: 98.99% (30/06/11: 98.25%) Financial Derivative Instruments: 98.99% (30/06/11: 98.25%) ed Swap*: 98.99% (30/06/11: 98.25%) CCY Notional Amount Description Maturity Date Fair Value % of Sub- SGD 163,576,344 Asian Real Estate SGD Swap 27/04/ ,492, ed Swap at positive fair value 71,492, Total Financial Derivative Instruments 71,492, Total Financial Assets at fair value through profit or loss 71,492, Cash and cash equivalents (30/06/11: 1.71%) 418, Deposits with credit institutions (30/06/11: 0.03%) 28, Debtors (30/06/11: 2.27%) 1,789, Creditors (30/06/11: (2.26%)) (1,505,201) (2.08) Net Assets Attributable to Redeemable Participating Shareholders 72,223, /06/ /06/ /06/2010 Net Assets Attributable to Redeemable Participating Shareholders 72,223,633 99,793, ,135,109 Number of Redeemable Participating in Issue 162,533, ,644, ,331,192 Net Asset Value per Redeemable Participating Share Classification Financial derivative instruments at fair value through profit or loss are traded over the counter (OTC). Analysis of Total Gross Assets (Unaudited) % of Total Gross Assets OTC Financial Derivative Instruments Current Assets 3.03 The Counterparty for the ed Swap is Bank plc. * The ed Swap exposes the Sub- to the performance of the Underlying (as defined in the Termsheet executed with the Approved Counterparty)
18 Celsius s plc Asian Real Estate (GBP) Investment Manager s Report for the year ended 30 June 2012 (Unaudited) Investment Objective The investment objective of the Sub- is to provide Shareholders with potential quarterly dividends depending on the performance of 20 Asian real estate shares with historically high dividend yields (the Basket ). Investment Strategy The Sub- will offer Shareholders exposure to a well defined equity trading strategy, applied to a diversified basket of 20 Asian real estate shares ( Basket Constituents ) from three well-known Asian real estate indices. The strategy may pay a quarterly return based on two sources, (i) any dividends paid on the Basket Constituents and (ii) income generated through notionally selling European call options on each Basket Constituent. Sub- Performance Summary % 1 Month 3 Months 6 Months 12 Months Since Inception* Sub- Performance (3.07) Year ended 30 June 2012 High Low Latest At Inception NAV (GBP) * The since inception figure includes any distributions reinvested since inception. The Investment Manager s Report has been prepared up to the last valuation point whereas the financial statements have been prepared to the year ended 30 June This may result in differences between figures quoted in the Investment Manager s Report and the financial statements. 15
19 Celsius s plc Asian Real Estate (GBP) Portfolio of Investments as at 30 June 2012 Financial assets at fair value through profit or loss: 99.24% (30/06/11: 98.49%) Financial Derivative Instruments: 99.24% (30/06/11: 98.49%) ed Swap*: 99.24% (30/06/11: 98.49%) CCY Notional Amount Description Maturity Date Fair Value % of Sub- GBP 52,664,641 Asian Real Estate GBP Swap 15/06/ ,733, ed Swap at positive fair value 25,733, Total Financial Derivative Instruments 25,733, Total Financial Assets at fair value through profit or loss 25,733, Cash and cash equivalents (30/06/11: 1.59%) 339, Debtors (30/06/11: 0.04%) 11, Creditors (30/06/11: (0.12%)) (154,297) (0.59) Net Assets Attributable to Redeemable Participating Shareholders 25,930, /06/ /06/ /06/2010 Net Assets Attributable to Redeemable Participating Shareholders 25,930,032 27,440,638 23,557,147 Number of Redeemable Participating in Issue 52,009,270 47,050,577 40,272,516 Net Asset Value per Redeemable Participating Share Classification Financial derivative instruments at fair value through profit or loss are traded over the counter (OTC). Analysis of Total Gross Assets (Unaudited) % of Total Gross Assets OTC Financial Derivative Instruments Current Assets 1.35 The Counterparty for the ed Swap is Bank plc * The ed Swap exposes the Sub- to the performance of the Underlying (as defined in the Termsheet executed with the Approved Counterparty). 16
20 Celsius s plc Global Commodities Delta Investment Manager s Report for the year ended 30 June 2012 (Unaudited) Investment Objective The investment objective of the Sub- is to provide Shareholders with a return linked to the performance of the Underlying, the RICI TM Index (the Index ), which provides exposure to 36 commodities consumed in the global economy. The Index is intended to be an effective measure of the price change of raw materials on a worldwide basis. Investment Strategy The Sub- will offer Shareholders exposure to the performance of the Index net of fees. Share Class Performance Summary % 1 Month 3 Months 6 Months 12 Months Since Inception Share Class Performance Class A 2.41 (10.12) (5.89) (14.15) (15.36) Share Class Performance Class B 2.39 (10.19) (6.02) (14.40) (27.26) Share Class Performance Class C 2.34 (10.26) (6.14) (14.67) (27.52) Share Class Performance Class D 2.27 (10.40) (6.40) (15.55) (42.37) Share Class Performance Class E 2.47 (9.67) (4.69) (12.71) Year ended 30 June 2012 High Low Latest At Inception NAV Class A NAV Class B NAV (HKD) Class C NAV Class D NAV (AUD) Class E Year ended 30 June 2011 High Low Latest At Inception NAV Class A NAV Class B NAV (HKD) Class C NAV Class D NAV (AUD) Class E Year ended 30 June 2010 High Low NAV Class A NAV Class B NAV (HKD) Class C NAV Class D NAV (AUD) Class E Year ended 30 June 2009 High Low NAV Class A NAV Class B NAV (HKD) Class C NAV Class D The Investment Manager s Report has been prepared up to the last valuation point whereas the financial statements have been prepared to the year ended 30 June This may result in differences between figures quoted in the Investment Manager s Report and the financial statements. 17
21 Celsius s plc Global Commodities Delta Portfolio of Investments as at 30 June 2012 Financial assets at fair value through profit or loss: 99.88% (30/06/11: 99.32%) Financial Derivative Instruments: 99.88% (30/06/11: 99.32%) ed Swap*: 99.79% (30/06/11: 99.27%) CCY Notional Amount Description Maturity Date Fair Value % of Sub- USD 137,004,537 Global Commodities Delta USD Swap 23/09/ ,508, ed Swap at positive fair value 121,508, Open Forward Foreign Exchange Currency Contracts**: 0.09% (30/06/11: 0.05%) Maturity Date Counterparty Amount Bought Amount Sold Unrealised Gain/(Loss) % of Sub- 03/07/2012 Bank plc USD 901 HKD 6,987 (0) (0.00) 05/07/2012 Bank plc HKD 654,028 USD 84, /07/2012 Bank plc HKD 100,405 USD 12, /07/2012 UBS AG London SGD 16,095 USD 12, /07/2012 Bank plc AUD 18,139 USD 18, /07/2012 Bank plc AUD 20,112 USD 20, /07/2012 Bank plc SGD 171,618 USD 135,500 (28) (0.00) 25/07/2012 Bank plc SGD 188,357 USD 147,583 1, /07/2012 Bank plc USD 11,587 AUD 11,645 (324) (0.00) 25/07/2012 Bank plc USD 33,765 AUD 33,672 (678) (0.00) 25/07/2012 Bank plc USD 125,434 SGD 160,713 (1,429) (0.00) 25/07/2012 Bank plc USD 245,736 SGD 313,513 (1,745) (0.00) 25/07/2012 UBS AG London AUD 816,610 USD 805,962 29, /07/2012 UBS AG London SGD 7,718,053 USD 6,005,880 86, /07/2012 UBS AG London SGD 8,900 USD 6, /07/2012 UBS AG London SGD 986 USD /07/2012 UBS AG London SGD 10,101 USD 7, /07/2012 UBS AG London USD 24,929 SGD 31,719 (110) (0.00) 25/07/2012 UBS AG London USD 12,570 SGD 16,095 (135) (0.00) Unrealised gain on forward foreign exchange currency contracts 117, Unrealised loss on forward foreign exchange currency contracts (4,449) (0.00) Net unrealised gain on forward foreign exchange currency contracts 113, Net Financial Derivative Instruments 121,621, Net Financial Assets at fair value through profit or loss (Cost: 136,793,241) 121,621, Cash and cash equivalents (30/06/11: 0.11%) 79, Deposits with credit institutions (30/06/11: 0.89%) 395, Debtors (30/06/11: 0.64%) 164, Creditors (30/06/11: (0.96%)) (493,265) (0.40) Net Assets Attributable to Redeemable Participating Shareholders 121,768,
22 Celsius s plc Global Commodities Delta Portfolio of Investments as at 30 June 2012 cont/d 30/06/ /06/ /06/2010 Net Assets Attributable to Redeemable Participating Shareholders Class A USD 13,081,481 7,583, ,592 Number of Redeemable Participating in Issue Class A 154,539 76,914 8,470 Net Asset Value per Redeemable Participating Share Class A USD Net Assets Attributable to Redeemable Participating Shareholders Class B USD 63,240,625 94,269,095 82,835,721 Number of Redeemable Participating in Issue Class B 869,345 1,109,265 1,274,731 Net Asset Value per Redeemable Participating Share Class B USD Net Assets Attributable to Redeemable Participating Shareholders Class C HKD 297,646, ,971, ,878,810 Number of Redeemable Participating in Issue Class C 4,106,559 5,403,391 6,504,782 Net Asset Value per Redeemable Participating Share Class C HKD Net Assets Attributable to Redeemable Participating Shareholders Class D SGD 7,872,159 10,769,383 2,709,968 Number of Redeemable Participating in Issue Class D 13,658,962 15,779,977 5,151,469 Net Asset Value per Redeemable Participating Share Class D SGD Net Assets Attributable to Redeemable Participating Shareholders Class E AUD 838,825 1,034, ,186 Number of Redeemable Participating in Issue Class E 747, , ,386 Net Asset Value per Redeemable Participating Share Class E AUD Classification Financial derivative instruments at fair value through profit or loss are traded over the counter (OTC). Analysis of Total Gross Assets (Unaudited) % of Total Gross Assets OTC Financial Derivative Instruments Current Assets 0.52 The Counterparty for the ed Swap is Capital Securities Limited. * The ed Swap exposes the Sub- to the performance of the Underlying (as defined in the Termsheet executed with the Approved Counterparty). ** Over the Counter (OTC) Financial Derivative Instruments
23 Celsius s plc Equity Select Investment Manager s Report for the year ended 30 June 2012 (Unaudited) Investment Objective The investment objective of the Sub- is to provide a return linked to a basket of 25 stocks from the infrastructure, utilities and real estate sectors, and a quarterly potential dividend payment. Investment Strategy The strategy involves: (i) notionally holding stocks that may distribute dividends in the next quarter and also benefit from potential capital appreciation, (ii) selling call options on each stock to receive premium income and enforce disciplined profit taking, and (iii) buying put options on each stock as a stop loss mechanism. Share Class Performance Summary % 1 Month 3 Months 6 Months 12 Months Since Inception Share Class Performance Class A (0.13) (1.18) (4.16) (10.01) (37.29) Share Class Performance Class B 1.71 (1.79) (1.81) (12.62) (0.78) Year ended 30 June 2012 High Low Latest At Inception NAV Class A NAV Class B The Investment Manager s Report has been prepared up to the last valuation point whereas the financial statements have been prepared to the year ended 30 June This may result in differences between figures quoted in the Investment Manager s Report and the financial statements. 20
24 Celsius s plc Equity Select Portfolio of Investments as at 30 June 2012 Financial assets at fair value through profit or loss: 98.97% (30/06/11: 98.46%) Financial Derivative Instruments: 98.97% (30/06/11: 98.46%) ed Swap*: 98.97% (30/06/11: 98.46%) CCY Notional Amount Description Maturity Date Fair Value % of Sub- SGD 184,121,363 Equity Select Income SGD Swap 25/07/ ,987, ed Swap at positive fair value 62,987, Total Financial Derivative Instruments 62,987, Total Financial Assets at fair value through profit or loss 62,987, Cash and cash equivalents (30/06/11: 3.72%) 397, Debtors (30/06/11: 1.19%) 1,705, Creditors (30/06/11: (3.37%)) (1,448,146) (2.28) Net Assets Attributable to Redeemable Participating Shareholders 63,643, /06/ /06/ /06/2010 Net Assets Attributable to Redeemable Participating Shareholders Class A SGD 63,328,924 86,949, ,129,939 Number of Redeemable Participating in Issue Class A 183,071, ,090, ,314,383 Net Asset Value per Redeemable Participating Share Class A SGD Net Assets Attributable to Redeemable Participating Shareholders Class B USD 248, , ,211 Number of Redeemable Participating in Issue Class B 304, , ,289 Net Asset Value per Redeemable Participating Share Class B USD Classification Financial derivative instruments at fair value through profit or loss are traded over the counter (OTC). Analysis of Total Gross Assets (Unaudited) % of Total Gross Assets OTC Financial Derivative Instruments Current Assets 3.23 The Counterparty for the ed Swap is Bank plc. * The ed Swap exposes the Sub- to the performance of the Underlying (as defined in the Termsheet executed with the Approved Counterparty)
25 Celsius s plc Dynamic Allocation Index Investment Manager s Report for the year ended 30 June 2012 (Unaudited) Investment Objective The investment objective of the Sub- is to provide Shareholders with a return linked to the performance of the Dynamic Allocation Protected Portfolio comprised of the Dynamic Allocation Index ( Index ) which represents a broad universe of hedge funds that reflect the strategy classifications of the MSCI Hedge indices that aims to out-perform Euribor by 100 bps and the Zero Bond Component Unit, and a payment of at least 104% of the Initial Issue Price ( Minimum Protection Level ) as at the Scheduled Maturity Date. Investment Strategy The Sub- offers Shareholders exposure to the Index with a guaranteed Minimum Protection Level on the Scheduled Maturity Date, by implementing the Constant Proportion Portfolio Insurance or CPPI Strategy, a strategy that manages the balance between the Index and the Zero Bond Component Unit. Sub- Performance Summary % 1 Month 3 Months 6 Months 12 Months Since Inception Sub- Performance (0.13) (4.20) Year ended 30 June 2012 High Low Latest At Inception NAV (EUR) The Investment Manager s Report has been prepared up to the last valuation point whereas the financial statements have been prepared to the year ended 30 June This may result in differences between figures quoted in the Investment Manager s Report and the financial statements. 22
26 Celsius s plc Dynamic Allocation Index Portfolio of Investments as at 30 June 2012 Financial assets at fair value through profit or loss: 99.38% (30/06/11: 99.31%) Financial Derivative Instruments: 99.38% (30/06/11: 99.31%) ed Swap*: 99.38% (30/06/11: 99.31%) CCY Notional Amount Description Maturity Date Fair Value % of Sub- EUR 30,000,000 Dynamic Allocation Index - Class B 31/05/ ,661, ed Swap at positive fair value 28,661, Total Financial Derivative Instruments 28,661, Total Financial Assets at fair value through profit or loss 28,661, Cash and cash equivalents (30/06/11: 0.84%) 208, Creditors (30/06/11: (0.15%)) (29,134) (0.10) Net Assets Attributable to Redeemable Participating Shareholders 28,840, /06/ /06/ /06/2010 Net Assets Attributable to Redeemable Participating Shareholders 28,840,779 26,017,353 26,764,644 Number of Redeemable Participating in Issue 300, , ,000 Net Asset Value per Redeemable Participating Share Classification Financial derivative instruments at fair value through profit or loss are traded over the counter (OTC). Analysis of Total Gross Assets (Unaudited) % of Total Gross Assets OTC Financial Derivative Instruments Current Assets 0.72 The Counterparty for the ed Swap is Bank plc * The ed Swap exposes the Sub- to the performance of the Underlying (as defined in the Termsheet executed with the Approved Counterparty). 23
27 Celsius s plc Revolution Investment Manager s Report for the year ended 30 June 2012 (Unaudited) Investment Objective The investment objective of the Sub- is to provide Shareholders with a return, on the Scheduled Target Date, linked to the performance of the Dow Jones Euro Stoxx 50 Index (the Index ) in relation to two barriers (the Upper Barrier and the Lower Barrier ). Return Profile On the Scheduled Target Date, seven years after the Strike Date, the Shareholders will receive a Net Asset Value per Share equal to the sum of the Reference Price and the Absolute Performance which is equal to the Initial Issue Price times the greater of (a) and (b), where: (a) is the maximum Appreciation (if any) of the Equity Index on any Annual Observation Date; and (b) is the Depreciation (if any) of the Equity Index on the Final Observation Date, unless the closing price of the Equity Index has dropped below the Lower Barrier on any Dealing Day after the Strike Period and has never exceeded the Upper Barrier on any Annual Observation Date, in which case the Shareholders will receive a Net Asset Value per Share on the Scheduled Target Date equal to the sum of the Reference Price and the Initial Issue Price times the Equity Index Return. Sub- Performance Summary % 1 Month 3 Months 6 Months 12 Months Since Inception Sub- Performance 9.00 (7.67) 0.83 (21.67) (52.54) Year ended 30 June 2012 High Low Latest At Inception NAV (EUR) The Investment Manager s Report has been prepared up to the last valuation point whereas the financial statements have been prepared to the year ended 30 June This may result in differences between figures quoted in the Investment Manager s Report and the financial statements. 24
28 Celsius s plc Revolution Portfolio of Investments as at 30 June 2012 Financial assets at fair value through profit or loss: 99.90% (30/06/11: 99.92%) Financial Derivative Instruments: 99.90% (30/06/11: 99.92%) ed Swap*: 99.90% (30/06/11: 99.92%) CCY Notional Amount Description Maturity Date Fair Value % of Sub- EUR 17,030,962 Revolution EUR Swap 10/10/2013 8,047, ed Swap at positive fair value 8,047, Total Financial Derivative Instruments 8,047, Total Financial Assets at fair value through profit or loss 8,047, Cash and cash equivalents (30/06/11: 0.09%) 9, Debtors (30/06/11: Nil) 2, Creditors (30/06/11: (0.01%)) (4,481) (0.05) Net Assets Attributable to Redeemable Participating Shareholders 8,054, /06/ /06/ /06/2010 Net Assets Attributable to Redeemable Participating Shareholders 8,054,818 11,008,137 11,672,093 Number of Redeemable Participating in Issue 16,968,784 18,165,781 22,210,612 Net Asset Value per Redeemable Participating Share Classification Financial derivative instruments at fair value through profit or loss are traded over the counter (OTC). Analysis of Total Gross Assets (Unaudited) % of Total Gross Assets OTC Financial Derivative Instruments Current Assets 0.15 The Counterparty for the ed Swap is Bank plc * The ed Swap exposes the Sub- to the performance of the Underlying (as defined in the Termsheet executed with the Approved Counterparty). 25
29 Celsius s plc Dynamic Money Builder Investment Manager s Report for the year ended 30 June 2012 (Unaudited) Investment Objective The investment objective of the Sub- is to provide Shareholders of each class of share with a return linked to the performance of the Dynamic Money Builder Portfolio (the Portfolio ) that represents exposure to multiple asset classes while seeking to provide capital appreciation and a potential return of 2% per annum above SGD SIBOR. Investment Strategy The Portfolio offers exposure to global indices (each a Portfolio Component ) representing a broad universe of global assets including, but not limited to, equities, bonds, currencies, money markets, emerging markets and property. The composition of the Portfolio and the weight of each Portfolio Component are determined monthly in accordance with a systematic and quantitative methodology. Sub- Performance Summary % 1 Month 3 Months 6 Months 12 Months Since Inception Sub- Performance (0.48) (0.51) (0.42) (4.67) (18.57) Year ended 30 June 2012 High Low Latest At Inception NAV The Investment Manager s Report has been prepared up to the last valuation point whereas the financial statements have been prepared to the year ended 30 June This may result in differences between figures quoted in the Investment Manager s Report and the financial statements. 26
30 Celsius s plc Dynamic Money Builder Portfolio of Investments as at 30 June 2012 Financial assets at fair value through profit or loss: 89.27% (30/06/11: 93.22%) Collective Investment Schemes*: 9.86% (30/06/11: 10.12%) CCY No. of Description Fair Value % of Sub- EUR 2,175 Celsius International s plc- Commodities Strategy (EUR) 312, Total Collective Investment Schemes 312, Financial Derivative Instruments: 79.41% (30/06/11: 83.10%) ed Swap**: 79.52% (30/06/11: 82.52%) CCY Notional Amount Description Maturity Date Fair Value % of Sub- SGD 2,458,702 Dynamic Money Builder SGD BOI Swap 22/12/2018 2,523, ed Swap at positive fair value 2,523, Open Futures Contracts***: (0.04%) (30/06/11: 0.60%) Number of Contracts Description Counterparty (1) Unrealised Gain/(Loss) % of Sub- SGX CNX Nifty Index Futures Long Index Futures Expiring July 2012 Goldman Sachs 1, MSCI Taiwan Index Futures Long Futures Contracts Expiring July 2012 Goldman Sachs 1, FTSE JSE Top 40 Index Futures Long Futures Contracts Expiring September 2012 Goldman Sachs (3,411) (0.11) 30 Year US Treasury Bond Futures Long Futures Contracts Expiring September 2012 Goldman Sachs (798) (0.03) UK Long Gilt Bond Futures Short Futures Contracts Expiring September 2012 Goldman Sachs (36) 0.00 Unrealised gain on open future contracts 3, Unrealised loss on open future contracts (4,245) (0.14) Net unrealised loss on open future contracts (1,095) (0.04) Open Forward Foreign Exchange Currency Contracts****: (0.07%) (30/06/11: (0.02%)) Maturity Date Counterparty Amount Bought Amount Sold Unrealised Gain/(Loss) % of Sub- 05/07/2012 Bank plc EUR 1,969 SGD 3, /07/2012 UBS AG London SGD 362,435 EUR 227,190 (2,809) (0.09) 05/07/2012 UBS AG London SGD 47,476 USD 36,671 1, /07/2012 UBS AG London SGD 2,983 ZAR 20,047 (121) /07/2012 Bank plc USD 20,000 SGD 25,637 (301) (0.01) Unrealised gain on forward foreign exchange currency contracts 1, Unrealised loss on forward foreign exchange currency contracts (3,231) (0.10) Net unrealised loss on forward foreign exchange currency contracts (2,188) (0.07) Net Financial Derivative Instruments 2,520, Net Financial Assets at fair value through profit or loss 2,833, Cash and cash equivalents (30/06/11: 0.11%) 89, Cash held with broker for open futures contracts (30/06/11: 4.33%) 103, Debtors (30/06/11: 3.27%) 157, Creditors (30/06/11: (0.93%)) (9,960) (0.31) Net Assets Attributable to Redeemable Participating Shareholders 3,173,
31 Celsius s plc Dynamic Money Builder Portfolio of Investments as at 30 June 2012 cont/d 30/06/ /06/ /06/2010 Net Assets Attributable to Redeemable Participating Shareholders 3,173,597 4,407,267 6,218,884 Number of Redeemable Participating in Issue 3,897,100 5,159,415 7,298,069 Net Asset Value per Redeemable Participating Share Classification Financial derivative instruments at fair value through profit or loss are traded over the counter (OTC) with the exception of open futures contracts which are exchange traded. Analysis of Total Gross Assets (Unaudited) % of Total Gross Assets Collective Investment Schemes 9.81 OTC Financial Derivative Instruments Exchange Traded Derivative Instruments 0.10 Current Assets The Counterparty for the ed Swap is Bank plc. * The Collective Investment Schemes held by the Sub- meet the requirements of UCITS Regulations ** The ed Swap exposes the Sub- to the performance of the Underlying (as defined in the Termsheet executed with the Approved Counterparty). *** Exchange Traded Financial Derivative Instruments. **** Over the counter (OTC) Financial Derivative Instruments. 28
32 Celsius s plc Sector Rotation Investment Manager s Report for the year ended 30 June 2012 (Unaudited) Investment Objective The investment objective of the Sub- is to provide Shareholders with a return linked to the performance of the Underlying, which is the Sector Rotation Index (the Index ). This index provides exposure to different Sectors of the Dow Jones Euro Stoxx Index, via Exchange Traded s or Equity Sub-Indices and aims to outperform the Dow Jones Euro Stoxx Index (the Benchmark ) by capturing upward trends in specific Sectors in accordance with the Sector Rotation Strategy. Investment Strategy The Sub- will offer investors exposure to the Sector Rotation Strategy Index net of fees. Sub- Performance Summary % 1 Month 3 Months 6 Months 12 Months Since Inception Sub- Performance 1.40 (7.42) 2.86 (24.49) (42.76) Year ended 30 June 2012 High Low Latest At Inception NAV (EUR) The Investment Manager s Report has been prepared up to the last valuation point whereas the financial statements have been prepared to the year ended 30 June This may result in differences between figures quoted in the Investment Manager s Report and the financial statements. 29
33 Celsius s plc Sector Rotation Portfolio of Investments as at 30 June 2012 Financial assets at fair value through profit or loss: 99.54% (30/06/11: 99.01%) Financial Derivative Instruments: 99.54% (30/06/11: 99.01%) ed Swap*: 99.54% (30/06/11: 99.01%) CCY Notional Amount Description Maturity Date Fair Value % of Sub- EUR 24,826,896 Sector Rotation ed EUR Swap 05/01/ ,123, ed Swap at positive fair value 14,123, Total Financial Derivative Instruments 14,123, Total Financial Assets at fair value through profit or loss 14,123, Cash and cash equivalents (30/06/11: 0.86%) 80, Debtors (30/06/11: 0.13%) 11, Creditors (30/06/11: Nil) (27,806) (0.19) Net Assets Attributable to Redeemable Participating Shareholders 14,188, /06/ /06/ /06/2010 Net Assets Attributable to Redeemable Participating Shareholders 14,188,795 18,788,490 16,105,681 Number of Redeemable Participating in Issue 247, , ,864 Net Asset Value per Redeemable Participating Share Classification Financial derivative instruments at fair value through profit or loss are traded over the counter (OTC). Analysis of Total Gross Assets (Unaudited) % of Total Gross Assets OTC Financial Derivative Instruments Current Assets 0.65 The Counterparty for the ed Swap is Bank plc * The ed Swap exposes the Sub- to the performance of the Underlying (as defined in the Termsheet executed with the Approved Counterparty). 30
34 Celsius s plc Entertainment Select Investment Manager s Report for the year ended 30 June 2012 (Unaudited) Investment Objective The investment objective of the Sub- is to derive income from 20 stocks (the Basket ), with expected high dividend yields related to the entertainment industry (including the media and gaming sector) and leisure industry (including beverage, tobacco and vacation sectors) while implementing disciplined profit taking and downside stop loss measures. The Sub- intends to provide Shareholders with quarterly fixed dividend payments in the first year, since launch and thereafter aims to provide Shareholders with potential quarterly dividends that may be zero. Investment Strategy The Sub- will have exposure to the performance of an equity trading strategy that aims to generate quarterly returns from the Basket, by (i) notionally holding a diversified universe of 20 stocks from the entertainment and leisure sectors which are expected to receive dividends, and (ii) by selling call options on these equities. The strategy also seeks protection by acquiring put options on these equities. Share Class Performance Summary % 1 Month 3 Months 6 Months 12 Months Since Inception* Share Class Performance Class A (0.75) (0.54) (40.08) Share Class Performance Class B 1.10 (1.10) Year ended 30 June 2012 High Low Latest At Inception NAV Class A NAV Class B * The since inception figure includes any distributions reinvested since inception. The Investment Manager s Report has been prepared up to the last valuation point whereas the financial statements have been prepared to the year ended 30 June This may result in differences between figures quoted in the Investment Manager s Report and the financial statements. 31
35 Celsius s plc Entertainment Select Portfolio of Investments as at 30 June 2012 Financial assets at fair value through profit or loss: 99.47% (30/06/11: 98.41%) Financial Derivative Instruments: 99.47% (30/06/11: 98.41%) ed Swap*: 99.47% (30/06/11: 98.41%) CCY Notional Amount Description Maturity Date Fair Value % of Sub- SGD 73,907,841 Entertainment Select SGD Swap 30/01/ ,020, ed Swap at positive fair value 27,020, Total Financial Derivative Instruments 27,020, Total Financial Assets at fair value through profit or loss 27,020, Cash and cash equivalents (30/06/11: 0.25%) 86, Debtors (30/06/11: 1.80%) 82, Creditors (30/06/11: (0.46%)) (25,463) (0.09) Net Assets Attributable to Redeemable Participating Shareholders 27,163, /06/ /06/ /06/2010 Net Assets Attributable to Redeemable Participating Shareholders Class A SGD 26,835,783 33,496,546 52,136,578 Number of Redeemable Participating in Issue Class A 72,853,488 89,340, ,517,843 Net Asset Value per Redeemable Participating Share Class A SGD Net Assets Attributable to Redeemable Participating Shareholders Class B USD 259, , ,631 Number of Redeemable Participating in Issue Class B 278, , ,442 Net Asset Value per Redeemable Participating Share Class B USD Classification Financial derivative instruments at fair value through profit or loss are traded over the counter (OTC). Analysis of Total Gross Assets (Unaudited) % of Total Gross Assets OTC Financial Derivative Instruments Current Assets 0.62 The Counterparty for the ed Swap is Bank plc * The ed Swap exposes the Sub- to the performance of the Underlying (as defined in the Termsheet executed with the Approved Counterparty). 32
36 Celsius s plc Power Select * Investment Manager s Report for the year ended 30 June 2012 (Unaudited) Investment Objective The investment objective of the Sub- is to provide quarterly dividends by capturing the expected high dividends of global stocks and using an innovative Trading Strategy (1). To reduce the downside risk, the Sub- uses a stop-loss mechanism (2). This strategy would help to stabilize the overall portfolio risk. It is an investment product suitable for an investor who seeks regular stable income in different market scenarios in the long-term. The Sub- offers a guaranteed quarterly Fixed Dividend payment of 9.8% p.a (3) (4) of the Initial Issue Price per Share during the first year after launch and thereafter aims to provide investors with potential quarterly dividends (nonguaranteed). Investment Strategy The Sub- will gain exposure to the performance of an investment strategy that aims to generate quarterly returns (if any) from three sources: (i) notionally holding a universe of 20 power related stocks with expected high dividend yields selected from a pre-defined stock universe of global power stocks*, (ii) by selling call options on these equities (appreciation of each stock in each quarter will be capped at a minimum of 2% of the price of each stock per quarter), and (iii) by the potential upside of the 20 stocks (5). The strategy also seeks protection by acquiring put options on these equities so that the potential downside of each stock is limited to a maximum of 10% in each quarter. *(1) market cap of at least 500m (2) Average daily turnover of at least 10m and (3) at least 75% Buy and Hold ratio from analyst recommendation from Bloomberg. Sub- Performance Summary (as at 17 May 2012) % 1 Month 3 Months 6 Months 12 Months Since Inception** Sub- Performance (1.96) (6.59) (3.05) (15.72) (10.02) Year ended 30 June 2012 High Low Latest At Inception NAV Year ended 30 June 2011 High Low NAV Year ended 30 June 2010 High Low NAV Year ended 30 June 2009 High Low NAV * This Sub- was fully redeemed during the year ended 30 June Performance figures are based on the results up to the redemption date. ** The since inception figure includes any distributions reinvested since inception. The Investment Manager s Report has been prepared up to the last valuation point whereas the financial statements have been prepared to the year ended 30 June This may result in differences between figures quoted in the Investment Manager s Report and the financial statements. (1) Yield from trading strategy = premium of call options less premium of put options plus dividends received. This does not take into account any fees or charges. (2) Subject to the impact of the option strategy used in the trading strategy of the Sub-. Capital gains might be capped. (For details of the trading strategy, please refer to the offering documents.) (3) Investors who invest during Year 1 (from Launch Date) are entitled to guaranteed quarterly Fixed Dividend of 2.45% of the Ini tial Issue Price per Share provided that investors must hold their shares until the relevant Sub- Ex-dividend Date (for details of the dates and other details, please refer to the offering documents) in order to receive the guaranteed Fixed Dividend for that quarter. (4) The Sub- price will go down as well as up. The Sub- is not capital guaranteed. (5) Single issuer limit: If more than one listing or class of shares of the same issuing body is in the top 20 shares, the listing or class of shares of the issuing body which is less liquid will be dropped from the Basket and replaced by the next lower ranking share. 33
37 Celsius s plc Bonus Select Investment Manager s Report for the year ended 30 June 2012 (Unaudited) Investment Objective The investment objective of the Sub- is to derive income from a basket of 25 stocks (the Basket ) with expected high dividend yields relating to a diversified range of sectors whilst implementing disciplined profit taking and downside stop loss measures. The Sub- aims to provide Shareholders with potential quarterly dividends, which may be zero. The Sub- further provides capital protection on the 6th anniversary of the launch date guaranteeing the higher of the Initial Issue Price or 80% of the highest NAV per Share. Investment Strategy The strategy involves: (i) notionally holding 25 stocks that may distribute dividends in the next quarter, (ii) selling call options on each stock to receive premium income and enforce disciplined profit taking, and (iii) buying put options on each stock as at stop loss mechanism. A dynamic allocation process is also in place to manage the Sub- s exposures to the basket and money market instruments to preserve capital. Sub- Performance Summary % 1 Month 3 Months 6 Months 12 Months Since Inception* Sub- Performance Year ended 30 June 2012 High Low Latest At Inception NAV * The since inception figure includes any distributions reinvested since inception. The Investment Manager s Report has been prepared up to the last valuation point whereas the financial statements have been prepared to the year ended 30 June This may result in differences between figures quoted in the Investment Manager s Report and the financial statements. 34
38 Celsius s plc Bonus Select Portfolio of Investments as at 30 June 2012 Financial assets at fair value through profit or loss: 99.84% (30/06/11: 98.56%) Financial Derivative Instruments: 99.84% (30/06/11: 98.56%) ed Swap*: 99.84% (30/06/11: 98.56%) CCY Notional Amount Description Maturity Date Fair Value % of Sub- SGD 76,116,353 Bonus Select Income SGD Swap 17/04/ ,817, ed Swap at positive fair value 75,817, Financial Derivative Instruments 75,817, Total Financial Assets at fair value through profit or loss 75,817, Cash and cash equivalents (30/06/11: 1.36%) 307, Debtors (30/06/11: 0.08%) 131, Creditors (30/06/11: Nil) (317,739) (0.42) Net Assets Attributable to Redeemable Participating Shareholders 75,938, /06/ /06/ /06/2010 Net Assets Attributable to Redeemable Participating Shareholders 75,938, ,485, ,125,060 Number of Redeemable Participating in Issue 76,427, ,090, ,105,712 Net Asset Value per Redeemable Participating Share Classification Financial derivative instruments at fair value through profit or loss are traded over the counter (OTC). Analysis of Total Gross Assets (Unaudited) % of Total Gross Assets OTC Financial Derivative Instruments Current Assets 0.58 The Counterparty for the ed Swap is Bank plc * The ed Swap exposes the Sub- to the performance of the Underlying (as defined in the Termsheet executed with the Approved Counterparty). 35
39 Celsius s plc Bonus Select Investment Manager s Report for the year ended 30 June 2012 (Unaudited) Investment Objective The investment objective of the Sub- is to derive income from a basket of 25 stocks (the Basket ) with expected high dividend yields relating to a diversified range of sectors whilst implementing disciplined profit taking and downside stop loss measures. The Sub- aims to provide Shareholders with potential quarterly dividends, which may be zero. The Sub- further provides capital protection on the 5th anniversary of the launch date guaranteeing the higher of the Initial Issue Price or 80% of the highest NAV per Share. Investment Strategy The strategy involves: (i) notionally holding 25 stocks that may distribute dividends in the next quarter, (ii) selling call options on each stock to receive premium income and enforce disciplined profit taking, and (iii) buying put options on each stock as at stop loss mechanism. A dynamic allocation process is also in place to manage the Sub- s exposures to the basket and money market instruments to preserve capital. Sub- Performance Summary % 1 Month 3 Months 6 Months 12 Months Since Inception* Sub- Performance Year ended 30 June 2012 High Low Latest At Inception NAV * The since inception figure includes any distributions reinvested since inception. The Investment Manager s Report has been prepared up to the last valuation point whereas the financial statements have been prepared to the year ended 30 June This may result in differences between figures quoted in the Investment Manager s Report and the financial statements. 36
40 Celsius s plc Bonus Select Portfolio of Investments as at 30 June 2012 Financial assets at fair value through profit or loss: 97.54% (30/06/11: 97.92%) Financial Derivative Instruments: 97.54% (30/06/11: 97.92%) ed Swap*: 97.54% (30/06/11: 97.92%) CCY Notional Amount Description Maturity Date Fair Value % of Sub- USD 3,213,667 Bonus Select Income USD Swap 17/04/2017 3,213, ed Swap at positive fair value 3,213, Financial Derivative Instruments 3,213, Total Financial Assets at fair value through profit or loss 3,213, Cash and cash equivalents (30/06/11: 0.62%) Deposits with credit institutions (30/06/11: 0.15%) 52, Debtors (30/06/11: 1.31%) 37, Creditors (30/06/11: Nil) (10,030) (0.30) Net Assets Attributable to Redeemable Participating Shareholders 3,294, /06/ /06/ /06/2010 Net Assets Attributable to Redeemable Participating Shareholders 3,294,654 4,749,642 8,184,630 Number of Redeemable Participating in Issue 3,294,650 4,770,103 8,356,536 Net Asset Value per Redeemable Participating Share Classification Financial derivative instruments at fair value through profit or loss are traded over the counter (OTC). Analysis of Total Gross Assets (Unaudited) % of Total Gross Assets OTC Financial Derivative Instruments Current Assets 2.75 The Counterparty for the ed Swap is Bank plc * The ed Swap exposes the Sub- to the performance of the Underlying (as defined in the Termsheet executed with the Approved Counterparty). 37
41 Celsius s plc China Accelerated Growth (HKD) Investment Manager s Report for the year ended 30 June 2012 (Unaudited) Investment Objective The investment objective of the Sub- is to provide Shareholders with capital appreciation referencing the performance of the Hang Seng China Enterprises Index (the Index ), comprising of H-shares issued by Chinese enterprises, listed on the Hong Kong Stock Exchange and included in the Hang Seng Mainland Composite Index. Investment Strategy The Sub- obtains exposure to the strategy via financial derivative instruments in the form of a swap, as follows: if the Index level of the Monthly Observation Date (which is expected to be the second last business day of the current month) is less than or equal to the Trigger Level, the Sub- would have 100% exposure to the Index performance; or if the Index level is more that the Trigger Level, the Sub- would have (a) 100% exposure to the Index performance up to and including 5%, and (b) 200% exposure to the excess of the Index performance above 5%. The Sub- s performance would be reduced by the Position Adjustment Factor and transaction costs of the swap. The Strategy will be implemented in Hong Kong Dollar and therefore subject to fluctuation in exchange rate risk between Hong Kong Dollar and Singapore Dollar, the base currency of the Sub-. Sub- Performance Summary % 1 Month 3 Months 6 Months 12 Months Since Inception Sub- Performance (0.90) (11.01) (4.03) (24.89) (50.53) Year ended 30 June 2012 High Low Latest At Inception NAV (HKD) Year ended 30 June 2011 High Low NAV (HKD) Year ended 30 June 2010 High Low NAV (HKD) Year ended 30 June 2009 High Low NAV (HKD) The Investment Manager s Report has been prepared up to the last valuation point whereas the financial statements have been prepared to the year ended 30 June This may result in differences between figures quoted in the Investment Manager s Report and the financial statements. 38
42 Celsius s plc China Accelerated Growth (HKD) Portfolio of Investments as at 30 June 2012 Financial assets at fair value through profit or loss: 99.12% (30/06/11: 98.07%) Financial Derivative Instruments: 99.12% (30/06/11: 98.07%) ed Swap*: 99.12% (30/06/11: 98.07%) CCY Notional Amount Description Maturity Date Fair Value HK$ % of Sub- HKD 180,884,812 China Accelerated Growth HKD Swap 04/07/ ,760, ed Swap at positive fair value 90,760, Total Financial Derivative Instruments 90,760, Total Financial Assets at fair value through profit or loss (Cost: HK$118,474,057) 90,760, Cash and cash equivalents (30/06/11: 1.84%) 266, Debtors (30/06/11: 0.43%) 1,017, Creditors (30/06/11: (0.34%)) (479,356) (0.52) Net Assets Attributable to Redeemable Participating Shareholders 91,564, /06/ /06/ /06/2010 Net Assets Attributable to Redeemable Participating Shareholders 91,564, ,360, ,639,945 Number of Redeemable Participating in Issue 1,850,616 2,373,830 3,765,706 Net Asset Value per Redeemable Participating Share Classification Financial derivative instruments at fair value through profit or loss are traded over the counter (OTC). Analysis of Total Gross Assets (Unaudited) % of Total Gross Assets OTC Financial Derivative Instruments Current Assets 1.39 The Counterparty for the ed Swap is Capital Securities Limited * The ed Swap exposes the Sub- to the performance of the Underlying (as defined in the Termsheet executed with the Approved Counterparty). 39
43 Celsius s plc Sector Select * Investment Manager s Report for the year ended 30 June 2012 (Unaudited) Investment Objective The investment objective of the Sub- is to provide a potential quarterly dividend return linked to a basket of 25 stocks from the global financial, real estate, utilities, infrastructure and resources sectors. Investment Strategy The strategy involves: (i) notionally holding stocks that may distribute dividends in the next quarter, (ii) selling call options on each stock to receive premium income and enforce disciplined profit taking, and (iii) buying put options on each stock as a stop loss mechanism. Sub- Performance Summary (as at 29 March 2012) % 1 Month 3 Months 6 Months 12 Months Since Inception** Sub- Performance (1.96) (0.89) (2.52) (22.49) (54.20) Year ended 30 June 2012 High Low Latest At Inception NAV * This Sub- was fully redeemed during the year ended 30 June Performance figures are based on the results up to the redemption date. ** The since inception figure includes any distributions reinvested since inception. The Investment Manager s Report has been prepared up to the last valuation point whereas the financial statements have been prepared to the year ended 30 June This may result in differences between figures quoted in the Investment Manager s Report and the financial statements. 40
44 Celsius s plc Strategic Select * Investment Manager s Report for the year ended 30 June 2012 (Unaudited) Investment Objective The investment objective of the Sub- is to provide Shareholders with a potential semi-annual dividend return linked to the performance of the Underlying (the Strategic Select Portfolio ) with continuous capital protection guaranteed after the end of four and a half years from the Launch Date equal to the Protected Price (as further described in the Sub- s Supplement under the section General Description of the Underlying ). The Underlying seeks to derive income equal to the Potential Dividend level from a basket of 25 expected dividend yielding stocks relating to a diversified range of sectors while implementing disciplined profit taking and downside stop-loss measures. Investment Strategy The strategy involves (i) notionally holding stocks that may distribute dividends in the next quarter, (ii) selling call options on each stock to receive premium income and enforce disciplined profit taking, and (iii) buying put options on each stock as a stop-loss mechanism. A dynamic allocation process is also in place to manage the Sub- s exposure to the basket and money market instruments to preserve capital. Sub- Performance Summary % 1 Month 3 Months 6 Months 12 Months Since Inception** Sub- Performance Year ended 30 June 2012 High Low Latest At Inception NAV * This Sub- was fully redeemed after the year end. ** The since inception figure includes any distributions reinvested since inception. The Investment Manager s Report has been prepared up to the last valuation point whereas the financial statements have been prepared to the year ended 30 June This may result in differences between figures quoted in the Investment Manager s Report and the financial statements. 41
45 Celsius s plc Strategic Select * Investment Manager s Report for the year ended 30 June 2012 (Unaudited) Investment Objective The investment objective of the Sub- is to provide a potential semi-annual dividend return linked to two baskets of 25 stocks each up to the Protection Effective Date and one basket thereafter, from the global financial, real estate and resources sectors. The Sub- further provides continuous capital protection guaranteed equal to after the end of four and a half years from the Launch Date. Investment Strategy The strategy involves (i) notionally holding stocks that may distribute dividends in the next quarter, (ii) selling call options on each stock to receive premium income and enforce disciplined profit taking, and (iii) buying put options on each stock as a stop-loss mechanism. A dynamic allocation process is also in place to manage the Sub- s exposure to the basket and money market instruments to preserve capital. Sub- Performance Summary (as at 29 June 2012) % 1 Month 3 Months 6 Months 12 Months Since Inception** Sub- Performance Year ended 30 June 2012 High Low Latest At Inception NAV * This Sub- was fully redeemed during the year ended 30 June ** The since inception figure includes any distributions reinvested since inception. The Investment Manager s Report has been prepared up to the last valuation point whereas the financial statements have been prepared to the year ended 30 June This may result in differences between figures quoted in the Investment Manager s Report and the financial statements. 42
46 Celsius s plc China Accelerated Growth Investment Manager s Report for the year ended 30 June 2012 (Unaudited) Investment Objective The investment objective of the Sub- is to provide Shareholders with capital appreciation referencing the performance of the Hang Seng China Enterprises Index (the Index ), comprising of H-shares issued by Chinese enterprises, listed on the Hong Kong Stock Exchange and included in the Hang Seng Mainland Composite Index. Investment Strategy The Sub- obtains exposure to the strategy via financial derivative instruments in the form of a swap, as follows: if the Index level of the Monthly Observation Date (which is expected to be the second last business day of the current month) is less than or equal to the Trigger Level, the Sub- would have 100% exposure to the Index performance; or if the Index level is more that the Trigger Level, the Sub- would have (a) 100% exposure to the Index performance up to and including 5%, and (b) 200% exposure to the excess of the Index performance above 5%. The Sub- s performance would be reduced by the Position Adjustment Factor and transaction costs of the swap. The Strategy will be implemented in Hong Kong Dollar and therefore subject to fluctuation in exchange rate risk between Hong Kong Dollar and US Dollar, the base currency of the Sub-. Sub- Performance Summary % 1 Month 3 Months 6 Months 12 Months Since Inception Sub- Performance (2.71) (12.28) (6.90) (26.22) (56.55) Year ended 30 June 2012 High Low Latest At Inception NAV The Investment Manager s Report has been prepared up to the last valuation point whereas the financial statements have been prepared to the year ended 30 June This may result in differences between figures quoted in the Investment Manager s Report and the financial statements. 43
47 Celsius s plc China Accelerated Growth Portfolio of Investments as at 30 June 2012 Financial assets at fair value through profit or loss: 99.29% (30/06/11: 97.33%) Financial Derivative Instruments: 99.29% (30/06/11: 97.33%) ed Swap*: 99.29% (30/06/11: 97.33%) CCY Notional Amount Description Maturity Date Fair Value % of Sub- USD 3,160,855 China Accelerated Growth USD Swap 30/08/2017 1,505, ed Swap at positive fair value 1,505, Total Financial Derivative Instruments 1,505, Total Financial Assets at fair value through profit or loss 1,505, Cash and cash equivalents (30/06/11: 0.02%) - - Deposits with credit institutions (30/06/11: 0.01%) - - Debtors (30/06/11: 2.64%) 113, Bank Overdraft (30/06/11: Nil) (103,105) (6.80) Net Assets Attributable to Redeemable Participating Shareholders 1,516, /06/ /06/ /06/2010 Net Assets Attributable to Redeemable Participating Shareholders 1,516,692 3,031,966 3,912,377 Number of Redeemable Participating in Issue 3,404,388 5,148,456 7,011,034 Net Asset Value per Redeemable Participating Share Classification Financial derivative instruments at fair value through profit or loss are traded over the counter (OTC). Analysis of Total Gross Assets (Unaudited) % of Total Gross Assets OTC Financial Derivative Instruments Current Assets 7.03 The Counterparty for the ed Swap is Bank plc * The ed Swap exposes the Sub- to the performance of the Underlying (as defined in the Termsheet executed with the Approved Counterparty). 44
48 Celsius s plc Life Select Investment Manager s Report for the year ended 30 June 2012 (Unaudited) Investment Objective The investment objective of the Sub- is to provide a potential capital growth during its first 10 years and thereafter, a potential quarterly dividend return, each linked to a basket of 25 stocks from the global pharmaceutical, health care, wealth management and environmental sectors. The Sub- also aims to repay the capital investment of investors who subscribed for the Sub- during the initial offer period and hold the shares for the next 10 years. Investment Strategy The strategy involves (i) notionally holding stocks that may distribute dividends in the next quarter, (ii) selling call options on each stock to receive premium income and enforce disciplined profit taking, and (iii) buying put options on each stock as a stop-loss mechanism. A dynamic allocation process is also in place to manage the Sub- s exposure to the basket and money market instruments to preserve capital. Sub- Performance Summary % 1 Month 3 Months 6 Months 12 Months Since Inception* Sub- Performance Year ended 30 June 2012 High Low Latest At Inception NAV * The since inception figure includes any distributions reinvested since inception. The Investment Manager s Report has been prepared up to the last valuation point whereas the financial statements have been prepared to the year ended 30 June This may result in differences between figures quoted in the Investment Manager s Report and the financial statements. 45
49 Celsius s plc Life Select Portfolio of Investments as at 30 June 2012 Financial assets at fair value through profit or loss: 99.14% (30/06/11: 98.17%) Financial Derivative Instruments: 99.14% (30/06/11: 98.17%) ed Swap*: 99.14% (30/06/11: 98.17%) CCY Notional Amount Description Maturity Date Fair Value % of Sub- SGD 8,423,560 Life Select 15/09/2017 5,019, ed Swap at positive fair value 5,019, Total Financial Derivative Instruments 5,019, Total Financial Assets at fair value through profit or loss 5,019, Cash and cash equivalents (30/06/11: 0.43%) 1, Debtors (30/06/11: 1.40%) 61, Bank overdraft (30/06/11: Nil) (19,522) (0.39) Net Assets Attributable to Redeemable Participating Shareholders 5,063, /06/ /06/ /06/2010 Net Assets Attributable to Redeemable Participating Shareholders 5,063,372 6,863,464 10,162,760 Number of Redeemable Participating in Issue 8,506,804 10,047,728 12,779,763 Net Asset Value per Redeemable Participating Share Classification Financial derivative instruments at fair value through profit or loss are traded over the counter (OTC). Analysis of Total Gross Assets (Unaudited) % of Total Gross Assets OTC Financial Derivative Instruments Current Assets 1.24 The Counterparty for the ed Swap is Bank plc * The ed Swap exposes the Sub- to the performance of the Underlying (as defined in the Termsheet executed with the Approved Counterparty). 46
50 Celsius s plc Global Asset Allocation Investment Manager s Report for the year ended 30 June 2012 (Unaudited) Investment Objective The Sub- s objective is to generate returns linked to the performance of a multi-asset portfolio (the diversified component) while protecting part of the initial capital invested and the highest value reached by the Sub- by also investing in Italian government bonds (the bonds). The Sub- can invest in a wide range of global asset classes including fixed income (rates, corporate and government bonds), shares (including in emerging markets), currencies and money market instruments. The Sub- can invest in these assets either directly or through investment funds and financial contracts known as derivatives. The Sub- may also be solely invested in the bonds. Investment Strategy From May 16th 2012 all or a substantial part of the Sub- s Assets will consist of Italian Government Bonds ("BTPs") the originally scheduled cash flows (interest and principal) of which, as of their date of purchase, are at least sufficient to achieve the Minimum Protection Level on the Scheduled Maturity Date. Investors should note that if a Credit Event occurs, the Minimum Protection Level may not be achieved (i.e. the payment under the Guarantee will be reduced). If, based on its terms and conditions, the Guarantee is terminated prior to the Scheduled Maturity Date, the Sub- may not be able to achieve the Investment Objective. Sub- Performance Summary % 1 Month 3 Months 6 Months 12 Months Since Inception Sub- Performance (4.44) (28.04) Year ended 30 June 2012 High Low Latest At Inception NAV (EUR) The Investment Manager s Report has been prepared up to the last valuation point whereas the financial statements have been prepared to the year ended 30 June This may result in differences between figures quoted in the Investment Manager s Report and the financial statements. 47
51 Celsius s plc Global Asset Allocation Portfolio of Investments as at 30 June 2012 Financial assets at fair value through profit or loss: 97.39% (30/06/11: 81.04%) Transferable Securities: 97.39% (30/06/11: Nil) Government Bonds: 97.39% (30/06/11: 72.63%) CCY Principal Amount Description Maturity Date Fair Value % of Sub- EUR 29,449, % Italy Buoni Poliennali del Tesoro 15/09/ ,790, EUR 24,000, % Italy Buoni Poliennali del Tesoro Principal Strip 01/08/ ,476, EUR 10,000, % Italy Buoni Poliennali del Tesoro Coupon Strip 01/08/2021 5,964, EUR 128,097, % Italy Buoni Poliennali del Tesoro 15/09/ ,492, EUR 119,000, % Italy Buoni Poliennali del Tesoro 01/08/ ,854, EUR 10,000, % Italy Buoni Poliennali del Tesoro Coupon Strip 01/08/2023 5,143, EUR 200,000, % Italy Buoni Poliennali del Tesoro Principal Strip 01/08/ ,568, EUR 134,988, % Italy Buoni Poliennali del Tesoro 15/09/ ,249, Total Government Bonds 472,539, Collective Investment Schemes: Nil (30/06/11: 6.74%) Financial Derivative Instruments: Nil (30/06/11: 1.67%) ed Swap: Nil (30/06/11: 0.90%) Unfunded Swap: Nil (30/06/11: (0.13%)) Open Futures Contracts: Nil (30/06/11: 0.90%) Total Financial Assets at fair value through profit or loss 472,539, Cash and cash equivalents (30/06/11: 13.55%) 6,513, Cash held with broker for open future contracts (30/06/11: 5.47%) - - Cash held with broker for swap contracts (30/06/11: 0.21%) - - Deposits with credit institutions (30/06/11: 0.08%) 5, Debtors (30/06/11: 0.02%) 4,473, Creditors (30/06/11: (0.37%)) (1,001,942) (0.21) Adjustment from bid market prices to last traded market prices 2,736, Net Assets Attributable to Redeemable Participating Shareholders 485,266, /06/ /06/ /06/2010 Net Assets Attributable to Redeemable Participating Shareholders 485,266, ,791, ,868,465 Number of Redeemable Participating in Issue 6,743,000 6,743,000 6,743,000 Net Asset Value per Redeemable Participating Share Analysis of Total Gross Assets (Unaudited) % of Total Gross Assets Transferable Securities and Money Market Instruments Current Assets
52 Celsius s plc China Accelerated Growth Investment Manager s Report for the year ended 30 June 2012 (Unaudited) Investment Objective The investment objective of the Sub- is to provide Shareholders with capital appreciation referencing the performance of the Hang Seng China Enterprises Index (the Index ), comprising of H-shares issued by Chinese enterprises, listed on the Hong Kong Stock Exchange and included in the Hang Seng Mainland Composite Index. Investment Strategy The Sub- obtains exposure to the strategy via financial derivative instruments in the form of a swap, as follows: if the Index level of the Monthly Observation Date (which is expected to be the second last business day of the current month) is less than or equal to the Trigger Level, the Sub- would have 100% exposure to the Index performance; or if the Index level is more that the Trigger Level, the Sub- would have (a) 100% exposure to the Index performance up to and including 5%, and (b) 200% exposure to the excess of the Index performance above 5%. The Sub- s performance would be reduced by the Position Adjustment Factor and transaction costs of the swap. The Strategy will be implemented in Hong Kong Dollar and therefore subject to fluctuation in exchange rate risk between Hong Kong Dollar and Singapore Dollar, the base currency of the Sub-. Sub- Performance Summary % 1 Month 3 Months 6 Months 12 Months Since Inception Sub- Performance (3.52) (11.25) (8.71) (21.88) (72.87) Year ended 30 June 2012 High Low Latest At Inception NAV The Investment Manager s Report has been prepared up to the last valuation point whereas the financial statements have been prepared to the year ended 30 June This may result in differences between figures quoted in the Investment Manager s Report and the financial statements. 49
53 Celsius s plc China Accelerated Growth Portfolio of Investments as at 30 June 2012 Financial assets at fair value through profit or loss: 99.44% (30/06/11: 97.56%) Financial Derivative Instruments: 99.44% (30/06/11: 97.56%) ed Swap*: 99.44% (30/06/11: 97.56%) CCY Notional Amount Description Maturity Date Fair Value % of Sub- SGD 9,794,254 China Accelerated Growth SGD Swap 30/11/2017 2,686, ed Swap at positive fair value 2,686, Total Financial Derivative Instruments 2,686, Total Financial Assets at fair value through profit or loss 2,686, Cash and cash equivalents (30/06/11: 0.31%) Debtors (30/06/11: 4.84%) 134, Bank overdraft (30/06/11: Nil) (117,047) (4.33) Creditors (30/06/11: (2.71%)) (2,604) (0.10) Net Assets Attributable to Redeemable Participating Shareholders 2,701, /06/ /06/ /06/2010 Net Assets Attributable to Redeemable Participating Shareholders 2,701,926 4,514,481 6,874,543 Number of Redeemable Participating in Issue 9,761,436 12,996,996 18,553,535 Net Asset Value per Redeemable Participating Share Classification Financial derivative instruments at fair value through profit or loss are traded over the counter (OTC). % of Total Analysis of Total Gross Assets (Unaudited) Gross Assets OTC Financial Derivative Instruments Current Assets The Counterparty for the ed Swap is Bank plc. * The ed Swap exposes the Sub- to the performance of the Underlying (as defined in the Termsheet executed with the Approved Counterparty). 50
54 Celsius s plc Investment Legends Investment Manager s Report for the year ended 30 June 2012 (Unaudited) Investment Objective The investment objective of the Sub- is to provide Shareholders with long-term capital appreciation from a diversified pool of asset classes, including equities, fixed income and commodities, which make up the Investment Legends Portfolio (the Portfolio ). Investment Strategy The Sub- gains access to the asset classes via the combination of direct investments in Transferable Securities, Derivative Contracts and Collective Investment Schemes ( CIS ). All exposure to UCITS and non-ucits CIS comply with the UCITS guidelines. Using quantitative and qualitative criteria, the Investment Manager seeks to select investments which, in its opinion, provide access to management skills of reputable investment managers. Share Class Performance Summary % 1 Month 3 Months 6 Months 12 Months Since Inception Share Class Performance Class A 2.89 (9.32) (3.49) (15.46) (26.38) Share Class Performance Class B 2.82 (9.43) (3.62) (15.74) (26.75) Share Class Performance Class E 2.81 (9.48) (3.75) (16.46) (25.36) Year ended 30 June 2012 High Low Latest At Inception NAV Class A NAV (HKD) Class B NAV Class E Year ended 30 June 2011 High Low NAV Class A NAV (HKD) Class B NAV Class E Year ended 30 June 2010 High Low NAV Class A NAV (HKD) Class B NAV Class E Year ended 30 June 2009 High Low NAV Class A NAV (HKD) Class B NAV Class E Period ended 30 June 2008 High Low NAV Class A NAV (HKD) Class B The Investment Manager s Report has been prepared up to the last valuation point whereas the financial statements have been prepared to the year ended 30 June This may result in differences between figures quoted in the Investment Manager s Report and the financial statements. 51
55 Celsius s plc Investment Legends Portfolio of Investments as at 30 June 2012 Financial assets at fair value through profit or loss: 96.82% (30/06/11: %) Transferable Securities: 29.09% (30/06/11: 29.60%) Common Stock: 29.09% (30/06/11: 29.60%) No. of Description Fair Value % of Sub- 81,383 Berkshire Hathaway Inc 6,781, ,770 Blackstone Group LP 3,525, ,322 Leucadia National 6,791, ,986,137 Man Group Plc 3,571, Total Common Stock 20,670, Total Transferable Securities 20,670, Collective Investment Schemes*: 28.65% (30/06/11: 30.23%) No. of CCY Description Fair Value % of Sub- USD 529,090 Pimco Total Return Bond 13,449, USD 324,430 Templeton Emerging Markets 6,907, Total Collective Investment Schemes 20,356, Financial Derivative Instruments: 39.08% (30/06/11: 38.68%) ed Swap**: 38.98% (30/06/11: 38.45%) Notional CCY Amount Description Maturity Date Fair Value % of Sub- USD 31,233,111 Investment Legends Collaterised Bullet Swap 27/09/ ,700, ed Swap at positive fair value 27,700, Open Forward Foreign Exchange Currency Contracts***: 0.10% (30/06/11: 0.23%) Maturity Date Counterparty Amount Bought Amount Sold Unrealised Gain/(Loss) % of Sub- 05/07/2012 Bank plc HKD 420,412 USD 54, /07/2012 UBS AG London SGD 14,280,384 USD 11,112, , /07/2012 UBS AG London SGD 4,250 USD 3, /07/2012 Bank plc SGD 290,355 USD 229, /07/2012 UBS AG London SGD 97 USD /07/2012 UBS AG London SGD 6,796 USD 5, /07/2012 UBS AG London USD 3,802,557 GBP 2,484,414 (99,447) (0.14) 05/07/2012 Bank plc USD 293,333 GBP 187,136 (580) (0.00) 25/07/2012 UBS AG London USD 82,060 SGD 105,302 (1,172) (0.00) 25/07/2012 UBS AG London USD 5,443 SGD 6,976 (72) (0.00) 25/07/2012 Bank plc USD 220,204 SGD 282,132 (2,798) (0.01) 25/07/2012 Bank plc USD 258,467 SGD 329,755 (2,176) (0.00) 25/07/2012 UBS AG London USD 28,113 SGD 36,029 (366) (0.00) 25/07/2012 UBS AG London USD 5,322 SGD 6,796 (50) (0.00) Unrealised gain on forward foreign exchange currency contracts 175, Unrealised loss on forward foreign exchange currency contracts (106,661) (0.15) Net unrealised gain on forward foreign exchange currency contracts 68,
56 Celsius s plc Investment Legends Portfolio of Investments as at 30 June 2012 cont/d Financial assets at fair value through profit or loss: 96.82% (30/06/11: %) cont/d Fair Value % of Sub- Net Financial Derivative Instruments 27,769, Net Financial Assets at fair value through profit or loss (Cost: 75,128,691) 68,796, Cash and cash equivalents (30/06/11: 0.06%) 154, Deposits with credit institutions (30/06/11: 1.99%) 2,501, Debtors (30/06/11: 0.16%) 73, Bank overdraft (30/06/11: Nil) (62) (0.00) Creditors (30/06/11: (0.72%)) (472,022) (0.66) Net Assets Attributable to Redeemable Participating Shareholders 71,053, /06/ /06/ /06/2010 Net Assets Attributable to Redeemable Participating Shareholders Class A USD 31,793,740 56,579,964 68,792,351 Number of Redeemable Participating in Issue Class A 431, , ,970 Net Asset Value per Redeemable Participating Share Class A USD Net Assets Attributable to Redeemable Participating Shareholders Class B HKD 216,861, ,811, ,147,987 Number of Redeemable Participating in Issue Class B 2,960,297 3,897,511 5,318,670 Net Asset Value per Redeemable Participating Share Class B HKD Net Assets Attributable to Redeemable Participating Shareholders Class E SGD 14,301,273 20,107,543 18,335,317 Number of Redeemable Participating in Issue Class E 19,158,041 22,503,018 25,221,809 Net Asset Value per Redeemable Participating Share Class E SGD Classification Financial derivative instruments at fair value through profit or loss are traded over the counter (OTC). Analysis of Total Gross Assets (Unaudited) % of Total Gross Assets Transferable Securities Collective Investment Schemes OTC Financial Derivative Investments Current Assets 3.81 The Counterparty for the ed Swap is Capital Securities Limited. * The Collective Investment Schemes held by the Sub- meet the requirements of UCITS Regulations. ** The ed Swap exposes the Sub- to the performance of the Underlying (as defined in the Termsheet executed with the Approved Counterparty). *** Over the counter (OTC) Financial Derivative Instruments
57 Celsius s plc GEMS Investment Manager s Report for the year ended 30 June 2012 (Unaudited) Investment Objective The investment objective of the Sub- is to provide Shareholders exposure to currency markets of the specified Emerging Markets achieved through entering into a synthetic portfolio of short term liquid non-deliverable forward foreign exchange currency contracts and investing in notional synthetic USD cash deposits, as represented by the GEMS USD Index. Investment Strategy The Sub- will offer Shareholders exposure to the performance of the Index net of fees. Share Class Performance Summary % 1 Month 3 Months 6 Months 12 Months Since Inception Share Class Performance Class A* 2.87 (3.38) (8.58) Share Class Performance Class B* 2.87 (3.42) - - (2.74) Share Class Performance Class F 2.94 (3.15) 2.68 (7.77) (1.01) Share Class Performance Class G 0.97 (1.29) 1.61 (5.73) Share Class Performance Class H 2.96 (3.17) 2.69 (8.00) (7.86) Share Class Performance Class I** (0.74) 4.50 (1.67) - (6.37) Year ended 30 June 2012 High Low Latest At Inception NAV Class A* NAV (GBP) Class B* NAV Class F NAV (GBP) Class G NAV (GBP) Class H NAV (EUR) Class I** * These Share Classes launched during the year ended 30 June ** This Share Class was fully redeemed during the year ended 30 June Performance figures for this Share Class are based on the results up to the termination date. The Investment Manager s Report has been prepared up to the last valuation point whereas the financial statements have been prepared to the year ended 30 June This may result in differences between figures quoted in the Investment Manager s Report and the financial statements. 54
58 Celsius s plc GEMS Portfolio of Investments as at 30 June 2012 Financial assets at fair value through profit or loss: 98.96% (30/06/11: 99.97%) Financial Derivative Instruments: 98.96% (30/06/11: 99.18%) ed Swap*: 98.75% (30/06/11: 99.19%) CCY Notional Amount Description Maturity Date Fair Value % of Sub- USD 17,348,445 GEMS Pooled Assets Swap 23/05/ ,333, ed Swap at positive fair value 18,333, Open Forward Foreign Exchange Currency Contracts**: 0.21% (30/06/11: (0.01%)) Maturity Date Counterparty Amount Bought Amount Sold Unrealised Gain/(Loss) % of Sub- 25/07/2012 UBS AG London GBP 95,632 USD 148,060 2, /07/2012 UBS AG London GBP 2,243,724 USD 3,486,780 37, /07/2012 UBS AG London GBP 6,728 USD 10, /07/2012 Bank plc GBP 48,736 USD 76, /07/2012 Bank plc GBP 137 USD /07/2012 UBS AG London USD 8,753 GBP 5,613 (62) (0.00) 25/07/2012 UBS AG London USD 10,776 GBP 6,920 (91) (0.00) Unrealised gain on forward foreign exchange currency contracts 39, Unrealised loss on forward foreign exchange currency contracts (153) (0.00) Net gain on forward foreign exchange currency contracts 39, Net Financial Derivative Instruments 18,373, Net Financial Assets at fair value through profit or loss 18,373, Cash and cash equivalents (30/06/11: 0.20%) 75, Deposits with credit institutions (30/06/11: 0.79%) 211, Debtors (30/06/11: 0.09%) 35, Creditors (30/06/11: (0.26%)) (130,237) (0.70) Net Assets Attributable to Redeemable Participating Shareholders 18,565, /06/ /06/ /06/2010 Net Assets Attributable to Redeemable Participating Shareholders Class A USD 2,295, Number of Redeemable Participating in Issue Class A 2,510, Net Asset Value per Redeemable Participating Share Class A USD Net Assets Attributable to Redeemable Participating Shareholders Class B GBP 6, Number of Redeemable Participating in Issue Class B 7, Net Asset Value per Redeemable Participating Share Class B GBP Net Assets Attributable to Redeemable Participating Shareholders Class F USD 1,162,166 2,967, ,474 Number of Redeemable Participating in Issue Class F 1,173,950 2,764, ,048 Net Asset Value per Redeemable Participating Share Class F USD Net Assets Attributable to Redeemable Participating Shareholders Class G GBP 7,243,312 20,053,942 5,172,351 Number of Redeemable Participating in Issue Class G 5,770,291 15,060,091 4,059,033 Net Asset Value per Redeemable Participating Share Class G GBP Net Assets Attributable to Redeemable Participating Shareholders Class H GBP 2,368,961 1,268,331 - Number of Redeemable Participating in Issue Class H 2,570,911 1,266,363 - Net Asset Value per Redeemable Participating Share Class H GBP
59 Celsius s plc GEMS Portfolio of Investments as at 30 June 2012 cont/d 30/06/ /06/ /06/2010 Net Assets Attributable to Redeemable Participating Shareholders Class I EUR - 2,126,842 - Number of Redeemable Participating in Issue Class I - 20,430 - Net Asset Value per Redeemable Participating Share Class I EUR Classification Financial derivative instruments at fair value through profit or loss are traded over the counter (OTC). Analysis of Total Gross Assets (Unaudited) % of Total Gross Assets OTC Financial Derivative Instruments Current Assets 1.72 The Counterparty for the ed Swap is Bank plc * The ed Swap exposes the Sub- to the performance of the Underlying (as defined in the Termsheet executed with the Approved Counterparty). ** Over the counter (OTC) Financial Derivative Instruments. 56
60 Celsius s plc Global Agriculture Delta Investment Manager s Report for the year ended 30 June 2012 (Unaudited) Investment Objective The investment objective of the Sub- is to provide Shareholders with a return linked to the performance of the Underlying, which is the Rogers International Commodity Index Agriculture (the Index ) net of Index fees. The total return performance is based on a basket of 20 agriculture commodities futures contracts consumed in the global economy. Investment Strategy The Sub- offers Shareholders exposure to a basket of commodities making up the Index, via Financial Derivative Instruments ( FDIs ), including swaps. FDIs are also being employed for currency hedging purposes. Share Class Performance Summary % 1 Month 3 Months 6 Months 12 Months Since Inception Share Class Performance Class A 8.48 (2.67) (1.35) (11.58) (25.92) Share Class Performance Class B 8.43 (2.77) (1.47) (11.86) (26.40) Share Class Performance Class C 8.42 (2.79) (1.62) (12.45) (29.34) Share Class Performance Class D 8.66 (2.01) 0.15 (9.16) Year ended 30 June 2012 High Low Latest At Inception NAV Class A NAV (HKD) Class B NAV Class C NAV (AUD) Class D Year ended 30 June 2011 High Low NAV Class A NAV (HKD) Class B NAV Class C NAV (AUD) Class D Year ended 30 June 2010 High Low NAV Class A NAV (HKD) Class B NAV Class C NAV (AUD) Class D Year ended 30 June 2009 High Low NAV Class A NAV (HKD) Class B NAV Class C Year ended 30 June 2008 High Low NAV Class A NAV (HKD) Class B NAV Class C The Investment Manager s Report has been prepared up to the last valuation point whereas the financial statements have been prepared to the year ended 30 June This may result in differences between figures quoted in the Investment Manager s Report and the financial statements. 57
61 Celsius s plc Global Agriculture Delta Portfolio of Investments as at 30 June 2012 Financial assets at fair value through profit or loss: 99.84% (30/06/11: 98.93%) Financial Derivative Instruments: 99.84% (30/06/11: 98.93%) ed Swap*: 99.54% (30/06/11: 98.79%) CCY Notional Amount Description Maturity Date Fair Value % of Sub- USD 118,066,530 RICI ed Swap 23/09/ ,219, ed Swap at positive fair value 104,219, Open Forward Foreign Exchange Currency Contracts**: 0.30% (30/06/11: 0.14%) Maturity Date Counterparty Amount Bought Amount Sold Unrealised Gain/(Loss) % of Sub- 25/07/2012 UBS AG London AUD 294,745 USD 290,902 10, /07/2012 Bank plc AUD 10,844 USD 11, /07/2012 Bank plc AUD 10,273 USD 10, /07/2012 Bank plc HKD 148,353 USD 19, /07/2012 Bank plc HKD 10,179 USD 1, /07/2012 UBS AG London SGD 23,928,146 USD 18,619, , /07/2012 UBS AG London SGD 8,875 USD 6, /07/2012 Bank plc SGD 894,539 USD 706, /07/2012 UBS AG London SGD 217 USD /07/2012 UBS AG London SGD 33,061 USD 25, /07/2012 Bank plc SGD 825,597 USD 646,631 5, /07/2012 UBS AG London SGD 4,312 USD 3, /07/2012 UBS AG London SGD 63,362 USD 49, /07/2012 Bank plc USD 6,079 AUD 6,063 (115) (0.00) 25/07/2012 UBS AG London USD 74,648 SGD 95,790 (1,067) (0.00) 25/07/2012 UBS AG London USD 6,837 SGD 8,795 (115) (0.00) 25/07/2012 UBS AG London USD 4,819 SGD 6,177 (63) (0.00) 25/07/2012 UBS AG London USD 9,745 SGD 12,451 (96) (0.00) 25/07/2012 UBS AG London USD 9,757 SGD 12,400 (44) (0.00) 25/07/2012 UBS AG London USD 21,948 SGD 27,874 (85) (0.00) 25/07/2012 UBS AG London USD 46,793 SGD 59,281 (64) (0.00) 25/07/2012 UBS AG London USD 4,119 SGD 5,266 (44) (0.00) 25/07/2012 Bank plc USD 378,683 SGD 483,120 (3,182) (0.00) 25/07/2012 UBS AG London USD 4,650 SGD 5,959 (61) (0.00) 25/07/2012 UBS AG London USD 25,890 SGD 33,061 (242) (0.00) 25/07/2012 UBS AG London USD 3,377 SGD 4,312 (31) (0.00) 25/07/2012 UBS AG London USD 49,490 SGD 63,362 (592) (0.00) Unrealised gain on forward foreign exchange currency contracts 311, Unrealised loss on forward foreign exchange currency contracts (5,801) (0.00) Net unrealised gain on forward foreign exchange currency contracts 305, Total Financial Derivative Investments at fair value 104,525,
62 Celsius s plc Global Agriculture Delta Portfolio of Investments as at 30 June 2012 cont/d Fair Value % of Sub- Net Financial Assets at fair value through profit or loss (Cost: 118,062,175) 104,525, Cash and cash equivalents (30/06/11: 0.06%) 1, Deposits with credit institutions (30/06/11: 1.00%) 679, Debtors (30/06/11: 0.45%) 49, Creditors (30/06/11: (0.44%)) (556,242) (0.54) Net Assets Attributable to Redeemable Participating Shareholders 104,698, /06/ /06/ /06/2010 Net Assets Attributable to Redeemable Participating Shareholders Class A USD 50,513,968 80,372,993 49,317,721 Number of Redeemable Participating in Issue Class A 681, , ,394 Net Asset Value per Redeemable Participating Share Class A USD Net Assets Attributable to Redeemable Participating Shareholders Class B HKD 260,692, ,616, ,929,653 Number of Redeemable Participating in Issue Class B 3,541,963 4,881,565 4,383,376 Net Asset Value per Redeemable Participating Share Class B HKD Net Assets Attributable to Redeemable Participating Shareholders Class C SGD 25,621,818 36,656,448 26,244,852 Number of Redeemable Participating in Issue Class C 36,256,992 45,411,977 45,299,340 Net Asset Value per Redeemable Participating Share Class C SGD Net Assets Attributable to Redeemable Participating Shareholders Class D AUD 318, , ,944 Number of Redeemable Participating in issue Class D 258, , ,169 Net Asset Value per Redeemable Participating Share Class D AUD Classification Financial derivative instruments at fair value through profit or loss are traded over the counter (OTC). Analysis of Total Gross Assets (Unaudited) % of Total Gross Assets OTC Financial Derivative Instruments Current Assets 0.69 The Counterparty for the ed Swap is Capital Securities Limited. * The ed Swap exposes the Sub- to the performance of the Underlying (as defined in the Termsheet executed with the Approved Counterparty). ** Over the counter (OTC) Financial Derivative Instruments
63 Celsius s plc Liquidity Compass (EUR) * Investment Manager s Report for the year ended 30 June 2012 (Unaudited) Investment Objective The investment objective of the Sub- is to provide Shareholders with a return linked to the performance of the Underlying, the Liquidity Compass (EUR) portfolio which is comprised of a Cash Constituent and a number of Strategy Constituents such as the Capital Global Trend Index, GEMS USD Index, Intelligent Carry EUR Index, Income Plus EUR Index, Exceed EUR Index. This is in accordance with a systematic quantitative strategy. Investment Strategy In order to achieve the investment objective, the Company on behalf of the Sub- intends to invest the net proceeds of any issue of in one or more Derivative Contracts in the form of funded swaps, and/or in combination with unfunded total return swaps. Sub- Performance Summary (as at 3 January 2012) % 1 Month 3 Months 6 Months 12 Months Since Inception Sub- Performance (0.02) (2.47) (5.62) (4.59) (2.60) Year ended 30 June 2012 High Low Latest At Inception NAV (EUR) * This Sub- was fully redeemed during the year ended 30 June Performance figures are based on the results up to Sub- termination date. The Investment Manager s Report has been prepared up to the last valuation point whereas the financial statements have been prepared to the year ended 30 June This may result in differences between figures quoted in the Investment Manager s Report and the financial statements. 60
64 Celsius s plc Dynamic Golden Allocation * Investment Manager s Report for the year ended 30 June 2012 (Unaudited) Investment Objective The Investment Objective of the Sub- is to provide Shareholders with long-term capital appreciation through providing exposure to a portfolio of assets whose value is linked to (or influenced by) the value of gold. Investment Strategy The Sub- offers Shareholders exposure to Gold via global equities, ETFs, debt securities (including but not limited to zero-coupon notes) and/or Futures (referencing the USD against EUR exchange rates).the Sub- may enter into Financial Derivative Instruments for efficient portfolio management purposes. Share Class Performance Summary (as at 2 September 2011) % 1 Month 3 Months 6 Months 12 Months Since Inception Share Class Performance Class A Share Class Performance Class B Share Class Performance Class H Year ended 30 June 2012 High Low Latest At Inception NAV Class A NAV (HKD) Class B NAV Class H Year ended 30 June 2011 High Low Latest At Inception NAV Class A NAV (HKD) Class B NAV Class H Period ended 30 June 2010 High Low NAV Class A NAV (HKD) Class B NAV Class H * This Sub- was fully redeemed on 2 September The Investment Manager s Report has been prepared up to the last valuation point whereas the financial statements have been prepared to the year ended 30 June This may result in differences between figures quoted in the Investment Manager s Report and the financial statements. 61
65 Celsius s plc Fondo Radar Investment Manager s Report for the year ended 30 June 2012 (Unaudited) Investment Objective The investment objective of the Sub- is to provide Shareholders with a return (net of fees and costs) linked to the Radar Portfolio (the "Portfolio"), which comprises the Traditional Basket, the Diversified Basket and a Fixed Income Component (together the "Portfolio Components"). Through the Portfolio Components, the Sub- will be exposed to a diversified pool of assets including bonds, equities, foreign currency and Money Market Instruments. Allocation between the Baskets and the Fixed Income Component shall be in accordance with the CPPI Strategy the aim of which is to dynamically allocate assets on an on-going basis between the Baskets and the Fixed Income Component as further described below, so as to ensure that the Sub-s Assets are sufficient to generate at least the Minimum Protection Level per Share on the Scheduled Maturity Date. The CPPI Strategy is run by the Put Option Counterparty. The Minimum Protection Level shall be the highest Net Asset Value per Share on any date from, and including, the Launch Date up to, and excluding, the Portfolio Date divided by the Initial Issue Price per Share times 100 EUR. Investment Strategy The performance of the Baskets depends on the performance of the following asset classes: equities, fixed income, currencies, money markets, emerging markets and volatility indices, inflation linked bonds and UCITS (in the form of CIS or ETF) (which deliver exposure to any of those asset classes) less all fees and charges (including any costs as detailed under the section "Portfolio Costs" of this Supplement). Sub- Performance Summary % 1 Month 3 Months 6 Months 12 Months Since Inception Sub- Performance 2.91 (2.77) 7.58 (4.31) (6.67) Year ended 30 June 2012 High Low Latest At Inception NAV (EUR) The Investment Manager s Report has been prepared up to the last valuation point whereas the financial statements have been prepared to the year ended 30 June This may result in differences between figures quoted in the Investment Manager s Report and the financial statements. 62
66 Celsius s plc Fondo Radar Portfolio of Investments as at 30 June 2012 Financial assets at fair value through profit or loss: 94.72% (30/06/11: 85.56%) Transferable Securities: 90.01% (30/06/11: 85.38%) Government Bonds: 90.01% (30/06/11: 85.38%) CCY Principal Amount Description Maturity Date Fair Value % of Sub- EUR 6,800, % Italy Buoni Poliennali del Tesoro 01/08/2017 6,854, EUR 30,000, % Italy Buoni Poliennali del Tesoro 01/02/ ,886, EUR 42,000, % Italy Buoni Poliennali del Tesoro 01/08/ ,905, EUR 50,000, % Italy Buoni Poliennali del Tesoro 01/08/ ,567, EUR 50,000, % Italy Buoni Poliennali del Tesoro 01/05/ ,046, EUR 18,000, % Italy Buoni Poliennali del Tesoro 01/02/ ,443, Total Government Bonds 154,703, Total Transferable Securities 154,703, Collective Investment Schemes*: 4.01% (30/06/11: Nil) CCY No. of Description Fair Value % of Sub- EUR 113,000 i MSCI Emerging Markets Index 3,489, EUR 140,000 i FTSE/EPRA European 3,397, Total Collective Investment Schemes 6,886, Financial Derivative Instruments: 0.70% (30/06/11: 0.18%) Unfunded Swaps****: 0.00% (30/06/11: 0.06%) CCY No. of Description Maturity Date Fair Value % of Sub- USD 8,850,000 Swap on EM US 31/07/ USD 16,600,000 Swap on BCIT1T Index 31/07/ Unfunded Swaps at fair value Open Forward Foreign Exchange Currency Contracts**: 0.07% (30/06/11: Nil) Maturity Date Counterparty Amount Bought Amount Sold Unrealised Gain/(Loss) % of Sub- 05/07/2012 Bank plc EUR 197,290 GBP 159, /07/2012 Bank plc EUR 676,276 JPY 65,450,000 29, /07/2012 Bank plc EUR 3,460,669 USD 4,271,400 94, /07/2012 Bank plc EUR 465,530 USD 581,146 7, /07/2012 Bank plc USD 208,240 EUR 168,662 (4,573) (0.00) Unrealised gain on forward foreign exchange currency contracts 133, Unrealised loss on open forward foreign exchange currency contracts (4,573) (0.00) Net unrealised gain on forward foreign exchange currency contracts 128,
67 Celsius s plc Fondo Radar Portfolio of Investments as at 30 June 2012 cont/d Financial assets at fair value through profit or loss: 94.72% (30/06/11: 85.56%) cont/d Financial Derivative Instruments: 0.70% (30/06/11: 0.18%) cont/d Open Futures Contracts***: 0.62% (30/06/11: 0.12%) No. of Contracts Description Counterparty (18) (397) Unrealised Gain/(Loss) % of Sub- German Euro Bund Futures Short Futures Contracts expiring September 2012 Goldman Sachs 82, German Euro BOBL Futures Short Futures Contracts expiring September 2012 Goldman Sachs 633, German Euro Bund Futures Long Futures Contracts expiring September 2012 Goldman Sachs (1,980) (0.00) Topix Index Futures Long Futures Contracts expiring September 2012 Goldman Sachs 265, Year JGB Mini Futures Long Futures Contracts expiring September 2012 Goldman Sachs 22, S&P 500 E-mini Index Futures Long Futures Contracts expiring September 2012 Goldman Sachs 15, FTSE 100 Index Futures Long Futures Contracts expiring September 2012 Goldman Sachs 41, Year US Treasury Note Futures Long Futures Contracts expiring September 2012 Goldman Sachs 13, Unrealised gain on open futures contracts 1,073, Unrealised loss on open futures contracts (1,980) (0.00) Net unrealised gain on open futures contracts 1,072, Total Financial Derivative Instruments 1,200, Total Financial Assets at fair value through profit or loss 162,790, Cash and cash equivalents (30/06/11: 10.41%) 7,001, Cash held with broker for open futures contracts (30/06/11: 3.99%) 4,503, Cash held with broker for swap contracts (30/06/11: 0.09%) - - Deposits with credit institutions (30/06/11: 0.22%) - - Debtors (30/06/11: 0.09%) 253, Bank overdraft (30/06/11: Nil) (14,894) (0.01) Creditors (30/06/11: (0.36%)) (3,690,501) (2.15) Adjustment from bid market prices to last traded market prices 1,038, Net Assets Attributable to Redeemable Participating Shareholders 171,882, /06/ /06/2011 Net Assets Attributable to Redeemable Participating Shareholders 171,882, ,969,675 Number of Redeemable Participating in Issue 1,957,368 1,983,093 Net Asset Value per Redeemable Participating Share Classification Financial derivative instruments at fair value through profit or loss are traded over the counter (OTC) with the exception of open futures contracts which are exchange traded. 64
68 Celsius s plc Fondo Radar Portfolio of Investments as at 30 June 2012 cont/d Analysis of Total Gross Assets (Unaudited) % of Total Gross Assets Transferable Securities Collective Investments Schemes 3.94 OTC Financial Derivative Instruments 0.08 Exchange Traded Financial Derivative Instruments 0.61 Current Assets 6.74 The Counterparties for the Unfunded Swaps is Bank plc and JP Morgan. * The Collective Investment Schemes held by the Sub- meet the requirements of UCITS Regulations. ** Over the counter (OTC) Financial Derivative Instruments. *** Exchange traded Financial Derivative Instruments. **** The Unfunded Swaps expose the Sub- to the performance of the Underlying (as defined in the Termsheet executed with the Approved Counterparty)
69 Celsius s plc HFRX Opportunity Investment Manager s Report for the year ended 30 June 2012 (Unaudited) Investment Objective The Investment Objective of the Sub- is to provide Shareholders with a return, net of fees and costs, linked to the HFRX Opportunity Portfolio (the "Portfolio"). The Portfolio comprised three Portfolio Components, namely, the Index Component, the Cash Component and the Bond Component, and notionally allocates between the Index Component and the Cash Component or, in case of a Lock-in Trigger Event, de-allocates entirely from the Index Component to allocate to the Bond Component and Cash Component, in accordance with a dynamic allocation strategy (the "Protection Strategy"). Investment Strategy In order to achieve the investment objective, the Company on behalf of the Sub- intends to invest the net proceeds of any issue of (whether on the Launch Date or subsequently) in Sub- Assets in the manner set out below. (i) one or more Derivative Contracts in the form of fully funded swaps entered into with the Approved Counterparty the purpose of which is to gain exposure to the Portfolio (each such swap a Portfolio Swap ). (ii) a portfolio of transferable securities or other eligible assets that may be unrelated to the Reference Index or the Portfolio. These may include (without limitation) fixed income securities such as sovereign bonds (including bonds issued by the Republic of Italy), money market instruments; and/or units of other open-ended collective investment schemes including other s of the Company, which satisfy the requirements of the Regulations. (iii) Where the Sub- invests in assets described in (ii) above, the Sub- will enter into Derivative Contracts in the form of funded swaps with the Approved Counterparty (each such swap an Asset Swap ). The Approved Counterparty will pay the upfront proceeds of the Asset Swaps to the Sub-. In return, the Sub- will provide the Approved Counterparty with exposure to the price performance and income received (if any) in relation to such securities and/or other eligible assets. The purpose of the Asset Swaps arrangement is to partially offset the overall credit exposure of the Sub- to the Approved Counterparty arising from the Portfolio Swap against the exposure of the Approved Counterparty to the Sub- under the Asset Swaps. Additionally, the Sub- will have neither market nor credit exposure to the particular securities and other eligible assets referred to in (ii) above, except in the event of a default on the part of the Approved Counterparty to the Asset Swaps. Sub- Performance Summary % 1 Month 3 Months 6 Months 12 Months Since Inception Sub- Performance (0.50) (1.53) 1.25 (7.67) (11.80) Year ended 30 June 2012 High Low Latest At Inception NAV (EUR) The Investment Manager s Report has been prepared up to the last valuation point whereas the financial statements have been prepared to the year ended 30 June This may result in differences between figures quoted in the Investment Manager s Report and the financial statements. 66
70 Celsius s plc HFRX Opportunity Portfolio of Investments as at 30 June 2012 Financial assets at fair value through profit or loss: % (30/06/11: %) Transferable Securities: 15.81% (30/06/11: 9.28%) Government Bonds: 15.81% (30/06/11: 9.28%) CCY Principal Amount Description Maturity Date Fair Value % of Sub- EUR 9,500, % Italy Buoni Poliennali del Tesoro Principal Strip 01/08/2013 9,177, EUR 6,500, % Italy Buoni Poliennali del Tesoro Coupon Strip 01/08/2018 4,767, Total Government Bonds 13,945, Total Transferable Securities 13,945, Collective Investment Schemes*: 66.29% (30/06/11: 75.94%) CCY No. of Description Fair Value % of Sub- USD 36,753 Aberdeen Global - Emerging Markets Equity 1,726, USD 469,254 Aberdeen Global - World Equity 5,343, EUR 2,695 Amundi - Amundi Dynarbitrage VaR 4 17,081, USD 17,944 Amundi s - Absolute VaR 4 USD 14,970, EUR 31,256 BlueBay High Yield Bond 8,478, EUR 64,859 Generali Investments SICAV - Euro Corporate Bonds 10,865, Total Collective Investment Schemes 58,465, Derivative Financial Instruments: 17.90% (30/06/11: 14.78%) ed Swaps**: 17.90% (30/06/11: 14.78%) CCY Notional Amount Description Maturity Date Fair Value % of Sub- EUR 100,000,000 FS CPPI HFRX OP 04/11/ ,203, USD (36,753) Swap on Aberdeen Global - Emerging Markets Equity 09/11/2026 (1,726,637) (1.96) USD (469,254) Swap on Aberdeen Global - World Equity 09/11/2026 (5,343,147) (6.06) EUR (2,695) Swap on Amundi - Amundi Dynarbitrage VaR 09/11/2026 (17,081,584) (19.37) USD (17,944) Swap on Amundi s - Absolute VaR 4 USD 09/11/2026 (14,970,419) (16.97) EUR (31,256) Swap on BlueBay High Yield Bond 09/11/2026 (8,478,190) (9.61) EUR (64,859) Swap on Generali Investments SICAV - Euro Corporate Bonds 09/11/2026 (10,865,050) (12.32) EUR (9,500,000) Swap on Italy Buoni Poliennali del Tesoro Principal Strip 11/01/2013 (9,177,665) (10.40) EUR (6,500,000) Swap on Buoni Poliennali Strip 04/05/2018 (4,767,588) (5.41) ed Swaps at positive fair value 88,203, ed Swaps at negative fair value (72,410,280) (82.10) Total ed Swaps at net value 15,793, Net Financial Derivative Instruments 15,793, Net Financial Assets at fair value through profit or loss 88,203, Debtors (30/06/11: Nil) 2, Bank overdraft (30/06/11: 0.01%) (1,679) 0.00 Creditors (30/06/11: (0.01%)) - - Net Assets Attributable to Redeemable Participating Shareholders 88,204,
71 Celsius s plc HFRX Opportunity Portfolio of Investments as at 30 June 2012 cont/d 30/06/ /06/ /06/2011 Net Assets Attributable to Redeemable Participating Shareholders 88,204,777 95,826,739 - Number of Redeemable Participating in Issue 1,000,000 1,000,000 - Net Asset Value per Redeemable Participating Share Classification Financial derivative instruments at fair value through profit or loss are traded over the counter (OTC). Analysis of Total Gross Assets (Unaudited) % of Total Gross Assets Transferable Securities 8.68 Collective Investment Schemes OTC Financial Derivative Instruments Current Assets 0.00 The Counterparty for the ed Swap is Bank plc. * The Collective Investment Schemes held by the Sub- meet the requirements of UCITS Regulations. ** The ed Swaps expose the Sub- to the performance of the Underlying (as defined in the Termsheet executed with the Approved Counterparty)
72 Celsius s plc Real Return USD Investment Manager s Report for the year ended 30 June 2012 (Unaudited) Investment Objective The investment objective of the Sub- is to provide the Shareholders with a return referencing three asset classes: (i) money markets; (ii) fixed income (including inflation-linked bonds); and (iii) commodities, via the Real Return USD Strategy (the "Strategy"). The Strategy is a dynamic allocation strategy implemented by the Investment Manager which allocates between the aforementioned asset classes. Each month, in accordance with the Strategy, the Investment Manager uses a combination of fundamental and technical analysis to determine the optimal allocation to the three asset classes described above and re-balances among them. Investment Strategy In order to achieve the investment objective, the Investment Manager, in its absolute discretion, may invest the net proceeds of any issue of (whether on the Launch Date or subsequently) in either; (i) a single FDI (in the form of a funded or unfunded Swap entered into with the Approved Counterparty) to gain exposure to the performance of the Index; or (ii) a combination of Transferable Securities, Money Market Instruments, FDIs (in the form of Swaps, Futures and Forwards which reference any Strategy Component and/or any individual component of the relevant Strategy Component), CIS and/or ETF to gain exposure to the performance of the Strategy Components. The exposure to each of the Strategy Components can also be achieved by gaining exposure to some of its individual components, by investing in a combination of Transferable Securities, Money Market Instruments, FDIs (in the form of Swaps, Futures and Forwards), CIS and/or ETF. Share Class Performance Summary % 1 Month 3 Months 6 Months 12 Months Since Inception Share Class Performance Class A (0.50) (0.97) (0.48) Share Class Performance Class AA* (0.46) (0.43) Share Class Performance Class B (0.52) (1.09) 0.83 (1.11) (0.65) Share Class Performance Class G* (0.47) Share Class Performance Class H* (0.50) (3.90) Share Class Performance Class K* (0.51) (5.19) Share Class Performance Class M* (0.55) (4.27) Share Class Performance Class Q* (0.47) Share Class Performance Class R (0.48) (0.69) (1.53) Share Class Performance Class U* (0.46) (1.78) Share Class Performance Class E* (0.38) (0.22) Year ended 30 June 2012 High Low Latest At Inception NAV Class A NAV Class B NAV (JPY) Class E* 10, , , ,000 NAV Class G* NAV Class H* NAV (EUR) Class K* NAV (CHF) Class M* NAV (JPY) Class Q* 10, , , , NAV Class R NAV (EUR) Class U* NAV Class AA* * These Share Classes launched during the year ended 30 June The Investment Manager s Report has been prepared up to the last valuation point whereas the financial statements have been prepared to the year ended 30 June This may result in differences between figures quoted in the Investment Manager s Report and the financial statements. 69
73 Celsius s plc Real Return USD Portfolio of Investments as at 30 June 2012 Financial assets at fair value through profit or loss: 89.99% (30/06/11: 84.83%) Money Market Instruments**: 91.34% (30/06/11: Nil) CCY Principal Amount Description Maturity Date Fair Value % of Sub- EUR 8,000, % Dutch, Treasury Bill of 31/08/ ,130, EUR 11,100, % Dutch, Treasury Bill of 31/07/ ,057, EUR 13,000, % France, Government of T-Bill 19/07/ ,461, EUR 14,000, % France, Government of T-Bill***** 02/08/ ,727, EUR 30,000, % France, Government of T-Bill 30/08/ ,985, USD 10,000, % United States, Government of T-Bill 30/08/2012 9,999, USD 33,000, % United States, Government of T-Bill 27/09/ ,993, USD 29,000, % United States, Government of T-Bill 23/08/ ,998, Total Money Market Instruments 168,352, Collective Investment Schemes*: 0.70% (30/06/11: 84.98%) No. of CCY Description Fair Value % of Sub- USD 12,000 i 7-10 Year Treasury Bond 1,295, Total Collective Investment Schemes 1,295, Derivative Financial Instruments: (2.05%) (30/06/11: (0.15%)) Unfunded Swap**: (0.90%) (30/06/11: Nil) Notional CCY Amount Description Maturity Date Fair Value % of Sub- USD (129,000,000) Swap on BCEY4T Index 03/07/2012 (1,657,409) (0.90) Unfunded Swap at negative fair value (1,657,409) (0.90) Open Forward Foreign Exchange Currency Contracts***: (1.15%) (30/06/11: (0.15%)) Maturity Date Counterparty Amount Bought Amount Sold Fair Value % of Sub- 02/07/2012 UBS AG London USD 28,773 EUR 23,028 (387) (0.00) 05/07/2012 Bank plc USD 36,265,750 EUR 28,981,578 (434,215) (0.22) 05/07/2012 UBS AG London USD 58,028,242 EUR 47,056,730 (1,560,658) (0.85) 25/07/2012 UBS AG London CHF 27,498 USD 28, /07/2012 UBS AG London EUR 66,569 USD 83,110 1, /07/2012 UBS AG London EUR 37,946 USD 47, /07/2012 UBS AG London EUR 15,207,213 USD 19,029, , /07/2012 UBS AG London EUR 23,028 USD 28, /07/2012 UBS AG London JPY 1,000,000,000 USD 12,575,590 (39,535) (0.02) 25/07/2012 UBS AG London JPY 10,357,917,488 USD 130,256,924 (409,502) (0.22) 25/07/2012 UBS AG London SGD 3,381,628 USD 2,631,448 41, /07/2012 UBS AG London SGD 1,719,042 USD 1,337,690 21, /07/2012 UBS AG London USD 540,666 EUR 425,428 1, /07/2012 UBS AG London USD 1,525,158 JPY 120,000,000 20, /07/2012 UBS AG London USD 618,852 SGD 796,080 (10,383) (0.01) 25/07/2012 UBS AG London USD 390 SGD 500 (5) (0.00) Unrealised gain on forward foreign exchange currency contracts 318, Unrealised loss on forward foreign exchange currency contracts (2,454,685) (1.32) Net unrealised loss on forward foreign exchange currency contracts (2,136,511) (1.15) Net Financial Derivative Instruments (3,793,920) (2.05) 70
74 Celsius s plc Real Return USD Portfolio of Investments as at 30 June 2012 cont/d Fair Value % of Sub- Net Financial Assets at fair value through profit or loss 165,853, Cash and cash equivalents (30/06/11: 0.00%) 2, Cash held at broker for open futures contracts (30/06/11: 3.42%) - - Deposits with credit institutions (30/06/11: 11.33%) 18,266, Debtors (30/06/11: 0.68%) 778, Creditors (30/06/11: (0.26%)) (588,820) (0.32) Net Assets Attributable to Redeemable Participating Shareholders 184,313, /06/ /06/2011 Net Assets Attributable to Redeemable Participating Shareholders Class A USD 7,420,516 13,289,492 Number of Redeemable Participating in Issue Class A 7,455,900 13,224,308 Net Asset Value per Redeemable Participating Share Class A USD Net Assets Attributable to Redeemable Participating Shareholders Class B SGD 1,872,386 1,710,220 Number of Redeemable Participating in Issue Class B 1,884,549 1,702,198 Net Asset Value per Redeemable Participating Share Class B SGD Net Assets Attributable to Redeemable Participating Shareholders Class E JPY**** 10,263,959,606 - Number of Redeemable Participating in Issue Class E 1,028,653 - Net Asset Value per Redeemable Participating Share Class E JPY 9, Net Assets Attributable to Redeemable Participating Shareholders Class G USD**** 9,272,593 - Number of Redeemable Participating in Issue Class G 92,200 - Net Asset Value per Redeemable Participating Share Class G USD Net Assets Attributable to Redeemable Participating Shareholders Class H USD**** 2,267,190 - Number of Redeemable Participating in Issue Class H 23,590 - Net Asset Value per Redeemable Participating Share Class H USD Net Assets Attributable to Redeemable Participating Shareholders Class K EUR**** 37,926 - Number of Redeemable Participating in Issue Class K Net Asset Value per Redeemable Participating Share Class K EUR Net Assets Attributable to Redeemable Participating Shareholders Class M CHF**** 27,476 - Number of Redeemable Participating in Issue Class M Net Asset Value per Redeemable Participating Share Class M CHF Net Assets Attributable to Redeemable Participating Shareholders Class Q JPY**** 1,000,384,712 - Number of Redeemable Participating in Issue Class Q 100,000 - Net Asset Value per Redeemable Participating Share Class Q JPY 10, Net Assets Attributable to Redeemable Participating Shareholders Class R USD 1,106,325 49,580 Number of Redeemable Participating in Issue Class R 11, Net Asset Value per Redeemable Participating Share Class R USD
75 Celsius s plc Real Return USD Portfolio of Investments as at 30 June 2012 cont/d 30/06/ /06/2011 Net Assets Attributable to Redeemable Participating Shareholders Class U EUR**** 14,885,777 - Number of Redeemable Participating in Issue Class U 151,541 - Net Asset Value per Redeemable Participating Share Class U EUR Net Assets Attributable to Redeemable Participating Shareholders Class AA SGD**** 3,382,912 - Number of Redeemable Participating in Issue Class AA 3,397,461 - Net Asset Value per Redeemable Participating Share Class AA SGD Classification Financial derivative instruments at fair value through profit or loss are traded over the counter (OTC). Analysis of Total Gross Assets (Unaudited) % of Total Gross Assets Money Market Instruments Collective Investment Schemes 0.68 OTC Financial Derivative Instruments 0.17 Current Assets The Counterparty for the Unfunded Swap is Bank plc. * The Collective Investment Schemes held by the Sub- meet the requirements of UCITS regulations. ** The Unfunded Swaps expose the Sub- to the performance of the Underlying (as defined in the Termsheet executed with the Approved Counterparty). *** Over the counter (OTC) Financial Derivative Instruments. **** These Share Classes launched during the year ended 30 June ***** Partly held as collateral (1,617,613) by the counterparties in respect of open over the counter financial derivative instruments held by the Sub- at year end. 72
76 Celsius s plc RMB Bond Investment Manager s Report for the year ended 30 June 2012 (Unaudited) Investment Objective The investment objective of the Sub- is to provide the Shareholders with a return linked to debt securities, deposits, money market instruments and/or currency transactions which in aggregate provide exposure to RMB fixed income. Investment Policy In order to achieve the investment objective, the Company on behalf of the Sub- intends to invest the net proceeds of any issue of (whether on the Launch Date or subsequently) with a focus on RMB denominated and RMB hedged debt securities, deposits and/or currency transactions. Debt securities may include RMB or non-rmb denominated bonds, notes, commercial papers and short-term bills, which may be issued by issuers including, but not limited to, governments, quasi-government organisations, international bodies, public or local authorities, state owned organisations, banks, financial institutions, private enterprises and corporations. Such Debt Securities may be issued and/or distributed in Hong Kong, Singapore and such other jurisdictions and may be denominated and/or settled in RMB or in any other currencies. As at the date of this Supplement, these Debt Securities will be issued outside the PRC. However to the extent that the applicable laws and regulations of the PRC permit, the Debt Securities may be established or incorporated in the PRC. The Debt Securities may be investment grade or non-investment grade, fixed or floating and may be rated or unrated. These will be selected by the Investment Manager, in its absolute and sole discretion, aided by the investment process as further described below. When the Sub- invests in bonds, notes, commercial papers and short term bills which are denominated in RMB, such securities, subject to the Investment Manager's sole discretion, may be fully, partially or not hedged into RMB through FDIs (including Futures, Forwards and/or Swaps, as further given under the "Use of Derivatives Contracts" section). Such non-rmb securities will be used in order to achieve the investment objective in circumstances where these non-rmb denominated instruments provide better liquidity, lower cost or better risk profile than other RMB denominated instruments. Share Class Performance Summary % 1 Month 3 Months 6 Months 12 Months Since Inception Share Class Performance Class A (1.09) (1.31) Share Class Performance Class AA 0.64 (0.34) Share Class Performance Class B 0.62 (0.41) Share Class Performance Class C (1.09) 0.34 (1.67) Year ended 30 June 2012 High Low Latest At Inception NAV (CNY) Class A NAV Class AA NAV Class B NAV Class C The Investment Manager s Report has been prepared up to the last valuation point whereas the financial statements have been prepared to the year ended 30 June This may result in differences between figures quoted in the Investment Manager s Report and the financial statements. 73
77 Celsius s plc RMB Bond Portfolio of Investments as at 30 June 2012 Financial assets at fair value through profit or loss: 93.27% (30/06/11: 60.43%) Transferable Securities: 93.27% (30/06/11: 60.43%) Corporate Bonds: 93.27% (30/06/11: 60.43%) CCY Principal Amount Description Maturity Date Fair Value % of Sub- CNY 9,000, % Air Liquide Finance SA 19/09/2016 8,902, CNY 5,000, % Asian Development Bank 21/10/2020 5,018, CNY 1,000, % Bank Of China Ltd/Hong Kong 25/09/ , CNY 7,000, % Baosteel Group Corp Ltd 01/12/2013 7,003, CNY 4,000, % Bank of Communications Co Ltd/Hong Kong 04/03/2013 3,948, CNY 6,000, % BP Capital Markets plc 15/09/2014 5,910, CNY 3,000, % BSH Bosch und Siemens Hausgerate GmbH 28/09/2016 3,015, CNY 1,000, % Caterpillar Financial Services Corp 16/03/2014 1,001, CNY 4,000, % Caterpillar Financial Services Corp 01/12/2012 3,995, CNY 2,000, % Caterpillar Financial Services Corp 12/07/2013 1,974, CNY 3,000, % China Construction Bank Corp/Hong Kong 15/02/2013 3,004, CNY 500, % China Construction Bank Asia Corp Ltd 29/05/ , CNY 7,100, % CNPC Golden Autumn Ltd 26/10/2013 7,096, CNY 1,000, % Emirates NBD PJSC 12/03/2015 1,017, CNY 5,000, % Export-Import Bank of Korea 02/11/2012 4,973, CNY 4,000, % Ford Motor Co 26/03/2015 4,030, CNY 6,000, % Global Logistic Properties Ltd 11/05/2016 5,841, CNY 4,000, % HKCG Finance Ltd 11/04/2016 3,741, CNY 5,000, % Industrial & Commercial Bank of China Macau Ltd 13/02/2013 4,940, CNY 2,000, % Industrial & Commercial Bank of China Asia Ltd 24/09/2012 1,996, CNY 2,000, % Korea Development Bank 21/06/2015 2,003, CNY 4,000, % Lanxess Finance BV 16/02/2015 4,035, CNY 1,500, % Lotte Shopping Business Management Hong Kong Ltd 09/02/2015 1,515, CNY 4,000, % McDonald's Corp 16/09/2013 4,045, CNY 8,000, % Rainbow Days Ltd 30/06/2014 7,770, CNY 2,000, % Raiffeisen Bank International AG 23/03/2014 1,980, CNY 3,000, % China Development Bank Corp 16/01/2015 2,996, CNY 1,000, % Standard Chartered Bank Hong Kong 02/11/ , CNY 2,000, % Standard Chartered Bank Hong Kong Ltd 11/06/2013 1,988, CNY 6,500, % Tesco plc 01/09/2014 6,451, CNY 9,000, % Volkswagen International Finance 23/05/2016 8,860, CNY 4,000, % VTB Bank OJSC Via VTB Capital SA 23/12/2013 3,937, Total Corporate Bonds 125,489, Total Transferable Securities 125,489, Financial Derivative Instruments: Nil (30/06/11: 0.00%) Open Forward Foreign Exchange Currency Contracts*: Nil (30/06/11: 0.00%) Total Financial Assets at fair value through profit or loss 125,489, Cash and cash equivalents (30/06/11: 74.41%) 8,387, Debtors (30/06/11: 0.86%) 941, Creditors (30/06/11: (35.70%)) (272,587) (0.20) Net Assets Attributable to Redeemable Participating Shareholders 134,545,
78 Celsius s plc RMB Bond Portfolio of Investments as at 30 June 2012 cont/d 30/06/ /06/2011 Net Assets Attributable to Redeemable Participating Shareholders Class A CNY 41,940,014 33,618,734 Number of Redeemable Participating in Issue Class A 42,493,377 33,692,487 Net Asset Value per Redeemable Participating Share Class A CNY Net Assets Attributable to Redeemable Participating Shareholders Class B USD 12,397,293 2,862,295 Number of Redeemable Participating in Issue Class B 12,331,353 2,864,358 Net Asset Value per Redeemable Participating Share Class B USD Net Assets Attributable to Redeemable Participating Shareholders Class C SGD 1,649,063 1,494,803 Number of Redeemable Participating in Issue Class C 1,597,097 1,503,007 Net Asset Value per Redeemable Participating Share Class C SGD Net Assets Attributable to Redeemable Participating Shareholders Class AA USD 867, ,987 Number of Redeemable Participating in Issue Class AA 8,589 8,589 Net Asset Value per Redeemable Participating Share Class AA USD Classification Financial derivative instruments at fair value through profit or loss are traded over the counter (OTC). Analysis of Total Gross Assets % of Total Gross Assets Transferable Securities Current Assets 6.92 * Over the counter (OTC) Financial Derivative Instruments

79

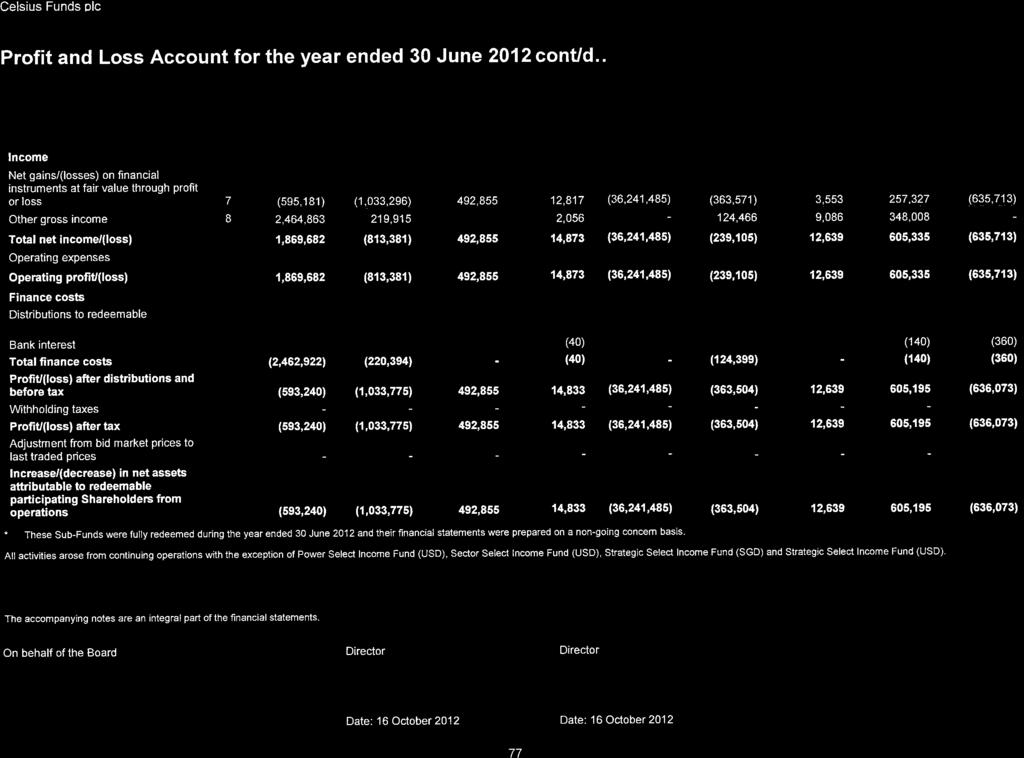
80
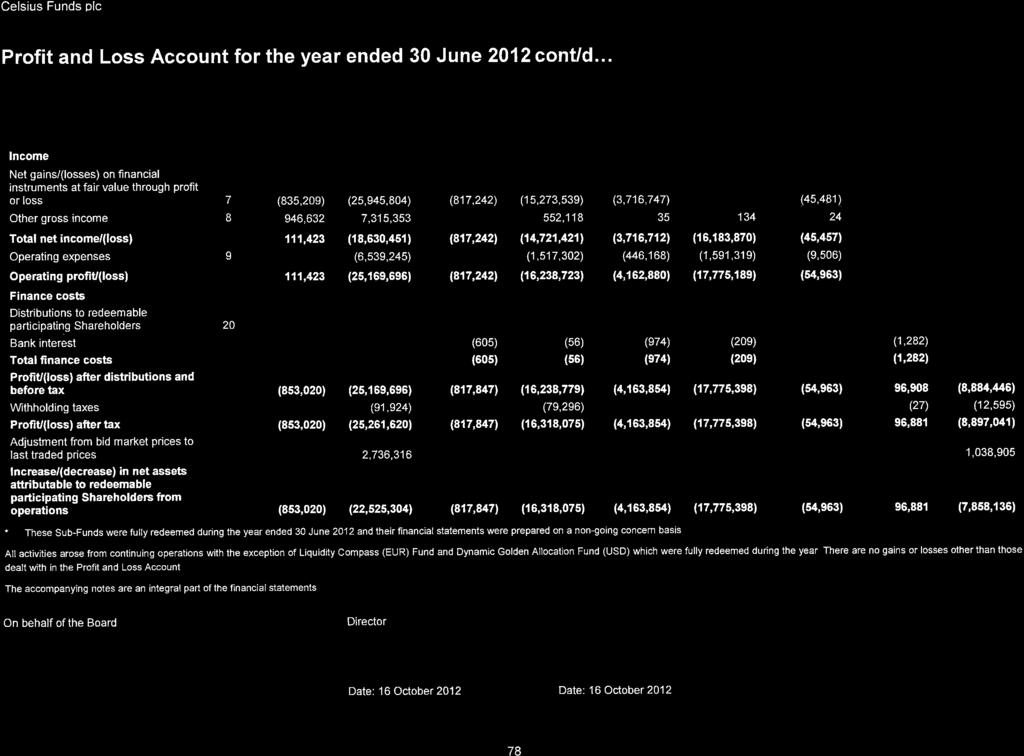
81


82
83 Celsius s plc Profit and Loss Account for the year ended 30 June 2011 Income Note Global Commodities Dynamic Asian Real Estate Income Fortune 8 Capital Guaranteed * Asian Real Estate Income (GBP) Global Commodities Delta Equity Select Dynamic Allocation Index Revolution Dynamic Money Builder Net gains/(losses) on financial instruments at fair value through profit or loss 7 301,481 (5,798,622) 1,287,975 (285,755) 41,045,012 (9,809,698) (747,361) 1,750,010 91,232 Other gross income 8 18,613 10,667, ,078 4,069,841-9,936, Total net income/(loss) 320,094 4,868,758 1,723,053 3,784,086 41,045, ,195 (747,291) 1,750,010 91,331 Operating expenses 9 (17,850) - (392,058) (26,524) (1,781,497) (75,665) Operating profit/(loss) 302,244 4,868,758 1,330,995 3,757,562 39,263, ,195 (747,291) 1,750,010 15,666 Finance costs Distributions to redeemable participating Shareholders 20 - (10,663,382) - (4,042,395) - (9,935,660) Bank interest - (327) - - (686) (414) - (24) (480) Total finance costs - (10,663,709) - (4,042,395) (686) (9,936,074) - (24) (480) Profit/(loss) after distributions and before tax 302,244 (5,794,951) 1,330,995 (284,833) 39,262,829 (9,808,879) (747,291) 1,749,986 15,186 Withholding taxes Increase/(decrease) in net assets attributable to redeemable participating Shareholders from operations 302,244 (5,794,951) 1,330,995 (284,833) 39,262,829 (9,808,879) (747,291) 1,749,986 15,186 * This Sub- matured during the year ended 30 June 2011 and its financial statements were prepared on a non-going concern basis. All activities arose from continuing operations with the exception of the Fortune 8 Capital Guaranteed which matured during the year. There are no gains or losses other than those dealt with in the Profit and Loss Account. The accompanying notes are an integral part of the financial statements. 80
84 Celsius s plc Profit and Loss Account for the year ended 30 June 2011 cont/d Income Note Sector Rotation Entertainment Select Income Power Select Bonus Select Bonus Select China Accelerated Growth (HKD) HK$ Sector Select Strategic Select Income Strategic Select Income Net gains/(losses) on financial instruments at fair value through profit or loss 7 2,682,788 (5,890,284) 370,576 5,380, ,168 18,031,919 (371,896) 62,513 2,185,860 Other gross income ,883, , , Total net income/(loss) 2,682,809 (2,007,091) 928,785 5,380, ,168 18,031,919 (157,919) 62,513 2,185,860 Operating expenses Operating profit/(loss) 2,682,809 (2,007,091) 928,785 5,380, ,168 18,031,919 (157,919) 62,513 2,185,860 Finance costs Distributions to redeemable participating Shareholders 20 - (3,880,766) (558,207) (213,882) - - Bank interest - - (292) (1,681) - (9,793) - (50) (155) Total finance costs - (3,880,766) (558,499) (1,681) - (9,793) (213,882) (50) (155) Profit/(loss) after distributions and before tax 2,682,809 (5,887,857) 370,286 5,378, ,168 18,022,126 (371,801) 62,463 2,185,705 Withholding taxes Increase/(decrease) in net assets attributable to redeemable participating Shareholders from operations 2,682,809 (5,887,857) 370,286 5,378, ,168 18,022,126 (371,801) 62,463 2,185,705 All activities arose from continuing operations. There are no gains or losses other than those dealt with in the Profit and Loss Account. The accompanying notes are an integral part of the financial statements. 81
85 Celsius s plc Profit and Loss Account for the year ended 30 June 2011 cont/d Income Note China Accelerated Growth Life Select Global Asset Allocation China Accelerated Growth Global Trend USD Index * New Zealand Income * NZ$ Investment Legends GEMS Global Agriculture Delta Net gains/(losses) on financial instruments at fair value through profit or loss 7 263,850 (1,377,027) 18,995,867 (311,009) 104,939 64,591 32,160,959 2,323,678 40,969,488 Other gross income 8-1,240,069 36, , ,628 19,446 - Total net income/(loss) 263,850 (136,958) 19,031,955 (310,989) 104, ,791 32,774,587 2,343,124 40,969,488 Operating expenses (8,108,637) - (6,112) - (2,207,873) (306,179) (1,851,451) Operating profit/(loss) 263,850 (136,958) 10,923,318 (310,989) 98, ,791 30,566,714 2,036,945 39,118,037 Finance costs Distributions to redeemable participating Shareholders 20 - (1,250,064) (78,233) Bank interest (775) - (61) (57) (2,022) Total finance costs - (1,250,064) - - (775) (78,233) (61) (57) (2,022) Profit/(loss) after distributions and before tax 263,850 (1,387,022) 10,923,318 (310,989) 98,103 65,558 30,566,653 2,036,888 39,116,015 Withholding taxes (90,900) - - Increase/(decrease) in net assets attributable to redeemable participating Shareholders from operations 263,850 (1,387,022) 10,923,318 (310,989) 98,103 65,558 30,475,753 2,036,888 39,116,015 * These Sub-s were fully redeemed during the year ended 30 June 2011 and their financial statements were prepared on a non-going concern basis. All activities arose from continuing operations with the exception of the Global Trend USD Index and the New Zealand which were fully redeemed during the year. There are no gains or losses other than those dealt with in the Profit and Loss Account. The accompanying notes are an integral part of the financial statements. 82
86 Celsius s plc Profit and Loss Account for the year ended 30 June 2011 cont/d Income Note Liquidity Compass (EUR) Mexico Equity Protect 80 (MXN)* MXN Dynamic Golden Allocation Fondo Radar** HFRX Opportunity ** Real Return USD ** RMB Bond ** Net gains/(losses) on financial instruments at fair value through profit or loss 7 59, ,554 13,049,915 (6,735,238) (4,174,243) 96,016 (102,340) 99,966,478 Other gross income 8-111, ,531 3,567, ,404 36,172 24,456,894 Total net income/(loss) 59,919 1,104,333 13,361,446 (3,168,005) (4,173,261) 102,420 (66,168) 124,423,372 Operating expenses 9 (26,013) (110,017) (881,628) (1,460,103) - (38,223) (63,989) (15,053,511) Operating profit/(loss) 33, ,316 12,479,818 (4,628,108) (4,173,261) 64,197 (130,157) 109,369,861 Finance costs Distributions to redeemable participating Shareholders (19,862,709) Bank interest - - (7,403) - - (342) - (11,163) Total finance costs - - (7,403) - - (342) - (19,873,872) Profit/(loss) after distributions and before tax 33, ,316 12,472,415 (4,628,108) (4,173,261) 63,855 (130,157) 89,495,989 Withholding taxes - - (64,806) - - (1,913) (4,732) (115,052) Increase/(decrease) in net assets attributable to redeemable participating Shareholders from operations 33, ,316 12,407,609 (4,628,108) (4,173,261) 61,942 (134,889) 89,380,937 * This Sub- was fully redeemed during the year ended 30 June 2011 and its financial statements were prepared on a non-going concern basis. ** These Sub-s launched during the year ended 30 June All activities arose from continuing operations with the exception of the Mexico Equity Protect 80 (MXN) which was fully redeemed during the year. There are no gains or losses other than those dealt with in the Profit and Loss Account. The accompanying notes are an integral part of the financial statements. Total 83
87 Celsius s plc Statement of Changes in Net Assets Attributable to Redeemable Participating Shareholders for the year ended 30 June 2012 Note Global Commodities Dynamic Asian Real Estate Income Asian Real Estate (GBP) Global Commodities Delta Equity Select Dynamic Allocation Index Revolution Dynamic Money Builder Sector Rotation Net assets attributable to redeemable participating Shareholders at the start of the year 7,066,991 99,793,345 27,440, ,717,590 87,336,239 26,017,353 11,008,137 4,407,267 18,788,490 Net increase/(decrease) in net assets attributable to redeemable participating Shareholders from operations 253,326 (8,356,394) (4,364,876) (23,305,852) (13,341,205) 2,823,426 (2,392,260) (183,640) (4,599,695) Share transactions Add amounts received on sale of redeemable participating 17 1,502,083 4,176,322 5,729,283 26,252,127 4,062, Less amounts paid on redemption of redeemable participating 17 (2,949,175) (23,389,640) (2,875,013) (51,895,610) (14,413,829) - (561,059) (1,050,330) - Net increase/(decrease) in net assets from Share transactions (1,447,092) (19,213,318) 2,854,270 (25,643,483) (10,351,507) - (561,059) (1,050,030) - Foreign currency translation adjustment Net assets attributable to redeemable participating Shareholders at the end of the year 5,873,225 72,223,633 25,930, ,768,255 63,643,527 28,840,779 8,054,818 3,173,597 14,188,795 The accompanying notes are an integral part of the financial statements. 84
88 Celsius s plc Statement of Changes in Net Assets Attributable to Redeemable Participating Shareholders for the year ended 30 June 2012 cont/d Note Entertainment Select Income Power Select * Bonus Select Bonus Select China Accelerated Growth (HKD) HK$ Sector Select * Strategic Select Income Strategic Select * China Accelerated Growth Net assets attributable to redeemable participating Shareholders at the start of the year 33,830,253 6,282, ,485,658 4,749, ,360,973 1,856,518 4,023,184 99,238,639 3,031,966 Net increase/(decrease) in net assets attributable to redeemable participating Shareholders from operations (593,240) (1,033,775) 492,855 14,833 (36,241,485) (363,504) 12, ,195 (636,073) Share transactions Add amounts received on sale of redeemable participating 17 1,139,809 55,827 1,235-2,724, Less amounts paid on redemption of redeemable participating 17 (7,212,893) (5,304,717) (47,040,954) (1,469,821) (31,279,382) (1,493,014) (3,986,989) (99,843,834) (879,201) Net increase/(decrease) in net assets from Share transactions (6,073,084) (5,248,890) (47,039,719) (1,469,821) (28,554,842) (1,493,014) (3,986,989) (99,843,834) (879,201) Foreign currency translation adjustment Net assets attributable to redeemable participating Shareholders at the end of the year 27,163,929-75,938,794 3,294,654 91,564,646-48,834-1,516,692 * These Sub-s were fully redeemed during the year ended 30 June 2012 and their financial statements were prepared on a non-going concern basis. The accompanying notes are an integral part of the financial statements. 85
89 Celsius s plc Statement of Changes in Net Assets Attributable to Redeemable Participating Shareholders for the year ended 30 June 2012 cont/d Note Life Select Global Asset Allocation China Accelerated Growth Investment Legends GEMS Global Agriculture Delta Liquidity Compass (EUR) * Dynamic Golden Allocation * Net assets attributable to redeemable participating Shareholders at the start of the year 6,863, ,791,783 4,514, ,487,133 40,279, ,934, , , ,969,675 Net increase/(decrease) in net assets attributable to redeemable participating Shareholders from operations (853,020) (22,525,304) (817,847) (16,318,075) (4,163,854) (17,775,398) (54,963) 96,881 (7,858,136) Share transactions Add amounts received on sale of redeemable participating ,927-1,440 1,162,959 23,120,668 14,711,643 6, Less amounts paid on redemption of redeemable participating 17 (1,048,999) - (996,148) (30,278,302) (40,670,458) (55,172,028) (924,967) (1,054,364) (2,228,646) Net increase/(decrease) in net assets from Share transactions (947,072) - (994,708) (29,115,343) (17,549,790) (40,460,385) (918,102) (1,054,364) (2,228,646) Foreign currency translation adjustment Net assets attributable to redeemable participating Shareholders at the end of the year 5,063, ,266,479 2,701,926 71,053,715 18,565, ,698, ,882,893 * These Sub-s were fully redeemed during the year ended 30 June 2012 and their financial statements were prepared on a non-going concern basis. The accompanying notes are an integral part of the financial statements. Fondo Radar 86
90 Celsius s plc Statement of Changes in Net Assets Attributable to Redeemable Participating Shareholders for the year ended 30 June 2012 cont/d Note HFRX Opportunity Real Return USD RMB Bond Net assets attributable to redeemable participating Shareholders at the start of the year 95,826,739 14,731,250 65,560,416 1,518,009,288 Net increase/(decrease) in net assets attributable to redeemable participating Shareholders from operations (7,621,962) 2,655,818 (447,723) (109,926,117) Share transactions Add amounts received on sale of redeemable participating ,015,351 98,201, ,582,059 Less amounts paid on redemption of redeemable participating 17 - (36,088,997) (28,768,847) (301,708,403) Net increase/(decrease) in net assets from Share transactions - 166,926,354 69,432,380 (76,126,344) Foreign currency translation adjustment ,761,219 Net assets attributable to redeemable participating Shareholders at the end of the year 88,204, ,313, ,545,073 1,411,718,046 The accompanying notes are an integral part of the financial statements. Total 87
91 Celsius s plc Statement of Changes in Net Assets Attributable to Redeemable Participating Shareholders for the year ended 30 June 2011 Note Global Commodities Dynamic Asian Real Estate Income Fortune 8 Capital Guaranteed * Asian Real Estate (GBP) Global Commodities Delta Equity Select Dynamic Allocation Index Revolution Dynamic Money Builder Net assets attributable to redeemable participating Shareholders at the start of the year 8,414, ,135,109 67,030,488 23,557, ,198, ,557,051 26,764,644 11,672,093 6,218,884 Net increase/(decrease) in net assets attributable to redeemable participating Shareholders from operations 302,244 (5,794,951) 1,330,995 (284,833) 39,262,829 (9,808,879) (747,291) 1,749,986 15,186 Share transactions Add amounts received on sale of redeemable participating 17 1,550,943 5,620,643-6,563,394 63,974,246 5,690, ,400 Less amounts paid on redemption of redeemable participating 17 (3,200,792) (37,167,456) (68,361,483) (2,395,070) (72,717,511) (26,101,960) - (2,413,942) (1,828,203) Net increase/(decrease) in net assets from Share transactions (1,649,849) (31,546,813) (68,361,483) 4,168,324 (8,743,265) (20,411,933) - (2,413,942) (1,826,803) Foreign currency translation adjustment Net assets attributable to redeemable participating Shareholders at the end of the year 7,066,991 99,793,345-27,440, ,717,590 87,336,239 26,017,353 11,008,137 4,407,267 * This Sub- matured during the year ended 30 June 2011 and its financial statements were prepared on a non-going concern basis. The accompanying notes are an integral part of the financial statements. 88
92 Celsius s plc Statement of Changes in Net Assets Attributable to Redeemable Participating Shareholders for the year ended 30 June 2011 cont/d Note Sector Rotation Entertainment Select Income Power Select Bonus Select Bonus Select China Accelerated Growth (HKD) HK$ Sector Select Strategic Select Strategic Select Income Net assets attributable to redeemable participating Shareholders at the start of the year 16,105,681 52,518,097 9,188, ,125,060 8,184, ,639,945 2,388,761 5,709, ,397,629 Net increase/(decrease) in net assets attributable to redeemable participating Shareholders from operations 2,682,809 (5,887,857) 370,286 5,378, ,168 18,022,126 (371,801) 62,463 2,185,705 Share transactions Add amounts received on sale of redeemable participating 17-1,810, ,347 18,769 20,242 14,543, Less amounts paid on redemption of redeemable participating 17 - (14,610,036) (3,675,067) (60,036,794) (3,555,398) (109,845,096) (160,442) (1,748,903) (20,344,695) Net increase/(decrease) in net assets from Share transactions - (12,799,987) (3,275,720) (60,018,025) (3,535,156) (95,301,098) (160,442) (1,748,903) (20,344,695) Foreign currency translation adjustment Net assets attributable to redeemable participating Shareholders at the end of the year 18,788,490 33,830,253 6,282, ,485,658 4,749, ,360,973 1,856,518 4,023,184 99,238,639 The accompanying notes are an integral part of the financial statements. 89
93 Celsius s plc Statement of Changes in Net Assets Attributable to Redeemable Participating Shareholders for the year ended 30 June 2011 cont/d Note China Accelerated Growth Life Select Global Asset Allocation China Accelerated Growth Global Trend USD Index * New Zealand Income * NZ$ Investment Legends GEMS Global Agriculture Delta Net assets attributable to redeemable participating Shareholders at the start of the year 3,912,377 10,162, ,868,465 6,874,543 4,069,472 4,756, ,933,139 8,573, ,761,424 Net increase/(decrease) in net assets attributable to redeemable participating Shareholders from operations 263,850 (1,387,022) 10,923,318 (310,989) 98,103 65,558 30,475,753 2,036,888 39,116,015 Share transactions Add amounts received on sale of redeemable participating , ,329-6,432 47,215-5,642,513 33,603, ,281,537 Less amounts paid on redemption of redeemable participating 17 (1,266,761) (2,023,603) - (2,055,505) (4,214,790) (4,821,888) (49,564,272) (3,934,807) (100,224,579) Net increase/(decrease) in net assets from Share transactions (1,144,261) (1,912,274) - (2,049,073) (4,167,575) (4,821,888) (43,921,759) 29,668,980 22,056,958 Foreign currency translation adjustment Net assets attributable to redeemable participating Shareholders at the end of the year 3,031,966 6,863, ,791,783 4,514, ,487,133 40,279, ,934,397 * These Sub-s were fully redeemed during the year ended 30 June 2011 and their financial statements were prepared on a non-going concern basis. The accompanying notes are an integral part of the financial statements. 90
94 Celsius s plc Statement of Changes in Net Assets Attributable to Redeemable Participating Shareholders for the year ended 30 June 2011 cont/d Note Liquidity Compass (EUR) Mexico Equity Protect 80 (MXN)* MXN Dynamic Golden Allocation Fondo Radar** HFRX Opportunity ** Real Return USD ** RMB Bond ** Net assets attributable to redeemable participating Shareholders at the start of the year 1,725,298 20,943,762 86,952, ,428,899,258 Net increase/(decrease) in net assets attributable to redeemable participating Shareholders from operations 33, ,316 12,407,609 (4,628,108) (4,173,261) 61,942 (134,889) 89,380,937 Share transactions Add amounts received on sale of redeemable participating ,586, ,732, ,000,000 14,897,983 67,583, ,318,959 Less amounts paid on redemption of redeemable participating 17 (786,139) (21,938,078) (119,989,352) (2,134,607) - (228,675) (1,888,452) (418,570,210) Net increase/(decrease) in net assets from Share transactions (786,139) (21,938,078) (98,402,632) 186,597, ,000,000 14,669,308 65,695,305 85,748,749 Foreign currency translation adjustment (86,019,656) Net assets attributable to redeemable participating Shareholders at the end of the year 973, , ,969,675 95,826,739 14,731,250 65,560,416 1,518,009,288 * This Sub- was fully redeemed during the year ended 30 June 2011 and its financial statements were prepared on a non-going concern basis. ** These Sub-s launched during the year ended 30 June The accompanying notes are an integral part of the financial statements. Total 91


95


96

97


98
Wealth & Investment Management. Celsius Funds PLC. An umbrella fund with segregated liability between Sub-Funds
 Wealth & Investment Management Celsius s PLC An umbrella fund with segregated liability between Sub-s Unaudited Interim Financial Statements for the six months ended 31 December 2013 Celsius s plc Table
CELSIUS GLOBAL FUNDS SICAV PLC
 CS1000899 v05 Celsius Fund Covers.qxp 11/02/2010 15:58 Page 7 CELSIUS GLOBAL FUNDS SICAV PLC AN UMBRELLA FUND WITH SEGREGATED LIABILITY BETWEEN SUB-FUNDS Unaudited Interim Financial Statements for the
Celsius Global Funds SICAV PLC
 s and Advisory Celsius Global s SICAV PLC An umbrella fund with segregated liability between Sub-s Annual Report and Audited Financial Statements for the year ended 30 June 2013 Table of Contents General
CitiFirst Investments plc (An umbrella fund with segregated liability between sub-funds) Interim Report and Condensed Unaudited Financial Statements
 Interim Report and Condensed Unaudited Financial Statements") (An umbrella fund with segregated liability between sub-funds) Interim Report and Condensed Unaudited Financial Statements Table of Contents Page Company information 3 Manager s report 5 Balance sheet
(An umbrella fund with segregated liability between sub-funds) Interim Report and Condensed Unaudited Financial Statements Table of Contents Page Company information 3 Manager s report 5 Balance sheet
Dimensional Funds PLC
 Dimensional Funds PLC Annual Report and Audited Financial Statements 30 November 2009 Authorised and Regulated by the Financial Services Authority DIMENSIONAL FUNDS PLC Table of Contents Page General Information...2
Annual Report and Audited Financial Statements for the Year Ended 31 December 2011
 Europe/Americas Select Private Equity (Ireland) II, PLC (An Irish Investment Company) Annual Report and Audited Financial Statements for the Year Ended 31 December 2011 Europe/Americas Select Private Equity
Man AHL Diversified Futures Ltd
 Man AHL Diversified Futures (the "Company") is a futures and options fund and will invest, without limitation, into sectors including stocks, bonds, currencies, interest rates, energies, metals, credit
Celsius Global Funds SICAV PLC
 Wealth & Investment Management Celsius Global Funds SICAV PLC An umbrella fund with segregated liability between s Annual Report and Audited Financial Statements for the year ended 30 June 2015 Table of
SEI GLOBAL ASSETS FUND PLC. Annual Report and Audited Financial Statements for the financial year ended 30 June 2017
 SEI GLOBAL ASSETS FUND PLC Annual Report and Audited Financial Statements for the financial year ended 30 June 2017 CONTENTS PAGE Directory 3 General Information 4 Directors Report 6 Report of the Depositary
TT ASIA EX JAPAN EQUITY FUND. Supplement to the Prospectus for TT INTERNATIONAL FUNDS PLC
 TT ASIA EX JAPAN EQUITY FUND Supplement to the Prospectus for TT INTERNATIONAL FUNDS PLC This Supplement contains specific information in relation to TT Asia ex Japan Equity Fund (the Fund ), a sub-fund
Polen Capital Investment Funds plc
 (an open-ended umbrella investment company with variable capital and segregated liability between Funds incorporated with limited liability in Ireland under the Companies Act 2014 as amended with registration
Source Commodity Markets Plc
 Source Commodity Markets Plc Directors report and audited fi nancial statements For the year ended Contents Page Directors and other information 1 Directors report 2-5 Statement of Directors responsibilities
BROWN ADVISORY FUNDS PLC
 (A company incorporated with limited liability as an open-ended investment company with variable capital under the laws of Ireland) US Equity Value Fund US Smaller Companies Fund American Fund US Equity
PRODUCT KEY FACTS HENDERSON HORIZON FUND PAN EUROPEAN PROPERTY EQUITIES FUND
 Henderson Global Investors Limited November 2015 PRODUCT KEY FACTS HENDERSON HORIZON PAN EUROPEAN PROPERTY EQUITIES This statement provides you with key information about the Pan European Property Equities
Odey Investments plc. (an umbrella fund with segregated liability between sub-funds) Annual Report and Audited Financial Statements
 Annual Report and Audited Financial Statements") Investments plc (an umbrella fund with segregated liability between sub-funds) Annual Report and Audited Financial Statements For the year ended 31 December 2015 Investments plc Table of contents Page
Investments plc (an umbrella fund with segregated liability between sub-funds) Annual Report and Audited Financial Statements For the year ended 31 December 2015 Investments plc Table of contents Page
Absolute Insight Funds p.l.c. Supplement dated 11 July 2017 to the Prospectus for Absolute Insight Equity Market Neutral Fund
 Absolute Insight Funds p.l.c. Supplement dated 11 July 2017 to the Prospectus for Absolute Insight Equity Market Neutral Fund This Supplement contains specific information in relation to the Absolute Insight
NOMURA FUNDS IRELAND PLC. Annual Report and Audited Financial Statements for the financial year ended 31st December, 2016
 Annual Report and Audited Financial Statements for the financial year ended Company Registration No. 418598 TABLE OF CONTENTS MANAGEMENT AND ADMINISTRATION 3 GENERAL INFORMATION 4 DIRECTORS REPORT 17 REPORT
CITI GLOBAL INTEREST RATES STRATEGY 10 INDEX FUND
 CITI GLOBAL INTEREST RATES STRATEGY 10 INDEX FUND SIMPLIFIED PROSPECTUS Dated 24 February 2012 This Simplified Prospectus contains key information in relation to the Citi Global Interest Rates Strategy
Coram Global Balanced Fund (the Fund) a sub-fund of. Coram Investment Funds plc (an umbrella fund with segregated liability between sub-funds)
 a sub-fund of. Coram Investment Funds plc (an umbrella fund with segregated liability between sub-funds)") Coram Global Balanced Fund (the Fund) a sub-fund of Coram Investment Funds plc (an umbrella fund with segregated liability between sub-funds) Supplement to the Prospectus dated 21 September 2016 This Supplement
Coram Global Balanced Fund (the Fund) a sub-fund of Coram Investment Funds plc (an umbrella fund with segregated liability between sub-funds) Supplement to the Prospectus dated 21 September 2016 This Supplement
WISDOMTREE EUROZONE QUALITY DIVIDEND GROWTH UCITS ETF
 This Supplement forms part of and should be read in conjunction with the general description of the Company contained in the current Prospectus dated 2 February 2018 together with the most recent annual
M&G Investment Funds (1) Product Key Facts. Issued by M&G Securities Limited 31 December 2014
 Product Key Facts. Issued by M&G Securities Limited 31 December 2014") M&G Investment Funds (1) Product Key Facts Issued by M&G Securities Limited 31 December 2014 product KEY FACTS table of Contents Contents Page 1. M&G Investment Funds (1) M&G American Fund 1 2. M&G Investment
M&G Investment Funds (1) Product Key Facts Issued by M&G Securities Limited 31 December 2014 product KEY FACTS table of Contents Contents Page 1. M&G Investment Funds (1) M&G American Fund 1 2. M&G Investment
PRODUCT KEY FACTS M&G Investment Funds (1) M&G North American Dividend Fund
 M&G North American Dividend Fund") PRODUCT KEY FACTS M&G Investment Funds (1) M&G North American Dividend Fund Issuer: M&G Securities Limited 26 February 2016 This statement provides you with key information about M&G North American Dividend
PRODUCT KEY FACTS M&G Investment Funds (1) M&G North American Dividend Fund Issuer: M&G Securities Limited 26 February 2016 This statement provides you with key information about M&G North American Dividend
NOMURA FUNDS IRELAND PLC. Interim Report and Unaudited Financial Statements for the financial half year ended 30th June, 2016
 Interim Report and Unaudited Financial Statements for the financial half year ended Company Registration No. 418598 TABLE OF CONTENTS MANAGEMENT AND ADMINISTRATION 3 GENERAL INFORMATION 4 INVESTMENT MANAGER
NEUBERGER BERMAN INVESTMENT FUNDS PLC
 The Directors of the Company whose names appear in the Management and Administration section of the Prospectus accept responsibility for the information contained in this document. To the best of the knowledge
SUPPLEMENT 10. Indexed Fundamental Global Equity Fund
 SUPPLEMENT 10 Indexed Fundamental Global Equity Fund This Supplement contains information relating specifically to the Indexed Fundamental Global Equity Fund (the "Fund"), a sub fund of Beresford Funds
Helaba International Finance plc Directors Report and Financial Statements Year ended 31 December 2010
 Helaba International Finance plc Directors Report and Financial Statements Year ended 31 December 2010 Helaba International Finance plc Directors Report and Financial Statements Year ended 31 December
BMO UCITS ETF ICAV An Irish collective asset-management vehicle constituted as an umbrella fund with segregated liability between Sub-Funds
 An Irish collective asset-management vehicle constituted as an umbrella fund with segregated liability between Sub-s registered in Ireland on 8 June 2015 under the Irish Collective Asset-management Vehicles
GILTS UNIT TRUST FOR THE YEAR ENDING 31 MARCH 2015
 GILTS UNIT TRUST FOR THE YEAR ENDING 31 MARCH 2015 Manager St. James's Place Unit Trust Group Limited PO Box 9034, Chelmsford, CM99 2XA United Kingdom Freephone: 0800 027 1031 (Authorised and regulated
Optimal Multi Asset Balanced Fund (the Fund) a sub-fund of
 a sub-fund of") Optimal Multi Asset Balanced Fund (the Fund) a sub-fund of Optimal Global Investment Funds plc (an umbrella fund with segregated liability between sub-funds) Supplement to the Prospectus dated 2 January
Optimal Multi Asset Balanced Fund (the Fund) a sub-fund of Optimal Global Investment Funds plc (an umbrella fund with segregated liability between sub-funds) Supplement to the Prospectus dated 2 January
SUPPLEMENT NO November 2016
 The directors of IVI Umbrella Fund plc (the Directors ) listed in the Prospectus dated 1 November 2016 (the Prospectus ) in the Management and Administration section, accept responsibility for the information
Schroder European Equity Yield Fund. Annual Report & Financial Statements
 Schroder European Equity Yield Fund Annual Report & Financial Statements December 2009 SCHRODER EUROPEAN EQUITY YIELD FUND (a sub-fund of Schroder International Opportunities Portfolio) Constituted under
PRODUCT KEY FACTS. Quick facts Manager: Trustee: Custodian: Dealing frequency: Base currency: Ongoing charges over a year:
 PRODUCT KEY FACTS Issuer: Haitong International Asset Management (HK) Limited 1 Haitong RMB Investment Fund Series - Haitong Global RMB Fixed Income Fund May 2018 This statement provides you with key information
CSOP LEVERAGED AND INVERSE SERIES (An umbrella unit trust established in Hong Kong)
") CSOP LEVERAGED AND INVERSE SERIES (An umbrella unit trust established in Hong Kong) CSOP HANG SENG INDEX DAILY (-1X) INVERSE PRODUCT (Stock Code: 07300) (A sub-fund of CSOP Leveraged and Inverse Series)
CSOP LEVERAGED AND INVERSE SERIES (An umbrella unit trust established in Hong Kong) CSOP HANG SENG INDEX DAILY (-1X) INVERSE PRODUCT (Stock Code: 07300) (A sub-fund of CSOP Leveraged and Inverse Series)
THE NT EURO GOVERNMENT INFLATION LINKED INDEX FUND SUPPLEMENT TO THE PROSPECTUS DATED 10 FEBRUARY 2011 FOR NORTHERN TRUST INVESTMENT FUNDS PLC
 THE NT EURO GOVERNMENT INFLATION LINKED INDEX FUND SUPPLEMENT TO THE PROSPECTUS DATED 10 FEBRUARY 2011 FOR NORTHERN TRUST INVESTMENT FUNDS PLC 1 2 Supplement to the Prospectus Northern Trust Investment
WISDOMTREE EUROPE SMALLCAP DIVIDEND UCITS ETF
 This Supplement forms part of and should be read in conjunction with the general description of the Company contained in the current Prospectus dated 2 February 2018 together with the most recent annual
LAZARD EMERGING MARKETS TOTAL RETURN DEBT FUND
 If you are in any doubt about the contents of this Supplement, you should consult your stockbroker, bank manager, solicitor, accountant or other independent financial adviser. The Directors of Lazard Global
CSOP ETF SERIES (An umbrella unit trust established in Hong Kong) Reports and Financial Statements FOR THE YEAR ENDED 31 DECEMBER 2017
 Reports and Financial Statements FOR THE YEAR ENDED 31 DECEMBER 2017") CSOP ETF SERIES (An umbrella unit trust established in Hong Kong) CSOP SZSE CHINEXT ETF Stock Codes: 83147 ( counter) and 03147 (HKD counter) (A sub-fund of CSOP ETF Series) Reports and Financial Statements
CSOP ETF SERIES (An umbrella unit trust established in Hong Kong) CSOP SZSE CHINEXT ETF Stock Codes: 83147 ( counter) and 03147 (HKD counter) (A sub-fund of CSOP ETF Series) Reports and Financial Statements
Source Commodity Markets Plc
 Source Commodity Markets Plc Directors report and audited fi nancial statements For the year ended Contents Page(s) Directors and other information 1 2 5 6 Statement of comprehensive income 7 Statement
Brookfield Investment Funds (UCITS) p.l.c. (the Company )
 p.l.c. (the Company )") Brookfield Investment Funds (UCITS) p.l.c. (the Company ) An umbrella Fund with segregated liability between Funds authorised pursuant to the European Communities (Undertakings for Collective Investment
Brookfield Investment Funds (UCITS) p.l.c. (the Company ) An umbrella Fund with segregated liability between Funds authorised pursuant to the European Communities (Undertakings for Collective Investment
The Church in Wales Common Investment Fund. Annual Report and Financial Statements Year ended 31 December 2015
 The Church in Wales Common Investment Fund Annual Report and Financial Statements Year ended 31 December 2015 Contents Report of the Trustee... 1 Statement of Trustee Responsibilities... 5 Administrative
Investec Global Strategy Fund. Product Key Facts Statements July 2018
 Investec Global Strategy Fund Product Key Facts Statements July 2018 Contents Money Sub-Funds U.S. Dollar Money Fund... 1 Sterling Money Fund... 4 Bond Sub-Funds Global Total Return Credit Fund... 7 Investment
CSOP ETF SERIES (An umbrella unit trust established in Hong Kong) CSOP MSCI T50 ETF (Stock Code: 3021) (A sub-fund of CSOP ETF Series)
 CSOP MSCI T50 ETF (Stock Code: 3021) (A sub-fund of CSOP ETF Series)") CSOP ETF SERIES (An umbrella unit trust established in Hong Kong) CSOP MSCI T50 ETF (Stock Code: 3021) (A sub-fund of CSOP ETF Series) Reports and Financial Statements FOR THE YEAR ENDED 31 DECEMBER 2017
CSOP ETF SERIES (An umbrella unit trust established in Hong Kong) CSOP MSCI T50 ETF (Stock Code: 3021) (A sub-fund of CSOP ETF Series) Reports and Financial Statements FOR THE YEAR ENDED 31 DECEMBER 2017
Invesco Funds, SICAV Product Key Facts
 Invesco Funds, SICAV Product Key Facts 8 June 2017 Equity Funds: Global: America: Europe: Japan: Asia: Theme Funds: Reserve Funds: Bond Funds: Mixed Funds: Invesco Global Structured Equity Fund Invesco
P R O D U C T H I G H L I G H T S S H E E T
 This Product Highlights Sheet is an important document. It highlights the key terms and risks of this investment product and complements the Prospectus 1. It is important to read the Prospectus before
THE CHURCH IN WALES COMMON INVESTMENT FUND
 THE CHURCH IN WALES COMMON INVESTMENT FUND ANNUAL REPORT & ACCOUNTS For the year ended 31 st December 2011 1291 July 2012 Produced by the Church in Wales Publications Department and printed on Carbon balanced
LAZARD EUROPEAN ALTERNATIVE FUND
 If you are in any doubt about the contents of this Supplement, you should consult your stockbroker, bank manager, solicitor, accountant or other independent financial adviser. The Directors of Lazard Global
RV CAPITAL UCITS FUND ICAV RV CAPITAL UCITS FUND ICAV. Unaudited condensed interim financial statements for the six months ended 30 June 2018
 RV CAPITAL UCITS FUND ICAV an Irish collective asset-management vehicle with variable capital constituted as an umbrella fund with segregated liability between sub-funds under the laws of Ireland pursuant
Allianz Global Investors Asia Fund
 Product Key Facts Allianz Global Investors Asia Fund April 2018 Table of Contents Page no. Allianz Selection European Equity Dividend 2 Allianz Selection Income and Growth 7 Allianz Selection US High Yield
GlaxoSmithKline Capital plc (Registered number: )
") (Registered number: 2258699) Directors' report and financial statements for the year ended 31 December 2012 Registered office address: 980 Great West Road Brentford Middlesex TW8 9GS Directors' report
(Registered number: 2258699) Directors' report and financial statements for the year ended 31 December 2012 Registered office address: 980 Great West Road Brentford Middlesex TW8 9GS Directors' report
MEDIOLANUM FUND OF HEDGE FUNDS ANNUAL REPORT & AUDITED FINANCIAL STATEMENTS FOR THE YEAR ENDED 31 DECEMBER 2012
 ANNUAL REPORT & AUDITED FINANCIAL STATEMENTS FOR THE YEAR ENDED 31 DECEMBER 2012 AUDITED FINANCIAL STATEMENTS Contents 1 Trust Information 2 Statement of Manager s Responsibilities 4 Trustee s Report 5
Credo ICAV (the ICAV )
") Credo ICAV (the ICAV ) An umbrella Fund with segregated liability between Funds authorised pursuant to the European Communities (Undertakings for Collective Investment in Transferable Securities) Regulations,
Credo ICAV (the ICAV ) An umbrella Fund with segregated liability between Funds authorised pursuant to the European Communities (Undertakings for Collective Investment in Transferable Securities) Regulations,
ABF Pan Asia Bond Index Fund Annual Report st July 2014 to 30th June 2015
 1st July 2014 to 30th June 2015 Contents Page Manager s Investment Report 1 Statement by the Manager 4 Report of the Trustee 5 Independent Auditor s Report to the Unitholders of ABF Pan Asia Bond Index
Absolute Insight Funds p.l.c. Supplement dated 11 July 2017 to the Prospectus for Absolute Insight Currency Fund
 Absolute Insight Funds p.l.c. Supplement dated 11 July 2017 to the Prospectus for Absolute Insight Currency Fund This Supplement contains specific information in relation to the Absolute Insight Currency
Haitong Global RMB Fixed Income Fund
 Cumulative Return (%) Cumulative Return (%) Haitong Global RMB Fixed Income Fund (Class A) (The Sub-Fund of Haitong RMB Investment Fund Series) Monthly Report, Data as of 30 December 2016 IMPORTANT NOTES:
Cambridge University Endowment Fund. Reports and financial statements 30 June 2015
 Secti on N: Cambridge University Endowment Fund: Reports and financial statements to 30 June 2015 Cambridge University Endowment Fund Reports and financial statements 30 June 2015 Section N Page 54 IMPORTANT
Company Number: IMPERIAL BRANDS FINANCE PLC. Annual Report and Financial Statements 2017
 Company Number: 03214426 IMPERIAL BRANDS FINANCE PLC Annual Report and Financial Statements 2017 Board of Directors J M Jones N J Keveth (resigned 31 March 2017) D I Resnekov O R Tant M A Wall (appointed
REPORT AND UNAUDITED CONDENSED FINANCIAL STATEMENTS
 An umbrella type open-ended investment company with variable capital and segregated liability between Sub-Funds INTERIM REPORT AND UNAUDITED CONDENSED FINANCIAL STATEMENTS FOR THE FINANCIAL PERIOD ENDED
HARVEST MSCI CHINA A INDEX ETF (A SUB-FUND OF THE HARVEST FUNDS (HONG KONG) ETF)
 ETF)") HARVEST FUNDS (HONG KONG) ETF (AN UMBRELLA UNIT TRUST ESTABLISHED IN HONG KONG) HARVEST MSCI CHINA A INDEX ETF ANNUAL REPORT FOR THE YEAR ENDED 31 DECEMBER 2013 www.harvestglobal.com.hk CONTENTS Report
HARVEST FUNDS (HONG KONG) ETF (AN UMBRELLA UNIT TRUST ESTABLISHED IN HONG KONG) HARVEST MSCI CHINA A INDEX ETF ANNUAL REPORT FOR THE YEAR ENDED 31 DECEMBER 2013 www.harvestglobal.com.hk CONTENTS Report
PRODUCT KEY FACTS. PIMCO FUNDS: GLOBAL INVESTORS SERIES PLC - Low Average Duration Fund. 10 April 2019
 PRODUCT KEY FACTS Issuer: PIMCO Funds: Global Investors Series plc PIMCO FUNDS: GLOBAL INVESTORS SERIES PLC - Low Average Duration Fund 10 April 2019 This statement provides you with key information about
LAZARD EMERGING MARKETS BOND FUND
 If you are in any doubt about the contents of this Supplement, you should consult your stockbroker, bank manager, solicitor, accountant or other independent financial adviser. The Directors of Lazard Global
REPORTS AND AUDITED FINANCIAL STATEMENTS
 REPORTS AND AUDITED FINANCIAL STATEMENTS (A sub-fund of an open-ended umbrella unit trust established under the laws of Hong Kong) For the period from 20 February 2012 (date of inception) to 31 December
Invesco Funds, SICAV Product Key Facts. 8 October 2018
 Invesco Funds, SICAV Product Key Facts 8 October 2018 Table of Contents 2 Equity Funds 2 Global 2 Invesco Emerging Markets Equity Fund 6 Invesco Global Equity Income Fund 11 Invesco Global Small Cap Equity
Quick facts St. James s Place Unit Trust Group Limited. Henderson Global Investors Limited (external delegation, in the United Kingdom)
") PRODUCT KEY FACTS St. James s Place Global Emerging Markets Unit Trust July 2018 This statement provides you with key information about this product. This statement is a part of the Hong Kong offering
PRODUCT KEY FACTS St. James s Place Global Emerging Markets Unit Trust July 2018 This statement provides you with key information about this product. This statement is a part of the Hong Kong offering
Schroder Global Emerging Market Opportunities Fund. Annual Report & Financial Statements
 Schroder Global Emerging Market Opportunities Fund Annual Report & Financial Statements December 2011 SCHRODER GLOBAL EMERGING MARKET OPPORTUNITIES FUND (a sub-fund of Schroder International Opportunities
Source Commodity Markets Plc
 Source Commodity Markets Plc Directors report and audited fi nancial statements For the year ended Contents Page (s) Directors and other information 1 Directors report 2-5 Statement of Directors responsibilities
BetaBuilders EUR Govt Bond 1-3 yr UCITS ETF
 JPMORGAN ETFS (IRELAND) ICAV BetaBuilders EUR Govt Bond 1-3 yr UCITS ETF 24 August 2018 (A sub-fund of JPMorgan ETFs (Ireland) ICAV, an Irish collective asset-management vehicle constituted as an umbrella
UK AUTOCALL FUND SIMPLIFIED PROSPECTUS. Dated 28 April 2010
 UK AUTOCALL FUND SIMPLIFIED PROSPECTUS Dated 28 April 2010 This Simplified Prospectus contains key information in relation to UK Autocall Fund (the Fund), a fund of CitiFirst Investments plc (the Company),
Goldman Sachs Funds SICAV
 Prospectus Goldman Sachs Funds SICAV An undertaking for collective investment organised under the laws of the Grand Duchy of Luxembourg (S.I.C.A.V.) December 2017 Supplement I to the Prospectus - Part
Dealing Frequency. FYE 31 December 2017 PRODUCT SUITABILITY KEY PRODUCT FEATURES
 This Product Highlights Sheet is an important document. Prepared on: 20/09/18 It highlights the key terms and risks of this investment product and complements the Prospectus 1. It is important to read
CULLEN FUNDS PLC PROSPECTUS INVESTMENT MANAGER. Cullen Capital Management LLC. DATED 3 July 2017
 CULLEN FUNDS PLC (An umbrella fund with segregated liability between sub-funds constituted as an investment company with variable capital under the laws of Ireland and authorised by Central Bank of Ireland
LAZARD US FUNDAMENTAL ALTERNATIVE FUND
 If you are in any doubt about the contents of this Supplement, you should consult your stockbroker, bank manager, solicitor, accountant or other independent financial adviser. The Directors of Lazard Global
THE NT EUROPE (EX-UK) EQUITY INDEX FUND
 EQUITY INDEX FUND") THE NT EUROPE (EX-UK) EQUITY INDEX FUND 1 2 Supplement dated 23 June 2017 to the Prospectus for Northern Trust Investment Funds plc dated 23 June 2017 THE NT EUROPE (ex-uk) EQUITY INDEX FUND This Supplement
THE NT EUROPE (EX-UK) EQUITY INDEX FUND 1 2 Supplement dated 23 June 2017 to the Prospectus for Northern Trust Investment Funds plc dated 23 June 2017 THE NT EUROPE (ex-uk) EQUITY INDEX FUND This Supplement
Invesco Funds, SICAV Product Key Facts. 18 March 2019
 Invesco Funds, SICAV Product Key Facts 18 March 2019 Table of Contents 2 Equity Funds 2 Global 2 Invesco Developed Small and Mid-Cap Equity Fund 6 Invesco Emerging Markets Equity Fund 10 Invesco Global
PRODUCT HIGHLIGHTS SHEET
 Prepared on: 26 October 2018 This Product Highlights Sheet is an important document. It highlights the key terms and risks of the BNY Mellon Global Infrastructure Income Fund (the Fund ), a sub-fund of
SUPPLEMENT Guinness Global Equity Income Fund DATED 17 th December, 2018
 SUPPLEMENT Guinness Global Equity Income Fund DATED 17 th December, 2018 This Supplement contains information relating specifically to the Guinness Global Equity Income Fund (the Fund ), a Fund of Guinness
Sanlam FOUR Stable Global Equity Fund. Supplement dated 27 February 2018 to the Prospectus dated 27 February for Sanlam Universal Funds plc
 Sanlam FOUR Stable Global Equity Fund Supplement dated 27 February 2018 to the Prospectus dated 27 February 2018 for Sanlam Universal Funds plc An umbrella fund with segregated liability between sub-funds
Product Key Facts Franklin Templeton Asia Fund Series Franklin Select Global Multi-Asset Income Fund Last updated: April 2018
 Product Key Facts Franklin Templeton Asia Fund Series Franklin Select Global Multi-Asset Income Fund Last updated: April 2018 This statement provides you with key information about this product. This statement
EFG Hellas plc Annual Report
 Annual Report For the year ended 31 December Registered No. 3798157 Registered office: 24 Grafton Street, London W1S 4EZ Contents Report of the Directors. 2 Independent auditors report to the members of..
Schroder International Opportunities Portfolio - Schroder Asian Income (the Fund )
") Prepared on: 28 August 2018 This Product Highlights Sheet is an important document. It highlights the key terms and risks of this investment product and complements the Prospectus¹. It is important to
Prepared on: 28 August 2018 This Product Highlights Sheet is an important document. It highlights the key terms and risks of this investment product and complements the Prospectus¹. It is important to
CSOP CHINA 5-YEAR TREASURY BOND ETF (A sub-fund of CSOP ETF Series II)
") CSOP ETF SERIES II (An umbrella unit trust established in Hong Kong) CSOP CHINA 5-YEAR TREASURY BOND ETF (A sub-fund of CSOP ETF Series II) Semi-Annual Report FOR THE PERIOD FROM 17 FEBRUARY 2014 (DATE
CSOP ETF SERIES II (An umbrella unit trust established in Hong Kong) CSOP CHINA 5-YEAR TREASURY BOND ETF (A sub-fund of CSOP ETF Series II) Semi-Annual Report FOR THE PERIOD FROM 17 FEBRUARY 2014 (DATE
IF YOU ARE IN DOUBT ABOUT THE CONTENTS OF THIS SUPPLEMENT YOU SHOULD CONSULT YOUR PROFESSIONAL ADVISORS
 IF YOU ARE IN DOUBT ABOUT THE CONTENTS OF THIS SUPPLEMENT YOU SHOULD CONSULT YOUR PROFESSIONAL ADVISORS The Directors of the ICAV, whose names appear in the Prospectus under the section Directory, accept
ADEQUITY TRUST : LYXOR DYNAMIC WATER FUND REPORTS AND FINANCIAL STATEMENTS
 ADEQUITY TRUST : LYXOR DYNAMIC WATER FUND REPORTS AND FINANCIAL STATEMENTS FOR THE YEAR ENDED JANUARY 31, 2011 Managed By Lyxor Asset Management A 100% SG subsidiary CONTENTS Pages Administration 1 Report
Source Physical Markets Plc
 Source Physical Markets Plc Directors report and audited fi nancial statements For the financial year ended Contents Page (s) Directors and other information 1 Directors' report 2-4 Directors' responsibilities
PRODUCT HIGHLIGHTS SHEET
 Prepared on: 26 October 2018 This Product Highlights Sheet is an important document. It highlights the key terms and risks of the BNY Mellon Mobility Innovation Fund (the Fund ), a sub-fund of BNY Mellon
PRODUCT KEY FACTS. Quick facts. BOCHK Wealth Creation Series BOCHK All Weather Asian Bond Fund. April Issuer: BOCHK Asset Management Limited
 PRODUCT KEY FACTS BOCHK Wealth Creation Series BOCHK All Weather Asian Bond Fund April 2019 Issuer: BOCHK Asset Management Limited This statement provides you with key information about BOCHK All Weather
COUTTS MULTI ASSET GLOBAL BALANCED FUND (the Fund) a sub-fund of. COUTTS MULTI ASSET FUND plc. Supplement to the Prospectus
 a sub-fund of. COUTTS MULTI ASSET FUND plc. Supplement to the Prospectus") COUTTS MULTI ASSET GLOBAL BALANCED FUND (the Fund) a sub-fund of COUTTS MULTI ASSET FUND plc Supplement to the Prospectus This Supplement contains specific information in relation to Coutts Multi Asset
COUTTS MULTI ASSET GLOBAL BALANCED FUND (the Fund) a sub-fund of COUTTS MULTI ASSET FUND plc Supplement to the Prospectus This Supplement contains specific information in relation to Coutts Multi Asset
PRODUCT HIGHLIGHTS SHEET
 Prepared on: 26 October 2018 This Product Highlights Sheet is an important document. It highlights the key terms and risks of the BNY Mellon Asia Rising Stars Fund (the Fund ), a sub-fund of BNY Mellon
SEVENTH SUPPLEMENT. Dated 21 December to the Prospectus for Thornburg Global Investment plc
 SEVENTH SUPPLEMENT Dated 21 December 2018 to the Prospectus for Thornburg Global Investment plc This Supplement contains information relating specifically to the Thornburg Long/Short Equity Fund (the Fund
UniCredit Bank Ireland p.l.c. Consolidated and Company Financial Statements 2008
 UniCredit Bank Ireland p.l.c. Consolidated and Company Financial Statements 2008 UniCredit Bank Ireland p.l.c. Consolidated and Company Financial Statements Year Ended 31 December 2008 Contents 1 2 3 6
HI PRINCIPIA FUND. Hedge Invest SGR P.A.
 If you are in any doubt about the contents of this Supplement, you should consult your stockbroker, bank manager, solicitor, accountant or other independent financial adviser. The Directors of the Company,
Man AHL Diversified Futures Ltd
 For investment professionals only. Not for public distribution. Man AHL Diversified Futures Man AHL Diversified Futures (the "Company") is a futures and options fund and will invest, without limitation,
Credo ICAV (the ICAV )
") Credo ICAV (the ICAV ) An umbrella Fund with segregated liability between Funds authorised pursuant to the European Communities (Undertakings for Collective Investment in Transferable Securities) Regulations,
Credo ICAV (the ICAV ) An umbrella Fund with segregated liability between Funds authorised pursuant to the European Communities (Undertakings for Collective Investment in Transferable Securities) Regulations,
Baring Global Opportunities Umbrella Fund
 1 Baring Global Opportunities Umbrella Fund Interim Report & Unaudited Financial Statements for the half year ended 31 January 2018 Table of Contents Management and administration... 1 Introduction...
CSOP ETF SERIES II (An umbrella unit trust established in Hong Kong)
") CSOP ETF SERIES II (An umbrella unit trust established in Hong Kong) CSOP CHINA ULTRA SHORT TERM BOND ETF Stock Codes: 83122 ( counter) and 03122 (HKD counter) (A sub-fund of CSOP ETF Series II) Unaudited
CSOP ETF SERIES II (An umbrella unit trust established in Hong Kong) CSOP CHINA ULTRA SHORT TERM BOND ETF Stock Codes: 83122 ( counter) and 03122 (HKD counter) (A sub-fund of CSOP ETF Series II) Unaudited
HONG KONG SUPPLEMENT
 OLD MUTUAL GLOBAL INVESTORS SERIES PLC an investment company with variable capital incorporated with limited liability in Ireland with registered number 271517, established as an umbrella fund with segregated
St. James s Place Unit Trust Group Limited. Magellan Asset Management Limited (external delegation, in Australia) Class H Accumulation Units: 2.
 Class H Accumulation Units: 2.") PRODUCT KEY FACTS St. James s Place International Equity Unit Trust July 2018 This statement provides you with key information about this product. This statement is a part of the Hong Kong offering document
PRODUCT KEY FACTS St. James s Place International Equity Unit Trust July 2018 This statement provides you with key information about this product. This statement is a part of the Hong Kong offering document
SANLAM FOUR US DIVIDEND INCOME FUND Supplement to the Prospectus dated 1 September 2014 for Sanlam Universal Funds plc
 SANLAM FOUR US DIVIDEND INCOME FUND Supplement to the Prospectus dated 1 September 2014 for Sanlam Universal Funds plc This Supplement contains specific information in relation to Sanlam FOUR US Dividend
UK AUTOCALL FUND. Supplement to the Prospectus
 UK AUTOCALL FUND Supplement to the Prospectus This Supplement contains information in relation to Shares issued in respect of the UK Autocall Fund (the Fund) created by CitiFirst Investments plc, an umbrella
LSAM SF 3 plc SUPPLEMENT TO PROSPECTUS
 LSAM SF 3 plc (the Company ) An open-ended investment company with variable capital incorporated in Ireland with registered number 426254 established as an umbrella fund with segregated liability between
CSOP LEVERAGED AND INVERSE SERIES (An umbrella unit trust established in Hong Kong)
") CSOP LEVERAGED AND INVERSE SERIES (An umbrella unit trust established in Hong Kong) CSOP NIFTY 50 DAILY (-1X) INVERSE PRODUCT (Stock Code: 07335) (A sub-fund of CSOP Leveraged and Inverse Series) Reports
CSOP LEVERAGED AND INVERSE SERIES (An umbrella unit trust established in Hong Kong) CSOP NIFTY 50 DAILY (-1X) INVERSE PRODUCT (Stock Code: 07335) (A sub-fund of CSOP Leveraged and Inverse Series) Reports