48 BROAD-BASED BLACK ECONOMICEMPOWERMENT REGULATIONS
|
|
|
- June Gilbert
- 6 years ago
- Views:
Transcription
1
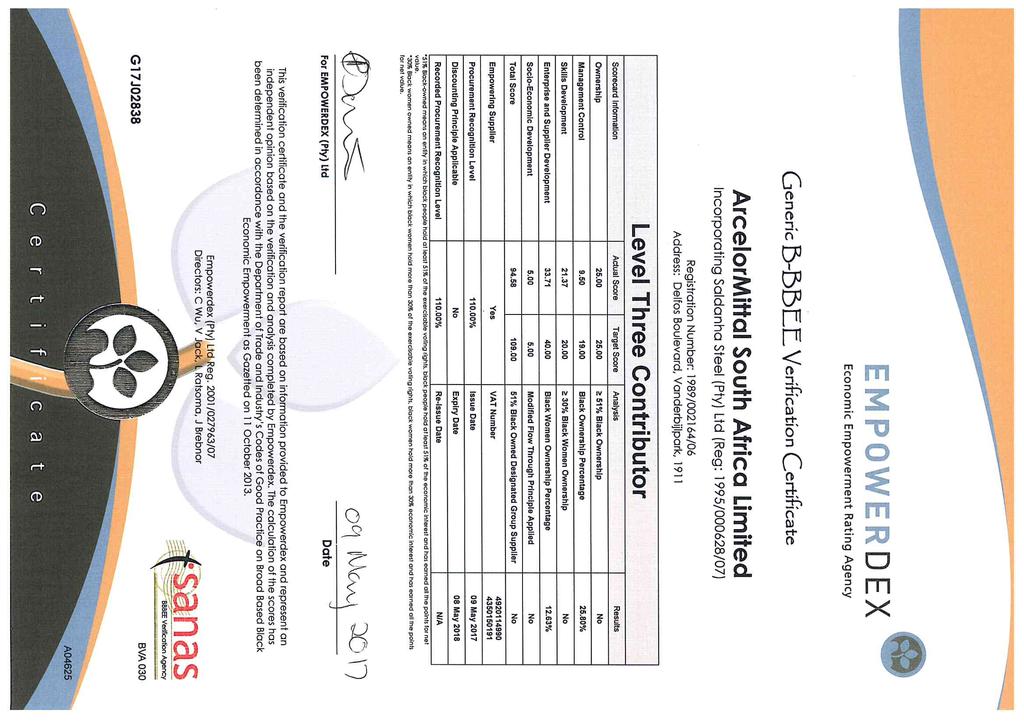
2 52 No GOVERNMENT GAZETTE, 6 JUNE 48 BROAD-BASED BLACK ECONOMICEMPOWERMENT REGULATIONS 1 SCHEDULE 2 FORMS TO REGULATIONS 3 4 BROAD-BASED BLACK ECONOMIC EMPOWERMENT COMMISSION 5 6 FORM: B-BBEE COMPLIANCE REPORT BY SPHERE OF GOVERNMENT, PUBLIC ENTITIES, 9 ORGANS OF STATE OR COMPANY LISTED ON THE JOHANNESBURG 10 STOCK EXCHANGE 11 (in terms of Section 13G (1) and 13G (2) of the Act) SECTION A: DETAILS OF ENTITY 14 Name of Entity/Organisation: 15 Registration number: 1989/002164/06 16 Physical address: Delfos Boulevard, Vanderbijlpark. 17 Telephone number: address: Mohamed.Adam@arcelormittal.com 19 Indicate Type of Entity/Organisation: Public company incorporated in South Africa. 20 Industry/Sector: Manufacturing 21 Relevant Code of Good Practice: Amended Code of Good Practice 22 Name of verification agency: Empowerdex 23 Name of Technical Signatory: Marco van den Berg SEC TION B: INFORMATION AS VERIFIED BY THE BROAD-BASED BLACK 26 ECONOMIC EMPOWERMENT VERIFICATION PREOFESSIONAL AS PER 27 SCORECARDS B-BBEE Elements Target Score Including bonus pts Bonus Points Actual Score Achieved 0F1 Ownership 25 points 25 points Management Control 9.25 points 9.5 points Skills Development 21.7 points 5 points points Enterprise and Supplier Development 32 points 2 points points Socio Economic Development 5 points 5 points Total Score points 7 points points Priority Elements Achieved YES/ Yes Empowering Supplier Status YES Yes 1 Including bonus points
3 STAATSKOERANT, 6 JUNIE No BROAD-BASED BLACK ECONOMIC EMPOWERM ENT REGULATIONS 49 Final B-BBEE Status level Level 3 Level 3 1 *indicate how each element contributes to the outcome of the scorecard 2 3 SECTION C: FINANCIAL REPORT BASIC ACCOUNTING DETAILS: Accounting officer's name: D. Subramamian Address: AMSA Vanderbijlpark Works, Delfos Boulevard, Vanderbijlpark Accounting policy: Accounts are done monthly Has the attached financial statements and annual report been approved by the entity? Yes PLEASE ATTACH THE FOLLOWING: i) COPY OF ANNUAL FINANCIAL STATEMENT INCLUDING 14 BALANCE SHEET AND INCOME AND EXPENDITURE REPORT 15 ii) ANNUAL REPORT Entity Annual Turnover: R32,737bn
4


5 Audited Annual Financial Statements Together creating value for all
6 Contents 1 Directors responsibility and approval of the group and company annual financial statements 2 Directors report 5 Audit and risk committee report 7 Report of the independent auditor 12 Group and company statements of comprehensive income 13 Group and company statements of financial position 14 Group and company statements of cash flows 15 Group and company statements of changes in equity 17 Notes to the group and company annual financial statements Feedback We value feedback from our stakeholders and use it to ensure that we are reporting appropriately on the issues that are most relevant to them. Please take the time to give us your feedback on this report. Visit the web link:
7 Audited Annual Financial Statements 1 Directors responsibility and approval of the group and company annual financial statements To the shareholders of Ltd The board of directors (directors) is required to maintain adequate accounting records and is responsible for the content and integrity of the group and company annual financial statements (annual financial statements) and related financial information included in this report. It is their responsibility to ensure that the annual financial statements, comprising the statements of financial position as at 31 December, the statements of comprehensive income, cash flows, changes in equity for the year then ended, and the notes to the annual financial statements, which include a summary of significant accounting policies and other explanatory notes, are prepared in accordance with International Financial Reporting Standards, the requirements of the Companies Act No 71 of 2008 (Companies Act) and JSE Listings Requirements. In addition, the directors are responsible for preparing the directors report. The annual financial statements and directors report have been prepared by the finance staff of Ltd headed and supervised by D Subramanian, the group s chief financial officer CA(SA). In order for the directors to discharge their responsibilities, management has developed and continues to maintain a system of internal control aimed at reducing the risk of error or loss in a cost-effective manner. The directors, primarily through the audit and risk committee, which consists of independent non-executive directors, meet periodically with the external and internal auditors, as well as executive management to evaluate matters concerning accounting policies, internal control, auditing and financial reporting. The group s internal auditors independently evaluate the internal controls. The external auditors are responsible for reporting on the financial statements. The external and internal auditors have unrestricted access to all records, property and personnel as well as to the audit and risk committee. The directors are not aware of any material breakdown in the functioning of these controls and systems during the period under review. The directors are of the opinion, based on the information and explanations given by management and the internal auditors, that the system of internal control provides reasonable assurance that the financial records may be relied on for the preparation of the group and company annual financial statements. However, any system of internal financial control can provide only reasonable and not absolute assurance against material misstatement or loss. The directors have reviewed the group and company s financial budgets for the year to 31 December In light of their review of the current financial position and existing borrowing facilities, they consider it appropriate that the annual financial statements continue to be prepared on the going concern basis. Refer to note 36 for further details. The financial statements for the year ended 31 December have been audited by Deloitte & Touche, the company s independent external auditors, whose report can be found on page 7. The directors of the company accept responsibility for the annual financial statements which were approved by the board of directors on 27 February 2017 and are signed on its behalf by: W de Klerk Chief executive officer D Subramanian Chief financial officer Certificate by company secretary In terms of section 88(2)(e) of the Companies Act, I certify that, to the best of my knowledge and belief, the company has, in respect of the financial year reported upon, lodged with the Companies Intellectual Property Commission all returns and notices required of a public company and that all such returns are true, correct and up to date. Nomonde Bam Company secretary 27 February 2017
8 2 Audited Annual Financial Statements Directors report The directors have pleasure in submitting their report together with Ltd s annual financial statements for the year ended 31 December. Nature of business Ltd and its subsidiaries (together, the group) manufacture and sell long and flat steel products and beneficiated by-products. The group s operations are primarily concentrated in South Africa with sales focus domestically and internationally, with specific emphasis on sub-saharan Africa. The company is a public company incorporated and domiciled in South Africa. The address of the registered office is detailed on the inside back cover of this report. The company is listed on the main board of the JSE Ltd in Johannesburg, South Africa, and is a subsidiary of ArcelorMittal Holdings AG, which is part of the ArcelorMittal group, and the functional and reporting currency is the South African rand (ZAR). Financial results and activities The contents of the annual financial statements adequately address the financial performance of the group for the financial year ended 31 December. Further detailed reports on the activities and performance of the group and the various segments of the group are contained in the integrated annual report. At 31 December the group had a net asset value per share of cents (: cents). The net asset value per share was calculated using a net asset value of R million (: R million). Refer to note 10 of the annual financial statements for information on loss and headline loss per share. Dividends Consistent with the group s dividend policy, no dividends were declared for the and financial years. Property, plant and equipment Details of capital expenditure are provided in note 26 and in the statements of cash flows. Authorised and issued share capital Details of the authorised and issued share capital are set out in note 20 of the annual financial statements. Shareholders ArcelorMittal Holdings AG, as controlling shareholder, held 53.05% (: 46.8%) of the shares in issue and had an effective shareholding of 69.2% (: 52.02% prior to the rights issue which took place in January ). Details of the registered and beneficial shareholders of the company are set out in the integrated annual report. Details of beneficial shareholders in excess of 3% are disclosed in note 20. Directors interests The details of the beneficial direct and indirect interests of executive directors in the shares of the company are set out in note 32 of these annual financial statements. Details of the direct and indirect interests of non-executive directors in the shares of the company are set out below: Director Direct Indirect Total Direct Indirect Total DCG Murray* JRD Modise NP Gosa** Total * DCG Murray has retired as a director. ** Interest via Likamva Resources.
9 Audited Annual Financial Statements 3 Directors report continued No other director holds any direct or indirect beneficial interest in the share capital of the company since the end of the financial year ended 31 December. Nomavuso Mnxasana, a non-executive director of the group, made a declaration of interest regarding the relationship between Noma Namuhla Trading and Projects Proprietary Ltd, a company owned by Nomavuso Mnxasana, and. In terms of the arrangement, Noma Namuhla Trading and Projects Proprietary Ltd will participate in s enterprise and supplier development initiatives., under its enterprise development programme, provided quality system development support, to the value of R12 500, to Noma Namuhla Trading and Projects Proprietary Ltd and, as a consequence, will be permitted to tender and potentially supply products and services to. Further to this, Noma Namuhla Trading and Projects Proprietary Ltd qualified for an interest-free loan under the terms of the supplier development initiative. Noma Namuhla Trading and Projects Proprietary Ltd has since applied for a loan of R which was granted at the end of the year. Investments in joint ventures, associates and subsidiaries The financial information in respect of interests in jointly controlled entities, associates and subsidiaries of the company is disclosed in notes 14 and 15 of the annual financial statements. Borrowing powers In terms of clause 34 of the Memorandum of Incorporation, the borrowing powers of the company and its subsidiaries are subject to any limitations imposed by the directors on the borrowing powers of the company. Directorate The names of the directors who presently hold office and served on the various committees of the board are set out in the integrated annual report. The following changes in directorate have taken place: LC Cele was appointed as a non-executive director effective 4 January. P O Flaherty announced his resignation as chief executive officer (CEO) effective 4 February. He was subsequently appointed as a non-executive director on 1 March and subsequently resigned as a non-executive director on 20 July. DCG Murray retired as a non-executive director effective 25 May. WA de Klerk was appointed as CEO and executive director of the company with effect from 1 July. D Chugh and M Vereecke both resigned as non-executive directors with effect from 15 July. H Blaffart and D Clarke were appointed as non-executive directors to the board with effect from 19 July. NP Gosa was appointed as a non-executive director with effect from 1 December. She has an interest in Likamva Resources and was nominated for appointment by Likamva Resources in accordance with the terms of the broad-based black economic empowerment (B-BBEE) transaction agreements. Retirement by rotation In terms of clause 27 of the Memorandum of Incorporation, the following directors are required to retire by rotation and, being eligible, offer themselves for re-election at the forthcoming annual general meeting: PM Makwana RK Kothari NF Nicolau LC Cele Shareholders will be requested to confirm the following directors appointment as directors at the forthcoming annual general meeting: WA de Klerk H Blaffart D Clarke NP Gosa
10 4 Audited Annual Financial Statements Directors report continued Going concern Due to the strengthening of the rand/us dollar exchange rate, weak local market demand and influx of cheap imports into the country, Ltd expects sales volumes to remain flat for the next 12 months, which will be mitigated by import substitution and new products, namely heavy structural products from Evraz Highveld. Export markets are likely to be more resilient, namely Africa Overland; however, authoritative projections being that Africa will experience demand growth in the order of 4%. While the group continues to benefit from the full support of ArcelorMittal Holdings AG, Ltd has invested in various initiatives to return the company to profitability. These initiatives include improvement in capital expenditure projects, restructuring the balance sheet by converting short-term borrowing facilities to medium-term debt and new products and markets. Based on the group s 12-month funding plan, a letter of support from ArcelorMittal Holdings AG and the initiatives detailed above, the board believes that the group will have sufficient funds to pay its debts as they become due over the next 12 months, and therefore will remain a going concern. The group would like to re-emphasise that the local steel industry continues to be threatened by imports entering the market, primarily from China, hence safeguard measures are important despite the positive progress on designation initiatives to date. Shareholders are cautioned that certain management initiatives as well as other government initiatives, including the fair pricing mechanism, safeguards, and designation are key to ensure the sustainability of the group, and should these initiatives not materialise in improved sales growth in the next 12 months, there remains a material uncertainty regarding the ability of Ltd and the local steel industry to continue operating without significant structural changes. Independent auditors Deloitte & Touche continued in office as auditors of the group. At the forthcoming annual general meeting to be held on 24 May 2017, shareholders will be requested to reappoint Deloitte & Touche as the independent auditors of the group and the appointment of M Mantyi as the individual designated auditor who will undertake the audit of the company for the ensuing year, terminating at the conclusion of the next annual general meeting of the company. Litigation During the year, an agreement was reached with the Competition Commission and was later accepted by the Competition Tribunal, regarding all outstanding competition matters. In accordance with the settlement agreement, an administrative penalty of R1 500 million is payable in equal instalments over the next five years. also committed to an earnings before interest and tax (ebit) cap of 10% on flat products and R4 600 million on capital expenditure for the next five years, subject to certain conditions. Other details on litigation and claims are detailed in note 33 of the annual financial statements. Subsequent events The directors are not aware of any matter or circumstances arising since the end of the financial year to the date of this report, not otherwise dealt with in this report or in the annual financial statements that would significantly affect the operations, the results and the financial position of the group and company.
11 Audited Annual Financial Statements 5 Audit and risk committee report The audit and risk committee (the committee) has pleasure in submitting its report to the shareholders as required in terms of section 94(7) of the Companies Act No 71 of Membership of the committee The committee comprised the following members at the date of this report: JRD Modise (chairman) LC Cele NP Mnxasana Each member is an independent director and has the adequate relevant knowledge, the financial expertise and experience to equip the committee to properly execute its duties and responsibilities. The experience and qualifications of the members are set out in the integrated annual report. DCG Murray retired effective 25 May and JRD Modise was elected chairperson at the annual general meeting (AGM) by the company s shareholders. Functions of the committee During the year under review, six meetings were held. Details of attendance are set out in the corporate governance section of the integrated annual report. The committee reports that it has adopted appropriate formal terms of reference as its mandate, and has regulated its affairs in compliance with this mandate, and has discharged all of the responsibilities set out therein. During the financial year under review, the committee reviewed the following matters: The quarterly and half-yearly financial reports, the integrated annual report, the annual financial statements and accounting policies for the company and all subsidiaries The effectiveness of the combined assurance model The reports of the internal audit function on the state of internal control including its forensic reports regarding fraud prevention and detection The effectiveness of the internal audit function The auditor s findings and recommendations Statements on ethical standards for the company and considered how they are promoted and enforced Significant cases of unethical activity by employees or by the company itself Reports on the risk management process in the company and assessed the company s exposure to the following risks: Top strategic risks (including credit and market risks, human resources risks and compliance risks) Operational risks Information technology risks Independence of auditor The committee reviewed a presentation by the external auditor and, after conducting its own review, is satisfied with the independence and objectivity of Deloitte & Touche as external auditors and M Mantyi, as the designated auditor. The committee further approved the fees to be paid to Deloitte & Touche and its terms of engagement and pre-approved each proposed contract with Deloitte & Touche for the provision of non-audit services to the company. Statutory reporting The committee has evaluated the annual financial statements of Ltd and the group for the year ended 31 December and, based on the information provided to the committee, considers that the company and group comply, in all material respects, with the requirements of the Companies Act of South Africa, the International Financial Reporting Standards (IFRS), the SAICA Financial Reporting Guides as issued by the Accounting Practices Committee, and applicable legislation and financial pronouncements as issued by the Financial Reporting Standards Council.
12 6 Audited Annual Financial Statements Audit and risk committee report continued Internal financial controls The committee agendas provide for confidential meetings between committee members and both the internal and independent external auditors. The committee has oversight of the group s financial statements and reporting process, including the system of internal financial control. It is responsible for ensuring the group s internal audit function is independent and has the necessary resources, standing and authority in the organisation to discharge its duties. The committee oversees cooperation between internal and external auditors, and serves as a link between the board of directors and these functions. The head of internal audit reports administratively to the chief executive officer and functionally to the chairman of the committee and head of group internal audit of the holding company ArcelorMittal Holdings AG. The committee is of the opinion, after having considered the assurance provided by the internal audit function, that the group s system of internal financial controls in all key material aspects is effective and provides reasonable assurance that the financial records may be relied upon for the preparation of the annual financial statements. This is based on the information and explanations given by management and the group internal audit function. Expertise and experience of the chief financial officer and the finance function The committee has satisfied itself that the chief financial officer, D Subramanian, has the appropriate expertise and experience to carry out his duties. The committee has assessed the competency, skills and resourcing of the group s finance function, and is satisfied as to the overall adequacy and appropriateness of the finance function. Expertise and experience of the company secretary The committee has satisfied itself that the company secretary has the appropriate competence and experience and has maintained an arm s length relationship with directors. Recommendation of the annual financial statements and integrated annual report The committee, having fulfilled the oversight role regarding the reporting process for both the annual financial statements and the integrated annual report and having regard to material factors that may impact the integrity of these reports, recommends the integrated annual report and the annual financial statements for approval by the board of directors. JRD Modise Chairman 27 February 2017
13 Audited Annual Financial Statements 7 Report of the independent auditor To the shareholders of Ltd Report on the audit of the consolidated and separate financial statements Opinion We have audited the consolidated and separate financial statements of Ltd and its subsidiaries (the group) set out on pages 12 to 84, which comprise the statements of financial position as at 31 December, and the statements of other comprehensive income, the statements of changes in equity and the statements of cash flows for the year then ended, and the notes to the financial statements, including a summary of significant accounting policies. In our opinion, the consolidated and separate financial statements present fairly, in all material respects, the consolidated and separate financial position of the group as at 31 December, and its consolidated and separate financial performance and its consolidated and separate cash flows for the year then ended in accordance with International Financial Reporting Standards (IFRS) and the requirements of the Companies Act of South Africa. Basis for opinion We conducted our audit in accordance with International Standards on Auditing (ISAs). Our responsibilities under those standards are further described in the auditor s responsibilities for the audit of the consolidated and separate financial statements section of our report. We are independent of the group in accordance with the Independent Regulatory Board for Auditors Code of Professional Conduct for Registered Auditors (IRBA Code) and other independence requirements applicable to performing audits of financial statements in South Africa. We have fulfilled our other ethical responsibilities in accordance with the IRBA Code and in accordance with other ethical requirements applicable to performing audits in South Africa. The IRBA Code is consistent with the International Ethics Standards Board for Accountants Code of Ethics for Professional Accountants (parts A and B). We believe that the audit evidence we have obtained is sufficient and appropriate to provide a basis for our opinion. Material uncertainty related to going concern We draw attention to note 36 of the consolidated and separate financial statements which states that the group has continued support from ArcelorMittal Holdings AG in the form of a signed letter of support. In addition, note 36 sets out specific directors initiatives and some pending government initiatives, which should they not materialise, indicate the existence of a material uncertainty which may cast significant doubt on the company s and group s ability to continue as a going concern. Our opinion is not modified in respect of this matter. Key audit matters Key audit matters are those matters that, in our professional judgement, were of most significance in our audit of the consolidated and separate financial statements of the current period. These matters were addressed in the context of our audit of the consolidated and separate financial statements as a whole, and in forming our opinion thereon, and we do not provide a separate opinion on these matters. All key matters relate to consolidated and separate financial statements.
14 8 Audited Annual Financial Statements Report of the independent auditor continued Key audit matter Impairment of property, plant and equipment As disclosed in note 12 of the consolidated and separate financial statements, an impairment to property, plant and equipment was recognised in the current year based on the assumptions disclosed in the note. The recoverable amount of a group of assets, or cash-generating unit (CGU), is to be measured whenever there is an indication that the value of the group of assets or the CGU may be impaired. Significant judgement is required by the directors in assessing the impairment of the group of assets or the CGUs, which is determined with reference to fair value less cost to sell or the value in use, based on the cash flow forecast for each CGU. Impairment indicators were existing as a result of the depressed trading conditions and weaker than expected economic growth. The key assumptions with the most significant impact on the cash flow forecast were: Revenue growth (including market share and volume growth). The discount rate, which is based on the weighted average cost of capital. The determination of the weighted average cost of capital is highly complex. Exchange rate forecasts. Projected sales and input cost prices, as both are linked to commodity prices which are volatile. A further key consideration includes whether the value in use calculation and valuation method used complies with the requirements of IAS 36: Impairment of Assets. The CGUs where indicators of impairment were identified, are the Vanderbijlpark Works and Long Steel Works at a company level and Saldanha Works at a group level. The complexity of the above results in complex accounting considerations and this was determined as a key audit matter. How the matter was addressed in the audit In evaluating the impairment of property, plant and equipment within the applicable CGUs, we reviewed the value in use calculations prepared by the directors, with a particular focus on the assumptions with the most significant impact. We performed various procedures, including the following: Testing of the key entity s controls relating to the preparation and review of the cash flow forecasts. Subjecting the key assumptions to sensitivity analyses. Testing of inputs into the cash flow forecast, including the assumptions relating to revenue growth and input prices, against historical performance and in comparison to the directors strategic plans in respect of the applicable CGUs. Consideration of the directors ability to accurately forecast, based on a comparison of historical actual performance against previous respective forecasts. We engaged our internal valuation specialists to: Critically evaluate whether the value in use calculation used by the directors to calculate the value in use of the individual cash-generating units complies with the requirements of IAS 36. Compare the growth rates used to historical data regarding economic growth rates for the regions included in the CGUs. Assess of the weighted average cost of capital (discount rate) and the determination of this rate. Assess the exchange rates used in the model to ensure that they comply with the requirements of IAS 36 in relation to the valuation method used. Analysis of the future projected cash flows used in the models to determine whether they are reasonable and supportable given the current macro-economic climate and expected future performance of the applicable CGUs, against external market data, historical performance and forecasts. Comparison of the forecast commodity prices used in determining the sales prices and input costs against independent third-party sources. Recalculation of the value in use of all CGUs. Based on our overall assessment, the key assumptions used in the determination of the impairment charge were within our expected ranges. We found that the resultant accounting impact was materially correct. We considered the related disclosures to be appropriate.
15 Audited Annual Financial Statements 9 Report of the independent auditor continued Key audit matter Environmental remediation obligations The group s environmental compliance has been under scrutiny in the past. Furthermore, the determination of environmental remediation obligations are subject to significant estimates and judgement. The key assumptions that affect the measurement of the related provisions include: The discount rates applied to the forecast cash flows relating to environmental remediation. The escalation rates applied in determining the forecast cash flows. The determination of the completeness of all projects and related costs to be incurred. The most significant estimates and areas of judgement have been disclosed by the directors in note 22 of the consolidated and separate financial statements. Due to the magnitude of the environmental remediation obligations, the environmental footprint of the group and the impact that environmental non-compliance could have on the group, this is considered a matter of key importance. How the matter was addressed in the audit We tested the entity s key controls relating to the preparation and review of the cash flow forecasts. We obtained the group s environmental models which are used to determine the value of the environmental remediation obligations. Through a consultative and corroborative process, including the review of minutes of meetings of the directors, of the audit and risk committee, and safety, health and environment committee together with discussions held with the directors environmental specialists and environmental legal counsel, we gained sufficient evidence that all required exposures have been provided for. Our assessment included inspection and analysis of existing rehabilitation plans as well as communication between the group and environmental regulators and local authorities. We made use of our specialists to assess the environmental cash flow forecasts as well as for the assessment of the applied discount rates by comparing the discount rate used to an independently determined rate based on external market data. The environmental specialists further assessed the completeness of the provisions by assessing the current provisions against latest legislation to ensure all areas of exposure have been considered and recorded appropriately. They also assessed the nature of the costs included within the cash flow forecasts. We furthermore assessed the key assumptions and inputs in the models, which included: Comparing estimated cash flows of significant projects against related project plans and anticipated costs. An assessment of the escalation rates applied in the forecast cash flows to ensure these are in line with market forecasts. Assessing the impact of changes in the applied discount rate as well as scope changes. We assessed the adequacy of the group s disclosures in relation to the judgement and estimation applied to these balances. Broad-based black economic empowerment (B-BBEE) transaction As disclosed in note 20 of the consolidated and separate financial statements, the company concluded the B-BBEE transaction with Likamva Resources Proprietary Limited during the year. This is considered a significant transaction which results in material financial impacts. The IFRS 2: Share-based Payment charge, that arises is dependent on various key assumptions, was determined by an independent third-party expert. The complexity of such transactions results in complex accounting considerations and this was determined as a key audit matter. We found the operation of the key controls relating to the cost modelling to be effective. Our substantive testing did not reveal any material misstatements and overall the directors had adequately factored in risks and the impact of macro-economic factors into the forecast costs. We considered the disclosures to be balanced and appropriate. We obtained and assessed the resultant accounting impact arising from this transaction. We consulted with our accounting specialists to determine whether the financial impact arising from the transaction was appropriate. We furthermore engaged with our internal valuation specialists to determine whether the IFRS 2 charge, and assumptions used therein, were appropriate. We found that the resultant accounting impact and assumptions used in determining the IFRS 2 charge to be materially correct. We did not identify any significant concerns relating to the B-BBEE transaction. We considered the related disclosures to be appropriate.
16 10 Audited Annual Financial Statements Report of the independent auditor continued Key audit matter Thabazimbi environmental obligation As disclosed in note 22 of the consolidated and separate financial statements, in terms of the amended settlement and supply agreement (supply agreement) between the company and Sishen Iron Ore Company Proprietary Limited (SIOC), the company is liable for the costs relating to the rehabilitation of SIOC s Thabazimbi iron ore mine. The mine ceased to be a captive mine on 1 January The company is required to fund its obligation through bank guarantees and/or cash in a trust fund maintained by SIOC. The company increased the related provision, based on a revised assessment of the expected rehabilitation costs received from SIOC, following the potential closure of the mine, subject to the company s efforts to take over the mine. The company has performed an independent assessment of the expected rehabilitation costs, which does not agree to that determined by SIOC. Due to the conclusion of the interim agreement between the company and SIOC, the difference in expected rehabilitation costs, and the nature of the agreements in place, this was considered a key audit matter that required additional attention. Current and deferred tax There are various complexities relating to the treatment and recognition of current and deferred taxation, in particular: The taxation consequences arising from significant or unusual transactions may be ambiguous and thereby require legal opinion. The determination of whether to recognise deferred taxation assets is dependent on the directors assessment of the utilisation of the historical taxation losses and the timing of realising temporary differences, which requires significant judgement. With respect to uncertain taxation positions, the directors make provision for taxation based on the most probable outcome. As a result, taxation is considered a key audit matter due to the complexities and judgement arising from the considerations relating to the calculation, recognition, and classification of current and deferred taxation balances and the significance of the balances in relation to the consolidated and separate financial statements as a whole. The disclosures relating to taxation and deferred taxation are contained in note 9 and note 24 of the consolidated and separate financial statements. How the matter was addressed in the audit We read and understood the terms of the supply agreement and the interim agreement, in order to determine the effects arising therefrom. We have considered the company s obligations in terms of the agreements. We also made enquiries of our internal environmental rehabilitation specialists based on the available rehabilitation assessment reports. We held discussions with and made enquiries of the directors in order to determine the view of the company, as well as the proposed response and courses of action that they intend to follow in this regard. While the directors experts have a different valuation regarding the obligation, after consideration of the contractual obligations included in the settlement agreement, the directors have increased the liability. Based on our overall assessment, we have not identified any material errors with regard to the increase in the provision. We considered the related disclosures to be appropriate. We involved our taxation specialists to evaluate the taxation provisions and potential exposures. This included: Analysing the taxation consequences arising on significant or unusual transactions to determine if the treatment adopted is appropriate under the circumstances, and/or based on appropriate legal counsel opinion obtained by the directors. Analysing the current and deferred taxation calculations for compliance with relevant taxation legislation. Evaluating the directors assessment of the estimated manner in which the timing differences, including the recoverability of the deferred taxation assets, would be realised by comparing this to evidence obtained in respect of other areas of the audit, including cash flow forecasts, minutes of directors meetings and evidence obtained in other areas during the performance of our audit procedures. Critically evaluating the assumptions made by the directors for uncertain current and deferred taxation positions to assess whether appropriate current and deferred taxation provisions have been recognised and are based on the most probable outcome. We assessed the disclosures to ensure that this was accurately and appropriately recognised. We assessed the presentation and disclosure in respect of taxation-related balances and considered whether the disclosures reflected the risks inherent in the accounting for the taxation balances. We found the disclosures relating to the current and deferred tax balances to be appropriate. Other information The directors are responsible for the other information. The other information comprises the directors report, the audit and risk committee s report and the certificate by the company secretary as required by the Companies Act of South Africa, which we obtained prior to the date of this report and the annual report, which is expected to be made available to us after that date. The other information does not include the consolidated and separate financial statements and our auditor s report thereon. Our opinion on the consolidated and separate financial statements does not cover the other information and we do not express an audit opinion or any form of assurance conclusion thereon. In connection with our audit of the consolidated and separate financial statements, our responsibility is to read the other information and, in doing so, consider whether the other information is materially inconsistent with the consolidated and separate financial statements or our knowledge obtained in the audit, or otherwise appears to be materially misstated. If, based on the work we have performed on the other information that we obtained prior to the date of this auditor s report, we conclude that there is a material misstatement of this other information, we are required to report that fact. We have nothing to report in this regard.
17 Audited Annual Financial Statements 11 Report of the independent auditor continued Responsibilities of the directors for the consolidated and separate financial statements The directors are responsible for the preparation and fair presentation of the consolidated and separate financial statements in accordance with IFRS and the requirements of the Companies Act of South Africa, and for such internal control as the directors determine is necessary to enable the preparation of consolidated and separate financial statements that are free from material misstatement, whether due to fraud or error. In preparing the consolidated and separate financial statements, the directors are responsible for assessing the group and the company s ability to continue as a going concern, disclosing, as applicable, matters related to going concern and using the going concern basis of accounting unless the directors either intend to liquidate the group and/or the company or to cease operations, or have no realistic alternative but to do so. Auditor s responsibilities for the audit of the consolidated and separate financial statements Our objectives are to obtain reasonable assurance about whether the consolidated and separate financial statements as a whole are free from material misstatement, whether due to fraud or error, and to issue an auditor s report that includes our opinion. Reasonable assurance is a high level of assurance, but is not a guarantee that an audit conducted in accordance with ISAs will always detect a material misstatement when it exists. Misstatements can arise from fraud or error and are considered material if, individually or in aggregate, they could reasonably be expected to influence the economic decisions of users taken on the basis of these consolidated and separate financial statements. As part of an audit in accordance with ISAs, we exercise professional judgement and maintain professional scepticism throughout the audit. We also: Identify and assess the risks of material misstatement of the consolidated and separate financial statements, whether due to fraud or error, design and perform audit procedures responsive to those risks, and obtain audit evidence that is sufficient and appropriate to provide a basis for our opinion. The risk of not detecting a material misstatement resulting from fraud is higher than for one resulting from error, as fraud may involve collusion, forgery, intentional omissions, misrepresentations, or the override of internal control. Obtain an understanding of internal control relevant to the audit in order to design audit procedures that are appropriate in the circumstances, but not for the purpose of expressing an opinion on the effectiveness of the group and the company s internal control. Evaluate the appropriateness of accounting policies used and the reasonableness of accounting estimates and related disclosures made by the directors. Conclude on the appropriateness of directors use of the going concern basis of accounting and based on the audit evidence obtained, whether a material uncertainty exists related to events or conditions that may cast significant doubt on the group and company s ability to continue as a going concern. If we conclude that a material uncertainty exists, we are required to draw attention in our auditor s report to the related disclosures in the consolidated and separate financial statements or, if such disclosures are inadequate, to modify our opinion. Our conclusions are based on the audit evidence obtained up to the date of our auditor s report. However, future events or conditions may cause the group and/or the company to cease to continue as a going concern. Evaluate the overall presentation, structure and content of the consolidated and separate financial statements, including the disclosures, and whether the consolidated and separate financial statements represent the underlying transactions and events in a manner that achieves fair presentation. Obtain sufficient appropriate audit evidence regarding the financial information of the entities or business activities within the group to express an opinion on the consolidated financial statements. We are responsible for the direction, supervision and performance of the group audit. We remain solely responsible for our audit opinion. We communicate with the directors regarding, among other matters, the planned scope and timing of the audit and significant audit findings, including any significant deficiencies in internal control that we identify during our audit. We also provide the directors with a statement that we have complied with relevant ethical requirements regarding independence, and to communicate with them all relationships and other matters that may reasonably be thought to bear on our independence, and where applicable, related safeguards. From the matters communicated with the directors, we determine those matters that were of most significance in the audit of the consolidated and separate financial statements of the current period and are therefore the key audit matters. We describe these matters in our auditor s report unless law or regulation precludes public disclosure about the matter or when, in extremely rare circumstances, we determine that a matter should not be communicated in our report because the adverse consequences of doing so would reasonably be expected to outweigh the public interest benefits of such communication. Report on other legal and regulatory requirements In terms of the IRBA Rule published in Government Gazette Number dated 4 December, we report that Deloitte & Touche has been the auditor of Ltd for 12 years. Deloitte & Touche Registered auditors Per: Mandisi Mantyi Partner 6 March 2017 Deloitte & Touche Registered Auditors Buildings 1 and 2, Deloitte Place The Woodlands, Woodlands Drive Woodmead, Sandton
18 12 Audited Annual Financial Statements Group and company statements of comprehensive income for the year ended 31 December Group Company Notes Revenue Raw materials and consumables used (19 454) (19 183) (17 738) (16 792) Employee costs (4 175) (4 027) (4 174) (4 026) Energy (3 981) (3 824) (2 888) (2 766) Movement in inventories of finished goods and work-in-progress 973 (457) 804 (566) Depreciation (1 030) (1 346) (959) (986) Amortisation of intangible assets (25) (23) (22) (20) Other operating expenses (6 137) (7 017) (4 877) (7 494) Loss from operations 5 (1 092) (4 736) (442) (5 490) B-BBEE charges (870) (870) Finance and investment income Finance costs 7 (876) (1 208) (837) (1 161) Impairment of other assets 8 (11) (310) (1 165) (2 260) Impairment of property, plant, equipment and intangible assets 12, 13 (2 143) (3 944) (1 723) (370) Income after tax from equity-accounted investments Loss before taxation (4 687) (9 828) (4 715) (8 997) Income tax (expense)/credit 9 (19) (11) 106 Loss for the year (4 706) (8 635) (4 726) (8 891) Other comprehensive (loss)/income (554) Items that may be reclassified subsequently to profit or loss: Exchange differences on translation of foreign operations (618) Income on available-for-sale investment taken to equity Share of other comprehensive income of equityaccounted investments Total comprehensive loss for the year (5 260) (7 305) (4 723) (8 871) Loss attributable to: Owners of the company (4 706) (8 635) (4 726) (8 891) Total comprehensive loss attributable to: Owners of the company (5 260) (7 305) (4 723) (8 871) Attributable loss per share (cents) Basic 10 (443) (2 152) Diluted 10 (443) (2 152)
19 Audited Annual Financial Statements 13 Group and company statements of financial position as at 31 December Group Company Notes Assets Non-current assets Property, plant and equipment Intangible assets Equity-accounted investments Investments in subsidiaries Other financial assets Current assets Inventories Trade and other receivables Taxation Other financial assets Cash and bank balances Total assets Equity and liabilities Equity Stated capital Reserves Retained income Non-current liabilities Finance lease obligations Provisions Other financial liabilities Other payables Current liabilities Trade payables Other financial liabilities Borrowings Finance lease obligations Provisions Other payables Total equity and liabilities
20 14 Audited Annual Financial Statements Group and company statements of cash flows for the year ended 31 December Group Company Notes Cash generated from/(utilised in) operations (264) (1 643) Interest income Finance cost (525) (554) (504) (536) Income tax paid 26.2 (2) (40) 1 (4) Transaction costs on B-BBEE share transaction (55) (55) Realised foreign exchange movements (268) (258) (225) (258) Cash flows from operating activities 90 (1 107) (2 432) Investment to maintain operations 26.3 (1 673) (1 164) (1 291) (1 045) Investment to expand operations 26.4 (335) (92) (335) (84) Investment in associates and joint ventures (11) (8) (8) Proceeds on disposal or scrapping of assets Dividend from equity-accounted investments/subsidiaries Interest income from investments Cash flows from investing activities (1 945) (1 140) (1 558) (1 017) Borrowings (repaid)/raised (3 079) (3 079) Proceeds from rights issue/issue of share capital Finance lease obligation repaid (62) (92) (48) (79) (Decrease)/increase in loans to subsidiaries (1 346) Cash flows from financing activities (Decrease)/increase in cash and cash equivalents (496) (495) Effect of foreign exchange rate changes on cash and cash equivalents (8) 20 (3) 11 Cash and cash equivalents at the beginning of the year Cash and cash equivalents at the end of the year
21 Audited Annual Financial Statements 15 Group and company statements of changes in equity for the year ended 31 December Stated capital 1 Retained income Treasury share equity reserve 2 Management Share Trust reserve 3 Reserves Sharebased payment reserve 4 Attributable reserves of equityaccounted investments Other reserves 5 Total equity Group Balance at 1 January (3 918) (285) Total comprehensive (loss)/income for the year (8 635) (7 305) Loss (8 635) Other comprehensive income Transfer between reserves (84) 84 Transactions with owners Share-based payment expense Balance at 31 January (3 918) (285) Total comprehensive (loss)/income for the year (4 706) 63 (617) (5 260) Loss (4 706) Other comprehensive income/(loss) 63 (617) Transfer between reserves (129) 129 Transactions with owners Rights issue A1 ordinary shares issued to Amandla* A2 ordinary shares issued to Isabelo* Share-based payment expense B-BBEE charge Cash settlement on management share trust/long-term incentive plan (32) (32) Balance at 31 December (3 918) (317) Footnotes relate to notes 1 to 5 on page 16. Reserves Stated capital 1 Retained income Treasury share equity reserve 2 Management Share Trust reserve 3 Sharebased payment reserve 4 Attributable reserves of equityaccounted investments Other reserves 5 Total equity Company Balance at 1 January (285) 269 (1) Total comprehensive loss for the year (8 891) 20 (8 871) Loss (8 891) Other comprehensive income 20 Transactions with owners Share-based payment expense Balance at 31 January (285) Total comprehensive loss for the year (4 726) 3 (4 723) Loss (4 726) Other comprehensive income 3 Transactions with owners Rights issue A1 ordinary shares issued to Amandla* A2 ordinary shares issued to Isabelo* Share-based payment expense B-BBEE charge Cash settlement on management share trust/long-term incentive plan (32) (32) Balance at 31 December (317) * Value less than R1 million shown as an asterisk Footnotes relate to notes 1 to 5 on page 16. Dividends per share (cents) : Rnil : Rnil
22 16 Audited Annual Financial Statements Group and company statements of changes in equity continued for the year ended 31 December In the context of the statement of changes in equity, the following equity reserves are of relevance: 1. Stated capital A successful rights offer for R4 500 million was concluded and implemented on 18 January. The company issued new ordinary shares. These shares were issued at a value of R6.50 per share At the special general meeting (SGM) of the shareholders of Ltd held on 18 November, the shareholders approved the increase in the authorised share capital of through the creation of new ordinary class shares ( empowerment shares) for the purposes of the broad-based black economic empowerment (B-BBEE) ownership scheme. The scheme is part of s initiatives to transform the company and achieve sustainable ownership by black people. In terms of the scheme, issued empowerment shares to Amandla we Nsimbi Proprietary Limited (A1 ordinary shares) and Isabelo Empowerment Share Trust (A2 ordinary shares) representing 17% and 5.1% respectively of the voting rights in through a notional loan. These shares were issued at a nominal value of R per share for both the A1 and A2 shares. 2. Treasury share equity reserve In 2009 the company implemented a share buy-back arrangement and acquired 9.995% of the shareholding of each shareholder. In the current year the Ikageng Broad-Based Employee Share Trust was created to hold in trust, the shares for the Employee Share Ownership Plan, and purchased 4.7% of the shareholding through a contribution from. The trust is controlled by Ltd and, therefore, the trust is consolidated in accordance with IFRS 10: Consolidated Financial Statements. The shares will continue to remain in issue as treasury shares. 3. Management Share Trust reserve The Management Share Trust reserve represents the net outflow from the purchase of treasury shares in order to meet obligations in terms of the equity-settled share option plan housed in the Management Share Trust. The trust is consolidated as a consolidated structured entity in compliance with IFRS 10: Consolidated Financial Statements. 4. Share-based payment reserve The share-based payment reserve represents the accumulated charge for share options and long-term incentive plan units in terms of IFRS 2: Share-based Payments, which are all equity-settled. Included in the current year was an IFRS 2 charge of R800 million and R1 million relating to the issue of A1 and A2 ordinary shares under the B-BBEE ownership scheme. 5. Other reserves Other reserves consist of the following: Capital redemption reserve of R23 million (: R23 million) for the group and company. The capital redemption reserve was created in terms of the South African Companies Act No 61 of 1973, following the redemption of shares during the year ended 30 June 2000, out of profits that would otherwise be available for distribution to ordinary shareholders. Available-for-sale investment reserve of R1 million credit (: R1 million debit) for the group. The available-for-sale reserve relates to the unrealised fair value gains/(losses) relating to the group s investment in Hwange Colliery Company Ltd and Coal of Africa Ltd. Translation of the foreign operation reserve of R1 999 million (: R2 618 million) for the group. The translation of the foreign operation reserve consists of: Reserves relating to equity-accounted investments of R1 719 million (: R2 276 million) Other group-related translation reserves of R280 million (: R342 million)
23 Notes to the group and company annual financial statements for the year ended 31 December Audited Annual Financial Statements General information Ltd (the company) and its subsidiaries consolidated in these annual financial statements to reflect the group, is one of the largest steel producers on the African continent. The company is domiciled in South Africa and it is a public limited company listed on the Johannesburg Stock Exchange. 2. Standards and interpretations not yet effective for December A number of new standards, amendments to standards and interpretations are effective for annual periods beginning on or after 1 January 2017, and have not been applied in preparing these annual financial statements. Those which may be relevant to the group and company are set out below. The group and company do not plan to adopt these standards early. These will be adopted in the period that they become mandatory unless otherwise indicated: Effective for the financial year commencing 1 January 2017 IFRS 12: Disclosure of Interests in Other Entities Disclosure of Interests in Other Entities IFRS 12 Clarified the scope of the standard by specifying that the disclosure requirements in the standard, except for those in paragraphs B10 B16, apply to an entity s interests in subsidiaries, joint arrangements, associates and unconsolidated structured entities that are classified as held-for-sale, as held for distribution or as discontinued operations in accordance with IFRS 5: Non-current Assets Held for Sale and Discontinued Operations. The amendments are effective for annual periods commencing on or after 1 January IAS 7: Cash Flow Statement Disclosure Initiative (Amendments to IAS 7) The amendments provide for disclosures that enable users of financial statements to evaluate changes in liabilities arising from financing activities, including both changes arising from cash flow and non-cash changes. This includes providing a reconciliation between the opening and closing balances for liabilities arising from financing activities. The impact of these amendments have not yet been adopted by the group. The amendments apply for annual periods beginning on or after 1 January 2017 and early application is permitted. IAS 12: Income Taxes Recognition of Deferred Tax Assets for Unrealised Losses (Amendments to IAS 12) The amendments provide additional guidance on the existence of deductible temporary differences, which depend solely on a comparison of the carrying amount of an asset and its tax base at the end of the reporting period, and is not affected by possible future changes in the carrying amount or expected manner of recovery of the asset. The amendments also provide additional guidance on the methods used to calculate future taxable profit to establish whether a deferred tax asset can be recognised. Guidance is provided where an entity may assume that it will recover an asset for more than its carrying amount, provided that there is sufficient evidence that it is probable that the entity will achieve this. Guidance is provided for deductible temporary differences related to unrealised losses are not assessed separately for recognition. These are assessed on a combined basis, unless a tax law restricts the use of losses to deductions against income of a specific type. The amendments apply for annual periods beginning on or after 1 January 2017 and early application is permitted. Effective for the financial year commencing 1 January 2018 IFRS 2: Share-based Payments Clarifying share-based payment accounting (amendments to IFRS 2). Currently, there is ambiguity over how a company should account for certain types of share-based payment arrangements. The IASB has responded by publishing amendments to IFRS 2: Share-based Payment. The amendments cover three accounting areas: Measurement of cash-settled share-based payments The new requirements do not change the cumulative amount of expense that is ultimately recognised, because the total consideration for a cash-settled share-based payment is still equal to the cash paid on settlement. Classification of share-based payments settled net of tax withholdings The amendments introduce an exception stating that, for classification purposes, a share-based payment transaction with employees is accounted for as equity-settled if certain criteria are met. Accounting for a modification of a share-based payment from cash-settled to equity-settled The amendments clarify the approach that companies are to apply. The new requirements could affect the classification and/or measurement of these arrangements and potentially the timing and amount of expense recognised for new and outstanding awards. The amendments are effective for annual periods commencing on or after 1 January 2018.
24 18 Audited Annual Financial Statements Notes to the group and company annual financial statements continued for the year ended 31 December 2. Standards and interpretations not yet effective for December continued Effective for the financial year commencing 1 January 2018 continued IFRS 9: Financial Instruments On 24 July 2014, the IASB issued the final IFRS 9: Financial Instruments Standard, which replaces earlier versions of IFRS 9 and completes the IASB s project to replace IAS 39: Financial Instruments: Recognition and Measurement. This standard will have an impact on the group, which will include changes in the measurement bases of the group s financial assets to amortised cost, fair value through other comprehensive income or fair value through profit or loss. Even though these measurement categories are similar to IAS 39, the criteria for classification into these categories are significantly different. In addition, the IFRS 9 impairment model has been changed from an incurred loss model from IAS 39 to an expected credit loss model, which could increase the provision for bad debts recognised in the group. The standard is effective for annual periods beginning on or after 1 January 2018 with retrospective application, early adoption is permitted. IFRS 15: Revenue from Contracts with Customers This standard replaces IAS 11: Construction Contracts, IAS 18: Revenue, IFRIC 13: Customer Loyalty Programmes, IFRIC 15: Agreements for the Construction of Real Estate, IFRIC 18: Transfer of Assets from Customers and SIC-31: Revenue Barter of Transactions Involving Advertising Services. The standard contains a single model that applies to contracts with customers and two approaches to recognising revenue: at a point in time or over time. The model features a contract-based five-step analysis of transactions to determine whether, how much and when revenue is recognised. This new standard will most likely have an impact on the group, which will include a possible change in the timing of when revenue is recognised and the amount of revenue recognised. The group is currently in the process of performing a more detailed assessment of the impact of this standard on the group. The standard is effective for annual periods beginning on or after 1 January 2018, with early adoption permitted under IFRS. Effective for the financial year commencing 1 January 2019 IFRS 16: Leases IFRS 16: Leases supersedes IAS 17: Leases; IFRIC 4: Determining whether an Arrangement contains a Lease; SIC-15: Operating Leases Incentives; and SIC-27: Evaluating the Substance of Transactions Involving the Legal Form of a Lease. IFRS 16 introduces a single lessee accounting model and requires all entities to reassess whether a contract is, or contains, a lease at the date of initial application. Lessees will have to recognise assets and liabilities for all leases with a term of more than 12 months, unless the underlying asset is of low value. A lessee is required to recognise a right-ofuse asset representing its right to use the underlying leased asset and a lease liability representing its obligation to make lease payments. A lessee measures right-of-use assets similarly to other non-financial assets (such as property, plant and equipment) and lease liabilities similarly to other financial liabilities. As a consequence, a lessee recognises depreciation of the right-of-use asset and interest on the lease liability, and also classifies cash repayments of the lease liability into a principal portion and an interest portion and presents them in the statement of cash flows applying IAS 7: Statement of Cash Flows. This standard will have an impact on the group s results; however, it is not expected to be material. The group is currently in the process of performing a more detailed assessment of the standard and the extent to which contracts currently accounted for as operating leases will result in additional assets and liabilities being recognised in the statement of financial position. 3 Significant accounting policies The principal accounting policies applied in the preparation of the group and company financial statements are set out on the following pages. These policies have been consistently applied from the comparative year presented. 3.1 Statement of compliance The annual financial statements are prepared in compliance with International Financial Reporting Standards (IFRS), the Companies Act 71 of 2008, SAICA Financial Reporting Guides as issued by the Accounting Practices Committee and financial pronouncements as issued by the Financial Reporting Standards Council relevant to its operations and effective for annual reporting periods beginning on or after 1 January. 3.2 Basis of preparation The annual financial statements have been prepared under the historical cost convention, as modified by the revaluation of: investments in equity instruments classified as available-for-sale. 3.3 Investments in subsidiaries, joint ventures and associates by the company The company accounts for all investments in subsidiaries, jointly controlled entities and associates at cost. Dividends received from subsidiaries, jointly controlled entities and associates are recognised in profit or loss when the company has the right to receive the dividend.
25 Notes to the group and company annual financial statements continued for the year ended 31 December Audited Annual Financial Statements Significant accounting policies continued 3.4 Basis of consolidation subsidiaries The group annual financial statements incorporate financial statements of the company and its subsidiaries. Subsidiaries are all investees (including structured entities) over which the group has control. The group controls an investee when it is exposed to or has rights to variable returns from its involvement with the investee and has the ability to affect those returns through its power over the investee. Subsidiaries are fully consolidated from the date on which control is transferred to the group. They are deconsolidated from the date that control ceases. Intercompany transactions, balances and unrealised gains and losses on transactions between group companies are eliminated. Accounting policies of subsidiaries have been changed where necessary to ensure consistency with the policies adopted by the group. 3.5 Interests in joint ventures A joint venture is a contractual arrangement whereby the parties that have joint control over the arrangement have rights to the net assets of the joint arrangement. Joint control is the contractually agreed sharing of control of an arrangement which exists only when the decision about the relevant activities requires the unanimous consent of the parties sharing control. Joint venture arrangements that involve the establishment of a separate entity in which each venturer has an interest are referred to as jointly controlled entities. The assets and liabilities of jointly controlled entities are incorporated in the group s annual financial statements using the equity method of accounting, except when the investment is classified as held-for-sale, in which case it is accounted for in accordance with IFRS 5: Non-current Assets Held for Sale and Discontinued Operations. Under the equity method, investments in joint ventures are carried in the consolidated statement of financial position at cost and adjusted for post-acquisition changes in the group s share of the net assets of the joint venture, less any impairment in the value of individual investments. The group s share of its jointly controlled entities post-acquisition profits or losses and other comprehensive income is recognised in the statement of comprehensive income and statement of other comprehensive income respectively and its share of postacquisition movements in reserves is recognised as reserves of the group. The cumulative post-acquisition movements are adjusted against the carrying amounts of the investment. Losses of a jointly controlled entity in excess of the group s interest in that entity (which includes any long-term interests that, in substance, form part of the group s net investment in the jointly controlled entity) are recognised only to the extent that the group has incurred legal or constructive obligations or made payments on behalf of the jointly controlled entity. Where a group entity transacts with a jointly controlled entity of the group, profits and losses are eliminated to the extent of the group s interest in the relevant jointly controlled entity. 3.6 Investments in associates An associate is an entity over which the group has significant influence and that is neither a subsidiary nor an interest in a joint venture. Significant influence is the power to participate in the financial and operating policy decisions of the investee, but is not control or joint control over those policies. The results and assets and liabilities of associates are incorporated in the annual financial statements using the equity method of accounting, except when the investment is classified as held-for-sale, in which case it is accounted for in accordance with IFRS 5: Non-current Assets Held for Sale and Discontinued Operations. Under the equity method, investments in associates are carried in the consolidated statement of financial position at cost and adjusted for post-acquisition changes in the group s share of the net assets of the associate, less any impairment in the value of individual investments.
26 20 Audited Annual Financial Statements Notes to the group and company annual financial statements continued for the year ended 31 December 3. Significant accounting policies continued 3.6 Investments in associates continued The group s share of its associates post-acquisition profits or losses is recognised in the statement of comprehensive income and its share of post-acquisition movements in reserves is recognised as reserves of the group. The cumulative post-acquisition movements are adjusted against the carrying amount of the investment. Losses of an associate in excess of the group s interest in that associate (which includes any long-term interests that, in substance, form part of the group s net investment in the associate) are recognised only to the extent that the group has incurred legal or constructive obligations or made payments on behalf of the associate. Where a group entity transacts with an associate of the group, profits and losses are eliminated to the extent of the group s interest in the relevant associate. 3.7 Segment reporting Operating segments are reported in a manner consistent with the internal reporting provided to the chief operating decision-maker. The chief operating decision-maker, who is responsible for allocating resources and assessing performance of the operating segments, has been identified as the executive committee of the group. 3.8 Foreign currency translation Functional and presentation currency Items included in the annual financial statements of each of the group s entities are measured using the currency of the primary economic environment in which the entity operates (its functional currency). The group s financial statements are presented in South African rand, which is the company s functional and presentation currency. Transactions and balances Foreign currency transactions are translated into the functional currency using the exchange rates prevailing at the dates of the transactions. Foreign exchange gains and losses resulting from the settlement of such transactions and from the translation at year-end exchange rates of monetary assets and liabilities denominated in foreign currencies are recognised as gains or losses in the statement of comprehensive income, except when deferred in equity as qualifying cash flow hedges. For available-for-sale financial assets, changes in the fair value of such monetary securities denominated in foreign currency are analysed between translation differences resulting from changes in the amortised cost of the security, and other changes in the carrying amount of the security. Translation differences are recognised in the statement of comprehensive income. Changes in carrying amounts on non-monetary securities are recognised in equity. Group companies The results and financial position of all the group entities that have a functional currency different from the presentation currency are translated into the presentation currency of the group as follows: Assets and liabilities for each reporting date presented are translated at the closing rate at the date of the statement of financial position Income and expenses for each reporting period are translated at average exchange rates for the reporting period All resulting exchange differences are recognised as a separate component of equity, within the translation of foreign operations reserve On consolidation, exchange differences arising from the translation of the net investment in foreign operations are disclosed in the statement of comprehensive income and are taken to shareholders equity.
27 Notes to the group and company annual financial statements continued for the year ended 31 December Audited Annual Financial Statements Significant accounting policies continued 3.9 Property, plant and equipment Property, plant and equipment are recorded at cost less accumulated depreciation and impairment. Cost includes professional fees and, for assets constructed by the group and company, any related works to the extent that these are directly attributable to the acquisition or construction of the asset. Property, plant and equipment, except land, are depreciated using the straight-line method over the useful lives of the related assets. Major improvements, which are expected to generate future economic benefits over more than one reporting period, are capitalised, while repairs and maintenance are charged as an expense when incurred. Where a tangible fixed asset comprises major components having different useful lives, these components are accounted for as separate items. Property, plant and equipment under construction are recorded as assets under construction until they are ready for their intended use; thereafter they are transferred to the related category of property, plant and equipment and depreciated over their estimated useful lives. Qualifying borrowing costs incurred during construction are capitalised. Gains and losses on retirement or disposal of assets are reflected in the statement of comprehensive income Accounting for finance leases as lessee Finance lease arrangements consist of those transactions that are: Leases in both economic substance and legal form Those that arise out of commercial arrangements that in economic substance represent leases, though not in legal form The group and company lease certain property, plant and equipment. Leases of property, plant and equipment where the group and company have substantially all the risks and rewards of ownership are classified as finance leases. Finance leases are capitalised at the lower of the fair value of the leased property, plant and equipment and the present value of the future minimum lease payments of the lease. Each lease payment is allocated between the liability and finance charges so as to achieve a constant rate on the capital balance outstanding, using the effective interest rate method. The corresponding rental obligations, net of finance charges, are shown as finance lease obligations. The interest element of the finance cost is charged to the statement of comprehensive income over the lease period. The property, plant and equipment acquired under finance leases are depreciated over the shorter of the useful life of the asset and the lease term. Finance lease obligations with settlement tenures greater than 12 months after the statement of financial position date, are classified as non-current finance lease obligations, while those to be settled within 12 months of the statement of financial position date are classified as current finance lease obligations Intangible assets Internally generated intangible assets research and development Research expenditure is recognised as an expense when incurred. Costs incurred on development projects (relating to the design and testing of new or improved products) are recognised as intangible assets when the criteria of IAS 38: Intangible Assets are met. Other development expenditures that do not meet these criteria are recognised as an expense when incurred. Development assets are tested for impairment annually, in accordance with IAS 36: Impairment of Assets. Purchased intangible assets other than goodwill Patents The cost of acquisition of patents, is capitalised at their historical cost as intangible assets, and amortised over the right-of-use period. This period is reviewed at least annually. Amortisation, gains and losses on disposals and impairment losses are reflected in the statement of comprehensive income. Non-integrated computer software Acquired computer software licences are capitalised on the basis of the costs incurred to acquire and bring into use the specific software. These costs are amortised over their estimated useful lives. Computer software development costs recognised as assets are amortised over their estimated useful lives, typically not exceeding seven years.
28 22 Audited Annual Financial Statements Notes to the group and company annual financial statements continued for the year ended 31 December 3. Significant accounting policies continued 3.12 Impairment of tangible and intangible assets excluding goodwill At each statement of financial position date, the group and company review the carrying amounts of tangible and intangible assets to determine whether there is any indication that those assets have suffered an impairment loss. If any such indication exists, the recoverable amount of the asset is estimated in order to determine the extent of the impairment loss (if any). In order to ensure completeness of the impairment assessment of individual assets, all tangible assets and intangible assets are allocated to the cash-generating unit to which they belong. An impairment assessment is then undertaken on the individual cash-generating units. Recoverable amount is defined as the higher of fair value less costs to sell and value-in-use. In assessing value-in-use, the estimated future cash flows are discounted to their present value using a post-tax discount rate that reflects the weighted average cost of capital of the company. Where an impairment loss subsequently reverses, the carrying amount of the asset (cash-generating unit) is increased to the revised estimate of its recoverable amount, but so that the increased carrying amount does not exceed the carrying amount that would have been determined had no impairment loss been recognised for the asset (cash-generating unit) in prior years. A reversal of an impairment loss is recognised immediately in the statement of comprehensive income Financial assets Financial assets are recognised and derecognised on the trade date where the purchase or sale of the asset is under a contract whose terms require delivery within the timeframe established by the market concerned. These assets are initially measured at fair value, net of transaction costs except for those financial assets classified as fair value through profit-or-loss (FVTPL), which are initially measured at fair value. Financial assets are classified into the following specified categories: Financial assets at FVTPL Available-for-sale (AFS) financial assets Loans and receivables Financial assets at FVTPL Financial assets at FVTPL are stated at fair value, with any resultant gain or loss recognised in the statement of comprehensive income. AFS financial assets Listed shares and similar securities held by the group and company that are traded in an active market are classified as being AFS and are stated at fair value. Loans and receivables Trade receivables, loans and other receivables that have fixed or determinable payments that are not quoted in an active market are classified as loans and receivables. Loans and receivables are measured at amortised cost using the effective interest rate method less any impairment.
29 Notes to the group and company annual financial statements continued for the year ended 31 December Audited Annual Financial Statements Significant accounting policies continued 3.13 Financial assets continued Impairment of financial assets A financial asset is considered to be impaired if there is objective evidence that one or more events has/have had a negative effect on the estimated future cash flows of that asset. Estimated future cash flows are determined using various assumptions and techniques, including comparisons with published prices in an active market, comparative price-earnings multiples and discounted cash flow projections using projected growth rates, weighted average cost of capital and inflation rates. In the case of AFS listed equity instruments, a significant or prolonged decline in the fair value of the security below its cost is considered an indicator that the securities are impaired. If any such evidence exists for these financial assets, the cumulative loss measured as the difference between the acquisition cost and the current fair value less any impairment loss on that financial asset previously recognised in the statement of comprehensive income, is removed from equity and recognised in the statement of comprehensive income. If objective evidence indicates that cost-method investments need to be tested for impairment, calculations are based on information derived from business plans and other information available for estimating their value-in-use. Any impairment loss is charged to the statement of comprehensive income. An impairment loss related to financial assets is reversed if and to the extent that there has been a change in the estimates used to determine the recoverable amount. The loss is reversed only to the extent that the asset s carrying amount does not exceed the carrying amount that would have been determined if no impairment loss had been recognised. Reversals of impairment are recognised in the statement of comprehensive income except for reversals of impairment of AFS equity securities, which are recognised in equity Financial liabilities and equity instruments issued by the group and company Classification as debt or equity Debt and equity instruments are classified as either financial liabilities or as equity in accordance with the substance of the contractual arrangement. Equity instruments An equity instrument is any contract that evidences a residual interest in the assets of an entity after deducting all of its liabilities. Equity instruments are recorded at the proceeds received, net of direct issue costs. Financial liabilities Financial liabilities are classified as either financial liabilities at FVTPL or other financial liabilities. Financial liabilities at FVTPL are stated at fair value, with any resultant gain or loss recognised in profit or loss. The net gain or loss recognised in profit or loss incorporates any interest paid on the financial liability. Other financial liabilities Other financial liabilities, including borrowings and finance lease obligations, are initially measured at fair value, net of transaction costs. Subsequently these are measured at amortised cost using the effective interest rate method, with interest expense recognised on an effective yield basis.
30 24 Audited Annual Financial Statements Notes to the group and company annual financial statements continued for the year ended 31 December 3. Significant accounting policies continued 3.15 Derivative financial instruments Derivatives are initially recognised at fair value at the date a derivative contract is entered into and are subsequently remeasured to their fair value at each statement of financial position date. The resulting gain or loss is recognised in profit or loss immediately unless the derivative is designated and effective as a hedging instrument, in which event the timing of the recognition in profit or loss depends on the nature of the hedge relationship. The group and company designate certain derivatives as either hedges of the fair value of recognised assets, liabilities or firm commitments (fair value hedges), or hedges of highly probable forecast transactions or hedges of foreign currency risk of firm commitments (cash flow hedges). Hedges are accounted for as prescribed in IAS 39: Financial Instruments: Recognition and Measurement Inventories Inventories are carried at the lower of cost and net realisable value. Cost is determined using the first-in, first-out (FIFO) method or weighted average cost method. Work-in-progress and finished goods include the purchase costs of raw materials and conversion costs such as direct labour and an allocation of fixed and variable production overheads. Raw materials, qualifying spare parts and consumables are valued at cost inclusive of freight, shipping and handling costs. Net realisable value represents the estimated selling price at which the inventories can be realised in the normal course of business after allowing for the cost of conversion from their existing state to a finished condition and for the cost of marketing, selling and distribution. Costs incurred when production levels are abnormally low are partially capitalised as inventories and partially recorded as a component of cost of sales in the statement of comprehensive income Cash and cash equivalents Cash and cash equivalents include cash on hand, deposits held on call with banks, and other short-term highly liquid investments with original maturities of three months or less, which are subject to an insignificant risk of changes in value, less any bank overdrafts Stated capital Equity instruments issued by the company and group are classified according to the substance of the contractual arrangements entered into and the definition of an equity instrument. An equity instrument is any contract that evidences a residual interest in the assets of the company and group after deducting all liabilities. Ordinary shares are classified as equity. Incremental costs directly attributable to the issue of new shares or portions are shown in equity as a deduction, net of tax effects, from the proceeds. Where any group company purchases the company s equity share capital (treasury shares), the consideration paid, including any directly attributable incremental costs (net of income taxes), is recognised in an equity reserve attributable to the company s equity holders until the shares are cancelled or reissued. Where such shares are subsequently reissued, any consideration received (net of any directly attributable incremental transaction costs and the related income tax effects) is included in equity attributable to the company s equity holders. Capital distributions to shareholders through capital reduction programmes are credited against stated capital. Income tax consequences of such and similar transactions are charged to profit or loss and not stated capital.
31 Notes to the group and company annual financial statements continued for the year ended 31 December Audited Annual Financial Statements Significant accounting policies continued 3.19 Borrowings Borrowings are recognised initially at cost, which typically reflects the fair value of the funding transaction. Borrowings are subsequently measured at amortised cost. Borrowings are classified as current liabilities unless the group and company have an unconditional right to defer settlement of the liability for at least 12 months after the statement of financial position date Deferred income tax Deferred income tax is provided in full, using the liability method, on temporary differences arising between the tax bases of assets and liabilities and their carrying amounts in the group and company annual financial statements. Deductible temporary differences are therefore recognised to the extent that taxable temporary differences exist or it is probable that taxable economic benefits will flow to the entity. Deferred income tax assets are recognised to the extent that it is probable that future taxable profit will be available against which the temporary differences can be utilised Employee benefits Short-term employee benefits Services rendered by employees during a reporting period, are recognised as the undiscounted amount of short-term employee benefits expected to be paid in exchange for that service as a liability, after deducting any amount already paid; and as an expense, unless included in the cost of inventory or property, plant and equipment. The cost of all short-term employee benefits, such as salaries, bonuses, housing allowances, medical and other contributions is recognised during the period in which the employee renders the related service. Short-term compensated absences (leave pay benefits) The expected cost of short-term employee benefits in the form of compensated absences are recognised (i) in the case of accumulating compensated absences, when the employees render service that increase their entitlement to future compensated absences; and (ii) in the case of non-accumulating compensated absences, when the absences occur. The leave pay benefits of the group and company are accumulative in nature and entail automatic encashment of the benefits once the entitlements reach an accumulation limit. Retirement benefits Defined contribution plans are plans where fixed contributions to pension funds for certain categories of employees are paid. Contributions are paid in return for services rendered by the employees during the period. Such payments are expensed as they are incurred in line with the treatment of short-term employee benefits. No provisions are established in respect of defined contribution plans, as they do not generate future commitments. Defined benefit plans are those plans that provide guaranteed benefits to certain categories of employees, by way of contractual obligations. The group s net obligation in respect of defined benefit plans is calculated separately for each plan by estimating the amount of future benefit that employees have earned in the current and prior periods, discounting that amount and deducting the fair value of any plan assets. The calculation of significant defined benefit obligations is performed annually by a qualified actuary using the projected unit credit method. When the calculation results in a potential asset for the group, the recognised asset is limited to the present value of economic benefits available in the form of any future refunds from the plan or reductions in future contributions to the plan. To calculate the present value of economic benefits, consideration is given to any applicable minimum funding requirements. Remeasurements of the net defined benefit liability, which comprise actuarial gains and losses, the return on plan assets (excluding interest) and the effect of the asset ceiling are recognised immediately in other comprehensive income. The group determines the net interest expense (income) on the net defined benefit liability (asset) for the period by applying the discount rate used to measure the defined benefit obligation at the beginning of the annual period to the net defined benefit liability (asset) during the period as a result of contributions and benefit payments. Net interest expense and other expenses related to defined benefit plans are recognised in comprehensive income.
32 26 Audited Annual Financial Statements Notes to the group and company annual financial statements continued for the year ended 31 December 3. Significant accounting policies continued 3.21 Employee benefits continued Retirement benefits continued When the benefits of a plan are changed or when a plan is curtailed, the resulting change in benefit that relates to past service or the gain or loss on curtailment is recognised immediately in comprehensive income. The group recognises gains and losses on the settlement of a defined plan when the settlement occurs. Medical benefits No contributions are made to the medical aid of retired employees, except for a closed group of early retirees in respect of whom contributions are made. The present value of the post-retirement medical aid obligation for such early retirements is actuarially determined annually on the projected unit credit method and any deficit or surplus is immediately recognised in profit or loss. Termination benefits Termination benefits are payable whenever an employee s employment is terminated before the normal retirement date or whenever an employee accepts voluntary redundancy in exchange for these benefits. The group and company recognise termination benefits when demonstrably committed to either: Terminate the employment of current employees according to a detailed formal plan without possibility of withdrawal or Provide termination benefits as a result of an accepted offer made to encourage voluntary redundancy in exchange for these benefits 3.22 Provisions and contingent liabilities Provisions Provisions for asset retirement obligations, environmental remediation obligations, onerous contracts, restructuring costs, legal claims and similar obligations are recognised when: A present legal or constructive obligation exists as a result of past events It is probable that an outflow of resources will be required to settle the obligation The amount has been reliably estimated Provisions are measured at the present value of the expenditures expected to be required to settle the obligation using a pre-tax discount rate that reflects current market assessments of the time value of money and the risks specific to the obligation. The increase in provisions due to the passage of time is recognised as accretion expenses within finance charges. Changes in the discount rate are recognised as finance charges, except for asset retirement obligations which are capitalised to property, plant and equipment. Contingent liabilities Legal claims are assessed to determine whether a present obligation exists and whether the obligations are measurable. A present obligation, classified as a provision, is recognised as probable and is measured at the estimated loss of the outcome if it is more than 50% likely to occur. For claims that are reasonably possible, being between 20% and 50% likely, the facts and circumstances of the possible loss and an estimate of the amount, if determinable, are disclosed. Remote claims, being less than 20% likely, are not disclosed or provided for; however, voluntary disclosure may be made if the matter is significant.
33 Notes to the group and company annual financial statements continued for the year ended 31 December Audited Annual Financial Statements Significant accounting policies continued 3.23 Revenue recognition Sale of goods Revenue comprises the fair value of the consideration received or receivable for the sale of goods in the ordinary course of the group and company s activities. Revenue is shown net of value added tax, returns, rebates, discounts and, in the case of the group accounts, after eliminating sales within the group. All amounts invoiced to a customer in a sale transaction related to distribution and handling costs are classified as revenue, with the costs related thereto shown as distribution and handling costs within other operating expenses. The group and company recognise revenue when the amount of revenue can be reliably measured, when it is probable that future economic benefits will flow to the entity and when specific criteria have been met for each of the group and company s activities as described below. The amount of revenue is not considered to be reliably measurable until all contingencies relating to the sale have been resolved. The group and company base such estimates on historical results, taking into consideration the type of customer, the type of transaction and the specifics of each arrangement. Sales of goods are recognised based on the relevant delivery terms at which point the risks of obsolescence and loss have been transferred to the customer and either the customer has accepted the products in accordance with the sales contract or the group and company have objective evidence that all criteria for acceptance have been satisfied Operating leases Operating lease payments are recognised as an expense on a straight-line basis over the lease term, except where another systematic basis is more representative of the time pattern in which economic benefits from the leased asset are consumed. Contingent rentals arising under operating leases are recognised as an expense in the period in which they are incurred and are not straight-lined Borrowing costs Qualifying borrowing costs calculated in accordance with the effective interest rate method and directly attributable to the acquisition, construction or production of qualifying assets, for those assets that necessarily take a substantial period of time to get ready for their intended use or sale, are added to the cost of those assets, until such time as the assets are substantially ready for their intended use or sale. All other borrowing costs are recognised in the statement of comprehensive income in the period incurred Share-based payments Equity-settled share-based payments Equity-settled share-based payments to employees and others providing similar services are measured at the fair value of the equity instruments at the grant date. Fair value determination of equity-settled share-based transactions is measured using the share price as reference point. The fair value determined at the grant date of the equity-settled share-based payments is expensed on a straight-line basis over the vesting period, based on the group and company s estimate of the number of equity instruments that will eventually vest. At each statement of financial position date, the group and company revise their estimate of the number of equity instruments expected to vest. The impact of the revision of the original estimates, if any, is recognised in profit or loss over the remaining vesting period, with a corresponding adjustment to the equity-settled employee benefits reserve. Cash-settled share-based payments For cash-settled share-based payments, a liability equal to the portion of goods or services received is recognised as the current fair value at each date of the statement of financial position. Vesting conditions Vesting conditions are service conditions and performance conditions only. Other features of a share-based payment are not vesting conditions. Features of a share-based payment that are not vesting conditions are included in the grant date fair value of the share-based payment. The fair value also includes market-related vesting conditions.
34 28 Audited Annual Financial Statements Notes to the group and company annual financial statements continued for the year ended 31 December 3. Significant accounting policies continued 3.27 Taxation Income tax expense represents the sum of the current tax and deferred tax. Current tax The current tax is based on taxable income or loss for the year. Taxable income or loss differs from income or loss as reported in the statement of comprehensive income because it excludes items of income or expense that are taxable or deductible in other years and it further excludes items that are never taxable or deductible (deferred tax). The liability for current tax is calculated using tax rates that have been enacted or substantively enacted by the date of the statement of financial position. Withholding tax on dividends Dividends received subject to withholding tax are shown inclusive of any withholding tax. The withholding tax amount is included in the tax charge for the reporting period Dividend distribution Dividend distribution to the company s shareholders is recognised as a liability in the period in which the dividends are approved by the company s board of directors Offset Where a legally enforceable right to offset exists for recognised financial assets and financial liabilities, and there is an intention to settle the liability and realise the asset simultaneously or to settle on a net basis, all related financial effects are offset. 4. Segment report Segment information is presented only at group level, where it is most meaningful. Operating segments are identified on the basis of internal reports about components of the group that are regularly reviewed by the chief operating decision-makers (the executive committee) in order to allocate resources to the segment and to assess its performance. The group s reportable segments are: Flat steel products consisting of the Vanderbijlpark Works and Saldanha Works Long steel products consisting of the Newcastle Works, Vereeniging Works and the decommissioned Maputo Works Coke and Chemicals undertaking the processing and marketing of by-products and the production and marketing of commercial-grade coking coal Corporate and other, consisting of sales and marketing functions, procurement and logistics activities, shared services, centres of excellence, the decommissioned Pretoria Works site, available-for-sale investments and the results of the non-trading consolidated subsidiaries and consolidated structured entities Segment profit/(loss) from operations represents the profit/(loss) earned/(incurred) by each segment without the allocation of after-tax profits of equity-accounted investments, net interest income, income from investments and income tax expenses. All assets and liabilities are allocated to the operating segments, other than for the following items that are allocated exclusively to the corporate and other segment, reflecting the manner in which resource allocation is measured. Assets not allocated to operating segments: Results of consolidated subsidiaries and consolidated structured entities, other than for Saldanha Works which is a subsidiary allocated to the Flat steel products segment Investments in equity-accounted entities Available-for-sale investments Cash and cash equivalents Income tax, capital gains tax and value added tax-related assets, as applicable Liabilities not allocated to operating segments: Income tax Capital gains tax Value added tax-related liabilities, as applicable
35 Notes to the group and company annual financial statements continued for the year ended 31 December Audited Annual Financial Statements Segment report continued For the year ended 31 December Flat steel products Long steel products Coke and Chemicals Corporate and other Total reconciling Adjustments to the and consolidated eliminations 1 amounts Revenue External customers Intersegment customers (887) Total revenue (887) Revenue to external customers distributed as: Local Export Africa Asia Other Total Results Earnings before interest, tax, depreciation and amortisation (392) (16) 190 Depreciation and amortisation (656) (390) (35) (22) 48 (1 055) Thabazimbi mine closure costs (194) (81) (275) Competition Commission settlement Derecognised payment in advance (19) (19) Unclaimed dividends (Loss)/profit from operations (1 242) (185) (1 092) B-BBEE charges (870) (870) Impairment (2 141) (2) (11) (2 154) Finance and investment income Finance costs (117) (146) (7) (605) (876) Profit after tax from equity-accounted investments (Loss)/profit before taxation (3 483) (293) 130 (1 073) 32 (4 687) Income tax expense (19) (19) (Loss)/profit for the year (3 483) (293) 130 (1 092) 32 (4 706) Segment assets (excluding investments in equity-accounted entities) (528) Investments in equity-accounted entities Segment liabilities Cash (utilised in)/generated from operations (395) (371) Capital expenditure (69) Number of employees at the end of the year Adjustments and eliminations comprise intergroup eliminations and fair value adjustments on consolidation of subsidiaries.
36 30 Audited Annual Financial Statements Notes to the group and company annual financial statements continued for the year ended 31 December 4. Segment report continued For the year ended 31 December Flat steel products Long steel products Coke and Chemicals Corporate and other Adjustments and eliminations 1 Total reconciling to the consolidated amounts Revenue External customers Intersegment customers (1 437) Total revenue (1 437) Revenue to external customers distributed as: Local Export Africa Asia Other Total Results Earnings before interest, tax, depreciation and amortisation (1 269) (348) 427 (1 131) (809) Depreciation and amortisation (973) (391) (35) (20) 50 (1 369) Thabazimbi mine closure costs (429) (253) (682) Provision for Tshikondeni mine closure costs Vereeniging closure costs (86) (86) Competition Commission settlement (1 245) (1 245) Payment in advance (420) (148) (568) (Loss)/profit from operations (3 091) (1 226) 392 (2 373) (4 736) Impairment (3 574) (370) (2 570) (4 254) Finance and investment income Finance cost (117) (38) (2) (1 051) (1 208) Profit after tax from equity-accounted investments (Loss)/profit before taxation (6 780) (1 633) 390 (5 627) (9 828) Income tax credit (Loss)/profit for the year (6 780) (1 633) 390 (4 434) (8 635) Segment assets (excluding investments in equity-accounted entities) (1 000) Investments in equity-accounted entities Segment liabilities (2) Cash generated from operations (1 270) (264) Capital expenditure (27) Number of employees at the end of the year Adjustments and eliminations comprise intergroup eliminations and fair value adjustments on consolidation of subsidiaries.
37 Notes to the group and company annual financial statements continued for the year ended 31 December Audited Annual Financial Statements Segment report continued 4.1 Revenue from major products and services The group s revenue from its major products sold to external customers was: Flat steel products Plate Hot rolled coil Cold rolled coil Galvanised sheet Coated sheet Tin plate Other Long steel products Billets and blooms Bars and rebars Wire rod Sections Rails Seamless tubular products Forged Other Coke and Chemicals Coke Tar Other Total consolidated revenue Geographical information The group operates principally in South Africa. Export sales are primarily sold into sub- Saharan Africa and Asia. 4.3 Information about major customers Segmentation of the group s top three customers, as measured on total revenue, is: Flat steel products Long steel products Total revenue attributable to top three customers Expressed as a % of total consolidated revenue (%) Of these top three customers only, Macsteel contributes more than 10% to total revenue Expressed as a % of total consolidated revenue (%) 15 16
38 32 Audited Annual Financial Statements Notes to the group and company annual financial statements continued for the year ended 31 December Group Company 5. Loss from operations Loss from operations has been arrived at after charging: Amortisation of intangible assets (25) (23) (22) (20) Depreciation (1 030) (1 346) (959) (986) Employee costs (4 175) (4 027) (4 174) (4 026) Salaries and wages (3 620) (3 284) (3 619) (3 283) Termination benefits (14) (232) (14) (232) Pension and medical costs (478) (456) (478) (456) Share-based payment expense (63) (55) (63) (55) Profit/(loss) on disposal or scrapping of property, plant and equipment 51 (5) 52 (2) Operating lease rentals (50) (50) (48) (49) Railage and transport (1 069) (994) (968) (887) Repairs and maintenance (2 530) (2 358) (2 032) (1 876) Research and development costs (143) (152) (143) (152) Reversal/(write-down) of inventory to net realisable value 59 (187) (60) (57) Auditors remuneration (16) (15) (15) (13) Audit fees (15) (12) (14) (11) Other services and expenses (1) (3) (1) (2) Allowance for doubtful debts recognised on trade receivables (2) 10 (2) 10 Other allowances on trade receivables (39) (48) (39) (48) Included in raw materials and consumables used is R176 million relating to the estimated impact of discounting.
39 Notes to the group and company annual financial statements continued for the year ended 31 December Audited Annual Financial Statements 33 Group Company 6. Finance and investment income Finance income Bank deposit and other interest income Discount rate adjustment of the provisions Investment income Dividends received Interest received from jointly controlled entities Total Finance costs Interest expense on bank overdrafts and loans (493) (515) (487) (514) Interest expense on finance lease obligations (32) (39) (17) (22) Net foreign exchange losses on financing activities (35) (437) (22) (412) Unwinding of the discounting effect on provisions (316) (217) (311) (213) Total (876) (1 208) (837) (1 161) No borrowing costs qualified for capitalisation during the current or comparative year.
40 34 Audited Annual Financial Statements Notes to the group and company annual financial statements continued for the year ended 31 December Group Company 8. Impairment of other assets Impairment of equity-accounted investments (11) (8) (3) (8) Impairment of investment in subsidiaries (1 326) (3 611) Impairment of non-current asset held-for-sale (302) (308) Reversal of impairment Total (11) (310) (1 165) (2 260) Impairment of equity-accounted investments The impairment loss of R11 million at group represents R8 million relating to the write off of loans advanced to Coza Mining Proprietary Limited that are not recoverable and R3 million relating to the impairment of the investment in Microsteel Proprietary Limited. In the investment in ArcelorMittal Analytical Laboratories Proprietary Limited, a joint venture with Coal of Africa Ltd of R8 million was impaired. Impairment of investment in subsidiaries The impairment reversal of R164 million (: R1 667 million), relates to the investment in Vicva Investments and Trading Nine Proprietary Limited that was measured at fair value and reverses a previously recognised impairment loss. In, 4.7% of the treasury shares held by Vicva were sold during the year for the purposes of the employee share ownership plan. In total, R1 667 million became recoverable and the impairment previously recognised was reversed. The investment in Saldanha Steel Proprietary Limited was impaired by R1 320 million (: R2 731 million) to the value in use of the cash-generating unit which was its recoverable amount (refer to note 12 for significant judgements made). Impairment losses of R6 million (: R6 million) relate to the impairment of the loan to subsidiary Oakwood Trading Proprietary Limited that is not recoverable. Non-current asset held-for-sale In, the investment in Coza Mining Proprietary Limited of R308 million at company and R302 million at group was written down to its recoverable amount (value-in-use) of Rnil. The investment was impaired primarily due to depressed iron ore prices. The investment was subsequently reclassified to equity-accounted investments because it no longer met the definition of a non-current asset held-for-sale in terms of IFRS 5: Non-current Assets Held for Sale.
41 Notes to the group and company annual financial statements continued for the year ended 31 December Audited Annual Financial Statements 35 Group Company 9. Income tax credit Income tax recognised in profit or loss Current tax expense (4) 2 Adjustments recognised in the current year in relation to the current tax of prior years (15) (11) (19) (11) 2 Deferred tax income relating to the origination and reversal of temporary differences Adjustment recognised in the current year in relation to the deferred tax of prior years (61) (66) Withholding tax on foreign dividend and securities transfer tax (11) (5) Total (19) (11) 106 The total charge for the year can be reconciled to the accounting profit as follows: Loss before taxation (4 687) (9 828) (4 715) (8 997) Income tax credit calculated at 28% Effect of income that is non-taxable/exempt Ferrosure Isle of Man income received Other exempt income Effect of expenses that are not deductible (365) (445) (695) (983) Broad-based black economic empowerment deal (257) (257) Competition Commission administrative penalty (22) (349) (22) (349) Environmental provisions (107) 3 (107) 3 Other non-deductible expenses 21 (99) (309) (637) Effect of taxable income imputed from controlled foreign companies (76) (16) (76) (16) Effect of (i) equity-accounted investments disclosed net of tax on the statement of comprehensive income; and (ii) the effect of different tax rates of subsidiaries operating in other jurisdictions Adjustments recognised in the current year in relation to the current tax and deferred tax of the prior year (15) (61) (11) (66) Deferred tax income relating to the origination and reversal of temporary differences (346) (291) Effect of timing differences not recognised in the current year in relation to unrecognised deferred tax asset (663) (1 564) (399) (1 378) VAT interest and penalties 2 3 Withholding tax on foreign dividend and securities transfer tax (11) (5) Total income tax (expense)/credit (19) (11) 106 Taxation as a percentage of loss before taxation (%) 0.40 (12.10) 0.20 (1.20) The effective tax rate of 0.4% (compared to the statutory rate of 28%) for the year ended 31 December is primarily as a result of not recognising the deferred tax asset on the available income tax losses and the impact of income tax recognised in relation to foreign controlled companies. This reduces the effective tax rate by approximately 98.6%. Management believes that the turnaround initiatives will result in the company returning to profitability at some point in the future. However, based on considerations presented, management believes it is premature to conclude at this stage that it is more likely than not for sufficient future taxable profits to be available against which the full proposed deferred tax asset can be utilised. The effective tax rate of negative 12.1% (compared to the statutory rate of 28%) for the year ended 31 December is primarily as a result of not recognising the deferred tax asset on the available tax losses reducing the effective tax to a receivable position.
42 36 Audited Annual Financial Statements Notes to the group and company annual financial statements continued for the year ended 31 December 9. Income taxation credit continued Deferred income tax liability Deferred tax liabilities/(assets) arise from the following: Group Property, plant, equipment and intangible assets Employee costs Temporary differences Provisions Doubtful debts Finance lease obligations Other Unused tax losses and credits Temporary differences At the beginning of the year (653) (467) (9) (72) (144) (705) Charged to income (468) (3) 18 (434) 370 At the end of the year (160) (442) (12) (54) (578) (336) Temporary differences At the beginning of the year (40) (546) (7) (97) (32) (1 227) Charged to income (1 103) (613) 79 (2) 25 (112) 522 (1 204) At the end of the year (653) (467) (9) (72) (144) (705) Total Company Property, plant, equipment and intangible assets Employee costs Temporary differences Provisions Doubtful debts Finance lease obligations Other Unused tax losses and credits Temporary differences At the beginning of the year (654) (451) (7) (44) (84) (730) Charged to income (414) (5) 14 (427) 322 At the end of the year (160) (434) (12) (30) (511) (408) Temporary differences At the beginning of the year (40) (537) (7) (66) (11) (1 227) 108 Charged to income (27) (614) (73) 497 (108) At the end of the year (654) (451) (7) (44) (84) (730) Total Group Company Unrecognised deferred tax losses Management believes that the turnaround initiatives will result in the company and group returning to profitability but also considers the timing and uncertainty of these initiatives. With the difficulty of accurately measuring the possible future effects, management believes it is premature to conclude at this stage that it is more likely than not for sufficient future taxable profits to be available against which the full proposed deferred tax asset can be utilised. Therefore, the recognition of the deferred tax asset is capped to the availability of deferred tax liabilities at the reporting date.
43 Notes to the group and company annual financial statements continued for the year ended 31 December Audited Annual Financial Statements Loss per share Basic loss per share is calculated by dividing loss attributable to the owners of the company by the weighted average number of ordinary shares, after taking the effects of the rights issue and the B-BBEE transaction into account. Where appropriate adjustments are made in calculating diluted loss, headline and diluted headline loss per share Loss attributable to owners of the company () (4 706) (8 635) Weighted average number of shares Basic loss per share (cents) (443) (2 152) Diluted loss per share is calculated by dividing the loss attributable to the owners of the company by the weighted average number of ordinary shares, held by third parties increased by the number of additional ordinary shares that would have been outstanding assuming the conversion of all outstanding share options/long-term incentive plan units representing dilutive potential ordinary shares. The B-BBEE transaction does not have a dilutive impact on the group shareholding. Loss attributable to owners of the company (4 706) (8 635) Weighted average number of diluted shares Diluted loss per share (cents) (443) (2 152) The calculation for headline loss per share is based on the basic loss per share calculation, reconciled as follows: Headline loss per share Gross Loss before tax (4 687) (9 828) Add: Impairment charges of property, plant and equipment Add: Impairment of investments in joint ventures and associates 11 Add: Loss on disposal or scrapping of property, plant and equipment 5 Less: Profit on disposal or scrapping of property, plant and equipment (51) Headline loss before tax (2 584) (5 569) Net of tax Loss attributable to owners of the company (4 706) (8 635) Add: Impairment charges of property, plant and equipment Add: Impairment of investments in joint ventures and associates 11 Add: Loss on disposal or scrapping of property, plant and equipment 4 Less: Profit on disposal or scrapping of property, plant and equipment (37) Headline loss net of tax (2 589) (5 370) Headline loss per share (cents) Basic (244) (1 338) Diluted (244) (1 338) The weighted average number of shares used in the computation of diluted earnings per share was determined as follows: Shares in issue held by third parties Weighted average number of shares Weighted average number of diluted shares Dividend per share Consistent with the group s dividend policy (payment of any dividend is subject to the discretion of the board. It will depend upon our earnings, financial condition, cash availability and capital requirements to sustain the business and support future growth). No dividends were declared for the and financial years. Group
44 38 Audited Annual Financial Statements Notes to the group and company annual financial statements continued for the year ended 31 December 12. Property, plant and equipment Land and buildings Buildings and infrastructure Machinery, plant and equipment Site preparation Group Asset retirement obligation Leased assets Construction in progress For the year ended 31 December Carrying amount at the beginning of the year Additions Disposals (6) (12) (18) Depreciation (48) (925) (1) (2) (54) (1 030) Impairment (16) (159) (1 959) (2 134) Other movements (2) (315) Carrying amount at the end of the year At 31 December Cost Accumulated depreciation and impairment (19) (1 916) (24 063) (83) (204) (4 914) (5) (31 204) Net carrying amount For the year ended 31 December Carrying amount at the beginning of the year Additions Disposals (12) (12) Depreciation (76) (1 210) (2) (1) (57) (1 346) Impairment (1) (177) (3 752) (5) (3 935) Other movements (193) Carrying amount at the end of the year At 31 December Cost Accumulated depreciation and impairment (3) (1 717) (21 496) (82) (202) (4 860) (5) (28 365) Net carrying amount Total
45 Notes to the group and company annual financial statements continued for the year ended 31 December Audited Annual Financial Statements Property, plant and equipment continued Company Land and buildings Buildings and infrastructure Machinery, plant and equipment Site preparation Asset retirement obligation Leased assets Construction in progress For the year ended 31 December Carrying amount at the beginning of the year Additions Disposals (6) (11) (17) Depreciation (45) (866) (1) (47) (959) Impairment (12) (150) (1 552) (1 714) Other movements (169) Carrying amount at the end of the year At 31 December Cost Accumulated depreciation and impairment (12) (1 545) (13 734) (81) (198) (4 739) (5) (20 333) Net carrying amount For the year ended 31 December Carrying amount at the beginning of the year Additions Disposals (11) (11) Depreciation (73) (861) (2) (50) (986) Impairment (22) (343) (5) (370) Other movements (127) Carrying amount at the end of the year At 31 December Cost Accumulated depreciation and impairment (1 354) (11 544) (80) (198) (4 692) (5) (17 873) Net carrying amount Total Land register and asset pledges A register of land is available for inspection at the registered office of the company. The group and company have not pledged property, plant and equipment to secure banking facilities granted. Critical judgements and estimates Useful lives and residual values of property, plant and equipment and intangible assets The estimates of depreciation and amortisation rates and the residual lives of the assets are reviewed annually taking cognisance of: Forecast commercial and economic realities Benchmarking within the greater ArcelorMittal group
46 40 Audited Annual Financial Statements Notes to the group and company annual financial statements continued for the year ended 31 December 12. Property, plant and equipment continued The useful lives of the classes of machinery, plant and equipment reflect current estimated life over which the group has the ability and intention to use such assets. Useful life range Land Buildings Steel plant equipment Other facilities Vehicles and general equipment Non-integrated software Patents These useful lives represent management s current best estimates. Not depreciated 10 to 50 years 15 to 30 years 15 to 30 years 5 to 20 years 1 to 50 years 20 years Impairment of assets An impairment indicator assessment was performed on all cash-generating units (CGUs) of the group. Following this assessment, an impairment test was performed on all CGUs. In accordance with IAS 36: Impairment of Assets, an asset is impaired if the carrying amount of the asset is greater than the recoverable amount of the asset. The recoverable amount of the unit was determined using a discounted cash flow model and an explicit forecast period of five years. These cash flows are US dollar-based with the resultant enterprise value being converted to ZAR at reporting date. To determine the terminal value the Gordon Growth Model was used and year five was taken into perpetuity. The outcome of the impairment test was that the Vanderbijlpark and Saldanha CGUs were impaired due to the strengthening of the rand/us dollar exchange rate which had a material impact on the terminal value when calculating the recoverable amount of the CGUs. Included in profit and loss is an impairment of R2 143 million (: R3 935 million) for group and R1 723 million (: R370 million) for company allocated as follows: An impairment of R1 721 million (: Rnil) relating to the Vanderbijlpark CGU; R1 712 million was allocated to property, plant and equipment and R9 million intangible assets (refer to note 13) An impairment of R420 million (: R3 574 million) relating to the Saldanha CGU; R420 million (: R3 565 million) was allocated to property, plant and equipment and Rnil (: R9 million) to intangible assets (refer to note 13) An impairment of R2 million (: R370 million), was recognised for redundant assets of the Vaal Meltshop and certain assets of the Forge at Vereeniging Works being placed under care and maintenance The other major assumptions in arriving at the present value of future cash flows are: Saldanha Long products Vanderbijlpark Major assumptions Post-tax Wacc/discount rate (% USD-based)** Growth rate (% USD-based) Exchange rate range (ZAR/USD)* Steel sales price range (average USD/t)* Sales volume range (kt)* Capex accumulated ( ), USDm* * Lowest to highest range over the initial period of 2017 to 2021 (: to 2020). ** While a pre-tax Wacc/discount rate is required per IAS 36 Impairment of Assets, the standard also accepts that discounting post-tax cash flows at a post-tax discount rate and discounting pre-tax cash flows at a pre-tax discount rate should give the same result, as long as the pre-tax discount rate is the post-tax discount rate adjusted to reflect the specific amount and timing of the future tax cash flows. Such consideration has been applied in determining the discounted post-tax cash flows. The Vanderbijlpark and Saldanha CGUs were impaired primarily due to the strengthening of the rand against the US dollar.
47 Notes to the group and company annual financial statements continued for the year ended 31 December Audited Annual Financial Statements Property, plant and equipment continued Sensitivities relating to the Saldanha and Vanderbijlpark CGUs Coverage* % Saldanha Long products Vanderbijlpark Impact on coverage % Coverage* % Impact on coverage % Coverage* % Impact on coverage % Coverage on the base basket pricing Impact on coverage % change from the base model 5% stronger exchange rate per annum from 2018 (62) (45) 10% decrease in forecast sales volumes (62) (49) 5% reduction in basket pricing (62) (58) * Coverage represents the recoverable amount as a % over the carrying amount. 13. Intangible assets Group Patents Nonintegrated computer software For the year ended 31 December Carrying amount at the beginning of the year Additions Other movements Amortisation (2) (23) (25) Impairment (9) (9) Carrying amount at the end of the year At 31 December Cost Accumulated amortisation and impairment (38) (308) (346) Net carrying amount 103 (103) For the year ended 31 December Carrying amount at the beginning of the year Additions Other movements (2) (2) Amortisation (2) (21) (23) Impairment (5) (4) (9) Carrying amount at the end of the year At 31 December Cost Accumulated amortisation and impairment (36) (276) (312) Net carrying amount No intangible assets have restricted titles or have been pledged as security in the current year. Total
48 42 Audited Annual Financial Statements Notes to the group and company annual financial statements continued for the year ended 31 December 13. Intangible assets continued Intangible assets An impairment of R9 million (: Rnil) was allocated to the intangible assets of Vanderbijlpark Works and Rnil (: R9 million) for Saldanha, relating to the impairment of the Vanderbijlpark and Saldanha cash-generating units (refer to note 12). Nonintegrated software Company For the year ended 31 December Carrying amount at the beginning of the year Additions Other movements Amortisation (22) (22) Impairment (9) (9) Carrying amount at the end of the year At 31 December Cost Accumulated amortisation and impairment (294) (294) Net carrying amount For the year ended 31 December Carrying amount at the beginning of the year Additions Other movements (3) (3) Amortisation (20) (20) Impairment Carrying amount at the end of the year At 31 December Cost Accumulated amortisation and impairment (263) (263) Net carrying amount No intangible assets have restricted titles or have been pledged as security in the current year. Total
49 Notes to the group and company annual financial statements continued for the year ended 31 December Audited Annual Financial Statements Equity-accounted investments Details of the company s material associates and jointly controlled entities are as follows: Name of the entity Principal activity Place of incorporation Proportion ownership interest and voting power Joint venture Macsteel International Trading BV Summarised financial information Associates Steel trading and shipping Netherlands 50% 50% Other associates Aggregate information of associates not individually material Profit after tax 4 3 Share of total comprehensive income 4 3 Aggregate carrying amount Group Company Summarised financial information Joint venture The summarised financial information below is in respect of the group s only material joint venture. The summarised financial information below represents amounts shown in the entity s annual financial statements for the year ended 31 December, adjusted by the group for equity accounting purposes. Macsteel International Trading BV Current assets Non-current assets Current liabilities (4 247) (6 164) Non-current liabilities (554) (776) Net assets The above amounts of assets and liabilities include the following: Cash and cash equivalents Current financial liabilities (excluding trade, other payables and provisions) (1 924) (3 768) Current non-financial liabilities (excluding trade, other payables and provisions) (4) (43) Revenue Profit after tax Other comprehensive income Total comprehensive income Profit for the year includes the following: Depreciation and amortisation (16) (13) Interest income Interest expense (124) (124) Income tax expense (54) (69) Reconciliation of the net assets to the carrying amount Net assets of the joint venture Ownership interest 50% 50% Carrying amount Comprehensive income items were converted from USD to ZAR using the average exchange rate of the year while financial position items were converted using the closing exchange rate at year-end.
50 44 Audited Annual Financial Statements Notes to the group and company annual financial statements continued for the year ended 31 December 14. Equity-accounted investments continued Summarised financial information continued Joint venture continued Other joint ventures Aggregate information of joint ventures not individually material Profit/(loss) after tax 7 (4) Share of other comprehensive income Dividend paid Share of total comprehensive income 7 (4) Aggregate carrying amount Total carrying amount of equity-accounted joint ventures and associates Group Company No significant judgements and assumptions have been made in determining whether had joint control or significant influence for any of its investments in joint ventures and associates. This was determined through direct shareholding and joint venture agreements where applicable. 15. Investments in subsidiaries Company Shares at cost Indebtedness by subsidiaries to subsidiaries (94) Total Aggregate attributable after tax losses (1 147) (3 376) The carrying value of the company s investment in subsidiaries consists largely of its investment in Saldanha Steel Proprietary Limited, being the cost of shares and indebtedness, at the initial and subsequent acquisition dates. Critical judgements and estimates Consolidation of structured entities Certain non-core services and corporate social development activities of the company are managed via two associations not for gain, namely the Vesco group and Vesco Community Enterprises. While the company has de facto control over both entities, these entities are not consolidated within the group accounts because they are not material to the group. Likewise, the results of the ArcelorMittal Foundation Trust, a public benefit organisation, are not included in the consolidated results of the group. Iscor Management Share Trust is consolidated into the group results, with the cost of open-market share purchases being included as a debit to the group s equity. Ikageng Broad-Based Employee Share Trust In the Ikageng Broad-Based Employee Share Trust (Ikageng) was created to give effect to the Employee Share Ownership Plan (ESOP). Ikageng holds the investment in shares in for the benefit of the company s employees, until such time that they vest. The ESOP was created by to facilitate black economic empowerment and meaningful wealth for its employees. The trust is controlled by and is therefore consolidated in accordance with IFRS 10: Consolidated Financial Statements. In the prior year, the shares in Ltd were obtained from the treasury shares (4.7%) held by Vicva Trading Nine Investments Proprietary Limited (Vicva), through a contribution from the company. Ikageng, subsequent to the rights issue owns 1.45% of Ltd. Isabelo Empowerment Share Trust and Amandla we Nsimbi Proprietary Limited In the Isabelo Empowerment Share Trust and Amandla we Nsimbi Proprietary Limited were created as part of the company s initiative to transform in order to achieve sustainable ownership by black people. In terms of the scheme ArcelorMittal South Africa issued empowerment shares to Amandla we Nsimbi Proprietary Limited and the Isabelo Share Trust (representing 17% and 5.1%, respectively, of the voting rights in through a notional loan. Both the trust and company are controlled by and are therefore consolidated in terms of IFRS 10: Consolidated Financial Statements.
51 Notes to the group and company annual financial statements continued for the year ended 31 December Audited Annual Financial Statements Investments in subsidiaries continued Interest of company Country of incorporation¹ Reporting currency Number of ordinary shares issued Shares at cost Indebtedness Property Yskor Landgoed (Pty) Ltd² RSA ZAR (94) Manufacturing Iscor Building Systems (Pty) Ltd RSA ZAR Saldanha Steel (Pty) Ltd³ RSA ZAR Mining Oakwood Trading 21 (Pty) Ltd RSA ZAR Service MSSA Investments BV NEH USD Pybus Fifty-Seven (Pty) Ltd RSA ZAR Vicva Investments and Trading Nine (Pty) Ltd RSA ZAR Dombotema Mining Investments (Pty) Ltd RSA ZAR Distribution (Pty) Ltd RSA ZAR ArcelorMittal African Investments Mauritius USD Operations (Pty) Ltd RSA ZAR Total RSA Republic of South Africa and NEH The Netherlands. 2 In the current year, Yskor Landgoed Proprietary Limited distributed the loan receivable balance of R94 million to as a liquidation dividend. 3 The indebtedness amount includes the shareholders loan of R3 462 million (: R4 922 million) and intercompany balances in favour of Saldanha Steel Proprietary Limited of R2 773 million (: R4 156 million). R R R R
52 46 Audited Annual Financial Statements Notes to the group and company annual financial statements continued for the year ended 31 December Group Company 16. Other financial assets Non-current Available-for-sale (AFS) investments carried at fair value Equity instruments Loans and receivables Amortised cost Ferrosure Isle of Man Insurance Captive Total Current Financial assets carried at FVTPL Held-for-trading Total Critical judgements and estimates AFS investments Hwange Colliery Company Ltd The company holds 10% of the ordinary share capital of Hwange Colliery Company Ltd, a coal, coke and by-products producer in Zimbabwe. The shares of Hwange Colliery Company Ltd are traded on the dollarised Zimbabwe Stock Exchange. The carrying amount of the investment represents its market value at the reporting date of R7 million (: R9 million). Coal of Africa Ltd The company holds shares (6.54%) in Coal of Africa Ltd, a company primarily listed on the Australian Stock Exchange and dually listed on the Johannesburg Stock Exchange. The shares are valued at a fair value of R0.57 per share and therefore are valued at the market value of R72 million (: R69 million). Amortised cost Ferrosure Isle of Man The investment in Ferrosure Isle of Man represents the company s insurance captive situated in the Isle of Man. Held-for-trading Foreign exchange contracts Financial instruments classified as held-for-trading represent gains on foreign exchange contracts (FECs). Group Company 17. Inventories Finished products Work-in-progress Raw materials Plant spares and consumable stores Total Vereeniging Works In, inventory, mainly consumable stock of R51 million was written down to its net realisable value of Rnil due to the Vaal Meltshop and certain areas of the forge being placed under care and maintenance. Thabazimbi run of mine stock Due to the closure of the Thabazimbi mine in, the company and group adjusted the run of mine stock of R297 million to its net realisable value of R64 million resulting in an impairment of Rnil (: R233 million). Included in the inventory balance in the current year was run of mine stock carried at its net realisable value of R51 million. Inventory at net realisable value Included in the above are finished products of R682 million (: R1 054 million), work-in-progress of R353 million (: R931 million) and raw materials of R1 476 million (: R1 612 million) carried at net realisable value.
53 Notes to the group and company annual financial statements continued for the year ended 31 December Audited Annual Financial Statements 47 Group Company 18. Trade and other receivables Trade receivables Local Exports Total gross trade receivables Allowance for doubtful debts Local (4) (2) (4) (2) Exports Total allowances for doubtful debts (4) (2) (4) (2) Other allowances Local (382) (273) (382) (273) Exports (4) (74) (4) (74) Total other allowances (386) (347) (386) (347) Net trade receivables Local Exports Total net trade receivables Other receivables Other receivables Rebates Allowance for doubtful debts on other receivables (56) (33) (51) (31) Net value added tax receivable Total other receivables Total Average credit period for trade receivables The sectoral split of the average credit period (in days) on sale of goods is as follows: Local Exports No interest is charged on trade receivables for the first 30 days from date of statement. Thereafter, interest is charged at prime +3% per annum on the outstanding balance. Other receivables relate primarily to by-product sales, site rental due, prepayments, staff education and bursary loans. In determining the recoverability of trade and other receivables, the group considers any change in the credit quality of the trade receivable from the date credit was initially granted up to the reporting date. Age of receivables past due and not impaired days days days >180 days Total
54 48 Audited Annual Financial Statements Notes to the group and company annual financial statements continued for the year ended 31 December 18. Trade and other receivables continued The following allowances exist: Allowance for doubtful debts, which is based on the ageing and recoverability of receivables. Customers handed over for collection are fully provided for unless insured, in which case the participation percentage of the insurer is deducted. Overdue customers without cover are fully provided for. Other allowances relate to settlement discounts, price, quality, dispatch and related claims for which credit notes still have to be issued. Group Company Movement in inventory prepayment Opening balance Deferred stripping in the period Derecognition charge (568) (568) Total Inventory prepayments made in the year represented the contribution made towards the stripping costs of the Sishen mine in terms of the settlement and supply agreement. In accordance with the amended pricing formulae in the final signed agreement, paid a market price (EPP) for iron ore and as a result no further prepayments towards stripping costs were made. The asset of R568 million was therefore derecognised and written off. Movement in other allowances Balance at the beginning of the year (347) (299) (347) (299) Allowances raised (1 683) (1 292) (1 677) (1 292) Allowances utilised Closing balance (386) (347) (386) (347) An allowance is also made for doubtful debts on other receivables that are more than 90 days overdue. Movement in allowances for doubtful debts on other receivables Balance at the beginning of the year (32) (22) (31) (20) Impairment losses recognised (49) (19) (44) (18) Amounts recovered during the year Closing balance (56) (33) (51) (31) Age of impaired trade receivables days days > 180 days (4) (2) (4) (2) Total (4) (2) (4) (2) Trade receivables with a carrying amount of R1 654 million (: R1 520 million) were transferred (sold) to unrelated third parties. This amount represents the outstanding receivables that were sold at 31 December. This is referred to as the True Sales of Receivables (TSR) programme. At the date of sale, transfers control and substantially all risks and rewards normally associated with ownership of these receivables. Therefore these trade receivables were derecognised at the date of sale. Expenses incurred under the TSR programme (reflecting the discount granted to the acquirers of the accounts receivable) recognised in the statement of comprehensive income for the year ended 31 December is R92 million (: R68 million). Included in trade receivables is a credit balance of R653 million (: R664 million) relating to factored debtors invoices that were not yet due. Trade receivables balance included an estimated amount of R8 million relating to effect of discounting as a result of delayed payments by customers. The credit risk management policy sets out the framework within which the customer credit risk is managed.
55 Notes to the group and company annual financial statements continued for the year ended 31 December Audited Annual Financial Statements Trade and other receivables continued The objectives of the credit risk management policy are to: Increase sales through investing in the customer base Avoid extensions that could lead to financial distress and default by customers Maintain productive customer relationships within the framework of prudent risk management Optimising cash collection periods Diversifying credit exposure over a broad client base The credit policy risk management is enacted by the credit management department. Credit management ensures that credit extension and management are conducted within the approved frameworks, and adequately assesses and reports all credit exposures, which include the maintenance of appropriate collateral, financial guarantees and credit insurance. Customer credit risk is assessed on a group-wide basis and refers to the risk that a customer will default on its contractual obligations resulting in financial loss to the group. Each customer s credit profile is determined by taking into account the customer s financial position, payment record, guarantees and other relevant information. Credit limits are monitored regularly and credit exposures are monitored on a daily basis. Credit insurance is underwritten by Credit Guarantee Insurance Corporation of Africa Ltd under three different policies with a maximum liability of R3.8 billion on the largest policy. The insurance excess ranges from zero to 10%. The group and company are exposed to three main customers. These top three customers operate in the domestic market. The table below details the cumulative credit limit and balances (both inclusive of value added tax) of the top three customers at the statement of financial position date for the group and company: Credit limit Balance Customer Rating Top three customers by sales for the year Outstanding balance B % of net trade receivables Group 53% 49% Company 61% 61% Macsteel International BV does not have a credit limit. The outstanding customer balance was R433 million (: R185 million). Group Company Credit risk exposure by class for the group and company is: Local Exports Total Cash and cash equivalents Cash and bank balances Restricted cash Total % % % For the purposes of the statements of cash flows, cash and cash equivalents include cash on hand and in banks, net of outstanding overdrafts. Restricted cash of R161 million (: Rnil) relates to cash that has been set aside for the purposes of the environmental rehabilitation obligation as detailed in note 22. %
56 50 Audited Annual Financial Statements Notes to the group and company annual financial statements continued for the year ended 31 December Group Company 20. Stated capital Shares issued Ordinary shares at no par value A1 ordinary shares at no par value* A2 ordinary shares at no par value* Total * Value less than R1 million. Number of shares Number of shares Number of shares Number of shares Reconciliation of authorised shares Ordinary shares at no par value A ordinary shares A1 ordinary shares at no par value A2 ordinary shares at no par value C redeemable preference shares Issued shares Ordinary shares of no par value A1 ordinary shares of no par value A2 ordinary shares of no par value Total shares issued Reconciliation of shares issued to shares outstanding Total ordinary shares issued Less: Shares held in reserve/trust ( ) ( ) ( ) ( ) Vicva Investments and Trading Nine Proprietary Limited ( ) ( ) ( ) ( ) Ikageng Broad-Based Employee Share Trust ( ) ( ) ( ) ( ) Amandla we Nsimbi Proprietary Limited ( ) ( ) Isabelo Employee Share Trust ( ) ( ) Total shares outstanding The unissued ordinary shares are not under the control of the directors.
57 Notes to the group and company annual financial statements continued for the year ended 31 December Audited Annual Financial Statements Stated capital continued Ordinary shares Ordinary shares increased due to the rights issue in January. The company successfully completed the rights issue which generated R4 500 million in cash. The funds were used to settle the company s debt as part of its strategy to convert short-term borrowing facilities to medium term. There was no bonus element for the rights issue, therefore the number of shares were adjusted prospectively. A1 and A2 shares The B-BBEE transaction was successfully completed towards the end of the year. The shareholders approved the issue of A1 and A2 ordinary shares. The B-BBEE company Amandla we Nsimbi Proprietary Limited whose shares are owned by broad-based black consortium, Likamva Resources, subscribed for A1 ordinary shares in Ltd, representing 17% of the voting rights in. A1 ordinary shares were issued at a nominal value through a notional loan structure. Likamva Resources is initially the only shareholder but has undertaken to introduce a broad-based party with an interest in the community as shareholders in the B-BBEE company within 24 months post the implementation of the B-BBEE transaction, such that an indirect effective shareholding of 5% is achieved by the broad-based party. The Isabelo Broad-Based Employee Share Trust will subscribe for A2 ordinary shares in, representing 5.1% of the voting rights in. A2 ordinary shares are also issued at a nominal value through a notional loan structure. Analysis of shareholding The analysis of ordinary shareholders below represents a summary of beneficial shareholders with a holding greater than 3% of issued shares as at 31 December : Number of shareholdings % of shares in issue Number of shareholdings % of shares in issue Beneficial shareholder ArcelorMittal Holdings AG Amandla we Nsimbi Proprietary Limited Industrial Development Corporation Isabelo Employee Share Trust Government Employees Pension Fund Investec Asset Management Coronation fund managers Vicva Investments and Trading Nine Proprietary Limited Of the issued shares, Ikageng Broad-Based Employee Share Trust holds 1.5% (: 4.7%) and Vicva Investments and Trading Nine Proprietary Limited owns 1.6% (: 5.2%). Amandla we Nsimbi Proprietary Limited and the Isabelo Empowerment Share Trust hold 100% of the A1 ordinary and A2 ordinary shares representing 17.0% and 5.1% shareholding respectively. Ikageng holds the shares in the company for the benefit of the employees until such time that they vest. Vicva Investments and Trading Nine Proprietary Limited, Ikageng Employee Share Trust, Amandla we Nsimbi Proprietary Limited, Isabelo Empowerment Share Trust are all subsidiaries of the company and the shares held by them are treated as treasury shares for accounting purposes.
58 52 Audited Annual Financial Statements Notes to the group and company annual financial statements continued for the year ended 31 December Group Company 21. Finance lease obligations Secured at amortised cost Non-current Current Total The finance leases are embedded within supply arrangements with suppliers and have been assessed in terms of IFRIC 4: Determining Whether an Arrangement Contains a Lease. Maturity profile At 31 December Minimum lease payments Not later than one year Later than one year and not later than five years Later than five years Total Future finance charges (56) (88) (19) (35) Present value of minimum lease payments The lease liabilities are effectively secured, as the rights to the leased assets which are embedded in the supply agreements would generally revert to the lessor or supplier in the event of default. There were no breaches or defaults in contracts during the current or comparative year. Functional category Term expiry Effective interest rate (fixed) Gases % 22.00% Electricity and transport utilities % 18.25% Steel processing and foundry services %
59 Notes to the group and company annual financial statements continued for the year ended 31 December Audited Annual Financial Statements Provisions Competition Commission Asset retirement obligation Environmental remediation Onerous contracts Thabazimbi mine closure Group For the year ended 31 December At the beginning of the year Charge to the statement of comprehensive income (150) (105) Additions and scope changes (31) (160) (105) Discount rate change (30) (7) (62) (2) (101) Unwinding of the discount effect Utilised during the year (10) (58) (24) (176) (38) (306) Asset retirement obligation scope changes (2) (2) Reclassification to financial liabilities (1 322) (1 322) At the end of the year Non-current Current Total Company For the year ended 31 December At the beginning of the year Charge to the statement of comprehensive income (139) (105) Additions and scope changes (31) (146) (105) Discount rate change (30) (7) (62) (2) (101) Unwinding of the discount effect Utilised during the year (11) (58) (9) (176) (37) (291) Reclassification to financial liabilities (1 322) (1 322) At the end of the year Non-current Current Total Other Total
60 54 Audited Annual Financial Statements Notes to the group and company annual financial statements continued for the year ended 31 December 22. Provisions continued Tshikondeni mine Competition Commission Asset retirement obligation Environmental remediation Onerous contracts Thabazimbi mine closure Group For the year ended 31 December At beginning of year Charge to the statement of comprehensive income (23) (13) (65) Additions and scope changes (23) (21) (105) Discount rate change (12) (137) (10) (159) Unwinding of the discount effect Utilised during the year (139) (3) (73) (60) (168) (87) (530) Asset retirement obligation scope changes 7 7 At end of year Non-current Current Total Other Total Tshikondeni mine Competition Commission Asset retirement obligation Environmental remediation Onerous contracts Thabazimbi mine closure Company For the year ended 31 December At beginning of year Charge to the statement of comprehensive income (23) (15) (65) Additions and scope changes (23) (21) (105) Discount rate change (12) (137) (10) (159) Unwinding of the discount effect Utilised during the year (139) (2) (73) (51) (168) (87) (520) At end of year Non-current Current Total Other Total
61 Notes to the group and company annual financial statements continued for the year ended 31 December Audited Annual Financial Statements Provisions continued Maturity profile The present value maturity profile of the provisions is set out in the table below: Asset retirement obligation Environmental remediation Onerous contracts Group At 31 December Less than one year More than one year, less than five years Greater than five years Total Company At 31 December Less than one year More than one year, less than five years Greater than five years Total Other Total Tshikondeni mine Competition Commission Asset retirement obligation Environmental remediation Onerous contracts Thabazimbi mine closure Group For the year ended 31 December Less than one year More than one year less than five years Greater than five years Total Company At 31 December Less than one year More than one year less than five years Greater than five years Total Other Total
62 56 Audited Annual Financial Statements Notes to the group and company annual financial statements continued for the year ended 31 December 22. Provisions continued Competition Commission The company has since engaged with the Competition Commission and a detailed settlement agreement has been finalised. Based on the draft settlement agreement, a provision of R1 245 million was raised in, representing the present value of a proposed administrative penalty of R1 500 million. The provision was adjusted for interest rate changes in the prime rate of interest and the unwinding of the discount. Following finalisation of the matter the provision was reclassified to financial liabilities. Asset retirement obligation and environmental remediation obligation provisions Environmental obligations consist of asset retirement obligations and environmental remediation obligations. Environmental remediation obligations represent the present value of the cost of remedial action to clean up and secure a site. These actions are primarily attributable to legacy waste disposal activities. Legal obligations exist to remediate these facilities. Estimating the future cash flows associated with these obligations and the related asset components is complex. In particular, judgement is required in distinguishing between asset retirement obligations and environmental remediation obligations. Existing laws and guidelines are not always clear as to the required end-state situation. The provisions are also affected by changing technologies, environmental, safety, business and legal considerations. Management assesses long-term operational plans, technological and legislative developments, guidelines issued by the authorities, advice from external environmental experts, and computations provided by quantity surveyors in order to derive an estimated future cash flow profile to serve as basis for the computation of the obligations and related assets. The asset retirement obligations represent management s best estimate of the present value of costs that will be required to retire plant and equipment. The majority of the obligation relates to ancillary plant and equipment that will be retired as part of the clean up and closure of those facilities to be remediated via the environmental remediation obligation. The net carrying amount of the asset retirement obligation asset component, included in note 12, amounts to R4 million (: R8 million) for the group and Rnil (: Rnil) for the company. The term of the obligation assessment varies according to the site. The maximum term is 12 years. Thabazimbi environmental rehabilitation Included in the environmental rehabilitation provision is a provision for rehabilitation of R830 million (: R450 million) for the rehabilitation of the Thabazimbi mine. In terms of the amended and restated settlement and supply agreement between Sishen Iron Ore Company (SIOC) and Ltd, Ltd is liable for the costs relating to the rehabilitation of SIOC s Thabazimbi iron ore mine for the duration that it was a captive mine. The mine ceased to be a captive mine on 1 January Ltd is required to fund its obligation through bank guarantees and/or cash in a trust fund maintained by SIOC. Ltd recognised a further provision for an additional amount of R380 million, based on a revised assessment of the expected rehabilitation costs received from SIOC. However, SIOC rehabilitation cost projection is not in line with the assessment performed by s independent consultants. In the meantime, has entered into an interim agreement with SIOC, to take over the Thabazimbi mine subject to certain conditions and including a due diligence review. If the conditions have not been satisfied by 28 April 2017 (or a later date agreed to by and SIOC), the agreement will lapse and SIOC will proceed with closure of the mine. and SIOC have been in discussions and will continue to engage with the Department of Mineral Resources in this regard. Thabazimbi mine closure Due to the slope failure at the Thabazimbi mine, all activities at the mine have ceased. In accordance with the settlement and supply agreement, a provision of R200 million and R249 million was recognised for developmental and retrenchment costs in. The developmental cost represents the provisional amount as indicated by Sishen Iron Ore Company Proprietary Limited. In the current year an EPP (market-related) receivable of R51 million was offset against the provision. Following this offset an overprovision of R105 million was released to the income statement. Retrenchment packages that were provided for in the prior year were settled in full in the current year. Average discount rates Asset retirement obligation Environmental remediation obligation Onerous contracts The average escalation factor applied to the current cash flow estimates is 7.11% (: 6.8%). % %
63 Notes to the group and company annual financial statements continued for the year ended 31 December Audited Annual Financial Statements Provisions continued Onerous contract provision The provision includes: An onerous operating lease contract embedded in a long-term, take-or-pay gas supply contract with Afrox. The unavoidability of the cost arose upon the 1997 decommissioning of steelmaking facilities at Pretoria Works. The carrying amount of provision at 31 December equalled Rnil (: R146 million). The decrease in the provision relates to a final settlement agreement between the company and Afrox which resulted in the release of R145 million excess provisions of profit or loss. An onerous take-or-pay contract for burnt dolomite and coal fines sourced from PPC Limited. The take-or-pay obligation arose historically due to lower off-take on account of efficiency improvements and method changes. The carrying amount of the provision is R13 million (: R40 million). Other In the current year a provision amounting to R15 million has been raised for the B-BBEE transaction costs that have still not been invoiced. Vereeniging closure costs In the Vaal Meltshop and parts of the Forge plants at Vereeniging Works were placed under care and maintenance. As a result, a provision for voluntary severance packages of R35 million was recognised. In the current year the retrenchment packages were settled in full. The sensitivity of the carrying amount of the obligations at 31 December in response to changes in key inputs is: Asset retirement obligations Environmental remediation obligations Onerous contracts Increase/ (decrease) Increase/ (decrease) Increase/ (decrease) Carrying amount at 31 December % change in all cash flows +10% % (20) (193) (1) % change in cash flows in first five years +10% % (16) (137) (1) Basis point change in discount rate +100 bps (6) (72) -100 bps 6 72 Basis point change in discount rate in first five years +100 bps (4) (38) -100 bps 4 38
64 58 Audited Annual Financial Statements Notes to the group and company annual financial statements continued for the year ended 31 December Group Company 23. Trade and other payables Trade payables Trade payables True sales of receivables programme Total The True sales of receivables (TSR) programme is the sale of receivables balances to third parties. At the date of sale, transferred control and substantially all risks and rewards normally associated with ownership of these receivables. Therefore these trade receivables were derecognised at the date of sale. The debtors, however, will settle the balance due to Limited and thereafter the company is obligated to transfer those amounts to the third parties. Included in trade payables balance is an estimated amount of R118 million relating to the effect of discounting as a result of extended payment terms. Other payables Leave pay Sundry Total Non-current Current Total Leave pay benefits accrual In terms of group and company policy, employees are entitled to accumulate vested leave benefits not taken within a leave cycle. The obligation is reviewed annually. Sundry Sundry payables comprise primarily accruals for corporate fees, other general accruals and payroll-related payables.
65 Notes to the group and company annual financial statements continued for the year ended 31 December Audited Annual Financial Statements 59 Group Company 24. Borrowings Unsecured at amortised cost Loans Group loans Banks Loans The reduction in the group and bank loan is due to the repayments from proceeds of the rights issue. The weighted average interest rate payable on all loans is 10.03% (: 8.4%). No loan covenants were breached during the year ended 31 December. 25. Other financial liabilities Non-current Financial liabilities carried at amortised cost Competition Commission administrative penalty Total Current Financial liabilities carried at FVTPL Held-for-trading Financial liabilities carried at amortised cost Competition Commission administrative penalty Total Competition Commission A final settlement agreement was reached with the Competition Commission, and subsequently accepted by the Tribunal on the outstanding competition matters regarding anti-competitive behaviour. The Competition Commission imposed an administrative penalty of R1 500 million and a provision of R1 245 million was initially recognised in, representing the present value of the administrative penalty. Since the agreement has been finalised, the provision has been reclassified to a financial liability. The financial liability of R1 323 million represents the present value of the repayment of the administrative penalty over a five-year period at the prime rate of interest and an interest-free period of 18 months. In addition, is subject to an earnings before interest and tax (ebit) of 10% on flat products as well as spending R4 600 million on capital expenditure projects, subject to certain conditions. Both commitments will apply for five years. Financial liabilities held-for-trading Financial liabilities held-for-trading represent losses on forward exchange contracts (FECs).
66 60 Audited Annual Financial Statements Notes to the group and company annual financial statements continued for the year ended 31 December Group Company 26. Notes to the statement of cash flows 26.1 Cash generated from operations Loss from operations (1 092) (4 736) (442) (5 490) Adjusted for: Depreciation Amortisation of intangible assets Unrealised profit on sales to joint ventures 18 Share option and participation costs Cash settlement on Management Share Trust (32) (32) Non-cash movement in provisions Reversal of loan from subsidiary 154 Net losses/(gains) arising on financial assets and liabilities held-for-trading 165 (426) 164 (425) Write-down/(reversal of write-down) of inventory to net realisable value (59) Asset retirement obligation scope changes 12 (21) 12 (21) Movements in trade and other receivable allowances (1) Reconditionable spares usage (Profit)/loss on disposal or scrapping of property, plant and equipment (51) 5 (52) 2 Working capital movements (Increase)/decrease in inventories (1 830) (1 753) Decrease in trade and other receivables (164) (87) (271) (314) Increase in trade payables Increase/(decrease) in other payables 195 (36) 190 (43) Utilisation of provisions (306) (530) (291) (520) 873 (264) (1 643) 26.2 Income tax paid Normal taxation recoverable at the beginning of the year Amounts charged to the statement of comprehensive income (19) (11) (11) (3) Normal taxation recoverable at the end of the year (58) (75) (53) (65) (2) (40) 1 (4) 26.3 Investment to maintain operations Replacement of property, plant and equipment (1 508) (1 004) (1 156) (913) Intangible assets (25) (11) (25) (11) Environmental (38) (65) (36) (65) Reconditionable spares (102) (84) (74) (56) (1 673) (1 164) (1 291) (1 045) 26.4 Investment to expand operations Property, plant and equipment for expansion and new technology (335) (92) (335) (84) (335) (92) (335) (84) Total capital expenditure (2 008) (1 256) (1 626) (1 129)
67 Notes to the group and company annual financial statements continued for the year ended 31 December Audited Annual Financial Statements 61 Group Company 27. Financial instruments and financial risk management 27.1 Categories of financial instruments Financial assets Fair value through profit or loss Held-for-trading Loans and receivables carried at amortised cost Cash and bank balances Trade and other receivables Available-for-sale financial assets Total financial assets Financial liabilities Fair value through profit or loss Held-for-trading Liabilities carried at amortised cost Borrowings Competition Commission Finance lease obligations Trade payables Other payables Total financial liabilities Financial instruments carried at fair value For financial instruments that are measured at fair value in the statement of financial position, the table below gives information about how the fair values of these financial assets and financial liabilities are determined. Financial assets measured at FVTPL Held-for-trading Available-for-sale financial assets Valuation technique Fair value hierarchy Quoted in active market Level Quoted in active market Level Total financial assets measured at fair value Financial liabilities measured at FVTPL Valuation technique Fair value hierarchy Held-for-trading liabilities Quoted in active market Level Total financial liabilities measured at fair value Fair value measurements are categorised into level 1, 2 or 3 based on the degree to which inputs to the fair value measurements are observable and the significance of the inputs to the fair-value measurements in its entirety, which are described as follows: Level 1: inputs are quoted prices (unadjusted) in active markets for identical assets or liabilities that the entity can access at the measurement date Level 2: inputs are inputs, other than quoted prices included in level 1, that are observable for the asset or liability, either directly or indirectly Level 3: inputs are unobservable inputs for the asset or liability
68 62 Audited Annual Financial Statements Notes to the group and company annual financial statements continued for the year ended 31 December 27. Financial instruments and financial risk management continued 27.3 Financial instruments carried at amortised cost The following table shows the carrying amounts and fair values of financial assets and financial liabilities carried at amortised cost. Where fair value information could not be determined the carrying amount of assets and liabilities carried at amortised cost approximates their fair value. Carrying value Fair value Carrying value Fair value Group Non-current liabilities Finance lease obligations Competition Commission administrative penalty Current liabilities Borrowings Finance lease obligations Competition Commission administrative penalty Trade payables Other payables Total liabilities Total borrowings Total finance lease obligations Competition Commission administrative penalty Trade payables Other payables Total liabilities Current assets Trade and other receivables Cash and bank balances Ferrosure Isle of Man Insurance Captive Total assets Company Non-current liabilities Finance lease obligations Competition Commission administrative penalty Current liabilities Borrowings Finance lease obligations Competition Commission administrative penalty Trade payables Other payables Total liabilities Borrowings Total finance lease obligations Competition Commission administrative penalty Trade payables Other payables Total liabilities Current assets Trade and other receivables Cash and bank balances Ferrosure Isle of Man Insurance Captive Total assets
69 Notes to the group and company annual financial statements continued for the year ended 31 December Audited Annual Financial Statements Financial instruments and financial risk management continued 27.4 Financial risk management overview and objectives The group s financial risk management programme focuses on the unpredictability of financial markets and seeks to minimise potential adverse effects on financial performance. Financial risks to which the group and company are exposed consist of: Financial market risk, consisting of: Foreign currency risk Commodity price risks Interest rate risk Liquidity risk, being: Cash flow volatility Fair value and cash flow interest rate risk Capital management and gearing risk Customer credit risk as detailed in note 18 The treasury and financial risk management policy (treasury policy) details the framework within which financial risk (other than customer credit risk) of the group is managed. The policy is approved by the board of directors and is reviewed annually. The treasury policy addresses market, liquidity, capital management and gearing risk through the direction of the following activities: Financing facilities Financial guarantees and letters of credit Market risk management through Foreign currency risk management Commodity risk management and Interest rate management Cash management through liquidity management The treasury policy is enacted by the treasury department (treasury). Treasury identifies, evaluates and mitigates financial risks in close cooperation with the group and company s operating units. Board-approved written policies cover the specific activities noted above and address risk limits, the use of derivative and non-derivative financial instruments to hedge certain exposures, and the approval framework governing transaction levels Financial market risk Through its activities, the group is exposed primarily to the financial risks of changes in commodity prices, foreign currency exchange rates, interest rates and potential liquidity constraints. The group manages currency risk through economic hedging of foreign exchange rates primarily relating to capital procurement, trade imports and exports exposures. Due to the limited scope of the programme, the forward contract derivatives were not designated within hedge accounting relationships. Regarding other exposures, markets continue to be monitored in order to determine the most opportune time to commence hedging.
70 64 Audited Annual Financial Statements Notes to the group and company annual financial statements continued for the year ended 31 December 27. Financial instruments and financial risk management continued 27.6 Foreign currency risk management The carrying amount in ZAR, as translated at the closing exchange rate of the foreign currency denominated monetary assets and monetary liabilities at the reporting date is: Group Company Monetary assets United States dollar (USD) Loans and receivables Cash and cash equivalents Trade and other receivables (third parties) Trade and other receivables (related parties) Financial assets at FVTPL Held-for-trading Euro (EUR) Financial assets at FVTPL Held-for-trading Metica (MZN) Loans and receivables Cash and cash equivalents 8 13 Total foreign denominated monetary assets Monetary liabilities USD Carried at amortised cost Trade and other payables (related parties) (3 456) (2 237) (3 144) (1 934) Trade and other payables (unrelated parties) (86) (32) (85) (32) Financial liabilities at FVTPL Held-for-trading (132) (132) EUR Carried at amortised cost Trade payables (related parties) (57) (194) (57) (194) Trade payables (unrelated parties) (145) (60) (131) (38) Financial liabilities at FVTPL Held-for-trading (89) (10) (83) (10) Total foreign denominated monetary liabilities (3 965) (2 533) (3 632) (2 208) Total net foreign denominated monetary assets/(liabilities) (3 302) (2 186) (3 165) (2 058) Only notable currency holdings are disclosed.
71 Notes to the group and company annual financial statements continued for the year ended 31 December Audited Annual Financial Statements Financial instruments and financial risk management continued 27.6 Foreign currency risk management continued Foreign currency sensitivity The following table details the sensitivity to a 10% strengthening in the ZAR against the respective foreign currencies. As the risks are symmetrical in nature, weakening of the ZAR would result in an equal but opposite amount to that detailed in the sensitivity below. A positive number indicates an increase in profit where the ZAR strengthens against the relevant currency. Group Company USD Profit or loss EUR Profit or loss Total Economic hedging using derivative contracts The selective foreign exchange hedging programme using derivative contracts described in note 27.5 as outstanding at the end of the reporting period is: Unmatured instruments FC: foreign currency Average price FC/R Contract value FCm Fair value favourable Profit or loss Group Forward contracts held-for-trading at FVTPL Buy EUR (84) (84) Buy USD (132) (132) Sell EUR (4) Sell USD (40) Forward contracts held-for-trading at FVTPL Buy EUR Buy USD (4) (4) Company Forward contracts held-for-trading at FVTPL Buy EUR (79) (79) Buy USD (132) (132) Sell EUR (4) Sell USD (40) Forward contracts held-for-trading at FVTPL Buy EUR Buy USD (4) (4)
72 66 Audited Annual Financial Statements Notes to the group and company annual financial statements continued for the year ended 31 December 27. Financial instruments and financial risk management continued 27.7 Interest rate risk management Sources of interest rate risk are: Interest expenses, on drawn financing facilities, and promissory notes issued to trade vendors as well as arrangements to fund the construction of assets either in the form of bona fide borrowing arrangements or through supply arrangements containing financial lease structures at fixed interest rates Interest income, due to the group and company s net cash position and the investment thereof at variable interest rates When compared with the comparative reporting period the group and company s sensitivity to interest rates has decreased due to cash inflow from the rights issue which resulted in a decreased need to draw down against financial facilities. Refer to note 27.9 for the interest sensitivity Liquidity risk management Ultimate responsibility for liquidity risk management rests with the board of directors, which has built an appropriate liquidity risk management framework for the management of the group and company s short, medium and long-term funding and liquidity management requirements. The objectives of the liquidity management policy are: Maintenance of adequate reserves, banking facilities and reserve borrowing facilities by monitoring forecast and actual cash flows and matching the maturity profiles of financial assets and liabilities Optimise the account and domestic cash pool structures Minimise bank charges Optimise the availability and use of short-term liquidity positions across the group without compromising the day-to-day cash needs Optimise the net interest result Minimise the number of bank accounts Details of additional undrawn financing facilities that the group and company have at their disposal to reduce liquidity risk are: Group Company Short-term facilities at the end of the reporting period amount undrawn During the reporting period, the maximum drawn amount at any given point equalled R5 329 million (: R5 539 million). No financing arrangements were breached during the current or comparative reporting period.
73 Notes to the group and company annual financial statements continued for the year ended 31 December Audited Annual Financial Statements Financial instruments and financial risk management continued 27.8 Liquidity risk management continued Liquidity risk and interest risk tables Contractual maturity for its non-derivative financial liabilities The following table details the group and company s remaining contractual maturity for non-derivative financial liabilities. The tables have been drawn up based on the undiscounted cash flows of financial liabilities based on the earliest date on which the group and company can be required to pay. The table includes both interest and principal cash flows. Annual effective interest rate 1 % 0 6 months 7 12 months 1 5 years >5 years Discount Carrying amount Group For the year ended 31 December Non-interest-bearing Trade payables (36) Other payables Finance lease obligations (56) 194 Borrowings Total (92) For the year ended 31 December Non-interest-bearing Trade payables (72) Other payables Finance lease obligations (88) 256 Borrowings Total (160) The group and company have access to financing facilities as noted earlier of which R2 000 million (: Rnil million) was undrawn at the end of the reporting date. The group and company expect to meet most of its other obligations from operating cash flows and proceeds from maturing financial assets. Annual effective interest rate 1 % 0 6 months 7 12 months 1 5 years >5 years Discount Carrying amount Company For the year ended 31 December Non-interest-bearing Trade payables (36) Other payables Finance lease obligations (19) 108 Borrowings Total (55) For the year ended 1 December Non-interest-bearing Trade payables (72) Other payables Finance lease obligations (35) 156 Borrowings Total (107) Calculated over the remaining tenure of the non-derivative financial liability.
74 68 Audited Annual Financial Statements Notes to the group and company annual financial statements continued for the year ended 31 December 27. Financial instruments and financial risk management continued 27.8 Liquidity risk management continued Liquidity risk and interest risk tables continued Expected maturity of non-derivative financial assets The following table details the group and company s expected maturity for non-derivative financial assets. The tables below have been drawn up based on the undiscounted contractual maturities of the financial assets including interest that will be earned on those assets. Annual effective interest rate 1 % 0 6 months 7 12 months 1 5 years > 5 years Discount Carrying amount Group For the year ended 31 December Non-interest-bearing Trade and other receivables (29) Fixed and variable interest rate cash holdings Cash and bank balances Total (29) For the year ended 31 December Non-interest-bearing Trade and other receivables (7) Fixed and variable interest rate cash holdings Cash and bank balances Total (7) Company For the year ended 31 December Non-interest-bearing Trade and other receivables (29) Fixed and variable interest rate cash holdings Cash and bank balances Total (29) For the year ended 31 December Non-interest-bearing Trade and other receivables (7) Fixed and variable interest rate cash holdings Cash and bank balances Total (7) Calculated over the remaining tenure of the non-derivative financial asset. 2 Fixed rate interest applicable on overdue accounts. 3 Fixed and variable rates applicable to call and short-term deposit holdings. Maturity profile reflects the synthesised availability of the cash bank balances on hand at the end of the reporting period, and the expected annual interest income to be earned thereon.
75 Notes to the group and company annual financial statements continued for the year ended 31 December Audited Annual Financial Statements Financial instruments and financial risk management continued 27.8 Liquidity risk management continued Derivative financial instruments The following table details the liquidity analysis for derivative financial instruments. The table has been drawn up based on the undiscounted net cash inflows/(outflows) on the derivative instruments that settle on a net cash-settled basis. When the amount payable or receivable is not fixed, the amount disclosed has been determined by reference to the projected interest rate and foreign currency forward curves existing at the reporting date. Financial assets 0 6 months 7 12 months 1 5 years >5 years Discount Carrying amount Group For the year ended 31 December Net cash-settled foreign currency derivatives Total For the year ended 31 December Net cash-settled foreign currency derivatives Total Company For the year ended 31 December Net cash-settled foreign currency derivatives Total For the year ended 31 December Net cash-settled foreign currency derivatives Total Financial liabilities Group For the year ended 31 December Net cash-settled foreign currency derivatives Total For the year ended 31 December Net cash-settled foreign currency derivatives Total Company For the year ended 31 December Net cash-settled foreign currency derivatives Total For the year ended 31 December Net cash-settled foreign currency derivatives Total
76 70 Audited Annual Financial Statements Notes to the group and company annual financial statements continued for the year ended 31 December 27. Financial instruments and financial risk management continued 27.9 Capital risk management The group and company objectives when managing capital are: To safeguard the ability to continue as a going concern, so as to be able to continue to provide returns for shareholders and benefits for other stakeholders To provide an adequate return to shareholders by pricing products and services commensurate with the level of risk The amount of capital is set in proportion to risk. The capital structure is managed and adjusted in light of changes in economic conditions within the domestic and global steel industry and the risk characteristics of the underlying assets. The group and company overall strategy remained unchanged in. Consistent with others in the industry, the group and company monitor capital on a debt-to-total shareholders equity basis. Net debt is total interest-bearing and bank overdraft borrowings less cash and cash equivalents. Total shareholders equity is as per the statement of financial position. Group Company Cash and bank balances Interest-bearing borrowings and bank overdraft (1 950) (5 029) (1 950) (5 029) Net debt (290) (2 865) (299) (2 879) Total shareholders equity Gearing ratio (%) Estimated impact on profit or loss based on a 100 basis point change in interest rate: 100 basis point increase (2.90) (28.65) (2.99) (28.79) 100 basis point decrease
77 Notes to the group and company annual financial statements continued for the year ended 31 December Audited Annual Financial Statements Related-party transactions During the year the company and its subsidiaries, in the ordinary course of business, entered into various sales and purchase transactions with its jointly controlled entities, its associates and other entities within the greater ArcelorMittal group. These transactions occurred under terms that are no less favourable to the company than those arranged with third parties. Companies within the greater ArcelorMittal group The company purchased products and services to the value of R6 008 million (: R4 228 million) from, and sold goods to the value of R32 million (: R42 million) to other companies in the ArcelorMittal group. The outstanding balances at year-end are: Included in trade receivables, R35 million (: R49 million) Included in trade payables, R4 003 million (: R2 433 million) Included in trade payables is the corporate service fee of R490 million (: R372 million) payable to ArcelorMittal group for corporate services rendered and the fee for research and development of R260 million to ArcelorMittal Investigation (: R145 million). Included in borrowings (refer to note 24) is a loan of R1 200 million (: R3 268 million) with the holding company. Jointly controlled entities and associates Interest income for the group from jointly controlled entities of R8 million (: R6 million) is included in note 6. The group purchased goods and services to the value of R42 million (: R190 million) from, and sold goods to the value of R4 271 million (: R5 646 million) to its equity-accounted entities. The outstanding balances at year-end are: Included in trade and other receivables, R35 million (: R199 million) Included in trade payables, Rnil (: Rnil) Included in the carrying value of jointly controlled entities are non-current loans of R140 million (: R138 million). Subsidiaries Details of income from investments and indebtedness in subsidiaries are disclosed in note 15. Ltd received a management fee of R270 million (: R271 million) from Saldanha Steel (Pty) Ltd for Ltd employees employed at Saldanha Works. Directors Executive directors are defined as key senior management. Details relating to directors remuneration and shareholdings (including share options and LTIP units) in the company are disclosed in note 32. During the year, a loan of R was given to Noma Namuhla Trading and Projects Proprietary Limited, a company owned by Nomavuso Mnxasana, non-executive director of. Senior employees and prescribed officers Details relating to option and share transactions are disclosed in note 31. Shareholders The principal shareholders of the company are detailed in the Analysis of shareholders schedule in the integrated annual report.
78 72 Audited Annual Financial Statements Notes to the group and company annual financial statements continued for the year ended 31 December 29. Post-employment benefits 29.1 Pensions Independent funds provide pension and other benefits for all permanent employees and their dependants. At the end of the financial year the following funds were in existence: Selector Pension Fund (registration number 12/8/35421) and Selector Provident Fund (registration number 12/8/35423), both operating as defined contribution plans Iscor Employees Provident Fund (registration number 12/8/27484), operating as a defined contribution plan Iscor Retirement Fund (registration number 12/8/5751), operating as a defined benefit plan. This plan is closed to new entrants The assets of these plans are held separately from those of the group and are in funds under the control of the trustees. All funds are governed by the South African Pension Funds Act of 1956 as amended. Defined contribution plans Membership of each fund and employer contributions to each fund recognised in the statement of comprehensive income were: Working members Employer contributions Selector Pension and Provident Funds Iscor Employees Provident Fund Total Defined benefit plans Iscor Retirement Fund The company provides benefits for qualifying employees through the Iscor Retirement Fund, a wholly funded defined benefit plan. The fund is administered by Retirement Fund Solutions Administrators Proprietary Limited. There are currently no active members participating in the fund The normal retirement age for members is 63 years. A member s pension entitlement is calculated as 43% of notional past service contributions, plus 43% of the employer and member s contributions. The last full statutory actuarial valuation was performed at 31 December. The actuaries were of the opinion that the fund was adequately funded. Currently there are plans in progress to search for a suitable fund administrator for the Iscor Retirement Fund. Pension Fund The fund is administered by Sanlam Employee Benefits. Contribution rates based on pensionable earnings for active members are 7% and 10% by the member and, respectively. The normal retirement age for members is 63 years. A member s pension entitlement is calculated as a percentage scale of final average salary for each year of pensionable service. The percentage scale ranges from 1.7% to 2.5%, and the average final salary is the pensionable salary over the 24 months which precedes the member s retirement. On 9 November, the Financial Services Board of South Africa approved the amendment to the rules such that the company will no longer participate in the fund. Effective 1 April, the company s participation in the fund was terminated and the company is no longer required to make any further contributions to the fund in the event of a shortfall. Therefore from 1 April, the pension fund obligation ceased to be accounted for as a liability. has derecognised the liability on its balance sheet in full and ceased to disclose the Pension Fund in these disclosure notes to the financial statements from 1 April.
79 Notes to the group and company annual financial statements continued for the year ended 31 December Audited Annual Financial Statements Post-employment benefits continued 29.1 Pensions continued Pension Fund Iscor Retirement Fund Membership As at 31 December Active members Pensioner members Pension fund assets The major categories of plan assets are as follows: Fixed income securities (including cash) Equity securities Real estate 6 7 Total Principal actuarial assumptions Weighted average assumptions used for the purposes of the actuarial valuations determined in consultation with independent actuaries for both of the funds are the same. % At valuation date Discount rate General inflation rates Salary inflation % ArcelorMittal South Africa Pension Fund Iscor Retirement Fund Total Amounts recognised in comprehensive income in respect of the defined benefit plans are: Service cost Current service cost Enhancer Net finance income Administration costs Subtotal Asset restriction adjustment (14) (14) Employee costs
80 74 Audited Annual Financial Statements Notes to the group and company annual financial statements continued for the year ended 31 December 29. Post-employment benefits continued 29.1 Pensions continued ArcelorMittal South Africa Pension Fund Iscor Retirement Fund Total Amounts recognised in other comprehensive income in respect of the defined benefit plans are: Remeasurement (gains)/losses Return on plan assets (excluding amounts recognised in net interest expense) (39) 37 (39) Changes in the irrecoverable surplus in excess of interest (1 413) 65 (47) 65 (1 460) Actuarial (gains) and losses arising from changes in financial assumptions Actuarial (gains) and losses arising from experience adjustments (23) (25) 9 (25) (14) Components of defined benefit costs recognised in other comprehensive income (14) 1 (1) 1 (15) Asset restriction adjustment 14 (1) 1 (1) 15 Total Reconciliation of the funded status to amounts recognised in the statement of financial position ArcelorMittal South Africa Pension Fund Iscor Retirement Fund Total For the year ended 31 December Projected benefit obligation Fair value of plan assets (302) (280) (302) (280) Surplus (121) (47) (121) (47) Asset restriction adjustment Net (asset)/liability recognised 1 Fund rules do not give the employer an unconditional right to the surplus in the fund.
81 Notes to the group and company annual financial statements continued for the year ended 31 December Audited Annual Financial Statements Post-employment benefits continued 29.1 Pensions continued Movement in present value of benefit obligation ArcelorMittal South Africa Pension Fund Iscor Retirement Fund Total For the year ended 31 December Projected benefit obligation at the beginning of the year Interest cost Current service cost Benefits paid (189) (46) (46) (46) (235) Enhancer Derecognition of the fund (6 506) (6 506) Remeasurement (gains)/losses Actuarial (gains) and losses arising from changes in financial assumptions Actuarial (gains) and losses arising from experience adjustments (23) (25) 9 (25) (14) Projected benefit obligation at the end of the year Movement in present value of plan assets ArcelorMittal South Africa Pension Fund Iscor Retirement Fund Total For the year ended 31 December Fair value of plan assets at the beginning of the year Interest income on plan assets Expected return (1 418) (41) (1 459) Contributions employer Administration cost of plan assets Benefits paid (189) (46) (46) (46) (235) Derecognition of the fund (6 506) (6 506) Actuarial gains/(losses) Fair value of plan assets at the end of the year The Iscor Retirement Fund has no direct shareholding in Ltd. Contributions Historically funding was based on actuarially determined contributions. Following the derisking and subsequent derecognition of the Pension Fund and that the Iscor Retirement Fund does not have any active members no further contributions will be made to either fund.
82 76 Audited Annual Financial Statements Notes to the group and company annual financial statements continued for the year ended 31 December 29. Post-employment benefits continued 29.1 Pensions continued Sensitivity analysis Iscor Retirement Fund Expected longevity Discount rate (-1%) Discount rate (+1%) Percentage increase/(decrease) % 8 (9) Increase by number of years 6 Ending net surplus Ending net surplus/(deficit) 6 8 (9) 29.2 Medical benefits The company contributes to medical aid schemes for the benefit of retired employees and their dependants, where those qualifying retirees accepted early retirement in At 31 December there were 26 qualifying retirees (: 27). On the basis of current practice, which is reviewed annually, the group provides for the actuarially determined present value of post-retirement medical aid obligations. These obligations are unfunded. The group has no further post-retirement medical aid obligations for current or retired employees. 30. B-BBEE transaction At the special general meeting (SGM) of the shareholders of Ltd held on 18 November, the shareholders approved the increase in the authorised share capital of through the creation of new class ordinary shares (ArcelorMittal South Africa empowerment shares) for the purposes of the B-BBEE ownership scheme. The scheme is part of s initiatives to transform the group and achieve sustainable ownership by black people. In terms of the scheme issued empowerment shares to Amandla we Nsimbi Proprietary Limited and Isabelo Empowerment Share Trust (representing 17.0% and 5.1%, respectively, of the voting rights in ) through a notional loan. The Isabelo Empowerment Share Trust has been established to facilitate B-BBEE ownership in compliance with the B-BBEE codes and to create meaningful wealth for qualifying employees in order to ensure their long-term dedication and the retention of skills, while enhancing the transformation of. The trust has been set up for permanently employed management and non-management employees of all job grades of. The B-BBEE employee share ownership scheme is equity-settled. The empowerment shares will receive notional dividends during the lock-in period. From the first business day following the seventh anniversary of the issue date until the expiry of the lock-in period, Amandla we Nsimbi and the Isabelo Empowerment Share Trust are entitled to receive cash dividends on the ArcelorMittal South Africa empowerment shares amounting to 5% of the ordinary dividend paid on shares. This is applicable to the extent that a dividend is declared and shall not create any obligation on to declare a dividend. The A class shares granted to Amandla we Nsimbi and the Isabelo Empowerment Trust will convert into ordinary shares upon expiry of the lock-in period. There is a 10-year vesting period for the share-based payment benefit provided to the Isabelo Empowerment Share Trust and no vesting period for the share-based payment benefit provided to Amandla we Nsimbi Proprietary Limited. There are no performance targets for vesting for both ownership schemes. The administration of participant transactions of both the Amandla we Nsimbi Proprietary Limited and Isabelo Empowerment Share Trust are outsourced to EOH Human Capital Solutions Proprietary Limited, an external service provider. Key assumptions Amandla we Nsimbi Proprietary Limited Isabelo Empowerment Share Trust Fair value of in-substance option on grant date (R) Expected attrition rate (%) n/a Average days until fully vested n/a Lock-in period (years) day VWAP* Interest rate on notional loan JIBAR plus 6% JIBAR plus 6% Dividend yield 0% 0% Expected risk-free rate over the 10-year period** 7.31% 8.66% 7.31% 8.66% Expected volatility on ArcelorMittal share price*** 40% 40% Number of Monte Carlo simulations Equity upside (value in excess of future share price on transaction date) * Daily value traded data was sourced from I-NETBFA. ** Expected risk-free rates are equivalent to six-month JIBAR forward rates. *** Expected volatility on the share price is based on a 10-year exponentially weighted moving average of the share price.
83 Notes to the group and company annual financial statements continued for the year ended 31 December Audited Annual Financial Statements B-BBEE transaction continued Determination of fair value at grant date The subscription price of the deal is equivalent to the 30-day volume weighted average price (VWAP) of the share price as at 26 September less a 10% discount. The economic substance of the transaction represents a deemed option granted to Amandla we Nsimbi Proprietary Limited and the Isabelo Empowerment Share Trust. The underlying value of this option is driven by the 10% discount granted on the 30-day VWAP and volatility in the share price. The economic valuation of the B-BBEE transaction was calculated using Monte Carlo simulations based on the Geometric Brownian Model (GBM). A large number of simulations in the model predict a reasonable price for the ordinary share at the end of the scheme. The results of the simulations are then averaged and discounted to a present value to determine the value of the option at grant date. The fair value of the option on grant date was determined to be the present value of the option pay-off and the future value of trickle dividends. Notwithstanding the nominal subscription price for the empowerment shares, the aggregate notional subscription price for the empowerment shares is approximately R2.3 billion. Additionally, sensitivity analyses taken into account in the option pricing model were performed considering the forecast dividends in respect of an share; the forecast outstanding balance in respect of the A1 notional amount and A2 notional amount after lock-in period; and the expected volatility of an share of 40% based on the implied volatility utilising call options on ArcelorMittal Société Anonyme, the holding company headquartered in Luxembourg. The call options trade on Euronext Amsterdam, formerly Amsterdam Stock Exchange. Expense recognised in profit or loss Amandla we Nsimbi Proprietary Limited Amandla we Nsimbi Proprietary Limited whose shares are owned by a broad-based black consortium, Likamva Resources, subscribed for A1 ordinary shares in, representing 17% of the voting rights in. A1 ordinary shares were issued at a nominal value through a notional loan structure. This grant had no other vesting conditions at grant date and a charge amounting to R800 million (: Rnil) was recognised immediately in the statement of comprehensive income in terms of IFRS 2: Share-based Payments. Isabelo Empowerment Share Trust The Isabelo Empowerment Share Trust subscribed for A2 ordinary shares in, representing 5.1% of the voting rights. A2 ordinary shares were also issued at a nominal value through a notional loan structure. The vesting conditions attached to this scheme require the beneficiaries of the scheme to remain in the employ of for a period of 10 years. An expected attrition rate was then applied to determine the best estimate of shares expected to vest at the end of the vesting period. An income statement charge of R1 million (: Rnil) was recognised in profit and loss with the remainder of the charge to be recognised evenly over the vesting period. Transaction costs amounting to R70 million were incurred and were recognised in the statement of comprehensive income in the current year. 31. Share-based payments Equity-settled share plan local employees Long-term incentive plan The long-term incentive plan (LTIP) was adopted for the first time in The LTIP was designed to replace the equity-settled share option plan. An LTIP is a conditional award of company shares offered to eligible senior employees. The shares vest only after a predetermined period over which certain grant conditions must be met. The extent to which these grant conditions are met, governs the number of shares that vest. The number of LTIP shares granted is calculated in accordance with the employees grading within the group and is approved by the board, remuneration, social and ethics committee. Designated members of the executive committee and senior management are eligible for participation in the scheme. LTIP shares granted to senior management will vest after three years. LTIP shares to the executive committee members only vest after three years provided that the prescribed performance conditions are met. Senior management receive shares subject to ongoing employment and individual performance. New grants to senior management since will also vest depending on ongoing employment, prescribed performance conditions and individual performance conditions. Proportionate awards will be made in the event of change of effective control of the company, retrenchment, retirement or death. Upon vesting of the award, the company shall deliver the number of shares that have vested to the participating employee. The unvested units carry neither rights to dividends nor voting rights until the date of vesting. The fair value of each equity-settled unit is determined using the market value at measurement date.
84 78 Audited Annual Financial Statements Notes to the group and company annual financial statements continued for the year ended 31 December 31. Share-based payments continued Equity-settled share plan local employees continued Share Option Plan The group and company operate the Management Share Trust, consisting of an option share plan for the benefit of the group and company s senior management including executive directors. This scheme was effective from 12 December 2005 to Share options are offered at market prices on the grant date and are released in three annual tranches of 33.3%, 33.3% and 33.4% respectively, commencing on the first anniversary of the offer date and expiring after 10 years. This is an open plan. The option plans are equity-settled as each share option converts into one ordinary share of Ltd on exercise. The options carry neither rights to dividends nor voting rights. Options may be exercised at any time from the date of vesting to the date of their expiry. The number of options granted is calculated in accordance with employees role grading within the company and group as approved by the remuneration committee of and as incorporated within the trust deed of the Management Share Trust. Upon resignation, the share options lapse immediately. Upon death, the options lapse within six months. As a result of the successful rights issue on 18 January an additional (: nil) share options were granted. The effect of this transaction resulted in a IFRS 2 charge of R26 million being recognised in profit and loss in the current year. Employee Share Ownership Plan (ESOP) On 1 October the ESOP became effective. In total, 21 million shares were granted to qualifying employees that will vest after five years of continued service in the company. However, shares remain outstanding and have not yet become effective. All permanent employees who do not qualify for the company s LTIP qualify to participate in the ESOP. The employee share ownership plan is equity-settled. The relevant employees will during the lifespan of the scheme benefit proportionately in the dividends earned from the ArcelorMittal shares that will be the subject of the scheme. There are no performance targets for vesting and qualifying employees are not required to pay any consideration to participate in the scheme. The only vesting requirement is five years of continued employment in the company. The administration of participant transactions of both the share option and the LTIPs are outsourced to EOH Human Capital Solutions Proprietary Limited, an external service provider. Key assumptions For the purposes of valuing the different grants the following assumptions were made: ESOP LTIP Share options Weighted average fair value on grant date (R)* n/a n/a Expected attrition rate (%) Charge to statement of comprehensive income () * Market value of shares (which takes dividends into account) is used as the fair value.
85 Notes to the group and company annual financial statements continued for the year ended 31 December Audited Annual Financial Statements Share-based payments continued Shares available for distribution million million Opening balance Utilisation (8.8) (0.0) Adjustment to number of shares issued following rights issue 34.6 Additional share options granted after rights issue 4.8 (2.7) Revision of shares available (2.3) Releases, forfeitures, resignations Closing balance Reconciliation of outstanding LTIP units/share options/shares ESOP LTIP Share options Outstanding at the beginning of the year Granted/reinstatement Expired/cancelled/forfeited/ exercised (1.0) (2.5) (0.3) (4.3) (0.5) Outstanding at the end of the year Exercisable options/units ESOP LTIP Share options Weighted average remaining contractual life in days at year-end Average days until fully vested n/a n/a Average days until expiry n/a n/a n/a n/a Weighted average prices applicable per transaction type Granted (R/unit) Exercised strike price (R/unit) n/a n/a Lapsed/cancelled (R/unit) n/a n/a Outstanding (R/unit) Details of outstanding options/ltip units as at 31 December are: ESOP LTIP Share options Latest expiry date n/a n/a n/a n/a Exercise price range (R) n/a n/a n/a n/a Number of outstanding units/options Total proceeds to employees if exercised immediately ()* Total intrinsic value of out of the money options ()** n/a n/a (176) (258) closing price at 31 December (R) * Proceeds to employees should all options vest on 31 December. ** Hypothetically if all options were to vest on 31 December, all options are out of the money with the exception of the options granted as a result of the rights issue.
86 80 Audited Annual Financial Statements Notes to the group and company annual financial statements continued for the year ended 31 December 31. Share-based payments continued Terms of the share options outstanding at the reporting date are: Share options Exercise price range R Outstanding numbers Units Exercise price range R Outstanding numbers Units For year ended 31 December Expiry date details Total Restricted/performance stock unit plan The ArcelorMittal group commenced with the restricted/performance stock unit plan in The stock units are issued for the benefit of senior executives of the group. The restricted stock unit entitles the holder of the unit to receive one ArcelorMittal group share on or after the vesting date of the restricted stock unit, subject to the vesting conditions being met. Restricted stock units vest after three years of continued employment within the group. Performance stock units vest upon continued employment as well as specific performance conditions being met. This plan replaces the Executive International Mobility Share Option Plan. The charge to the group and company for the year amounted to Rnil (: R3 million). Latest vesting date Group and company 30 June December 2018 Number of units outstanding Units fully vested Weighted average fair value at grant date (USD) Average days until fully vested Reconciliation of outstanding restricted stock units: Units Units Outstanding at the beginning of the year Granted Transfers Exercised Expired/cancelled/forfeited (31 925) (31 925) Outstanding at the end of the year
87 Notes to the group and company annual financial statements continued for the year ended 31 December Audited Annual Financial Statements Remuneration of directors and prescribed officers This is a summary of directors remuneration, prescribed officers and the highest paid senior employees (who are not directors) for services rendered to Ltd: Notes Salary 1 R Retirement funding R Short-term incentives 2 R Equity incentives 3 R Other 4 R Total remuneration R Total remuneration R Executive directors WA de Klerk D Subramanian PS O Flaherty Subtotal Prescribed officers and highest paid employees M Adam HPR Orsoni WA Nel RH Torlage TG Nkosi W Venter AM Ngapo KS Kumar R Bardien Subtotal Total Directors fees R Committee fees R Other 4 R Total remuneration R Total remuneration R Non-executive directors PM Makwana DCG Murray LP Mondi NP Mnxasana JRD Modise NF Nicolau PS O Flaherty LC Cele NP Gosa Total Directors remuneration is not paid to the non-executive directors in the employment of the ArcelorMittal group and have therefore not been disclosed in this note. 1 Salary represents cash salary earned by directors and prescribed officers. 2 The short-term incentives relate to benefits for the December financial year, which were paid in April. 3 Further detail on the equity incentives can be found under directors unexercised share options and LTIPs in the table that follows. 4 Other includes separation payments, leave encashment, business travel claims and allowance, settlement allowance, housing benefits, international mobility allowance, medical benefits, hardship allowance and sign-on incentives. 5 WA de Klerk was appointed CEO and executive director effective 1 July. 6 D Subramanian was appointed acting CEO from 4 February to 30 June whereafter he assumed his role as chief financial officer. 7 PS O Flaherty announced his resignation as chief executive officer effective 4 February. It was proposed that he assumed a role as a non-executive director with effect from 1 March. Subsequent to this appointment he resigned as non-executive director effective 1 August. 8 TG Nkosi resigned as general manager: human resources, transformation and communications effective July. 9 AM Ngapo appointed as chief marketing officer effective 1 July. 10 KS Kumar resigned as chief marketing officer with effect from 30 July. 11 R Bardien was appointed as general manager: human resources and transformation effective 1 November. 12 DCG Murray retired as non-executive effective 26 May. 13 LC Cele was appointed as non-executive director effective 4 January. 14 NP Gosa, was appointed to represent Likamva Resources as non-executive director with effect from 1 December.
88 82 Audited Annual Financial Statements Notes to the group and company annual financial statements continued for the year ended 31 December 32. Remuneration of directors and prescribed officers continued 32.1 LTIPs and equity-settled share options The following table reflects the status of unvested LTIPs held by executive directors and the highest paid senior employees at 31 December : Names of executives Award type Award date Number of allocations at the start of the year Number of allocations made during the year Adjustment for units not expected to vest Number of allocations at the end of the year Number of allocations vested at the end of the year Issue price (R) Present value of unvested share units at the end of the year (R) WA de Klerk LTIP 10/10/ D Subramanian LTIP 10/10/ WA Nel LTIP 14/11/ /05/ /05/ /10/ RH Torlage LTIP 14/11/ /05/ /05/ /10/ M Adam LTIP 18/05/ /10/ W Venter LTIP 14/11/ /05/ /05/ /10/ LTIP shares vest within three to five years.
89 Notes to the group and company annual financial statements continued for the year ended 31 December Audited Annual Financial Statements Remuneration of directors and prescribed officers continued 32.2 Restricted stock unit (RSU)/performance stock unit (PSU) plans The following table reflects the number of restricted and performance stock units allocated to executive directors, prescribed officers and the highest paid senior employees who belong to the ArcelorMittal group share-based payment scheme: Name of executive Award type Award date Number of allocations at the start of the year Number of allocations made during the year Number of allocations at the end of the year Number of allocations vested at the end of the year Issue price (USD) Present value of unvested share units at the end of the year (USD) HPR Orsoni RSU 29/03/ /09/ /12/ /12/ PSU 29/03/ /09/ /12/ /12/ /06/ /06/ Group Company 33. Contingent liabilities Financial guarantees The value of financial guarantee contracts issued in the normal course of business from which it is anticipated that no material liabilities will arise are: Total The company has issued guarantees to the value of R756 million (: R611 million) for which all liabilities have been raised on the statement of financial position.
90 84 Audited Annual Financial Statements Notes to the group and company annual financial statements continued for the year ended 31 December Group Company 34. Commitments Capital expenditure commitments on property, plant and equipment Capital expenditure authorised and contracted for Capital expenditure authorised but not contracted for Total In accordance with the Competition Commission settlement agreement concluded in the current year, is committed to spend additional capital expenditure of R4 600 million over five years subject to affordability and feasibility. In total, R947 million has been invested in various projects in the current year. Operating lease commitments Plant, equipment, vehicles and buildings The future minimum payments under non-cancellable standalone and embedded operating leases are: Less than one year More than one year and less than five years More than five years Total None of the individual operating leases resulted in significant leasing arrangements. 35. Subsequent events Designation Designation relating to steel products and components for construction was approved in January Fair pricing The fair pricing model for flat steel products has been finalised and was implemented by the company but remains subject to final government approval. In terms thereof, the company may not charge more than an agreed basket price for various flat steel products. The directors are not aware of any other matter or circumstances arising since the end of the financial year to the date of this report, not otherwise dealt with in this report or in the group and company annual financial statements that would significantly affect the operations, the results and the financial position of the group and company. 36. Going concern Due to the strengthening of the rand/us dollar exchange rate, weak local market demand and influx of cheap imports into the country, Ltd expects sales volumes to remain flat for the next 12 months, which will be mitigated by import substitution and new products, namely heavy structural products from Evraz Highveld. Export markets are likely to be more resilient, namely Africa Overland; however, authoritative projections being that Africa will experience demand growth in the order of 4%. While the group continues to benefit from the full support of ArcelorMittal Holdings AG, Ltd has invested in various initiatives to return the company to profitability. These initiatives include improvement in capital expenditure projects, restructuring the balance sheet by converting short-term borrowing facilities to medium-term debt and new products and markets. Based on the group s 12-month funding plan, a letter of support from ArcelorMittal Holdings AG and the initiatives detailed above, the board believes that the group will have sufficient funds to pay its debts as they become due over the next 12 months, and therefore will remain a going concern. The group would like to re-emphasise that the local steel industry continues to be threatened by imports entering the market, primarily from China, hence safeguard measures are important despite the positive progress on designation initiatives to date. Shareholders are cautioned that certain management initiatives as well as other government initiatives, including the fair pricing mechanism, safeguards, and designation are key to ensure the sustainability of the group, and should these initiatives not materialise in improved sales growth in the next 12 months, there remains a material uncertainty regarding the ability of Ltd and the local steel industry to continue operating without significant structural changes.
91 Corporate information Company registration Ltd Registration number 1989/002164/06 Share code: ACL ISIN: ZAE Registered office Vanderbijlpark Works Room N3-5, Main Building Delfos Boulevard Vanderbijlpark Postal address PO Box 2 Vanderbijlpark, 1900 Telephone: +27 (0) Facsimile: +27 (0) Internet address Auditors Deloitte & Touche Deloitte Place, Building 1, The Woodlands 20 Woodlands Drive, Woodmead, 2052, South Africa Telephone: +27 (0) Facsimile: +27 (0) Transfer secretaries Computershare Investor Services (Pty) Ltd Rosebank Towers, 15 Biermann Avenue, Rosebank, 2196 PO Box 61051, Marshalltown, 2107 Telephone: Facsimile: +27 (0) web.queries@computershare.co.za United States ADR depositary The Bank of New York Mellon ADR Department 101 Barclay Street, 22nd Floor, New York, NY United States of America Internet: Company secretary Ms NB Bam Telephone: +27 (0) Facsimile: +27 (0) nomonde.bam@arcelormittal.com Sponsor JP Morgan Equities South Africa Proprietary Limited 1 Fricker Road, Illovo, Johannesburg, 2196 Private Bag X9936, Sandton, 2146 Telephone: +27 (0) Facsimile: +27 (0) BASTION GRAPHICS
 16 889")


92 Corporate Office Delfos Boulevard Vanderbijlpark Phone: +27 (0) Fax: +27 (0) GPS coordinates: E S for the online version

93 Integrated Annual Report Together creating value for all
94 Report navigation To aid navigation and cross-referencing, this report contains the following icons: our key strategic objectives, our most material issues, our top 10 risks and our key performance indicators. Our online report includes additional information on particular topics. These icons refer to our four key strategic objectives: Keeping our people safe Driving profitability Creating social value Creating a high-performance culture These icons refer to our material issues: Workplace safety B-BBEE compliance Liquidity Competition Commission issues Optimising our industrial footprint Unsustainable input costs Protection against unfair imports Environmental compliance Training for a new operating reality Customer focus and establishing a fair price for steel These icons refer to our top 10 risks: Liquidity Risk 1 Risk 6 Operational instability Market demand decline Risk 2 Risk 7 Safety performance Increased imports Risk 3 Risk 8 Environmental impacts from operations Foreign exchange exposure Risk 4 Risk 9 Insufficient input material supply and quality of input material Spread between input costs and prices Risk 5 Risk 10 Increased input costs These icons refer to our 16 key performance indicators: Number of fatalities KPI 1 KPI 9 On-time deliveries Lost time injury frequency rate KPI 2 KPI 10 B-BBEE status level Total injury frequency rate KPI 3 KPI 11 Enterprise and supplier development and preferential procurement performance Ebitda per tonne KPI 4 KPI 12 Specific environmental measures (see pages 49 to 52) Return on capital employed KPI 5 KPI 13 Fines, penalties and settlements Liquid steel production KPI 6 KPI 14 Total cost of employment per tonne of liquid steel Cash generated from operations KPI 7 KPI 15 Management control and employment equity performance Net cash/debt at year-end KPI 8 KPI 16 Execution of Future Leaders programme
95 Contents IFC Our business About this report 2 Who we are 4 Our value creation model 6 How we create social and human value 8 Key sustainability indicators 10 Our operating context 13 risk and materiality 20 Our strategy, our stakeholders and our creation of value Our leadership and reports 22 Company leadership 24 Our stakeholders and how we engage them 26 Message from the chairman 28 Message from the chief executive officer 31 Message from the chief financial officer 34 highlights and 10-year performance review 34 Five-year benchmarking Execution against our strategic objectives 36 Keeping our people safe 40 Driving profitability 45 Creating social value 54 Creating a high-performance culture Corporate governance 60 Leadership 66 Remuneration report Reports and financial results 73 Independent limited assurance report 74 Audit and risk committee report 75 Independent auditor s report on summarised consolidated financial statements 76 Summarised consolidated financial statements 81 Notes to the summarised consolidated financial statements Shareholders information, AGM and proxy 90 Analysis of ordinary shareholders 92 Notice of annual general meeting 97 Proxy form 98 Instructions and notes to the form of proxy IBC Corporate information Feedback We value feedback from our stakeholders and use it to ensure that we are reporting appropriately on the issues that are most relevant to them. Please take the time to give us your feedback on this report. Visit the web link:


96 Integrated Annual Report About this report Our vision To add value to all our stakeholders through our market leadership position in sub-saharan Africa by producing quality steel products safely, being an employer and supplier of choice while striving to be among the lowest-cost steel producers in the world. Our mission We aim to achieve our vision by: Keeping our people safe Pursuing operational excellence in all business processes Producing innovative high-quality steel solutions for our customers on time Protecting our environment and caring for the communities in which we operate Being a fair employer as well as a career and skills developer Our values These underpin our strategic objectives and impact our stakeholders: Safety Caring Customer focus Commitment VIEW THIS REPORT ONLINE Together creating value for all This is our sixth integrated annual report (IAR). With this report we aim to provide a transparent and balanced appraisal of the material issues that faced our business during the year under review and that impacted our ongoing ability to create value. The report should be read in conjunction with the full financial statements. This report aims to provide all stakeholders with an account of the group s operational, financial, economic, social and environmental performance, its use of the capitals as described by the International Integrated Reporting <IR> Framework and its creation of value in terms of those capitals, governance, opportunities and risks during the period reviewed as well as prospects. As with our report, this year we continue to place a premium on conciseness in our printed reporting while increasing our level of disclosure in our online IAR. From 2017 we will report against the new King IV Code on Corporate Governance. To this end we began a process of aligning our disclosure in this report against the new code. This report was prepared in accordance with the recommendations of Principle 9.1 of King III and the International Integrated Reporting (<IR>) Framework. Our IAR was adjudged overall winner in the Nkonki Top 100 JSE Listed Companies Integrated Reporting Awards and winner in the basic materials category. The report was the first in the history of the Top 100 Awards to receive a score of over 90%. It also won best report in the Chartered Secretaries Southern Africa small cap category. Scope and boundary of this report This IAR covers the period from 1 January to 31 December. The previous IAR covered the financial year. Our report concerns the operations of, which include Vanderbijlpark Works, Saldanha Works (flat steel products), Pretoria Works, our integrated long steel products division comprising Newcastle Works, Vereeniging and tubular products, and our Coke and Chemicals division. There has been no material change in the scope and boundary of the IAR compared to the prior year, or historical financial data. Materiality In this report we seek to address those issues that are most material to our formulation and execution of strategy. As in the previous year, in our leadership explicitly determined that our most material issues related to: Our commitment to safety as embodied in our vision, mission and values Addressing the considerable risks that threatened the sustainability of our business and that of the primary steel industry in South Africa Leadership s determination of materiality was informed by detailed reports emanating from our enterprise risk management process and extensive engagement with stakeholders, many of whose interests are today more extensively aligned with those of the company. A list of our most material issues is on 13. Our online IAR contains all the information and messages in this printed version of the report, plus additional, more detailed disclosure which we adjudge would be of value to particular stakeholders. Access our full annual financial statements The full financial statements, which are available at provide comprehensive insight into the financial position of the company for the year under review. Copies of the full financial statements may also be requested from the company secretary at our registered offices. 1 2


97 Our business Integrated Annual Report 1 Forward looking statements Certain statements in this document constitute forward looking statements which involve known and unknown risks and opportunities, other uncertainties and important factors that could turn out to be materially different following the publication of actual results. These forward looking statements speak only as of the date of this document. The company undertakes no obligation to update publicly, or release any revisions, to these forward looking statements, to reflect events or circumstances after the date of this document, or to reflect the occurrence of anticipated events. Assurance We have in place a highly developed combined assurance model and systems, the effectiveness of which receives particular, ongoing focus from the board because of the extent to which our most material risks affect our sustainability. Given our reliance on a wide range of stakeholders to grant us our legal and social licences to operate, we place as much of a premium on the integrity of external reports (particularly that of this IAR) as we place on the information used for key internal decision-making. To this end, limited assurance was applied to certain key performance indicators (KPIs), the number of which was the same (12) as in. The limited assurance report may be found in our online IAR. particular International Accounting Standard (IAS) 34 Interim Financial Reporting, the SAICA Financial Reporting Guides as issued by the Accounting Practices Committee and the Financial Pronouncements as issued by the Financial Reporting Standards Council, and the requirements of the Companies Act of South Africa as applicable to summary financial statements. An independent audit was performed by Deloitte & Touche, expressing a modified opinion with an emphasis made on going concern. The opinion on the summarised consolidated financial statements, included in the IAR, is on 75. Board responsibility The board, together with the audit and risk committee, takes responsibility for this IAR. The report was prepared by a representative team of the company, assisted by outside experts, which reported to the chief executive officer (CEO) and chief financial officer (CFO). All directors were given at least three opportunities to review and comment on the contents and to ensure the report s integrity. In the board s opinion, this report addresses the material issues and accurately presents the integrated performance of the organisation and its impacts. The board authorised this report for release on 17 March Regarding the summarised consolidated financial statements We have provided summarised consolidated financial statements in our printed report, in accordance with International Financial Reporting Standards (IFRS) and interpretations issued respectively by the International Accounting Standards Board (IASB) and the International Financial Reporting Interpretation Committee (IFRIC) of the IASB, in Wim de Klerk Chief executive officer Dean Subramanian Chief financial limited


98 2 Integrated Annual Report Who we are With headquarters in Vanderbijlpark, Gauteng, is Africa s largest steel producer with a production capacity, in a normal year, of 6.1 million tonnes of liquid steel which, after taking into account various yield factors, amounts to approximately 5.2 million tonnes of saleable steel products. This year we produced some 4.8 million tonnes of saleable steel, a very similar amount to that of. A proudly South African company, we are part of the ArcelorMittal group, the world s leading steel producer with industrial sites in over 20 countries and a presence in more than 60. Our steel is produced in flat and long products that are further processed by downstream manufacturers. We also have a Coke and Chemicals operation which produces commercial grade coke for use by the ferro-alloy industry, and processes steelmaking by-products. Ebitda contribution Flat steel (392) (1 269) Long steel 286 (348) (R392m) 0 0 R286m. Produced at Vanderbijlpark and Saldanha Works. Products include slabs and heavy plate as well as hot rolled coil, cold rolled and coated products. Major consumers are the construction, piping, packaging and automotive industries. Vanderbijlpark Works Capacity 2.9 million tonnes of liquid steel per annum One of the world s largest inland steel mills and sub-saharan Africa s biggest supplier of flat steel products. An integrated process produces liquid iron which is refined to produce, ultimately, heavy plate and coils. Capacity utilisation 82% + (: 75% 2014: 83%) Lost time injury frequency rate (LTIFR) 0.39 (: : 0.54) Flat steel products Saldanha Works Capacity 1.3 million tonnes of liquid steel per annum Largely export focused, Saldanha produces high-quality ultra-thin hot rolled coil, using a world-first merger of the Corex and Midrex technologies to replace the need for blast furnaces and coke ovens. Capacity utilisation 64% + (: 74% 2014: 87%) LTIFR 0.30 (: : 0.59) Coke and Chemicals Corporate 124 R172m R124m 381 Revenue R18.3 billion (: R15.9 billion) Liquid steel production million tonnes + (: million tonnes) + Externally assured. Revenue R5.2 billion (: R5.2 billion) Liquid steel production tonnes + (: tonnes) 0 For more information on Vanderbijlpark Works 41 For more information on Saldanha Works 41


99 Our business Integrated Annual Report 3 Our primary goal is to sell into the local and nearby markets. Currently we supply approximately 60% of the steel used in South Africa while exporting the balance to sub-saharan Africa and elsewhere. In, we permanently employed (: 9 315) people, with an estimated economy-wide employment-creating impact of over jobs. Long steel products Produced at Newcastle and Vereeniging Works. Products include bar, billets, blooms, hot-finished and cold-drawn seamless tubes, window and fencing profiles, light, medium and heavy sections, rod and forged products. Long steel products are used primarily in the construction industry. Coke and Chemicals Coke and Chemicals core business is the production of commercial coke for the ferro-alloy industry from coke batteries located at Vanderbijlpark, Newcastle and Pretoria. The business also processes and beneficiates metallurgical and steel by-products, including coal tar. These are sold as raw materials for a wide variety of uses. Capacity 1.9 million tonnes of liquid steel per annum The foremost South African producer of profile products including low and medium-carbon commercial grades, sulphur-containing free-cutting steels, micro-alloyed steels and high-carbon wire-rod steels as well as alloy steels, specialty steel, seamless tube and forge products. In, a restructuring of our long steel division entailed billets produced at the Newcastle furnace (which was relined at a cost of R1.8 billion in 2014) being transported to Vereeniging for milling, unlocking synergies and boosting return on capital employed. Tubular Products Vereeniging is the sole producer of hot rolled and cold drawn seamless tube products in South Africa. The facility produces tonnes of final product per annum, of which some 80% is exported. Capacity tonnes of commercial coke per annum Produces commercial coke for the ferro-alloy industry from coke batteries in Vanderbijlpark, Newcastle and Pretoria. Metallurgical and steel products are also beneficiated, among them coal tar. Capacity utilisation (Newcastle) 81% + (: 73% 2014: 41%) LTIFR 0.92 (Previously we reported separate LTIFR figures for Newcastle, Vereeniging and Tubular Products. In both 2014 and Newcastle s LTIFR was 0.25.) LTIFR 1.25 (: : 0.95) Revenue R1.4 billion (: R1.8 billion 2014: R2.0 billion) Revenue R10.6 billion (: R10.9 billion 2014: R9.1 billion) Liquid steel production million tonnes + (: million tonnes) Commercial coke production tonnes (: tonnes 2014: tonnes) For more information on long steel 42 For more information on Coke and Chemicals 42

100 4 Integrated Annual Report Our value creation model Our business model requires the input of various capitals in the creation of steel, coke and chemicals. We operate our business model in a social, environmental and human context from which we derive our licence to operate. We create value for a broad range of stakeholders but our business model is unsustainable if we do not create real and meaningful value for investors, employees, government, suppliers, communities and customers while proving that we are doing everything possible to minimise our environmental impact. Inputs Our working business model We produce iron and steel, commercial coke and useful by-products in three provinces, in processes that sustain hundreds of thousands of jobs. This is our business model: Natural capital Raw materials consumed 2014 Iron ore 6 562kt 6 541kt 6 604kt Coal 4 700kt 4 075kt 4 014kt Consumed scrap* 794kt 759kt 684kt Fluxes 1 612kt 1 658kt 1 733kt * Externally procured and internally generated and recycled Energy Electricity purchased (TWh) Water intake Water intake (Ml) Human and intellectual capital Making iron Using inputs including iron ore, coke and dolomite, blast furnaces convert iron ore into liquid iron. 2 Making steel products Liquid steel is cast into slabs which are hot rolled into heavy plate in a plate mill, or into coils in a strip mill. Coils are either sold as hot rolled or processed further into cold rolled and coated products such as hot dip galvanised, electrogalvanised, pre-painted sheet and tinplate. 1 Making steel Liquid iron is refined in basic oxygen furnaces (three at Vanderbijlpark and two at Newcastle) to produce liquid steel. Saldanha is the world s only steel plant to combine the Corex and Midrex processes, which replace the need for coke ovens and blast furnaces. At Vereeniging an electric arc furnace (currently closed) does the work of a traditional basic oxygen furnace Employees 8 825* 9 315* 9 056* Hired labour Service contractors Training spend R151m R202m R184m As at 31 December. * Permanently employed. Financial capital 4 Producing commercial coke Our Coke and Chemicals business produces commercial coke for the ferro-alloy and other industries from coke batteries in Newcastle, Vanderbijlpark and Pretoria as well as processing and selling steelmaking by-products Equity R20 722m R13 472m R13 543m Borrowings R1 000m R5 029m R1 950m + Externally assured. 5 Serving our customers Our steel products are used by customers in South Africa, across Africa and elsewhere in construction, manufacturing, mining and agriculture. Our coke is used to beneficiate this country s iron and chrome wealth. Our viability depends on the viability of our customers.
101 Our business Integrated Annual Report 5 Our new sales environment We are committed to fair pricing on flat steel products. Performance on this commitment has to be transparent and is enforced by regulators. Tariffs and other trade measures aim to protect us and other primary steel producers as well as downstream manufacturers from unfair governmentsubsidised imports. Outputs and outcomes Financial capital Shareholders, investors, employees 2014 Revenue R34 852m R31 141m R32 737m Ebitda R1 258m (R809m) R190m Loss from operations (R301m) (R4 736m) (R1 092m) Ebitda margin 3.6% (2.6%) 0.6% Headline loss (R224m) (R1 338m) (R244m) Manufactured capital Customers 2014 Flat steel products sold 2 981kt 2 678kt 2 736kt Domestic market 1 951kt 1 915kt 2 097kt Export market 1 030kt 763kt 639kt Long steel products sold 1 259kt 1 459kt 1 351kt Domestic market 1 051kt 1 124kt 1 178kt Export market 208kt 329kt 173kt Coke and Chemicals Market coke 466kt 451kt 367kt Tar 110kt 96kt 75kt Other (mostly slag) 1 323kt 1 120kt 710kt Human capital Employees, contractors 2014 Safety: LTIFR Safety: Fatalities Salaries and wages R3 764m R4 027m R4 175m Social capital Local communities, suppliers, HDSA businesses 2014 Socio-economic development + R16.3m R12.6m R17.4m Procurement spend R32 275m R29 047m R27 789m Direct GDP 1% 0.7% 0.9% Indirect GDP contribution R11 000m 0.4% R15 200m 0.4% R27 175m 0.4% Taxes contributed R870m R618m R837m Procurement QSE and EME R2 500m R2 800m R2 750m + Externally assured. Our flat steel prices do not derive from tariffs and safeguards but from international developments. Long steel prices are determined by a fiercely competitive market. é é é é é Trade-offs Our pricing and even particulars of our capital expenditure are monitored by independent regulators. In, as in recent years, we sought to minimise losses and preserve cash. Despite the negative effect on our financial capital we succeeded in increasing our creation of social value in several important respects. Manufactured capital Capital expenditure including optimising our industrial footprint in was R2 018 million (: R1 153 million) Human capital Apprenticeships offered 546 (: 462) Natural capital Spend on mitigating our environmental impact R176 million* (: R65 million) * Includes R38 million of direct environmental capital expenditure, and R138 million on co-generating electricity. é Social capital Procurement spend was R28 billion (: R29 billion) Social capital In the face of considerable financial constraints this year we increased our corporate social investment spend to R17.4 million + (: R12.6 million) Social capital To support downstream industry this year we gave customers export and strategic rebates worth R479 million (: R158 million)

102 6 Integrated Annual Report How we create social and human value As Africa s largest primary steel producer, creates vast social and human capital. Our products produced in South Africa by South Africans using mostly South African raw materials and skills are at the heart of the manufacturing, construction, mining and energy sectors sectors that employ millions and which create the infrastructural backbone underpinning our economy and the livelihoods of present and future generations. Employer, job creator and skills developer Over 9000 permanently employed by ArcelorMittal South Africa in of whom 64% + were ACI (African, coloured and Indian) Local economic and social impact Our plants are at the very heart of at least three regions which rely on them for employment and economic activity and to which we contribute through community investment and training In we spent R2 018 million on maintaining and enhancing our plants, in the process ensuring our ability to sustain employment in, especially, the Vaal region, northern KwaZulu-Natal and the West Coast. Much of this maintenance work was carried out by local contractors and suppliers. Key capital expenditure investments were: Newcastle coke oven battery N2 repair (R286 million) ongoing to 2017 Vanderbijlpark coke oven battery V4 repair (R135 million) ongoing to 2017 Vanderbijlpark standalone gas fired boiler (R138 million) Saldanha Midrex D01 tube bundle replacement and installation (R95 million) Saldanha Corex campaign extension (R73 million) R382m Saldanha Vaal R836m Newcastle R800m 3 jobs created for every tonnes of steel produced Over hours of training conducted at a cost of R184 million Employed 85% of new recruits from local communities (: 85%) In : Registered 470 new emerging local businesses as suppliers, bringing the total registered to Reached 527 teachers and individuals with our three sponsored science centres For detail on our local economic and social impact, see page 6 R127 million spent on technical training, apprenticeships and bursaries in For details on our performance as an employer, see 54. Invested R17.4 million in local communities through CSI (: R12.6 million (2014: R16.3 million) Opened a 1 600m 2 incubation hub which will create an initial 77 jobs and be co-funded by the Department of Trade and Industry Reduced its fresh-water intake per tonne of steel to litres per tonne against a world average of litres For detail on our environmental impact, see page 49 Catalyst for change 17% percentage of our shares held by Likamva Resources, a 100% black-owned company following our B-BBEE transaction 5.1% percentage of company shares given to a new employee trust, bringing to 6.6% employee and manager ownership R20 million spend on enterprise and supplier development 95% percentage of s 546 apprentices and 117 candidate artisans who were black; 93% of candidate technicians were black as were 61% of candidate engineers R2 750 million procurement spend with exempt micro-enterprises and qualifying small enterprises + Externally assured.

103 Our business Integrated Annual Report 7 We are committed to working with the private sector, government and labour to unlock economic growth, industrial development and job creation. Here we present some of the many ways in which we as a company, as an employer, customer and steel producer create significant value for South Africa and its people. Economic growth engine 43 new products/new specifications being actively developed by long steel products to meet customer needs, to help them find new markets and create additional jobs R479 million value of strategic and value-added export rebates given to SA customers in (: R158 million) R5.5 billion export revenue R23 billion value added by creating products which otherwise would be imported 0.9% of direct GDP R28 billion spent on suppliers NDP enablement through beneficiation The National Development Plan (NDP) contains key targets that are supported by s activities, the key being the secure domestic supply of steel required to execute the NDP s ambitious infrastructure plans. directly and indirectly contributes to the attainment of many of the plan s social, economic and environmental targets. More than 70% of our South African sales go to four key industrial sectors which, between them, account for some 20% of South Africa s GDP and almost two million jobs. Sector National economic, industrial and employment impact GDP Our contribution sales % (000 tonnes) Employment (000) Construction Utilities (water and energy) Mining Automotive In and its first order suppliers contributed an estimated R41 billion to the national economy. will enable the NDP by creating value through converting raw material to steel Touching every part of the South African economy, steel is central to the achievement of the 2030 goals of the NDP Value () Iron ore (export partly) Coal (export partly) ArcelorMittal South Africa steel value add Value of finished steel Value added by downstream Steel Steel products Structural steel Wire products Packaging Machines Agriculture Construction Energy Infrastructure Major focus of NDP 2030 Source: NDP 2030 Food and beverage Rail Pipelines 1 Raw materials considered are iron ore and coking coal (excludes limestone and dolomite), export parity price as per average estimates as reported by IMF (Iron Ore) and World Bank (South African export coal). 2 revenue less EPP value of iron ore and coal consumed by company. 3 Value of total production. Source: Steel Index at IMF, World Bank, internal data, BCG analysis. Automotive Mining Defence Oil and gas Logistics Communication Water supply
104 8 Integrated Annual Report Key sustainability indicators We seek to grow social and human capital as well as financial capital while minimising our consumption of, and impacts on, natural capital. These are some of the leading performance indicators which we closely monitor and which our strategy seeks to influence. Making steel more sustainable Risk 5 Risk 8 Risk 9 Risk 10 Key performance indicator Unit 2014 Definitions Percentage of operations certified to the ISO standard Greenhouse gases % ISO is an international standard for environmental management systems Direct carbon dioxide (CO2) Scope 1 + t/t liquid steel Direct CO 2 emissions Indirect carbon dioxide (CO2) Scope 2 + t/t liquid steel Indirect CO 2 emissions due to electricity consumption Total greenhouse gas t/t liquid steel (CO2 equivalent Scope 1 and Scope 2) + Total greenhouse gas mt (CO2 equivalent Scope 1 and Scope 2) + Atmospheric emissions Sulphur dioxides (SO2) Tonnes Particulates from point sources Tonnes By-products By-products generated mt By-products disposed (% of total) % Energy use Electricity (purchased) + TWh Total energy consumption + PJ Electricity self-generated MWh Material use Iron ore Tonnes Coal Tonnes Dolomite Tonnes Limestone Tonnes Scrap (consumed) Tonnes Externally procured and internally generated and recycled Water Fresh water intake kl Investing in our people Risk 6 Risk 7 Key performance indicator Unit 2014 Definitions Employee numbers + (permanent at Number year-end) Employee and contractor fatalities + Number Lost time injury frequency rate (LTIFR) + Disabling injury frequency rate (DIFR) Total injury frequency rate (TIFR) + Externally assured. per million hours worked per million hours worked per million hours worked LTIFR is the number of fatalities and injuries that have resulted in an employee or contractor being away from work for at least one day after the day the accident occurred, per million hours worked DIFR is the number of fatalities, lost time injuries and restricted workday case injuries per million hours worked. Restricted workday case injuries are recorded when the injured employee returns to work by their next shift and can complete meaningful tasks, but a restriction placed on them by a medical practitioner limits their ability to perform all of the tasks required of them All injuries (fatalities, DIFR, lost time injuries, medical aid and first aid injuries) per million hours worked
105 Our business Integrated Annual Report 9 Investing in our people continued Key performance indicator Unit 2014 Definitions Occupation disease frequency rate (ODFR) Percentage of operations certified to the health and safety management system standard, OHSAS Number of hours of full-time package category employee training Number of hours of full-time bargaining unit category employee training Investment in employee training and development Proportion of above focused on black employees per million hours worked Occupational diseases (work-related ailments) per million hours worked % OHSAS is an international standard for health and safety management systems Number Number of hours of full-time package category employee training. This includes health and safety training Number Number of hours of full-time bargaining unit category employee training. This includes health and safety training and on-the-job training % Investment in bursary scheme Graduates in training Number Production learners Number Apprentices Number Artisan-to-technician conversion programme Number Creating value for our stakeholders Risk 1 Risk 5 Risk 10 Key performance indicator Unit 2014 Definitions Value added statement Revenue Purchased materials and services Finance and investment income Percentage of total spend with black- % owned businesses Value distributed to: Shareholders Employees Providers of debt Government Community investment Reinvested in group Transparent governance Risk 1 Risk 9 Risk 12 Key performance indicator Unit 2014 Definitions Fines, penalties and settlements Number 1 All incidents of and fines for non-compliance with all laws and regulations associated with safety, health and environmental issues Fines, penalties and settlements Provision includes fines due to non-compliance with all laws, regulations and permits. Payments do not include levies or costs for lawyers and product liabilities. The figure reflected here relates to the penalty agreed this year with the Competition Commission, which the company will begin paying in Externally assured.
106 10 Integrated Annual Report Our operating context In recent years world and domestic steel markets have languished with a combination of weak demand and excess production capacity depressing prices. In South Africa a surge of imports has threatened both the primary and secondary steel sectors. Market overview World In 2008 the global prices of hot rolled coil (HRC) and rebar both reached over USD1 000/t. Since the prices of these two key primary steel products have persistently been less than half that figure. In there was a modest recovery in world steel demand, driven by a combination of factors including a better-than-expected Chinese economic performance, an anticipated increase in infrastructural spend following the US presidential election and a reduction in inventories in. As a result, in global steel production rose by 0.8%, to million tonnes (Mt) after contracting 3% the previous year. In the second half of world steel prices recorded sizeable increases, the Chinese HRC FOB price gaining 53% at year-end over that of the average of the previous year, to USD501/t. By year-end, the second-half price rally seemed likely to continue into the new year with the World Steel Association predicting a 0.5% rise in demand in While growth in demand remained limited and fragile, Chinese mills continued to export steel in large quantities some 108Mt in more than double that of the world s second largest exporter, Japan. This year South Africa continued to import 1.2 million tonnes of steel despite the imposition, in Q4 and Q1, of import duties on 10 products. In Chinese steel represented 52% (: 57.6%) of all South African steel imports, which declined by 17%. (In China decommissioned some 65mtpa of its approximately 200mtpa excess capacity, a development which reduced its amount available for exports.) In recent years massive worldwide overproduction and the resulting surge in exports prompted almost all countries possessing a primary steel sector to impose trade restrictions (in some instances duties of over 200%) to prevent a flood of often unfairly subsidised steel into their markets. This trend focused exporters attention on South Africa where there was no such protection, a situation that has now been partially remedied. World steel prices 2008 to Platts HRC and Rebar world price (USD/t) Dec 08 Jun 09 Dec 09 Jun 10 Dec 10 Jun 11 Dec 11 Jun 12 Dec 12 Jun 13 Dec 13 Jun 14 Dec 14 Jun 15 Dec 15 Jun 16 Dec 16 HRC Rebar Risk 2 Risk 3 South Africa As is the case worldwide, South African steel consumption correlates closely to gross domestic product (GDP) growth (and investment) and overall economic activity. In most of the major steelconsuming sectors, including manufacturing, utilities and mining, contracted while the building and construction sectors (which consume approximately 60% of all steel sold in this country) recorded a decrease in demand of 3.9%. In line with the country s lacklustre economic performance and the slight reduction in imports in, sales by domestic steel producers rose by just 0.3%, apparent steel consumption, which includes imports, showing a 2.5% ( t) decline. In real terms (local sales and imports less movements in stock), local consumption fell by 4.0%. While the domestic steel market declined, s domestic sales increased by t or 7.8% this year to 3.275Mt (: 3.039Mt). This was achieved through increased market share, largely the result of the closure of the country s second largest producer, Evraz Highveld Steel, and a stronger customer focus (see 42).
107 Our business Integrated Annual Report 11 South Africa: apparent steel consumption and market share Thousands % Q1 Q2 Q3 Q4 Q1 Q2 Q3 Q4 Apparent consumption Market share Given that this year 1.201Mt of steel continued to be imported, much of it below its cost of production, it was apparent that import tariffs had had only a limited impact. This was a situation that had been foreseen by several industry players, including our company which applied for safeguard duties on five products, as well as seeking the designation of local steel in government infrastructure projects. In January 2017 government approved the designation of local steel for state infrastructural construction projects while, in mid-, it issued notices that only local steel be used in tenders for the supply of five product categories. These decisions will, it is anticipated, have a significantly positive impact not only on primary steel producers such as but, especially, on the downstream consumers of our steel. At the time of reporting, decisions on the imposition of safeguards (short-term import duties to prevent specific harm to local industries) on specific categories of steel were still being awaited. In produced 82% of all primary steel made in South Africa; following the closure of Evraz Highveld, this grew to 88%, a development which only increased the importance of our company to the national economy. In our domestic sales of flat products increased by 9.5% or t, achieved mostly through success in replacing imports, improved supplies to steel re-rollers and the closure of Evraz Highveld. The company s domestic long steel sales rose by 5% over the previous year, thanks largely to a good first half when some competitors were late in ramping up production after experiencing production difficulties. Risk 4 Export markets Overall demand in our Africa Overland markets remained little changed from that of. Blue Water exports were impacted, however, by a drop in demand from, in particular, West Africa where a languishing oil price restricted the availability of foreign exchange which, in turn, limited imports. A drop-off in export sales to West Africa (86 000t down on ) was partly offset by rising demand in East Africa, notably Kenya. This year Saldanha succeeded in securing orders for some t of steel which had previously been imported. In 55% of Saldanha s output was exported (: 64%). This year Blue Water exports represented 15% of our sales (: 21%) and Africa Overland 5% (: 6%). Risk Risk Risk Pricing From April has committed itself to an agreement with key stakeholders (which, in February 2017, was ratified by government) to not price its flat steel products above an agreed import weighted basket price (see 46). Also, in terms of an agreement reached with the Competition Commission in August, the company will not earn an earnings before interest and tax (ebit) margin of more than 10% on flat products. (Under certain circumstances this may increase to 15%.) The flat basket comprises 50% European prices, 20% prices within the North Atlantic Free Trade Agreement area and 30% prices in the Far East. German steel prices account for half of the 50% European share of the basket. As such, any deterioration in the value of the euro against the dollar has a negative impact on our profitability.
108 12 Integrated Annual Report Our operating context continued In the HRC basket price averaged USD508/t while ArcelorMittal South Africa s HRC prices were USD509/t relative to the basket, on average for this period. Persistent rand strength against the US currency during the year (with our selling prices denominated mostly in the local currency) translated into higher USD equivalents. Average net long domestic prices realised were USD435/t (: USD446/t). Rand performance against the US dollar has a substantial impact on our profitability; whereas the ZAR/USD exchange rate at the beginning of the year was 16.60, by the end of the year the rand had strengthened to against the US currency. ArcelorMittal predominantly sells to the domestic South African market, generating ZAR receivables. However, sales prices are set, on a monthly basis, in USD which are subsequently converted to ZAR. A large proportion of raw materials are imported (predominantly coal, in USD) while iron ore purchases from the Sishen Iron Ore Company are also denominated in USD. Approximately 60% of costs are ZAR denominated (local raw materials, labour, utilities, services and debt, etc). This fact provides, to a substantial degree, a natural foreign-exchange hedge. Exports, approximately a quarter of sales, are all in USD. The company is therefore exposed to significant movement in, especially, the ZAR/USD exchange rate on both a sales and cost level. For both flat and long, we were, in every sense, a price taker with duties only determining the prices of imported steel and having no bearing on our flat prices. In agreeing to impose import tariffs, the International Trade Administration Commission has acknowledged that conditions prevailing within the global steel industry require South Africa to take reasonable and appropriate steps to protect the national economy in light of the surge in imports. In essence, this means that our prices are regulated by agreements with key stakeholders, agreements which are aimed at deriving maximum long-term, sustainable social value from our investments and our production and distribution processes. In agreeing to impose import tariffs, the authorities have accepted that the long-term benefits of having a primary steel sector are being threatened by short-term benefits (cheap, subsidised imports). In return for vitally important regulated protection against unfair imports, we accept that our ability to create financial value will be limited by the need (which we wholeheartedly endorse) to create value for customers, employees, communities and suppliers. These agreements on pricing are a reflection of the very great extent to which our interests and those of society are integrated. Not only are prices of our flat steel products (64% of domestic sales) now capped, we are also committed by our agreements to invest an agreed amount of capital expenditure R4.6 billion in the creation of manufactured capital over the next five years (subject to our ability to afford such investments). Costs In ensuring our survival, especially in a price-regulated environment, it is essential that we do everything possible to reduce our costs of inputs and of production. While striving to improve the terms of our key inputs, including iron ore, coke and coal, the raw material basket (RMB) and the spread between the basket and realised prices has a fundamental influence on our profitability and sustainability. In our RMB cost rose by 6% despite the international prices of key inputs, especially coking coal and iron ore rising in the latter part of the year by 247% and 93% respectively. With HRC prices improving by 11%, the spread between the RMB and prices realised improved from R2 632/t at the beginning of the year to R3 883/t by year-end. For details on the success of our strategy to derisk our exposure to commodity price increases see 32. Our performance on operational efficiencies is explained on 41. Our raw material basket, HRC prices and spread Risk 5 domestic HRC price RMB Spread
109 Our business Integrated Annual Report 13 risk and materiality Determining materiality In we continued to grapple with issues not just of sustainability but of survival. As in the previous year, therefore, our material issues and our strategy were almost entirely concerned with obviating risks. The board this year concurred with management s view that, to build a sustainable future for our company, we had to continue stabilising our present situation by confronting our key risks and demonstrating, in no uncertain terms, our commitment to creating value for all stakeholders. The top 10 risks facing our company in were: Risk 1 Liquidity Risk 2 Market demand decline Risk 3 Increased imports Risk 4 Foreign exchange exposure Risk 5 Spread between input costs and prices Risk 6 Operational instability Risk 7 Safety performance Risk 8 Environmental impacts from operations Insufficient input material supply and quality of input Risk 9 material Risk 10 Increased input costs The following top () risks were mitigated in : Availability of energy Competition Commission issues Contract management With the determination by our leadership that the overriding imperative facing our company was the need to ensure its survival by addressing (mostly external) risks, it followed, ipso facto, that our most material issues were derived from our top risks. In addition to material issues deriving from our risks, the health and safety of our employees and contractors is our foremost value and integral to our mission. Our most material issues this year were: With external factors testing the effectiveness of our enterprise risk management (ERM) process to the extreme, our company this year experienced a considerably renewed, sharper focus on the importance of an effective ERM process with a particular focus on the effectiveness of risk controls being built into the combined assurance process. This report seeks to explain how execution of our strategy and our governance practices created value in the year reported and is likely to do so into the future. To this end we report performance on our four key, most material, strategic objectives: Keeping our people safe Driving profitability Creating social value Creating a high-performance culture We formulate our key strategic objectives by answering the following questions: What are the most material issues our company must address if it is to create value into the future while meeting the terms of its mission and subscribing consistently to its values? What are the issues that matter most to our stakeholders? Our mission and values seek to embed safety into our DNA. Safety is non-negotiable and is always placed above any other consideration or issue; any strategy or action that compromises our ability to keep our people safe compromises our values. As a values-driven organisation, safety is our foremost material issue. Stakeholder inclusiveness is central to determining our most material issues. Engagement with stakeholders happens through formal platforms. See 24. Workplace safety Liquidity Protection against unfair imports Unsustainable input costs Establishing a fair price for steel and customer focus Competition Commission issues B-BBEE compliance Environmental compliance Optimising our industrial footprint Training for a new operating reality Explicit and perceived stakeholder concerns are regularly reported to the executive committee and board for consideration while the company s policies and strategic execution are communicated to stakeholders for input. In addition to the concerns of stakeholders, we consider the macroeconomic, political, social, legislative and regulatory environments in which we operate and do business, as well as the risk register, which is informed by our ongoing ERM systems and overseen by the audit and risk committee.
110 14 Integrated Annual Report risk and materiality continued Risk management This year our risk register highlighted the many ways in which the environments mentioned above posed very real threats to our ability to stay in business and to continue creating value. At the outset of the year our board considered detailed reports on material risks and, in addition to safety, prioritised our most material issues accordingly. These were updated during the year. Our ERM policy is aligned with the ArcelorMittal group risk management policy, world best practices, the King III Code and the ISO standard. The objective of the ERM policy is to enhance our ability to manage the uncertainties faced by our business. In the long run this will create greater confidence in the company s capacity to seize opportunities, alleviate risks and achieve sustainable successes. The following continuous improvements are focus areas within our business: Combined assurance audits to verify the control effectiveness of current controls implemented in The project risk management process being embedded and refined Ongoing changes to our internally developed risk database with a focus on combined assurance and control effectiveness Structured opportunity risk management being implemented Continuous benchmarking to improve our risk management process with cross learning between and Exxaro in The following highlights in greater detail some of the continuous risk management improvement initiatives: Asset risk mitigation By the end of, 74% of the 62 top asset risks identified in 2013 had been mitigated. Investments included significant risk mitigation expenditure at Newcastle, chief among these the R1.8 billion blast furnace reline in 2014, stove refurbishment, a sinter plant reline and a blast oxygen furnace (BOF) flare stack repair. Other business units also spent significant amounts of risk-mitigating capital on items such as the Corex campaign extension at Saldanha (at a cost of R73 million), purchasing of critical spares, upgrading drives and the improvement or installation of fire detection and suppression systems. New asset risks identified in were assessed and included in the various risk registers. Risks identified as being part of the top exposures for the company will be highlighted and addressed accordingly. Structural risk survey s plants are ageing, ranging in age between 18 and 105 years. Because of the age of our plants, the risk of structural failure was identified as a focal area in with continued focus in. Although structural risks were identified and mitigated in certain areas it was further decided to launch an investigation to determine the status of all critical physical structures within the company. This investigation included the identification of structures at risk, the frequency and adequacy of structural surveys, the state of at-risk structures and actions necessary to address concerns identified. Those structural risks identified were prioritised and actions to mitigate them allocated. Focus on maintenance oversight The CEO maintenance governance committee, initiated in, continued to meet quarterly in. The principal objective of these meetings is to monitor the execution of plant maintenance and reliability performance so as to improve plant availability/reliability while minimising or eliminating major breakdowns and risks. Information discussed supports decision-making processes on: Operating/capital expenditure Maintenance practices Risk identification and mitigation Comparison against group technical benchmarking (GTB) information Risk management database The internally developed risk management database is used to register all risks identified at. The database was initially developed in 2006 at Saldanha Works to replace then Excel-based risk documents and was subsequently rolled out across the company, becoming an established risk management tool with the following advantages: Uniformity in the application of the risk management process and risk assessment methodology An aligned, structured approach to risk management Alignment in reporting Tracking of changes to risks Security of information Ease in collaboration of risk management (reduction in administrative burden) Seamless integration with the capital expenditure database Integration with combined assurance principles Board accountability Our board is ultimately responsible for risk management and has an audit and risk committee which oversees risk policies and strategies. Top risks are also reported to the group risk committee via the group enterprise risk manager.
111 Our business Integrated Annual Report 15 IT forms an integral part of risk management, the board bearing responsibility for IT governance while delegating to management the implementation of the IT governance framework. Organisational structures and reporting framework Risk assessment process PHASE 1 PHASE 2 PHASE 3 PHASE 4 Identification Evaluation Pure risk register Mitigation Residual risk register Monitor review report Risks Scenario/effect of scenario Current controls Insurance Exposure frequency Probability/ control effectiveness Consequence Treat Terminate Tolerate Transfer Insurance REQUEST FOR CAPEX Risk reporting framework Operations ArcelorMittal group general manager ERM ArcelorMittal group risk committee Information management ArcelorMittal group general manager Insurance Corporate finance Procurement and logistics Sales and marketing Manager risk and insurance Exco ArcelorMittal group general manager Operational risks ArcelorMittal South Africa audit and risk committee ArcelorMittal South Africa board Human resources Legal/compliance INTERNAL ASSURANCE
112 16 Integrated Annual Report risk and materiality continued Risk management is structured around the following functional risk areas: sales and marketing, operations, procurement and logistics, human resources, finance, strategic, legal, health, safety and environment. The risk management process is divided into four distinct phases as per the graphic above. The link between the risk database and the capital process, which allows for risk-based budgeting and capital allocation, as well as the combined assurance process, are built into the risk process to audit current control effectiveness. Each risk area, department or business unit has a risk officer who reports directly to the head of each department. The manager of risk and insurance attends all high-level risk committee meetings and prepares consolidated risk management reports which are presented monthly to the executive committee and, on a quarterly basis, to the audit and risk committee and the board. Project risk management Project risk management, one of the focus areas in, has become part of the culture of the company. All major projects, or projects with significant risks attached, go through a structured project risk management process facilitated by the risk specialists. Project risks are identified during the different project stages and are updated at a frequency determined in conjunction with the project team. Follow-up on project risks and the implementation of mitigation actions are done during the project execution phase. Business continuity management The business continuity management (BCM) policy we have implemented is aligned with world best practices, the King III Code and the ISO standard. The purpose of this policy is to provide a basis for understanding and implementing business continuity within and to provide confidence in the organisation s dealings with stakeholders. Business continuity plans are implemented according to the risk profile of the company. This year the operational business continuity plans were revised to be aligned with changes in the business structure. In 2017 a focus will be on revising all business continuity plans including a gap analysis against best practices. Insurance Our insurance department, with the assistance of external consultants and by using recognised international procedures and standards, undertakes regular loss-prevention audits of all plants and operations. During AIG, a top three asset insurance company, again joined our loss surveyors (Axa-Matrix) in the annual loss survey exercise. The chief outcomes of the survey were: Improved fire system maintenance Improved housekeeping which contributes, among others, towards reduced fire load Increased management awareness of risks and actions to address these risks Additional emphasis required on the reliability of fire systems. Operational risk exposure is measured by risk consultants using a vulnerability index. Loss surveyors evaluate three main categories: management, fire protection and process safety (with 39 subcategories) to determine the company s vulnerability index. Our vulnerability index has improved by 24% over the past nine years. Action plans to improve the vulnerability rating have been drafted and form part of the risk management process. We have in place an insurance programme which is underpinned by an approved insurance policy providing insurance cover for losses above agreed deductibles at competitive costs (measured and determined both locally and abroad). Insurance cover is, in principle, risk-based as is outlined in the policy. Good risk management practices and vigilance by operations reduced the insurable incidents to such an extent that the company has been claim free since February This improved the company s insurability, leading to a reduction in deductibles and premiums. The company s cell captive in Ferrosure Isle of Man was also fully funded, allowing the payment of a dividend from the cell to support cash flow. Combined assurance In the combined assurance process supported by the risk management system was implemented in full. The implementation process consisted of four phases: Finalising and testing the combined assurance process within the risk systems Training risk specialists and risk database users in combined assurance principles and changes in the database Conducting combined assurance (control effectiveness) audits on top risks Auditing the combined assurance process by internal assurance during October/November. The outcome of the audit will be used to further improve on the rollout of the combined assurance process. Continuous improvement To improve the robustness of the ERM process we continuously review our risk management performance. A maturity model is used across the ArcelorMittal group to monitor the maturity of risk management processes. We are assessed in the top 10 within the ArcelorMittal group. The following actions to improve the maturity of our risk management processes are being pursued: Doing what-if and bow-tie analysis exercises on probable maximum loss areas to supplement existing continuous identification and assessment processes Analysis of different sources of information (eg incident reporting, maintenance dashboards) as input to risk identification Creating a platform whereby currently listed opportunities (as required by the incoming King IV Code) can be formally listed and reported on Embedding the combined assurance (current control effectiveness audit) process Benchmarking risk management processes Revising our business continuity plans and procedures as practical tools to reduce the impact of business interruptions
113 Our business Integrated Annual Report 17 We actively participate in risk and insurance webinars where lessons and best practices are shared with other facilities within the ArcelorMittal group. These programmes inform the ongoing improvement of our risk management processes. The ArcelorMittal South Africa risk manager is a member of the global risk steering committee that is driving improvement actions for the group by using local knowledge and skills. Compliance risk management While the company has an effective compliance policy, with the exception of some pockets of excellence, there is no entrenched compliance culture. In we began implementing an appropriate compliance framework, this process entailing the establishment of a compliance structure (including the creation of company-wide co-ordination, capability and reporting templates), appointing compliance champions and raising awareness about the importance of compliance. Using Compliance Institute of SA guidelines, we aim to effectively identify, monitor and report regulatory compliance risks. In the first business unit compliance self-assessments were done and the statutory reporting schedule was also compiled. In addition, specific projects were identified for implementation, notably a rollout plan and training in protection of personal information (POPI) compliance. Training in competition law was also begun. Outlook for 2017 We recognise that effective strategy formulation and risk management require ERM processes, principles and objectives to be aligned and embedded across the organisation. Including combined assurance principles in the risk database during contributed towards taking risk management, specifically the control effectiveness of top risks, to a new level. In the year ahead we will focus on improving the robustness of the process by, among other measures, taking the risk-control effectiveness approach to a more detailed level, testing our business continuity plans to mitigate the impact when a disaster strikes and challenging our risk financing programme when the company s risk-bearing capacity is challenged. In 2017 various actions will be taken to embed and integrate compliance risk management at both head office and business unit level. Most significant risk exposures The top strategic residual risks, as identified through our ERM process, which could impact our sustainability, are detailed in the diagram below. Heat map of our top 10 risks in (5) Critical More than USD200 million Risk 7 Risk 1 Risk 4 Risk 6 Risks Risk 1 Liquidity Risk 2 Market demand decline Financial impact (3) Moderate (4) Major USD50 to USD200 million USD10 to USD50 million Risk 8 Risk 5 Risk Risk 9 10 Risk 2 Risk 3 Risk 3 Increased imports Risk 4 Foreign exchange exposure Risk 5 Spread between input costs and prices Risk 6 Operational instability Risk 7 Safety performance (2) Minor USD4 to USD10 million Risk 8 Risk 9 Environmental impacts from operations Insufficient input material supply and quality of input material (1) Negligible Below USD4 million Risk 10 Increased input costs Below 10% 10% 30% 30% 50% 50% 90% Above 90% Likelihood of occurrence 1. Rare: very unlikely to occur during the next 12 months 2. Not impossible to occur 3. Possible: can be expected during the next 12 months at least once in the next 12 months 4. Likely to arise once during the next 12 months 5. Almost certain: will occur several times during the next 12 months
114 18 Integrated Annual Report risk and materiality continued Measures taken to mitigate our top strategic risks No Risk name and context Control details (controls currently implemented) Action details (additional actions being considered or planned to reduce the risk) 1 Liquidity A decline in markets due to minimal local infrastructure spend, a surge in imports as well as a decline in steel prices lead to severe cash pressure on the company. Sufficient cash/facilities are crucial during the current trying times 2 Market demand decline Global oversupply of steel puts pressure on steel prices. This, together with lower domestic economic activity, contributes to market demand declining 3 Increased imports Different competitive actions within the market are threatening our market share. Increased imports, particularly from China, are the main concern 4 Foreign exchange exposure With a significant portion of ebitda costs being rand-based, the company is exposed to fluctuations in the exchange rate Rights issue Promissory notes programme True sale of receivables (TSR) programme Overnight facilities at banks Loan facility with ArcelorMittal group Supplier financing programme Mandated extended payment terms Cash initiatives Expert study on Vanderbijlpark footprint Import tariffs on 10 products implemented Adequate market intelligence, including: Monitoring of imports Strategy discussions with customers Arbitration meetings Consumption modelling with customers Monitoring leading market indicators Import tariffs on 10 products Monitoring market activities and reviewing strategies accordingly Improved customer service and reliability Feedback from customers and developing account plans accordingly (target market approach) Monitoring imports and competitor activity Import tariffs on 10 products Natural hedge on USD-denominated imports (the prices of these commodities tend to increase in line with dollar strength, which impacts the rand) Borrowing-based facility (BBF) was launched Bond raising to be considered if required Sale of non-core assets Discussions with government on localisation of steel, flat steel pricing model and safeguards Working capital management Inventory management and additional on-boarding of suppliers onto supplier financing Further development of the Africa Overland market Target projects (eg infrastructure) Engagement with key customers Improving customer service Safeguard applications being pursued on selected products exposed to high risk of unfair imports Localisation of steel for state infrastructure projects Improving customer service Supply stability by continued focus on production improvements, maintenance and operational expenditure requirements Safeguard applications being pursued on selected products exposed to high risk of import Localisation of steel Continuously hedge net firm commitments and maximise cash in functional currency 5 Spread risk An increase in the raw material basket without a concomitant increase in steel prices leads to margin squeeze, impacting profitability Market intelligence on pricing parameters Contracts in place with key suppliers defining price and/or pricing mechanisms Source cheaper input materials Source better quality materials with higher Fe content to reduce costs and increase value in use Initiatives to reduce costs
115 Our business Integrated Annual Report 19 No Risk name and context Control details (controls currently implemented) Action details (additional actions being considered or planned to reduce the risk) 6 Operational instability Incidents causing operational instability leading to a loss of production are a risk not only to the profitability of the company but will also impact customers, which may prompt them to seek alternative supply, increasing the risk of imports 7 Safety performance Non-compliance and non-adherence to fatality prevention standards and unsafe acts and conditions may potentially lead to lost time injuries and ultimately to fatalities 8 Environmental impacts from operations Non-compliance with existing environmental laws and regulations could have a significant impact on the company, leading to penalties or even plant closures 9 Insufficient input material supply and quality of input material Input material disruptions due to factors such as insufficient stock holding, Transnet Freight Rail (TFR) inefficiency, supplier disruptions (such as strikes, breakdowns or incidents) and poor quality of input material could result in plant stoppages/disruptions with resultant production losses 10 Increased input costs Higher and rising input costs of material, services or transport which are not compensated by increases in steel prices could lead to margin squeeze with a resultant bottom-line impact Tracking of plant KPIs Reliability programmes (including root cause analysis) Maintenance plans Skills development Operational procedures Quality control on input material Driving adherence to fatality prevention standards Shop floor audits Management presence on the shop floor Environmental projects implemented, eg waste disposal site (Vanderbijlpark), BOF slag disposal site (Newcastle), improvements to air abatement systems Ongoing air emission, water quality and waste monitoring as required by licences Improvements to water treatment facilities at Vanderbijlpark and Newcastle Internal logistics improvement plan to address turnaround times Road transport as alternative to rail Monthly forum with TFR Daily, weekly and monthly planning meetings Integrated transport plan Logistics operations centre (LOC) with TFR on site Alternative supply of critical input material Weekly dashboard report between TFR and company CEO Change of unfavourable contract with main iron ore supplier Alternative iron ore supply Weekly stock planning meetings, target stock days Optimise internally generated material (eg scrap) Strategic partnerships Leakage prevention initiatives Increased Africa Overland supply Contracts in place with key suppliers defining price and/or pricing mechanism Business improvement process Implementation of actions to reduce asset risks through prioritised capex plan Increased focus on process safety and passive plant protection Focus on current control effectiveness Adherence to company processes and procedures Journey to zero incidents by: Reducing total injury frequency rates, disabling injury frequency rates, number of serious occurrences and potential serious injuries or fatalities Driving fatality prevention standards level 3 at all sites achieved by end Continuing with land remediation activities Capital provision for air/water and waste with a focus on air-related improvements at Newcastle Joint optimisation project between management and TFR to improve service delivery Review and maintain safety stock levels to serve as contingency Investigation into potential technical solutions at the respective plants Importation of pellets Potential reactivation of Thabazimbi to mitigate the high alumina levels of ore from Beeshoek and Sishen Investigate alternative sources including imports of iron ore Base volume to be negotiated (rail and road) thus focus should be on sustainable logistics performance
116 20 Integrated Annual Report Our strategy, our stakeholders and our creation of value Here we show how, in, our four key strategic objectives addressed our most material issues and our key risks, what these mean for our key stakeholders, and how we measure our performance on achieving our strategic objectives. Keeping our people safe Material issues, top risks and KPIs Key actions Stakeholders impacted Impact on stakeholders Other areas impacted 1 Strategic 2 Workplace safety Risk 7 KPI 1 KPI 2 KPI 3 We embedded a culture of being aware of, and reporting on, serious occurrences as well as a culture of team members taking responsibility for each other s safety. All three fatalities suffered this year were of contractor employees. Tougher penalties for safety non-conformance were instituted while the execution of nonconformance report procedures was tightened. Employees Contractors Contractors Our safety performance this year was mixed; we suffered three fatalities, Vanderbijlpark, in particular, performed well while, overall, long steel disappointed. Our lost time injury frequency rate deteriorated while our total injury rate improved. 279 contractor supervisors and employees were formally cautioned this year and one contractor blacklisted for unsatisfactory safety performance. Contractor employees identified as being high risk were required to be redeployed. To see how we performed against our key performance indicators on this strategic objective, go to 36. Material issues, top risks and KPIs Key actions Stakeholders impacted Creating a highperformance culture Creating social value Impact on stakeholders Driving profitability Other areas impacted Liquidity Risk 5 Risk 1 Risk 10 Risk 2 KPI 4 Risk 3 KPI 7 Risk 4 KPI 8 We remained liquid thanks to ongoing support from the ArcelorMittal group, by far our largest funder. At the time of reporting we were close to finalising a R3.5 billion borrowing-based facility with a tenure of 36 months. This year various cash optimisation initiatives were implemented. Shareholders Lenders Suppliers Our secured ability to meet our short-term financial obligations will positively impact shareholders, suppliers and employees. Creating a highperformance culture Optimising our industrial footprint Risk 3 Risk 5 KPI 4 Risk 6 KPI 5 Risk 9 KPI 6 This year we spent R2 018 million to maintain and modernise our production facilities while various process interventions at Vanderbijlpark resulted in combined (unaudited) savings of R754 million. Shareholders Employees Trade unions Suppliers Customers Contractors By optimising our production processes we benefit all stakeholders with an interest in our survival and growth. Customers will benefit from improved pricing and better products. Creating a highperformance culture Unsustainable input costs Risk 5 Risk 9 Risk 10 KPI 4 Our export pricing-based agreement with Kumba Iron Ore was closely managed to derive maximum benefit. We also increased (rand denominated) iron ore sourcing from other suppliers while achieving procurement savings of R860 million. Suppliers Contractors Shareholders Commodity suppliers will benefit from the sustainability of our business and some suppliers, including contractors, received expanded work scopes. We must ensure that customers benefit from our cost savings. Creating social value Protection against unfair imports Risk 2 Risk 3 KPI 4 We pursued, with the relevant authorities, tariff, safeguard and localisation measures, a majority of which were in place at year-end. Employees Government Customers Suppliers Communities Protection measures will positively impact our ability to stay in business, benefiting a wide range of stakeholders. Fair pricing will work to the advantage of customers. Localisation for state infrastructure projects, announced in January 2017, will benefit, especially, the downstream. Creating social value Customer focus and a fair price for steel Risk 2 Risk 3 Risk 6 KPI 9 A fair price for (flat) steel products was applied by ourselves from April. We established teams to focus on niche customer needs and improved on-time deliveries. Employees Government Suppliers Customers Communities Customers will benefit from more predictable, more competitive pricing. This year we paid R479 million in export and other rebates while complaints dropped and on-time deliveries improved (although not nearly enough). Creating social value Creating a highperformance culture To see how we performed against our key performance indicators on this strategic objective, go to 40.

117 Our business Integrated Annual Report 21 objectives 4 All stakeholders benefit in the medium to long term from a safer, profitable, more sustainable. In our online report we detail who our material stakeholders are, why they are important, what matters to them and how we engage with them. 3 Creating social value Material issues, top risks and KPIs Key actions Stakeholders impacted Impact on stakeholders Other areas impacted B-BBEE compliance KPI 10 KPI 11 In November shareholders approved our landmark B-BBEE ownership transaction. Shareholders Employees Government Communities New value will be created for HDSA shareholders, employees and, ultimately, our local communities. Employees now own 6.6% of the company and, in future, local community groups will have a 5% interest. Driving profitability Creating a highperformance culture In we almost doubled (to 1 107) the number of emerging businesses registered on our database, inaugurated an incubation hub and spent R16 million on enterprise and supplier development, and R17.5 million on socio-economic development. Suppliers Communities We will increase the business we do with emerging small businesses while empowering them through enterprise and supplier development. Our CSI initiatives now largely address economic opportunities for our communities. Driving profitability Competition Commission issues Risk 2 Risk 3 KPI 13 We reached an agreement with the Competition Commission, which was ratified by the Competition Tribunal. Government Shareholders The settlement draws a line under issues that have negatively affected our relations with government and regulators. These parties will now have a say in both our pricing and capital expenditure. Driving profitability Environmental compliance Risk 8 KPI 12 We continued to invest in emissions and effluent control. While meeting legal obligations, our lack of free cash flow affected our ability to mitigate our environmental impacts. Communities Government Employees We achieved considerable success this year on, especially, reducing water abstraction and effluent discharge. Driving profitability Keeping our people safe To see how we performed against our key performance indicators on this strategic objective, go to 45. Creating a high-performance culture Material issues, top risks and KPIs Key actions Stakeholders impacted Impact on stakeholders Other areas impacted Training for a new operating reality KPI 14 Risk 6 KPI 15 Risk 7 KPI 16 This year we spent R184 million on training and skills development. A total of 548 managers took part in leadership programmes while we offered apprenticeships to 546 individuals, an investment which will have a wider impact on society, especially as the country invests more in infrastructural development. Employees Leaders are being equipped with new skills while being imbued with the tenets of values-based leadership, which will transform our corporate culture. Critical technical skills are being developed. Driving profitability Keeping our people safe To see how we performed against our key performance indicators on this strategic objective, go to 54.
 Committee key 5 5 11 11 3 5 Board Audit and risk 2 2 5 6 2 0 1 SHE 1 1 0 3 1 1 B-BBEE 1 1 2 2 5 2 1 2 Nominations 2 3 Remuneration, social and ethics 10 / 10 Meeting")
 (46) Independent non-executive chairman BA (Hons) Appointed board chairman on 5 February 2013 Value added to the board: Governance, stakeholder relations and transformation")
 (44) Chief financial officer (CFO) CA(SA) Appointed CFO on 1 August Value added to the board: Experience in finance and steel industry management 4.")
 (44) Non-executive director CA(India) Appointed on 11 June Value added to the board: Experience in finance and steel industry management 6.")
 (50) Independent non-executive director BCom, BAcc, CA(SA), MBA, AMP Appointed on 1 October 2013 Value added to the board: Governance and sustainability best practice 8.")
118 22 Integrated Annual Report Company leadership Mr PM Makwana (Mpho) 2. Mr WA de Klerk (Wim) 3. Mr D Subramanian (Dean) Committee key Board Audit and risk SHE B-BBEE Nominations 2 3 Remuneration, social and ethics 10 / 10 Meeting attendance Chairman 2 Attended by invitation 3 Attended the other three meetings as a non-director 4. Mr H Blaffart (Henri) 5. Mr RK Kothari (Ramesh) 6. Mr D Clarke (David) 1. Mr PM Makwana (Mpho) (46) Independent non-executive chairman BA (Hons) Appointed board chairman on 5 February 2013 Value added to the board: Governance, stakeholder relations and transformation best practice 2. Mr WA de Klerk (Wim) (53) Chief executive officer (CEO) BCom, BAcc, CA(SA) Appointed on 1 July Value added to the board: Strategic leadership and financial insight 3. Mr D Subramanian (Dean) (44) Chief financial officer (CFO) CA(SA) Appointed CFO on 1 August Value added to the board: Experience in finance and steel industry management 4. Mr H Blaffart (Henri) (62) Non-executive director Civil engineer, MA general management Appointed on 19 July Value added to the board: Human resources, research and development 5. Mr RK Kothari (Ramesh) (44) Non-executive director CA(India) Appointed on 11 June Value added to the board: Experience in finance and steel industry management 6. Mr D Clarke (David) (52) Non-executive director PHD, MA Physics Appointed on 19 July Value added to the board: Strategy and integration and operational improvement 7. Mr JRD Modise (Jacob) (50) Independent non-executive director BCom, BAcc, CA(SA), MBA, AMP Appointed on 1 October 2013 Value added to the board: Governance and sustainability best practice 8. Mr LP Mondi (Lumkile) (54) Non-executive director MA Economics, BCom (Hons) Economics Appointed on 11 May 2007 Value added to the board: Macro-economic insight and governance

 8. Mr LP Mondi (Lumkile) 9.")
 9.")


119 Our leadership and reports Integrated Annual Report 23 During the past year the board of directors held 11 meetings, including a strategy session and five special board meetings. Attendance by directors at board and committee meetings is set out on these pages while the following pages contain reports from the chairman, chief executive officer and chief financial officer Mr JRD Modise (Jacob) 8. Mr LP Mondi (Lumkile) 9. Ms NP Gosa (Noluthando) Ms NP Mnxasana (Nomavuso) 11. Mr NF Nicolau (Neville) 12. Ms LC Cele (Zee) 9. Ms NP Gosa (Noluthando) (54) Non-executive director BA (Hons), MBA Appointed on 1 December Value added to the board: Business administration and experience in investment banking 10. Ms NP Mnxasana (Nomavuso) (60) Independent non-executive director BCompt (Hons), CA(SA) Appointed on 1 October 2013 Value added to the board: Sustainability best practice, risk and finance management expertise 11. Mr NF Nicolau (Neville) (57) Independent non-executive director BTech, MBA Appointed on 10 September Value added to the board: High-level strategic and technical insight 12. Ms LC Cele (Zee) (64) Independent non-executive director BCom, MAcc Appointed on 4 January Value added to the board: Commercial and tax expertise Board membership at the time of reporting 16% Independent non-executive 42% Non-executive 42% Executive Board gender representation 25% 75% Male Female Board diversity (including international directors) 33% Black White 67%
120 24 Integrated Annual Report Our stakeholders and how we engage them Here we list our stakeholders, why they and their concerns are important and how we engage with each group: Stakeholder group Why they are important Their interests in our business Strategic objectives and material issues Customers Provide the markets for our products Provide revenue, without which the business could not function Quality products Pricing On-time delivery Product choice Protection against unfair imports Driving profitability Creating social value Customer focus and establishing a fair price for steel Employees Integral to delivery on our strategic objectives Provide skilled labour to produce and market our products Our most important and most valued ambassadors Workplace safety Reward and recognition Security of employment Career progression Education and training Corporate reputation Our profitability Workplace safety Creating a high-performance culture Driving profitability Optimising our industrial footprint Training for a new operating reality Government (national, provincial, local), parliamentary portfolio committees, regulators Develop legislation and policies that directly impact our business Have the ability to grant or revoke licences necessary to operate and impose penalties Enforce tariff protection and the designation of local steel Product pricing Job creation Legislative and regulatory compliance Socio-economic impact Environmental compliance Transformation Creating social value Seeking the implementation of protection against unfair imports Competition Commission issues Customer focus and establishing a fair price for steel Shareholders We are accountable to shareholders who expect returns on their investments Influence decisions taken by the board Support the value of investing in the local steel industry Sustainability of our business Return on investment Effective risk management and corporate governance Good corporate citizenship Transformation Driving profitability B-BBEE compliance Suppliers and contractors Directly influence raw material and other input costs Reliable delivery impacts our ability to deliver on customer needs and expectations Impact our safety performance Opportunities for continuing and new business Fair and transparent treatment including predictable payment Employee safety Driving profitability Workplace safety Optimising our industrial footprint Trade unions More than 70% of our workforce belong to unions and more than 80% are covered by collective bargaining agreements Good relationships with organised labour can avert industrial action and positively influence the outcome of wage negotiations Union support can help secure regulatory measures which ensure our sustainability Living in the vicinity of our operations, their environment and employment opportunities are directly impacted by our business Direct beneficiaries of our corporate social investments and economic opportunities presented by our operations Will become company shareholders Maintenance of employment and new job creation Workplace safety Employee remuneration Members career advancement Employee safety Transformation Industry sustainability Our financial sustainability CSI and socio-economic development projects Environmental performance Opportunities for employment and business Creating a high-performance culture Creating social value Ensuring workplace safety Local communities Creating social value B-BBEE compliance Environmental compliance NGOs and special interest groups Represent the social and environmental concerns of local communities and broader society We previously had acrimonious relations with some community organisations CSI and socio-economic impacts Environmental performance Creating social value Environmental compliance Small and medium enterprises Provide a range of secondary products and services to our operations Provide us with the opportunities to improve our ESD scores on the dti Codes of Good Practice scorecard Are integral parts of our local communities Business opportunities Enterprise development Preferential procurement Creating social value B-BBEE compliance Lenders Provide funding required to remain in business and to invest in growth Business sustainability Predictable payment of interest and principal debt and regular servicing of facilities Security of credit Media Can influence public perception and brand reputation Access to newsworthy, timeous information Industry and economic insight Driving profitability liquidity Creating social value
121 Our leadership and reports Integrated Annual Report 25 How we engage with them Regular, ongoing engagement between sales staff, management and key customers to determine the needs of the market and identify issues as they arise Direct ad hoc communication to inform customers about new developments or the resolution of specific issues Industry associations Engagement on customer requirements for new product specifications and grades Working with government and regulators to assist downstream customers with import protection on finished products Granting and administration of rebates Online claims tracking system (new from ) Customer satisfaction surveys Social media Internal newsletters 1Magazine, Enews, CEO newsletter, CEO blog (#AskWim) and announcement mailers, intranet, posters and campaigns CEO roadshows and CEO Recognition Awards Shopfloor safety meetings Performance and career development reviews (package category employees) Formal grievance and dispute resolution structures Culture and values surveys Training and skills development Communications around employee shareholding CEO and officers in charge of specialist functions engage on an individual level with national ministry, provincial and local government representatives Industry meetings with government Detailed reports on company financial, commercial and socio-economic performance Integrated annual report International Trade Administration Commission committee meetings Industry-specific task force Direct ad hoc communications to inform government about industry developments Bi-annual and annual results presentations Shareholder and business unit roadshows and meetings Quarterly production trading updates and SENS announcements Integrated annual report Website Site visits and special events Regular meetings between management and key suppliers Managers on site conduct ongoing engagement and management of contractors Safety training for contractors Incubation hub Enterprise and supplier development projects Health and safety day Online supplier registration portal Union representation on a range of committees including safety, health and environment, training and employment equity Shopfloor line managers engagement with union representatives on a daily basis Wage negotiation process Meetings between CEO, senior management and union head office level Integrated annual report Joint presentations to government Annual community engagement facilitated by local councillors, community leaders and NGOs Environmental open days Arranged meetings with CSI managers Meetings and joint local upliftment projects with chambers of commerce and municipalities Regular planned one-on-one meetings Advertising and media buying through advertorials Integrated annual report CSI projects and investments Annual community engagement forums Local environmental quality forums Integrated annual report Structures representing government, NGOs and business Office meetings Training of local women Science centres Website Annual community engagement forums Preferential procurement days and supplier days Online vendor portal Enterprise and supplier development training Interaction with supplier development officials at business units and head office Supplier incubator hub Daily electronic and telephonic communication Regular updates by CEO and senior finance officials Bespoke presentations SENS announcements Company spokesperson responds to media queries and requests for information while keeping media informed of key developments CEO and officers in charge of specialist areas are regularly interviewed Media are invited to interim and full-year results presentations as well as important company events such as the launch of CSI projects SENS announcements and media releases Integrated annual report Site visits and media conferences Round tables and editors lunches


122 26 Integrated Annual Report Message from the chairman fully appreciates the extent to which its future and its interests are bound up with those of the society in which it operates. We have reached important new accords with stakeholders, are rapidly optimising our industrial footprint and are entrenching cultures of safety and high performance. Mpho Makwana Chairman Dear stakeholders This year we report against the theme, together creating value for all. We undertake this report believing that, after a year of tremendous change and considerable progress, we are indeed now equipped to confidently speak of a near future in which we will be able to play our part in creating sustainable value for all stakeholders. Earning our place at the table In recent integrated annual reports I have consistently written about how fully appreciates the extent to which its future and its interests are bound up with those of the society in which it operates, with those who provide us with capital, labour, revenue and our licence to operate. For some time, however, we as a company have been considered something less of an equal partner by many; for some years we have been regarded in some quarters with suspicion and even disdain. We have had to work hard to earn our full and equal place at the table securing the future of the primary and downstream steel sectors and their places in building a new, inclusive, more prosperous, more equal South Africa. In, I believe, we finally began to prove our worth and our sincere commitment to creating value for all. But while we strive to create social value, we destroy value of the most precious kind every time someone is injured, or worse, killed while working at ArcelorMittal South Africa. Safety seeping into our DNA We pause to remember the three contractor employees who tragically died on our watch in. < < Risk 7 < < < culture is finally seeping into the DNA of our organisation. Whereas in the past, improved safety indicators have lulled us into complacency (this year the indicators were decidedly mixed, see 36), we will not allow the same to happen again. There is only one thing that matters more to us than our reputation as an ethical valuecreating good corporate citizen: our reputation as a company that strives to do zero harm. Competition Commission settlement and tariff protection We thank the Competition authorities for the positive spirit they displayed in engagements over legacy issues relating to past pricing-collusion practices, issues that have now been put to bed. The settlement reached with the authorities, entailing an administrative fine of R1.5 billion, frees the company to now focus more meaningfully on the critical issues that will secure a sustainable primary steel sector in South Africa. This matter is of the utmost priority to the board, as well as to the ArcelorMittal group, especially as we look to ensure that such practices never become part of the sales culture at again. The agreements reached with the Competition Commission also foresee a cap on the prices we will charge for some products and commit the company to invest R4.6 billion in our plants and the broader steelmaking value chain. These agreements represent a bold new multistakeholder compact to direct (to borrow from the nomenclature of integrated reporting) the value our company will create for itself and for others over time. Stakeholder engagement and support We wish to thank our stakeholders: organised labour, In visits to our various business units this year, the board and I observed on shop floors, in offices and in canteens tangible signs that a deep-rooted safety our partner trade unions Numsa and Solidarity; the economic-cluster ministries within government; the regulatory agencies and our shareholders, for the instrumental roles each played in getting us this far.
123 < < < < Our leadership and reports Integrated Annual Report 27 In the recent past, these key stakeholders have all demonstrated a keen appreciation of the fact that the sustainability of the steel industry is crucial to the growth of the economy and the creation of jobs. Managing a business sustainably is impossible without meaningful support from, and partnership with, organised labour. In we reached another significant milestone with our B-BBEE initiatives deepening our commitment to our employees when, through an employee share trust, the people who work on our shop floors secured an additional 5.1% shareholding in. We hope that this will infuse an employee-owner mindset among all of our people throughout our mills, plants and corporate offices. < spent R138 million on capturing off-gases with which to self-generate electricity. This expenditure will enable us to preserve financial capital while reducing our environmental impact by lowering our Scope 2 CO 2 emissions. Leadership is committed to best practice in governance. We welcome the King IV Report on Corporate Governance and look forward to reporting to stakeholders in our 2017 integrated annual report in terms of the new code. We congratulate the distinguished members of the King Committee, whose number included our own general counsel Mohamed Adam, on their excellent work. Towards outstanding corporate citizenship We are committed to deepening both our licence to operate and meaningful corporate citizenship. To this end, in September we welcomed our strategic B-BBEE partners, Likamva Resources, who joined the family through the acquisition of a 17% shareholding. With this groundbreaking transaction, after more than a century of steelmaking in South Africa, we marked one of the most important milestones in the year that the ArcelorMittal group celebrated its 10th anniversary. As we welcome Likamva as active partners in our drive to create value for all, we also look ahead with confidence towards unlocking further value for the communities around our plants who will, within two years of the transaction date, participate in a 5% stake in the company at which so many of their sons, daughters, mothers and fathers work. Our communities are at the heart of our operations and their members are among our most important stakeholders. This year (see 47) we sought to align our corporate social investments with our value chain by creating real economic opportunities for local emerging businesses. But, as with the science centres which we sponsor, we can achieve only so much on our own. Therefore, as we report also on 39, it was extremely gratifying that, in November, government, through the Department of Trade and Industry, committed R14 million to our new incubation hub in Vanderbijlpark. Only together can we create real value for all. This year we report lower direct capital expenditure (R38 million) on mitigating our environmental impacts than the amount spent in the previous year. In fact, over and above the amount of R38 million, in we also < This year the board took leave of non-executive directors Mr Marc Vereecke and Mr Davinder Chugh while, subsequent to year-end, Mr Lumkile Mondi will leave the board he has served since I thank these gentlemen for their outstanding contributions to the ethical and effective leadership of ArcelorMittal South Africa. This year we welcomed Mr David Clarke and Mr Henri Blaffart while, following our successful B-BBEE transaction, Ms Noluthando Gosa joined the board, also as a non-executive director. Outlook ended better equipped to deal with complex and very material risks as well as various challenges from the macro-economic environment. We enter 2017 with renewed hope, a hope informed by experience, that in the second half of the year our stakeholders, especially our shareholders, will begin to experience the effects of the many hard-won victories recorded in. The new year will, we believe, represent an opportunity for us all to work together, to work harder than ever and to get back to the business of growing our economy. Invitation to attend the annual general meeting I hereby extend an invitation to all shareholders to attend the 29th annual general meeting, to be held at the Hyatt Regency Hotel, Rosebank, Johannesburg, on 24 May 2017 at 09:00. Mpho Makwana Chairman


124 < < < 28 Integrated Annual Report Message from the chief executive officer The steel downstream is at the heart of our business model and our creation of value. Tens of thousands of jobs depend on and its competitors, and tens of thousands more depend on the businesses to which we supply. Wim de Klerk Chief executive officer Dear stakeholders Readers of this report, especially those who take a close interest in our business, will notice a subtle shift in our presentation of information this year. In the recent past much of the information conveyed in our integrated annual reports has had to do with survival, about staunching losses while fixing broken processes and, especially, broken relationships. In this narrative there was relatively little about the customer, about the people who, in buying and using our steel, create economic activity, infrastructure, jobs and wealth. Getting back to basics The reason for this is simple: in recent years the issues that were most material to our survival were so daunting, so numerous and so complex that management s attention was not always focused to the degree that it should have been on that which is most fundamental to our business model. By that I mean the business of consistently getting better at making great steel safely and efficiently, selling it to customers in the quantities, quality and to the specifications that they want at world-class prices. In November the Competition Tribunal ratified our settlement agreement with the Competition Commission, which agreement ArcelorMittal South Africa has to date complied with in all material respects. Shortly after the Tribunal confirmed the settlement agreement, I communicated in a memorandum to my colleagues that, having put our legacy behaviours behind us, our management team could now focus on returning the company to sustained profitability in compliance with law. Six weeks later I wrote to my colleagues: To improve profitability and ensure sustained growth, the quality of our product, delivery, and excellent customer service are important. We really need to deliver on our budget to produce tonnes of world-class steel products that meet our customers needs. < < By its very nature a report such as this, about a company as large and complex as, talks about millions of tonnes of steel and commercial coke but our customers do not buy millions of tonnes; they and the steel they buy from us, not in millions of tonnes but perhaps hundreds of tonnes at a time, are not commodities. In, as we finally cut the Gordian knots that have tied up so much of our leadership s attention for too long, we renewed our focus on our customers, together creating value for all. Inevitably the financial health of a primary steel producer such as ourselves is tied to the health of the economy in which it operates. Reputable research proves that when there is zero or near-zero growth, steel markets contract. This is the situation in which South Africa regrettably found itself in. With almost non-existent GDP growth, domestic steel shipments contracted while in some of the African markets to which we export, infrastructural investment faltered. As the financial and operational discussions in this report make clear, this year our company succeeded in increasing sales. This was largely ascribable to developments affecting our competitors, to a limited extent to a slowdown in imports but also to our renewed focus on the customers who keep us in business. Despite all of this, for much of the year we were selling our steel at prices that were at the lowest levels seen for many years. The steel downstream is at the heart of our business model and our value creation. Tens of thousands of jobs depend on and its competitors, and tens of thousands more depend on the businesses to which we supply. Whereas we are simply unable to compete against imported steel that has been produced with foreign government subsidies, the South African authorities appreciate only too well the importance of ensuring the health of the downstream sectors.
125 Our leadership and reports Integrated Annual Report 29 This year import tariffs on 10 product ranges were in force and, in the third week of January 2017 government announced its decision to designate locally produced and manufactured steel products and components for state construction projects. It was in light of this announcement that I issued my internal communication (referred to above) about the need for us to consistently achieve quality, delivery and service to meet our customers needs. In February 2017 government, through the Department of Trade and Industry, formally endorsed the fair pricing agreement (see 11) which we had applied since April. Throughout our recent interactions and negotiations with government both parties have been motivated by an open, honest desire to ensure not only that all elements of the steel sector can survive but that everything possible is done to ensure their ability to thrive, invest and create new jobs. The requirement that public sector construction must use 100% locally made steel is tremendously good news for but it is especially good news for the downstream, for our customers. This requirement will in time help to divert import orders back to the factories of local manufacturers and producers, creating new opportunities and employment for hundreds of businesses and thousands of people. In assisting our customers to take full advantage of these new opportunities, our company has already signalled its commitment in a number of concrete ways to create considerable social value. At the time of reporting, the International Trade Administration Commission (ITAC) had yet to make a final decision on whether to implement safeguard duties on HRC and cold rolled coil. Safeguards are of the utmost importance to the sustainability not only of our company but to that of thousands of downstream businesses. In 2017 we will work closely with these same customers and the authorities, including ITAC on together creating solutions that are to the benefit of all stakeholders. Ensuring the safety of our people A task that occupied a great deal of management s time and attention this year, as it does every year, was our safety record and safety culture. We have reason to believe that a deep-rooted safety culture is indeed finally taking root at a belief that would appear to be borne out by at least one key safety indicator our total injury frequency rate. This year management at all levels, as well as our dedicated health and safety professionals, worked with diligence and considerable creativity to engender a 24/7 safety ethos (see 37). Yet, as readers of this report < < < < < < Risk 3 Risk 7 Risk 1 Risk 5 Risk 5 Risk 10 Risk 6 Risk 5 < < < < < < < < < < are repeatedly reminded, we suffered three deaths at our premises, all of them contractor employees. Also, most disappointingly, our lost time injury frequency rate worsened from 0.48 to As much as our safety drive in used imaginative means to bring home safety awareness, we have begun to act with the most extreme rigour against unsafe acts and unsafe mindsets. Contractors are essential to our production of quality steel but any supplier who does not live up to our high expectations on keeping everyone safe will simply not be allowed to do business with us. Driving profitability A fundamental upshot of the new steel order is that we now have less control over the domestic prices we receive for our products (see 46). This year, in line with international developments (which stemmed largely from sharp rises in the prices of iron ore and, especially coking coal), our average net realised price rose by 8%. This increase had no relation to import tariffs, was lower than international price rises and entirely in keeping with the undertakings we have made in terms of our fair pricing agreements. While our room to manoeuvre on pricing has been limited, we do have the means to optimise our footprint to produce our steel more efficiently and, from this year, have had a greater measure of control over our raw material costs. We are still some way off achieving sustainable profitability but our operational and financial performance speaks volumes about the strides we have made on driving profitability. Excluding the impact of once-off items our, ebitda performance this year was R1 billion better than the previous year while we produced steel at prices that often compared with the best in the world. Of particular note, I believe, was the performance this year of our flagship Vanderbijlpark Works. Running at 81% capacity despite a Q4 rupture of the stove at blast furnace C which deprived us of t of production, Vanderbijlpark achieved enormous success in terms of reliability and cost. At all of our plants we invested a great deal in capital expenditure (75% more than in ), in improving the reliability and efficiency of our operations. While this large outlay had a material impact on our profitability performance this year, this investment will have a significant short and mediumterm effect on our ability to generate sustainable profits. It was thanks to such much improved performances that this year we were able to more than triple, to R479 million, the value of rebates given to our customers, a very real way in which we create social value. As much as we value customers as partners, we rely on our supplier partners to support us in creating
126 < < < < < 30 Integrated Annual Report Message from the chief executive officer continued sustainable value. Regrettably, just one part of our supply chain transport proved to be a stubbornly conspicuous area of underperformance. Because of consistently poor service from our rail partner, we had to bring very large amounts of material to our plants by truck, translating into added, unnecessary costs of R535 million. The impact of such a single cost item on our overall performance will be readily apparent. Encouragingly, towards the end of the year the quality of our dialogue with Transnet management improved considerably and we are confident that undertakings they have made, to improve their service levels, will bear fruit in Of particular note was the reopening in February 2017 of the Elandsfontein Intermodal Terminal in Germiston which will, we envisage, result in the shipping of some tonnes of finished product being migrated from road to rail. < < the traditional trades had an average pass mark of 87%, against a national average of between 45% and 54%. Most unusually, this report begins to give an indication of the financial return we derived from this investment in human capital (see 41 and 54). At all of our plants and among all of our customer-facing teams, tangible benefits amounting to several hundred million rand flowed from the inspiration and application demonstrated this year by highly motivated people. Outlook The prospects for a strong economic rebound in 2017 remain limited and we believe that the low-growth, stagnant steel consumption context of recent years will continue to prevail for at least the foreseeable future. In similar vein, we are encouraged by a greater willingness from the management of Eskom to work with us on ways to unlock mutual benefits. Also encouragingly, we are able to report a substantial improvement in the quality of the dialogue we today have with our local communities on our environmental impacts, a dialogue that is now characterised by openness and empathy. Equally constructive is the engagement we have with our trade unions. As the chairman mentions, we are delighted that our employees and soon the people living near our plants will have substantial stakes in our company. Not the least of our achievements in was the tolling agreement we were able to reach with Evraz Highveld Steel to produce heavy structural products (see 42) at their facilities in Mpumalanga. Not only will this exciting new arrangement contribute towards returning to profitability, it will secure hundreds of jobs and boost economic activity in an area in which it is sorely needed. Reviving employment was also a key consideration in our acquisition of the Thabazimbi mine assets (see 42). Creating a high-performance culture We are unusual in reporting (as we have done since 2014) on so-called human resources issues with such prominence. There is good reason for this: we are convinced that building a high-performance culture is of the utmost importance to our financial sustainability and we believe that a high-performance culture is only possible with a truly transformed and truly empowered workforce. This is why I believe that one of our greatest achievements this year was the large investment we once again made in the skills of our people. < < Risk 1 Risk 10 Risk 8 In the new year we do predict with some confidence, however, a modest improvement in our export markets (representing opportunities which we will pursue with determination) and a return to more normal levels of profitability by Coke and Chemicals. On sales of long steel products in particular, high levels of competition and dampened demand from key customer sectors are likely to persist for much of 2017 with an upturn only likely in the second half of the year. So-called carbon taxes, on which we have engaged with multiple stakeholders for some years, may have a negative impact on our profitability in As we have done in the past, we will continue to vigorously argue the position that, unless implemented and applied in ways that support the achievement of desired outcomes, such taxes can have extremely negative impacts on investment and job creation. In the new year the prices of our key inputs will have a very substantial, very direct bearing on the spread between the raw material basket and our steel prices, and therefore on our profitability. It is our view that market fundamentals do not justify the raw material price hikes witnessed in and that these will return to more normal levels in the new year. Currency movements, which are similarly beyond our control, will have a material impact on our raw material baskets and our prices. While was a year of profound challenges it was also a year of profound achievements. In the year reported we achieved a great deal in terms of our ability to create human, manufactured, social and ultimately financial value. We will build on these achievements at our plants, in our communities, on our customers shop floors and in our relations with all stakeholders to, together, create new value in This year we record, with great satisfaction, the fact that our engineering academy at Vanderbijlpark which offers all of Wim de Klerk Chief executive officer

127 Our leadership and reports Integrated Annual Report 31 Message from the chief financial officer In a world that is awash with steel, we succeeded to a remarkable extent in not just navigating through a most challenging year but in boosting our competitiveness, significantly reducing losses and stabilising and improving most aspects of the business. Dean Subramanian Chief financial officer Overview In the company made considerable progress towards achieving and ultimately maintaining financial sustainability despite an operating context which continued to be extremely adverse. Around the world and in our key markets, including South Africa, there was no appreciable increase in steel demand with traditionally large domestic consumers experiencing zero or even negative growth. In South Africa large quantities of foreign government-subsidised steel continued to be imported despite the introduction, in late and early, of 10% import duties. Imports reduced from 1.3Mt to 1.2Mt negated by the reduction in apparent steel consumption from approximately 5Mt to 4.1Mt. Elsewhere in our main export markets demand remained subdued. Meanwhile global prices of our most important input raw materials increased dramatically iron ore by 100% and coking coal by as much as 247%. On the back of these sharp cost increases, world steel prices rose towards the end of the year, hot rolled coil (HRC) price gaining 93% over a year previously and rebar ending 75% stronger. In a year of substantial (and profoundly positive) corporate activity, voluntarily followed the terms of a fair pricing agreement for eight of the 12 months reviewed. This had the effect of capping the prices realised on flat products, the products that account for two-thirds of our revenue. Added to this, rand strength in limited the upside potential of stronger global steel prices reflecting the considerable foreign-exchange risks to which we are exposed. In a world that was awash with steel (much of it for sale at prices below its actual cost of production and shipment) with the active support of investors, regulators, customers and employees, we succeeded to a remarkable extent in not just navigating through a most challenging year but in boosting our competitiveness, significantly reducing losses and stabilising and improving most aspects of the business. < < Results for the year Revenue Once-off items Ebitda 190 (809) Loss from operations (1 092) (4 736) Impairments (2 154) (4 254) Finance and investment income Finance costs (876) (1 208) Equity earnings B-BBEE charge (870) Headline loss (2 589) (5 370) Headline loss per share (cents) (244) (1 338) Results for the year In revenue increased by 5% to R million after declining by some 11% the previous year. This was despite total shipments reducing by tonnes, a small contraction relative to shrinking apparent and real domestic steel consumption, a 26% reduction in export sales and a 24% drop in revenue from the Coke and Chemicals division. Significantly, necessary planned maintenance programmes the Saldanha campaign extension and repairs to our coke batteries resulted in lost revenue opportunities for Saldanha of R700 million and lost revenue opportunities and increased cost for coke and chemicals of R400 million. The company increased its share of the South African market marginally, mostly the result of the closure of Evraz Highveld Steel and Vanadium. With average net realised steel prices rising by 8% to R7 282/tonne and despite the impact of commercial coke and tar sales being respectively 19% and 22% lower, ebitda improved from s negative R809 million to a positive R190 million. The reduced headline loss stemmed from higher revenue, lower depreciation and once-off items that were markedly lower than those of when impairments amounted to R4 254 million (: R2 154 million).
128 < 32 Integrated Annual Report Message from the chief financial officer continued This year once-off items amounted to R227 million. These included matters outstanding in the previous year including finalisation of the Competition Commission penalty provision, release of payments in advance and Thabazimbi closure costs. Ahead of our planned acquisition of the Thabazimbi mining right, this year we recognised an additional R380 million of rehabilitation costs. Key results drivers ebita bridge () (255) (1 067) (809) Headline loss for fell sharply, from s R5 370 million to R2 589 million. As we promised the market, a portion of the proceeds of our R4.5 billion January rights issue were mostly used to repay debt. As a result, financing costs were R332 million lower this year and the year-end net borrowing position fell from R2 865 million to R290 million. Despite these positives, the company s operating context was such that generating cash remained a challenge and consequently, liquidity remained our biggest risk which is further impacted by an extremely volatile currency. Operational results were mostly encouraging. Vanderbijlpark produced HRC at a record low cost of USD386/t, 12% better than the cost. Overall steel production increased with Saldanha and Vanderbijlpark improving their capacity utilisation. This was despite a mini-reline which will have the effect of extending Saldanha s life by six years, as well as extensive, costly repairs to the coke batteries at Vanderbijlpark and Newcastle. The repair in the coke battery resulted in significant import of metallurgical coke and once-off costs to the business. Cash flow Cash generated from operations before working capital 215 (1 911) Working capital Capex (2 008) (1 256) Net finance cost (451) (537) Investments (11) (8) Rights issue Tax (2) (40) Dividend received 114 Proceeds on scrapping of assets 67 2 Realised Forex (268) (258) (Decrease)/increase of borrowings and finance lease (3 141) Transaction cost (B-BBEE) (55) Cash flow (496) Effect of forex rate change on cash (8) 20 Net cash flow (504) Cash and cash equivalents at the beginning of the year Cash and cash equivalents at the end of the year Short-term loans (1 950) (5 029) Net borrowings (290) (2 865) < < Ebitda Sales volume Sales prices and mix Variable cost Coke and Chemicals Fixed cost and other Ebitda Costs This year contractual arrangements succeeded in largely shielding the company from the effects of very sharp increases in the global prices of raw materials, being iron ore, coal and scrap (which in accounted for 44% of total costs). Whereas these key inputs increased during the year by the significant amounts detailed above, our cash cost per tonne of liquid steel produced rose by less than 5% to R6 544/t. In mitigating potential input price shocks was achieved by increasing the percentage of rand-denominated iron ore received by our business units to 50% while also consuming previously stockpiled material. In addition, imported coking coal was, as was previously the case, received via the ArcelorMittal group s sourcing structure which benefits from being one of the world s largest buyers of the commodity. Whereas the abovementioned coal price increase (247%) reflected spot prices, ArcelorMittal Sourcing negotiates contracts on a quarterly basis. This year our company also continued to enjoy the benefit of advantageous terms received from local suppliers of coking and non-coking coal. The higher price of the RMB will impact the business in Q due to three months stockholding. Consumables and auxiliaries (31% of costs) rose this year by 9%, electricity by 2% and fixed costs by only 3%. At USD73/t of liquid steel produced, our total cost of employment, measured in dollar, declined for the second consecutive year, meaning that our human cost of producing steel has fallen by almost a quarter in two years. In, however, the performance of Transnet Freight Rail deteriorated, performance falling from 86% to 78% and necessitating additional road transport costs of R535 million. Despite these challenges, great success was achieved this year on managing down variable costs, savings net of production, exchange rate and market influences amounting to R860 million being achieved on the procurement of goods and services. Of particular note, in a business improvement drive at Vanderbijlpark Works alone recorded savings of R754 million. In 2017 the lessons learnt from this process will, it is envisaged, be rolled out to other plants.
129 < Our leadership and reports Integrated Annual Report 33 Cash and debt This year cash generated from operations amounted to R873 million (: a negative R264 million), reflecting mainly a decrease in net working capital of R658 million. This in turn derived largely from a R2 958 million increase in accounts payable which in turn was partly offset by an increase in inventories of R1 830 million. Excluding the effects of the January rights issue and borrowings, we had a net decrease in cash this year amounting to R1 855 million, the bulk of which consisted of a financing cost of R451 million and R2 008 million in necessary capital expenditure. Also encouraging this year was the repaying of more than R3 billion in debt: R2 000 million of group debt and R1 141 million of other debt (payments which were made possible by the rights issue). Main steel cost drivers (R/t liquid steel) < < In ensuring that we remained a going concern in it is important to stress the vital support received from the ArcelorMittal group. Over and above extending to the company a facility of R2 700 million, the group underwrote and fully followed its rights in January. At the time of reporting, other than the group s loan, the company s only access to credit consisted of overnight facilities with a variety of local banks, clearly an untenable situation. In the company therefore embarked on a process to match the tenor of its borrowings to its cash requirement, mainly capital expenditure and working capital. To this end, in February 2017 we launched a R3.5 billion borrowing-based facility, which amount will, we believe, be adequate to fund the company for the medium term. Change on % weight Iron ore and pellets Scrap/DRI/HBI Raw material Coal (imported and domestically sourced) basket 44% Electricity Auxiliaries Other energy and utilities and Alloys, fluxes and coating materials consumables Refractories, electrodes and consumables % Manpower Maintenance Fixed cost Other* % Total % Liquid steel (000t) Average exchange rate (R) * General expenses, outside services, expert fees, IS/IT and insurance premiums. Share price After losing 83% in value in, our share price recovered strongly this year, adding 156% to finish the year at cents. The improvement in the value of our equities was particularly pronounced in the lead-up to our B-BBEE transaction, an improvement which was maintained up to the time of reporting. The board and management have been extremely gratified by this vote of confidence in the company s future, a confidence which they fully intend to repay. Outlook Should the borrowing-based facility be secured and suitable safeguards be implemented to effectively curb imports, we are confident that the business will have been largely derisked, positioning it to exploit any upturn in demand and improvement in pricing, to the benefit of all stakeholders. The imperative of addressing our cash challenges will, however, remain a key management task as we work to put in place optimal working capital structures. As noted, in impairments of R1 721 million and R420 million were raised against our Vanderbijlpark and Saldanha operations, the impairments deriving from < continuing rand strength, and further volatility will have a significant impact on the business. In we spent a great deal on maintaining and improving Vanderbijlpark and Saldanha and on equipping those plants people with the skills to produce steel safely, efficiently and at a world-class cost. This year, in reaching a long-awaited settlement with the Competition Commission (see 47), we committed to continue investing considerable sums in our plants and facilities, much of which will necessarily be devoted to our two flat steel works. Were it not for the continuing import of approximately 1.2Mt of steel and the strong rand, much of it at unfairly subsidised prices, Vanderbijlpark in particular would not have incurred the unwelcome impairment recorded this year. We remain confident, however, that the relevant authorities will, in 2017, take the requisite action needed to ensure the survival and growth of Vanderbijlpark and South Africa s primary steel sector. To this end, we look forward to the imposition of much needed additional trade remedies and to reporting in a year s time on a further improved financial position and a substantially reduced financial risk. Dean Subramanian Chief financial officer
130 34 Integrated Annual Report highlights and 10-year performance review In addition to the information disclosed in the chief financial officer s report, here we detail key indicators that inform our strategic objective of driving profitability (see also 40) Revenue Ebitda by segment Flat Long Coke and Chemicals Other (75) (284) 19 Ebitda/tonne R/t Ebitda margin % Headline earnings (440) Production (tonnes of liquid steel) 000 tonnes Flat 000 tonnes Long 000 tonnes Sales by segment 000 tonnes Flat 000 tonnes Long 000 tonnes Sales by market Domestic 000 tonnes Africa Overland 000 tonnes Blue water exports 000 tonnes Net cash/borrowings Capacity utilisation (liquid steel) % Productivity tonnes of HRC equivalent/total FTE t/fte n/a Five-year benchmarking Ebitda margin % ArcelorMittal Global* # (2.6) 0.6 Ebitda/tonne production (USD/t) ArcelorMittal Global* # (15.4) 3.2 USD/t cost (revenue less ebitda) ArcelorMittal Global* # China import prices, ArcelorMittal South Africa costs and prices China hot rolled coil (price) φ Vanderbijlpark hot rolled coil (cash cost)# Saldanha hot rolled coil (cash cost)# hot rolled coil (domestic prices)
131 Our leadership and reports Integrated Annual Report (809) (266) (1 269) (392) (348) (39) (247) 114 (79) (196) (2.6) (52) (518) (224) (227) (5 370) (2 589) (546) (2 865) (290) China import prices, ArcelorMittal South Africa costs and prices China rebar (price) Newcastle rebar (cash cost)# rebar (domestic prices) International raw material basket (USD/t) Flat Long South African raw material basket (USD/t including transport) Flat Vanderbijlpark# Saldanha# Long Newcastle# * Restated to ArcelorMittal Global reported figures (previously UBS report). # ArcelorMittal s previously published results. φ USD/t selling price into South Africa-China import price equals China export (FOB/t) plus sea freight plus trader margin. Platts/MB.


132 36 Integrated Annual Report Strategic objective 1: Keeping our people safe If we cannot keep our people safe we should not be in the steel business KPI 1 Why this is important Safety affects our people s lives and their work performance, our reputation, market acceptance, profitability and potentially, our legal licence to operate. Unless everyone feels safe while working at our company, we will be unable to maintain a high-performance culture, without which we will fail to drive profitability; safety not only underpins our licence to operate but is essential to our sustainability. In three people died while working at. These tragic events were utterly unacceptable. Three-year key performance indicators Work-related fatalities Work-related fatalities Lost time injury frequency rate KPI 2 Lost time injury frequency rate (LTIFR) KPI 3 Total injury frequency rate (TIFR) Externally assured Issues that were most material to driving safety issues in Ensuring workplace safety Addressing contractor safety compliance Total injury frequency rate Key actions taken in to achieve this strategic objective Embedded a company-wide focus on serious occurrences Focused on total injuries, to cultivate a 24/7 safety mindset Communicated emotional connections to safety
133 Execution against our strategic objectives Integrated Annual Report 37 A mixed safety performance Our safety performance in was decidedly mixed with some business units achieving outstanding, sometimes record, safety milestones while others returned results that differed markedly from quarter to quarter. This year we suffered three work-related fatalities, all three deaths being contractor employees and all three tragic incidents being entirely preventable. In we made considerable progress in bedding down important new aspects of our safety policy and monitoring and reporting procedures. In particular, we focused on engendering a new culture which emphasises individual and team caring and responsibility above systems while successfully communicating the devastating emotional consequences of unsafe behaviour. This year senior management reported having benefited from stronger, more resolute board leadership on safety. This was largely ascribed to the efforts and vigilance of the safety, health and environment (SHE) committee which, from this year, is chaired by independent non-executive director Neville Nicolau. In, at 0.62 our overall LTIFR deteriorated from the 0.48 of the previous year and even the 0.58 of This disappointing result was largely the result of underperformance by the long steel products division. At mid-year, by which time long steel s safety record for the year had become a cause for serious concern, the SHE committee approved a number of interventions aimed at improving this performance. These included re-energising the behaviour-based care (BBC) process, increased vigilance including more after-hour visits by senior personnel, communicating lower risk thresholds and reviewing, and remedying, contractors specific on-site risk profiles. There were, however, pockets of safety excellence at long steel products; the reasons why these areas of operation performed relatively so well were examined by senior management and lessons learnt communicated to, especially, underperforming areas. Lost time injury frequency rate (quarterly) Q1 Q2 Q3 Q4 At 0.89 the disabling injury frequency rate which includes fatalities, lost time injuries and restricted workday case injuries was also worse than that of (0.70). Vanderbijlpark Works recorded an outstanding safety record in. Achievements included more than 12 million lost time injury (LTI)-free man hours being worked for a 200-day LTI-free record and an LTIFR that declined from 0.51 of to Total injury frequency rate (quarterly) One most encouraging achievement was the successful Saldanha reline which was completed without a single LTI. In May this year Saldanha achieved a 664-day LTI-free record and finished the year with an LTIFR of 0.30 (: 0.0). Q1 Q2 Q3 Q4 While flat steel products performed admirably, the same could not be said for long steel products where most safety indicators disappointed. In addition to two deaths (both at Newcastle) most long steel indicators deteriorated: LTIFR 0.92 and total injury frequency rate (TIFR) (in long steel products did not report safety as a single unit).
134 38 Integrated Annual Report Strategic objective 1: Keeping our people safe continued Changing our safety culture This year management reported safety gains deriving from the more devolved management structures implemented the previous year. This gave individual business units the ability to apply protocols and to communicate in ways that speak more effectively to employees experiences on the ground. In particular, general managers were motivated to assume even greater responsibility for safety and to remedy identified gaps in safety and supervisory skills, especially those of contractors. Across the company a key focus in was on the quality of safety communications, at pre-shift and other meetings where a brother s keeper initiative was instituted and employees were encouraged to speak out about unsafe conditions or acts. Company-wide communications aimed to cement an emotional connection, in the minds of employees and contractor staff, between safety and their behaviour. To this end some drawings by employees children and grandchildren reminding employees about how their families depended on them to keep themselves safe were prominently displayed along with symbolic walls and gardens of remembrance, commemorating those who had lost their lives at our premises. Vanderbijlpark undertook industrial theatre performances which involved plays communicating the importance of subordinates not being pressured into accepting unsafe conditions and practices by their superiors, and a snake handler displaying live snakes (to convey impactful hazard-awareness messages). The snakes for safety training programme is fully integrated with the company s hazard identification and risk assessment programme, using live snakes as metaphors for the hazards of life and work. Contractor safety a key concern This year all three people killed while working at our plants were employees of contractors. Similarly, in 2014 three of four people killed in work-related incidents at our premises worked for contractors while of the two fatalities in, one was of a contractor employee. In the past three years, therefore, seven of nine people killed at our facilities worked for contractors. On 14 January Mr VTS Xaba, a general worker employed by a contractor, was killed when a coke crusher at Newcastle, which he had entered to remove a blockage, started up unexpectedly, not having been isolated and locked out. Mr Xaba was 38 years old and the father of two children aged three and five. On 30 May Mr JW Vermaak was crushed when a large tundish, also at Newcastle Works, fell on him while he and colleagues attempted to flip the tundish over, a most unorthodox procedure which was aimed at loosening its refractory lining prior to it being relined. Mr Vermaak was 62 years old. He leaves a wife and two children. On 10 November Mr Tebogo Motsepe, a security officer, died when he fell through a translucent section of roofing at Vanderbijlpark s Cold Rolling South installation. At the time he was attempting to apprehend suspected copper thieves. Mr Motsepe was married with a three-year-old child. Serious occurrences/potential to cause serious injury or fatality (quarterly) In keeping with our greater emphasis on creating an environment in which everyone takes responsibility for their safety and that of their colleagues and teams, we intend to embrace so-called positive performance indicators which classify and emphasise the effects injuries have on the lives of individuals over the much-relied on capturing of LTIs. However, for at least the foreseeable future, LTIFR will remain a cardinal measure of our safety performance at plant and company level In pursuing the ArcelorMittal group key sustainability outcome of ensuring safe, healthy, quality working lives for our people we believe that a more meaningful measure of the extent to which the desired safety culture has taken root at is the TIFR. In our TIFR stood at 9.50 (: 10.77, 2014: 15.83). Q1 Q2 Q3 Q4 Unsafe acts (000) (quarterly) Q1 Q2 Q3 Q4
135 Execution against our strategic objectives Integrated Annual Report 39 All three incidents were thoroughly researched and lessons learnt communicated throughout the organisation. Appropriate disciplinary action was taken while, at the direction of the SHE committee, new procedures to ensure that the needs of families of contractor workers affected by death and serious injury were thoroughly attended to were implemented and the actions taken interrogated. The committee required such steps to ensure that the company meets its duty of care towards all of those involved in our production processes. In overall contractor safety performance worsened, the contractor LTIFR for being 0.91 against s 0.31 and LTIs more than tripling (13 versus four the previous year). This year concerted action to improve the safety of contractor employees was taken. A first contravention of SHE legislation and standards now entails a penalty of 15% of contract value with contractors incurring penalties of 30% of contract value for each subsequent infraction. Safety outlook In we bedded down our focus, introduced the previous year, on serious occurrences (SOs) and potential to cause serious injury or fatality (PSIF) cases, in line with ArcelorMittal group policy. Considerable effort went into ensuring that individual plant management and supervisors understood their SO and PSIF reporting targets and were conversant with the implementation of these important measures. This process will be further entrenched in 2017 while visible felt leadership will be strengthened with the introduction of more regular informal briefings in a classroom setting. More rigorous, more regular internal fatality prevention audits and cross-audits will be conducted to improve compliance while greater use will be made of CCTV monitoring to create a widespread awareness that individual and team behaviour is constantly being observed. SHE personnel were tasked this year with ensuring more stringent implementation of non-conformance report procedures, which include formal hearings and processes to ensure that all corrective measures are executed satisfactorily. At Newcastle this year one contractor employing 600 people on site was thoroughly audited for exposure of individuals to risks. The contractor was required to redeploy individuals identified as being very high risk. This audit will be replicated with other contractors. While it is necessary to ensure ongoing, inclusive engagement on safety issues, in we strengthened our zero tolerance towards unsafe behaviour, one contractor was blacklisted and 279 contractor employees formally warned.

 2014 297 (196) 47 Return on capital employed (ROCE) (%) 2014 (1.2) (342) (6.")
136 40 Integrated Annual Report Strategic objective 2: Driving profitability We need to reward our stakeholders, including investors, if we are to stay in business. With sustainable profits we will have greater means with which to reward those who grant us our licences to operate KPI 4 KPI 5 KPI 6 KPI 7 KPI 8 KPI 9 Why this is important Continuing losses threaten the viability of our business. Investors, lenders, employees, suppliers and communities will all benefit from a profitable. Three-year key performance indicators Ebitda per tonne (R/t) (196) 47 Return on capital employed (ROCE) (%) 2014 (1.2) (342) (6.1) Liquid steel production (000 tonne) Cash generated from operations before working capital (R million) (1 911) 215 Net cash/debt position at year-end (R million) On-time deliveries (%) 2014 (546) (2 865) (290) Issues that were most material to driving profitability in Optimising our industrial footprint Seeking the implementation of tariff and non-tariff trade protection and the localisation of steel Establishing a fair price for steel Focusing on customer service and product development Restructuring our balance sheet Debating carbon taxes Reducing input costs, especially raw materials Resolving Competition Commission issues Key actions taken in to address our most material driving profitability issues In January we completed a R4.5 billion rights issue (as previously reported) We agreed to a settlement of legacy competition issues, which entailed payment of a R1.5 billion fine To optimise our industrial footprint we: Undertook necessary (and costly) repairs to our coke ovens and to Saldanha s Corex furnace Invested R2 billion of capital expenditure in improving processes, product quality and variety, and reliability (investment to maintain and expand operations less environmental expenditure) Grew capital expenditure on new products more than three-fold Achieved process savings, at Vanderbijlpark alone, equivalent to R754 million, many of which improvements were suggested by employees Reduced our water and energy intensity, in the process lowering our consumption of natural capital Improved on-time deliveries to customers from 62% to 64% and lowered our quality rejection rate Achieved sustainable procurement savings of R860 million on top of savings of R1 billion on raw material costs recorded the previous year.
137 Execution against our strategic objectives Integrated Annual Report 41 This year we adjusted prices as appropriate to ensure our sustainability but always with strict reference to costs, the market circumstances and the agreed-upon basket which determined fair prices for flat steel. In restructuring our balance sheet, an effect of the rights issue was to reduce our financing cost, which in amounted to R1.2 billion. For more on this and measures taken to address our most material risk, liquidity, see 33. Optimising our industrial footprint Pleasing, often outstanding results were achieved in on improving the efficiency of our production processes, in achieving cost savings while raising productivity, in boosting the reliability of our plants and increasing the utilisation of our assets. These achievements (including a limited 3% increase in fixed costs) were recorded in a continuing context of depressed and unpredictable demand and large-scale but necessary repairs at Vanderbijlpark, Newcastle and Saldanha which impacted, in particular, our sales of commercial coke and coal tar. A more concerted focus on customer requirements required substantial capital investment but will translate into new market opportunities and higher volumes. Less satisfactory was our performance on delivering to customers on time. Flat steel products Vanderbijlpark Vanderbijlpark enjoyed considerable success on optimising its industrial footprint in a year in which a coke battery repair project hampered production, market demand fell short of budgeted levels and considerable challenges were encountered with the quality of coke and iron ore. Also, at the end of November, blast furnace C lost one of three supporting hot blast stoves, resulting in t of lost production. Liquid steel production for the year was million tonnes, giving an HRC cost of production of USD386/t (: USD438/t), an outstanding achievement that speaks of world-class efficiency and the steady realisation at our flagship operation of a high-performance culture. Operating Vanderbijlpark as per market demand, capacity utilisation was 82% (: 75%). Problems encountered with the quality of, especially, coke delivered were extremely costly, requiring continuous monitoring and intervention. As in a close focus on reliability meant that the hot strip mill s unplanned maintenance downtime reduced from 26.54% in H2 to 21.37% at the end of. Also, the colour line improved its downtime from 22% to 12% while the steel plant achieved a hard-won 2% improvement in unplanned stoppages. Most notably, this year our internal Project Focus was driven by the business improvement team which, at Vanderbijlpark, solicited several hundred process improvement suggestions from employees, many of which were implemented, often entailing sizeable capital expenditure but in many cases without any upfront outlay. We believe that in Project Focus achieved savings of R754 million, of which R550 million was internally audited. Vanderbijlpark key performance indicators Full cast regrades (%)* * All figures re-assessed Mean time between failure (hours) (galvanising line) Flat steel products Saldanha In Q1 an in-depth business case study was undertaken at Saldanha. This investigation stemmed from persistently low flat steel prices in the export markets on which this plant has traditionally been focused. (In the average net realised price on exported flat steel was USD410/t while Saldanha s average cost of production in was USD433/t.) The study concluded that the plant s existing footprint was optimal but that efforts should continue to be made to lower the cost of production and to exploit new, less price-sensitive markets. To this end, this year Saldanha secured an order for tonnes from a Western Cape customer which had traditionally processed imported flat steel. This meant that, combined with other new local orders secured and the effects of the mini-reline, the share of Saldanha s production exported dropped from a typical 64% to some 55% this year. At the beginning of the year export markets for flat steel had been expected to be so depressed that it was initially planned to shut Saldanha s iron-making units between April and December. In the event, more buoyant demand meant that these units were shut for just three months, with liquid steel production for the year amounting to /t (: /t) against an initially projected /t. This year a planned Corex campaign extension repair was very successfully undertaken. The project was completed with an excellent safety record and lessons learned from the project and in particular, its safety achievements are being implemented at other sites. In October an environmental impact assessment report on a planned gas-to-power project, from which Saldanha could obtain power at more predictable and ultimately lower overall energy costs, was forwarded to the authorities. Also this year the rezoning application process for the plant commenced. Saldanha key performance indicators HRC < 1.09mm production (tonne/month) Thin slab caster breakdowns (%)
138 42 Integrated Annual Report Strategic objective 2: Driving profitability continued Long steel products Long steel operated as a substantially restructured division following the closure of the Vaal Meltshop in and that of the tonne press towards the end of. With the restructuring, all input billets were produced at Newcastle and distributed to the secondary mills for further processing. Initial challenges were encountered with especially the high loading of special steel grades at Newcastle but these were mitigated by carrying extra stock and optimising production cycles. While projections were that local demand for long steel would be subdued, prompting the division to focus on blue water exports, local demand (influenced largely by output challenges faced by competitors) was unexpectedly robust in H1, resulting in a focus on meeting domestic requirements. By the end of the year, order backlogs in both domestic and foreign markets had been met. As was the case at other plants, in blast furnace productivity was negatively impacted by the quality of iron ore. In April Newcastle s coke battery 2 was halted for critical repairs with coke having to be imported for the remainder of the year, entailing costs which had a significant effect on the financial performance of the long steel products business. Reliability issues with off-gas equipment at the steel plant, basic oxygen furnace burn-throughs and challenges relating to the making of more complex steel grades contributed to the loss of t of crude steel production. Coke battery 2 is only scheduled to begin production in May 2017, at which time supplies for both Newcastle and Vanderbijlpark, and for commercial coke sales, will return to normal levels. Newcastle long steel production costs reduced by 3%, from USD444/t to USD429/t, with the dollar strengthening by 15% against the rand. In terms of an agreement reached in November, the company will ship t of product per month from Newcastle and Vanderbijlpark to a new entity, Evraz Highveld Newco s heavy structural mill for processing into some t of heavy sections and rails for domestic sales. At present these products are all imported. The products will at all stages remain the property of, with Newco earning a tolling fee. The announcement that local steel had been designated for all public sector construction projects, in January 2017, was especially propitious for the prospects of this new venture. Long steel products key performance indicators Blast furnace fuel rate (kg/t) Coke and Chemicals The division was heavily impacted this year by necessary, planned repairs to coke batteries at both Vanderbijlpark and Newcastle. The repairs which will continue into 2017 were essential to ensure the sustainability of a part of our business that has traditionally been strongly ebitda-positive. For the year commercial coke and tar sales volumes were 19% and 22% lower respectively while sales prices of both commodities were some 5% softer. (Commercial coke should not be confused with coking coal whose prices, as related, increased sharply in.) Profitability was further impacted (R268 million) by the need to purchase and import coking coal for sale to existing customers. Coke and Chemicals key performance indicator Solvent plant availability (%) Risk Risk Capital expenditure 5 6 Total capital expenditure to drive profitability (capital expenditure less environmental spend) for the year was R2 018 million, more than 75% higher than the R1 153 million of. The main production capital items and their costs were: Newcastle coke oven battery N2 repair (R276 million), ongoing to 2017 Vanderbijlpark coke oven battery V4 repair (R135 million), ongoing to 2017 Vanderbijlpark standalone gas-fired boiler (R138 million) Saldanha Midrex D01 tube bundle replacement and installation (R112 million) Saldanha Corex campaign extension (R75 million). Other significant capital projects undertaken this year were: Vanderbijlpark Methane sulphonic acid (MSA) conversion of the electrolytic tinning line (ETL) (R35 million) Replace BOF off-gas coolers (R26 million) Battery V8 waste gas ducting (R14 million) Blast furnace C and D bunker structural repairs (R13 million). Newcastle Rebuild boiler 3 phase 2 (R17 million) Replace rod mill obsolete strand 3 reducing mill drive (R17 million) Replace 33kV breakers and panels at service substation (R11 million) Replace main coke oven gas pipeline (R10 million). Bar mill delay ratio (%)
139 Execution against our strategic objectives Integrated Annual Report 43 Saldanha Roller hearth furnace hard and fibre refractory replacement (R16 million) Midrex campaign extension repair (R14 million) Air separation unit reline projects (R12 million) Corex dust recycling system coarse particle separator (R12 million). Coke and Chemicals Tar plant environmental compliance (R14 million) End flue rebuild of ovens 205 to 208 (R10 million). Risk Cost containment 5 In we achieved considerable success in reducing variable costs. Excluding the effects of production volumes, exchange rate and market movements, the cost of raw materials, goods and services was reduced by approximately R860 million. These savings mitigated to an important degree, the impact of a weaker rand and higher raw material costs. The depreciation of the rand, coupled with a sharp increase in iron ore and coal prices, resulted in a significant increase in input costs. Iron ore prices traded within a wide range of USD39/t to USD83.95/t, averaging USD59.80/t over the year. A combination of reduced Chinese mine production and increased demand in that country impacted international coking coal prices which increased by 322% from January. Import coking coal from Mozambique and Australia was subject to supply disruptions but we remained committed to diversifying our sources of supply, particularly from Mozambique and despite the logistics difficulties inherent in sourcing from that country. Import coal prices remained volatile, rising from a low of USD73.90 in January to a high of USD in November. For the year import coal prices averaged USD In November the company finalised an agreement for the takeover of Thabazimbi mine from Sishen Iron Ore, which is subject to the suspensive condition relating to the conclusion of a satisfactory due diligence. The mine is in the process of being closed and the primary purpose of the takeover is to manage its rehabilitation (for which costs we are contractually liable) in a prudent manner. The agreement is for the purchase of the mine for a nominal consideration of R1. In terms of the agreement, will acquire all of Thabazimbi s assets while assuming all liabilities. Should we be successful in acquiring the mine, investigations will be conducted to determine whether and to what extent the mine could in future be operated in a viable manner. Logistics continued to be a major challenge during the year with Transnet Freight Rail s performance deteriorating relative to previous years. TFR performance (on-time deliveries) (%) The poor Transnet performance was mitigated by the transportation of 1.2 million tonnes of iron ore, coal and import coke by road, which resulted in additional costs amounting to R535 million. In February 2017 we, and project partners including Transnet Freight Rail, announced the reopening of the Elandsfontein Intermodel Terminal in Germiston after almost four years of inactivity. It is expected that, as a result of the terminal being reopened, some tonnes of product coming from Newcastle and Saldanha and destined for customers in Gauteng will be shifted from road to rail. As a result, the number of long-haul road vehicle movements will reduce by more than per year. We remain committed to building lasting, sustainable relationships with suppliers, believing that they are an indispensable part of the greater steel value chain and that their wellbeing (and ability to generate and sustain quality jobs) is a key part of our social licence to operate. As such, in-depth discussions with various strategic suppliers were initiated with the purpose of securing sustainable savings through collaborative efficiency improvements. Customer focus Risk 2 Risk 3 This year more than 60 new product lines were being actively developed. Of this total, 43 were under development by the long steel products division. These products include new specifications on widths, lengths, thicknesses and strength. Sectors and market segments for which new products were developed included automotive, construction, engineering, mining, energy, chemicals and water. Particular focus was on developing products in conjunction with customers for the renewable energy sector and on designing and producing innovative products for construction and low-cost housing. While improving customer satisfaction, making these new products translated into additional sales worth some R50 million, most of which was sold at above-average margins. Total capital expenditure on new product development in was R335 million (: R92 million). This year a large, internally developed and therefore unaudited amount was invested in improving customer service, in particular the handling of complaints and claims. (An online claims tracking system was piloted this year and was due for a full rollout in Q ) In customer complaints as a percentage of sales value declined from 1.24% to 0.74%. Authoritative research has shown that product availability is a greater concern of steel customers than price. We acknowledge that we have considerable room for improvement in terms of lead times and in making on-time deliveries. This year 64% of our steel deliveries were on time (: 62%) with Vanderbijlpark in particular underperforming, its on-time delivery performance being just above 50%.
140 44 Integrated Annual Report Strategic objective 2: Driving profitability continued Labour productivity Our two key productivity measures this year were little changed from. Tonnes of liquid steel to full-time (job) equivalent, expressed as HRCe/FTE, decreased to 471 (: 472, 2014: 418). Total cost of employment per tonne of liquid steel, measured in USD, fell from USD77/t to USD72/t. (In rand terms TCOE/t increased from R979 to R1 062.) Risk Energy efficiency 5 This year we reduced our electricity consumption per tonne of liquid steel by 7%, thereby limiting our electricity cost increase per tonne to just 2.4%, well below tariff rises implemented by the national utility, Eskom. In the mix of processes and technologies we used to produce liquid steel was markedly different to the mix employed in. Changes included the mothballing of the electric arc furnace in Vereeniging and relining Saldanha s Corex furnace. To compensate for these changes, Vanderbijlpark and Newcastle increased their blast furnace production of liquid steel. The net result was that our energy consumption per tonne, including electricity, natural gas, coal and industrial gases increased by 3.8%, and our CO 2 emissions per tonne by 8.9%. Energy-efficiency measures implemented this year included a so-called demand side management project at the main air compressor plant at Vanderbijlpark, aimed at shifting electricity demand out of the daily peak periods. Also in control specialists succeeded in controlling gas pressures in Vanderbijlpark s main gas distribution system by utilising a generator as a variable load, thus reducing the flaring of gas and increasing electricity generation. Most significantly, in we invested R138 million in a 50 tonne per hour high-pressure steam boiler at Vanderbijlpark s direct reduction kilns to supplement the existing waste-heat steamgenerating units by using off-gases. The steam generated by this boiler (which is scheduled for commissioning in March 2017) will increase our co-generation of electricity by at least 10MW in 2017 from the current average level of 24MW. In we generated a total of MWh. Our dependence on increasingly expensive electricity supplies from the national grid has underpinned our close involvement in a project to generate power using imported liquefied natural gas in Saldanha. If implemented, this project, which is being developed by third parties, would make our Saldanha Works independent of Eskom electricity supplies, leading to lower, more predictable prices. This year the key environmental impact assessment process for the power plant commenced. During improved energy reporting at a corporate level with refinement of this system continuing in The distorting effect of production level changes on energy efficiency performance was eliminated and energy performance is now measured against these standards. Reporting of CO 2 emissions related to energy consumption has also been included into this monthly reporting using internally developed factors multiplied by production tonnes. The company is exploring a number of projects which may have the ability to sequestrate some CO 2 emissions. These are still at an early stage of development. Outlook In 2017 footprint optimisation measures implemented at Vanderbijlpark and Saldanha this year will be extended while Saldanha s mini-reline will equip the plant to compete more effectively at prevailing prices, in both its traditional export and domestic markets. Coke and Chemicals production levels are expected to return to historically more normal levels in Q2, improved efficiencies. We are confident that procurement improvements can be further advanced in 2017 and expect that the outsourcing of overall logistics management will result in significant cost savings. Having bedded down the wide-ranging restructuring of long steel products, and having invested considerable amounts in modernising and improving the reliability of our Newcastle operation, the division will be well positioned to exploit new opportunities in both domestic and export markets. A lower raw material basket cost, relative to that at the end of, is anticipated. The recovery in international steel prices witnessed from H2 is expected to persist for much of The problems with iron-ore quality encountered in are expected to represent a long-term challenge, which will require substantial ongoing intervention. Process optimisation to accommodate this new reality began in and will continue in In 2017, procurement management will focus on: Reducing road transport by t A 15% reduction in controllable costs of R5.3 billion A 10% reduction in inventories. A major sales focus in 2017 will be on the Africa Overland market where we believe it is possible for us to acquire a 40% market share. By identifying, and supplying to strategic customers in key locations who will effectively serve as distribution points into local markets, we envisage overcoming many of the logistical difficulties attendant on supplying mostly smaller national markets. Relative to our performance this year, we project a 15% increase in the Africa Overland segment in 2017, at prices which we anticipate will improve over those of.


141 Execution against our strategic objectives Integrated Annual Report 45 Strategic objective 3: Creating social value Being seen to be creating meaningful, substantial social value for a wide range of stakeholders is essential to us earning and maintaining our licences to operate KPI 10 KPI 11 KPI 13 Why this is important Two of the ArcelorMittal group s 10 sustainability outcomes are that we be an active and welcomed member of the community and that our contributions to society are measured, shared and valued. We subscribe to, and actively pursue, these outcomes while, in the South African context, working diligently to use our scale and socioeconomic reach to effect meaningful transformation within our workforce, supply chains and communities. Our various licences to operate are premised on our ability to demonstrate our commitment to create value for all stakeholders, including our customers, and to practice sound environmental stewardship. Three-year key performance indicators B-BBEE compliance score 2014 (old codes) Level 6 Level 4* Level 4** Preferential procurement (percentage of total spend) (%) EMEs QSEs Black-owned businesses (We present here only information from as the amended B-BBEE codes made it extremely difficult to make meaningful comparisons with prior years.) Total environment spend () Fines, penalties and settlements *** 2014 None None R1.5 billion * Reported in as a self-assessed Level 3. Final assessment: Level 4. ** Self-assessed but externally assured by Deloitte. *** Excludes R138 million spent on co-generating electricity. Issues that were material to our creation of social value in Workplace safety Resolving Competition Commission issues Establishing a fair price for steel Supporting downstream industry B-BBEE compliance Environmental compliance Carbon taxes Commitments to capital expenditure Enterprise and supplier development, and preferential procurement. Key actions taken in to address our most material issues relating to social value creation Engaged with the authorities, industry bodies, regulators and customers on tariff and non-tariff trade protection Finalised a fair pricing mechanism on flat steel products Finalised all pending investigations and prosecutions with the Competition Commission, entailing a R1.5 billion fine As part of the Competition Commission settlement, committed to R4.6 billion capital expenditure over five years Concluded a B-BBEE ownership transaction in terms of which a broad-based black consortium, employees and communities acquired a recognised black shareholding of 25% of our share capital Established a business incubation hub and expanded registration of HDSA-owned potential suppliers Significantly reduced water abstraction and maintained or restored zero effluent discharge status at Vanderbijlpark and Newcastle Tariff and non-tariff import protection Unlike almost all countries possessing a primary steel sector, until recently South Africa had no protection against imports produced at artificially low prices. In a situation of worldwide overproduction, this meant that South Africa was particularly targeted for steel exports. Towards the end of this situation began to be rectified with the implementation, by the authorities, of 10% duties on various steel products, in order to ensure the viability of the steel industry. By mid-year duties were in place on 10 product categories.
142 46 Integrated Annual Report Strategic objective 3: Creating social value continued In the middle of the year the authorities approved the designation of local steel on five product categories. These included rail moving stock, water pipes and specific products used in state infrastructure. In January 2017 the Department of Trade and Industry announced the designation of local products, including all steel, both primary and finished, used in state construction projects. In essence this means that those tendering for state construction projects will have to include 100% primary and finished steel products in their bids. This was an extremely encouraging development for ArcelorMittal South Africa but its impact is likely to be primarily and more immediately felt in the downstream. Those customers of ours who use our crude steel to fabricate, manufacture and install products used in construction have recently been prejudiced by imported finished products. The designation of locally produced and manufactured steel products in public sector construction will prove a boon to their enterprises, to employment and to the South African economy. It is also our view that, in sourcing quality, locally manufactured steel inputs for infrastructural investment, National Treasury will be incentivised to increase budget allocations for such projects because of lower prices and broad, positive economic effects. Such larger infrastructural investment will benefit our company, its customers, suppliers, employees and local communities, creating greater social value. In exploiting the new opportunities arising from the designation of local content, steel manufacturers will inevitably seek to increase employment, in particular those with artisanal, technical skills. In this respect our substantial investment over several years in technical training, apprenticeships and bursaries will serve to unlock considerable social value (see 56). As alluded to, South Africa has experienced a surge in imports of not only primary steel but also imports of many finished products, which negatively affect downstream producers. As a result, a number of applications for tariff protection against such unfair imports have been made. In various instances we have sought to assist our customers through knowledge sharing and especially by extending strategic rebates. At the time of reporting, official decisions concerning safeguard duties on HRC and cold rolled coil, and other bars and rods were being awaited. The company had, however, received communication from the International Trade Administration Commission of South Africa (ITAC) indicating that it was considering not granting the safeguard duty applied for on HRC due to public interest considerations despite finding that a case for safeguard existed. The company was continuing to engage with ITAC on this matter. In 2017 we intend engaging with our customers, the downstream, on arguing for import protection measures which will benefit the full steel value chain. has recently intimated to various stakeholders, including regulators and government, employer representatives and industry bodies, as well as customers, its willingness to partner with the downstream on whose health it is so dependent for its own success. Measures the company believes it can implement to support customers and which will have directly, positive impacts include: Value-added export and strategic rebates which, in, tripled to R479 million Assistance in seeking duties on finished products Improved payment terms Reviewing market access, including direct access to the company and creating larger buffer stocks Interventions to assist the downstream to participate in infrastructure and other projects Establishing a technology and innovation hub to facilitate the empowerment of, especially, black-owned businesses Leveraging s considerable training resources to further benefit the entire industry. Our decision in December to supply tonnes of steel products per month to the Mpumalanga facilities of Evraz Highveld Steel for processing into heavy steel products (see 42) was about more than just driving profitability. When it ceased operations Evraz Highveld had employed people. At the time of reporting it was not clear how many new jobs would be created with the resumption of operations but it was likely that this would amount, at least, to several hundred with former Evraz Highveld employees being given preference. Restarting operations will also have a significant impact on the local economy. Risk Risk Fair pricing for steel 2 3 We acknowledge that, as much as we need protection against unfair imports, our customers are entitled to buy steel products at fair prices and that it would be inequitable to expect them to pay higher prices simply to protect and other primary producers. To this end, in April we agreed to a fair pricing formula on our flat steel products, which government endorsed in February 2017 (see 11 for details). It was agreed with various authorities and stakeholders that there was sufficient domestic competition to allow market forces to determine prices for long steel products. In addition to the fair pricing dispensation, a condition of the Competition Commission settlement was that, for flat steel products, we would not earn a margin of more than 10% (under certain conditions, up to 15%) of earnings before interests and tax (ebit). This will apply for five years.
143 Execution against our strategic objectives Integrated Annual Report 47 Resolving Competition Commission issues In November the Competition Tribunal approved a settlement, B-BBEE compliance Additional creation of social value recommended by the Competition Commission, of the Commission s long-standing investigation into allegations of anti-competitive behaviour by ourselves. The settlement entails us paying an administrative fine of R1.5 billion in annual instalments of not less than R300 million. In addition, we committed to invest the amount of R4.6 billion over the next five years in our operating footprint. It is intended that these improvements will benefit not only investors in ArcelorMittal South Africa but also our customers and suppliers. Socioeconomic development (SED) Enterprise development (ED) R4.2 million Impilo grants R1.7 million. Various upliftment projects R2.5 million R4.2 million Training, quality systems and grants R8.4 million R13.2 million Science centres R2.2 million Incubation hub R1.4 million While the resolution of the competition issue entails very substantial costs, our leadership considered it essential to decisively confront and deal with this very material risk, to draw a line under past misdemeanours so that we are able to demonstrate going forward, our total commitment to ethical conduct in all aspects of our business and in all of our interactions with stakeholders. A Competition Commission statement on the settlement agreement is available online. B-BBEE performance As at 31 December we had a self-assessed B-BBEE compliance rating of Level 4. A year previously, our score also stood at Level 4 whereas a year before that we were at Level 6 and, at the end of 2013, Level 7. (Our 2013 and 2014 compliance was measured under the old, subsequently revised, B-BBEE Codes of Good Practice; had our 2013 and 2014 performance been measured under the revised codes, we would have been non-compliant.) The revised codes resulted in most steel and large industrial companies dropping at least two levels. Almost alone among our peers, we dramatically improved our performance, a performance that was driven by the board of directors which, among other measures, established a B-BBEE subcommittee in Our enhanced B-BBEE performance (45 points at end-2014; 81 points at end- and 89 points at end-) derived from an improvement in all elements of the codes scorecard including ownership, management control, skills development and socioeconomic development. However, in the area of enterprise and supplier development, which includes preferential procurement and which constitutes the single largest amount in the codes, our score (28 out of a possible 44 including bonus points) only partially reflected the very substantial investments of financial and human capital which we made this year in creating meaningful social value, especially for our local communities. Supplier development (ED) Various SD programmes Additional investment in SD initiatives Enterprise and supplier development and preferential procurement As in, this year our enterprise and supplier development (ESD) and preferential procurement investments were managed by 10 individuals with direct input from some 30 procurement employees at head office and various business units. Our enterprise development efforts aim to develop emerging businesses and prepare them for absorption into our value chain. Businesses register via a simple web-based system, are audited for capability and then undergo business training and a two-year formal incubation. The company subsequently gives these businesses contracts of at least three years. This year 470 local businesses registered, bringing to the total number on our database. In October a 1 600m 2 (under roof) incubation hub was completed in Vanderbijlpark at an initial cost of R12 million. Aimed primarily at light to medium manufacturing, fabrication and reconditioning businesses, the hub will house 12 undertakings which will create at least 77 direct jobs over the initial 24-month cycle. In addition to space and services and ongoing mentoring, our partnership with government has ensured co-funding of this incubation hub to the value of R14 million over a three-year period. In total, our investment in enterprise development amounted to R6.4 million. With supplier development, we aim to enable those smaller (blackowned) enterprises that are already supplying to the company to increase their business with us, and their capacity to supply more broadly. In we spent R10 million on 14 supplier development programmes and R2.7 million on a new industrial park with a capacity of housing three medium-sized industrial suppliers. Employment has already been created for 48 local community members, housed in the first industrial building. A supply agreement has been concluded for the second of three buildings which will enable a further 53 direct jobs with a specific focus on youth and women from local communities.
144 48 Integrated Annual Report Strategic objective 3: Creating social value continued As with our enterprise development spend, however, on supplier development this year we spent more than the amount recognised by the B-BBEE Codes of Good Practice. Over and above this amount (R8.4 million), we spent R1.5 million on supplier development, including an amount of R on practical business-oriented training supplied by North West University and Vaal University of Technology for both ESD candidates. Through s supplier development programme, existing supplier development beneficiaries benefited this year from improved procurement worth R49 million on a year-on-year basis (a 155% improvement). Meeting our legislated requirements on preferential procurement was challenging this year. Our generic recognised spend declined by R800 million, majority black ownership recognised spend by R600 million and our black women-owned recognised spend by R1.4 billion, impacting, in particular, a few large previously empowered vendors. This development had a 4.85 negative impact on our overall B-BBEE compliance. Whereas we achieved 15.1 points for preferential procurement at the end of, this would have deteriorated sharply this year had we not taken decisive measures. By year-end we had succeeded in arresting the deterioration in our preferential procurement performance, to the extent that we ended the year with a self-assessed 12.5 points. At year-end we had active vendors of which 582 were emerging micro-enterprise (EME) vendors, 497 were qualifying small enterprises (QSEs which number declined as expected, from 552 a year earlier), 152 were >30% black-women-owned businesses and 338 were >51% black-owned. Overall, the percentage participation in procurement opportunities from black-owned businesses improved by 11% while the percentage participation in procurement opportunities of SMEs improved by 24% year-on-year. Given that our total procurement spend is R28 billion and that spend with EMEs and QSEs is some R2.75 billion, the need to invest additional resources in managing our emerging supply chain requirements is apparent. (In we spent an amount of R16 million on the development of EME/QSE vendors.) As a leading player in the steel value chain we are committed to working with partners to create meaningful social value for especially the downstream. In this regard we are co-operating with other manufacturers, suppliers and national and provincial governments as well as with state-owned enterprises, on extracting maximum value from our procurement processes. Similarly, we are playing a leading role in creating outcomes that will rapidly unlock broad-based value from the iron ore-to-finished steel chain for SMEs and communities, as is now being practiced by mining s Operation Phakisa initiative. Two additional key initiatives were undertaken during for the purposes of accelerating sustainable transformation within local communities. In the first instance, CSI initiatives were aligned with ESD initiatives. With a clear line of sight over development projects across all three focus areas, it is possible to initiate projects within local communities which will facilitate the eventual participation of these communities in the company s procurement landscape. Socio-economic development Despite our extremely challenging financial circumstances, in we increased our socio-economic investment, from R12.6 million to R17.4 million. In line with our drive to embed the ArcelorMittal group s 10 sustainable development outcomes in our creation of value for all stakeholders, we seek to have our contribution to society measured, shared and valued. To this end we measure, as precisely as possible, our investments in socio-economic development, and have these investments independently assured. In we remained committed to our flagship science centres, our partnership with the provinces departments of education to run three science centres in Sebokeng, Newcastle and Saldanha. This year we spent R12.6 million on the operations and programmes of these centres with a large portion of funding paying the salaries of 49 science centre staff, which investment reached 527 teachers and more than learners. An additional R2.4 million was spent on roofing or re-roofing 201 homes in Sharpeville while training and employing 67 locals who gained skills in installation and asbestos handling. Humanitarian aid in the form of roofing material was provided to 500 families in Moreleta Park and Plastic View informal settlement after their homes were destroyed by fire. This year the company provided R20 million towards the development of an affordable housing project for low to medium-income employees on 180 stands in the Vanderbijlpark area. Qualifying employees will be able to buy serviced stands at below market value. In addition, employees can select from cost-effective light steel frame building structures (manufactured by ) at less than half the cost of conventional brick-building alternatives. (This year the company began establishing training facilities where local community members will be trained in erecting such light steel frame houses.) Ownership In November shareholders approved a B-BBEE transaction in terms of which 17% of our issued share capital was acquired, through a special purpose vehicle, by Likamva Resources, a 100% black-owned company in which black women held a 58% interest. In addition, a new employee share ownership scheme, the Employee Empowerment Share Trust, gave employees and management a 5.1% interest in the company they work for. The allocation of shares to employees was structured such that at least 60% of trust units will belong to black employees. The effects of the two transactions is that, in terms of the B-BBEE codes, the company is assured of a long-term black shareholding of at least 25.1%, giving it 25 points under the ownership element. Of particular added significance is the agreement by Likamva that it will, within two years, transfer 5% of company shares to organisations representing community interests in the areas in which our production facilities are located: Vanderbijlpark, Newcastle and Saldanha. We believe that giving our local communities a material interest in the wellbeing of our business will be especially important in our drive to create meaningful social value. In executing one of the ArcelorMittal group s 10 sustainable development outcomes (to be an active and welcomed member of the community), we will record a first for the worldwide family of steel businesses of which we are part, a first which we believe other operations would do well to emulate.
145 Execution against our strategic objectives Integrated Annual Report 49 Management control and employment equity Further progress on targets contained within our five-year (to 2018) employment equity plan was made this year. In particular, at year-end, five of the 11 top management posts (45%) were filled by ACI individuals (at the end of, three out of 12). As at 31 December our management control performance (15 points plus a potential four bonus points) was 9.25, a significant improvement on the 8.26 of a year previously. This year, however, tough trading conditions continued to hamper our ability to attract scarce ACI talent in the junior management and above levels. At senior management level, in particular, attrition rates and competition for black skills remained particularly challenging. Skills development This year our very substantial investment in the values and skills of our people translated into a commendable skills development score of points (see 56). Environmental performance We want to be acknowledged for using natural resources in the most efficient and effective way, so that we are seen to be creating significant value for our stakeholders, especially our local communities which are impacted by our emissions and our use of the local water resources which we share with them. In, our most material environmental issues were: Water management Emissions to air Proposed carbon tax and climate change-related developments including energy efficiency Rehabilitation of legacy sites By-product utilisation (Our key environmental indicators derive from those most material issues which we are able to directly influence.) Total raw materials consumed consumption of scrap declined by some 14%. This was mostly related to production volumes. In, in particular, we continued to invest in reaching and maintaining zero effluent discharge (ZED) status at Vanderbijlpark and Newcastle. Also, we achieved conspicuous success in lowering our intake of fresh water a key imperative especially at a time when the country was grappling with the effects of a severe drought. Our key environmental indicators include emissions to air and water intake as well as the percentage of by-products not utilised that cannot be usefully sold and used and need to be land filled. Our performance on these key indicators, and others, in the year reviewed relative to previous years is reflected in various graphs in this section. embraces the need to produce steel in the most environmentally friendly ways possible. We are committed to minimising our impact on our environment and on the health and wellbeing of our communities. To this end we have invested some R2 billion over the past decade in reducing, where possible, emissions and process water discharges while addressing environmental legacy issues. While this year we formally reflect an amount of R38 million on mitigating our environmental impacts, as noted elsewhere, the amount (R138 million) spent on installing an off-gas boiler at Vanderbijlpark will have a direct impact on our emissions of CO 2. The off-gas boiler will, it is envisaged, have a material impact on both our CO 2 emissions and our cost of electricity after it is commissioned in March 2017 (see 44). Since 2014 our co-generation of electricity has increased by some 14%, a figure which we predict will increase further in the new year. Electricity usage MWh/TLS kilotonnes Iron ore Dolomite Lime Coal Scrap Our processes consume significant quantities of raw materials and, while the scope for improvement in consumption patterns is inherently limited, we apply considerable effort towards reducing our use of natural capital. Most importantly we continuously strive to reduce the amounts of raw materials brought in by road by working closely with Transnet. In this regard we hope to achieve meaningful improvements in We strive to achieve the ArcelorMittal group s sustainability outcome, to be make efficient use of resources and to achieve high recycling rates. To this end we seek to maximise the amount of scrap steel consumed by our steelmaking processes. However, in our total 684 We also strive to find more applications for our by-products, but with the depressed construction sector being our largest client, progress was below expectation this year. This situation was exacerbated by an intervention (see below) by the authorities which we believe was inappropriate and which had the effect of significantly increasing our disposal of valuable by-products. There were no major environmental incidents recorded in in terms of section 30 of the National Environmental Management Act (NEMA) although, in some instances, we struggled to comply with all the conditions of our various operations authorisations/permits / licences. In, our biggest environment concerns were: Particulate emission levels of Vanderbijlpark s sinter plant Effluent discharges at Vanderbijlpark Fugitive emissions from the Saldanha Corex cast house towards the end of Sulphur removal from coke oven gas at Vanderbijlpark.
146 50 Integrated Annual Report Strategic objective 3: Creating social value continued Apart from the last point all concerns where longer-term intervention is required to achieve required plant availability were effectively addressed in. Regarding the Vanderbijlpark sinter plant emissions, our interventions were successful but more work is planned for In absolute terms, levels of particulate emissions were higher this year than in, related largely to problems encountered with particulate emissions at the Vanderbijlpark sinter operation. In June, Green Scorpions inspectors from different spheres of government visited Vanderbijlpark. A report regarding this inspection was made available in November, the main concerns highlighted relating to: Housekeeping in certain areas Stormwater management Material spillages Aspects of waste management (waste sorting) Atmospheric emission licence (AEL) compliance (sinter was main concern). At the time of reporting every effort was being made to address the findings made in the Green Scorpions report. Our key environmental risks Why it is important Developments and actions taken in Carbon taxes Effluent discharges Fugitive emissions Legacy areas Groundwater contamination Could have the effect of making our business unsustainable. We acknowledge our potential impacts on climate change. Environmental impacts and potential licensing and legislative infringements. Emissions caused by ineffective process controls could infringe AEL conditions. Groundwater and atmospheric pollution (fugitive emissions) could impinge licences to operate. Groundwater pollution from legacy dams and active sources at certain business units could affect communities and the environment. Legislation to implement carbon tax is now expected to be debated by Parliament in This year we engaged extensively on seeking additional relief for carbonintensive, but employment-generating industries such as iron and steel. Newcastle ZED project was fully implemented in and ZED status maintained this year despite minor, sporadic discharges which were resolved after small improvements were implemented. Vanderbijlpark s ZED status was restored in October. Vereeniging was able to sustain the boron levels in its effluent below specified levels after improvements made in. All plants issued with AELs. Improvements were devoted to capturing excessive emissions at the Vanderbijlpark sinter plant, a project that was completed in July. Also at Vanderbijlpark, a vapour recovery project at the tar distillation facility is nearing completion after some unfortunate delays occurred. Temporary technical problems resulting in excessive fugitive emissions at Saldanha s Corex plant were resolved. For 2017, significant improvements are scheduled, or are to be continued, at our ironmaking and coke-making facilities with a strong focus on Newcastle Works. A project to establish a new disposal site to replace the old Newcastle BOF slag site was finalised in December with the first disposal commencing in after meeting all construction-related conditions in the licence. Good progress was made at Vanderbijlpark to complete and maintain remediation efforts, with more work planned for Work is ongoing where legacy groundwater pollution is evident and good progress was made to neutralise past activities that may have resulted in potential contamination. The practice of storing effluent in unlined dams was phased out some years ago. Water management A standout achievement this year was our performance on water abstraction which, at 3.24kl per tonne of liquid steel, was the lowest in almost a decade (: 3.81kl/tonne). At kl our total fresh water intake was 16% lower than the kl of the previous year. Relative to 2005, our absolute water abstraction declined by 54%. fresh water intake (per tonne of steel) kl/t liquid steel Vanderbijlpark Newcastle Saldanha Company 2014
147 Execution against our strategic objectives Integrated Annual Report 51 fresh water intake (kl) Water intake (kl) millions Newcastle Ngagane River Vanderbijlpark Vaal Dam and municipality (potable) Saldanha Municipality (potable and treated sewage) Company The main reason for our improved water abstraction performance was the finalisation of our long-term, very costly, ZED commitments while some smaller-scale savings were also achieved by a concerted campaign to fix leaks. The best water saving performances were achieved at Newcastle and Vanderbijlpark where improvements varying between 12% and 19% were recorded both in absolute and specific terms. Maintaining Newcastle s ZED status proved to be challenging on occasion this year, the main difficulties relating to the quality of effluent received from the coke ovens being below the ZED facilities treatment specifications, and problems experienced with a pre-treatment stage of the newly installed reverse osmosis plant. These were addressed and, since Q4, Newcastle has sustained its ZED obligations. As anticipated and following a substantial investment (R42 million), ZED status at Vanderbijlpark was achieved in October. In addition to the large financial outlay, this single challenge absorbed much of the time and attention of the environment and water departments. Our Saldanha operations are equipped with infrastructure to utilise treated municipal sewage water, which also resulted in less potable water being purchased for production purposes. In total during, kl of treated sewage water was purchased from the municipality and applied mainly for dust suppression purposes. Saldanha is a ZED facility which achieves the best water consumption/ abstraction figures in the company. Debating carbon tax and greenhouse gas requirements Draft legislation to introduce a carbon tax of R120 per tonne of CO 2 above certain thresholds was published in November, indicating that this tax was likely to be introduced in January Subsequent developments point to the carbon tax now only being processed by Parliament in Q with implementation occurring at a later stage during 2017 or even Given the status and current contents of the draft legislation we do not believe that this new tax will add more than the R300 million previously communicated to our annual costs to the year However, we remain extremely concerned that this substantial, added burden could threaten our financial and environmental sustainability as this money would, we believe, be better spent on important but costly environmental improvements. To this end, as in, our CEO and group manager: environment made regular representations on the unforeseen consequences that a carbon tax could have on employment in a key national industry which is intrinsically carbon-heavy. In particular, we and stakeholders including the SA Iron and Steel Institute and Business Unity SA met regularly with National Treasury on defining the criteria for relief as provided for in the draft carbon tax design. In particular, we stressed the point that additional allowances or relief should apply to sectors such as our own which are exposed to imports from countries which do not have similar carbon tax regimes in place. Regarding the carbon budgets that were allocated to our company by the Department of Environmental Affairs for the period to 2020, our allocation was not exceeded on an annualised basis. It is foreseen that climate-change requirements will in future place a significant additional administrative burden on the company and that dedicated staff may be required to ensure compliance with various reporting requirements. It is unfortunate that South Africa is not actively working towards one climate-change mitigation system to achieve the desired outcomes. Instead, each state department is promoting its own mitigation system, in isolation from others. We remain hopeful that a more realistic outcome will prevail one that balances the very real need to minimise the impact of steel production on the environment with the need to preserve employment, economic activity and the achievement of the objectives of the National Development Plan, in which steel as a commodity will play an important role. CO 2 emissions (per tonne of steel) tco 2 /t liquid steel Scope 1 Scope 2 Our direct (Scope 1) CO 2 emissions increased while indirect (Scope 2) emissions also increased slightly during. The increase in direct emissions can be attributed to not producing steel via the electric arc furnace route (Vereeniging) in. (For the calculation of Scope 2 emissions, a factor of 1.01tCO 2 /MWh was used.)
148 52 Integrated Annual Report Strategic objective 3:Creating social value continued Emissions to air In all facilities retained their atmospheric emissions licences (AELs) while excedances of our various AELs were proactively communicated to, and addressed in cooperation with, the relevant authorities. Our most material emissions challenge related to the Vanderbijlpark sinter plant which was non-compliant for most of H1. By July, thanks to a sizeable investment in new filter bags, the plant became compliant but more work is foreseen for Towards the end of, problems at Saldanha s Corex plant resulted in visible fugitive emissions being released to atmosphere on a sporadic basis. This problem was resolved before year-end and the authorities expressed their satisfaction in this regard. Unfortunately, a vapour recovery project at the Vanderbijlpark tar distillation facility was delayed and will now only be completed in 2017 at a cost of R27 million. Particulates, which are our most significant air emissions, increased this year because of the sinter plant challenges referred to above, with overall point source emissions being 0.62kg/tonne of liquid steel (: 0.52kg/tonne). In absolute terms particulate emissions increased by 438 tonnes. SO 2 emission levels increased relative to those of (4.80kg/ tonne of liquid steel (: 4.45kg/tonne). In absolute terms, our SO 2 emissions rose by tonnes. This increase can mainly be ascribed to the increased sulphur levels in our raw materials. Total SO 2 emissions (tonnes) t/annum Vanderbijlpark Newcastle Saldanha Company Particulate emissions (kilogram per tonne of steel) kg/t liquid steel BOF slag sales and by-product disposal Our various slag types are key by-products of the iron and steel making processes and find a ready market in the construction (particularly road-building) and cement sectors. By-products disposed of % of total produced Vanderbijlpark Newcastle Saldanha Company 2014 Due to the continued depressed condition of the construction sector, the percentage of by-products that had to be disposed of increased from 35% in to 37% in. In December Newcastle was issued with a directive to stop BOF slag sales. This directive was issued on the premise that our clients lacked the requisite waste management licences. We strongly contend that BOF slag is a product and is not subject to applicable waste management regulation but rather to product-related regulations. A request on these grounds to the minister of environmental affairs was dismissed in April, as was an appeal. As a result, and believing strongly in both the merits and benefits to all stakeholders of our case, we have been compelled to take the matter further on review. This enforcement action by the authorities has had a negative effect on our by-product sales and revenue associated with such sales. We remain committed to find further markets for our byproducts. Legacy site rehabilitation In we continued to invest in rehabilitating sites as failure to do so poses significant environmental risks. This year at Vanderbijlpark Works, where the bulk of remediation activities are taking place, the focus was on maintaining and improving the existing remediated areas. Erosion damage, control of invader plants and optimisation of stormwater management received attention in addition to the planning of new projects. Approximately 570 hectares of disturbed land have been rehabilitated or remediated to date. It is important to note that the maintenance and monitoring of our remediated areas is equally important, and that the vegetation in our previously disturbed areas is now so well established that grass harvesting could take place this year, with bales being donated towards drought-relief initiatives Vanderbijlpark Newcastle Saldanha Company 2014

149 Execution against our strategic objectives Integrated Annual Report 53 Our ISO certified environmental management systems are based on these core principles. In all of our operations retained their ISO certification. We are bound by environmental legislation including the National Environmental Management Act, No 107 of 1998 (NEMA); the National Environmental Management Air Quality Act, No 39 of 2004; the National Water Act, No 36 of 1998 and the National Environmental Management Waste Act, No 59 of Stakeholder engagement We acknowledge that various stakeholders, including local, provincial and national government, communities and non-governmental organisations, have very material interests in our environmental performance. As directed by the board, we actively strive to ensure that maximum transparency is brought to bear on our environmental work and performance. The board is regularly updated, via the SHE committee, on engagement with stakeholders interested in our environmental performance and impacts. In Vanderbijlpark we continued to participate, with various stakeholders, in air quality, waste monitoring and water quality forums. Similarly, in Saldanha we contributed funding towards an ongoing initiative aimed at monitoring the quality of seawater in Saldanha Bay and participated in municipal stakeholder forums on a quarterly basis. Similar engagement also occurs at our other operations. Our environmental policy The 10 principles of our group s environmental policy, which guides our stewardship of the environment, are: Implementation of environmental management systems including ISO certification for all production facilities Compliance with all relevant environmental laws and regulations and other company commitments Continuous improvement in environmental performance, taking advantage of systematic monitoring and aiming at pollution prevention Development, improvement and application of low impact, environmental production methods taking benefit from locally available raw materials Development and manufacture of environmentally friendly products focusing on their use and subsequent recycling Efficient use of natural resources, energy and land Management and reduction, where technically and economically feasible, of the CO 2 footprint of steel production Employee commitment and responsibility towards environmental performance Supplier and contractor awareness and respect for ArcelorMittal s environmental policy Open communication and dialogue with all stakeholders affected by s operations The group manager: environment is responsible for overall environmental management and compliance. The group manager and corporate energy manager share responsibility for carbon and climate change issues. Both positions report to the chief technology officer. The corporate environment department reports to the health, safety and environment (SHE) committee of the board on environmental activities, performance, policies and outlook. The committee in turn raises material environmental issues with the board. Outlook In 2017 air-related improvements will be a key focus area (especially as these relate to our coke and ironmaking activities) together with continued remediation activities. In particular, we intend building on the lessons learnt in recent years to use our limited financial resources to effect significant environmental impact improvements. We will also continue engagement on practicable, useful outcomes to the carbon tax debate. Our enterprise and supplier development initiatives will be bedded down and developed while we intend giving real, practical expression to translating more of our corporate social investment spend into business opportunities for, in particular, local communities. Given any improvement in our financial performance, and working especially with our new B-BBEE partners, we commit to significantly increasing the company s socio-economic impact. Having drawn a line under our past anti-competitive practices we intend, in 2017, strengthening our ethics policies, practices and behaviours and communicating these more extensively across our workforce and supplier base. Assisting the downstream to combat the large-scale import of finished products and to exploit opportunities arising from the designation of local steel will be key priorities in the new year.


150 54 Integrated Annual Report Strategic objective 4: Creating a high-performance culture To survive we need to produce world-class steel products at world-class prices. To do this we need world-class people who value safety, teamwork, innovation, productivity, quality and each other KPI 14 KPI 15 KPI 16 Why this is important In some quarters our company has been perceived to be structurally inefficient, a giant which had become so accustomed to its own dominance that it had succumbed to complacency, had disregarded the interests of society and even those of its customers, and had failed to invest in its own processes and people. It is true that many of our plants and equipment are ageing and that they need rejuvenating. As much as this year we committed to investing almost R4.6 billion in upgrading and improving our facilities, we believe that only highly skilled, highly motivated individuals and teams can extract the maximum value from these investments. Only a pervasive, deep-rooted culture of high performance can change for the better, for the benefit of our shareholders, our customers and our communities. Three-year key performance indicators (KPIs) Total cost of employment measure (TCOE): TCOE/hot rolled tonne of liquid steel (USD)* * In this KPI changed, from USD to ZAR. From 2017 we will report accordingly. Management control performance (under B-BBEE codes) December 2014 December December Execution of Future Leaders Programme (FLP) Managers and leaders taking part 2014 * * Programme initiated in. Our most material high-performance issues in Workplace safety Training for a new operating reality Transforming our culture Implemented an integrated performance management system (IPMS) Invested R184 million in skills development and training Drove restructuring of operations, giving business units greater autonomy Gave all employees a larger ownership stake in the company Improved our management control and employment equity performance Rolled out a skills development framework pyramid, aligning training to National Qualifications Framework (NQF) outcomes Transforming our culture for a new operating reality In just two successive years, despite the extremely challenging financial realities facing our business, has succeeded in investing almost half a billion rand in upskilling and empowering its workforce. In we increased our training and leadership development spend by a third to R202 million. In, despite the many and growing demands on our limited financial capital, we succeeded in allocating R184 million towards learning and development. This was, we believe, a most considerable achievement under the circumstances, one that demonstrates our commitment to changing and even transforming our culture and empowering our people. Unfortunately this year our efforts at culture change were not reflected in our voluntary employee turnover rate, which increased substantially. It is our new reality that our investments in human capital must translate into the sustainable creation of financial capital. After six years of headline losses, it is imperative that we deliver satisfactory returns to our shareholders while adding value to all of the capitals. Our empowered, skilled people must utilise our manufactured capital (our plants and equipment) to produce quality products that meet our customers needs at prices which allow them to sustain their businesses and the jobs they create. We must consistently lower our cost of production to the point that we can state without fear of contradiction that our efficiencies are such that we can compete with the best, most efficient steel producers in the world. Delivering performance on strategic objectives That our investments in creating a high-performance culture are paying off was borne out this year by our key indicator of TCOE per tonne of liquid steel produced (TCOE/t) again declining, from USD95/t in 2014 and USD77/t in to USD72/t.
151 Execution against our strategic objectives Integrated Annual Report 55 At present, we are not able to measure how much of this productivity improvement derived from capital and operating expenditure and how much was contributed by improvements in our people s skills levels and our work culture. Currently we also do not have in place formal measures of employee engagement, although senior grades are formally engaged every two years as per ArcelorMittal group guidelines. This year we employed people of whom were African, coloured and Indian. In our voluntary employee turnover rate rose substantially from s 3% to 5.3%. In a context of low economic and employment growth, this clearly reflected employees continuing uncertainty about the company s prospects and the effect that financial constraints had on our ability to use remuneration to retain scarce skills. Most notably, turnover was high in specialist areas including finance and accounting, engineering, logistics and senior management.. voluntary turnover year to date December (%) Senior Artisans Engineering Finance Human Information Logistics management and and resources technology and technology accounting transport Voluntary turnover benchmark 5% Manufacturing and operations Marketing Product and and sales maintenance Supply chain Support services Total From the end of a bespoke SAP Success Factors performance and goals module was implemented. The system enables objectives to be cascaded down from the chief executive officer and executive committee to individual employees, thus enabling managers and employees to focus on those behaviours and outcomes that are important to drive a high-performance culture. This system supports the strategic objective of effective people management through standardisation, integration and simplification. In addition, it aims to simplify the performance and objectives management process. This online system will, we believe, increase efficiency and continuously manage employee performance by: Aligning individual objectives to business strategy Streamlining the performance review, feedback and coaching process Enabling the identification of talents and building effective teams The fully automated system uses real-time dashboards and readily accessible drill-down data to show how every level of manager, supervisor and team has performed against specific metrics in terms of delivering on our strategic objectives. Measured tasks can be monitored and amended on a weekly basis, providing not only greater insight into overall functional performance but better informing variable remuneration the key financial incentives that reward high-performing individuals and teams. This R2.3 million system was successfully implemented by local third-party consultants within 16 weeks and below budget. A particularly important shift in our appreciation and use of the powerful performance tools we have at our disposal was that these are now considered essential, core business tools, not human resources tools. Additional modules including the learner management system and succession and development will be implemented in 2017 to ensure that people management processes are fully integrated and automated. Changing our corporate culture A Barrett culture survey conducted in 2013 disclosed a command corporate culture in which there was little scope for individual or team initiative, a culture in which individuals were not inclined to take their safety or that of their colleagues and team members seriously. This landmark survey resulted in the implementation of new ArcelorMittal South Africa values: safety, caring, customer focus and commitment. To embed a values-driven culture, management pacts and action plans were implemented. In addition, a Future Leaders Programme (FLP) targeting management was rolled out and was underpinned by a values-driven leadership style. In there was a renewed focus on driving our culture transformation journey with an emphasis on embedding the values and associated behaviours to support a high-performance culture. We acknowledge that our demographic profile, at all levels but particularly at the management (B to D) levels, requires sizeable and decisive intervention, especially the recruitment and fast-tracking of African, coloured and Indian (ACI) talent. For information on our B-BBEE management control performance in, see 47. As much as the use of the Success Factors system will largely address this situation, a cultural step-change towards values-based leadership is needed. In cultivating a new set of shared values, the allocation this year of an effective 5.1% shareholding to an employee empowerment share trust will be of considerable benefit. Today employees and managers own a total 6.6% of the company.
152 56 Integrated Annual Report Strategic objective 4: Creating a high-performance culture continued In an employee share ownership plan gave more than full-time employees a 4.7% stake in the business. However, this was diluted to 1.9% following our successful rights issue undertaken in February. The new shares will vest for 10 years with at least 60% of shares benefiting ACI employees. Giving employees a more substantive financial interest in the fortunes of the company will sharpen our focus on creating a culture in which all employees believe they can contribute to our sustainability and success (see 48). Training for a new operating reality We endeavour to constantly meet the ArcelorMittal group sustainability outcome of providing a workplace in which every individual is developed to their full potential. Our sizeable training spend this year (and that of ) was aimed not just at equipping employees, including executives and managers, with practical, high-performance workplace skills but was also aimed at cultural change. A recent standout success has been FLP which was developed and implemented from, in association with Duke University. As stated in the previous integrated annual report, FLP aims to transform and align leadership values with the desired values of and to strive for operational excellence. Delivering learning through experience and application, FLP seeks to entrench a culture of strong, principled leadership. This year the cost of FLP amounted to R9 million (: R6.7 million) with 269 employees taking part (: 226). Delivered over five days, FLP consists of three modules: Module 1 deals with personal insight and alignment with group values and includes an equine immersive experience making individuals aware of their personal values and how these relate to desired company values. Module 2 deals with operational excellence, providing the latest thought leadership to empower leaders in the execution of their duties and to instil discipline within their teams. Module 3 addresses leading and implementing change with two immersive experiences. The first utilises a motor-racing pit-crew experience to focus on team excellence. The second addresses leading change with a simulated courtroom experience in which teams are formally charged and act as prosecution, defence and judiciary with proceedings being overseen by an actual judge. Between modules, participants work in cohorts of five or six colleagues, taking part in action learning projects (ALPs) which harness diverse groups working on specific topics to improve particular aspects of our business. As in, this year 35 ALPs were undertaken. Twenty-nine of these resulted in technical, mostly process enhancements which have already been implemented in the workplace. In addition to technical projects, the focus of ALPs was on so-called people activities, in particular: Strategy and values Leadership Employee value proposition (EVP) High-performance teams Each ALP was required to focus on an aspect of the ArcelorMittal South Africa EVP. In the recent past we had intended to roll out a succinct EVP to our workforce but doing so would be symptomatic of a top-down mentality, which we intended to move away from. Instead, ALPs sought to obtain as much input from as wide a variety of the workforce as possible so that a company EVP would be meaningful to and reflective of the values of all employees. It is hoped to disseminate a new EVP throughout the company in In addition to FLP (269 candidates), in a comprehensive skills development framework pyramid was instituted throughout the company. In terms of the pyramid model, 548 individuals were enrolled in leadership programmes; 27 senior managers in Summit, 93 middle managers in Alpine, 87 employees in Base Camp and 341 in first-line management programmes. In total, 817 candidates were engaged in all leadership programmes. Courses were aligned throughout with defined NQF outcomes, the total skills development (SD) outlay of R184 million contributing to claiming points (out of a possible 25) in the SD component of the B-BBEE Codes of Good Practice (: 24.63). This was a performance that was matched by few other large companies. In recent years our B-BBEE SD scores have been negatively impacted by our low spend on qualifying African women. This underperformance related to the demographics of our workforce; as at 31 December we had only 417 African women employees, of whom just 145 were in bands A to G. In amendments to legislation governing B-BBEE negatively impacted us because of the low number of qualifying African women employed. However, this provided an opportunity to develop unemployed African women from our local communities through an entrepreneurship programme. In, 212 African women benefited from this company-funded training, at an NQF Level 4, representing the creation of R12 million of social capital. We are committed to building a strong pipeline of talented scientists and engineers for tomorrow. Despite the many financial challenges, in our development pipeline to address our need for technical skills (engineers, technicians, artisans and production staff) remained positive, numbers enrolled increasing by 3.4% to candidates. The various pipelines are developed over six-year cycles (workforce plans) and are essential to address and rejuvenate the ageing workforce.

153 Execution against our strategic objectives Integrated Annual Report 57 Compared to, there was a decrease in the training hours for bargaining unit employees although this year the number of hours still equalled the average of the past five years. This training takes place on the job and is based on peer-to-peer training addressing the skills required to operate machinery and produce steel. Also included in this training are legal aspects relating to mobile and lifting equipment and fatality prevention standards. In contrast to the bargaining unit, the number of training hours of the package employees increased due to the focus on managerial and leadership training during. Skills development pyramid Training and development Focus of development TALENTS Coaching/ Pioneer programme mentoring Business school Local leadership academy - Future External professional knowledge Leaders Programme Identification of functional talents TEP FFLP Assessment Apprenticeship programme Candidate artisan programme Production learnership programme Functional academy (plant-specific training) NON-EXEMPTS PROFESSIONALS TOP MANAGEMENT AMU courses External professional courses Functional academy Challenge Programme Alpine Programme Supervisor development programme Internships Functional academy Base Camp Programme Explore Programme Summit Programme MIDDLE MANAGEMENT Enhancement of leadership skills Knowledge of the group Development of strategic skills Enhancement of succession/ tailored skills development Development of leadership skills Broaden business awareness and knowledge Cross-functional exposure Identification of talents for senior roles FIRST LEVEL MANAGEMENT Building basic managerial skills Expanding professional knowledge and skills Identification of talent for further advancement Safety awareness Building professional skills Second profession Identification of candidates for superintendent The development of our junior or first-line managers is critical for business performance as 80% of the time of first-line managers is spent dealing with people issues. To provide desired behaviours and business acumen, the junior management programme (JMP) or supervisor development programme was originally introduced with a cadre of 341 candidates. This programme essentially forms the entry or gateway to further development of these managers through the managerial staircase/framework. The successes of the leadership programmes, which are co-designed and facilitated on site by Duke University Corporate Education, include uplifting the overall competency levels of our management teams while having a direct impact on the successes and productivity of our plant operations. This year the programme afforded an opportunity for Summit delegates to visit India and the United States where they were exposed, through immersive experiences, to innovation and client centricity. Another achievement is the implementation of the young talent programme, also presented on site by Duke University, which commenced this year. The aim of this programme is to develop differently-abled employees on an NQF Level 5. At year-end 22 differently-abled candidates were registered on this programme.
154 58 Integrated Annual Report Strategic objective 4: Creating a high-performance culture continued This year skills development spend decreased by 8.9% to R184 million (: R202 million). Cost Training expenditure () Training hours bargaining unit employees Training hours package employees Individuals directly impacted by skills development Apprentices Learner technicians Production learners University and technikon bursars Candidate engineers Candidate technicians Candidate artisans Graduates in training Total development pipeline Pipeline: employment equity African Coloured Indian White Total Pipeline Total Male Female Male Female Male Female Male Female Male Female % EE Apprentices Candidate artisans Candidate engineers Candidate technicians Graduates in training Learner technicians Production learners University bursars Total Externally assured. Directing our drive towards high performance The general manager: human resources and transformation, reporting to the chief executive officer (CEO), is a member of the executive committee and regularly briefs fellow executives on employment, recruitment, skills development and transformation issues. The board s remuneration, social and ethics committee is addressed by the general manager at its quarterly meetings regarding the delivery of the human resources agenda. Through this agenda we are committed to the fair, equitable and non-discriminatory treatment of all employees including equal remuneration for men and women, and to building an inclusive and diverse workforce. We align our people management strategy with our business goals, to drive cost competitiveness and sustainable productivity, and develop and sustain a skilled and capable organisation. We are directed by a group-wide health and safety policy, which includes our safety principles and highlights the imperative of shared responsibility for the safety of employees and contractors. Within we also have a safety, health and wellness policy, and comply with relevant local occupational health and safety legislation including the Occupational Health and Safety Act (1993). The CEO is ultimately responsible for the health and safety of employees. The group manager: safety, health and wellness, reports to the CEO and manages day-to-day health and safety issues. This function also reports to the safety, health and wellness committee which meets on a monthly basis and is chaired by the CEO. The committee comprises the group manager: safety, health and wellness, the chief technical officer, the general managers of each operational site and union representatives. [X-ref to SO 1]
155 Execution against our strategic objectives Integrated Annual Report 59 Labour relations In the labour relations climate was stable, the two largest unions, the National Union of Metalworkers of SA (Numsa) and Solidarity, having signed two and three-year wage agreements in. Numsa is the largest union at, its members comprising 62% of bargaining unit employees, Solidarity members 37% and members of the United Association of South Africa (Uasa) 1%. In total, 69% of all employees are unionised. For and 2017, for Numsa and Solidarity members (and 2018 in the case of members of the latter union), the formula applicable to the agreement will be CPI +1% but not less than 7% as a minimum guaranteed increase across the board including a medical aid cap. A floor of 4.5% and a ceiling of 6.5% will be applicable. This applies to all allowances, excluding protected allowances. This year 44 employees at Vereeniging Works took voluntary severance packages and 64 took voluntary early retirement in terms of a so-called section 189 process initiated in September and carried out with facilitation by the Commission for Conciliation, Mediation and Arbitration. An initial 249 employees were affected by the process which succeeded in avoiding enforced retrenchments (as per an undertaking made by the company) through measures including redeployment and the freezing of vacancies. Employee benefits Membership of a retirement fund is a condition of employment for all permanent full-time employees. At Saldanha Works, employees become members of the Saldanha Steel Retirement Fund while all other employees may choose to become members of either the ArcelorMittal SA Selector pension and provident funds or the Iscor Employees Umbrella Provident Fund. Employees contribute 7% of pensionable salary and the employer 10%, this latter amount being included in employees total cost to company for package category employees. Retirement funds are independent legal entities, existing separately from their beneficiaries and are capable by law of suing and being sued of acquiring, holding and alienating movable and immovable property, and acquiring rights and obligations. They are managed by boards of trustees which are constituted by employer-appointed and memberelected trustees. The company s retirement funding obligations towards current employees are all in terms of defined contribution. Defined benefit obligations towards a number of company pensioners were funded from general company resources. However, towards the end of, the trustees of the major defined benefit fund and the employer succeeded in terminating the balance sheet liability of the major fund, which had assets of R8 billion. The other smaller defined benefit fund, the Iscor Retirement Fund, was outsourced to an insurance company in December. Membership of a medical aid is compulsory for all full-time permanent employees unless employees are covered by their spouse s medical aid. This year 96.8% of all employees were on company-provided medical aid. The company furthermore offers family funeral benefits to employees and their dependants. These benefits are insured through an external provider and are fully funded by the company. A policy extending support to those injured or killed while on duty but who are not permanent employees was introduced this year, in line with board direction to further materialise the company s duty of care. As well as permanent employees, support will now be extended to those injured (or the families of the deceased) where the person concerned is a fixed-term contract employee or temporary employee, an expatriate, production learner or apprentice (ie not in possession of a letter of appointment or permanent employment contract). Stipulations in the policy do not influence the application of guaranteed benefits that would normally apply under these circumstances, such as company death cover/disability benefits and/or provisions under the Compensation for Occupational Injuries and Diseases Act. In just one case of noise-induced hearing loss was recorded (: eight). Most cases were derived from testing of ageing or retiring employees. No cases of pneumoconiosis, silicosis or asbestosis were recorded in. The company s occupational disease frequency rate was (: 0.19). Outlook for 2017 In 2017 the company s people strategy will focus strongly on translating the substantial recent investments made in leadership and skills development into productivity gains on the ground. We will continue to focus on transformation, driving the employment equity agenda, in particular the management control element of the B-BBEE scorecard while seeking to ensure sound labour relations through ongoing, constructive dialogue with trade unions to drive profitability for the benefit of all stakeholders. In addition, we will deliver an employee value proposition that will reflect the high-performance, values-based culture which we believe is now taking root at and which will enable us to recruit and retain high-performing individuals, a particular concern given the high voluntary turnover rate recorded in.
156 60 Integrated Annual Report Leadership Overview is a public company listed under the Industrial Steel and Other Metals sector of JSE Ltd (JSE). The company is subject to the JSE Listings Requirements and the Companies Act, as well as other legislation applicable to companies in South Africa. Ethical and effective leadership The board of directors is the custodian, and focal point, of corporate governance at. The board supports and practises the principles set out in the King Code on Corporate Governance (King III). As enunciated by King IV (the successor to King III), the board acknowledges that it is important to have good corporate governance structures and processes and that the board needs to lead and direct the organisation in an ethical and effective manner. The board accepts that effective leadership entails guiding management and making strategic choices about the future direction of the company. Most importantly, the board remains accountable and should report in a transparent and open manner to all stakeholders regarding the performance of the company and how it has fulfilled its responsibilities as a board. As set out in King IV, the board is mindful about the outcomes it needs to achieve and appreciates that the company s core purpose, its risks and opportunities, strategy, business model and sustainable development are all inseparable elements of its value creation process. This year an externally facilitated self-assessment of the board s performance and effectiveness found that the board believed its performance to have been effective. However, following this review and given the extremely challenging circumstances facing the company and the need for urgent, far-reaching strategic choices, the board decided on the following focus areas: The CEO and management were directed to engage more frequently and with greater purpose outside of board meetings with board members The board instructed the company secretary and management to improve the quality of director induction and the frequency of ongoing director development and education CEO and senior executive performance goal-setting, evaluation and succession management to be more closely interrogated. This year the board and committee terms and references and work plans were reviewed. Key board activities and achievements this year included: Managing the appointment of the incoming CEO and the transition process Actively supporting the CEO and management in charting a way through the many challenges faced by the company and the steel industry Approving a strategy providing guidance to management on material issues and key strategic objectives to be addressed, and identifying key indicators to monitor progress against the achievement of these priorities Closely monitoring progress in terms of the B-BBEE scorecard. Notably, the board was intimately involved in the process of selecting the most appropriate B-BBEE partners and in ensuring that the ownership transaction achieved this year would unlock maximum value for the company and for stakeholders, including local communities and employees Reviewing the codes of business conduct and ethics and considering initiatives to enhance the compliance framework and culture within the company Holding management to account on safety performance while giving direction on the company s duty of care towards those injured at work and the families of those who passed away Interacting extensively with management on corporate actions including import protection and localisation, Competition Commission issues, Evraz Highveld Steel and Thabazimbi mine Through the safety, health and environment committee, monitoring, in detail, safety and environmental issues Closely involving itself in matters relating to funding and the company s status as a going concern as well as the footprint reviews of Saldanha and Vanderbijlpark Works and the Saldanha recovery plan Giving direction on desired outcomes in terms of stakeholder engagement and social and human value creation Giving detailed leadership on strengthening the internal audit and combined assurance functions An externally facilitated evaluation of the board s performance and effectiveness was undertaken in. Policies and procedures The board s governance policies and procedures are continually updated to ensure ongoing adherence to the JSE Listings Requirements, current legislation, international best practice and King III. The board also recognises that its role includes approving and monitoring the implementation of strategy that adequately considers the organisation s priorities, its impacts on the various capitals, and its ability to create meaningful, sustainable value for stakeholders. Structure and process The board is governed by a formal board charter setting out its composition, processes and responsibilities. The primary responsibilities of the board are to: Retain full and effective control of the company Give strategic direction to the company Monitor management in implementing plans and strategies, as approved by the board Appoint the CEO and executive directors Ensure that succession is planned Identify and regularly monitor key risk areas and key performance indicators of the business Ensure that the company complies with relevant laws, regulations and codes of business practice Ensure that the company communicates with shareholders and relevant stakeholders openly and promptly Monitor the company s integrated performance Establish a formal and transparent procedure for appointment to the board, as well as a formal orientation programme for incoming directors Regularly review processes and procedures to ensure the effectiveness of internal systems of control including information technology (IT) management and accept responsibility for the total process of risk management Assess the performance of the board, its committees and its individual members on a regular basis.
157 Corporate governance Integrated Annual Report 61 The board delegates to committees of the board particular roles and responsibilities which are detailed in committee reports forming part of this Leadership section. Committees of the board are all governed by formal terms of reference which in no way amount to a discharge of the board s accountability. A clear division of responsibility exists at board level, as captured in the board charter which provides evidence of the balance of power between the independent non-executive chairman, chief executive officer and non-executive directors. The company seeks to comply with the recommendations of King III regarding its composition. With the retirement of Mr C Murray in May, as well as the appointment of Ms NP Gosa who represents the B-BBEE partner, the balance in the composition changed and includes two executive directors, five non-executives and five independent non-executives. The majority of members are non-executive directors but there is an equal number of non-executive and independent directors. It is envisaged that at the annual general meeting in May 2017 this matter will be addressed. Following the retirement of Mr Murray in May, the board functioned without a lead independent director. The board was of the view that it would be appropriate to postpone electing a lead independent director until after the completion of the company s B-BBEE transaction and the appointment of an additional independent non-executive, scheduled for Q The board remains an effective board. A board matrix, which sets out the skills and expertise of the various directors, as well as feedback from regular board evaluations and the accepted need for diversity and transformation, inform the composition of the board, and assist in identifying any additional skills or areas of expertise needed to ensure a balanced and effective board. The board, through the nominations committee, has considered that the executive and non-executive directors together have the range and mix of skills, knowledge and experience necessary for them to govern the business effectively. The nominations committee assists the board in ensuring that the board comprises individuals whose background, skills, experience and diversity will assist the board in meeting the future needs of the company. This year the board accepted that women were underrepresented both within the workforce and on the board. As a result, greater substance was given to the board s gender diversity policy (adopted the previous year). In particular, in the nominations committee was tasked with addressing barriers to, and providing strategic direction on, the advancement of gender diversity at board level. The remuneration, social and ethics committee was also tasked with creating synergy across the business on issues of gender diversity, succession planning and transformation in general. The board s gender diversity policy was aligned with the company s B-BBEE scorecard targets as these related to management control. Accordingly, in two female directors were appointed, Ms Lungile Zee Cele in January and Ms Noluthando Gosa of Likamva Resources with effect from December. This brought the number of women on the board to three of 12 members. The gender diversity policy obliges the board to seriously consider the appointment of female candidates, particularly black women, whenever vacancies, retirements or other opportunities for board appointments arise. While the board was mindful of the importance of setting gender diversity targets, it was of the view that such decisions would be best taken after ensuing changes to board membership had been effected (in early 2017). The roles of the chairman and CEO are separate. The chairman provides overall leadership to the board without limiting the principles of collective responsibility for board decisions. The chairman has no executive functions. The CEO is responsible for developing and recommending to the board a strategy and vision for the company, as well as an annual business plan and budget to support the strategy. The board rigorously interrogates the strategy and budget and provides input. The CEO exercises final executive authority to run the company efficiently on a day-to-day basis, and is the leading interface between the board and executive management. Directors exercise objective judgement on the affairs of the company independently from management but with sufficient management information to enable proper and objective assessments to be made. The directors understand their fiduciary duty to act in good faith and in a manner that the directors reasonably believe to be in the best interests of the company. Each decision made is based on all the relevant facts provided to the board at the time. Ethical business practices Fair and ethical business practices are at the heart of our values. These principles are entrenched in our code of business conduct and reinforced by specific policies and training programmes on issues such as anti-trust and anti-corruption behaviour. This year the remuneration, social and ethics committee reviewed the code and anti-corruption guidelines and reported to the board that it believed these were adequate. The anti-corruption guidelines establish procedures for handling concerns about possible corrupt practices and provide guidance on how to fight and prevent corruption. All senior executives and staff in relevant sections of the business are required to be trained in the application of these guidelines. Anti-competitive behaviour is monitored according to anti-trust guidelines. All senior executives and staff in relevant sections of the business are trained in the application of these guidelines. This year the Competition Tribunal confirmed a settlement agreement reached between the company and the Competition Commission relating to past practices. In terms of the settlement agreement, we will be obliged to annually provide the Commission with a report on our compliance with all terms of the agreement. In addition, an independent external audit will be conducted by our independent auditors or another reputable audit firm to confirm that the pricing remedy forming part of the agreement has been applied in accordance with the agreement s provisions. The company will report to the Commission on its adherence to the pricing remedy on a six-monthly basis.
158 62 Integrated Annual Report Leadership continued In December the CEO communicated to employees, including managers and directors, as follows: is already on a bold new compliance path and we welcome the fact that we have settled past legacy behaviours with the Commission. With that behind us, our management team can focus on returning the company to sustained profitability in compliance with law. It is of crucial importance that as an organisation we never find ourselves in this position again. It is important for all employees, especially those of you who have responsibilities dealing with customers and other stakeholders, that you become familiar with your obligations, and in particular, what kind of conduct may or may not be permissible. If in doubt you are invited to contact your manager, the legal department or compliance officer for advice and assistance. In addition, a Competition Law training programme is available and being rolled out throughout the organisation. Our global code for responsible sourcing was developed in collaboration with customers, suppliers, peer companies and NGOs. It outlines the minimum standards with which we expect suppliers to comply in the areas of health and safety, human rights, ethics and environmental responsibility. It applies to our suppliers and contractors, their affiliates and to all of the products and services that we purchase. We encourage our suppliers to promote the requirements of the code within their own supply chains. In line with our commitment to create and maintain supply chains that our customers trust, suppliers must acknowledge their adherence to the global ArcelorMittal code for responsible sourcing. This year we required suppliers to complete a responsible sourcing questionnaire which covered their policies and practices, record keeping and certification of human rights, health and safety, and environmental best practice. Responses to the questionnaire were incorporated into supplier performance evaluations. Over the past year, 61 ethics-related incidents were reported to forensic services (: 53). Of these, 58 were found to have been unsubstantiated or were referred back. Seven allegations were substantiated. Corrective action taken this year resulted in one dismissal and one case of corrective counselling. One employee resigned as a result of forensic investigations and one was issued with a final warning. A formal process is in place to track and report incidents, while also ensuring that recommendations are fully implemented by management. We have zero tolerance for performing or concealing fraudulent and/or illegal acts, as defined in the company s anti-fraud policy. A fraud whistleblower line ( ) is operated by Global Compliance on behalf of the company. Fraud awareness training sessions for various employees of all levels were held during the fraud awareness week in November. Various posters with the whistleblower number, address and website are visible within our buildings. An was sent to all users of the company and flyers were distributed across all plants two weeks prior to the fraud awareness week, with information regarding the week. An interview was also conducted with the general manager: forensic services of the ArcelorMittal group and published in the e-newsletter during November. The CEO distributes group notices to all employees on an ongoing basis which highlight forensic issues identified, creating awareness of fraud and its consequences while advertising the hotline numbers. After finalising our long-running competition issues with the relevant authorities, measures to prevent a repeat were widely disseminated by the CEO s office. This year no donations, either financial or in kind, were made to political parties. Such donations are strictly governed by an ArcelorMittal group policy which requires prior written approval by responsible office bearers and the regular maintenance of political donations registers and the signing of regular compliance certificates. Human rights In the year reviewed none of our operations was identified as having human rights violations, including violations of the right to exercise freedom of association and collective bargaining, or to have been at risk for child, forced and compulsory labour. Our close relationship with suppliers provides an opportunity to positively influence their environmental and social conduct, and we see this as an important part of our responsibility as a good corporate citizen. This year no instances were identified where the possibility existed for suppliers to infringe human rights as defined by our human rights policy and internationally accepted covenants and declarations. No specific human rights issues were raised at the board or senior executive levels. The ArcelorMittal human rights policy complements and brings together the human rights aspects from other company policies and guidelines. These include our code of business conduct, the health and safety, environment and human resources policies, and the anticorruption guidelines. The human rights policy sets out the principles underlying our actions and behaviour in relation to human rights, and applies to all employees and subcontractors working at our sites. Key stakeholders include: Employees: we want our workforce to be safe and healthy, committed to our success, and to carry out our business with integrity. We are committed to respecting the human rights of all of our employees. We develop our employment policies with the aim of achieving uniform worldwide application of the relevant aspects contained in the International Human Rights Declarations. We are committed to train our employees to be aware of, respect and protect human rights in the workplace and in the local communities directly impacted by our operations Business partners: we want our customers to trust that we live up to their standards, both in our steel business and in our supply chain. We seek to respect and promote human rights when engaging with subcontractors, suppliers, customers, joint ventures and other partners. We do this, as appropriate, through proactive engagement, monitoring and contractual provisions
159 Corporate governance Integrated Annual Report 63 Local communities: it is important that we are welcomed as good neighbours that actively engage and listen to local stakeholders, and make a positive contribution to more resilient and thriving communities through both our day-to-day operations and through thoughtful, well-targeted investments. To this end, we seek to respect human rights and to develop an understanding of the cultures, customs and values that prevail in our local communities by developing an inclusive and open dialogue with the people affected by our operations Specific provisions of our human rights policy include: Promoting health and safety Promoting freedom of association Eliminating forced or compulsory labour Abolishing child labour Eliminating unlawful discrimination in the workplace Eliminating harassment and violence Providing competitive compensation Upholding conditions of employment Avoiding involuntary resettlements Respecting indigenous people s rights Adopting proportionate security arrangements Developing practices for land and water use. Board membership and changes to directorate For the year under review, the board consisted of 12 members: five independent non-executive directors (Mr PM Makwana, Mr JRD Modise, Ms NP Mnxasana, Mr NF Nicolau and Ms LC Cele), five non-executive directors (Messrs RK Kothari, D Clarke, H Blaffart, LP Mondi and Ms NP Gosa) and two executive directors (Mr WA de Klerk and Mr D Subramanian). The independent non-executive directors are considered by the board to be independent in mind, character and judgement. Biographical details of board members at the date of this report as well as their membership, and attendance at meetings of board committees are on 22 and 23. Expanded biographical details of directors and senior managers are available at DirectorsManagementProfile.aspx. Appointments to the board are made in a formal and transparent manner, with the assistance of the nominations committee. Changes in the directorate this year were: Ms LC Cele was appointed as an independent non-executive director with effect from 4 January Following Mr PS O Flaherty s resignation as the CEO and executive director of the company on 12 February he was appointed as a non-executive director, with effect from 1 March. Mr O Flaherty resigned as a board member on 20 July following an effective handover process to the new CEO Between 13 February and 1 July, the CFO Mr D Subramanian was appointed as acting CEO and Mr G van Zyl as acting CFO. Mr WA de Klerk was appointed as CEO and executive director with effect from 1 July Mr M Vereecke resigned as a non-executive director on 15 July as a result of his new responsibilities in Europe, following an internal reorganisation of the ArcelorMittal group Mr DK Chugh retired as an employee of the ArcelorMittal group at the end of July and therefore also retired from board appointments related to his official position. His resignation as a non-executive director became effective on 15 July In Messrs Vereecke and Chugh s places, Messrs D Clarke and H Blaffart were appointed as non-executive directors with effect from 19 July Following conclusion of the B-BBEE ownership transaction, one representative nominated by Likamva Resources, Ms NP Gosa, was appointed as a non-executive director with effect from 1 December. The chairman The chairman is an independent non-executive director and is free of any conflicts of interest. The chairman s role and functions are formalised and include: Setting the ethical tone for the board and the company Providing overall leadership to the board As chairman of the nominations committee, identifying and participating in selecting board members and overseeing a formal succession plan for the board, the CEO, the CFO and certain key management appointments Together with the company secretary, formulating a yearly board work plan Ensuring that the directors are aware of their fiduciary duties as directors of the board Ensuring that complete, timely, relevant, accurate and accessible information is placed before the board to enable it to reach an informed decision Ensuring that decisions by the board are executed Ensuring that good relations are maintained with the company s major shareholders and stakeholders. CEO The CEO is an executive director on the board and plays a critical role in the operations and success of the day-to-day business of the group. Board authority conferred on management is delegated through the CEO, in accordance with approved authority levels. The CEO s role and functions are formalised, and include: Appointing the executive team and ensuring proper succession planning and performance appraisals Developing the company strategy for consideration and approval by the board Developing, recommending and implementing the annual business plans and the budgets that support the company s short and long-term strategies Establishing an organisational structure for the company to enable execution of its strategic planning.
160 64 Integrated Annual Report Leadership continued Retirement and re-election of directors One-third of directors are subject, by rotation, to retirement and re-election at the annual general meeting in terms of the company s memorandum of incorporation. Messrs PM Makwana, R Kothari, NF Nicolau and Ms LC Cele retire and, being eligible, have offered themselves for re-election at the AGM in May In accordance with the company s memorandum of incorporation, shareholders will be asked to confirm the appointment of Messrs WA de Klerk, D Clarke, H Blaffart and Ms NP Gosa as directors of the board at the forthcoming AGM. Company secretary The company secretary advises the board on appropriate procedures for the management of meetings and the implementation of governance procedures. The company secretary provides the board collectively, and each director individually, with guidance on the discharge of their responsibilities in terms of legislation and regulatory requirements applicable to South Africa. On a quarterly basis, the board is informed of changes to legislation, regulation and best practice by means of a formal written update provided by the company secretary. The company secretary and chairman of the board ensure that the affairs of the board are managed effectively. Appointment and removal of the company secretary are dealt with by the board. The company secretary monitors directors dealings in shares, and ensures adherence to closed periods for share trading. Ms Nomonde Beatrice Bam has served as the company secretary since August. Board committees While the board remains accountable and responsible for the performance and affairs of the company and the need to provide consistent, quality, ethical and effective leadership, it delegates to management and board committees certain functions to assist it in properly discharging its duties. Each committee acts within approved written terms of reference under which authority is delegated by the board. The chairman of each committee reports at each scheduled meeting of the board, and minutes of committee meetings are provided to the board. Audit and risk committee The audit and risk committee report, required in terms of section 94(7) of the Companies Act, is set out on 74 of this integrated annual report. Safety, health and environment (SHE) committee The SHE committee has been mandated to assist the board in ensuring sound management of safety, health and environmental matters. The committee comprised Mr NF Nicolau (chairman), Ms NP Mnxasana, Ms LC Cele, Mr D Clarke and the CEO. Representatives of both the Numsa and Solidarity unions attend meetings as permanent invitees. The general managers of all business units, the chief technology officer, the group manager: health, safety and wellness as well as the group manager: environment are permanent invitees of the committee. The committee met three times during the year under review. It rotates its visits between plants to ensure site visits by committee members. The main duties of the committee are to: Ensure that the management of safety, health and the environment in the company is aligned with the overall business strategy of the company Consider and approve corporate safety, health and environmental strategies and policies Ensure that committee members are informed about all significant impacts on the company in the safety, health and environmental field and how these are managed (process and activities) Monitor the company s safety, health and environmental performance, progress and improvement Ensure adequate resources are provided to comply with SHE policies, standards and regulatory requirements. Remuneration, social and ethics committee (RSEC) RSEC s roles and responsibilities include setting and reviewing remuneration policy, implementation and reporting, and oversight of the company s ethics, social value creation, sustainable development and stakeholder engagement. The committee met four times during the year. As per King IV, all members were non-executive directors, of whom a majority were independent. From May RSEC members were Ms NP Mnxasana (chairman), Mr JRD Modise, Ms LP Mondi, Mr H Blaffart and Mr NF Nicolau. Mr RK Kothari was a permanent invitee. In the committee reviewed the company s performance and strategy relating to the economic, social and environmental contexts, including its standing in terms of the goals and purposes of: The 10 principles set out in the United Nations Global Compact Principles The OECD recommendations regarding corruption The Employment Equity Act The Broad-Based Black Economic Empowerment Act. The committee also received reports on, and considered, the company s: Remuneration policy and the design and implementation of guaranteed and variable pay Promotion of equality, prevention of unfair discrimination, and reduction of corruption Contribution to the development of communities in which its activities are predominantly conducted or within which its products or services are predominantly marketed Records of sponsorship, donations and charitable giving The health, environmental and public safety impacts of the company s activities and of its products or services
161 Corporate governance Integrated Annual Report 65 Consumer relationships, including the company s advertising, public relations and compliance with consumer protection laws Labour and employment, including the company s standing in terms of the International Labour Organisation s protocol on decent work and working conditions, and the company s employment relationships with and its contribution toward the educational development of its employees General salary increases and mandates for negotiations with trade unions Ensuring a proper system of succession planning for top management and monitoring of the succession plan for the rest of the organisation Confirming appointments to senior management positions Employment equity plans for implementation Matters relating to corporate culture and management performance in terms of retention and talent development. Nominations committee The functions of the nominations committee are to: Ensure that procedures for appointments to the board are formal, transparent and in accordance with the JSE Listings Requirements, the memorandum of incorporation and the Companies Act Regularly review the board structure, size and composition and make recommendations to the board on the composition of the board in general, and any adjustments that are deemed necessary, including the balance between executive, non-executive and independent non-executive directors assume responsibility for board diversity including gender diversity policy Identify and nominate candidates for the approval of the board to fill board vacancies as and when they arise Be responsible for succession planning, in particular for the chairman and executive directors Agree, and put in place, a performance contract with the CEO Formalise the annual performance reviews of the board, the respective board committees and individual board members The nominations committee is chaired by the chairman of the board and consisted of a majority of independent directors: Messrs PM Makwana (chairman), NP Mnxasana, JRD Modise, RK Kothari and H Blaffart. The committee met three times in. The CEO and other relevant members of management attend the meetings by invitation. In, in addition to the responsibilities detailed above, the committee was instrumental in furthering achievement of the board s gender-diversity policy. B-BBEE committee The committee monitors the company s performance on improving its B-BBEE scorecard performance and provides an umbrella view of how the company performs against each of the identified pillars of the B-BBEE codes. The committee s terms of reference include formal work plans which the committee focuses on and drives each quarter. These include: Considering and determining B-BBEE strategies and policies with respect to the following year s transformation objectives, and setting targets Monitoring the implementation of determined strategies and improvement actions per the scorecard elements as approved by the board Ensuring that effective transformation takes place within the company in respect of recruitment, retention, career development and succession planning Ensuring that effective economic transformation takes place in respect of enterprise development, supplier development and preferential procurement Establishing and reviewing B-BBEE partnership programmes and transactions. The committee consisted of Messrs PM Makwana (chairman), JRD Modise, Ms NP Mnxasana, R Kothari, D Clarke, Ms NP Gosa and the CEO. It met four times in. In the committee was intimately involved in the process and negotiations leading to the successful conclusion of the company s B-BBEE transaction. Share dealings by directors and management In line with statutory and regulatory obligations and best practice, directors and management may not deal directly or indirectly in the company s shares during specific closed periods. These closed periods operate from year-end to the announcement of annual results, and from half-year-end to the announcement of interim results. Restrictions on share dealings are also applied during any other period considered sensitive in terms of the requirements of JSE Ltd. Directors and the company secretary require the prior approval of the chairman or CEO before dealing in the company s shares. A closed period was triggered by the cautionary announcement issued by the company on the Securities Exchange News Service on 30 September, announcing the commencement of a B-BBEE ownership transaction and the intention to undertake a rights offer. A withdrawal of the cautionary announcement and terms announcement relating to the B-BBEE transaction was issued at the end of September, lifting the embargo on the trading of the company s shares. The board is satisfied that it has fulfilled its responsibilities in accordance with its charter for the financial year ended 31 December. A statement on the company s compliance with King III is available online.
162 66 Integrated Annual Report Remuneration report Remuneration context This report reflects our remuneration guiding principles and the implementation of our remuneration policy, outlining remuneration decisions made by the board and remuneration, social and ethics committee (RSEC) with respect to employees, executive and non-executive directors. Notwithstanding major achievements on areas including B-BBEE and skills development, this year s financial performance continued to disappoint. In this context, we are acutely mindful of the need for our remuneration policies and practices to strike a balance between shareholder interests and the need to attract, retain and incentivise our employees to improve company performance. During the year the senior management turnover report reflected an increase due to the departure of Paul O Flaherty and Themba Nkosi in top management roles. Voluntary turnover throughout the company reflected a similar increase (see 55). In our continued efforts to engage and address employee concerns, we implemented corrective measures such as equity pay improvements, leadership programmes, robust succession and career plans as well as driving transformation. Guiding principles Our underlying philosophy is to attract, develop and retain our employees while remaining mindful of our financial performance. In this context, we operate within the regulatory, legislative and governance frameworks as detailed in this report. Our remuneration philosophy seeks to balance the need to reward performance appropriately, fairly and competitively while remaining conscious of our responsibility to deliver shareholder value. Our approach towards managing pay includes the following principles: Total rewards mindset reward is viewed in a holistic manner comprising a range of monetary (fixed and variable) and nonmonetary components Performance aligned to strategy there is strong differentiation based on performance by all employees, addressing line-of-sight responsibilities aligned to key strategic objectives and the creation of value over the short, medium and long term. Performance is the cornerstone of reward practices and is linked to shareholder, company, business unit, team and individual goals Manager discretion we continue to drive the empowerment of business units. Our delegation-of-authority matrix incorporates decentralised decision-making Legislative framework aligned to the Employment Equity Amendment Act, we adopted an internal equity pay correction strategy for those below executive level that is in its third implementation year, differentiated by individual performance and tenure Pay mix our total pay includes a variable pay element and reward for contributions to business performance. The differentiation by role level is reflected in the table opposite Consistency the reward philosophy strives to be both consistent and transparent. Benchmarking is performed annually using reliable and recognised methodologies by utilising differential market values of various skills groups and roles as reflected in variable pay practices Attraction and retention the focus is on fair and equitable remuneration practices that attract, develop and retain talent to deliver on the business strategy Governance framework aligned to King III, RSEC is delegated by the board to perform various functions and to make recommendations to the board on human resources issues. The board ensures that the remuneration policy results in fair and responsible remuneration practices in the context of overall employee and executive remuneration so as to: Attract, motivate, reward and retain human capital Promote the achievement of strategic objectives within the organisation s risk appetite Promote an ethical culture and responsible corporate citizenship. The report of the remuneration, social and ethics committee is on 64. Remuneration design structure The principle of performance-based remuneration is one of the cornerstones of the remuneration strategy. It is further underpinned by sound remuneration management and governance principles, which are promoted across to ensure the consistent application of the strategy. We strive to reward employees for individual and corporate performance through an appropriate balance of fixed pay and short and long-term variable pay. Remuneration mix s remuneration philosophy and policy aim to attract and retain motivated, high-calibre employees whose interests are aligned with those of our shareholders. This is achieved through the right mix of guaranteed and performance-based remuneration (variable pay), which provides for differentiation between high, on-target and low performance. The pay mix of guaranteed and variable remuneration differs according to the level of the employee. Generally, the more senior the employee, the higher the proportion of variable pay in his/her total remuneration package. (TGP) total guaranteed pay CEO/CFO Executive Senior management Non-unionised Unionised Remuneration mix in (STI) short-term incentive (LTI) long-term incentive 99% 1% 86% 7% 7% 92% 4% 4% 98% 2% 91% 9% Our remuneration mix is intended to reward top and senior management through a greater element of performance-based pay. The relatively low rates of variable pay for such employees reflected in the table above derive from the fact that, in, only 1% of long-term incentive targets, and 0% of short-term targets, were achieved.
163 Corporate governance Integrated Annual Report 67 Pay elements s remuneration strategy comprises the following key elements: Guaranteed pay Retirement, risk and medical benefits Retention schemes (MTI and executive retention agreements) Variable pay such as production and maintenance bonuses (OPI) and short-term incentives (STIs), ie annual performance bonuses Long-term incentives (LTIs), ie share plans Other benefits. Reward element Guaranteed Total cost to company (CTC) including company retirement contribution Strategic intent Salary structuring Equitable pay Reward for performance External competitive pay Total remuneration Benefits Medical schemes Allowances (shift) Funeral, death, insurance Short-term incentive Annual incentive scheme Legislative compliance Competitiveness (attraction) Employee lifestyle Flexibility Improved employee and company performance Driving short/medium-term goals Annual alignment (12 months) Long-term incentive Long-term equity-settled instruments Five-year strategy targets Shareholder value Performance Reward element Recognition Annual CEO Awards Long service Bronze, silver, gold awards at management s discretion Strategic intent Recognition for performance excellence Other benefits Training Future Leaders Programme Leadership training Learnerships Employee share trusts ESOP empowerment share trust Skills development Internal branding Employee value proposition Employee engagement B-BBEE compliance Culture change Retention Employee value proposition Licence to operate
164 68 Integrated Annual Report Remuneration report continued Guaranteed pay The guaranteed pay of package category employees is based on CTC. It comprises cash salary and contribution to retirement funding (including death and disability risk insurance). CTC is usually determined with effect from April each year and is informed by parameters approved by the board. Factors such as inflation, market pay and individual performance inform pay differentiation. While remuneration is benchmarked against peer competitors, the results of individual annual performance may allow earnings above the market median but not below the pay scale minimum. Guaranteed pay for bargaining unit employees is negotiated with the National Union of Metalworkers of South Africa (Numsa) and Solidarity. Pay components, which are similar to those for package category, were adjusted by 7% according to a multi-year wage agreement implemented in April for a period of three years as reflected below. Wage agreement 2017 Formulae 7.42% 1% + CPI (floor of 4.5%, capped at 6.5%) not less than 7% across the board (7% implemented for ) Once-off R2 000 (net) Semi-skilled level 6.5% (including allowance) 6.3% (including allowances) Skilled level 6.2% 6.0% (including allowances) Medical aid subsidy cap 6.5% 6.5% Unionised employees pay progression is governed by competencybased remuneration, allowing for pay progressions in accordance with the individual s assessed competency level. This pay progression model for the bargaining unit has been implemented since Benefits s policy is to provide, where appropriate, additional elements of compensation as listed below: All permanent employees are eligible for participation in our retirement funds and medical schemes Group life insurance is provided as a fixed amount of pensionable salary Funeral cover is provided to all employees All retirement plans include disability cover. Variable pay Variable pay structures include a performance incentive scheme and a productivity bonus scheme. The bonus schemes are discretionary and based on the achievement of key annual objectives. Variable pay aims to support and incentivise the achievement of strategy which, in turn, ensures our ability to create value over the short, medium and long term. The performance incentive scheme gives employees an annual performance bonus based on individual performance reviews combined with scorecards measuring the company s financial and non-financial performance. Bonus payments are calculated as a percentage of an individual s CTC. Performance incentive scheme package employees In the performance bonus plan was similar to that of and provided package category employees an annual performance bonus based on company and individual performance reviews. A performance scorecard is used to measure financial (ebitda and free cash flow) and non-financial (health and safety, and business-specific measures BSMs) performance, weighted respectively on a 70/30 basis. This is outlined in the table below, which also demonstrates the threshold, target and stretch (minimum, on-target and maximum) performance levels to be achieved against the business plan either at company or business unit level. The final score is moderated up or down based on individual performance. Performance scorecard Performance levels Performance measure and weights Threshold Target Stretch Free Health and Role 80% 100% 120% Ebitda cash flow safety BSM Total CEO 20.0% 40.0% 60.0% 40.0% 30.0% 10.0% 20.0% 100.0% General managers 15.0% 30.0% 45.0% 40.0% 30.0% 10.0% 20.0% 100.0% Group managers 10.0% 20.0% 30.0% 40.0% 30.0% 10.0% 20.0% 100.0% Managers 8.8% 17.5% 26.3% 40.0% 30.0% 10.0% 20.0% 100.0% BSMs (20% of STI) are approved by the CEO and board and reflect key business drivers that are visible in our results.
165 Corporate governance Integrated Annual Report 69 Productivity bonus scheme unionised employees The productivity bonus scheme is negotiated for bargaining unit employees with trade unions as part of wage negotiations. It seeks to drive improved safety and productivity by rewarding bargaining unit employees for achieving monthly KPI targets that include: Ebitda (80%) Safety (20%) The extent to which individual employee performance is measured against these targets is determined by employees ability to influence safety, production and productivity in their areas. The productivity bonus payment is determined as a percentage of monthly base salary and a maximum payment of 7% is applied. Production and maintenance bonus (OPI) production employees To further enhance our reward offering in driving a high-performance culture, an additional element is added to the productivity bonus. Middle managers, technical and support staff linked directly to the production of steel are measured in the same way as their staff members and are incentivised for driving safety, quality and business unit performance. This monthly productivity bonus payment is determined as a percentage of monthly salary with a maximum of 5% achievement. Long-term incentive plan (LTIP) for senior management A share option scheme was effective from 2005 to Share options were offered at market prices on the grant date and were released in three annual tranches of 33.3%, 33.3% and 33.4%, commencing on the first anniversary of the offer date and expiring after 10 years. Option plans are equity-settled as each share option converts into one ordinary share of Ltd on exercise. The options carry neither rights to dividends nor voting rights. Options may be exercised at any time from vesting to expiry date. No share option grants were made in 2012, 2013, 2014 or and, as at 31 December, all share options had vested. However, in the case of a rights offer, the trust deed of the share option scheme (clause 19) states that the scheme shares (options) held by a participant shall be increased with the number of shares to which the participant is entitled and will be equal to the subscription amount payable in respect of such rights shares at the rights offer price. Therefore, for every 100 options, the number of options increased by 163 at the rights offer price applicable to the increased portfolio only. The result this year following our rights issue was an increase of 4.8 million options that were exercisable by eligible participants. In 2012, RSEC approved a new LTIP based on performance and conditional share units, as approved by shareholders. The scheme s participants are divided into two groups: Designated members of the executive committee who receive LTIP shares based on performance conditions: return on capital employed (ROCE) and total cost of employment per tonne (TCOE/t in USD), which are equally weighted (performance stock units PSU). (The measurement changed to TCOE/t in ZAR in.) Senior management, who receive LTIP shares based on service conditions which include ongoing employment moderated by individual performance (restricted stock units RSUs). Since, 50% of the LTIP award for this category was also subject to performance conditions. Salient features of the LTIP award, in accordance with the rules: It is a three-year performance plan Awards are made annually Allocations are calculated on cost to company X applicable % per grade X individual performance Threshold must be achieved to trigger payout for any measurement It is capped at 120% achievement of the specific target The audited financial year s performance is used for measurement purposes. Eligible participants must remain employed to qualify for any settlement if the performance conditions have been met. There is provision for proportional awards when there is a change in the effective control of the company, or when an employee is retrenched, retires or dies while in service. Specific to the grant rule, the share allocation percentage to senior managers and designated executives varies between 50% and 150% of cost to company relating to on-target performance. (International executives participate in the ArcelorMittal group scheme in accordance with the international mobility policy.) Executive retention Executive retention payable in three tranches was approved by RSEC earlier in due to increased turnover in the senior management category. This first tranche was paid to six key individuals in July supported by strong retention terms with the final payment due in These agreements include specific employment conditions. The first payment entailed a once-off cost of R4.2 million. Medium-term incentive scheme aimed at retention of critical talent The medium-term incentive scheme is aimed at retaining critical, scarce skills in various key specialist positions below senior management. Participants need to have been in employment for three years from the date of the first payment and, where necessary, are required to participate in a formal mentorship and coaching programme as part of our succession plan. Although we have awarded medium-term incentives selectively, five tranches were paid in. Voluntary turnover this year was 5.3%, a substantial increase over. Staff turnover per employee category is reflected in the graph on 55. Employee Share Ownership Plan Ikageng Trust In line with our commitment to transformation and our B-BBEE strategy, the board approved a five-year Employee Share Ownership Plan (ESOP) effective from October last year. The size of the ESOP was a 4.7% shareholding (which reduced to an effective 1.89% following our subsequent rights offer) with 21.1 million shares available for allocation. The following participation rules apply: Beneficiaries All permanent employees, middle management and below role levels African, coloured and Indian (ACI) Non-ACIs Criteria Permanent employment share units share units
166 70 Integrated Annual Report Remuneration report continued The salient features of the ESOP include: The 21.1 million shares will be held by the Ikageng Trust for the benefit of participating employees No new entrants will be allowed participation on or after 1 October 2019 On expiry date, participating employees may exercise their right to receive the cash value of the shares (tax remains applicable) or the actual shares (tax applicable) The trust is managed by six trustees (three elected, two independent and one appointed by the company) Computershare was appointed as the administrator of the scheme. The trust deed also allows for fault and no-fault termination rules as managed by the trustees. Death or retirement are deemed to be no-fault terminations in terms of the rules with affected employees and their beneficiaries being entitled to a matured portion only. B-BBEE partnership Creating social value requires us to be a demonstrably transformed leader in the steel industry, one that acknowledges its role to ensure the long-term sustainability of the local steel sector and associated industries, and to create meaningful value for all stakeholders. To continue with our transformation journey, we are committed to: Providing meaningful opportunities for historically disadvantaged persons to enter and benefit from the South African steel industry, by acquiring a B-BBEE partner Furthering the objectives of B-BBEE legislation and the B-BBEE Codes of Good Practice by establishing an additional employee trust vehicle to broaden participation in the business. In November shareholders approved Likamva Resources as our new B-BBEE partner. The structure of the new scheme is as follows: It will be implemented by a 22.1% (post-issue) notionally funded issue of shares as follows: 17% Likamva Resources 5.1% ArcerlorMittal South Africa Employee Empowerment Share Trust. ArcelorMittal Employee Empowerment Share Trust (Isabelo) The ArcelorMittal Employee Empowerment Share Trust was registered earlier this year: The scheme has a 10-year term The scheme is a bewind trust managed by four elected trustees, two independent and one appointed by the company Participation in the scheme is offered to all permanent full-time employees of the company and its South African subsidiaries (including executives) First allocation date was 1 December The first 50% of the total free trust units was an equal distribution to all beneficiaries, equivalent to trust units per beneficiary, with the other 50% allocated according to role grade, favouring lower-level employees also on the first allocation date The trust will be subject to the requirement that a minimum of 60% of the economic benefits relating to shares held by the trust must accrue to black beneficiaries Fault and no-fault termination rules, similar to those of the Ikageng Trust, apply. Contractual arrangements We do not have any fixed-term contracts with executive directors or senior executives and there exists no restraint or special severance compensation payable to such employees. A period of restraint with standard non-compete and non-solicitation conditions is included as a generic clause in employment contracts. The chief executive officer s period of notice for termination of employment was three months on either side while executive directors and senior executives were also required to give two months notice on either side, in line with the standard terms and conditions of employment, unless otherwise specified. In late, however, RSEC approved a change to new-hire contracts: Chief executive officer and chief financial officer s notice periods changed to six months Other executive committee members notice periods changed to three months Senior management s termination period remains unchanged at two months. Non-executive directors Non-executive directors do not receive short-term or long-term incentives. They are appointed based on proposals submitted by the nominations committee to the board and shareholders for approval and their term of office is three years. One-third of all directors retire at the annual general meeting but are eligible for re-election. RSEC is responsible for setting the fees and determining the terms of service for the chairman and non-executive directors. The fees for non-executive directors are reviewed annually, informed by market best practice and the time commitment and responsibilities associated with each role. Non-executive directors receive an annual fee and a fee for attending board meetings while the chairman receives an annual fee that includes remuneration for attendance at all board and board committee meetings. Non-executive directors do not participate in any type of incentive scheme nor do they receive any medical and pension-related benefits. A resolution proposing an increase in non-executive directors fees was approved by shareholders on 25 May. The committee has reviewed non-executive directors fees for 2017 and a proposal will be put to the board in May Remuneration of executive directors and prescribed officers The following is a summary of the remuneration of executive directors, prescribed officers and the highest paid senior employees (who are not directors) for services rendered to ArcelorMittal South Africa Ltd.
167 Corporate governance Integrated Annual Report 71 This is a summary of directors remuneration, prescribed officers and the highest paid senior employees (who are not directors) for services rendered to Ltd. Notes Salary 1 R Retirement funding R Short-term incentives 2 R Equity incentives 3 R Other 4 R Total remuneration R Total remuneration R Executive directors WA de Klerk D Subramanian PS O Flaherty Subtotal Prescribed officers and highest paid employees M Adam HPR Orsoni WA Nel RH Torlage TG Nkosi W Venter AM Ngapo KS Kumar R Bardien Subtotal Total Directors fees R Committee fees R Other 4 R Total remuneration R Total remuneration R Non-executive directors PM Makwana DCG Murray LP Mondi NP Mnxasana JRD Modise NF Nicolau PS O Flaherty LC Cele NP Gosa Total Directors remuneration is not paid to the non-executive directors in the employment of the ArcelorMittal group and have therefore not been disclosed in this note. 1 Salary represents cash salary earned by directors and prescribed officers. 2 The short-term incentives relate to benefits for the December financial year, which were paid in April. 3 Further detail on the equity incentives can be found under directors unexercised share options and LTIPs in the table that follows. 4 Other includes separation payments, leave encashment, business travel claims and allowance, settlement allowance, housing benefits, international mobility allowance, medical benefits, hardship allowance and sign-on incentives. 5 WA de Klerk was appointed CEO and executive director effective 1 July. 6 D Subramanian was appointed acting CEO from 4 February to 30 June whereafter he assumed his role as chief financial officer. 7 PS O Flaherty announced his resignation as chief executive officer effective 4 February. It was proposed that he assumed a role as a non-executive director with effect from 1 March. Subsequent to this appointment he resigned as non-executive director effective 1 August. 8 TG Nkosi resigned as general manager: human resources, transformation and communications effective July. 9 AM Ngapo appointed as chief marketing officer effective 1 July. 10 KS Kumar resigned as chief marketing officer with effect from 30 July. 11 R Bardien was appointed as general manager: human resources and transformation effective 1 November. 12 DCG Murray retired as non-executive director effective 26 May. 13 LC Cele was appointed as non-executive director effective 4 January. 14 NP Gosa, was appointed to represent Likamva Resources as non-executive director with effect from 1 December.
168 72 Integrated Annual Report Remuneration report continued LTIPs and equity-settled share options The following table reflects the status of unvested LTIPs held by executive directors and the highest paid senior employees at 31 December : Number of allocations at the start of the year Number of allocations made during the year Adjustment for units not expected to vest Number of allocations at the end of the year Number of allocations vested at the end of the year Names of executives Award type Award date WA de Klerk LTIP 10/10/ D Subramanian LTIP 10/10/ Issue price (R) Present value of unvested share units at the end of the year (R) WA Nel LTIP 14/11/ /05/ /05/ /10/ RH Torlage LTIP 14/11/ /05/ /05/ /10/ M Adam LTIP 18/05/ /10/ W Venter LTIP 14/11/ /05/ /05/ /10/ LTIP shares vest within three to five years. Restricted stock unit (RSU)/performance stock unit (PSU) plans The following table reflects the number of restricted and performance stock units allocated to executive directors, prescribed officers and the highest paid senior employees who belong to the ArcelorMittal group share-based payment scheme. Name of executive Award type Award date Number of allocations at the start of the year Number of allocations made during the year Number of allocations at the end of the year Number of allocations vested at the end of the year Issue price (USD) Present value of unvested share units at the end of the year (USD) HPR Orsoni RSU 29/03/ /09/ /12/ /12/ PSU 29/03/ /09/ /12/ /12/ /06/ /06/
169 Reports and financial results Integrated Annual Report 73 Independent limited assurance report To the directors of ArcelorMittal South Africa Ltd We have performed our limited assurance engagement in respect of the selected non-financial key performance indicator (KPI) disclosures to be published in the integrated annual report for the year ended 31 December. Subject matter The subject matter comprises the non-financial key performance indicators prepared in accordance with the Global Reporting Initiative G4 Guidelines (GRI G4) supported by management s internal basis of preparation (the criteria) as prepared by the responsible party during the year ended 31 December. The subject matter comprises the following: Lost-time injury frequency rate (LTIFR) Total number of work-related fatalities Total number of permanent employees and RSA-based employee demographic (race) Corporate social investment spend Total number of employees within the development pipeline Environment (scope 1) consumption Environment (scope 2) consumption Total greenhouse gas emissions Externally verified B-BBEE score card Carbon emission intensity per tonne of liquid steel Liquid steel capacity utilisation Directors responsibility The directors being the responsible party, and where appropriate, those charged with governance are responsible for the subject matter information, in accordance with the GRI and ArcelorMittal South Africa s own internal basis of preparation. The responsible party is responsible for: ensuring that the subject matter information is properly prepared and presented in accordance with the criteria against which the underlying subject matter will be assessed; confirming the measurement or evaluation of the underlying subject matter against the applicable criteria, including that all relevant matters are reflected in the subject matter information; and designing, establishing and maintaining internal controls to ensure that the subject matter information is properly prepared and presented in accordance with the criteria against which the underlying subject matter will be assessed. Assurance practitioner s responsibility We conducted our assurance engagement in accordance with the International Standard on Assurance Engagements (ISAE) 3000 (Revised), assurance engagements other than audits or reviews of historical financial information. This standard requires us to comply with ethical requirements and to plan and perform our limited assurance engagement with the aim of obtaining limited assurance regarding the subject matter of the engagement. We shall not be responsible for reporting on any non-financial performance indicator transactions beyond the period covered by our limited assurance engagement. Quality control The firm applies International Standard on Quality Control 1 and accordingly maintains a comprehensive system of quality control including documented policies and procedures regarding compliance with ethical requirements, professional standards and applicable legal and regulatory requirements. Independence and other ethical requirements We have complied with the independence and other ethical requirements of Parts A and B of the Code of Ethics for Professional Accountants issued by the International Ethics Standards Board for Accountants, which is founded on the fundamental principles of integrity, objectivity, professional competence and due care, confidentiality and professional behaviour. Summary of work performed We have performed our procedures on the subject matter, the non-financial performance indicators of the company, as prepared by management in accordance with the GRI G4 as supported by management s basis of preparation for the year ended 31 December. Our evaluation included performing such procedures as we considered necessary which included: Interviewing management and senior executives to obtain an understanding of the internal control environment, risk assessment process and information systems relevant to the sustainability reporting process for the selected subject matter; Testing the systems and processes to generate, collate, aggregate, validate and monitor the source data used to prepare the selected subject matter for disclosure in the report; Inspected supporting documentation and performed analytical review procedures; and Evaluated whether the selected KPI disclosures are consistent with our overall knowledge and experience of sustainability processes at. Our assurance engagement does not constitute an audit or review of any of the underlying information in accordance with International Standards on Auditing or International Standards on Review Engagements and accordingly, we do not express an audit opinion or review conclusion. We believe that the evidence obtained is sufficient and appropriate to provide a basis for our limited assurance conclusion. In a limited assurance engagement, the procedures performed vary in nature and timing from, and are less in extent than for, a reasonable assurance engagement. Consequently, the level of assurance obtained in a limited assurance engagement is substantially lower than the assurance that would have been obtained had we performed a reasonable assurance engagement. Accordingly, we do not express a reasonable assurance opinion about whether the non-financial performance indicators have been presented, in all material respects, in accordance with GRI G4 Guidelines, supported by management s internal basis of preparation. Conclusion Based on our work described in this report, nothing has come to our attention that causes us to believe that the selected non-financial key performance indicators as set out in the subject matter paragraph (of our report) for the year ended 31 December, is not prepared, in all material respects, in accordance with the GRI G4 supported by management s internally developed basis of preparation. Other matters Our report does not extend to any disclosures or assertions relating to future performance plans and/or strategies disclosed in the report. The maintenance and integrity of the entity s website is the responsibility of management. Our procedures did not involve consideration of these matters and, accordingly we accept no responsibility for any changes to either the information in the website, the report or our independent assurance report that may have occurred since the initial date of presentation. Restriction on use and distribution Our report is made solely to the directors of ArcelorMittal South Africa in accordance with our engagement letter dated 22 November for the purpose of proving limited assurance over the subject matter disclosed in the integrated report for year ended 31 December. We do not accept or assume liability to any party other than the entity, for our work, for this report, or for the conclusion we have reached. Deloitte & Touche Registered Auditors 1st Floor, The Square, Cape Quarter 27 Somerset Road, Green Point, 8005 Per AN le Riche Partner 6 March 2017 National executive: *LL Bam chief executive officer, *TMM Jordan deputy chief operating officer, *MJ Jarvis chief operating officer, *GM Pinnock audit, *N Sing risk advisory, *NB Kader tax, TP Pillay consulting, S Gwala BPaaS, *K Black clients & industries, *JK Mazzocco talent & transformation, *MJ Comber reputation & risk, *TJ Brown chairman of the board Regional leader: MN Alberts A full list of partners and directors is available on request *Partner and registered auditor B-BBEE rating: Level 2 contributor in terms of the Chartered Accountancy Profession Sector Code Associate of Deloitte Africa, a member of Deloitte Touche Tohmatsu Limited
170 74 Integrated Annual Report Audit and risk committee report The audit and risk committee (the committee) has pleasure in submitting its report to the shareholders as required in terms of section 94(7) of the Companies Act No 71 of Membership of the committee The committee comprised the following members at the date of this report: JRD Modise (chairman) LC Cele NP Mnxasana Each member is an independent director and has the adequate relevant knowledge, the financial expertise and experience to equip the committee to properly execute its duties and responsibilities. The experience and qualifications of the members are set out in the integrated annual report. DCG Murray retired effective 25 May and JRD Modise was elected chairperson at the annual general meeting (AGM) by the company s shareholders. Functions of the committee During the year under review, six meetings were held. Details of attendance are set out in the corporate governance section of the integrated annual report. The committee reports that it has adopted appropriate formal terms of reference as its mandate, and has regulated its affairs in compliance with this mandate, and has discharged all of the responsibilities set out therein. During the financial year under review, the committee reviewed the following matters: The quarterly and half-yearly financial reports, the integrated annual report, the annual financial statements and accounting policies for the company and all subsidiaries The effectiveness of the combined assurance model The reports of the internal audit function on the state of internal control including its forensic reports regarding fraud prevention and detection The effectiveness of the internal audit function The auditor s findings and recommendations Statements on ethical standards for the company and considered how they are promoted and enforced Significant cases of unethical activity by employees or by the company itself Reports on the risk management process in the company and assessed the company s exposure to the following risks: Top strategic risks (including credit and market risks, human resources risks and compliance risks) Operational risks Information technology risks Independence of auditor The committee reviewed a presentation by the external auditor and, after conducting its own review, is satisfied with the independence and objectivity of Deloitte & Touche as external auditors and M Mantyi, as the designated auditor. The committee further approved the fees to be paid to Deloitte & Touche and its terms of engagement and pre-approved each proposed contract with Deloitte & Touche for the provision of non-audit services to the company. Statutory reporting The committee has evaluated the annual financial statements of Ltd and the group for the year ended 31 December and, based on the information provided to the committee, considers that the company and group comply, in all material respects, with the requirements of the Companies Act of South Africa, the International Financial Reporting Standards (IFRS), the SAICA Financial Reporting Guides as issued by the Accounting Practices Committee, and applicable legislation and financial pronouncements as issued by the Financial Reporting Standards Council. Internal financial controls The committee agendas provide for confidential meetings between committee members and both the internal and independent external auditors. The committee has oversight of the group s financial statements and reporting process, including the system of internal financial control. It is responsible for ensuring the group s internal audit function is independent and has the necessary resources, standing and authority in the organisation to discharge its duties. The committee oversees co-operation between internal and external auditors, and serves as a link between the board of directors and these functions. The head of internal audit reports administratively to the chief executive officer and functionally to the chairman of the committee and head of group internal audit of the holding company ArcelorMittal Holdings AG. The committee is of the opinion, after having considered the assurance provided by the internal audit function, that the group s system of internal financial controls in all key material aspects is effective and provides reasonable assurance that the financial records may be relied upon for the preparation of the annual financial statements. This is based on the information and explanations given by management and the group internal audit function. Expertise and experience of the chief financial officer and the finance function The committee has satisfied itself that the chief financial officer, D Subramanian, has the appropriate expertise and experience to carry out his duties. The committee has assessed the competency, skills and resourcing of the group s finance function, and is satisfied as to the overall adequacy and appropriateness of the finance function. Expertise and experience of the company secretary The committee has satisfied itself that the company secretary has the appropriate competence and experience and has maintained an arm s-length relationship with directors. Recommendation of the annual financial statements and integrated annual report The committee, having fulfilled the oversight role regarding the reporting process for both the annual financial statements and the integrated annual report and having regard to material factors that may impact the integrity of these reports, recommends the integrated annual report and the annual financial statements for approval by the board of directors. JRD Modise Chairman 27 February 2017
171 Reports and financial results Integrated Annual Report 75 Independent auditor s report on summarised financial statements To the shareholders of ArcelorMittal South Africa Ltd Opinion The summarised consolidated financial statements of ArcelorMittal South Africa Ltd, which comprise the summarised consolidated statement of financial position as at 31 December, the summarised consolidated statements of comprehensive income, changes in equity and cash flows for the year then ended, and related notes, are derived from the audited consolidated financial statements of Limited for the year ended 31 December. In our opinion, the accompanying summarised consolidated financial statements are consistent, in all material respects, with the audited consolidated financial statements of Ltd, in accordance with the framework concepts and the measurement and recognition requirements of International Financial Reporting Standards and SAICA Financial Reporting Guides as issued by the Accounting Practices Committee and Financial Pronouncements as issued by the Financial Reporting Standards Council; also contains as a minimum the information required by IAS 34 Interim Financial Reporting and the requirements of the Companies Act of South Africa as applicable to summarised financial statements. Summarised consolidated financial statements The summarised consolidated financial statements do not contain all the disclosures required by the International Financial Reporting Standards and the requirements of the Companies Act of South Africa as applicable to financial statements. Reading the summarised consolidated financial statements and the auditor s report thereon, therefore, is not a substitute for reading the audited consolidated financial statements of Ltd and the auditor s report thereon. The audited consolidated financial statements and our report thereon We expressed an unmodified audit opinion on the audited consolidated financial statements in our report dated 6 March That report also includes: A material uncertainty related to going concern section in our audit report, dated 6 March 2017 draws attention to note 36 within the audited consolidated financial statements of ArcelorMittal South Africa Ltd. Aligning herewith, and without qualifying our opinion, we draw attention to note 10 in these summarised consolidated financial statements, states that the group has continuing support from ArcelorMittal Holdings AG in the form of a signed letter of support. In addition, note 10 sets out specific management initiatives and some pending government initiatives, which should they not materialise, indicate the existence of a material uncertainty which may cast significant doubt on the company s and group s ability to continue as a going concern The communication of other key audit matters. Directors responsibility for the summarised consolidated financial statements The directors are responsible for the preparation of the summarised consolidated financial statements in accordance with the requirements of the framework concepts and the measurement and recognition requirements of International Financial Reporting Standards and SAICA Financial Reporting Guides as issued by Accounting Practices Committee and Financial Pronouncements as issued by the Financial Reporting Standards Council; also contains as a minimum the information required by IAS 34 Interim Financial Reporting, and the requirements of the Companies Act of South Africa as applicable to summarised financial statements, and for such internal control as the directors determine is necessary to enable the preparation of the summarised consolidated financial statements that are free from material misstatement, whether due to fraud or error. Auditor s responsibility Our responsibility is to express an opinion on whether the summarised consolidated financial statements are consistent, in all material respects, with the consolidated audited financial statements based on our procedures, which were conducted in accordance with International Standard on Auditing 810 (Revised): Engagements to Report on Summary Financial Statements. Deloitte & Touche Registered Auditors Per: Mandisi Mantyi Partner 6 March 2017 Deloitte & Touche Registered Auditors Buildings 1 and 2, Deloitte Place The Woodlands, Woodlands Drive Woodmead, Sandton
172 76 Integrated Annual Report Summarised consolidated financial statements for the year ended 31 December Basis of preparation The summarised consolidated financial statements for the year ended 31 December were prepared in accordance with the requirements of the Companies Act of South Africa as applicable to summarised financial statements. These summarised consolidated financial statements have been prepared in accordance with the framework concepts and the measurement and recognition requirements of International Financial Reporting Standards (IFRS) and the SAICA Financial Reporting Guides as issued by the Accounting Practices Committee and Financial Pronouncements as issued by the Financial Reporting Standards Council. It also contains, as a minimum, the information required by IAS 34: Interim Financial Reporting. The accounting policies applied in the preparation of the summarised consolidated financial statements are in terms of IFRS and are consistent with those applied in the previous consolidated annual financial statements. The summarised consolidated financial statements are presented in rand, which is the group s functional and presentation currency. The preparation of financial statements, in conformity with IFRS, requires the use of certain critical accounting estimates. It also requires management to exercise its judgement in the process of applying the accounting policies. The areas involving a higher degree of judgement or complexity, or areas where assumptions and estimates are significant to the financial statements are: The assumptions used in impairment tests of carrying values of cash-generating units and intangible assets Estimates of useful lives and residual values for intangible assets and property, plant and equipment Estimates for share-based payments in terms of IFRS 2 These summarised consolidated financial statements do not include all the information required for full annual financial statements and should be read in conjunction with the consolidated annual financial statements for the year ended 31 December, which have been prepared in accordance with IFRS and the Companies Act of South Africa. Deloitte & Touche has issued an unmodified opinion on the group annual financial statements, which included the material uncertainty relating to the going concern paragraph also found in an ISA 810 opinion issued on this report. A full set of the audited consolidated annual financial statements is available for inspection from the company secretary at the registered office of the company, and has been published on the company s website. The summarised consolidated financial statements were prepared under the supervision of Mr D Subramanian, the group s chief financial officer, CA(SA).
173 for the year ended 31 December Reports and financial results Integrated Annual Report 77 Summarised consolidated statement of comprehensive income and other comprehensive income Revenue Raw materials and consumables used (19 454) (19 183) Employee costs (4 175) (4 027) Energy (3 981) (3 824) Movement in inventories of finished goods and work-in-progress 973 (457) Depreciation (1 030) (1 346) Amortisation of intangible assets (25) (23) Other operating expenses (6 137) (7 017) Loss from operations 2 (1 092) (4 736) B-BBEE charges (870) Finance and investment income Finance costs (876) (1 208) Impairment of other assets (11) (310) Impairment of property, plant, equipment and intangible assets 3 (2 143) (3 944) Income after tax from equity-accounted investments Loss before taxation (4 687) (9 828) Income taxation (expense)/credit (19) Loss for the year (4 706) (8 635) Other comprehensive (loss)/income (554) Items that may be reclassified subsequently to profit or loss Exchange differences on translation of foreign operations (618) Income on available-for-sale investment taken to equity 1 19 Share of other comprehensive income of equity-accounted investments Total comprehensive loss for the year (5 260) (7 305) Loss attributable to: Owners of the company (4 706) (8 635) Total comprehensive loss attributable to: Owners of the company (5 260) (7 305) Attributable loss per share (cents) Basic 4 (443) (2 152) Diluted 4 (443) (2 152) Notes Group
174 78 Integrated Annual Report Summarised consolidated statement of financial position as at 31 December Assets Non-current assets Property, plant and equipment Intangible assets Equity-accounted investments Other financial assets Current assets Inventories Trade and other receivables Taxation Other financial assets Cash and bank balances Total assets Equity and liabilities Equity Stated capital Reserves Retained income Non-current liabilities Finance lease obligations Provisions Other financial liabilities Other payables Current liabilities Trade payables Other financial liabilities Borrowings Finance lease obligations Provisions Other payables Total equity and liabilities Group
175 Reports and financial results Integrated Annual Report 79 Summarised consolidated statement of cash flows for the year ended 31 December Cash generated/(utilised in) from operations 873 (264) Interest income 67 9 Finance cost (525) (554) Income tax paid (2) (40) Transaction costs on B-BBEE share transaction (55) Realised foreign exchange movements (268) (258) Cash flows from operating activities 90 (1 107) Investment to maintain operations (1 673) (1 164) Investment to expand operations (335) (92) Investment in associates and joint ventures (11) (8) Proceeds on disposal or scrapping of assets 67 2 Dividend from equity-accounted investments/subsidiaries 114 Interest income from investments 7 8 Cash flows from investing activities (1 945) (1 140) Borrowings (repaid)/raised (3 079) Proceeds from rights issue/issue of share capital Finance lease obligation repaid (62) (92) Cash flows from financing activities (Decrease)/increase in cash and cash equivalents (496) Effect of foreign exchange rate changes on cash and cash equivalents (8) 20 Cash and cash equivalents at the beginning of the year Cash and cash equivalents at the end of the year Group
176 80 Integrated Annual Report Summarised consolidated statement of changes in equity for the year ended 31 December Note Stated capital Retained income Treasury share equity reserve Management Share Trust reserve Group Reserves Sharebased payment reserve Attributable reserves of equityaccounted investments Other reserves Balance at 1 January (3 918) (285) Total comprehensive (loss)/income for the year (8 635) (7 305) Profit/(loss) (8 635) Other comprehensive income Transfer between reserves (84) 84 Transactions with owners Share-based payment expense Balance at 31 December (3 918) (285) Total comprehensive (loss)/income for year (4 706) 63 (617) (5 260) Profit/(loss) (4 706) Other comprehensive income 63 (617) Transfer between reserves (129) 129 Transactions with owners Rights issue A1 ordinary shares issued to Amandla* A2 ordinary shares issued to Isabelo* Share-based payment expense B-BBEE charge Cash settlement on Management Share Trust/long-term incentive plan (32) (32) Balance at 31 December (3 918) (317) * Amount less than R1 million. Total equity
177 Reports and financial results Integrated Annual Report 81 Notes to the summarised consolidated financial statements for the year ended 31 December 1. Segment report Segment information is presented only at group level where it is most meaningful. Operating segments are identified on the basis of internal reports about components of the group that are regularly reviewed by the chief operating decision-makers (the executive committee) in order to allocate resources to the segment and to assess its performance. The group s reportable segments are: Flat steel products consisting of Vanderbijlpark Works and Saldanha Works Long steel products consisting of Newcastle Works, Vereeniging Works and the decommissioned Maputo Works Coke and Chemicals undertaking the processing and marketing of by-products and the production and marketing of commercial-grade coking coal Corporate and other, consisting of sales and marketing functions, procurement and logistics activities, shared services, centres of excellence, the decommissioned Pretoria Works site, available-for-sale investments and the results of the non-trading consolidated subsidiaries and consolidated structured entities Segment profit/(loss) from operations represents the profit/(loss) earned/(incurred) by each segment without the allocation of after-tax profits of equity-accounted investments, net interest income, income from investments and income tax expenses. All assets and liabilities are allocated to the operating segments, other than for the following items that are allocated exclusively to the corporate and other segment, reflecting the manner in which resource allocation is measured: Assets not allocated to operating segments: results of consolidated subsidiaries and consolidated structured entities, other than for Saldanha Works which is a subsidiary allocated to the Flat steel products segment investments in equity-accounted entities available-for-sale investments cash and cash equivalents income tax, capital gains tax and value added tax-related assets, as applicable Liabilities not allocated to operating segments: income tax capital gains tax value added tax-related liabilities, as applicable
178 82 Integrated Annual Report Notes to the summarised consolidated financial statements continued for the year ended 31 December 1. Segment report continued Flat steel products Long steel products Coke and Chemicals Corporate and other Total reconciling Adjustments to the and consolidated eliminations amounts 1 For the year ended 31 December Revenue External customers Intersegment customers (887) Total revenue (887) Revenue to external customers distributed as: Local Export Africa Asia Other Total Results Earnings before interest, tax, depreciation and amortisation (392) (16) 190 Depreciation and amortisation (656) (390) (35) (22) 48 (1 055) Thabazimbi mine closure costs (194) (81) (275) Competition Commission settlement Derecognised payment in advance (19) (19) Unclaimed dividends (Loss)/profit from operations (1 242) (185) (1 092) B-BBEE charges (870) (870) Impairment (2 141) (2) (11) (2 154) Finance and investment income Finance costs (117) (146) (7) (605) (876) Profit after tax from equity-accounted investments (Loss)/profit before taxation (3 483) (293) 130 (1 073) 32 (4 687) Income taxation expense (19) (19) (Loss)/profit for the year (3 483) (293) 130 (1 092) 32 (4 706) Segment assets (excluding investments in equity-accounted entities) (528) Investments in equity-accounted entities Segment liabilities Cash (utilised in)/generated from operations (395) (371) Capital expenditure (69) Number of employees at the end of the year Adjustments and eliminations comprise intergroup eliminations and fair value adjustments on consolidation of subsidiaries.
179 Reports and financial results Integrated Annual Report Segment report continued Flat steel products Long steel products Coke and Chemicals Corporate and other Adjustments and eliminations 1 Total reconciling to the consolidated amounts For the year ended 31 December Revenue External customers Intersegment customers (1 437) Total revenue (1 437) Revenue to external customers distributed as: Local Export Africa Asia Other Total Results Earnings before interest, tax, depreciation and amortisation (1 269) (348) 427 (1 131) (809) Depreciation and amortisation (973) (391) (35) (20) 50 (1 369) Thabazimbi mine closure costs (429) (253) (682) Provision for Tshikondeni mine closure costs Vereeniging closure costs (86) (86) Competition Commission settlement (1 245) (1 245) Payment in advance (420) (148) (568) (Loss)/profit from operations (3 091) (1 226) 392 (2 373) (4 736) Finance and investment income (3 574) (370) (2 570) (4 254) Finance costs Gain recognised on loss of interest over former associate (117) (38) (2) (1 051) (1 208) Profit after tax from equity-accounted investments (Loss)/profit before taxation (6 780) (1 633) 390 (5 627) (9 828) Income taxation credit (Loss)/profit for the year (6 780) (1 633) 390 (4 434) (8 635) Segment assets (excluding investments in equity-accounted entities) (1 000) Investments in equity-accounted entities Segment liabilities (2) Cash generated from operations (1 270) (264) Capital expenditure (27) Number of employees at the end of the year Adjustments and eliminations comprise intergroup eliminations and fair value adjustments on consolidation of subsidiaries.
180 84 Integrated Annual Report Notes to the summarised consolidated financial statements continued for the year ended 31 December 2. Loss from operations Loss from operations has been arrived at after charging: Amortisation of intangible assets (25) (23) Depreciation (1 030) (1 346) Employee costs (4 175) (4 027) Salaries and wages (3 620) (3 284) Termination benefits (14) (232) Pension and medical costs (478) (456) Share-based payment expense (63) (55) Profit/(loss) on disposal or scrapping of property, plant and equipment 51 (5) Operating lease rentals (50) (50) Railage and transport (1 069) (994) Repairs and maintenance (2 530) (2 358) Research and development costs (143) (152) Reversal/(write-down) of inventory to net realisable value 59 (187) Auditors remuneration (16) (15) Audit fees (15) (12) Other services and expenses (1) (3) Allowance for doubtful debts recognised on trade receivables (2) 10 Other allowances on trade receivables (39) (48) Note: Included in raw materials and consumables used is R176 million relating to the estimated impact of discounting. 3. Impairment Changes in the rand/us dollar exchange rate will always have a material impact on the company s financial results; this year an impairment of R1 721 million was raised on property, plant and equipment and intangible assets at Vanderbijlpark Works and R420 million at Saldanha Works as a result of rand strength. An additional impairment of R2 million at Vereeniging due to the closure of the Vaal Meltshop in. Despite this, an industrial footprint review concluded during the year indicated that a substantial restructuring was not feasible and that Vanderbijlpark Works would achieve sizeable production and cost gains in the event of running full as a result of an upturn in market demand and reduction in imports. Group
181 Reports and financial results Integrated Annual Report Loss per share Group Basic loss per share is calculated by dividing loss attributable to the owners of the company by the weighted average number of ordinary shares, after taking the effects of the rights issue and the B-BBEE transaction into account. Where appropriate adjustments are made in calculating diluted loss, headline and diluted headline loss per share Loss attributable to owners of the company () (4 706) (8 635) Weighted average number of shares Basic loss per share (cents) (443) (2 152) Diluted loss per share is calculated by dividing the loss attributable to the owners of the company by the weighted average number of ordinary shares, held by third parties increased by the number of additional ordinary shares that would have been outstanding assuming the conversion of all outstanding share options/long-term incentive plan units representing dilutive potential ordinary shares. The B-BBEE transaction does not have a dilutive impact on the ArcelorMittal South Africa group shareholding. Loss attributable to owners of the company () (4 706) (8 635) Weighted average number of diluted shares Diluted loss per share (cents) (443) (2 152) The calculation for headline loss per share is based on the basic loss per share calculation, reconciled as follows: Gross Net of tax Gross Net of tax Headline loss per share Gross Loss before tax (4 687) (4 706) (9 828) (8 635) Add: Impairment charges of property, plant and equipment and intangible assets Add: Impairment of other assets Add: Loss on disposal or scrapping of property, plant and equipment 5 4 Less: (Profit) on disposal or scrapping of property, plant and equipment (51) (37) Headline loss before tax (2 584) (2 589) (5 569) (5 370) Headline loss per share (cents) Basic (244) (1 338) Diluted (244) (1 338) The weighted average number of shares used in the computation of diluted earnings per share was determined as follows: Shares in issue held by third parties Weighted average number of shares Weighted average number of diluted shares Group
182 86 Integrated Annual Report Notes to the summarised consolidated financial statements continued for the year ended 31 December 5. Rights issue A successful rights offer for R4 500 million was concluded and implemented on 18 January. The company issued new ordinary shares. These shares were issued at a value of R6.50 per share. 6. Fair value measurements Certain of the group s financial assets and financial liabilities are measured at fair value at the end of each reporting period. The following table gives information about how the fair values of these financial assets and financial liabilities are determined, particularly the valuation techniques and inputs used. Fair values as at period ended Financial assets 31 December Reviewed 31 December Audited Fair value hierarchy Valuation techniques and key inputs Available-for-sale Level 1 Quoted prices in an active market Held-for-trading assets Level 1 Quoted prices in an active market Held-for-trading liabilities Level 1 Quoted prices in an active market Level 1: Fair value measurements are those derived from unadjusted quoted prices in active markets for identical assets or liabilities. 7. Related-party transactions The group is controlled by ArcelorMittal Holdings AG, which effectively owns 69% (December : 52%) of the group s shares. At 31 December, the outstanding ArcelorMittal Holdings AG loan amounted to R1 200 million (: R3 200 million). Interest is payable at three-month Jibar plus 2.125% and an amount of R98 million (: R261 million) was incurred for the year ended 31 December. During the year, the company and its subsidiaries entered into sale and purchase transactions with joint ventures in the ordinary course of business. These transactions were concluded at arm s length.
183 Reports and financial results Integrated Annual Report B-BBEE transaction At the special general meeting (SGM) of the shareholders of Ltd held on 18 November, the shareholders approved the increase in the authorised share capital of through the creation of new class ordinary shares (ArcelorMittal South Africa empowerment shares) for the purposes of the B-BBEE ownership scheme. The scheme is part of s initiatives to transform the group and achieve sustainable ownership by black people. In terms of the scheme issued empowerment shares to Amandla we Nsimbi Proprietary Limited and Isabelo Empowerment Share Trust (representing 17.0% and 5.1%, respectively, of the voting rights in ) through a notional loan. The Isabelo Empowerment Share Trust has been established to facilitate B-BBEE ownership in compliance with the B-BBEE codes and to create meaningful wealth for qualifying employees in order to ensure their long-term dedication and the retention of skills, while enhancing the transformation of. The trust has been set up for permanently employed management and non-management employees of all job grades of. The B-BBEE employee share ownership scheme is equity-settled. The empowerment shares will receive notional dividends during the lock-in period. From the first business day following the seventh anniversary of the issue date until the expiry of the lock-in period, Amandla we Nsimbi and the Isabelo Empowerment Share Trust are entitled to receive cash dividends on the ArcelorMittal South Africa empowerment shares amounting to 5% of the ordinary dividend paid on shares. This is applicable to the extent that a dividend is declared and shall not create any obligation on to declare a dividend. The A class shares granted to Amandla we Nsimbi and the Isabelo Empowerment Trust will convert into ordinary shares upon expiry of the lock-in period. There is a 10-year vesting period for the share-based payment benefit provided to the Isabelo Employee Empowerment Share Trust and no vesting period for the share-based payment benefit provided to Amandla we Nsimbi Proprietary Limited. There are no performance targets for vesting for both ownership schemes. The administration of participant transactions of both the Amandla we Nsimbi Proprietary Limited and Isabelo Employee Empowerment Share Trust are outsourced to EOH Human Capital Solutions Proprietary Limited, an external service provider. Key assumptions Amandla we Nsimbi (Proprietary) Limited Isabelo Empowerment Share Trust Fair value of in-substance option on grant date (R) Expected attrition rate (%) n/a Average days until fully vested n/a Lock-in period (years) day VWAP* Interest rate on notional loan JIBAR plus 6% JIBAR plus 6% Dividend yield 0% 0% Expected risk-free rate over the 10-year period** 7.31% 8.66% 7.31% 8.66% Expected volatility on ArcelorMittal share price*** 40% 40% Number of Monte Carlo simulations Equity upside (value in excess of future share price on transaction date) * Daily value traded data was sourced from I-NETBFA. ** Expected risk-free rates are equivalent to six-month JIBAR forward rates. *** Expected volatility on the share price is based on a 10-year exponentially weighted moving average of the share price.
184 88 Integrated Annual Report Notes to the summarised consolidated financial statements continued for the year ended 31 December 8. B-BBEE transaction continued Determination of fair value at grant date The subscription price of the deal is equivalent to the 30-day volume weighted average price (VWAP) of the share price as at 26 September less a 10% discount. The economic substance of the transaction represents a deemed option granted to Amandla we Nsimbi Proprietary Limited and the Isabelo Empowerment Trust. The underlying value of this option is driven by the 10% discount granted on the 30-day VWAP and volatility in the share price. The economic valuation of the B-BBEE transaction was calculated using Monte Carlo simulations based on the Geometric Brownian Model (GBM). A large number of simulations in the model predict a reasonable price for the ordinary share at the end of the scheme. The results of the simulations are then averaged and discounted to a present value to determine the value of the option at grant date. The fair value of the option on grant date was determined to be the present value of the option pay-off and the future value of trickle dividends. Notwithstanding the nominal subscription price for the empowerment shares, the aggregate notional subscription price for the empowerment shares is approximately R2.3 billion. Additionally, sensitivity analyses taken into account in the option pricing model were performed considering the forecast dividends in respect of an share; the forecast outstanding balance in respect of the A1 notional amount and A2 notional amount after lock-in period; and the expected volatility of an share of 40% based on the implied volatility utilising call options on ArcelorMittal Société Anonyme, the holding company headquartered in Luxembourg. The call options trade on Euronext Amsterdam, formerly Amsterdam Stock Exchange. Expense recognised in profit or loss Amandla we Nsimbi Proprietary Limited Amandla we Nsimbi Proprietary Limited whose shares are owned by a broad-based black consortium, Likamva Resources, subscribed for A1 ordinary shares in, representing 17% of the voting rights in. A1 ordinary shares were issued at a nominal value through a notional loan structure. This grant had no other vesting conditions at grant date and a charge amounting to R800 million (: Rnil) was recognised immediately in the statement of comprehensive income in terms of IFRS 2: Share-Based Payments. Isabelo Empowerment Share Trust The Isabelo Broad-Based Employee Share Trust subscribed for A2 ordinary shares in, representing 5.1% of the voting rights. A2 ordinary shares were also issued at a nominal value through a notional loan structure. The vesting conditions attached to this scheme require the beneficiaries of the scheme to remain in the employ of for a period of 10 years. An expected attrition rate was then applied to determine the best estimate of shares expected to vest at the end of the vesting period. An income statement charge of R1 million (: Rnil) was recognised in profit and loss with the remainder of the charge to be recognised evenly over the vesting period. Transaction costs amounting to R70 million were incurred and were recognised in the statement of comprehensive income in the current year.
185 Reports and financial results Integrated Annual Report Commitments Capital expenditure commitments on property, plant and equipment Group Capital expenditure authorised and contracted for Capital expenditure authorised but not contracted for Total In accordance with the Competition Commission settlement agreement concluded in the current year, is committed to spend additional capital expenditure of R4 600 million over five years subject to affordability and feasibility. In total, R947 million has been invested in various projects in the current year. 10. Going concern Due to the strengthening of the rand/us dollar exchange rate, weak local market demand and influx of cheap imports into the country, Limited expects sales volumes to remain flat for the next 12 months, which will be mitigated by import substitution and new products, namely heavy structural products from Evraz Highveld. Export markets are likely to be more resilient, namely Africa Overland; however, authoritative projections being that Africa will experience demand growth in the order of 4%. While the group continues to benefit from the full support of ArcelorMittal Holdings AG, Ltd has invested in various initiatives to return the company to profitability. These initiatives include improvement in capital expenditure projects, restructuring the balance sheet by converting short-term borrowing facilities to medium-term debt and new products and markets. Based on the group s 12-month funding plan, a letter of support from ArcelorMittal Holdings AG and the initiatives detailed above, the board believes that the group will have sufficient funds to pay its debts as they become due over the next 12 months, and therefore will remain a going concern. The group would like to re-emphasise that the local steel industry continues to be threatened by imports entering the market, primarily from China, hence safeguard measures are important despite the positive progress on designation initiatives to date. Shareholders are cautioned that certain management initiatives as well as other government initiatives, including the fair pricing mechanism, safeguards, and designation are key to ensure the sustainability of the group, and should these initiatives not materialise in improved sales growth in the next 12 months, there remains a material uncertainty regarding the ability of Ltd and the local steel industry to continue operating without significant structural changes. 11. Subsequent events Designation Designation relating to steel products and components for construction was approved in January Fair pricing The fair pricing model for flat steel products has been finalised and was implemented by the company but remains subject to final government approval. In terms thereof, the company may not charge more than an agreed basket price for various flat steel products. The directors are not aware of any other matter or circumstances arising since the end of the financial year to the date of this report, not otherwise dealt with in this report or in the group and company annual financial statements that would significantly affect the operations, the results and the financial position of the group and company.
186 90 Integrated Annual Report Analysis of ordinary shareholders as at 31 December Shareholder spread Number of shareholdings % of total shareholdings Number of shares % of issued capital shares shares shares shares shares and more shares Total Distribution of shareholders Number of shareholdings % of total shareholdings Number of shares % of issued capital Corporate holdings Retirement benefit funds Collective investment schemes and hedge funds Retail shareholders, trusts and private companies Employee share schemes Other managed funds Custodians, brokers and nominees Unclassified holders (less than shares) Assurance and insurance companies Total Geographical holding by owner Number of shareholdings % of total shareholdings Number of shares % of shares in issue Switzerland South Africa United Kingdom United States Belgium Namibia Luxembourg Balance Total
187 Shareholders information, AGM and proxy Integrated Annual Report 91 Beneficial shareholders with a holding greater than 5% of the issued shares Number of shares % of issued capital ArcelorMittal Holdings AG Amandla we Nsimbi Proprietary Limited Industrial Development Corporation Isabelo Employee Share Trust Government Employees Pension Fund Investec Asset Management Vicva Investments and Trading Nine Proprietary Limited Total Public and non-public shareholders Number of shareholdings % of total shareholdings Number of shares % of issued capital ArcelorMittal Holdings AG Directors and associates of the company or its subsidiaries Non-public shareholders Public shareholders Total Total number of shareholdings Total number of shares in issue Share price performance Opening price 31 December R4.60 Closing price 30 December R11.50 Closing high for period R12.50 Closing low for period R4.10 Number of shares in issue Volume traded during period Ratio of volume traded to shares issued (%) Rand value traded during the period R Directors interests The details of the beneficial direct and indirect interests of executive directors in the shares of the company are set out in note 32 of these annual financial statements. Details of the direct and indirect interests of non-executive directors in the shares of the company are set out below: Director Direct Indirect Total Direct Indirect Total DCG Murray* JRD Modise NP Gosa** Total * DCG Murray has retired as a director. ** Interest via Likamva Resources.
188 92 Integrated Annual Report Notice of annual general meeting Important information regarding attendance at the annual general meeting. Notice of annual general meeting Notice is hereby given that the twenty-ninth annual general meeting of the company will be held at Hyatt Regency Johannesburg Hotel, Nina 2 Room, 191 Oxford Road, Rosebank, South Africa on Wednesday, 24 May 2017 at 09:00 to consider and, if deemed fit, pass, with or without modification, the ordinary and special resolutions set out below and to deal with such other business as may be lawfully dealt with at the meeting. Electronic participation Shareholders or their proxies may participate in the meeting by way of a conference call and, if they wish to do so: must contact the company secretary (by at the address: nomonde.bam@arcelormittal.co.za) by no later than 09:00 on Monday, 22 May 2017 in order to obtain a PIN and dial-in details for that conference call; will be required to provide reasonably satisfactory identification; and will be billed separately by their own telephone service providers for their telephone call to participate in the meeting. Attendance and voting The date on which an individual must be registered as a shareholder in the company s register for purposes of being entitled to attend, participate in and vote at the meeting is Friday, 19 May 2017 (meeting record date). Therefore the last day to trade to be registered as a shareholder in the company s register is Tuesday, 16 May If you are a registered shareholder as at the meeting record date, you may attend the meeting in person. Alternatively you may appoint a proxy (who need not be a shareholder of the company) to represent you at the meeting. Any appointment of a proxy may be effected by using the attached proxy form and, in order for the proxy to be effective and valid, must be completed and delivered in accordance with the instructions contained therein. If you are a beneficial shareholder and not a registered shareholder as at the record date: and wish to attend the meeting, you must obtain the necessary letter of authority to represent the registered holder of your shares from your Central Securities Depository Participant (CSDP) or broker; and do not wish to attend the meeting but would like your vote to be recorded at the meeting, you should contact the registered holder of your shares through your CSDP or broker and furnish them with your voting instructions; and you must not complete the attached proxy form. Attendance and representation at the annual general meeting In accordance with the mandate between you and your CSDP/broker, you must advise your CSDP/broker of your intention to attend the annual general meeting in person, or, if you wish to send a proxy to represent you at the annual general meeting, your CSDP/broker will issue the necessary letter of representation to you or your proxy to attend the annual general meeting. Identification All participants at the meeting will be required to provide identification reasonably satisfactory to the chairman of the meeting before any person may attend or participate in the annual general meeting. Forms of identification include the presentation of a valid identity document, driver s licence or passport. Notice of percentage of voting rights In order for an ordinary resolution and a special resolution to be approved by shareholders, it must be supported by more than 50% and 75%, respectively, of the voting rights exercised on the resolution by shareholders present or represented by proxy at the meeting. Purpose of the annual general meeting The purpose of this annual general meeting is to: present the directors report and the audited annual financial statements of the group for the year ended 31 December ; present the audit and risk committee report; present the remuneration, social, ethics and audit and risk committee report; and consider any matters raised by shareholders. This notice of meeting includes the attached proxy form. Directions for obtaining a copy of the complete annual financial statements The complete annual financial statements for the year ended 31 December may be obtained from the website or a request may be sent to the company secretary (by at the address: nomonde.bam@arcelormittal.co.za). 1. Presentation to shareholders of: 1.1 The consolidated annual financial statements of the company and its subsidiaries. 1.2 The directors report. 1.3 The independent auditors report. 1.4 The audit and risk committee chairman s report. 1.5 The remuneration, social and ethics committee chairman s report.
189 Shareholders information, AGM and proxy Integrated Annual Report Ordinary resolution number 1: Reappointment of auditors Resolved, as an ordinary resolution, that Deloitte & Touche be and is hereby appointed as the independent registered auditor of the company, and that Mr Mandisi Mantyi be noted as the individual determined by Deloitte & Touche to be responsible for performing the functions of the auditor and who will undertake the audit of the company for the ensuing year. Rotation of directors by retirement 3. Ordinary resolution number 2: Re-election of Mr PM Makwana Resolved, as an ordinary resolution, that Mr PM Makwana, who was appointed by the board and retires in terms of the Memorandum of Incorporation (MoI) of the company and is eligible and available for election, be and is hereby elected as a director of the company for a period of three years, subject to annual re-election at each AGM. Mr PM Makwana (BAdmin (Hons)) was appointed as independent board chairman on 5 February 2013 and chairs the nominations and B-BBEE committees. Immediate past chairman of Eskom Holdings, Mr PM Makwana is a management strategist with 20 years executive experience in both the private and public sectors. He serves as an independent non-executive director on the boards of JSE listed companies such as Adcock Ingram Holdings Ltd (AIHLF.PK), Nedbank Group Ltd (NDBKF.PK), Nedbank Ltd and Sephaku Holdings Ltd (SEPJ.J). He further serves as Trustee of Brand SA, Trustee of the Nelson Mandela Children s Fund and Vodacom Foundation. 4. Ordinary resolution number 3: Re-election of Mr RK Kothari Resolved, as an ordinary resolution, that Mr R Kothari, who was appointed by the board on 11 June as a non-executive director and retires in terms of the MoI of the company and is eligible and available for election, be and is hereby elected as a director of the company for a period of three years, subject to annual re-election at each AGM. Mr NF Nicolau was appointed as an independent non-executive director on 10 September. Mr NF Nicolau holds a BTech in mining engineering from the University of Johannesburg and an MBA (finance) from the University of Cape Town s Graduate School of Business. He is currently the CEO of Basil Read Holdings and has a long history at Anglo American at which he was the COO and executive director of Anglo Gold Ashanti and CEO of Anglo American Platinum. He has over 30 years working experience in the mining sector which includes holding various technical, management and executive positions. He is the chairman of the health, safety and environmental committee. 6. Ordinary resolution number 5: Re-election of Ms LC Cele Resolved, as an ordinary resolution, that Ms LC Cele, who was appointed by the board on 4 January as an independent non-executive director and retires in terms of the MoI of the company and is eligible and available for election, be and is hereby elected as a director of the company for a period of three years, subject to annual re-election at each AGM. Ms LC Cele holds a BCom degree from the University of Fort Hare and various postgraduate tax qualifications from the University of Natal. She is the founder and was the chief executive of Tax Solutions CC prior to its merger with Garach and Garach Accountants in Ms LC Cele currently holds various board memberships, including Hulamin Ltd. She brings a wealth of commercial and tax expertise to the board. Election of new directors 7. Ordinary resolution number 6: Election of Mr H Blaffart Resolved, as an ordinary resolution, that the appointment of Mr H Blaffart by the board on 19 July as a non-executive director is hereby ratified, and that he be and is hereby elected as a director of the company for a period of three years, subject to annual re-election at each AGM. Mr RK Kothari holds a chartered accountant degree from the Institute of Chartered Accountants of India. He is a vice-president within the ArcelorMittal group and is the current CFO and co-ordinator for the ACIS region. He has over 20 years working experience in various industries and has held key executive finance roles. 5. Ordinary resolution number 4: Re-election of Mr NF Nicolau Resolved, as an ordinary resolution, that Mr NF Nicolau, who was appointed by the board and retires in terms of the MoI of the company and is eligible and available for election, be and is hereby elected as a director of the company for a period of three years, subject to annual re-election at each AGM. Mr H Blaffart is executive vice-president and member of the management committee of the ArcelorMittal group. He is head of group human resources (HR) and also responsible for corporate services. He joined the group in 1982 and held several positions in the company including R&D director for the construction market and CEO of the former Arcelor s research division. He later became CEO of ArcelorMittal Lorraine in France and head of HR in the flat carbon Europe segment.
190 94 Integrated Annual Report Notice of annual general meeting continued 8. Ordinary resolution number 7: Election of Mr D Clarke Resolved, as an ordinary resolution, that the appointment of Mr D Clarke, who was appointed by the board on 19 July as a non-executive director is hereby confirmed for a period of three years, subject to annual re-election at each AGM, as contemplated in the MoI. Mr D Clarke, vice-president of ArcelorMittal Holdings, is head of strategy and chief technology officer of ArcelorMittal. He holds a PhD and MA in physics from Princeton University where he was a Fulbright Fellow and a Hackett Scholar, and a BSc (Hons) in mathematics and physics from the University of Western Australia. 9. Ordinary resolution number 8: Election of Ms NP Gosa Resolved, as an ordinary resolution, that the appointment of Ms NP Gosa, by the board on 1 December as non-executive director is hereby ratified, subject to annual re-election at each AGM, as contemplated by the MoI. Ms NP Gosa was a member of the National Planning Commission that crafted the National Development Plan and Vision She holds an MBA from the University of New Brunswick, Canada, a BA (Hons) (Communications) from the University of Fort Hare and several other postgraduation qualifications in business administration. Before her entrepreneurial interests which started in 2004, Ms NP Gosa was an investment analyst with Investec Bank. Prior to investment banking, she was one of the founding regulators of the then SA Telecommunications Regulatory Authority (now ICASA). In addition to being chairperson and one of the founding members of Likamva Resources, s B-BBEE partner and 17% shareholder, she is also the current CEO and founder of Akhona Group and an independent non-executive director of Investec Asset Management and Hulisani. She has also sat on the boards of other companies including Broll Property Group and AON South Africa. Retirement of Mr LP Mondi The board notes the retirement of Mr LP Mondi, a seasoned and long-standing member of the board with effect from the date of this AGM, as non-executive director. Mr LP Mondi has been a board member for over nine years. He was appointed non-executive director on 11 May 2007, is a member of the remuneration, social and ethics committee. He holds an MA in economics (Eastern Illinois University), a BCom (Hons) Economics (Wits University) and was previously appointed as the chief economist of the Industrial Development Corporation and is director of various companies, including Yard Capital (Pty) Ltd and Thelo Rolling Stock. Annual re-elections 10. Ordinary resolution number 9: Re-election of Mr JRD Modise Resolved, as an ordinary resolution, that Mr JRD Modise, who was appointed as a director for a period of three years by shareholders at the AGM in, subject to annual re-election at each AGM, be and is hereby elected as a director of the company for a further period in accordance with the original appointment of three years. Mr JRD Modise (BCom, BAcc, MBA, AMP) was appointed independent non-executive director on 1 October 2013 and is a member of the audit and risk committee. He previously chaired the remuneration, social and ethics committee. He is a former group financial director and chief operations officer of Johnnic and occupied senior finance positions at Eskom, Teljoy and JCI. Mr Modise is the founder and owner of Batsomi Investments and has held various non-executive directorships on some of South Africa s leading companies, including Altron Group, Eskom, DBSA, Blue IQ, The Nelson Mandela Children s Fund and Wits Business School. He is also the chairman of NERSA and deputy chairman of TCTA. 11. Ordinary resolution number 10: Re-election of Ms NP Mnxasana Resolved, as an ordinary resolution, that Ms NP Mnxasana, who was appointed as a director for a period of three years by shareholders at the AGM in, subject to annual re-election at each AGM, be and is hereby elected as a director of the company for a further period in accordance with the original appointment of three years. Ms NP Mnxasana (BCompt (Hons), CA(SA)) was appointed independent non-executive director on 1 October She is a member of the safety, health and environment committee and member of the audit and risk committee. She served as group audit and risk head at Imperial Holdings Ltd and currently serves on the boards of Nedbank and the JSE. Executive directors 12. Ordinary resolution number 11: Election of Mr WA de Klerk Resolved, as an ordinary resolution, that the appointment of Mr WA de Klerk, who was appointed as CEO and executive director by the board on 1 July is hereby confirmed and that he be and is hereby appointed as a director of the company in accordance with his conditions of appointment. Mr WA de Klerk holds a BAcc (Hons) from the University of Pretoria, an executive management diploma from Darden as well as a strategic marketing diploma from Harvard. He is a qualified Chartered Accountant (South Africa) and was previously the finance director and executive director of Exxaro Resources Ltd, a position he held since He has over 30 years, working experience in the audit, tax, steel, titanium and mining industries, having spent the last 15 years in various executive positions at both Kumba Resources and Exxaro Resources.
191 Shareholders information, AGM and proxy Integrated Annual Report Ordinary resolution number 12: Election of Mr D Subramanian Resolved, as an ordinary resolution, that the appointment of Mr D Subramanian, be and is hereby confirmed as a director of the company in accordance with his conditions of employment as chief financial officer. Mr D Subramanian (BCom, CA(SA)) was previously a finance executive for the Steel Cluster of Aveng Ltd. He has 22 years working experience in the retail, air transport, property management and construction industries. This includes more than 11 years experience in various positions at Aveng Ltd. Mr D Subramanian joined on 1 August as the CFO and executive director; he was the acting CEO of the company between February and July. Retirement of Messers P O Flaherty, M Vereecke, D Chugh and L Mondi The board notes the following retirements: Mr P O Flaherty (BAcc, BCom, CA(SA)) was appointed as the chief executive officer and executive director of the company on 1 July He resigned from this position on 12 February and was appointed as a non-executive director with effect from 1 March. He resigned from this position on 20 July to pursue other interests. Mr M Vereecke, who was appointed by the board on 11 June as a non-executive director and resigned on 15 July as a result of his new responsibilities in Europe, following an internal re-organisation of the ArcelorMittal group. Mr D Chugh, who was appointed as a non-executive director on 1 May 2002, has retired as an employee of the ArcelorMittal group at the end of July and therefore also retired from board appointments related to his official position. Mr LP Mondi, a long-standing member of the board, as a nonexecutive director with effect from the date of this AGM. Mr LP Mondi has been a board member for over nine years. He was appointed non-executive director on 11 May Ordinary resolution number 13: Election of Mr JRD Modise as audit and risk committee member Resolved, as an ordinary resolution, that Mr JRD Modise be and is hereby appointed as a member of the audit and risk committee, from the conclusion of the AGM at which this resolution is passed until the conclusion of the next AGM of the company. The board is satisfied that Mr JRD Modise is suitably skilled and an experienced independent non-executive director and has the appropriate experience and qualifications to fulfil his audit and risk committee obligations as set out in section 94 of the Companies Act, No 71 of 2008 (the Act). 15. Ordinary resolution number 14: Election of Ms NP Mnxasana as audit and risk committee member Resolved, as an ordinary resolution, that Ms NP Mnxasana be and is hereby appointed as a member of the audit and risk committee, from the conclusion of the AGM at which this resolution is passed until the conclusion of the next AGM of the company. The board is satisfied that Ms NP Mnxasana is suitably skilled and an experienced independent non-executive director and that she has the appropriate experience and qualifications to fulfil her audit and risk committee obligations as set out in section 94 of the Act. A brief curriculum vitae of Ms NP Mnxasana is set out in resolution Ordinary resolution number 15: Election of Ms LC Cele as audit and risk committee member Resolved, as an ordinary resolution, that Ms LC Cele be and is hereby appointed as a member of the audit and risk committee, from the conclusion of the AGM at which this resolution is passed until the conclusion of the next AGM of the company. The board is satisfied that Ms LC Cele is suitably skilled and an experienced independent non-executive director and that she has the appropriate experience and qualifications to fulfil her audit and risk committee obligations as set out in section 94 of the Act. A brief curriculum vitae of Ms LC Cele is set out in ordinary resolution Ordinary resolution number 16: Election of chairperson of the audit and risk committee Resolved, as an ordinary resolution, that the audit committee members, failing which the board of directors, be and are hereby authorised to elect a chairperson of the audit and risk committee from among its members, from the conclusion of the AGM at which this resolution is passed until the conclusion of the next AGM of the company. 18. Non-binding advisory endorsement: Remuneration policy Resolved, as an ordinary resolution, that the company s remuneration policy (excluding the non-executive directors), as set out in the remuneration report on 66 be endorsed by way of a non-binding advisory vote in terms of the King Report on Corporate Governance for South Africa, A brief curriculum vitae of Mr JRD Modise is set out in resolution 9.
192 96 Integrated Annual Report Notice of annual general meeting continued 19. Special resolution number 1: Non-executive directors fees Resolved, by way of separate special resolutions, that the annual fees payable to the non-executive directors of the company with effect from 1 June 2017 and until otherwise determined by ArcelorMittal South Africa in general meeting be approved on the basis set out below: Annual retainer Attendance fee per meeting Chairman (all-in annual fee) R None Director R R Audit and risk committee chairman R Audit and risk committee member R Nominations committee chairman R Nominations committee member R Safety, health and environment committee chairman R Safety, health and environment committee member R Remuneration, social and ethics committee chairman R Remuneration, social and ethics committee member R Share trust committee chairman R Share trust member R B-BBEE committee chairman R B-BBEE committee member R Any ad hoc or other board committee appointed by the board (chairman)* R Any ad hoc or other board committee appointed by the board (member)* R * Fees to be payable to the non-executive directors of the company with effect from 1 June Special resolution number 2: Financial assistance to related or inter-related company Resolved, by way of a special resolution, that the board may authorise the company (for a period of two years from the date on which this resolution is passed) to generally provide any direct or indirect financial assistance, in the manner contemplated in and subject to the provisions of sections 44 and 45 of the Act, to a related or interrelated company or corporation or to a member of a related or inter-related corporation, pursuant to the authority hereby conferred upon the board for these purposes. Reason for and effect of this special resolution The reason for this special resolution is that, from time to time, the company may be required to provide financial assistance to subsidiaries and other related companies within the group. The effect of this special resolution is that the company will be authorised to provide financial assistance to subsidiaries and other related parties within the group. 21. Ordinary resolution number 17: Authority to implement resolutions passed at the annual general meeting That any director or company secretary of the company be authorised to do all such things, perform all acts and sign all such documentation as may be required to give effect to the ordinary and special resolutions adopted at this annual general meeting. By order of the board Reason for and effect of this resolution The reason and effect of this resolution is to grant the company the authority to pay remuneration to its directors for their services as directors. Nomonde Bam Company secretary 15 February 2017
193 Shareholders information, AGM and proxy Integrated Annual Report 97 Proxy form ARCELORMITTAL SOUTH AFRICA LIMITED (Incorporated in the Republic of South Africa) (Registration number 1989/002164/06) JSE code: ACL ISIN: ZAE (the company) To be completed by registered certificated shareholders and dematerialised shareholders with own-name registration only. For use in respect of the twenty-ninth annual general meeting of the company to be held at Hyatt Regency Johannesburg Hotel, Nina 2 Room, 191 Oxford Road, Rosebank, South Africa on Wednesday, 24 May 2017 at 09:00. Ordinary shareholders who have dematerialised their shares with a CSDP or broker, other than with own-name registration, must arrange with the CSDP or broker concerned to provide them with the necessary letter of representation to attend the annual general meeting, or the ordinary shareholders concerned must instruct their CSDP or broker as to how they wish to vote in this regard. This must be done in terms of the agreement entered into between the shareholder and the CSDP or broker concerned. I/We (full name in block letters) of (address) Telephone (work) (home) being the registered owner/s of ordinary shares in the company hereby appoint or failing him/her the chairperson of the annual general meeting, as my/our proxy to act for me/us and on my/our behalf at the annual general meeting which will be held for the purpose of considering and, if deemed fit, passing, with or without modification, the ordinary and special resolutions to be proposed thereat and at any adjournment thereof; and to vote for and/or against the ordinary and special resolutions and/or abstain from voting in respect of the ordinary shares registered in my/our name(s), in accordance with the following instructions: *Please indicate with an X in the appropriate spaces below how you wish your votes to be cast. Unless otherwise instructed, my/our proxy may vote as he/she thinks fit. Number of votes For* Against* Abstain* 2. Ordinary resolution number 1: Reappointment of auditors 3. Ordinary resolution number 2: Re-election of Mr PM Makwana 4. Ordinary resolution number 3: Re-election of Mr RK Kothari 5. Ordinary resolution number 4: Re-election of Mr NF Nicolau 6. Ordinary resolution number 5: Re-election of Ms LC Cele 7. Ordinary resolution number 6: Election of Mr H Blaffart 8. Ordinary resolution number 7: Election of Mr D Clarke 9. Ordinary resolution number 8: Election of Ms NP Gosa 10. Ordinary resolution number 9: Re-election of Mr JRD Modise 11. Ordinary resolution number 10: Re-election of Ms NP Mnxasana 12. Ordinary resolution number 11: Election of Mr WA de Klerk 13. Ordinary resolution number 12 Election of Mr D Subramanian 14. Ordinary resolution number 13: Election of Mr JRD Modise as audit and risk committee member 15. Ordinary resolution number 14: Election of Ms NP Mnxasana as audit and risk committee member 16. Ordinary resolution number 15: Election of Ms LC Cele as audit and risk committee member 17. Ordinary resolution number 16: Election of chairperson of the audit and risk committee 18. Non-binding advisory endorsement: Remuneration policy 19. Special resolution number 1: Approval of non-executive directors fees 19.1 Chairman (all-in annual fee) 19.2 Director (annual retainer and attendance per board meeting) 19.3 Audit and risk committee chairman 19.4 Audit and risk committee member 19.5 Nominations committee chairman 19.6 Nominations committee member 19.7 Safety, health and environment committee chairman 19.8 Safety, health and environment committee member 19.9 Remuneration, social and ethics committee chairman Remuneration, social and ethics committee member Share trust committee chairman Share trust committee member B-BBEE committee chairman B-BBEE committee member Any ad hoc or other committee appointed by the board (chairman) Any ad hoc or other committee appointed by the board (member) 20. Special resolution number 2: Financial assistance to related or inter-related company 21. Ordinary resolution number 17: Authority to implement resolutions passed at the annual general meeting Signed this day of 2017 Signature: Assisted by (if applicable):
194 98 Integrated Annual Report Instructions and notes to the form of proxy 1. This form of proxy will not be effective at the meeting unless received at the company s transfer secretaries office, Computershare Investor Services (Pty) Ltd, 15 Biermann Avenue, Rosebank, 2196, by no later than 09:00 on Monday, 22 May If a shareholder does not wish to deliver this form of proxy to that address, it may also be posted, at the risk of the shareholder, to Computershare Investor Services (Pty) Ltd, PO Box 61051, Marshalltown, This form is for use by registered shareholders who wish to appoint another person (a proxy) to represent them at the meeting. If duly authorised, companies and other corporate bodies who are registered shareholders may appoint a proxy using this form, or may appoint a representative in accordance with point 12 below. Other shareholders should not use this form. All beneficial shareholders who have dematerialised their shares through a CSDP or broker must provide the CSDP or broker with their voting instruction. Alternatively, if they wish to attend the meeting in person, they should request the CSDP or broker to provide them with a letter of representation in terms of the custody agreement entered into between the beneficial shareholder and the CSDP or broker. 3. This proxy shall apply to all ordinary shares registered in the name of the shareholder who signs this form of proxy at the record date, unless a lesser number of shares are inserted. 4. A shareholder may appoint one person of his own choice as his proxy by inserting the name of such proxy in the space provided. Any such proxy need not be a shareholder of the company. If the name of the proxy is not inserted, the chairman of the meeting will be appointed as proxy. If more than one name is inserted, then the person whose name appears first on the form of proxy and who is present at the meeting will be entitled to act as proxy to the exclusion of any persons whose names follow. The proxy appointed in this form of proxy may delegate the authority given to him in this form of proxy by delivering to the company, in the manner required by these instructions, a further form of proxy which has been completed in a manner consistent with the authority given to the proxy in this form of proxy. 5. Unless revoked, the appointment of a proxy in terms of this form of proxy remains valid until the end of the meeting, even if the meeting or part thereof is postponed or adjourned. 6. If: 6.1 a shareholder does not indicate on this instrument that the proxy is to vote in favour of or against or to abstain from voting on any resolution; or 6.2 the shareholder gives contradictory instructions in relation to any matter; or 6.3 any additional resolution/s which are properly put before the meeting; or 6.4 any resolution listed in the form of proxy is modified or amended, then the proxy shall be entitled to vote or abstain from voting, as he thinks fit, in relation to that resolution or matter. If, however, the shareholder has provided further written instructions which accompany this form and which indicate how the proxy should vote or abstain from voting in any of the circumstances referred to in 6.1 to 6.4, then the proxy shall comply with those instructions. 7. If this proxy is signed by a person (signatory) on behalf of the shareholder, whether in terms of a power of attorney or otherwise, then this form of proxy will not be effective, unless: 7.1 it is accompanied by a certified copy of the authority given by the shareholder to the signatory; or 7.2 the company has already received a certified copy of that authority. 8. The chairman of the meeting may, in his discretion, accept or reject any form of proxy or other written appointment of a proxy which is received by the chairman prior to the time when the meeting deals with a resolution or matter to which the appointment of the proxy relates, even if that appointment of a proxy has not been completed and/or received in accordance with these instructions. However, the chairman shall not accept any such appointment of a proxy unless the chairman is satisfied that it reflects the intention of the shareholder appointing the proxy. 9. Any alternations made in this form of proxy must be initialled by the authorised signatory/ies. 10. This form of proxy is revoked if the shareholder who granted the proxy: 10.1 gives written notice of such revocation to the company, so that it is received by the company by not later than 09:00 on Monday 22 May 2017; or 10.2 subsequently appoints another proxy for the meeting; or 10.3 attends the meeting himself in person. 11. All notices which a shareholder is entitled to receive in relation to the company shall continue to be sent to that shareholder and shall not be sent to the proxy. 12. If duly authorised, companies and other corporate bodies who are shareholders of the company having shares registered in their own names may, instead of completing this form of proxy, appoint a representative to represent them and exercise all of their rights at the meeting by giving written notice of the appointment of that representative. That notice will not be effective at the meeting unless it is accompanied by a duly certified copy of the resolution/s or other authorities in terms of which that representative is appointed and is received at the company s transfer secretaries office, Computershare Investor Services (Pty) Ltd, Rosebank Towers, 15 Biermann Avenue, Rosebank, 2196, by not later than 09:00 on Monday 22 May If a shareholder does not wish to deliver that notice to that address, it may also be posted, at the risk of the shareholder, to Computershare Investor Services (Pty) Ltd, PO Box 61051, Marshalltown, Certificated and/or own name dematerialised shareholders may also utilise the address: proxy@computershare.co.za. 13. The completion and lodging of this form of proxy does not preclude the relevant shareholder from attending the annual general meeting and speaking and voting in person to the exclusion of any proxy appointed by the shareholder. 14. The chairman of the annual general meeting may accept or reject any form of proxy which is completed and/or received other than in accordance with these instructions, provided that he shall not accept a proxy unless he is satisfied as to the manner in which a shareholder wishes to vote. Transfer secretaries office Computershare Investor Services (Pty) Ltd Rosebank Towers, 15 Biermann Avenue, Rosebank, 2196 (PO Box 61051, Marshalltown, 2107)
195 Corporate information Company registration Ltd Registration number 1989/002164/06 Share code: ACL ISIN: ZAE Registered office Vanderbijlpark Works Room N3-5, Main Building Delfos Boulevard Vanderbijlpark Postal address PO Box 2 Vanderbijlpark, 1900 Telephone: +27 (0) Facsimile: +27 (0) Internet address Auditors Deloitte & Touche Deloitte Place, Building 1, The Woodlands 20 Woodlands Drive, Woodmead, 2052, South Africa Telephone: +27 (0) Facsimile: +27 (0) Transfer secretaries Computershare Investor Services (Pty) Ltd Rosebank Towers, 15 Biermann Avenue, Rosebank PO Box 61051, Marshalltown, 2107 Telephone: Facsimile: +27 (0) web.queries@computershare.co.za United States ADR depositary The Bank of New York Mellon ADR Department 101 Barclay Street, 22nd Floor, New York, NY United States of America Internet: Company secretary Ms NB Bam Telephone: +27 (0) Facsimile: +27 (0) nomonde.bam@arcelormittal.com Sponsor JP Morgan Equities South Africa Proprietary Limited 1 Fricker Road, Illovo, Johannesburg, 2196 Private Bag X9936, Sandton, 2146 Telephone: +27 (0) Facsimile: +27 (0) BASTION GRAPHICS

196 Corporate Office Delfos Boulevard Vanderbijlpark Phone: +27 (0) Fax: +27 (0) GPS coordinates: E S for the online version
Audited Annual Financial Statements Together. creating value for all
 Audited Annual Financial Statements Together creating value for all Contents 1 Directors responsibility and approval of the group and company annual financial statements 2 Directors report 5 Audit and
COPY TO BE SUPPLIED AUDITED ANNUAL FINANCIAL STATEMENTS
 COPY TO BE SUPPLIED AUDITED ANNUAL FINANCIAL STATEMENTS Contents 1 Directors responsibility and approval of the group and company annual financial statements 1 Certificate by company secretary 2 Directors
SASOL INZALO PUBLIC (RF) LIMITED GROUP
 LIMITED GROUP") SASOL INZALO PUBLIC (RF) LIMITED GROUP Annual Financial Statements 30 June 2017 1 FINANCIAL 2 4 Sasol Inzalo Public (RF) Limited Group Contents OVERVIEW CONSOLIDATED AND SEPARATE FINANCIAL STATEMENTS 4
SASOL INZALO PUBLIC (RF) LIMITED GROUP Annual Financial Statements 30 June 2017 1 FINANCIAL 2 4 Sasol Inzalo Public (RF) Limited Group Contents OVERVIEW CONSOLIDATED AND SEPARATE FINANCIAL STATEMENTS 4
Directors statement of responsibility and approval
 Directors statement of responsibility and approval The directors are responsible for the preparation and integrity of the annual financial statements of the company and the group, which have been prepared
INDEPENDENT AUDITOR S REPORT TO THE SHAREHOLDERS OF AFRICAN EQUITY EMPOWERMENT INVESTMENTS LIMITED OPINION
 6 FINANCIAL STATEMENTS INDEPENDENT AUDITOR S REPORT TO THE SHAREHOLDERS OF AFRICAN EQUITY EMPOWERMENT INVESTMENTS LIMITED OPINION We have audited the consolidated and separate financial statements of African
2017 Audited Annual Financial Statements for the year ended 31 December 2017 Grindrod Limited
 2017 Audited Annual Financial Statements for the year ended 31 December 2017 Grindrod Limited FINANCIAL + FREIGHT + SHIPPING 1 Group 01 Approval of the annual financial statements 2 02 Compliance statement
Staples Rodway Level 9, 45 Queen Street, 1010 PO Box 3899, Auckland 1140 New Zealand T F E W
 Staples Rodway Level 9, 45 Queen Street, 1010 PO Box 3899, Auckland 1140 New Zealand T +64 9 309 0463 F +64 9 309 4544 E enquiries@staplesrodway.com W staplesrodway.co.nz INDEPENDENT AUDITOR S REPORT To
BASIL READ LIMITED CONSOLIDATED ANNUAL FINANCIAL STATEMENTS. for the year ended 31 December 2016
 BASIL READ LIMITED CONSOLIDATED ANNUAL FINANCIAL STATEMENTS Contents Annual financial statements Certificate by company secretary 1 Preparation of financial statements 1 Director's report 2-3 Audit committee
ANNUAL FINANCIAL STATEMENTS
 ANNUAL FINANCIAL STATEMENTS Contents Annual financial statements 1 Certificate by company secretary 1 Preparation of financial statements 2 4 Directors report 5 8 Audit committee report 9 14 Independent
LEADERS IN MOBILITY ANNUAL FINANCIAL STATEMENTS
 LEADERS IN MOBILITY ANNUAL FINANCIAL STATEMENTS FOR THE YEAR ENDED 30 JUNE AUDITED ANNUAL FINANCIAL STATEMENTS FOR THE YEAR ENDED 30 JUNE CONTENTS 1 DIRECTORS RESPONSIBILITY FOR SEPARATE AND CONSOLIDATED
DELIVERING ON OUR PROMISE OF A NEW STRATEGIC FUTURE OIL & GAS + UNDERGROUND MINING + POWER & WATER
 DELIVERING ON OUR PROMISE OF A NEW STRATEGIC FUTURE OIL & GAS + UNDERGROUND MINING + POWER & WATER ANNUAL FINANCIAL STATEMENTS 20 18 MURRAY & ROBERTS ANNUAL FINANCIAL STATEMENTS 18 CONTENTS The reports
UNLOCKING GROWTH FINANCIAL STATEMENTS
 UNLOCKING GROWTH FINANCIAL STATEMENTS 2016 FINANCIAL STATEMENTS 2016 Contents FINANCIAL STATEMENTS Directors responsibility and approval of the annual financial statements 2 Certificate by the company
statements annual financial statements 70 Group salient features 71 Five-year summary of results Annexure a: interest-bearing borrowings
 annual financial statements Annual financial statements 70 Group salient features 71 Five-year summary of results 72 Summary of statistics 73 Definitions 74 Ordinary share ownership 75 Financial review
REVIEWED CONDENSED CONSOLIDATED FINANCIAL STATEMENTS FOR THE SIX MONTHS ENDED 30 JUNE 2018
 REVIEWED CONDENSED CONSOLIDATED FINANCIAL STATEMENTS FOR THE SIX MONTHS ENDED 30 JUNE 2018 Limited (Incorporated in the Republic of South Africa) (Registration number 1989/002164/06) Share code: ACL ISIN:
Premium Properties Limited (Registration number 1994/003601/06) Annual Financial Statements for the year ended 31 August 2017
 Annual Financial Statements for the year ended 31 August 2017") Annual Financial Statements for the year ended 31 August 2017 General Information Country of incorporation and domicile Nature of business and principal activities Directors Registered office Business
Annual Financial Statements for the year ended 31 August 2017 General Information Country of incorporation and domicile Nature of business and principal activities Directors Registered office Business
GROWING GREAT BRANDS
 COMPANY ANNUAL FINANCIAL STATEMENTS GROWING GREAT BRANDS AVI LIMITED ISIN: ZAE000049433 Share code: AVI Registration : 1944/017201/06 ( AVI or the Group or the Company ) For more information, please visit
CONSOLIDATED AND COMPANY ANNUAL FINANCIAL STATEMENTS 2017
 CONSOLIDATED AND COMPANY ANNUAL FINANCIAL STATEMENTS 2017 Contents Statutory information Company information 2 Directors responsibility statement 3 Company secretary certificate 3 Independent auditor's
AUDITED ANNUAL FINANCIAL STATEMENTS
 AUDITED ANNUAL FINANCIAL STATEMENTS 2017 AUDITED ANNUAL FINANCIAL STATEMENTS 2017 I CONTENTS Directors responsibility report 1 Declaration by the company secretary 1 Audit and risk committee report 2 Independent
CONTENTS COMPANY FINANCIAL STATEMENTS
 CONTENTS ANNUAL FINANCIAL STATEMENTS 1 Directors report 3 Directors responsibility statement and approval 3 Company Secretary s statement 4 Report of the Audit and Risk Committee 7 Independent Auditor
MPACT LIMITED GROUP. for the year ended 31 December
 MPACT LIMITED GROUP Audited consolidated Annual Financial Statements for the year ended 31 December 2016 Table of Contents AUDITED CONSOLIDATED ANNUAL FINANCIAL STATEMENTS 31 December 2016 Directors responsibility
AUDITED ANNUAL FINANCIAL STATEMENTS 2017
 AUDITED ANNUAL FINANCIAL STATEMENTS CONTENTS 1 Directors responsibility statement 1 Certificate by the company secretary 2 Directors report 3 Audit and risk committee report 6 Independent auditor s report
The reports and statements set out below comprise the annual consolidated financial statements presented to the shareholders:
 1 INDEX The reports and statements set out below comprise the annual consolidated financial statements presented to the shareholders: INDEPENDENT AUDITOR S REPORT DIRECTORS RESPONSIBILITIES AND APPROVAL
Report on the Audit of the Consolidated Financial Statements
 To the General Meeting of Barry Callebaut AG, Zurich Report on the Audit of the Consolidated Financial Statements Opinion We have audited the consolidated financial statements of Barry Callebaut AG and
OHLTHAVER & LIST F OR THE YE AR ENDED 30 JUNE 20 17
 OHLTHAVER & LIST GROUP ANNUAL FINANCI AL F OR THE YE AR ENDED 30 JUNE 20 17 S TATEMENT S APPROVAL OF FINANCIAL STATEMENTS Responsibility Of Directors The Directors are responsible for the maintenance of
Independent Auditor s Report
 22/F, CITIC Tower 1 Tim Mei Avenue Central, Hong Kong To the shareholders of Bank of China Limited (Established in the People s Republic of China with limited liability) Opinion We have audited the consolidated
Independent Auditor s Report
 New Silkroutes Group Limited 27 Report on the Audit of the Financial Statements Qualified Opinion We have audited the financial statements of New Silkroutes Group Limited (the Company ) and its subsidiaries
AUDITED ANNUAL FINANCIAL STATEMENTS
 AUDITED ANNUAL FINANCIAL STATEMENTS CONTENTS 1 Directors responsibility statement 1 Certificate by the company secretary 2 Directors report 3 Audit and risk committee report 6 Independent auditor s report
AUDITED ANNUAL FINANCIAL STATEMENTS 2018
 AUDITED ANNUAL FINANCIAL STATEMENTS 2018 I CONTENTS Directors responsibility report 1 Declaration by the company secretary 1 Audit and risk committee report 2 Independent auditor s report 4 CORONATION
Independent Auditor s Report of the Consolidated and Separate Financial Statements
 Financial Statements To the Shareholders of Sanlam Limited Opinion We have audited the consolidated and separate financial statements of Sanlam Limited set out on pages 15 to 161, which comprise the statements
Independent Auditor s Report
 Independent Auditor s Report To the Shareholders of Sa Sa International Holdings Limited (incorporated in Cayman Islands with limited liability) Opinion What we have audited The consolidated financial
GROUP AND COMPANY AUDITED ANNUAL FINANCIAL STATEMENTS
 GROUP AND COMPANY AUDITED ANNUAL FINANCIAL STATEMENTS AT 2 JULY 2017 These annual financial statements were prepared by the finance department of the Truworths International Ltd Group acting under the
Preliminary reviewed condensed consolidated fi nancial statements for the year ended 31 December 2018
 Preliminary reviewed condensed consolidated fi nancial statements for the year ended Our Vision To add value to all our stakeholders through our market leadership position in sub- Saharan Africa by producing
Principal Audit Procedures
 INDEPENDENT AUDITOR S REPORT TO THE BOARD OF DIRECTORS OF INFOSYS LIMITED Report on the Audit of the Interim Consolidated Financial Statements Opinion We have audited the accompanying interim consolidated
Independent Auditor s Report
 Independent Auditor s Report Li & Fung Limited Annual Report 2017 165 Independent Auditor s Report To the Shareholders of Li & Fung Limited (incorporated in Bermuda with limited liability) Opinion What
THE SPAR GROUP LTD ANNUAL FINANCIAL STATEMENTS 2017
 THE SPAR LTD ANNUAL FINANCIAL STATEMENTS 2017 CONTENTS 1 Directors approval of the annual financial statements 1 Certificate by the Company Secretary 2 Independent auditor s report 5 Directors statutory
INDEPENDENT AUDITOR S REPORT
 TO THE MEMBERS OF THE HONG KONG AND CHINA GAS COMPANY LIMITED (incorporated in Hong Kong with limited liability) Opinion What we have audited The consolidated financial statements of The Hong Kong and
Independent auditor s report
 Independent auditor s report 193 DBS Group Holdings Ltd and its Subsidiaries Independent auditor s report To the members of DBS Group Holdings Ltd (incorporated in Singapore) Report on the Audit of the
194 Chemical Company of Malaysia Berhad Annual Report Opinion
 194 Chemical Company of Malaysia Berhad Annual Report 2016 AUDITOR S REPORT REPORT ON THE AUDIT OF THE FINANCIAL STATEMENTS Opinion We have audited the financial statements of Chemical Company of Malaysia
Mubadala Development Company PJSC
 Mubadala Development Company PJSC Consolidated financial statements 31 December 2016 Principal Business Address PO Box 45005 Abu Dhabi United Arab Emirates Mubadala Development Company PJSC Consolidated
independent auditor s report. AUSTRALIAN PIPELINE TRUST AND ITS CONTROLLED ENTITIES TO THE UNITHOLDERS OF AUSTRALIAN PIPELINE TRUST
 independent auditor s report. Deloitte Touche Tohmatsu ABN 74 490 121 060 Grosvenor Place 225 George Street Sydney NSW 2000 PO Box N250 Grosvenor Place Sydney NSW 1220 Australia DX: 10307SSE Tel: +61 (0)
Please refer to Annexure 1 for some examples of Key Audit Matters (KAM) for illustrative purposes.
 for illustrative purposes.") Independent Auditor s Report To the Shareholders of ABC Life Insurance Company Limited Report on the Audit of the Financial Statements Opinion We have audited the financial statements of ABC Life Insurance
Independent Auditor s Report To the Shareholders of ABC Life Insurance Company Limited Report on the Audit of the Financial Statements Opinion We have audited the financial statements of ABC Life Insurance
CONSOLIDATED ANNUAL FINANCIAL STATEMENTS
 CONSOLIDATED ANNUAL FINANCIAL STATEMENTS 2018 GENERAL INFORMATION Country of incorporation and domicile Nature of business and principal activities Directors Registered office Business address South Africa
Independent Auditor s Report
 Ernst & Young 22/F, CITIC Tower 1 Tim Mei Avenue Central, Hong Kong To the members of BOC Hong Kong (Holdings) Limited (Incorporated in Hong Kong with limited liability) Opinion We have audited the consolidated
Appendices to the Annual Report for 2017
 5 APPENDIX 5. CONSOLIDATED FINANCIAL STATEMENTS AND MANAGEMENT S DISCUSSION AND ANALYSIS OF FINANCIAL CONDITION AND RESULTS OF OPERATIONS Appendices to the Annual Report for 2017 CONSOLIDATEDD FINANCIAL
Annual Financial Statements and other information
 Audited Annual Financial Statements Annual Financial Statements and other information The reports and statements set out below were prepared under the supervision of K Ntlha CA(SA), Financial Director,
Auditor s Report (Translation of the Finnish Original)
") Auditor s Report (Translation of the Finnish Original) To the Annual General Meeting of Stora Enso Oyj Report on the Audit of the Financial Statements Opinion In our opinion the consolidated financial
Auditor s Report (Translation of the Finnish Original) To the Annual General Meeting of Stora Enso Oyj Report on the Audit of the Financial Statements Opinion In our opinion the consolidated financial
Contents. Consolidated financial statements for the year ended 31 March 2017
 Consolidated financial statements for the year ended 31 March 2017 Contents Consolidated financial statements for the year ended 31 March 2017 Page Statement of responsibility by the board of directors
INDEPENDENT AUDITOR S REPORT TO THE BOARD OF DIRECTORS OF INFOSYS LIMITED. Report on the Audit of the Interim Consolidated Financial Statements
 INDEPENDENT AUDITOR S REPORT TO THE BOARD OF DIRECTORS OF INFOSYS LIMITED Report on the Audit of the Interim Statements Opinion We have audited the accompanying interim consolidated financial statements
Report on the Financial Statements (ISA 700 (Revised) Report)
 Report)") Report on the Financial Statements (ISA 700 (Revised) Report) Circumstances Audit of a complete set of financial statements of a medical scheme prepared in accordance with International Financial Reporting
Report on the Financial Statements (ISA 700 (Revised) Report) Circumstances Audit of a complete set of financial statements of a medical scheme prepared in accordance with International Financial Reporting
INDEPENDENT AUDITOR S REPORT TO THE MEMBERS OF CAL BANK LIMITED REPORT ON THE AUDIT OF THE CONSOLIDATED AND SEPARATE FINANCIAL STATEMENTS
 REPORT ON THE AUDIT OF THE CONSOLIDATED AND SEPARATE FINANCIAL STATEMENTS Deloitte & Touche Ibex Court, 4 Liberation Road Ako Adjei Interchange P.O. Box GP 453 Accra Ghana Tel: +233 (0) 302 775355 / 770559
INDEPENDENT AUDITOR S REPORT. HFC Annual Report
 INDEPENDENT AUDITOR S REPORT HFC Annual Report 2016 31 32 HFC Annual Report 2016 INDEPENDENT AUDITOR S REPORT TO THE SHAREHOLDERS OF HFC BANK GROUP Report on the Audit of the Financial Statements Opinion
Annual Financial Statements. for the year ended 31 March 2013
 Annual Financial Statements Annual financial statements Approval of annual financial statements 1 Lodgement of returns with the Companies and Intellectual Property Commission 1 Independent auditor s report
Paramount Trading (Jamaica) Limited Financial Statements 31 May 2017
 Limited Financial Statements 31 May 2017") Financial Statements Index Page Independent Auditor s Report to the Members Financial Statements Statement of Comprehensive Income 1 Statement of Financial Position 2 Statement of Cash Flows 3 Statement
Financial Statements Index Page Independent Auditor s Report to the Members Financial Statements Statement of Comprehensive Income 1 Statement of Financial Position 2 Statement of Cash Flows 3 Statement
ANNUAL FINANCIAL STATEMENTS FOR THE YEAR ENDED 30 JUNE 2015
 ANNUAL FINANCIAL STATEMENTS FOR THE YEAR ENDED 30 JUNE 2015 These annual financial statements were compiled by the Company s appointed manager, Remgro Management Services Ltd, under the supervision of
Preliminary reviewed condensed consolidated financial statements for the year ended 31 December 2017
 ArcelorMittal South Africa Limited Registration number: 1989/002164/06 Share code: ACL ISIN: ZAE 000134961 (ArcelorMittal South Africa, the company or the group) Preliminary reviewed condensed consolidated
ANNUAL FINANCIAL STATEMENTS
 ANNUAL FINANCIAL STATEMENTS CONTENTS 107 Directors approval of annual financial statements 107 Certificate by Company Secretary 108 Independent auditor s report 109 Directors statutory report 111 Audit
DIRECTORS' STATEMENT. 1. Directors. 2. Arrangements to enable directors to acquire benefits by means of acquisition of shares or debentures
 DIRECTORS' STATEMENT The directors of GP Industries Limited (the Company ) present their statement together with the audited consolidated financial statements of the Company and its subsidiaries (collectively,
STATUTORY REPORTS AND FINANCIAL STATEMENTS
 STATUTORY REPORTS AND FINANCIAL STATEMENTS CONTENTS Directors Statement 116 Balance Sheets 139 Independent Auditor s Report 126 Consolidated Statement of Changes in Equity 141 Consolidated Income Statement
BTS Group Holdings Public Company Limited and its subsidiaries Report and consolidated financial statements 31 March 2018
 BTS Group Holdings Public Company Limited and its subsidiaries Report and consolidated financial statements 31 March 2018 Independent Auditor's Report To the Shareholders of BTS Group Holdings Public Company
Independent Auditor s Report To the Members of Singapore Telecommunications Limited
 REPORT ON THE AUDIT OF THE FINANCIAL STATEMENTS Opinion We have audited the financial statements of Singapore Telecommunications Limited (the Company ) and its subsidiaries (the Group ) which comprise
INDEPENDENT AUDITOR S REPORT TO THE BOARD OF DIRECTORS OF INFOSYS LIMITED. Report on the Audit of Interim Consolidated Financial Statements.
 INDEPENDENT AUDITOR S REPORT TO THE BOARD OF DIRECTORS OF INFOSYS LIMITED Report on the Audit of Interim Consolidated Financial Statements Opinion We have audited the accompanying interim consolidated
EMPHASIS OF MATTER BY INDEPENDENT AUDITORS ON THE FINANCIAL STATEMENTS FOR THE FINANCIAL YEAR ENDED 31 MARCH 2018
 (a business trust constituted on 29 July 2011 and registered on 25 September 2012 under the laws of the Republic of Singapore) managed by RHT Health Trust Manager Pte. Ltd. EMPHASIS OF MATTER BY INDEPENDENT
About Redefine. Top 40
 About Redefine Redefine is an internally managed Real Estate Investment Trust (REIT) with the primary goal of growing and improving cash flow to deliver quality earnings, to underpin sustained growth in
ANNUAL FINANCIAL STATEMENTS 2017
 ANNUAL FINANCIAL STATEMENTS 1 1 1 2 4 6 10 11 12 14 15 50 Companies Act notice Directors responsibility statement Company secretary s certificate Directors report Audit committee report Independent auditor
ONE CARIBBEAN MEDIA LIMITED ANNUAL REPORT 2016 Page 29
 ANNUAL REPORT 2016 Page 29 One Caribbean Media Limited and its subsidiaries Statement of Management s Responsibilities Management is responsible for the following: Preparing and fairly presenting the accompanying
ANNUAL FINANCIAL STATEMENTS
 5 ANNUAL FINANCIAL STATEMENTS 50 Directors responsibility and approval 51 Certificate of the Company Secretary 52 Audit Committee Report 53 Directors Report 55 Independent Auditor s Report 58 Statements
MULTICHOICE SOUTH AFRICA HOLDINGS PROPRIETARY LIMITED (Registration number 2006/015293/07) Group and company annual financial statements for the year
 Group and company annual financial statements for the year") Group and company annual financial statements for the year ended 31 March 2018 General Information Prominent Notice These annual financial statements have been audited by our external auditors PricewaterhouseCoopers
Group and company annual financial statements for the year ended 31 March 2018 General Information Prominent Notice These annual financial statements have been audited by our external auditors PricewaterhouseCoopers
Report TO THE MEMBERS OF LIONGOLD CORP LTD
 on the Audit of the Financial Statements Qualified Opinion We have audited the accompanying consolidated financial statements of LionGold Corp Ltd and its subsidiaries (collectively referred to as the
INDEPENDENT AUDITOR S REPORT TO THE MEMBERS OF UNILEVER GHANA LIMITED
 INDEPENDENT AUDITOR S REPORT TO THE MEMBERS OF UNILEVER GHANA LIMITED Report on the Audit of the Financial Statements Opinion We have audited the financial statements of Unilever Ghana Limited, which comprise
Report on the Audit of the Financial Statements
 KPMG Chartered Accountants P.O. Box 76 6 Duke Street Kingston Jamaica, W.I. +1 (876) 922-6640 firmmail@kpmg.com.jm INDEPENDENT AUDITORS REPORT To the Members of Report on the Audit of the Financial Statements
THE JAMAICA STOCK EXCHANGE LIMITED CONSOLIDATED FINANCIAL STATEMENTS. FOR THE YEAR ENDED DECEMBER 31, 2017 (Expressed in Jamaican Dollars)
") CONSOLIDATED FINANCIAL STATEMENTS FOR THE AND ITS SUBSIDIARIES CONTENTS Independent Auditor s Report 1-8 Page FINANCIAL STATEMENTS Consolidated Statement of Financial Position 9 Consolidated Statement
CONSOLIDATED FINANCIAL STATEMENTS FOR THE AND ITS SUBSIDIARIES CONTENTS Independent Auditor s Report 1-8 Page FINANCIAL STATEMENTS Consolidated Statement of Financial Position 9 Consolidated Statement
JSE Clear Proprietary Limited. (Registration Number 1987/002294/07)
") (Registration Number 1987/002294/07) ANNUAL FINANCIAL STATEMENTS FOR THE YEAR ENDED 31 DECEMBER 2016 General Information Country of incorporation and domicile Directors Registered office Business address
(Registration Number 1987/002294/07) ANNUAL FINANCIAL STATEMENTS FOR THE YEAR ENDED 31 DECEMBER 2016 General Information Country of incorporation and domicile Directors Registered office Business address
Financial Statements and Dividend Announcement for the year ended 31 December 2016
 Page 1 of 22 COMFORTDELGRO CORPORATION LIMITED Company Registration Number : 200300002K Financial Statements and Dividend Announcement for the year ended 31 December 2016 The Board of Directors announces
AUDITED ANNUAL FINANCIAL STATEMENTS
 AUDITED ANNUAL FINANCIAL STATEMENTS 2017 CONTENTS Approval of annual financial statements 1 Secretarial certification 1 Independent auditor's report 2 Directors report 4 Report of the audit and risk committee
Stationery and Office Supplies Limited. Financial Statements. December 31, 2017
 Financial Statements Contents Page Independent auditor s report 1-5 Financial Statements Statement of financial position 6 Statement of profit or loss 7 Statement of changes in equity 8 Statement of cash
TRC Construction Public Company Limited and its subsidiaries Report and consolidated financial statements 31 December 2017
 TRC Construction Public Company Limited and its subsidiaries Report and consolidated 31 December 2017 Independent Auditor's Report To the Shareholders of TRC Construction Public Company Limited Opinion
Thai Agro Energy Public Company Limited Report and financial statements 31 December 2018
 Thai Agro Energy Public Company Limited Report and financial statements 31 December 2018 Independent Auditor's Report To the Shareholders of Thai Agro Energy Public Company Limited Opinion I have audited
AVIOR CAPITAL MARKETS HOLDINGS LIMITED (Registration number 2015/08658/06) Consolidated Annual Financial Statements for the year ended 30 April 2018
 Consolidated Annual Financial Statements for the year ended 30 April 2018") AVIOR CAPITAL MARKETS HOLDINGS LIMITED (Registration number 2015/08658/06) Consolidated Annual Financial Statements for the year ended 30 April 2018 General Information Country of incorporation and domicile
AVIOR CAPITAL MARKETS HOLDINGS LIMITED (Registration number 2015/08658/06) Consolidated Annual Financial Statements for the year ended 30 April 2018 General Information Country of incorporation and domicile
Strategic report. Corporate governance. Financial statements. Financial statements
 Strategic report Corporate governance Financial statements 76 Statement of Directors responsibilities 77 Independent auditor s report to the members of Tesco PLC 85 Group income statement 86 Group statement
Statutory Auditor s Report
 Statutory Auditor s Report To the General Meeting of Feintool International Holding AG, Lyss Report on the Audit of the Consolidated Financial Statements Opinion We have audited the consolidated financial
Responsibility for external financial reporting
 Responsibility for external financial reporting Management s responsibility Management s report regarding the effectiveness of internal controls over external financial reporting The management of the
CONSOLIDATED ANNUAL FINANCIAL STATEMENTS 2017
 CONSOLIDATED ANNUAL FINANCIAL STATEMENTS 2017 RUN AIRPORTS DEVELOP AIRPORTS GROW OUR FOOTPRINT GENERAL INFORMATION Country of incorporation and domicile South Africa Company registration number 1993/004149/30
ANNUAL FINANCIAL STATEMENTS
 ANNUAL FINANCIAL STATEMENTS FEBRUARY CONTENTS 02 Approval of the Annual Financial Statements 02 Compliance Statement by the Company Secretary 03 Report of the Audit and Risk Committee 06 Social and Ethics
INDEPENDENT AUDITOR S REPORT TO THE MEMBERS OF
 50 CIM FINANCIAL SERVICES LTD INDEPENDENT AUDITOR S REPORT TO THE MEMBERS OF Report on the Audit of the Financial Statements Opinion We have audited the financial statements of CIM Financial Services Ltd
Financial Statements
 Financial Statements Independent Auditor s Report Statements of Financial Position Statements of Profit or Loss Statements of Comprehensive Income Statements of Changes in Equity Statements of Cash Flows
UNQUALIFIED OPINION BY THE INDEPENDENT AUDITOR WITH AN EMPHASIS OF MATTER ON THE FINANCIAL STATEMENTS FOR FINANCIAL YEAR ENDED 31 DECEMBER 2016
 CHINA GAOXIAN FIBRE FABRIC HOLDINGS LTD. ( 中国高纤控股有限公司 ) ("Company") (Company Registration No. 200817812K) (Incorporated in Singapore on 9 September 2008) UNQUALIFIED OPINION BY THE INDEPENDENT AUDITOR
Merafe Resources Limited
 Registration number 1987/003452/06 Audited Annual Financial Statements The following individuals were responsible for the preparation of the annual financial statements: Kajal Bissessor CA(SA) Financial
Independent Auditor s Report to the Shareholders of Keppel Corporation Limited For the financial year ended 31 December 2016
 Financial Report Independent Auditor s Report to the Shareholders of Keppel Corporation Limited For the financial year ended 31 December 2016 Our Opinion In our opinion, the accompanying consolidated financial
INDEPENDENT AUDITOR S REPORT TO THE MEMBERS OF COATS GROUP PLC
 INDEPENDENT AUDITOR S REPORT TO THE MEMBERS OF COATS GROUP PLC Report on the audit of the financial statements Opinion In our opinion: the financial statements give a true and fair view of the state of
Financial Statements, Valuation and Other Information
 Financial Statements, Valuation and Other Information 114 Directors Responsibility for the Financial Statements 115 Independent Auditor s Report 119 Consolidated Statement of Profit or Loss 120 Consolidated
Extracted Independent Auditor s Report of the Audited Financial Statements of Blumont Group Ltd. for the financial year ended 31 December 2017
 Extracted Independent Auditor s Report of the Audited Financial Statements of Blumont Group Ltd. for the financial year ended 31 December 2017 Report on the Audit of the Financial Statements Opinion INDEPENDENT
AO Toyota Bank. Financial Statements for 2017 and Independent Auditors Report
 Financial Statements for 2017 and Independent Auditors Report CONTENTS Independent Auditors Report... 3 Financial Statements Statement of Profit or Loss and Other Comprehensive Income... 9 Statement of
The Shareholders of T.Krungthai Industries Public Company Limited
 REPORT OF CERTIFIED PUBLIC ACCOUNTANT To The Shareholders of T.Krungthai Industries Public Company Limited I have audited the accompanying of financial statements of T.Krungthai Industries Public Company
INDEPENDENT AUDITOR S REPORT TO THE MEMBERS OF THOMAS COOK GROUP PLC
 INDEPENDENT AUDITOR S REPORT TO THE MEMBERS OF THOMAS COOK GROUP PLC REPORT ON THE Our opinion In our opinion: > Thomas Cook Group plc s Group financial statements and parent company financial statements
ALLIANCE MINERAL ASSETS LIMITED (Company Registration Number: ACN ) (Incorporated in the Australia on 6 December 2010)
 (Incorporated in the Australia on 6 December 2010)") ALLIANCE MINERAL ASSETS LIMITED (Company Registration Number: ACN 147 393 735) (Incorporated in the Australia on 6 December 2010) ANNOUNCEMENT PURSUANT TO RULE 704(4) OF THE CATALIST RULES (AS DEFINED
ALLIANCE MINERAL ASSETS LIMITED (Company Registration Number: ACN 147 393 735) (Incorporated in the Australia on 6 December 2010) ANNOUNCEMENT PURSUANT TO RULE 704(4) OF THE CATALIST RULES (AS DEFINED
Financial statements
 89 Independent Auditor s Report to the member of Network Rail Limited 95 Income statement 96 Statement of comprehensive income 97 Statement of changes in equity 98 Balance sheets 99 Statement of cash flows
TOWER PROPERTY FUND Limited consolidated Annual Financial Statements
 TPF CROATIA for the year ended 31 May TOWER PROPERTY FUND Limited consolidated Annual Financial Statements PROPERTY FUND LIMITED Consolidated Annual Financial Statements The reports and statements set
QT VASCULAR LTD. (Company Registration No K) (Incorporated in Singapore)
 (Incorporated in Singapore)") QT VASCULAR LTD. (Company Registration No. 201305911K) (Incorporated in Singapore) ANNOUNCEMENT PURSUANT TO RULE 704(4) OF THE CATALIST RULES (AS DEFINED HEREIN) OF THE SGX-ST (AS DEFINED HEREIN) EMPHASIS
QT VASCULAR LTD. (Company Registration No. 201305911K) (Incorporated in Singapore) ANNOUNCEMENT PURSUANT TO RULE 704(4) OF THE CATALIST RULES (AS DEFINED HEREIN) OF THE SGX-ST (AS DEFINED HEREIN) EMPHASIS
INDEPENDENT AUDITOR S REPORT. To the Shareholders of RICH ASIA CORPORATION PUBLIC COMPANY LIMITED. Opinion
 INDEPENDENT AUDITOR S REPORT To the Shareholders of RICH ASIA CORPORATION PUBLIC COMPANY LIMITED Opinion I have audited the accompanying consolidated and separate financial statements of RICH ASIA CORPORATION
South Africa. IJ Calisto (executive) JR Edmeston (executive) DJ Brown (non-executive) AT Ikalafeng (non-executive) K White (non-executive)
 JR Edmeston (executive) DJ Brown (non-executive) AT Ikalafeng (non-executive) K White (non-executive)") CONSOLIDATED ANNUAL FINANCIAL STATEMENTS 2017 CONSOLIDATED ANNUAL FINANCIAL STATEMENTS GENERAL INFORMATION Country of incorporation and domicile Nature of business and principal activities Directors Registered
CONSOLIDATED ANNUAL FINANCIAL STATEMENTS 2017 CONSOLIDATED ANNUAL FINANCIAL STATEMENTS GENERAL INFORMATION Country of incorporation and domicile Nature of business and principal activities Directors Registered