Management s Discussion and Analysis and Annual Financial Statements
|
|
|
- Amie Tate
- 6 years ago
- Views:
Transcription
1

2 Management s Discussion and Analysis and Annual Financial Statements 31 December 2015 Asian Development Bank
3
4 CONTENTS Management s Discussion and Analysis I. Overview 1 II. Combination of OCR and ADF Resources 1 III. Ordinary Capital Resources 2 A. Basis of Financial Reporting 2 B. Selected Financial Data 3 C. Overall Financial Results 3 D. Operating Activities 6 1. Loans 6 2. Guarantees Syndications Equity Investments Debt Management Products 14 E. Financing Resources Equity Borrowings 16 F. Liquidity Portfolio 19 G. Contractual Obligations 20 H. Risk Management Credit Risk Market Risk Liquidity Risk Operational Risk Capital Adequacy Asset and Liability Management 30 I. Internal Control over Financial Reporting 31 J. Critical Accounting Policies and Estimates 31 IV. Special Funds 32 A. Asian Development Fund 32 B. Technical Assistance Special Fund 36 C. Japan Special Fund 37 D. ADB Institute 37 E. Regional Cooperation and Integration Fund 38 F. Climate Change Fund 38 G. Asia Pacific Disaster Response Fund 39 H. Financial Sector Development Partnership Special Fund 39 V. Grant Cofinancing 39 Appendix: Ordinary Capital Resources Condensed Management Reporting Balance Sheets 42
5 Financial Statements, Management s Report on Internal Control over Financial Reporting, and Independent Auditors Reports I. Ordinary Capital Resources (OCR) Management s Report on Internal Control over Financial Reporting 45 Independent Auditors Report on Internal Control over Financial Reporting 46 Independent Auditors Report on Financial Statements 48 OCR-1 Balance Sheet, 31 December 2015 and OCR-2 Statement of Income and Expenses for the Years Ended 31 December 2015 and OCR-3 Statement of Comprehensive Income (Loss) for the Years Ended 31 December 2015 and OCR-4 Statement of Changes in Equity for the Years Ended 31 December 2015 and OCR-5 Statement of Cash Flows for the Years Ended 31 December 2015 and OCR-6 Summary Statement of Loans, 31 December 2015 and OCR-7 Summary Statement of Borrowings, 31 December 2015 and OCR-8 Statement of Subscriptions to Capital Stock and Voting Power, 31 December OCR-9 Notes to Financial Statements, 31 December 2015 and II. Asian Development Fund (ADF) Management s Report on Internal Control over Financial Reporting 110 Independent Auditors Report on Internal Control over Financial Reporting 111 Independent Auditors Report on Financial Statements 113 ADF-1 Special Purpose Statement of Assets, Liabilities and Fund Balances, 31 December 2015 and ADF-2 Special Purpose Statement of Revenue and Expenses for the Years Ended 31 December 2015 and ADF-3 Special Purpose Statement of Comprehensive Loss for the Years Ended 31 December 2015 and ADF-4 Special Purpose Statement of Changes in Fund Balances for the Years Ended ADF-5 31 December 2015 and Special Purpose Statement of Cash Flows for the Years Ended 31 December 2015 and ADF-6 Special Purpose Summary Statement of Loans, 31 December 2015 and ADF-7 Special Purpose Statement of Resources, 31 December ADF-8 Notes to Special Purpose Financial Statements, 31 December 2015 and III. Technical Assistance Special Fund (TASF) Management s Report on Internal Control over Financial Reporting 135 Independent Auditors Report on Internal Control over Financial Reporting 136 Independent Auditors Report on Financial Statements 138 TASF-1 Statement of Financial Position, 31 December 2015 and TASF-2 Statement of Activities and Changes in Net Assets for the Years Ended 31 December 2015 and TASF-3 Statement of Cash Flows for the Years Ended 31 December 2015 and TASF-4 Statement of Resources, 31 December TASF-5 Summary Statement of Technical Assistance Approved and Effective for the Year Ended 31 December TASF-6 Notes to Financial Statements, 31 December 2015 and
6 IV. Japan Special Fund (JSF) Management s Report on Internal Control over Financial Reporting 152 Independent Auditors Report on Internal Control over Financial Reporting 153 Independent Auditors Report on Financial Statements 155 JSF-1 Statement of Financial Position, 31 December 2015 and JSF-2 Statement of Activities and Changes in Net Assets for the Years Ended 31 December 2015 and JSF-3 Statement of Cash Flows for the Years Ended 31 December 2015 and JSF-4 Notes to Financial Statements, 31 December 2015 and V. Asian Development Bank Institute (ADBI) Independent Auditors Report 165 ADBI-1 Statement of Financial Position, 31 December 2015 and ADBI-2 Statement of Activities and Changes in Net Assets for the Years Ended 31 December 2015 and ADBI-3 Statement of Cash Flows for the Years Ended 31 December 2015 and ADBI-4 Notes to Financial Statements, 31 December 2015 and VI. Regional Cooperation and Integration Fund (RCIF) Management s Report on Internal Control over Financial Reporting 185 Independent Auditors Report on Internal Control over Financial Reporting 186 Independent Auditors Report on Financial Statements 188 RCIF-1 Statement of Financial Position, 31 December 2015 and RCIF-2 Statement of Activities and Changes in Net Assets for the Years Ended 31 December 2015 and RCIF-3 Statement of Cash Flows for the Years Ended 31 December 2015 and RCIF-4 Notes to Financial Statements, 31 December 2015 and VII. Climate Change Fund (CCF) Management s Report on Internal Control over Financial Reporting 198 Independent Auditors Report on Internal Control over Financial Reporting 199 Independent Auditors Report on Financial Statements 201 CCF-1 Statement of Financial Position, 31 December 2015 and CCF-2 Statement of Activities and Changes in Net Assets for the Years Ended 31 December 2015 and CCF-3 Statement of Cash Flows for the Years Ended 31 December 2015 and CCF-4 Notes to Financial Statements, 31 December 2015 and VIII. Asia Pacific Disaster Response Fund (APDRF) Management s Report on Internal Control over Financial Reporting 211 Independent Auditors Report on Internal Control over Financial Reporting 212 Independent Auditors Report on Financial Statements 214 APDRF-1 Statement of Financial Position, 31 December 2015 and APDRF-2 Statement of Activities and Changes in Net Assets for the Years Ended 31 December 2015 and APDRF-3 Statement of Cash Flows for the Years Ended 31 December 2015 and APDRF-4 Notes to Financial Statements, 31 December 2015 and
7 IX. Financial Sector Development Partnership Special Fund (FSDPSF) Management s Report on Internal Control over Financial Reporting Independent Auditors Report on Internal Control over Financial Reporting Independent Auditors Report on Financial Statements FSDPSF-1 Statement of Financial Position, 31 December 2015 and 2014 FSDPSF-2 Statement of Activities and Changes in Net Assets for the Years Ended 31 December 2015 and FSDPSF-3 Statement of Cash Flows for the Years Ended 31 December 2015 and FSDPSF-4 Notes to Financial Statements, 31 December 2015 and
8 MANAGEMENT S DISCUSSION AND ANALYSIS I. OVERVIEW The Asian Development Bank (ADB), a multilateral development bank, was established in 1966 under the Agreement Establishing the Asian Development Bank (the Charter). 1 ADB is owned by 67 members, 48 of which are regional members, including Japan, Australia and New Zealand, providing 63.6% of its capital and 19 non-regional members, including the United States, Canada and 17 European countries, providing 36.4% of its capital. The vision of ADB is of an Asia and Pacific region free of poverty. Its mission is to help its developing member countries (DMCs) reduce poverty and improve living conditions and quality of life. ADB s strategy for reducing poverty focuses on achieving three strategic agendas: inclusive economic growth, environmentally sustainable growth, and regional integration. ADB provides various forms of financial assistance to its DMCs. The main instruments are loans, technical assistance (TA), grants, guarantees, and equity investments. These instruments are financed through ordinary capital resources (OCR), Special Funds, and trust funds. ADB s ordinary operations are financed from OCR and special operations from Special Funds. The Charter requires that funds from each resource be kept and used separately. Trust funds are generally financed by contributions and administered by ADB as the trustee. ADB also offers debt management products to its members and entities fully guaranteed by members such as interest rate swaps and cross currency swaps (including local currency swaps) for their third party liabilities. ADB also provides policy dialogue and advisory services, and mobilizes financial resources through its cofinancing operations, which access official and other concessional, commercial, and export credit sources to maximize the development impact of its assistance. Cofinancing for ADB projects can be in the form of external loans, grants for TA and components of loan projects, equity, and credit enhancement products such as guarantees and syndications. II. COMBINATION OF OCR AND ADF RESOURCES On 29 April 2015, the Board of Governors adopted the resolution authorizing the termination of the lending operations of the Asian Development Fund (ADF), the concessional lending window of ADB, and the transfer of ADF loans and certain other assets to OCR effective 1 January The new initiative will expand ADB s lending capacity particularly to poor countries and the private sector, enhance ADB s risk-bearing capacity, and strengthen its readiness to respond to future economic crises and natural disasters. Currently, OCR loans are provided to middle-income countries at market-based rates. After the transfer, lower income countries currently eligible for ADF loans will continue to receive concessional loans from the expanded OCR on the same terms and conditions as current ADF loans, and the ADF will be retained as a grant-only operation providing assistance to eligible countries. 1 ADB Agreement Establishing the Asian Development Bank. Manila.
9 2 III. ORDINARY CAPITAL RESOURCES Funding for OCR operations comes from three distinct sources: funds borrowed from capital markets and private placements, paid-in capital provided by shareholders, and accumulated retained income (reserves). The financial strength of ADB is based on the support it receives from its shareholders and on its financial policies and practices; shareholder support is reflected by capital subscriptions of members and the record of ADB borrowing members in meeting their debt service obligations. Borrowed funds, together with equity, are used to fund OCR lending and investment activities and other general operations. ADB is rated triple-a by the major rating agencies and its bonds are viewed as high quality debt by investors. ADB s funding strategy is aimed at ensuring availability of funds for its operations at the most stable and lowest possible cost. Such strategy has enabled ADB to achieve cost-efficient funding levels for its borrowing members. Loans are generally provided to DMCs that have attained higher economic development and to nonsovereign borrowers. Sovereign loans are priced on a cost pass-through basis, which means the cost of funding the loans plus a contractual spread is passed to the borrowers. ADB applies market-based pricing for nonsovereign loans. In addition to direct lending, ADB also provides guarantees to assist DMC governments and nonsovereign borrowers in securing commercial funds for ADB-assisted projects. A. Basis of Financial Reporting Statutory reporting. ADB prepares OCR financial statements in accordance with accounting principles generally accepted in the United States of America (US GAAP), referred to in this document as the statutory reporting basis. ADB manages its balance sheet by selectively using derivatives to minimize interest rate and currency risks associated with its financial instruments. Derivatives are used to enhance asset and liability management of individual positions and overall portfolios. ADB has elected not to define any qualifying hedging relationships, not because economic hedges do not exist, but rather because the application of hedging criteria under US GAAP does not make fully evident ADB s risk management strategies. ADB reports all derivative instruments on the balance sheet at fair value and recognizes the changes in fair value for the period as part of net income. ADB also elects to measure financial instruments at fair value on a selective basis and opts to measure at fair value all derivatives and selected borrowings that are swapped or have floating interest rates, in order to generally apply a consistent accounting treatment between the borrowings and their related swaps. ADB continues to report its loans and the remaining borrowings at amortized cost, and reports most of its investments (except time deposits that are recorded at cost) at fair value. Management reporting. The asymmetric accounting treatment in which certain financial instruments (including all derivatives, swapped and floating-rate borrowings, and certain investments) are recorded at their fair value, while loans and a portion of borrowings and investments are recorded at amortized cost leads ADB Management to believe that statutory income may not fully reflect the overall economic value of ADB s financial position. Accordingly, ADB also reports operating income, which excludes the impact of the fair value adjustments associated with financial instruments from the results of OCR operations. ADB uses operating income as the key measure to manage its financial position, make financial management decisions, and monitor financial ratios and parameters. ADB MANAGEMENT S DISCUSSION AND ANALYSIS: 31 DECEMBER 2015
10 Operating income does not include unrealized gains or losses of the portfolio. The unrealized gains or losses, although an important indicator of the portfolio performance, generally represent changes in income as a result of fluctuations in the fair value of selected borrowings and derivatives. Because ADB does not actively trade these financial instruments, such gains or losses are generally not realized, unless ADB is forced to do so by risk events before maturity. ADB has instituted conservative risk management policies to mitigate such risks. Because ADB intends to hold most borrowings and related swaps until maturity or call, the interim unrealized gains and losses reported under the statutory reporting basis will eventually converge with the net realized income and expenses that ADB recognizes over the life of the financial instrument. The management reporting basis balance sheet reconciled from the statutory reporting basis balance sheet as of 31 December 2015 is provided in the Appendix. 3 B. Selected Financial Data Selected financial data are presented on a statutory reporting basis and management reporting basis (Table 1). Rates of return on equity and earning assets under the management reporting basis decreased in 2015 compared with 2014, mainly as a result of lower operating income brought about by the significant decrease in divestment gains. While return on investments remained stable, increases in the rate of return on loans and cost of borrowings were consistent with the applicable market interest rate trend (Table 2) and portfolio composition. Income and expenses are discussed in the next section. C. Overall Financial Results Net income. Table 3 presents the overall financial results for Net income was $556 million, compared with $387 million for The increased net income from 2014 is mainly attributed to the unrealized gains from ADB s borrowings and associated derivatives. ADB MANAGEMENT S DISCUSSION AND ANALYSIS: 31 DECEMBER 2015
11 4 Table 1: Selected Financial Data for the Year Ended 31 December ($ million) Item Statutory Reporting Basis Revenue From Loans From Investments From Guarantees From Equity Investments (19) From Other Sources Total Revenue 1, ,035 1,238 1,095 Borrowings and Related Expenses Administrative Expenses a (Write-back) Provision for Loan Losses (1) (1) (6) 7 (7) Other Expenses Total Expenses Net Realized Gains Net Unrealized Gains (Losses) 239 (193) 150 (331) 6 Net Income Average Earning Assets b 85,227 80,633 78,828 76,361 69,112 Annual Return on Average Earning Assets (%) Return on Equity (%) Return on Loans (%) Return on Investments (%) Cost of Borrowings (%) Management Reporting Basis Operating Income c Average Earning Assets b 85,227 80,639 78,839 76,386 69,099 Annual Return on Average Earning Assets d (%) Return on Equity (%) Return on Loans (%) Return on Investments (%) Cost of Borrowings (%) ( ) = negative. Net of administrative expenses allocated to the Asian Development Fund and loan origination costs that are deferred. Average of investments and related swaps, outstanding loans (excluding net unamortized loan origination cost and/or front-end fees) and related swaps and equity investments. Operating income is defined as statutory net income before unrealized gains or losses and the Asian Development Bank s proportionate share in unrealized gains or losses from equity investment accounted for under the equity method. Represents operating income over average earning assets. a b c d Table 2: Selected US Dollar Interest Rates at 31 December (%) Item Month US Dollar LIBOR Year US Dollar Swap Rate LIBOR = London interbank offered rate, US = United States. Source: Bloomberg Finance L.P. ADB MANAGEMENT S DISCUSSION AND ANALYSIS: 31 DECEMBER 2015
12 5 Table 3: Overall Financial Results for the Year Ended 31 December ($ million) Item Change Income from loans Interest income Write-back for loan losses Others 4 7 (3) Income from investments Interest income Realized gain (4) Income from equity investments (227) Profit on sale net of impairment losses (229) Proportionate share of loss from EI accounted for under the equity method realized (1) (6) 5 Others 8 11 (3) Other income net a (1) Borrowings and related expenses Interest and other expenses Realized gain (1) (1) Administrative expenses OCR Operating income (228) Net unrealized gains (losses) 239 (193) 432 Proportionate share of (loss) income from EI accounted for under the equity method unrealized (26) 9 (35) Net income = nil, ( ) = negative, EI = equity investments, OCR = ordinary capital resources. Note: 0 = amount less than $0.5 million. a Includes income and related expenses from guarantees and income from trust funds administration. Operating income. Operating income in 2015 decreased to $343 million, from $571 million in The change in operating income was primarily driven by: (i) $227 million decrease in income from equity investments, mainly due to lower gain from divestment of equity investments; (ii) $56 million increase in borrowings and related expenses resulting largely from increase in average outstanding borrowings, as well as higher market interest rates; and (iii) $31 million increase in administrative expenses. These were partially offset by: (iv) $74 million increase in income from loans due to increase in average outstanding loans, higher interest rates and discontinuation of the lending spread waiver on selected sovereign loans; and (v) $13 million increase in income from investments due mainly to the larger portfolio. 2 Operating income is defined as statutory net income before unrealized gains or losses and ADB s proportionate share in unrealized gains or losses from equity investment accounted for under the equity method. ADB MANAGEMENT S DISCUSSION AND ANALYSIS: 31 DECEMBER 2015
13 6 Net unrealized gains and losses. During 2015, ADB reported net unrealized gains of $239 million (2014: $193 million net unrealized losses), which primarily consisted of fair value adjustments on certain borrowings and derivatives used for hedging borrowings, investments and loans. For 2015, large portion of the movements in fair value resulted in net unrealized gains of $244 million (2014: net unrealized losses of $205 million) from borrowings and related swaps, reflecting the movements in ADB s credit spreads and interest rates. D. Operating Activities ADB provides financial assistance under its ordinary operations to its DMCs through loans, TA, guarantees and equity investments to help them meet their development needs. ADB also promotes cofinancing of its projects and programs to complement its assistance with funds from official and commercial sources, including export credit agencies. ADB also provides debt management products to its members and member-guaranteed entities for their third party liabilities. 1. Loans ADB is authorized under the Charter to make, participate in or guarantee loans to its DMCs, to any of their agencies, instrumentalities or political subdivisions, and to any entities or enterprises operating within such countries, as well as to international or regional agencies or entities concerned with the economic development of the region. Such loans are made only for projects or programs of high developmental priority. ADB s lending limitation policy limits the total amount of disbursed loans, disbursed equity investments and related prudential buffer, and the maximum amount that could be demanded from ADB under its guarantee portfolio, to the total amount of ADB s unimpaired subscribed capital, reserves, and surplus, exclusive of the special reserve. As of 31 December 2015, the total of such loans, equity investments and related prudential buffer, and guarantees was $63,042 million (2014: $57,126 million), compared with the maximum lending ceiling of $159,136 million, which resulted in a headroom of $96,094 million (2014: $107,960 million). ADB s projects undergo an evaluation and approval process that includes such factors as economic, social, environmental, technical, institutional and financial feasibility, effect on the general development activity of the country concerned, contribution to economic development, capacity of the borrowing country to service additional external debt, effect on domestic savings, balance of payments effects, impact of new technologies on productivity, and expansion of employment opportunities. Except in special circumstances, ADB requires that the proceeds of its loans and equity investments and the proceeds of the loans it guarantees be used only for procurement of goods and services produced in and supplied from member countries. Loan disbursements must comply with the requirements specified in loan agreements. ADB s staff review progress and monitor compliance with ADB policies. ADB s Independent Evaluation Department, reporting directly to ADB s Board of Directors, evaluates the development effectiveness of ADB s operations. ADB offers the multitranche financing facility (MFF), a debt financing facility that delivers financial resources for a program or investment in a series of separate financing tranches over a fixed period. Financing tranches may be provided as loans, guarantees, or any combination of these instruments based on periodic financing requests (PFRs) submitted by the borrower. ADB MANAGEMENT S DISCUSSION AND ANALYSIS: 31 DECEMBER 2015
14 In 2011, ADB reviewed its policy-based lending and enhanced the program lending policy by mainstreaming programmatic budget support and enhancing crisis response capacity. Consequently, ADB offers four policy-based lending products, each catering to a different situation in a DMC: stand-alone policy-based lending, programmatic approach, special policybased lending, and countercyclical support facility (CSF) lending. In April 2011, ADB established the project design facility (PDF) on a pilot basis to support project preparation, particularly detailed engineering designs, through project design advances (PDA). The facility is designed to be refinanced from the proceeds of the ADB loan for the ensuing project. The pilot period has been extended for 3 years (until 31 December 2017). In March 2013, the Board of Directors approved piloting results-based lending (RBL). This modality will support government-owned sector programs and disburse ADB financing based on program results. Loan terms under RBL are the same as for investment projects. Nonsovereign operations. ADB provides lending without sovereign guarantee to privately-held or state-owned or subsovereign entities. In its nonsovereign operations, ADB provides financial assistance on market-based terms and conditions to provide investment capital. ADB s nonsovereign operations primarily focus on two of the core areas of operations identified in Strategy 2020, namely infrastructure (with particular emphasis on energy) and finance. Strategic interventions focus on renewable energy and other infrastructure sectors. ADB s participation is meant to catalyze or bring about financing from other sources both local and foreign and not to compete with these sources. ADB cannot be the largest single investor in an enterprise. As needed, ADB will help mobilize additional debt from commercial banks, other development institutions, and financing partners. Loan approvals, disbursements, repayments, and prepayments. In 2015, approved loans totaled $12,941 million, representing a $2,708 million increase from 2014 ($10,233 million). 3 ADB approved 60 sovereign loans totaling $10,791 million, including one PDA loan for $3 million (2014: nil) and 24 nonsovereign loans totaling $2,150 million, compared with 2014 approvals of 56 sovereign loans totaling $8,520 million and 28 nonsovereign loans totaling $1,713 million. In 2015, MFFs totaling $1,224 million (2014: $2,532 million) were approved under OCR. 4 Under the MFFs, PFRs totaling $2,910 million were approved in 2015 (2014: $2,952 million); a total of $2,149 million was disbursed in 2015 (2014: $2,210 million). In 2015, ADB approved three OCR loans totaling $1,025 million under RBL (2014: three loans amounting $450 million); and disbursed a total of $193 million (2014: $58 million). Disbursements in 2015 totaled $9,667 million ($8,223 million for sovereign loans and $1,444 million for nonsovereign loans), an increase of 31% from the $7,368 million disbursed in 2014 ($6,280 million for sovereign loans and $1,088 million for nonsovereign loans). Regular principal repayments in 2015 were $3,325 million (2014: $3,989 million), while prepayments totaled $154 million (2014: $317 million). In 2015, four loans were fully prepaid for $127 million, and four loans were partially prepaid for $27 million. As of 31 December 2015, loans outstanding after allowance for loan losses and net unamortized loan origination cost totaled $61,941 million, of which sovereign loans represented $57,555 million and nonsovereign loans $4,386 million. 7 3 These exclude adjustments prior to signing. 4 These amounts may be adjusted based on flexibility in the use of OCR and ADF funding. ADB MANAGEMENT S DISCUSSION AND ANALYSIS: 31 DECEMBER 2015
15 8 A summary of the outstanding loan commitments by member country as of 31 December 2015 is set forth in OCR-6 of the Financial Statements. A breakdown by sector of loans as of 31 December 2015 is shown in Table 4. Table 4: Sectoral Breakdown of Total OCR Loans a As of 31 December 2015 Sector $ million % Transport 35, % Energy 22, % Public Sector Management 9, % Water and Other Urban Infrastructure and Services 9, % Finance 8, % Agriculture, Natural Resources and Rural Development 5, % Multi-Sector 2, % Education 2, % Health % Industry and Trade % Information and Communication Technology % Total 97, % a Includes outstanding loans, undisbursed effective loans and approved loans that are not yet effective. Note: Numbers and percentages may not sum precisely because of rounding. The majority of outstanding loans (92.8%) have been made to the public sector (member countries and, with the guarantee of the concerned member, government agencies or other public entities) (Table 5). The rest have been made to private sector enterprises, financial institutions, and selected nonsovereign public sector entities. Table 5: Loan Status at 31 December 2015 and 2014 ($ million) Outstanding Undisbursed 2015 % 2014 % 2015 % 2014 % Sovereign 57, % 52, % 24, % 24, % Nonsovereign 4, % 3, % 1, % 1, % Total Loans 61, % 55, % 25, % 26, % Status of loans. No loans were in nonaccrual status as of 31 December 2015 and Lending windows. ADB s currently available lending windows are the LIBOR-based loan (LBL) window and the local currency loan (LCL) window. The LBL has been the primary lending facility for OCR sovereign operations since The LBL is designed to meet demand by borrowers for loan products that suit project needs and effectively manage their external debt. The LBL also gives borrowers a high degree of flexibility in managing interest rate and exchange rate risks, while providing low intermediation risk to ADB. ADB has offered LCLs to nonsovereign borrowers since November 2002, and this was expanded to sovereign borrowers in August Discontinued lending windows. With the introduction of the LBL in July 2001, ADB s poolbased single currency loans (PSCL), market-based loans, and fixed-rate multicurrency loans were no longer offered. ADB MANAGEMENT S DISCUSSION AND ANALYSIS: 31 DECEMBER 2015
16 A breakdown of ADB s loan portfolio by loan product as of 31 December 2015 and 2014 is presented in Table 6. Table 6: Loan Portfolio by Lending Windows as of 31 December 2015 and 2014 ($ million) Sovereign Nonsovereign LIBOR-based loans Outstanding 54,586 48,714 3,534 2,779 Undisbursed 24,334 24,250 1,334 1,588 Local currency loans Outstanding Undisbursed Others Outstanding 2,781 3,404 Undisbursed Total Outstanding 57,432 52,239 4,457 3,606 Undisbursed 24,334 24,250 1,577 1, = nil, LIBOR = London interbank offered rate. Sovereign loan charges. LBLs and loans approved under the CSF carry a floating lending rate that comprises a funding cost margin over or under the 6-month LIBOR and an effective contractual spread. LCLs may be made on a floating rate basis, and typically reset every 6 months. The cost-base rate of an LCL is based on back-to-back or a pool-based funding. The lending rate is reset every 6 months on each interest reset date and can be converted into a fixed rate at the request of the borrower. The lending rates for PSCLs are based on the previous semester s average cost of borrowing. Interest rates for market-based loans are either fixed or floating. The floating rates are determined based on the 6-month LIBOR, with reset dates of 15 March and 15 September or 15 June and 15 December. OCR loans under PDF carry standard OCR lending rates. Payment of interest is deferred until the PDA is refinanced out of the loan proceeds or other repayment terms take effect. A commitment charge is levied on the undisbursed loans beginning 60 days after signing of the applicable loan agreement; charges begin to accrue when the loan becomes effective, except for PDAs where commitment charges start to accrue after two years from the date the PDA agreement is signed. Lending spread. Effective in 2000, all sovereign loans without specific provisions in the loan agreements were charged a lending spread of 60 basis points over the base lending rate. ADB MANAGEMENT S DISCUSSION AND ANALYSIS: 31 DECEMBER 2015
17 10 Starting in 2004, ADB provided a 20 basis points waiver on the lending spread for borrowers or guarantors that have no OCR loans in arrears under ADB sovereign operations. 5 The waiver for the applicable loans is reviewed annually. In December 2014, the Board of Directors approved the continuation of this waiver 6 for borrowers of US dollar PSCL covering interest periods commencing from 1 January 2015 to 31 December In November 2015, the Board approved extending this waiver to 31 December In 2015, the total waiver provided on the lending spread was $6 million (2014: $20 million). In December 2007, the ADB Board of Directors approved a revision to the pricing structure for all LBLs and LCLs negotiated on or after 1 October 2007, eliminating the waiver mechanism and provided a credit of 0.4% for the duration of the loan. This resulted in an effective contractual spread of 20 basis points over the base lending spread. The Board of Directors subsequently revised the loan charges, where for LBLs and LCLs (i) negotiated from 1 July 2010 up to and including 30 June 2011, that the credit of 0.4% be reduced to 0.3% for the duration of the loan, to result in a contractual spread of 0.3% over the base lending rate; and (ii) negotiated from 1 July 2011, that the credit of 0.4% be reduced to 0.2% for the duration of the loan. This resulted in a contractual spread of 0.4% over the base lending rate. In December 2013, the Board of Directors approved a revision to the loan pricing for all LBLs and LCLs negotiated on or after 1 January 2014, reducing the credit of 0.2% to 0.1% for the duration of the loan. This resulted in a contractual spread of 0.5% over the base lending rate. The loans approved under the CSF carry a lending spread of 200 basis points over the base lending rate. Maturity premium. In December 2011, the Board of Directors approved the introduction of maturity premiums for all LBLs (other than PDF loans) and LCLs for which formal loan negotiations were completed on or after 1 April 2012 of: (i) 10 basis points per annum on loans with an average loan maturity of greater than 13 years and up to 16 years, and (ii) 20 basis points per annum on loans with an average loan maturity of greater than 16 years and up to 19 years. ADB also introduced a limit on the average loan maturity for new loans to not exceed 19 years. As of 31 December 2015, 141 approved loans totaling $21,023 million were subject to maturity premium (2014: 107 approved loans totaling $16,560 million). Rebates and surcharges. To maintain the principle of the cost pass-through pricing policy, ADB passes on the actual funding cost margin above or below LIBOR to its borrowers through a surcharge or rebate (Table 7). The funding cost margins are reset semi-annually (on 1 January and 1 July), and are based on the actual average funding cost margin for the preceding 6 months. The rebates or surcharges are passed on to borrowers by incorporating them into the interest rate for the succeeding interest period. ADB returned a sub-libor funding cost margin of $75 million to its LBL borrowers in 2015 (2014: $70 million), no surcharge were collected on CSF loans in 2015 (2014: $2 million). 5 Applicable for sovereign loans negotiated before 1 October This applies to borrowers or guarantors that do not have any OCR loans in arrears under ADB s sovereign operations. ADB MANAGEMENT S DISCUSSION AND ANALYSIS: 31 DECEMBER 2015
18 11 Table 7: Funding Cost Margin on LIBOR-based Loans a (% per year) (Rebate) or Surcharge Type 1 July January July January 2014 LIBOR-based Loans US dollar (0.12) (0.15) (0.15) (0.16) Yen (0.46) (0.42) (0.34) (0.31) New Zealand dollar CSF Loans US dollar n/a b n/a b ( ) = negative, n/a = not applicable, CSF = Countercyclical Support Facility, LIBOR = London interbank offered rate, US = United States. a Funding cost margins are announced on 1 January and 1 July and are valid for 6 months. b Disbursements under CSF for 2015 w ere made only in December. Lending rates for PSCLs are based on the previous semester s average cost of borrowing (Table 8) and carry a lending spread of 60 basis points. Table 8: PSCL Lending Rates a (% per year) Currency 1 January US dollar b Yen 1 July US dollar b Yen PSCL = pool-based single currency loan, US = United States. a Lending rates are set semi-annually on 1 January and 1 July and are valid for 6 months. b Net of 20 basis points lending spread waiver. Commitment charge. ADB borrowers are charged commitment fees on the undisbursed loan balances for sovereign LBLs. The charges differ depending on when the loan was negotiated (Table 9). Table 9: Commitment Fees (% per year) Project Policy-based Results-based Date loans loans lending loans Negotiated on or before 1 January 2007, with undisbursed balance as of 1 January a n/a Waiver n/a n/a Net 0.75 n/a Negotiated after 1 January 2007 and before 1 October n/a Waiver (0.10) b n/a n/a Net 0.25 n/a n/a Negotiated on or after 1 October ( ) = negative, n/a = not applicable. a Progressive. b Applicable to all interest periods from 1 January 2007 to 31 December ADB MANAGEMENT S DISCUSSION AND ANALYSIS: 31 DECEMBER 2015
19 12 Nonsovereign loan charges. For nonsovereign loans, ADB applies market-based pricing to determine the lending spread, front-end fees, and commitment charges for each loan. The lending spread is intended to cover ADB s risk exposure to specific borrowers and projects and the front-end fee to cover the administrative costs incurred in loan origination. Front-end fees are typically 1% to 1.5% depending on the transaction. ADB applies a commitment fee (typically 0.50% to 0.75% per year) on the undisbursed commitment. LCLs are priced based on relevant local funding benchmarks or ADB s funding costs and a market-based spread. Direct value-added official loan cofinancing. In 2015, $5,296 million from official sources was mobilized for loan cofinancing for 33 loan projects, of which $297 million is under ADB administration and $4,999 million is under collaborative arrangements. (Refer to Note F of OCR Financial Statements for loans administered by ADB as of 31 December 2015). 2. Guarantees Guarantees are typically designed to facilitate cofinancing by mitigating the risk exposure of commercial lenders and capital market investors. Guarantees can be provided when ADB has a direct or indirect participation in a project or a related sector, through a loan, equity investment or technical assistance, ADB provides two primary guarantee products a credit guarantee and a political risk guarantee. ADB s credit guarantee is designed as credit enhancements for eligible projects to cover risks that the project and its commercial cofinancing partners cannot easily absorb or manage on their own. ADB also provides political risk guarantees to cover specifically defined political risks. Reducing these risks can make a significant difference in mobilizing debt funding for projects. ADB has used its guarantee instruments successfully for infrastructure projects, financial institutions, capital markets, and trade finance. These instruments generally are not recognized in the balance sheet and have off-balance-sheet risks. For guarantees issued and modified after 31 December 2002, ADB recognizes at the inception of a guarantee the noncontingent aspect of its obligations. In 2015, ADB approved two new guarantee facilities and an additional approval to one existing facility totaling $341 million (2014: one guarantee amounting $20 million). ADB s exposure on guarantees as of 31 December 2015 and 2014 are shown in Table 10. Table 10: Outstanding Guarantee Exposure As of 31 December 2015 and 2014 ($ million) Item Credit guarantee Trade related Non-Trade related Political risk guarantee Total 1,407 1,740 ADB MANAGEMENT S DISCUSSION AND ANALYSIS: 31 DECEMBER 2015
20 Trade Finance Program. The Trade Finance Program (TFP), which started operations in 2004, comprises of three products: (i) a credit guarantee facility, under which ADB issues guarantees to participating international and regional banks to guarantee payment obligations issued by an approved DMC and/or local banks in selected DMCs; (ii) a revolving credit facility, under which ADB provides trade-related loans to DMC banks in support of DMC companies export and import activities; and (iii) a risk participation agreement, under which ADB shares risk with international banks to support and expand trade in challenging and frontier markets. The credit guarantee and risk participation agreement are unfunded products, while the revolving credit facility is funded. In 2015, TFP supported $2,548 million (2014: $3,829 million) in trade through 49 DMC banks in 13 different countries. Of the trade supported, $1,133 million was financed by ADB (2014: $1,789 million) and $1,415 million was cofinanced (2014: $2,039 million). TFP transactions have average maturities of less than 180 days which enabled the TFP to revolve its $1 billion limit in 2015 to finance a total of $1,133 million of guarantees and loans. As of 31 December 2015, TFP guarantees outstanding totaled $525 million (2014: $723 million) and loans outstanding totaled $16 million (2014: $12 million). Adding TFP unused commitments of $276 million, total TFP gross exposure against its $1 billion Board approved limit (which applies at any one point in time) was $817 million, net of risk distribution was $683 million. Supply Chain Finance Program. In 2012, ADB established the Supply Chain Finance Program totaling $200 million to provide guarantees and loans (both without government guarantee) through partner financial institutions to support payments to suppliers and distributors of goods in DMCs. In 2015, the program provided guarantees of $46 million (2014: nil) and the outstanding guarantee amount as of 31 December 2015 was $22 million (2014: nil). 3. Syndications Syndications refer to the pooling of financing and sharing of risk among financiers. It enables ADB to mobilize cofinancing by transferring some or all of the risks associated with its loans and guarantees to other financing partners. 7 Thus, syndications decrease and diversify the risk profile of ADB s financing portfolio. Syndications may be on a funded or unfunded basis, and they may be arranged on an individual, portfolio, or any other basis consistent with industry practices. Under this activity, in 2015, $1,085 million of B-loans were approved for eight projects (2014: $863 million for eight projects) Depending on whether ADB retains risk or not, ADB may or may not have a contingent liability. 8 A B-loan is a tranche of a direct loan nominally advanced by ADB, subject to eligible financial institutions taking funded risk participation within such a tranche and without recourse to ADB. It complements an A-loan funded by ADB. B-loan figures for 2014 and 2015 include US dollar and local currency complementary loans. ADB MANAGEMENT S DISCUSSION AND ANALYSIS: 31 DECEMBER 2015
21 14 4. Equity Investments The Charter allows the use of OCR for equity investments up to 10% of ADB s unimpaired paidin capital actually paid up at any given time together with reserves and surplus, excluding special reserves. At the end of 2015, the total equity investment portfolio for OCR, including prudential buffers, totaled $1,187 (2014: $1,316 million), or about 67% (2014: 76%) of the ceiling defined by the Charter. In 2015, ADB approved four equity investments totaling $134 million (2014: eight equity investments totaling $175 million 9 ). Equity investments disbursements in 2015 totaled $124 million, a 33% decrease from the $184 million (footnote 9) in 2014, and received a total of $74 million from capital distributions and divestments, whether in full or in part, in 22 projects. The divestments were carried out in a manner consistent with good business practices, after ADB s development role in its investments had been fulfilled, and without destabilizing the companies. 5. Debt Management Products ADB offers debt management products to members and entities fully guaranteed by members in relation to their third-party liabilities. Debt management products offered by ADB include currency swaps, including local currency swaps, and interest rate swaps. While currency swaps include the possibility of members or guaranteed entities transforming a foreign currency liability into a local currency liability, the reverse transformation of a local currency liability into a foreign currency liability is not offered. E. Financing Resources ADB s ordinary operations are financed from ADB s OCR, which consist primarily of its subscribed capital stock, proceeds from its borrowings, and funds derived from its ordinary operations. 1. Equity As of 31 December 2015, ADB had 67 members with Japan and the United States as the two largest shareholders. Out of the 67 members, 27 members are non-borrowing members holding 66.7% of total shareholdings with a total voting power of 61.4%. The capital subscription of all ADB members is shown in OCR-8 of the Financial Statements. The total authorized capital of ADB was 10,638,933 shares valued at $147,547 million as of 31 December The details of ADB s equity as of 31 December 2015 and 2014 are shown in Table Excluding approval and disbursement for Compulsory Convertible Debentures, reported as Investment in other securities, of $10 million and $6 million respectively. ADB MANAGEMENT S DISCUSSION AND ANALYSIS: 31 DECEMBER 2015
22 15 Table 11: Details of Equity ($ million) Subscribed 147, ,056 Less: Callable capital subscribed 139, ,376 Paid-in capital subscribed 7,374 7,680 Less: Other adjustments a ,293 7,229 Add: Reserves, Surplus, Accumulated Net Income and Other Comprehensive Loss b less nonnegotiable, noninterest-bearing demand obligations on account of subscribed capital and net notional amounts required to maintain value of currency holdings 10,153 9,709 Total Equity 17,446 16,938 a Comprises $81 million (2014: $84 million) of capital transferred to the Asian Development Fund and discount, and $367 million of paid-in capital subscription installments not yet due in (See OCR-9 of the Financial Statements, Note L). b For a description of reserves, see OCR-9 of the Financial Statements, Note M. Total shareholders equity increased from $16,938 million as of 31 December 2014 to $17,446 million as of 31 December This was primarily the result of (i) the demand notes encashment totaling $257 million; (ii) net income for the year of $556 million; offset by (iii) $180 million transfers to other Special Funds; and (iv) a $128 million increase in other comprehensive loss due to unfavorable currency translation adjustments, fair value changes in available for sale investments, and actuarial losses. Callable capital. Callable capital can be called only if required to meet ADB s obligations incurred on borrowings or guarantees under OCR. No call has ever been made on ADB s callable capital. Paid-in capital. ADB s paid-in capital may be freely used in its ordinary operations, except that DMCs have the right under the Charter to restrict the use of a portion of their paid-in capital to making payments for goods and services produced and intended for use in their respective territories. (See OCR-9 of the Financial Statements, Note C). The Charter authorizes the Board of Governors, by a vote of two-thirds of the total number of Governors representing at least three-quarters of the total voting power of the members, to set aside to Special Funds up to 10% of ADB s unimpaired capital paid-in by members. (See IV Special Funds). As of December 31, 2015, a total of $66 million (0.9% of unimpaired paid-in capital) had been set aside and transferred to the ADF, one of ADB s Special Funds. Allocation of OCR net income. In accordance with Article 40 of the Charter, the Board of Governors annually approves the allocation of the previous year s net income to reserves and/or surplus. In addition, to the extent feasible, it approves the transfer of part of net income to Special Funds to support development activities in the DMCs. ADB MANAGEMENT S DISCUSSION AND ANALYSIS: 31 DECEMBER 2015
23 16 In May 2015, the Board of Governors approved the following with respect to ADB's 2014 net income of $366 million, after appropriation of guarantee fees to special reserve: (i) $183 million representing the Accounting Standards Codification (ASC) 815/825 adjustments and the unrealized portion of net income from equity investments accounted for under the equity method for the year ended 31 December 2014, be added from the Cumulative Revaluation Adjustments account; (ii) $15 million representing the adjustment to the Loan Loss Reserve as of 31 December 2014, be added from the loan loss reserve to the net income; (iii) $384 million be allocated to the Ordinary Reserve; (iv) $120 million be allocated to ADF; (v) $40 million be allocated to Technical Assistance Special Fund (TASF); and (vi) $20 million be allocated to Asia Pacific Disaster Response Fund (APDRF). 2. Borrowings General Borrowing Policies. Under the Charter, ADB may borrow only with the approval of the country in whose market ADB s obligations are to be sold and the member in whose currency such obligations are to be denominated. ADB must also obtain the approvals of the relevant countries so that the proceeds of its borrowings may be exchanged for the currency of any member without restriction. The Charter also requires ADB, before determining to sell its obligations in a particular country, to consider the amount of previous borrowings in that country, the amount of previous borrowings in other countries, and the availability of funds in such other countries, giving due regard to the general principle that its borrowings should to the greatest extent possible be diversified as to country of borrowing. ADB s borrowing policy limits ADB s gross outstanding borrowings to no more than the sum of callable capital of non-borrowing members, paid-in capital, and reserves (including surplus). Based on such policy, the sum of such capital and reserves as of 31 December 2015 was $112,755 million ($116,741 million in 2014). The aggregate of ADB s gross outstanding borrowings of $68,965 million as of 31 December 2015 (2014: $63,676 million) was equivalent to 61% (55% in 2014) of such ceiling. Funding Operations. ADB raises funds for its ordinary operations through the issue and sale of debt obligations in the international capital markets (including by means of private placements) and from official sources, as conditions permit. ADB s primary borrowing objective is to ensure the availability of funds for its operations at the most stable and lowest possible cost. Subject to this objective, ADB seeks to diversify its funding sources across markets, instruments, and maturities. In 2015, ADB continued to employ a strategy of issuing liquid benchmark bonds to maintain its strong presence in key currency bond markets, and raising funds through opportunistic financing and private placements, such as retail-targeted transactions and structured notes, which provide ADB with cost-efficient funding levels funding operations. In 2015, ADB raised the equivalent of $18,948 million (2014: $14,249 million) in medium- and long-term funds with 56 borrowing transactions. The new borrowings were raised in 11 currencies: Australian dollar, Brazilian real, Canadian dollar, yuan, Euro, Georgian lari, Japanese yen, New Zealand dollar, South African rand, Turkish lira, and US dollar. Proceeds of the 2015 borrowings were swapped into US dollar floating-rate liabilities, except for one local currency note which remained in local currency. The average maturity to first call date of these borrowings is 4.7 years (2014: 4.3 years). Of the 2015 borrowings, $16,666 million was raised through 26 public offerings, including five US dollar global benchmark bonds totaling $9,250 million. The remaining $2,282 million was raised through 30 private placements. ADB MANAGEMENT S DISCUSSION AND ANALYSIS: 31 DECEMBER 2015
24 Among the highlights of ADB s capital markets activities in 2015 were the issuances of its inaugural green bond issue of $500 million, its inaugural Georgian lari bond amounting to GEL 100 million ($49.3 million equivalent), and a Canadian dollar maple issue amounting to C$500 million ($399 million equivalent). In addition, ADB undertook dual issues in the Australian dollar market comprising of a new issue of A$700 million ($569 million equivalent) and a tap of A$350 million ($284 million equivalent). This was followed by another tap of A$500 million ($365 million equivalent). ADB continued to issue thematic bonds, raising $177 million equivalent from its sale of water bonds. ADB also raised $4,082 million ($2,420 million in 2014) of short-term funds under its Euro- Commercial Paper Program (ECP). Of the ECPs issued in 2015, $1,317 million were outstanding as of 31 December Table 12 shows details of 2015 borrowings as compared with Table 12: Borrowings ($ million) Item Long Term Total Principal Amount 18,948 14,249 Average Maturity to First Call (years) Average Final Maturity (years) Number of Transactions Public Offerings Private Placements Number of Currencies (before swaps) Public Offerings 5 8 Private Placements 9 7 Short Term a Total Principal Amount b 4,082 2,420 Number of Transactions Number of Currencies 1 3 a All euro commercial papers. b At year-end, the outstanding principal amount was $1,317 million in 2015 ($475 million in 2014). 17 Use of derivatives. ADB undertakes currency and interest rate swaps to cost-efficiently and on a fully hedged basis raise the currencies needed for its operations, while maintaining its borrowing presence in major capital markets. Figures 1 and 2 show the effects of swaps on the currency composition and interest rate structure of ADB s outstanding borrowings as of 31 December Interest rate swaps are also used for asset and liability management purposes to match the liabilities with the interest rate characteristics of loans. ADB MANAGEMENT S DISCUSSION AND ANALYSIS: 31 DECEMBER 2015
25 18 Figure 1: Effect of Swaps on Currency Composition of Borrowings As of 31 December 2015 (%) Currency Composition of Outstanding Borrowings (Before Swaps) Currency Composition of Outstanding Borrowings (After Swaps) Canadian dollar 2.1 pound sterling 2.5 New Zealand dollar 2.6 Euro 2.8 Other Currencies a 8.1 yen 2.0 Other Currencies b 1.4 Australian dollar 13.3 US dollar 68.6 US dollar 96.6 a Other currencies include the Brazilian real, yuan, lari, Hong Kong dollar, Indian rupee, yen, ringgit, Mexican peso, Norwegian krone, Singapore dollar, South African rand, Swiss franc, baht and Turkish lira. b Other currencies include the yuan, lari, Indian rupee and Swiss franc. Figure 2: Effect of Swaps on Interest Rate Structure of Borrowings As of 31 December 2015 (%) Interest Rate Structure of Outstanding Borrowings (Before Swaps) Variable 8.6 Interest Rate Structure of Outstanding Borrowings (After Swaps) Fixed 7.0 Fixed 91.4 Variable 93.0 ADB MANAGEMENT S DISCUSSION AND ANALYSIS: 31 DECEMBER 2015
26 19 F. Liquidity Portfolio The liquidity portfolio helps ensure the uninterrupted availability of funds to meet loan disbursements, debt servicing, and other cash requirements; provides a liquidity buffer in the event of financial stress; and contributes to ADB s earning base. ADB s Investment Authority governs ADB s investments in liquid assets. The primary objective is to maintain the security and liquidity of the funds invested. Subject to these two parameters, ADB seeks to maximize the total return on its investments. ADB does not switch currencies to maximize returns on investments, and investments are generally made in the same currencies in which they are received. At the end of 2015, ADB held liquid investments in 22 currencies. Liquid investments are held in government or government-related debt instruments, time deposits, and other unconditional obligations of banks and financial institutions. To a limited extent, they are also held in corporate bonds that are rated at least A. These investments are held in five portfolios core liquidity, operational cash, cash cushion, discretionary liquidity, and ad hoc all of which have different risk profiles and performance benchmarks. The year-end balance of the portfolios in 2015 and 2014 is presented in Table 13. The amortized cost and fair value returns of the portfolios are presented in Table 14. Table 13: Year-End Balance of Liquidity Portfolio a ($ million) Item Core Liquidity Portfolio 15,308 15,261 Cash Cushion Portfolio 550 2,960 Operational Cash Portfolio Discretionary Liquidity Portfolio 7,771 5,945 Other Portfolio Total 23,869 24,820 a Including securities purchased under resale arrangements, securities transferred under repurchase agreements, and investment related swaps. The composition of the liquidity portfolio may shift from year to year as part of ongoing liquidity management. Table 14: Return on Liquidity Portfolio (%) Annualized Return Amortized Cost Fair Value Item Core Liquidity Portfolio Operational Cash Portfolio Cash Cushion Portfolio Discretionary Liquidity Portfolio a Other Portfolio Note: The amortized returns are based on income from investments and realized gains and losses reported in the Statement of Income and Expenses. The fair value return incorporate unrealized gains and losses that are reported as part of other comprehensive income loss and movements are dependent on prevailing market environment. a Spread over funding cost. ADB MANAGEMENT S DISCUSSION AND ANALYSIS: 31 DECEMBER 2015
27 20 The core liquidity portfolio (CLP) is invested to ensure that the primary objective of a liquidity buffer is met. Cash inflows and outflows are minimized to maximize the total return relative to a defined level of risk. The portfolio has been funded by equity, and the average duration of the major currencies in the portfolio was about 2.6 years (2014: 2.4 years) as of 31 December The operational cash portfolio, designed to meet net cash requirements over a 1-month horizon, is funded by equity and invested in short-term highly liquid money market instruments. The cash cushion portfolio holds the proceeds of ADB s borrowing transactions pending disbursement. It is invested in short-term instruments and aims to maximize the spread earned between the borrowing cost and the investment income. The discretionary liquidity portfolio is used to support medium-term funding needs and is funded by debt to provide flexibility in executing the funding program over the medium-term to opportunistically permit borrowing ahead of cash-flow needs, and to bolster ADB access to short-term funding through continuous presence in the market. G. Contractual Obligations In the normal course of business, ADB enters into contractual obligations that may require future cash payments. Table 15 summarizes ADB s significant contractual cash obligations as of 31 December 2015 and Long-term debt includes direct medium- and long-term borrowings, excluding swaps, and excludes unamortized premiums, discounts, and the effects of applying ASC 815. Other long-term liabilities correspond to accrued liabilities, including pension and postretirement medical benefits. H. Risk Management Table 15: Contractual Cash Obligations ($ million) Item Long-Term Debt 63,504 60,490 Undisbursed Loan Commitments 29,801 27,687 Undisbursed Equity Investment Commitments Guarantee Commitments 1,975 2,186 Other Long-Term Liabilities 1,408 1,452 Total 97,124 92,252 In its operations, ADB faces various kinds of risks, including financial, operational, and other organizational risks. ADB has a risk management framework that is built on the three core components of governance, policies, and processes. Governance starts with the Board of Directors, which plays a key role in reviewing and approving risk policies that define ADB's risk appetite. ADB also maintains an independent risk management group and has various management-level committees with responsibility to oversee bank-wide risk issues and endorse related decisions for approval by the Board and President. ADB s risk management framework also includes the Risk Committee, which provides high-level oversight of ADB s risks and recommends risk policies and actions to the President. ADB MANAGEMENT S DISCUSSION AND ANALYSIS: 31 DECEMBER 2015
28 ADB monitors the credit profile of existing transactions in the operations portfolio, conducts risk assessments of new nonsovereign transactions, and assumes responsibility for resolving distressed transactions when necessary. It also monitors market and credit risks in treasury operations, such as the credit quality of counterparties, interest rate risk, and foreign exchange risk. In addition, ADB has developed an operational risk management framework for the institution. For the aggregate portfolio, ADB monitors limits and concentrations; sets aside loan loss reserves; provides loan loss provisions, including collective provision requirements; and assesses its capital adequacy. Risk to which ADB is exposed in carrying out its mission include: (i) credit risk, (ii) market risk, (iii) liquidity risk, and (iv) operational risk. This section discusses each of these risks as well as ADB s capital adequacy ADB s ultimate protection against unexpected losses and its asset and liability management. 1. Credit Risk Credit risk is the risk of loss that could result if a borrower or counterparty defaults or if its creditworthiness deteriorates. Related to credit risk, ADB also faces concentration risk, which arises when a high proportion of the portfolio is allocated to a specific country, industry sector, obligor, type of instrument, or individual borrower. ADB assigns a risk rating to each loan, guarantee, and treasury counterparty (Table 16). For nonsovereign transactions, the rating typically is not better than that of the sovereign. Table 16: Asian Development Bank Internal Risk Rating Scale ADB Internal Credit Rating Rating Scale Agency Equivalent ADB Definitions 1 AAA / Aaa to A / A2 Lowest expectation of credit risk 2 A / A3 Very low credit risk 3 BBB+ / Baa1 Low credit risk 4 BBB / Baa2 Low credit risk 5 BBB / Baa3 Low to medium credit risk 6 BB+ / Ba1 Medium credit risk 7 BB / Ba2 Medium credit risk 8 BB / Ba3 Medium credit risk 9 B+ / B1 Significant credit risk 10 B / B2 Significant credit risk 11 B / B3 Significant credit risk 12 CCC+ / Caa1 High credit risk 13 CCC / Caa2 to C Very high credit risk 14 D Default ADB = Asian Development Bank. ADB is exposed to credit risk in its sovereign, nonsovereign, and treasury operations. The sovereign portfolio includes sovereign loan and guarantees as well as one equity investment, while the nonsovereign portfolio includes nonsovereign loan and guarantees, and equity investments (direct and private equity funds). The treasury portfolio includes fixed-income securities, cash and cash equivalents, and derivatives. Table 17 details the credit risk exposure and weighted average risk rating for each asset class. Aggregate credit risk slightly weakened to 3.9 (BBB) in 2015 from 3.8 (BBB) in 2014 due to a change in the portfolio composition with less of the stronger credit quality treasury portfolio offset by a higher proportion of the growing sovereign and nonsovereign portfolios carrying weaker credit ratings. 21 ADB MANAGEMENT S DISCUSSION AND ANALYSIS: 31 DECEMBER 2015
29 22 Table 17: Exposure to Credit Risk As of 31 December 2015 and Exposure Rating Exposure Rating Item ($ million) (1 14) ($ million) (1 14) Sovereign operations 58,106 53,017 a. Loan and guarantee a 57, / BBB 52, / BBB b. Equity Investments b 150 n/a 150 n/a Nonsovereign operations 5,837 5,108 a. Loan and guarantee a 5, / BB+ 4, / BB+ b. Equity Investments b 797 n/a 765 n/a Treasury 24, / AA 25, / AA a. Fixed income 20, / AA 18, / AA b. Cash instruments 3, / AA 6, / AA c. Derivatives / AA / AA Aggregate Exposure 88, /BBB 83, /BBB n/a = not applicable. Note: Numbers may not sum precisely because of rounding. a The sum of disbursed and outstanding loan balances and the present value of guaranteed obligations. b At fair values. Credit risk in the sovereign portfolio. Sovereign credit risk is the risk that a sovereign borrower or guarantor will default on its loan or guarantee obligations. ADB manages its sovereign credit risk through loan loss reserves and by maintaining conservative equity levels. OCR has experienced no loss of principal from sovereign operations. When countries have delayed payments, they have returned their loans to accrual status, and ADB has never had to write off a sovereign loan funded from OCR. ADB charges provisions against income for a specific transaction if it is considered impaired. In addition, ADB also appropriates loan loss reserves within equity for the average loss that ADB could incur in the course of lending. The provisions are based on projections of future repayment capacity. The loan loss reserve is based on the historical default experience of sovereign borrowers to multilateral development banks. The sum of the provisions and loan loss reserve represents ADB s expected loss for sovereign operations. The 2015 results are discussed below. Sovereign loan and guarantee exposure. The weighted average risk rating of the sovereign loan and guarantee portfolio stayed at 4.9 (BBB ) in 2015 as improving sovereign credit conditions in some ADB DMCs were offset by rating downgrades of other ADB DMCs and higher disbursements to countries with weaker ratings (Figure 3). Refer to Note F of OCR Financial Statements for additional information. ADB MANAGEMENT S DISCUSSION AND ANALYSIS: 31 DECEMBER 2015
30 23 Figure 3: Sovereign Loan and Guarantee Exposure by Credit Quality As of 31 December 2015 and 2014 (%) Medium credit risk 22.4 High credit risk 0.1 Medium credit risk 13.9 High credit risk 8.4 Low credit risk 77.6 Low credit risk 77.7 Notes: Low credit risk = exposures with risk rating 1 5, medium credit risk = exposures with risk rating 6 11, high credit risk = exposures with risk rating Percentages may not total 100% because of rounding. Sovereign concentrations. ADB has assumed some concentration risk to fulfill its development mandate. The three largest borrowers the People s Republic of China, India, and Indonesia represented 61.5% of the portfolio in 2015 (Table 18). Table 18: Sovereign Country Exposure a As of 31 December 2015 and Country $ million % $ million % People s Republic of China 14, , India 12, , Indonesia 8, , Philippines 5, , Pakistan 4, , Others 12, , Total 58, , a The sum of disbursed and outstanding loan balances, present value of guaranteed obligations and fair values of equities. Expected loss. In 2015, ADB experienced an improvement in the credit quality of some countries in the sovereign portfolio. As a result, expected loss decreased from $182 million in 2014 to $136 million in 2015 (Table 19). Table 19: Sovereign Portfolio Expected Loss As of 31 December 2015 and Item $ million % of SO portfolio $ million % of SO portfolio Provision for Loan Losses Loan Loss Reserve Requirement a Expected Loss = nil, SO = sovereign operations. a The loan loss reserve requirement is subject to the Board of Governors approval during the Annual Meeting in May ADB MANAGEMENT S DISCUSSION AND ANALYSIS: 31 DECEMBER 2015
31 24 Credit and equity risks in the nonsovereign portfolio. Nonsovereign credit risk is the risk that a borrower will default on a loan or guarantee obligation for which ADB does not have recourse to a sovereign entity. ADB s nonsovereign credit risk is considered more significant than in the sovereign operations because of the uncertain economic environment in some ADB markets. In addition, ADB s exposure is concentrated in the energy and finance sectors. ADB employs various policy-based measures to manage these risks. The Investment Committee and the Risk Committee oversee risks in the nonsovereign portfolio. The Investment Committee reviews all new nonsovereign transactions for creditworthiness and pricing. The Risk Committee monitors aggregate portfolio risks, and individual transactions with deteriorating creditworthiness. The Risk Committee also endorses changes in portfolio risks and management policy, and approves provisions for impaired transactions. ADB manages its nonsovereign credit risk by assessing all new transactions at the concept clearance stage and before final approval. Following approval, all exposures are reviewed at least annually; more frequent reviews are performed for those that are more vulnerable to default or have defaulted. In each review, ADB assesses whether the risk profile has changed; takes necessary actions to mitigate risks and either confirms or adjusts the risk rating; and updates the valuation for equity investments including assessing whether impairments are considered other than temporary. ADB will provide specific provisions where necessary in accordance with its provisioning policy. ADB recognizes specific provisions in net income for known or probable losses in individual loans or guarantees, and collective provisions for probable losses that exist collectively in disbursed loans rated below investment grade. In addition, ADB appropriates loan loss reserves within equity for the average loss that ADB would expect to incur in the course of lending for credit transactions that are rated investment grade and for the undisbursed portions of credit transactions rated worse than investment grade. Specific provisions are based on projections of future repayment capacity. The collective provision and loan loss reserve are based on historical default data from Moody s Investors Service that is mapped to ADB s portfolio. ADB annually tests whether this external data reasonably corresponds to ADB s actual loss experience and may adjust estimates on the basis of this back testing. The sum of the specific provision, collective provision, and loan loss reserve represents ADB s expected loss for nonsovereign operations. ADB uses limits for countries, industry sectors, corporate groups, obligors, products and individual transactions to manage concentration risk in the nonsovereign portfolio. The 2015 results are discussed below. Nonsovereign loan and guarantee exposure. ADB assigns a risk rating to each nonsovereign loan and guarantee. ADB s weighted average risk rating improved slightly to 6.2 (BB+) in 2015 from 6.4 (BB+) in 2014 because of a slight shift in credit mix within the bands (Figure 4). Refer to Note F of OCR Financial Statements for additional information. ADB MANAGEMENT S DISCUSSION AND ANALYSIS: 31 DECEMBER 2015
32 25 Figure 4: Nonsovereign Loan and Guarantee Exposure by Credit Quality As of 31 December 2015 and 2014 (%) 2015 High credit risk High credit risk 9.2 Medium credit risk 53.5 Low credit risk 43.1 Medium credit risk 47.2 Low credit risk 43.6 Notes: Low credit risk = exposures with risk rating 1 5, medium credit risk = exposures with risk rating 6 11, high credit risk = exposures with risk rating Nonsovereign equity exposure. The nonsovereign private equity portfolio has two components: (i) direct equity investments, where ADB owns shares in investee companies; and (ii) private equity funds, where ADB has partial ownership of a private equity fund, managed by a fund manager, which acquires equity stakes in investee companies. ADB s nonsovereign private equity portfolio increased to $797 million in 2015 from $765 million in The increase was from equity disbursements and valuation improvements to some investments during the year. Equity exits over 2015 partially offset the increase. Refer to Note H of OCR Financial Statements for additional information. Nonsovereign concentrations. The three largest nonsovereign country exposures as of 31 December 2015 were India (21.8%), the People s Republic of China (20.1%), and Thailand (8.8%). The exposure of the top three countries slightly increased from 49.2% in 2014 to 50.7% in 2015 (Table 20). All country exposures complied with ADB exposure limits. Table 20: Nonsovereign Country Exposure a As of 31 December 2015 and Country $ million % $ million % India 1, People s Republic of China 1, , Thailand Pakistan Indonesia Others 2, , Total 5, , a The sum of disbursed and outstanding loan balances, present value of guaranteed obligations and fair values of equities. ADB MANAGEMENT S DISCUSSION AND ANALYSIS: 31 DECEMBER 2015
33 26 ADB employs the Global Industry Classification Standard for its nonsovereign exposures. Under this system, ADB is dominated by the utilities sector (Table 21). ADB maintains higher exposures to this sector because of the importance of infrastructure to economic development. In addition, the high level of exposure to the utilities sector is deemed acceptable because of the systemic importance of utilities to the national economies in which they operate, and the lack of correlation between the utilities sector in one country and another. The utilities sector is also fragmented with seven major sub-industries. To mitigate sector concentration, ADB conducts additional monitoring of and reporting on this sector and employs specialists in these areas. Table 21: Nonsovereign Sector Exposure As of 31 December 2015 and Sector $ million % $ million % Utilities 2, , Banks 1, Diversified Financials Insurance Administration Energy Others Total 5, , Expected loss. Expected loss in the nonsovereign portfolio increased slightly in 2015 because of the increase in loan and guarantee exposure (Table 22). Table 22: Nonsovereign Portfolio Expected Loss As of 31 December 2015 and Item $ million % of NSO portfolio a $ million % of NSO portfolio a Specific Provision for Loan Losses Collective Provision for Loan Losses Loan Loss Reserve Requirement 37 b Expected Loss NSO = nonsovereign operations. a Percentage only applies to the loan and guarantee operations of the nonsovereign portfolio. b The loan loss reserve requirement is subject to the Board of Governors approval during the Annual Meeting in May Credit risk in the treasury operations. Issuer default and counterparty default are credit risks that affect the liquidity portfolio. Issuer default is the risk that a bond issuer will default on its interest or principal payments, while counterparty default is the risk that a counterparty will not meet its contractual obligations to ADB. To mitigate issuer and counterparty credit risks, ADB transacts only with institutions rated by reputable international rating agencies. Moreover, the liquidity portfolio is generally invested in conservative assets, such as money market instruments and government securities. In addition, ADB has established exposure limits for its corporate investments, depository relationships, and other investments. ADB MANAGEMENT S DISCUSSION AND ANALYSIS: 31 DECEMBER 2015
34 ADB has counterparty eligibility criteria to mitigate counterparty credit risk arising through derivative transactions. In general, ADB will only undertake swap transactions with counterparties that meet the required minimum counterparty credit rating, have executed an International Swaps and Derivatives Association Master Agreement or its equivalent, and have signed a credit support annex. Under the credit support annex, derivative positions are marked to market daily, and the resulting exposures are generally collateralized by cash or US government securities. ADB also sets exposure limits for individual swap counterparties and monitors these limits against current and potential exposures. ADB enforces daily collateral calls as needed to ensure that counterparties meet their collateral obligations. The weighted average credit rating for the liquidity portfolio was AA in About 99% of the portfolio was rated A or better. As of 31 December 2015 and 2014, no fixed-income instruments, derivatives, or other treasury exposures were past due or impaired. Deposits. Generally, credit risk from investment deposits is low. ADB only invests with depository institutions that have a minimum long-term average credit rating of A+ or a shortterm credit rating of A-1. ADB maintains a watch list of institutions that it perceives as potentially riskier based on regular internal credit risk assessments. Moreover, the size of the investment deposits is limited by the counterparty s equity and creditworthiness. Fixed income. Sovereign and sovereign-guaranteed securities, and those issued by government-related enterprises, including supranationals represent 93% of ADB s fixed income assets. The remainder is in corporate bonds that are rated at least A (Table 23). ADB has monitored market developments closely and adjusted its risk exposures accordingly. Table 23: Fixed Income Portfolio by Asset Class As of 31 December 2015 and Item $ million % $ million % Government 11, , Government Guaranteed 2, , Government-Sponsored Enterprises and Supranationals 4, , Corporates 1, , Total 20, , Derivatives. All eligible swap counterparties are rated at least A. Current exposure to counterparties rated below A+ is generally fully collateralized, while the uncollateralized exposure to those rated AA and above are subject to specified thresholds. ADB maintains a watch list of institutions that it perceives as potentially riskier based on regular internal credit risk assessments. At the end of 2015, all counterparty marked-to-market exposures were fully collateralized, except for one AA rated counterparty whose uncollateralized exposure is within its established threshold. 27 ADB MANAGEMENT S DISCUSSION AND ANALYSIS: 31 DECEMBER 2015
35 28 Country exposure. At the end of 2015, treasury credit risk exposure was allocated across 30 countries with the largest exposure in Japan (Table 24). Table 24: Treasury Country Exposure As of 31 December 2015 and Country $ million % $ million % Japan 6, , United States 6, , Korea 2, , Germany 1, , Supranational 1, , Others 5, , Total 24, , Market Risk Market risk is the risk of loss on financial instruments because of changes in market prices. ADB principally faces three forms of market risk: (i) equity price risk, which is the risk that the fair value of equities decreases as a result of changes in the levels of equity indices and the value of individual stocks; (ii) interest rate risk; and (iii) foreign exchange risk. Interest rate risk and foreign exchange risk are further discussed below. Interest rate. Interest rate risk in the operations portfolio is hedged as the basis for borrowers interest payments are matched to ADB s borrowing expenses. Therefore, the borrower must assume or hedge the risk of fluctuating interest rates, whereas ADB s margins remain largely constant. ADB is primarily exposed to interest rate risk through the liquidity portfolio. ADB monitors and manages interest rate risks in the liquidity portfolio by employing various quantitative methods. It marks all positions to market, monitors interest rate risk metrics, and employs stress testing and scenario analysis. ADB uses duration and interest rate value-at-risk (VaR) to measure interest rate risk in the liquidity portfolio. Duration is the estimated percentage change in the portfolio s value in response to a 1% parallel change in interest rates. Interest rate VaR is a measure of possible loss at a given confidence level in a given time frame because of changes in interest rates. ADB uses a 95% confidence level and a 1-year horizon. In other words, ADB would expect to lose at least this amount once every 20 years because of fluctuations in interest rates. ADB uses duration and VaR to measure interest rate risk across the liquidity portfolio, with particular attention to the major CLP, which is the most exposed to interest rate risk. Foreign exchange. ADB endeavors to minimize exposure to exchange rate risk in its operations. In both the operations and liquidity portfolios, ADB is required to match the currency of its assets with the currencies of liabilities and equity. Borrowed funds or funds to be invested may only be converted into other currencies provided that they are fully hedged through cross currency swaps or forward exchange agreements. However, because of its multicurrency operations, ADB is exposed to fluctuations in reported US dollar results due to currency translation adjustments. ADB MANAGEMENT S DISCUSSION AND ANALYSIS: 31 DECEMBER 2015
36 ADB monitors VaR and duration, and performs stress testing to manage market risk in the liquidity portfolio. The major currencies of the CLP bear the majority of ADB s market risks and account for 61% of ADB s OCR, while major currencies account for 93% of the CLP. Major currencies include the US dollar, yen, euro, pound sterling, Australian dollar, and Canadian dollar. Value-at-risk. Aggregate VaR of major currencies of the CLP, which includes interest rate and foreign exchange risks, increased from 2.7% in 2014 to 3.0% in This means that there is a 5.0% probability that the portfolio will lose more than 3.0% ($444 million) of its value over the next year. Duration. The major CLP s interest rate sensitivity, as reflected in its weighted portfolio duration, increased from 2.4 years as of the end of 2014 to 2.6 years as of the end of Stress testing. ADB measures how sensitive the major CLP is to interest rate changes. If interest rates were to rise 2%, the major CLP portfolio would be expected to lose 5.1% ($768 million). ADB also uses scenario analysis to assess how the major CLP would respond to significant changes in market factors, such as those that have occurred in the past. Because of the high quality of ADB s investments, scenario analysis suggests that the liquidity portfolio would appreciate during many stressed scenarios, as demand for highly rated securities increases (flight to quality). 3. Liquidity Risk Liquidity risk can arise if ADB is unable to raise funds to meet its financial and operational commitments. ADB maintains core liquidity to safeguard against a liquidity shortfall in case its access to the capital market is temporarily denied. The overriding objective of the liquidity policy is to enable ADB to obtain the most cost-efficient funding under both normal and stressed situations and manage liquidity optimally to achieve its development mission. The Board of Directors approved a revised liquidity policy framework in December The revised policy redefined the prudential minimum liquidity as 45% of the 3-year net cash requirements. This represents the minimum amount of liquidity necessary for ADB to continue operations even if access to capital markets is temporarily denied. Maintaining the prudential minimum liquidity level is designed to enable ADB to cover normal net cash requirements for 18 months under the normal and stressed situations without borrowing. The liquidity levels and cash requirements are monitored on an ongoing basis, with quarterly review by the Board of Directors. The policy allows for the discretionary liquidity portfolio to maintain a debt-funded sub-portfolio that will be excluded from the net cash requirements and prudential minimum liquidity calculations. 4. Operational Risk ADB defines operational risk as the risk of loss resulting from inadequate or failed internal processes, people, and systems; or from external events. ADB manages its operational risks based on a framework endorsed by the Risk Committee and approved by the President in The framework enables ADB to implement an approach that focuses on identifying, accessing, and managing risks to minimize potential adverse impacts. Key components of ADB s operational risk management approach include (i) employing the Operational Risk Self Assessment in its key business areas; (ii) using Key Risk Indicators for operational risk profile monitoring and the collection of risk event information; and (iii) promoting risk awareness, including through presentations to staff on the application of the methodologies. ADB has completed implementing its operational risk management approach across the organization in ADB will continue maintaining the framework, while retaining the key operational risk methodologies and tools. 29 ADB MANAGEMENT S DISCUSSION AND ANALYSIS: 31 DECEMBER 2015
37 30 Like any other organization, ADB is exposed to various types of operational risk, which it mitigates by applying internal controls and monitoring areas of particular concern. ADB uses risk transfer, including insurance, for mitigating low-frequency, high-severity operational risks. ADB continuously strengthens its business continuity process and particularly information technology (IT) to reduce the impact of disruptions. 5. Capital Adequacy ADB s most significant risk is potential default of a large portion of its loan portfolio. Credit risk is measured in terms of both expected and unexpected losses. For expected losses, ADB holds loan loss reserves and provisions. For unexpected losses, ADB relies on its income-generating capacity and capital, which is a financial institution s ultimate protection against unexpected losses that may arise from credit and other risks. ADB principally uses stress testing to assess the capacity of its capital to absorb unexpected losses. The framework has two objectives. First, it measures ADB s ability to absorb income losses because of a credit shock. Through this monitoring, ADB reduces the probability that it would have to rely on shareholder support, such as additional paid-in capital or a capital call. Second, the framework evaluates ADB s ability to generate sufficient income to support loan growth after a credit shock. As a development institution, ADB s mandate becomes more important during a financial crisis when some DMCs may find their access to capital markets limited. Demand for ADB assistance may rise under such adverse conditions. For the stress test, ADB generates thousands of potential portfolio scenarios and imposes credit shocks that are large enough to account for 99% of those scenarios. ADB then assesses the impact of these shocks on its capital by modeling the ratio of equity to loans over the next 10 years. Throughout 2015, the stress test indicated that ADB had adequate capital to absorb the losses of a severe credit shock and to continue its development lending. During 2015, ADB s AAA credit rating was reaffirmed by the three major international credit rating agencies. 6. Asset and Liability Management ADB has an asset and liability management policy framework that guides all financial policies related to asset and liability management including liquidity, investments, equity management, and capital adequacy. The objectives of the asset and liability management are to safeguard ADB s net worth and capital adequacy, promote steady growth in ADB s risk-bearing capacity, and define financial policies to undertake acceptable financial risks. The aim is to provide resources for developmental lending at the lowest and most stable funding cost to borrowers, along with the most reasonable lending terms, while safeguarding ADB s financial strength. ADB s asset and liability management aims to safeguard net worth from foreign exchange rate risks, protect net interest margin from fluctuations in interest rates, and provide sufficient liquidity to meet the needs of ADB operations. ADB also uses a cost pass-through pricing policy for loans to sovereign borrowers, and allocates the most cost-efficient borrowing based on cost and maturity to fund the loans. ADB MANAGEMENT S DISCUSSION AND ANALYSIS: 31 DECEMBER 2015
38 31 I. Internal Control over Financial Reporting ADB Management has been assessing the effectiveness of its internal controls over financial reporting (ICFR) since 2008 using criteria set forth by the Committee of Sponsoring Organizations of the Treadway Commission (COSO) in the Internal Control Integrated Framework (1992 Framework). ADB used the 1992 Framework to assess the effectiveness of ICFR from In May 2013, COSO issued a revised Internal Control Integrated Framework (2013 Framework), which became effective for ADB s financial statements for the 2014 fiscal year. Significant enhancements in the 2013 Framework included: (i) codification of the 17 Principles that support the 5 components of internal control; (ii) the concept of considering the potential of fraud risk as part of risk assessment process; and (iii) considerations on outsourcing and increased relevance of information technology (IT) as a result of changes in the business and operating environment. For an effective system of internal control, the 2013 Framework requires that each of the 5 components and the 17 principles be present and functioning; and that the 5 components operate together in an integrated manner. ADB continued to adopt the 2013 Framework for assessing the effectiveness of ADB s internal control over financial reporting for its 2015 financial statements. ADB applied a risk-based evaluation framework for the assertion and attestation of the effectiveness of internal control over financial reporting for OCR and Special Funds, except for the ADB Institute (ADBI) and trust funds. The scope included a review of 52 business processes for financial reporting and four domains for the IT general computer controls. ADB staff across several departments and offices were responsible for (i) identifying and testing key controls, and (ii) assessing and evaluating the design and operating effectiveness of the business processes. Concurrently in 2015, the external auditor performed an independent test of selected key controls and concurred with Management that ADB maintained effective internal control over financial reporting for OCR and Special Funds (except for ADBI). J. Critical Accounting Policies and Estimates Significant accounting policies are contained in Note B of the OCR financial statements. As disclosed in the financial statements, Management estimates the fair value of financial instruments. Because the estimates are based on judgment and available information, actual results may differ and could have a material impact on the financial statements. Fair value of financial instruments. Under statutory reporting, ADB carries selected financial instruments and derivatives, as defined by ASC Topics 815 and 825, on a fair value basis. These financial instruments include embedded derivatives that are valued and accounted for in the balance sheet as a whole. Fair values are usually based on quoted market prices. If market prices are not readily available, fair values are usually determined using market-based pricing models incorporating market data requiring judgment and estimates. These are discussed in more detail in Note B of OCR s financial statements. The pricing models used to determine the fair value of ADB s financial instruments are based on discounted cash-flow models. ADB reviews the pricing models to assess whether the assumptions are appropriate and produce results that reflect the reasonable valuation of the financial instruments. In addition, the fair values derived from the models are subject to ongoing internal and external verification and review. The models use market-sourced inputs, such as interest rates, exchange rates, and option volatilities. The selection of these inputs may involve some judgment and may impact net income. ADB believes that the estimates of fair values are reasonable. ADB MANAGEMENT S DISCUSSION AND ANALYSIS: 31 DECEMBER 2015
39 32 Provision for loan losses and loan loss reserves. In 2006, the Board of Directors approved the revision of the loan loss provisioning methodology for ADB s nonsovereign operations to a risk-based model. Provision against loan losses for impaired loans reflects Management s judgment and estimate of the present value of expected future cash flows discounted at the loan s effective interest rate. ADB considers a loan impaired when, based on current information and events, ADB will probably be unable to collect all the amounts due according to the loan s contractual terms. The provisioning estimate is done quarterly. In 2010, ADB refined the provisioning methodology to include collective provisioning for the nonsovereign portfolio. ADB uses an internal risk-rating system to estimate expected loss for unimpaired loans. The probability of default is based on the historical default experience of sovereign borrowers to multilateral development institutions; for nonsovereign loans, it is based on Moody s Investors Service default data. A loan loss reserve is established within equity for the expected losses as an allocation of net income, subject to the approval of the Board of Governors. Pension and other postretirement benefits. ADB provides staff pension and postretirement medical benefit plans for all eligible staff members, provided they have not reached the normal retirement age of 60. Net periodic benefit costs are allocated between OCR and the ADF based on the agreed cost-sharing methodology. The underlying actuarial assumptions used to determine the projected benefit obligations, accumulated benefit obligations, and funded status associated with these plans are based on market interest rates, past experience, and Management s best estimate of future benefit changes and economic conditions. For further details, refer to Notes to Financial Statements Note P Staff Pension Plan and Postretirement Medical Benefits. IV. SPECIAL FUNDS ADB is authorized by its Charter to establish and administer Special Funds. These are the ADF, the TASF, the Japan Special Fund (JSF), ADBI, the Regional Cooperation and Integration Fund (RCIF), the Climate Change Fund (CCF), APDRF, and the Financial Sector Development Partnership Special Fund (FSDPSF). Financial statements for each Special Fund are prepared in accordance with US GAAP except for the ADF, for which special purpose financial statements are prepared. A. Asian Development Fund The ADF is ADB s concessional financing window for DMCs with per capita gross national income below the ADB operational cutoff and limited or low creditworthiness. It provides a multilateral source of concessional assistance dedicated exclusively to reducing poverty and improving the quality of life in Asia and the Pacific. The ADF has received contributions from 34 donors (regional and nonregional). Cofinancing with bilateral and multilateral development partners complements ADF resources. In July 2012, the Board of Governors adopted a resolution providing for the 10th replenishment of the ADF (ADF XI) and the 5th regularized replenishment of the TASF. The resolution provides for a substantial replenishment of the ADF to finance ADB s concessional program for 4 years from January 2013, and for replenishment of the TASF in conjunction with the ADF replenishment to finance TA operations under the TASF. The total replenishment of SDR8,415 million ($13,155 million equivalent at Resolution No. 357 exchange rates) comprised SDR8,174 million for ADF XI and SDR241 million for the TASF. About 38% of the replenishment will be financed from new donor contributions totaling SDR3,090 million ($4,831 million equivalent). The replenishment became effective on 4 June As of 31 December 2015, ADB had received 31 instruments of contributions from donors totaling of SDR3,047 million ($4,764 million equivalent). ADB MANAGEMENT S DISCUSSION AND ANALYSIS: 31 DECEMBER 2015
40 Currency management. Based on ADF s currency management framework, its resources are managed using the SDR basket of currencies (US dollar, euro, pound sterling, and yen) as the basis. ADF donor contributions and loan reflows received in currencies that are not part of the SDR basket are converted into one of the currencies in the basket to maintain the SDR-based liquidity portfolio. In addition, the borrower s obligations for new ADF loans are determined in SDR. Starting in 2008, ADB extended the full-fledged SDR approach to ADF legacy loans by providing ADF borrowers the option to convert their existing liability (i.e., disbursed and outstanding loan balance) in various currencies into SDR, while the undisbursed portions were to be treated as new loans redenominated in SDR. As of 31 December 2015, 20 of 29 borrowing members agreed to the conversion. The outstanding balance of their SDR-converted loans amounted to $10,332 million. Framework for grants and hard-term facility. In September 2007, the Board of Directors approved the ADF grant framework, which limits grant eligibility to ADF-only countries and introduced a new hard-term ADF lending facility. The facility will have a fixed interest rate of 150 basis points below the weighted average of the 10-year fixed swap rates of the SDR basket of currencies plus the OCR lending spread, or the current ADF rate, whichever is higher. Other terms are similar to those of regular ADF loans. In June 2012, the Board of Directors approved the hardening of lending terms to blend countries: (i) for project and policy-based loans financed from ADF resources, a 25-year tenor including a 5-year grace period, 2.0% per year interest rate throughout the loan tenor, and equal amortization; and (ii) for hard-term loans, a 25-year tenor including a 5-year grace period; an interest rate calculated as 150 basis points below the weighted average of the 10-year fixed swap rates of the SDR component currencies plus the OCR lending spread, or the applicable ADF interest rates, whichever is higher, throughout the loan tenor; and equal amortization. These new lending terms were applicable to loans for which formal loan negotiations were completed on or after 1 January In general, blend countries with per capita income not exceeding the International Development Association (IDA) operational cutoff for more than 2 consecutive years and with an active OCR lending program are eligible to borrow from this new facility. The interest rate, which is fixed for the life of hard-term loans approved during the year, is reset every January. For hard-term ADF loans approved in 2015, the interest rate is set at (i) 1.0% during the grace period and 1.5% thereafter (2014: 1.77% fixed for the life of the loans) for ADF-only countries; and (ii) 2.0% fixed for the life of the loans for blend countries (2014: 2.0% fixed). During 2015, no loan was approved under this facility (2014: one loan for blend countries). Liquidity management. ADF manages its liquidity assets under two tranches to enable the optimal use of financial resources. The main objective of the first tranche is to ensure adequate liquidity is available to meet expected cash requirements. The second tranche comprises the prudential minimum liquidity the ADF should hold to meet unexpected demands and any usable liquidity for future commitments. This approach ensures that liquidity is managed transparently and efficiently. Heavily Indebted Poor Countries Initiative. In response to ADF donors request, the ADB Board of Governors adopted a resolution on 7 April 2008 for ADB to participate in the Heavily Indebted Poor Countries (HIPC) Initiative and to provide Afghanistan with debt relief. The estimated principal amount of Afghanistan s ADF debt to be forgiven and charged against ADF income was $82 million. 33 ADB MANAGEMENT S DISCUSSION AND ANALYSIS: 31 DECEMBER 2015
41 34 Launched in 1996 by the IDA and the International Monetary Fund (IMF), the HIPC Initiative provides partial debt relief to poor countries with external debt that severely burdens export earnings or public finance. In 1999, the initiative was enhanced to enable more countries to qualify for HIPC relief. The IDA and the IMF reported that several ADF borrowers met the income and indebtedness criteria of the HIPC Initiative and were potentially eligible for HIPC debt relief. Of these, only Afghanistan became eligible and reached the decision point under the HIPC Initiative on 9 July The decision point is where an HIPC country, having met certain conditions, 10 becomes eligible to receive interim debt relief on a provisional basis following approval by the ADB Board of Directors to provide debt relief under the HIPC Initiative. Debt relief has been delivered by partial reduction of debt service payments as they come due. On 26 January 2010, the executive boards of the IDA and the IMF agreed that Afghanistan had reached the completion point under the HIPC Initiative. Thus, debt relief to Afghanistan under the initiative had become irrevocable. The amount of debt relief including principal and interest was revised to $106 million and was to be provided through a reduction of Afghanistan s debt service from July 2008 to February As of December 2015, the ADF had delivered $22 million under this arrangement, bringing the balance to $84 million. Contributed resources. The total replenishment of SDR8,415 million for ADF XI and TASF V comprises SDR5,018 million financed from internal resources, SDR3,090 million from new donor contributions, and SDR307 million from net income transfers from OCR. This covers , which became effective in June 2013 after instruments of contribution deposited with ADB for unqualified contribution exceeded 50% of all pledged contributions. As of 31 December 2015, 31 donors had contributed a total of $3,599 million equivalent, of which $2,493 million (including the allocation to the TASF) had been received and made available for operational commitments. The remaining unpaid contributions under ADF IX, ADF X and ADF XI as of 31 December 2015 totaled $439 million. 11 (For details of amounts released for operational commitments in 2015, see the column labeled Addition in Table 32 of the Operational Data). The commitment authority available for future commitments comprises the resources available to the ADF for its future lending activities in the form of loans and grants. These resources are derived from donor contributions, reflow-based resources, and net income transfers from OCR. The balance of the commitment authority available for operations as of 31 December 2015 was $436 million, compared with $549 million as of 31 December 2014 (Table 25). 10 The conditions are that an HIPC country has a track record of macroeconomic stability and an interim poverty reduction strategy in place and has been cleared of any outstanding arrears. 11 At US dollar equivalent at 31 December 2015 exchange rates. ADB MANAGEMENT S DISCUSSION AND ANALYSIS: 31 DECEMBER 2015
42 Table 25: Asian Development Fund Commitment Authority a 31 December 2015 and 2014 ($ million) Item Carryover of ADF X Commitment Authority b ADF XI Contributions 2,345 1,604 ADF X Contributions c ADF IX Contributions d ADF VIII Contributions d Internal Resources e 5,219 3,634 Savings and Cancellations OCR Net Income Transfer Total ADF Commitment Authority 9,691 7,196 Loans and Grants Committed 9,255 6,647 ADF Commitment Authority Available for Future Commitments ADF = Asian Development Fund, OCR = ordinary capital resources. Note: Numbers may not sum precisely because of rounding. a The Asian Development Bank monitors the ADF commitment authority based on special drawing rights. All reported figures are based on special drawing rights translated to US dollar as of 31 December 2015 and 2014 exchange rates. b c A portion of the carryover funds from ADF X would be used to finance loans and grants that overflow ed from 2012 approval. Represents the additional payments of Italy, Spain and the United States including the corresponding pro-rated amounts released by France, Germany and Turkey. d e Represents payment from the United States including the corresponding pro-rated amounts released by Germany and Turkey. Internal resources include (i) reflow-based resources, (ii) liquidity drawdown, and (iii) resources from the three enhancement options. In May 2015, the Board of Governors approved the transfer of $120 million to the ADF as part of the net income allocation for OCR (2014: $120 million). In addition, $671 million from loan and grant savings and cancellations were included in the commitment authority. This resulted from Management s continued assessment of opportunities to free committed resources through cancellations of unused loan and grant balances. During 2015, deposited installments under ADF XI amounted to $898 million, and ADF XI promissory notes encashed totaled $588 million. About $69 million was transferred to the TASF. Loan approvals, disbursements, and repayments. In 2015, 43 ADF loans totaling $2,514 million were approved compared with 52 ADF loans totaling $2,682 million in Disbursements during 2015 totaled $2,048 million, a decrease of 7% from $2,203 million in At the end of 2015, cumulative disbursements from ADF resources were $39,786 million. Loan repayments during 2015 totaled $1,242 million (2014: $1,291 million). At the end of 2015, outstanding ADF loans amounted to $27,270 million (2014: $27,604 million). In 2015, MFFs for $219 million (2014: $773 million) were approved under the ADF. 12 PFRs under the MFFs totaling $341 million were approved in 2015 (2014: $314 million). A total of $412 million was disbursed under the MFFs in 2015 (2014: $337 million). Results-based lending. In 2015, one ADF loan for $88 million was approved under RBL (2014: one loan amounting $50 million); disbursements totaled $47 million (2014: $38 million). Project design facility. In April 2011, ADB established the PDF on a pilot basis to support project preparation, particularly detailed engineering designs, through PDA. ADF loans approved under the facility carry standard ADF interest rates. Payment of interest is deferred until the PDA is refinanced out of the loans proceeds, or other repayment terms take effect. No loans were approved under this facility in 2015 and These amounts are adjusted based on flexibility in the use of OCR and ADF funding. ADB MANAGEMENT S DISCUSSION AND ANALYSIS: 31 DECEMBER 2015
43 36 Investment portfolio position. The ADF investment portfolio totaled $6,030 million at the end of 2015 compared with $6,559 million at the end of About 7% of the portfolio was invested in bank deposits, and 93% in fixed-income securities. The annualized rate of return on ADF investments, including unrealized gains and losses, was 0.7% (2014: 0.8%). Grants. In 2015, ADB approved 15 grants (2014: 17) totaling $358 million (2014: $405 million), of which $200 million were PFRs under MFFs (2014: $109 million) (footnote 12), while 16 grants (2014: 19) totaling $348 million (2014: $848 million) became effective, net of $12 million (2014: $7 million) in write-backs of undisbursed commitments for savings on financially closed and/or cancelled projects. Direct value-added official and other concessional cofinancing for ADF loans and grants. In 2015, $2,088 million (2014: $1,723 million) was mobilized in official loan and grant cofinancing for 39 ADF-financed projects (2014: 32) totaling $1,373 million (2014: $2,003 million). B. Technical Assistance Special Fund The TASF was established to provide TA on a grant basis, both regionally and to ADB s DMCs. In July 2012, as part of ADF XI replenishment, donors agreed to contribute 3% of the total replenishment size as the fifth replenishment of the TASF. The replenishment covers Contributed resources. As of 31 December 2015, 30 donors had committed a total of $371 million to the TASF as part of the ADF XI and the fifth regularized replenishment of the TASF. Of the total commitment, $262 million had been received. As part of the ADF X and fourth regularized replenishment of TASF, $318 million of the total commitment of $339 million had been received as of 31 December During the period, Pakistan made a direct voluntary contribution of $0.07 million. In addition, $40 million was allocated to the TASF as part of the OCR s 2014 net income allocation, and $28 million was committed for the fifth regularized replenishment of the TASF. At the end of 2015, TASF resources totaled $2,386 million, of which $2,239 million was committed, leaving an uncommitted balance of $147 million ($221 million as of 31 December 2014) (Table 26). Table 26: Technical Assistance Special Fund Cumulative Resources ($ million) Item Regularized Replenishment Contributions 1,145 1,116 Allocations from OCR Net Income Direct Voluntary Contributions Income from Investment and Other Sources Transfers from the TASF to the ADF (3) (3) Total 2,386 2,308 ( ) = negative, ADF = Asian Development Fund, OCR = ordinary capital resources, TASF = Technical Assistance Special Fund. Note: Numbers may not sum precisely because of rounding. 13 Includes securities purchased under resale arrangements. ADB MANAGEMENT S DISCUSSION AND ANALYSIS: 31 DECEMBER 2015
44 Operations. TA commitments (approved and effective) increased from $113 million in 2014 to $124 million in 2015 for 153 TA projects and 45 supplementary approvals that were made effective during the year, net of $24 million (2014: $25 million) in write-backs of undisbursed commitments for completed and canceled TA projects. Undisbursed commitments net of advances for TA increased to $339 million as of 31 December 2015 ($337 million as of 31 December 2014). The TASF financed 57% of all TA activities approved in 2015 (2014: 53%). Investment position. As of 31 December 2015, the total investment portfolio, including securities purchased under resale arrangements, amounted to $367 million, compared with $391 million at the end of Revenue from investments decreased from $3 million in 2014 to $2 million in C. Japan Special Fund The JSF was established in 1988 when ADB, acting as the administrator, entered into a financial arrangement with the Government of Japan, which agreed to make the initial contribution to help ADB s DMCs restructure their economies and broaden the scope of opportunities for new investments, mainly through TA operations. Contributed resources. As of 31 December 2015, Japan s cumulative contribution to the fund since inception amounted to 113 billion ($974 million equivalent), comprising regular contributions of 95 billion ($823 million equivalent) and supplementary contributions of 18 billion ($151 million equivalent). The uncommitted balance was $68 million as of 31 December 2015 ($65 million as of 31 December 2014). Operations. In 2015, no new TA projects or grants were approved or made effective (2014: nil), and $3 million was written back for financially completed and cancelled projects (2014: $3 million). Undisbursed commitments net of advances for TA projects as of 31 December 2015 were $3 million, compared with $7 million as of the end of Investment position. As of 31 December 2015, the total investment portfolio amounted to $69 million, lower than the balance of $73 million as of 31 December Revenue from investments increased from $0.12 million in 2014 to $0.14 million in D. ADB Institute ADBI was established in 1996 as a subsidiary body of ADB. ADBI s objectives are to identify effective development strategies and capacity improvements for sound development management in the DMCs. Its operating costs are met by ADBI, and it is administered in accordance with the Statute of the Asian Development Bank Institute. In June 2015, the Government of Japan committed its 25th contribution for 672 million ($5 million equivalent) and in December 2015, committed its 26th contribution for 672 million ($6 million equivalent). In September 2015, the Government of Indonesia committed its 1st contribution for $0.5 million. In December 2015, the Government of Republic of Korea committed its 2nd contribution for $0.7 million. 37 ADB MANAGEMENT S DISCUSSION AND ANALYSIS: 31 DECEMBER 2015
45 38 As of 31 December 2015, cumulative contributions committed to ADBI amounted to 25 billion, A$2 million, and $3 million (about $240 million equivalent). Of the total contributions received, $230 million had been used by the end of 2015 mainly for research and capacity-building activities, including (i) organizing symposia, forums, and training sessions; (ii) preparing research reports, publications, and websites; and (iii) financing associated administrative expenses. The balance of net current assets (excluding property, furniture, and equipment) available for future projects and programs was about $9 million. E. Regional Cooperation and Integration Fund The RCIF was established in February 2007 in response to the increasing demand for regional cooperation and integration activities among ADB s member countries in Asia and the Pacific. Its main objective is to improve regional cooperation and integration by facilitating the pooling and provision of additional financial and knowledge resources. Contributed resources. In 2014, the Government of Japan committed contributions of 392 million ($4 million equivalent) to the fund. As of 31 December 2015, RCIF resources totaled $63 million, of which $55 million had been used, leaving an uncommitted balance of $8 million ($8 million as of 31 December 2014). Operations. In 2015, net TA expenses totaled $0.1 million (2014: $0.5 million), comprising two TA projects and one supplementary approval totaling $1.4 million that became effective, and a $1.3 million write-back on financially completed and/or cancelled projects (2014: three TA projects and one supplementary approval totaling $2.2 million, and a $1.7 million write-back). The balance of undisbursed commitments net of grant advances as of 31 December 2015 amounted to $9 million (2014: $11 million). Investment position. As of 31 December 2015, the total investment portfolio amounted to $15 million ($17 million as of 31 December 2014). Annual revenue from investments for 2015 and 2014 was $0.02 million. F. Climate Change Fund The CCF was established in April 2008 to facilitate greater investments in DMCs to address the causes and consequences of climate change in combination with ADB assistance in related sectors. Contributed resources. As of 31 December 2015, CCF resources totaled $60 million, of which $49 million had been used, leaving an uncommitted balance of $11 million ($10 million as of 31 December 2014). Operations. In 2015, a write-back of $0.8 million and no TA and/or grant became effective (2014: net TA and/or grant expenses totaled $2.8 million consisted of four TA projects and four supplementary approvals totaling $3.3 million, and a $0.5 million write-back). The balance of undisbursed commitments net of grant and/or TA advances as of 31 December 2015 amounted to $11 million (2014: $16 million). Investment position. As of 31 December 2015, the total investment portfolio amounted to $21 million ($26 million as of 31 December 2014). Revenue from investments for 2015 was $0.04 million (2014: $0.05 million). ADB MANAGEMENT S DISCUSSION AND ANALYSIS: 31 DECEMBER 2015
46 39 G. Asia Pacific Disaster Response Fund The APDRF was established on 1 April 2009 to provide timely incremental grant resources to DMCs affected by natural disasters. Contributed resources. In 2015, $20 million was transferred to the APDRF from OCR allocable net income. As of 31 December 2015, fund resources totaled $60 million, of which $43 million had been used, leaving an uncommitted balance of $17 million ($4 million as of 31 December 2014). Operations. In 2015, three grants amounting to $7 million became effective (2014: one grant totaling $0.2 million). The fund had no undisbursed commitments net of grant advances as of 31 December 2015 and Investment position. As of 31 December 2015, the total investment portfolio amounted to $11 million (2014: nil). Revenue from investments for 2015 was $0.02 million (2014: nil). H. Financial Sector Development Partnership Special Fund The FSDPSF was approved by the Board of Directors and established on 31 January 2013 to strengthen regional, subregional, and national financial systems in Asia and the Pacific. Contributed resources. In 2015, the Government of Luxembourg committed contribution of $2 million equivalent of contributions (2014: $2 million equivalent). As of 31 December 2015, fund resources totaled $11 million, of which $4 million had been used, leaving an uncommitted balance of $7 million (2014: $7 million as of 31 December 2014). Operations. In 2015, two TA projects and three supplementary approvals totaling $2 million became effective (2014: six TA projects and one supplementary approval totaling $2 million became effective), and a $0.1 million write-back for financially completed and/or cancelled projects ($2014: nil). The balance of undisbursed commitments net of grant advances as of 31 December 2015 amounted to $2 million ($2 million as of 31 December 2014). Investment position. As of 31 December 2015, the total investment portfolio amounted to $5 million ($7 million as of 31 December 2014). Annual revenue from investments for 2015 and 2014 was $0.01 million. V. GRANT COFINANCING Trust funds and project-specific grants are key instruments to mobilize and channel financial resources from external sources to finance TA and components of investment projects. They play an important role in complementing ADB s own resources. Multilateral, bilateral, and private sector partners have contributed about $2,258 million in grants to ADB operations (Table 27). In 2015, grant cofinancing for ADB-approved projects totaled $875 million, comprising $125 million for 85 TA projects and $750 million for components of 42 investment projects. By the end of 2015, ADB was administering 41 trust funds, comprising 30 stand-alone trust funds, 14 and 11 trust funds established under financing partnership facilities. Of these, 28 have balances totaling $437 million in grants. Additional grant resources from external partners totaled $257 million in 2015, comprising $132 million in new commitments, $70 million in replenishments to existing trust funds, and $55 million in additional allocation from global funding initiatives. 14 Trust funds not related to financing partnership facilities and including the Japan Scholarship Program. ADB MANAGEMENT S DISCUSSION AND ANALYSIS: 31 DECEMBER 2015
47 40 Financing partners provided the following commitments and replenishments to existing trust funds: (i) (ii) (iii) (iv) (v) (vi) (vii) (viii) (ix) $109 million from the Government of Japan for the Afghanistan Infrastructure Trust Fund, Asia Pacific Project Preparation Facility, Japan Fund for Poverty Reduction (JFPR), Japan Fund for the Joint Crediting Mechanism, and Japan Scholarship Program (JSP); $35 million from ANA Trust Fund for the Afghanistan Infrastructure Trust Fund; $16 million from the Government of Canada for the Asia Pacific Project Preparation Facility; $15 million from the Government of the United Kingdom for the Clean Energy Fund under the Clean Energy Financing Partnership Facility; $10 million from the Government of Switzerland for the Urban Climate Change Resilience Trust Fund under the Urban Financing Partnership Facility; $8 million from the Government of the United States for the Afghanistan Infrastructure Trust Fund; $8 million from the Government of Australia for the Pacific Business Investment Trust Fund; $1 million form the Government of Republic of Korea for the e-asia Knowledge and Partnership Fund; and $0.5 million from the Government of Finland for the Typhoon Yolanda Multi Donor Trust Fund. Additional allocations from global funding initiatives comprised $52 million from the Climate Investment Funds, and $3 million from the Global Environment Facility. Japan Fund for Poverty Reduction. The Government of Japan established the JFPR in May 2000 to provide grants for projects supporting poverty reduction and related social development activities that can add value to projects financed by ADB. In 2011, the JFPR expanded its scope of grant assistance to provide TA grants in addition to project grants. At the end of 2015, JFPR funds totaled about $703 million. The Government of Japan had approved 173 grant projects (equivalent to $508 million) and 207 TA projects (equivalent to $245 million) of which ADB had subsequently approved 169 grant projects (equivalent to $502 million) and 198 TA projects (equivalent to $228 million) funded by JFPR. Japan Scholarship Program. The Government of Japan established the JSP in 1988 to provide an opportunity for well-qualified citizens of DMCs to undertake postgraduate studies in economics, management, science and technology, and other development-related fields at selected educational institutions in Asia and the Pacific. Between 1988 and 2015, Japan has contributed $165 million and 3,387 scholarships were awarded to recipients from 37 member countries. Of the total, 3,028 have completed their courses. Women have received 1,239 scholarships. An average of 148 new scholarships per year has been awarded since As of 2015, JSP has 29 participating institutions in 10 countries. ADB MANAGEMENT S DISCUSSION AND ANALYSIS: 31 DECEMBER 2015
48 Table 27: Schedule of Cumulative Contributions and Net Assets of Grants from External Sources As of 31 December 2015 ($ million) Item Contribution Net Assets b Item Contribution Net Assets b Administered by ADB a Country Non-Sovereign entities and external trust funds Australia Bill and Melinda Gates Austria Foundation Belgium Clean Technology Fund Brunei Darussalam ENECO Energy Trade B.V Canada Global Agriculture and Food China, People's Security Program Republic of Global Environment Fund Denmark Special Climate European Community Change Fund Finland Least Developed France Countries Fund Germany International Fund for Agricultural India Development Ireland Nordic Development Fund 40.3 (0.5) Italy 2.2 POSCO Japan 1, Public Private Infrastructure Korea, Republic of Advisory Facility Luxembourg Strategic Climate Fund The Netherlands Trust Fund for Forest New Zealand The Rockefeller Foundation Norway (1.5) Other Portugal 0.6 Spain Sweden Switzerland United Kingdom and Northern Ireland 1, United States Subtotal 5, ,293.4 Subtotal 1, Grand Total 6, ,258.1 = nil, ( ) = negative, ADB = Asian Development Bank. Notes: 1. Numbers may not sum precisely because of rounding = amount less than $0.5 million. a Excludes capital contributions to Credit Guarantee and Investment Facility (CGIF). b Excludes projects approved but not yet effective. 41 ADB MANAGEMENT S DISCUSSION AND ANALYSIS: 31 DECEMBER 2015
49 42 Appendix ORDINARY CAPITAL RESOURCES CONDENSED MANAGEMENT REPORTING BALANCE SHEETS As of 31 December 2015 and 2014 ($ million) Item Statutory Management Reporting Basis Adjustments a Reporting Basis Management Reporting Basis Due from banks Investments 23,315 23,315 23,006 Securities transferred under repurchase agreements 30 Securities purchased under resale arrangements ,257 Loans outstanding 61,889 61,889 55,845 Unamortized net loan origination costs, less allowance for loan losses Equity investments 862 (23) Accrued interest receivable Investments Loans Derivative Assets Borrowings 21,664 (1,065) 20,599 25,566 Investments 7,112 (21) 7,091 5,580 Loans 762 (14) Other assets ,761 1,972 TOTAL 117,697 (263) 117, ,419 Borrowings and accrued interest 66,054 (814) 65,240 61,381 Derivative Liabilities Borrowings 24,985 (79) 24,906 28,353 Investments 6,679 (48) 6,631 4,980 Loans 608 (26) Payable under securities repurchase agreements 30 Payable for swap related collateral Accounts payable and other liabilities 1,431 1,431 1,526 Total Liabilities 100,251 (967) 99,284 97,326 Paid-in capital 6, ,293 7,229 Net notional maintenance of value receivable (1,616) (1,616) (1,537) Ordinary reserve 11, ,984 11,562 Special reserve Loan loss reserve Surplus 1,065 1,065 1,065 Cumulative revaluation (125) 125 adjustments account Net income b 537 (213) Accumulated other comprehensive loss (1,366) (71) (1,437) (1,308) Total Equity 17, ,150 18,093 TOTAL 117,697 (263) 117, ,419 = nil, ( ) = negative. a Includes reversal of ASC Topics 815 and 825 effects, Asian Development Bank s share in unrealized gains or losses from equity investments accounted for under the equity method, and nonnegotiable, and noninterest-bearing demand obligations on account of subscribed capital. b Net income after appropriation of guarantee fees to the Special Reserve. ADB MANAGEMENT S DISCUSSION AND ANALYSIS: 31 DECEMBER 2015
50 Financial Statements
51 [This page is intentionally left blank]
52 45 ORDINARY CAPITAL RESOURCES MANAGEMENT'S REPORT ON INTERNAL CONTROL OVER FINANCIAL REPORTING The management of Asian Development Bank ("ADB") is responsible for establishing and maintaining adequate internal control over financial reporting. ADB's internal control over financial reporting is a process designed to provide reasonable assurance regarding the reliability of financial reporting and the preparation of financial statements for external purposes in accordance with generally accepted accounting principles in the United States of America. ADB's internal control over financial reporting includes those policies and procedures that (i) pertain to the maintenance of records that, in reasonable detail, accurately and fairly reflect the transactions and dispositions of the assets of ADB; (ii) provide reasonable assurance that transactions are recorded as necessary to permit preparation of financial statements in accordance with generally accepted accounting principles in the United States of America, and that receipts and expenditures of ADB are being made only in accordance with authorizations of management and directors of ADB; and (iii) provide reasonable assurance regarding prevention or timely detection and correction of unauthorized acquisition, use, or disposition of ADB's assets that could have a material effect on the financial statements. Because of its inherent limitations, internal control over financial reporting may not prevent or detect misstatements. Also, projections of any evaluation of effectiveness to future periods are subject to the risk that controls may become inadequate because of changes in conditions, or that the degree of compliance with the policies or procedures may deteriorate. ADB's management assessed the effectiveness of ADB's internal control over financial reporting as of 31 December In making this assessment, ADB's management used the criteria set forth by the Committee of Sponsoring Organizations of the Treadway Commission in Internal Control Integrated Framework (2013). Based on that assessment, management believes that as of 31 December 2015, ADB's internal control over financial reporting is effective based upon the criteria established in Internal Control Integrated Framework (2013). Takehiko Nakao President Thierry de Longuemar Vice-President (Finance and Risk Management) Chai S. Kim Controller 11 March 2016
53 46
54 47
55 48
56 49
57 50 ASIAN DEVELOPMENT BANK ORDINARY CAPITAL RESOURCES BALANCE SHEET 31 December 2015 and 2014 Expressed in Millions of US Dollars A S S E T S DUE FROM BANKS (Note C) $ 753 $ 417 INVESTMENTS (Notes D, I, N, and Q) Government or government-guaranteed obligations $ 20,635 $ 18,177 Time deposits 1,308 3,971 Other securities 1,372 23, ,006 SECURITIES TRANSFERRED UNDER REPURCHASE AGREEMENTS (Notes D, E, and Q) 30 SECURITIES PURCHASED UNDER RESALE ARRANGEMENTS (Notes D and Q) 126 1,257 LOANS OUTSTANDING (OCR-6) (Notes A, F, I, Q, and S) (Including net unamortized loan origination costs of $ and $ ) Sovereign 57,555 52,351 Nonsovereign 4,420 3,574 61,975 55,925 Less allowance for loan losses 34 61, ,890 EQUITY INVESTMENTS (Notes A, H, Q, and S) ACCRUED INTEREST RECEIVABLE Investments Loans DERIVATIVE ASSETS (Notes D, I, K, and Q) Borrowings 21,664 26,830 Investments 7,112 5,596 Loans , ,092 OTHER ASSETS Property, furniture, and equipment (Note J) Investment related receivables 10 9 Swap related collateral (Notes I and Q) Miscellaneous (Notes G, O, and Q) TOTAL $ 117,697 $ 115,660 The accompanying notes are an integral part of these financial statements (OCR-9).
58 51 OCR-1 LIABILITIES AND EQUITY BORROWINGS (OCR-7) (Notes I, K, and Q) At amortized cost $ 4,259 $ 3,662 At fair value 61,795 $ 66,054 59,039 $ 62,701 DERIVATIVE LIABILITIES (Notes D, I, K, and Q) Borrowings 24,985 28,372 Investments 6,679 5,034 Loans , ,987 PAYABLE UNDER SECURITIES REPURCHASE AGREEMENTS (Notes E and Q) 30 ACCOUNTS PAYABLE AND OTHER LIABILITIES Investment related payables 10 6 Swap related collateral (Notes I and Q) Accrued pension and postretirement medical benefit costs (Note P) 1,258 1,352 Miscellaneous (Notes G, J, O, and Q) 163 1, ,004 TOTAL LIABILITIES 100,251 98,722 EQUITY (OCR-4) Capital stock (OCR-8) (Note L) Authorized (SDR106, and 2014) Subscribed (SDR106, and 2014, less temporary reduction of SDR and SDR ) 147, ,056 Less callable shares subscribed (SDR100, and 2014, less temporary reduction of SDR and SDR ) 139, ,376 Paid-in shares subscribed 7,374 7,680 (SDR5, and 2014, less temporary reduction of SDR and SDR ) Less subscription installments not due Subscription installments matured 7,374 7,313 Less capital transferred to the Asian Development Fund and discount ,293 7,229 Nonnegotiable, noninterest-bearing demand obligations on account of subscribed capital (Note L) (860) (1,098) 6,433 6,131 Net notional amounts required to maintain value of currency holdings (Note L) (1,616) (1,537) Ordinary reserve (Note M) 11,981 11,559 Special reserve (Note M) Loan loss reserve (Note M) Surplus (Note M) 1,065 1,065 Cumulative revaluation adjustments account (Note M) (125) 59 Net income after appropriation (OCR-4) (Note M) Accumulated other comprehensive loss (Note M) (1,366) 17,446 (1,238) 16,938 TOTAL $ 117,697 $ 115,660 0 = less than $0.5 million.
59 52 OCR-2 ASIAN DEVELOPMENT BANK ORDINARY CAPITAL RESOURCES STATEMENT OF INCOME AND EXPENSES For the Years Ended 31 December 2015 and 2014 Expressed in Millions of US Dollars REVENUE (Note N) From loans (Notes F and I) Interest $ 673 $ 596 Commitment charge Other, net (44) $ 678 (41) $ 605 From investments (Notes D and I) Interest From guarantees From equity investments (19) 17 From other sources net (Notes F and R) TOTAL REVENUE $ 1,029 $ 973 EXPENSES (Note N) Borrowings and related expenses (Notes I and K) Administrative expenses (Note M) Write-back for loan losses (Note F) (1) (1) Other expenses TOTAL EXPENSES NET REALIZED GAINS From investments (Notes D, I, M, and N) From equity investments (Notes M and N) From borrowings (Note I) 1 NET REALIZED GAINS NET UNREALIZED GAINS (LOSSES) (Notes H, I, K, and N) 239 (193) NET INCOME $ 556 $ 387 The accompanying notes are an integral part of these financial statements (OCR-9).
60 53 OCR-3 ASIAN DEVELOPMENT BANK ORDINARY CAPITAL RESOURCES STATEMENT OF COMPREHENSIVE INCOME (LOSS) For the Years Ended 31 December 2015 and 2014 Expressed in Millions of US Dollars NET INCOME (OCR-2) $ 556 $ 387 Other comprehensive (loss) income (Note M) Currency translation adjustments $ (136) $ (100) Unrealized investment holding losses (125) (57) Pension/postretirement liability adjustments 133 (128) (440) (597) COMPREHENSIVE INCOME (LOSS) $ 428 $ (210) The accompanying notes are an integral part of these financial statements (OCR-9).
61 54 OCR-4 ASIAN DEVELOPMENT BANK ORDINARY CAPITAL RESOURCES STATEMENT OF CHANGES IN EQUITY For the Years Ended 31 December 2015 and 2014 Expressed in Millions of US Dollars (Note L) Nonnegotiable, Cumulative Accumulated Noninterest- Net Notional Revaluation Net Income Other Capital bearing Demand Maintenance Ordinary Special Loan Loss Adjustments After Comprehensive Stock Obligations of Value Reserve Reserve Reserve Surplus Account Appropriations Loss Total Balance, 1 January 2014 $ 6,843 $ (958) $ (1,390) $ 11,166 $ 282 $ 261 $ 1,065 $ (38) $ 548 $ (641) $ 17,138 Comprehensive loss (OCR-3, Note M) 387 (597) (210) Appropriation of guarantee fees (Note M) 21 (21) Change in subscription installments not due and paid-in shares 662 (264) 398 Effect of change in SDR/USD rate on capital transferred to ADF 4 (4) Effect of change in SDR/USD rate on paid-in capital (281) Encashment of demand obligations Change in US Dollar value (Note L) 1 83 (366) (282) Allocation of prior year income (Note M) 332 (31) 97 (398) Allocation of prior year income to ADF and TASF (Note M) (150) (150) Transfer of unutilized PEF funds (Note M) 3 3 Balance, 31 December 2014 $ 7,229 $ (1,098) $ (1,537) $ 11,559 $ 303 $ 230 $ 1,065 $ 59 $ 366 $ (1,238) $ 16,938 Comprehensive income (OCR-3, Note M) 556 (128) 428 Appropriation of guarantee fees (Note M) 19 (19) Change in subscription installments not due and paid-in shares 321 (74) 247 Effect of change in SDR/USD rate on capital transferred to ADF 3 (3) Effect of change in SDR/USD rate on paid-in capital (262) Encashment of demand obligations Change in US Dollar value (Note L) 2 55 (300) (243) Allocation of prior year income (Note M) 384 (15) (183) (186) Allocation of prior year income to ADF, TASF and APDRF (Note M) (180) (180) Balance, 31 December 2015 $ 7,293 $ (860) $ (1,616) $ 11,981 $ 322 $ 215 $ 1,065 $ (125) $ 537 $ (1,366) $ 17,446 ADF - Asian Development Fund, APDRF - Asia Pacific Disaster Response Fund, PEF - Pakistan Earthquake Fund, SDR - Special Drawing Rights, TASF - Technical Assistance Special Fund, US - United States. The accompanying notes are an integral part of these financial statements (OCR-9).
62 55 ASIAN DEVELOPMENT BANK ORDINARY CAPITAL RESOURCES STATEMENT OF CASH FLOWS For the Years Ended 31 December 2015 and 2014 Expressed in Millions of US Dollars OCR CASH FLOWS FROM OPERATING ACTIVITIES Interest and other charges on loans received $ 613 $ 554 Interest on investments received Interest paid for securities purchased under resale/repurchase arrangements 0 (0) Interest and other financial expenses paid (281) (233) Administrative expenses paid (346) (665) Others net Net Cash Provided by Operating Activities CASH FLOWS FROM INVESTING ACTIVITIES Sales of investments 12,377 8,858 Maturities of investments 161, ,009 Purchases of investments (174,769) (187,506) Receipts from securities purchased under resale arrangements 125, ,519 Payments for securities purchased under resale arrangements (124,743) (156,523) Principal collected on loans 3,479 4,306 Loans disbursed (9,623) (7,327) Receipts from derivatives Payments for derivatives (69) Property, furniture, and equipment acquired (17) (30) Change in swap related collateral 17 (108) Purchases of equity investments (124) (184) Sales of equity investments Net Cash Used in Investing Activities (5,650) (2,760) CASH FLOWS FROM FINANCING ACTIVITIES Proceeds from new borrowings 23,175 16,733 Borrowings redeemed (16,583) (14,389) Capital subscriptions collected Issuance expenses paid (25) (21) Demand obligations of members encashed Receipts from derivatives Payments for derivatives (1,315) Resources transferred from PEF 3 Resources transferred to ADF (120) (120) Resources transferred to TASF (40) (30) Resources transferred to APDRF (20) Net Cash Provided by Financing Activities 5,667 2,877 Effect of Exchange Rate Changes on Due from Banks (35) (56) Net Increase in Due from Banks Due from Banks at Beginning of Year Due from Banks at End of Year $ 753 $ 417 RECONCILIATION OF NET INCOME TO NET CASH PROVIDED BY OPERATING ACTIVITIES: Net Income (OCR-2) $ 556 $ 387 Adjustments to reconcile net income to net cash provided by operating activities: Depreciation and amortization Write-back of loan losses (1) (1) Net realized gains from investments, equity investments and other borrowings (56) (288) Proportionate share in losses (earnings) on equity investments 28 (3) Net unrealized (gains) losses (239) 193 Change in accrued revenue from loans, investments and other swaps (85) (47) Change in receivable from ADF allocation of administrative expenses (10) (6) Change in accrued interest on borrowings and swaps, and other expenses (34) 120 Change in pension and postretirement benefit liability 132 (440) Others net (23) (0) Net Cash Provided by Operating Activities $ 354 $ 40 ADF - Asian Development Fund, APDRF - Asia Pacific Disaster Response Fund, PEF - Pakistan Earthquake Fund, TASF - Technical Assistance Special Fund. 0 = less than $0.5 million. Supplementary disclosure of noncash financing activities: 1 Nonnegotiable, noninterest-bearing demand promissory notes amounting to $74 million ($266 million 2014) were received from members. The accompanying notes are an integral part of these financial statements (OCR-9).
63 56 ASIAN DEVELOPMENT BANK ORDINARY CAPITAL RESOURCES SUMMARY STATEMENT OF LOANS 31 December 2015 and 2014 Expressed in Millions of US Dollars Undisbursed Loans Loans Balances of Not Yet Total Percent of Borrowers/Guarantors Outstanding 1 Effective Loans 2 Effective 3 Loans Total Loans Armenia $ 102 $ 219 $ 113 $ Azerbaijan 1,040 1, , Bangladesh 1,825 1, , Bhutan Cambodia China, People's Republic 15,715 5,596 2,074 23, Cook Islands Fiji Georgia India 14,301 6,802 2,248 23, Indonesia 8, , Kazakhstan 2, , Kyrgyz Republic Lao People's Democratic Republic Malaysia Maldives Marshall Islands Micronesia, Federated States of Mongolia Myanmar Pakistan 4,522 2, , Palau Papua New Guinea Philippines 5, , Sri Lanka 1, , Tajikistan Thailand , Timor-Leste Turkmenistan Uzbekistan 1,728 1, , Viet Nam 2,915 2,622 1,048 6, ,848 25,899 10,072 97, Regional TOTAL 31 December ,889 25,911 10,099 97, Allowance for loan losses (34) (34) Unamortized loan origination cost net NET BALANCE 31 December 2015 $ 61,941 $ 25,911 $ 10,099 $ 97,951 Made up of: Sovereign Loans $ 57,555 $ 24,334 $ 8,235 $ 90,124 Nonsovereign Loans Private Sector 3,968 1,483 1,344 6,795 Public Sector ,032 NET BALANCE 31 December 2015 $ 61,941 $ 25,911 $ 10,099 $ 97,951 TOTAL 31 December 2014 $ 55,845 $ 26,140 $ 8,078 $ 90,063 Allowance for loan losses (35) (35) Unamortized loan origination cost net NET BALANCE 31 December 2014 $ 55,890 $ 26,140 $ 8,078 $ 90,108 Made up of: Sovereign Loans $ 52,351 $ 24,249 $ 6,428 $ 83,028 Nonsovereign Loans Private Sector 3,168 1,425 1,595 6,188 Public Sector Net Balance 31 December 2014 $ 55,890 $ 26,140 $ 8,078 $ 90,108 1 Amounts outstanding on the pool-based loans totaled $2,781 million ($3,404 million 2014) and on LIBOR-based loans, market-based and local currency loans totaled $59,108 million ($52,441 million 2014). The average yield on loans was 1.16% (1.15% 2014). 2 Refer to the unwithdrawn portions of effective loans as of 31 December Of the undisbursed balances, ADB has made irrevocable commitments to disburse various amounts totaling $575 million ($385 million 2014). 3 Loans totaling $6,209 million ($6,531 million 2014) have been approved by ADB, but the related agreements have not been signed. Agreements for loans totaling $3,890 million ($1,547 million 2014) have been signed, but the loans are not effective and disbursements will not start until the relevant conditions to the effectiveness of the loans have been fulfilled. The accompanying notes are an integral part of these financial statements (OCR-9).
64 57 OCR-6 continued MATURITY OF EFFECTIVE LOANS AS OF 31 DECEMBER 2015 Twelve Months Five Years Ending Ending 31 December Amount 31 December Amount 2016 $ 3, , , , , , , , ,260 over Total $ 87,800 SUMMARY OF CURRENCIES RECEIVABLE ON LOANS OUTSTANDING Currency Currency Yuan $ 479 $ 425 Rupiah Euro Tenge Lari 42 New Zealand dollar Yen 1,259 1,657 Philippine peso 7 5 Indian rupee Baht US dollar 59,564 53,174 Total $ 61,889 $ 55,845
65 58 ASIAN DEVELOPMENT BANK ORDINARY CAPITAL RESOURCES SUMMARY STATEMENT OF BORROWINGS 31 December 2015 and 2014 Expressed in Millions of US Dollars Borrowings Swap Arrangements 2 Principal Outstanding 1 Payable (Receivable) 3 Net Currency Obligation Australian dollar $ 8,750 $ 9,643 $ (8,773) $ (9,587) $ (23) $ 56 Brazilian real 874 1,127 (874) (1,124) (0) 3 Canadian dollar 1,391 1,264 (1,412) (1,266) (21) (2) Yuan (80) (29) Euro 1,819 1,850 (1,827) (1,849) (8) 1 Hong Kong dollar (10) (10) 0 0 Indian rupee Yen 1,026 1,694 1,317 1,560 1,401 1,617 (942) (1,637) Ringgit (120) (148) (0) 0 Mexican peso (294) (344) (30) (34) New Zealand dollar 1,730 1,721 (1,736) (1,714) (6) 7 Norwegian krone (118) (140) (0) 1 Pound sterling 1,675 2,665 (1,675) (2,658) 0 7 Singapore dollar (343) (370) (0) 1 South African rand (319) (928) (0) 2 Swiss franc (291) (281) Baht (29) (33) (0) (0) Turkish lira 855 2,292 (856) (2,288) (1) 4 Lari US dollar 45,323 37,022 23,656 26,785 67,014 61,383 (1,965) (2,424) Total $ 66,054 $ 62,701 $ 3,321 $ 1,542 $ 69,375 $ 64,243 0 = less than $0.5 million. 1 Includes accrued interest and commission. Reported at fair value except for unswapped borrowings which are reported at principal amount net of unamortized discount/premium. The aggregate face amounts and discounted values of zero coupon and deep discount borrowings (in US dollar equivalents) are: Aggregate Face Amount Currency Australian dollar $ 335 $ 377 $ 274 $ 294 Brazilian real South African rand Swiss franc Turkish lira Mexican peso US dollar 1,848 3,516 1,348 2,175 The average cost of borrowings after swaps was 0.19% (0.82% ). Discounted Value
66 59 OCR-7 continued MATURITY STRUCTURE OF BORROWINGS OUTSTANDING AS OF 31 DECEMBER Twelve Months Five Years Ending Ending 31 December Amount 31 December Amount 2016 $ 14, , , , , ,021 over ,195 Total $ 66,054 INTEREST RATE SWAP ARRANGEMENTS AS OF 31 DECEMBER 2015 Average Rate (%) Notional Pay Maturing Amount Receive Floating 5 Through 6 Receive Fixed Swaps: Australian dollar 7 $ (0.12) Yuan US dollar 40, US dollar (0.26) Receive Floating Swaps: Yen (0.27) US dollar 7, Total $ 48,224 2 Include currency and interest rate swaps. At 31 December 2015, the remaining maturity of swap agreements range from less than one year to 20 years. Approximately 83% of the swap receivables and 85% of the payables are due before 1 January Adjusted by the cumulative effect of the adoption of ASC 815 effective 1 January Bonds with put and call options were considered maturing on the first put or call date. 5 Represents average current floating rates, net of spread. 6 Swaps with early termination date were considered maturing on the first termination date. 7 Consists of dual currency swaps with interest receivable in Australian dollar and interest payable in yen. 8 Consists of dual currency swaps with interest receivable in US dollar and interest payable in yen. The accompanying notes are an integral part of these financial statements (OCR-9).
67 60 ASIAN DEVELOPMENT BANK ORDINARY CAPITAL RESOURCES STATEMENT OF SUBSCRIPTIONS TO CAPITAL STOCK AND VOTING POWER 31 December 2015 Expressed in Millions of US Dollars SUBSCRIBED CAPITAL VOTING POWER Number of Percent Par Value Of Shares 1 Number of Percent MEMBERS Shares of Total Total Callable Paid-in Votes of Total REGIONAL Afghanistan 3, $ 49.7 $ 43.1 $ , Armenia 31, , Australia 614, , , , Azerbaijan 47, , Bangladesh 108, , , , Bhutan , Brunei Darussalam 37, , Cambodia 5, , China, People s Republic of 684, , , , Cook Islands , Fiji 7, , Georgia 36, , Hong Kong, China 57, , India 672, , , , Indonesia 578, , , , Japan 1,656, , , , ,696, Kazakhstan 85, , , , Kiribati , Korea, Republic of 534, , , , Kyrgyz Republic 31, , Lao People s Democratic Republic 1, , Malaysia 289, , , , Maldives , Marshall Islands , Micronesia, Federated States of , Mongolia 1, , Myanmar 57, , Nauru , Nepal 15, , New Zealand 163, , , , Pakistan 231, , , , Palau , Papua New Guinea 9, , Philippines 252, , , , Samoa , Singapore 36, , Solomon Islands , Sri Lanka 61, , Taipei,China 115, , , , Tajikistan 30, , Thailand 144, , , , Timor-Leste 1, , Tonga , Turkmenistan 26, , Tuvalu , Uzbekistan 71, , Vanuatu , Viet Nam 36, , Total Regional (Forward) 6,743, , , , ,643,
68 61 OCR-8 continued SUBSCRIBED CAPITAL VOTING POWER Number of Percent Par Value Of Shares 1 Number of Percent MEMBERS Shares of Total Total Callable Paid-in Votes of Total Total Regional (Forward) 6,743, , , , ,643, NONREGIONAL Austria 36, , Belgium 36, , Canada 555, , , , Denmark 36, , Finland 36, , France 247, , , , Germany 459, , , , Ireland 36, , Italy 191, , , , Luxembourg 36, , The Netherlands 108, , , , Norway 36, , Portugal 12, , Spain 36, , Sweden 36, , Switzerland 61, , Turkey 36, , United Kingdom 216, , , , United States 1,645, , , , ,684, Total Nonregional 3,859, , , , ,610, TOTAL 10,603, , , , ,253, Note: Numbers may not sum precisely because of rounding. 1 The authorized capital stock of the ADB has a par value of $10,000 in terms of US dollars of the weight and fineness in effect on 31 January Pending ADB's selection of the appropriate successor to the 1966 dollar, the par value of each share is SDR 10,000 for financial reporting purposes. Exchange rate at 31 December 2015 was $ (Notes B and L) The accompanying notes are an integral part of these financial statements (OCR-9).
69 62 OCR-9 ASIAN DEVELOPMENT BANK ORDINARY CAPITAL RESOURCES NOTES TO FINANCIAL STATEMENTS 31 December 2015 and 2014 NOTE A NATURE OF OPERATIONS AND LIMITATIONS ON LOANS, GUARANTEES AND EQUITY INVESTMENTS Nature of Operations The Asian Development Bank (ADB), a multilateral development financial institution, was established in 1966 with its headquarters in Manila, Philippines. ADB and its operations are governed by the Agreement Establishing the Asian Development Bank (the Charter). Its purpose is to foster economic development and co-operation in Asia and the Pacific region and to contribute to the acceleration of the process of economic development of the developing member countries (DMCs) in the region, collectively and individually. Since 1999, ADB s corporate vision and mission has been to help DMCs reduce poverty in the region. This was reaffirmed under the long-term strategic framework for (Strategy 2020). Under Strategy 2020, ADB s corporate vision continues to be An Asia and Pacific Free of Poverty and its mission has been to help its DMCs reduce poverty and improve living conditions and quality of life. ADB has been pursuing its mission and vision by focusing on three complementary strategic agendas: inclusive growth, environmentally sustainable growth, and regional integration. ADB conducts its operations through the ordinary capital resources (OCR) and Special Funds (See Note R). Mobilizing financial resources, including cofinancing, is another integral part of ADB s operational activities, where ADB, alone or jointly, administers on behalf of donors funds provided for specific uses. ADB s OCR operations comprise loans, equity investments, and guarantees. ADB finances its ordinary operations through borrowings, paid-in capital, and reserves. ADB is immune from taxation pursuant to Chapter VIII, Article 56, Exemption from Taxation, of the Charter. Combined ADF-OCR Lending Operations In April 2015, the Board of Governors adopted the resolution authorizing the termination of Asian Development Fund (ADF) loan operations and the transfer of ADF loans, resources originally set-aside from the OCR, and certain other assets as may be determined by the Board of Directors to OCR effective 1 January After the effective date of this transfer, concessional lending to lower-income countries will continue from the expanded OCR. Limitations on Loans, Guarantees, and Equity Investments Article 12, paragraph 1 of the Charter provides that the total amount outstanding of loans, equity investments, and guarantees made by ADB shall not exceed the total of ADB s unimpaired subscribed capital, reserves, and surplus, exclusive of the special reserve. ADB s policy on lending limitations limits the total amount of disbursed loans, disbursed equity investments and related prudential buffer, and the maximum amount that could be demanded from ADB under its guarantee portfolio, to the total amount of ADB s unimpaired subscribed capital, reserves and surplus exclusive of the special reserve. At 31 December 2015, the total of such loans, equity investments and related prudential buffers, and guarantees aggregated approximately 39.6% (34.6% 2014) of the total subscribed capital, reserves, and surplus exclusive of the special reserve. Article 12, paragraph 3 of the Charter provides that equity investments shall not exceed 10% of the unimpaired paid-in capital actually paid up at any given time together with reserves and surplus, exclusive of the special reserve. At 31 December 2015, such equity investments represented approximately 6.7% (7.6% 2014) of the paid-in capital, reserves, and surplus, as defined.
70 63 OCR-9 continued NOTE B SUMMARY OF SIGNIFICANT ACCOUNTING POLICIES Presentation of the Financial Statements The financial statements of OCR are prepared in accordance with accounting principles generally accepted in the United States of America (US GAAP). Functional Currencies and Reporting Currency The currencies of members are all functional currencies of ADB as these are the currencies of the primary economic environment in which OCR generates and expends cash. The reporting currency is the US dollar. Translation of Currencies ADB adopts the use of daily exchange rates for accounting and financial reporting purposes. This allows transactions in currencies other than the US dollar to be translated to the reporting currency using exchange rates applicable at the time of transactions. At the end of each accounting month, translations of assets, liabilities, capital, and reserves denominated in non-us dollar currencies are adjusted using the applicable rates of exchange at the end of the reporting period. These translation adjustments, other than those relating to the non-functional currencies (Note N) and to the maintenance of special drawing right (SDR) capital values (Notes L and M), are charged or credited to Accumulated translation adjustments and reported in EQUITY as part of Accumulated other comprehensive loss. Valuation of Capital Stock The authorized capital stock of ADB is defined in Article 4, paragraph 1 of the Charter in terms of US dollars of the weight and fineness in effect on 31 January 1966 (1966 dollar) and the value of each share is defined as 10, dollars. The capital stock had historically been translated into the current US dollar (ADB s unit of account) on the basis of its par value in terms of gold. From 1973 until 31 March 1978, the rate arrived at on this basis was $ per 1966 dollar. Since 1 April 1978, at which time the Second Amendment to the Articles of Agreement of the International Monetary Fund (IMF) came into effect, currencies no longer have par values in terms of gold. Pending ADB s selection of the appropriate successor to the 1966 dollar, the capital stock has been valued for purposes of these financial statements in terms of the SDR at the value in US dollars as determined by the IMF, with each share valued at SDR10,000. As of 31 December 2015, the value of the SDR in terms of the US dollar was $ ($ ) giving a value for each share of ADB s capital equivalent to $13, ($14, ). Derivative Financial Instruments ADB reports all derivative transactions in accordance with Accounting Standards Codification (ASC) 815, Derivatives and Hedging. ADB has elected not to define any qualifying hedging relationships, not because economic hedges do not exist, but rather because the application of ASC 815 hedging criteria does not make fully evident ADB s risk management strategies. All derivative instruments, as defined by ASC 815, have been marked to fair value (FV), and all changes in FV have been recognized in net income. ADB records derivatives in the Balance Sheet as either assets or liabilities measured at FV, consistent with the legal rights and way the instruments are settled. Individual interest rate swaps under the Master Agreement of the International Swaps and Derivatives Association (ISDA), absent of local market constraints, are recorded on a net basis, while all other swaps, including cross currency and foreign exchange swaps, are recorded on a gross basis.
71 64 OCR-9 continued Investments All investment securities and negotiable certificates of deposit held by ADB are considered by Management to be Available for Sale and are reported at FV. Unrealized gains and losses are reported in EQUITY as part of Accumulated other comprehensive loss. Realized gains and losses are reported in the Statement of Income and Expenses under NET REALIZED GAINS From investments and are measured by the difference between amortized cost and the net proceeds of sales using the specific identification method for internally managed investment portfolio and the weighted average cost method for externally managed investment portfolio. Interest income on investment securities and time deposits is recognized as earned and reported, net of amortization of premiums and discounts. Unrealized losses on investment securities are assessed to determine whether the impairment is deemed to be other than temporary. If the impairment is deemed to be other than temporary, the investment is written down to the impaired value, which becomes the new cost basis of the investment. Impairment losses are not reversed for subsequent recoveries in the value of the investment, until it is sold. Securities Transferred Under Repurchase Agreements and Securities Purchased Under Resale Arrangements ADB accounts for transfers of financial assets in accordance with ASC 860, Transfers and Servicing. Transfers are accounted for as sales when control over the transferred assets has been relinquished. Otherwise the transfers are accounted for as repurchase/resale agreements and collateralized financing arrangements. Under repurchase agreements, securities transferred are recorded as assets and reported at estimated FV and cash received is recorded as a liability. ADB monitors the FV of the securities transferred under repurchase agreements and the collateral. Under resale arrangements, securities purchased are recorded as assets and are not re-pledged. Loans ADB s loans are made to or guaranteed by members, with the exception of nonsovereign loans. Loan interest income and loan commitment fees are recognized on accrual basis. In line with ADB s principle of cost pass-through pricing, the funding cost margin is passed on to LIBOR-based loan borrowers as a surcharge or rebate. It is the policy of ADB to place loans in non-accrual status for which principal, interest, or other charges are overdue by six months. Interest and other charges on non-accruing loans are included in income only to the extent that payments have been received by ADB. Accordingly, loans are reinstated to accrual status when all the principal, interest and other charges due on the loan have been paid. ADB maintains a position of not taking part in debt rescheduling agreements with respect to sovereign loans. In the case of nonsovereign loans, ADB may agree to debt rescheduling only after alternative courses of action have been exhausted. ADB s periodic evaluation of the adequacy of the allowance for loan losses is based on its past loan loss experience, known and inherent risks in existing loans, and adverse situations that may affect a borrower s ability to repay. For sovereign loans, ADB determines that a loan is impaired and therefore subject to provisioning when principal or interest is in arrears for more than one year. Specific provision for sovereign loan losses is written-back when the borrower s arrears have been fully settled and the borrower has re-established regular loan service payments. The nonsovereign loans are individually reviewed and subject to provisioning when the loan is considered impaired. The impairment is determined based on the difference between the loan carrying value and the present value of expected future cash flows discounted at the loan s effective
72 65 OCR-9 continued interest rate. In addition, ADB provides collective provisions for nonsovereign loans based on the credit risk ratings and probability of default and assumed loss given default. ADB establishes loan loss reserves for both sovereign and nonsovereign credit exposures to be used as a basis for capital adequacy against expected losses in loans and guarantees. The amount of expected loss pertaining to credit exposures that is not impaired or subject to collective provision is recorded as loan loss reserve in the EQUITY section of the balance sheet. Any adjustment to loan loss reserve following this methodology is subject to the approval of the Board of Governors. From 2000 to 2003, ADB levied front-end fees on all new sovereign loans. These fees are deferred and amortized over the life of the loans after offsetting deferred direct loan origination costs. Front-end fees were waived on sovereign loans approved from 2004 and were eliminated for sovereign loans negotiated on or after 1 October Since 1988, ADB has charged front-end fees for nonsovereign loans. ADB levies a commitment charge on the undisbursed balance of effective loans. Unless otherwise provided by the loan agreement, the charges take effect commencing on the 60th day after the loan signing date and are credited to loan income. Guarantees ADB provides guarantees under its sovereign and nonsovereign operations. Guarantees are regarded as outstanding when the underlying financial obligation of the borrower is incurred. ADB would be required to perform under its guarantees if the payments guaranteed were not made by the debtor, and the guaranteed party called the guarantee by demanding payments from ADB in accordance with the term of the guarantee. For guarantees issued and modified on or after 1 January 2003, ADB recognizes at the inception of a guarantee, a liability for the stand-by obligation to perform on guarantees. A front-end fee on guarantees received is deferred and amortized over the term of the guarantee contract. ADB records a contingent liability for the probable losses related to guarantees outstanding. This provision, as well as the unamortized balance of the deferred guarantee fee income, and the unamortized balance of the obligation to stand ready, are included in ACCOUNTS PAYABLE AND OTHER LIABILITIES - Miscellaneous on the Balance Sheet. Collateral ADB requires collateral from individual swap counterparties in the form of approved liquid securities or cash to mitigate its credit exposure to these counterparties. ADB records the restricted cash in OTHER ASSETS with a corresponding obligation to return the cash in ACCOUNTS PAYABLE AND OTHER LIABILITIES. Collateral received in the form of liquid securities is disclosed in Note I and not recorded on OCR s Balance Sheet. Equity Investments Investments in equity securities with readily determinable market price are considered Available for Sale and are reported at FV, with unrealized gains and losses reported in EQUITY as part of Accumulated other comprehensive loss. ADB reports equity investments with associated derivatives at FV, with changes in FV reported in the Statement of Income and Expenses under NET UNREALIZED GAINS (LOSSES). ADB applies the equity method of accounting to investments where it has the ability to exercise significant influence such as in limited liability partnerships (LLPs) and certain limited liability companies (LLCs) that maintain a specific ownership account for each investor in accordance with ASC , Partnerships, Joint Ventures, and Limited Liability Entities and direct equity investment that fall under the purview of ASC 323, Investments Equity Method and Joint Ventures.
73 66 OCR-9 continued Investments in equity securities without readily determinable FVs are reported at cost or at written down value. ADB has determined that it is not practicable to estimate the FV of equity investments reported at cost or written down. These investments are assessed each quarter to reflect the amount that can be realized using valuation techniques appropriate to the market and industry of each investment. When impairment is identified and is deemed to be other than temporary, the equity investment is written down to the impaired value, which becomes the new cost basis of the equity investments. Impairment losses are not reversed for subsequent recoveries in the value of the equity investments. Variable Interest Entities ADB complies with ASC 810, Consolidated Financial Statements. ASC 810 requires an entity to consolidate and provide disclosures for any Variable Interest Entity (VIE) for which it is the primary beneficiary. ASC 810 defines the primary beneficiary as the entity that both has the (i) power to direct the activities that most significantly impact the economic performance of the VIE and the (ii) obligation to absorb losses or the right to receive residual returns of the entity. Variable interests can arise from equity investments, loans, guarantees, and other contractual agreements that change with the changes in the FV of the VIE s net assets exclusive of variable interests. ADB is required to disclose information about its involvement in VIEs where ADB holds variable interest (see Note S). Property, Furniture, and Equipment Property, furniture, and equipment are stated at cost and, except for land, depreciated over estimated useful lives on a straight-line basis. Maintenance, repairs, and minor betterments are charged to expense. Land is stated at cost and is not amortized. Borrowings Borrowings are used as a source to provide funds for ADB s operations. ADB diversifies its funding sources across markets, instruments, and maturities. In conjunction, ADB uses currency and interest rate swaps for asset and liability management. ADB reports selected borrowings that are swapped or have floating interest rates at FV. Changes in FV are reported in the Statement of Income and Expenses under NET UNREALIZED GAINS (LOSSES). Fixed rate borrowings, including legacy borrowings that do not have associated swaps continue to be reported at amortized cost. Amortization of discounts and premiums and issuance costs associated with new borrowings are deferred and amortized over the period during which the borrowing is outstanding. Fair Value of Financial Instruments ASC 820, Fair Value Measurement defines FV as the price that would be received to sell an asset or paid to transfer a liability at measurement date in an orderly transaction among willing participants with an assumption that the transaction takes place in the entity s principal market, or in the absence of principal market, in the most advantageous market for the asset or liability. The most advantageous market is the market where the sale of the asset or transfer of liability would maximize the amount received for the asset or minimize the amount paid to transfer the liability. The FV measurement is not adjusted for transaction cost. The Fair Value Option ADB has adopted the Fair Value Option subsections of ASC 825, Financial Instruments (ASC 825 or the Fair Value Option). ASC 825 permits the measurement of eligible financial assets, financial liabilities and firm commitments at FV on an instrument-by-instrument basis, that are not otherwise permitted to be accounted for at FV under other accounting standards. The election to use the FV Option is available when an entity first recognizes a financial asset or liability or upon entering into a firm commitment.
74 67 OCR-9 continued In adopting ASC 825, ADB elected to record and report at FV all borrowings that are swapped or have floating interest rates. This election allows ADB to apply a consistent accounting treatment between borrowings and their related swaps. ADB continues to report its loans and fixed rate borrowings, including legacy borrowings that do not have associated swaps at amortized cost and reports most of its investments (except time deposits that are recorded at cost) at FV. Fair Value Hierarchy ASC 820 establishes a FV hierarchy that gives the highest priority to quoted prices in active markets for identical assets or liabilities (Level 1), next priority to observable market inputs or market corroborated data (Level 2), and the lowest priority to unobservable inputs without market corroborated data (Level 3). The FVs of ADB s financial assets and liabilities are categorized as follows: Level 1: FVs are based on unadjusted quoted prices for identical assets or liabilities in active markets. Level 2: FVs are based on quoted prices for similar assets or liabilities in active markets or markets that are not active; or valuation models for which significant inputs are obtained from market-based data that are observable. Level 3: FVs are based on prices or valuation models for which significant inputs to the model are unobservable. Inter-level transfers from one year to another may occur due to changes in market activities affecting the availability of quoted market prices or observable market data. ADB s policy is to recognize transfers in and transfers out of levels as of the end of the reporting period in which they occur. Accounting Estimates The preparation of the financial statements requires Management to make reasonable estimates and assumptions that affect the reported amounts of assets and liabilities and disclosure of contingent liabilities at the end of the year and the reported amounts of revenues and expenses during the year. The actual results could differ from those estimates. Judgments have been used in the valuation of certain financial instruments, the determination of the adequacy of the accumulated provisions for losses on loans and other exposures (irrevocable commitments and guarantees), the determination of net periodic cost from pension and other postretirement benefits plans, and the present value of benefit obligations. Accounting and Reporting Developments In May 2014, the Financial Accounting Standards Board (FASB) issued Accounting Standard Update (ASU) Revenue from Contracts with Customers (Topic 606) to improve financial reporting by creating common revenue recognition guidance for US GAAP and the International Financial Reporting Standards. An entity is required to apply the amendments prospectively for annual reporting periods beginning after 15 December In August 2015, FASB issued ASU deferring the effective date by one year. ADB is currently assessing the impact on OCR's financial statements. In June 2014, the FASB issued ASU Development Stage Entities (Topic 915) Elimination of Certain Financial Reporting Requirements, Including an Amendment to Variable Interest Entities Guidance in Topic 810, Consolidation. The amendments in this Update remove all incremental financial reporting requirements for development stage entities under US GAAP. In addition, the amendments in Topic 810 may affect the consolidation analysis and decision for a reporting entity that has an interest in an entity in the development stage, by eliminating the exception to the sufficiency-of-equity-at-risk criterion for development stage entities. The amendments to Topic 810 should be applied retrospectively
75 68 OCR-9 continued for annual reporting periods beginning after 15 December 2015, and interim periods therein. This ASU is not expected to impact OCR s financial statements. Also in June 2014, the FASB issued ASU Transfers and Servicing (Topic 860) Repurchase-to- Maturity Transactions, Repurchase Financings, and Disclosures to change the accounting for repurchase-to-maturity transactions and linked repurchase financings to secured borrowing accounting, which is consistent with the accounting for other repurchase agreements. The amendments require an entity to disclose information on transfers accounted for as sales in transactions that are economically similar to repurchase agreements and to provide increased transparency about the types of collateral pledged in repurchase agreements and similar transactions accounted for as secured borrowings. An entity is required to apply the disclosure amendments prospectively for annual reporting periods beginning after 15 December 2014, and for interim periods after 15 March Additional disclosure requirements have been incorporated in Note E. In August 2014, the FASB issued ASU , Presentation of Financial Statements Going Concern (Subtopic ), to require management to perform interim and annual assessments of an entity s ability to continue as a going concern within one year of the date the financial statements are issued. An entity must provide certain disclosures if conditions or events raise substantial doubt about the entity s ability to continue as a going concern. The ASU applies to all entities and is effective for annual periods ending after 15 December 2016, and interim periods thereafter. This ASU is not expected to impact OCR s financial statements. In November 2014, the FASB issued ASU Derivatives and Hedging (Topic 815) - Determining Whether the Host Contract in a Hybrid Financial Instrument Issued in the Form of a Share Is More Akin to Debt or to Equity a Consensus of the FASB Emerging Issues Task Force. The amendment requires an entity to consider all of a hybrid instrument s stated and implied substantive terms and features, including any embedded derivative features evaluated for bifurcation to determine the nature of a host contract in a hybrid financial instrument issued in the form of a share. An entity is required to apply the amendments for fiscal years, and interim periods within those fiscal years beginning after 15 December ADB is currently assessing the impact of this ASU on OCR s financial statements. In 2015, the FASB issued the following ASUs which are effective for public business entities for fiscal years, and for interim periods within those fiscal years, beginning after 15 December ADB is currently assessing the impact of these ASUs on OCR s financial statements. ASU Consolidation (Topic 810) Amendments to the Consolidation Analysis, which amends the consolidation requirements and significantly changes the consolidation analysis required. The amendments reduce the number of consolidation models and place more emphasis on risk of loss when determining a controlling financial interest. A reporting entity may apply the amendments in this Update retrospectively or by using a modified retrospective approach by recording a cumulative-effect adjustment to equity as of the beginning of the fiscal year of adoption. ASU Interest Imputation of Interest (Subtopic ) Simplifying the Presentation of Debt Issuance Costs, requires that debt issuance costs related to a recognized debt liability, currently reported as deferred charges, be presented in the balance sheet as a direct deduction from the carrying amount of that debt liability, consistent with debt discounts. This Update does not change the recognition and measurement guidance for debt issuance costs. ASU Intangibles Goodwill and Other Internal-Use Software (Subtopic ) Customer s Accounting for Fees Paid in a Cloud Computing Arrangement, provides guidance to customers on accounting for cloud computing arrangement, giving consideration of whether the arrangement includes license software or not. In January 2016, the FASB issued ASU , Financial Instruments Overall (Subtopic ) - Recognition and Measurement of Financial Assets and Financial Liabilities. This Update enhances the reporting requirements for financial instruments. Specifically, this Update (i) requires that investments in equity securities measured at FV, recognize changes in FV in net income, (ii) simplifies the impairment assessment of equity investments for which FV is not readily determinable by requiring entities to perform a
76 69 OCR-9 continued qualitative assessment to identify impairment, (iii) amends certain disclosure requirements associated with the FV of financial instruments, and (iv) requires to present separately in other comprehensive income the portion of the total change in the FV of financial liabilities measured at FV resulting from a change in the instrument-specific credit risk. This Update is effective for fiscal years beginning after 15 December 2017 and interim periods thereafter. ADB is currently assessing the impact of this ASU on OCR s financial statements. In February 2016, the FASB issued ASU , Leases (Topic 842). This amendment requires the recognition of lease assets and lease liabilities by lessees for those leases classified as operating leases. It also requires qualitative disclosures along with specific quantitative disclosures. This Update is effective for fiscal years beginning after 15 December 2018 and interim periods thereafter. ADB is currently assessing the impact of this ASU on OCR s financial statements. Statement of Cash Flows For the purposes of the Statement of Cash Flows, ADB considers that its cash and cash equivalents are limited to DUE FROM BANKS, which consist of cash on hand and current accounts in banks used for (i) operational disbursements, (ii) receipt of funds from encashment of members promissory notes, and (iii) clearing accounts. NOTE C RESTRICTIONS ON USE OF CURRENCIES OF MEMBERS In accordance with Article 24, paragraph 2(i) of the Charter, the use by ADB or by any recipient from ADB of certain currencies may be restricted by members to payments for goods or services produced and intended for use in their territories. With respect to the currencies of 40 DMCs for 2015 ( ), cash in banks (due from banks) totaling $88 million ($107 million 2014) may be, but are not currently so restricted. In accordance with Article 24, paragraphs 2(i) and (ii) of the Charter, no member has restricted the use by ADB or by any recipient from ADB of its currency to payments for goods or services produced in its territory. NOTE D INVESTMENTS The main investment management objective is to maintain security and liquidity. Subject to these parameters, ADB seeks the highest possible return on its investments. Investments are governed by the Investment Authority approved by the Board of Directors. ADB enters into currency and interest rate swaps, and forward rate agreements. Exposure to interest rate risk may be adjusted within defined bands to reflect changing market conditions. These adjustments are made through the purchase and sale of securities. Other securities as of 31 December 2015 consisted of corporate obligations and debt securities totaling $1,372 million ($858 million 2014). ADB may engage in securities lending of government or government-guaranteed obligations and corporate obligations, for which ADB receives a guarantee from the securities custodian and a fee. Transfers of securities by ADB to counterparties are not accounted for as sales as the accounting criteria for the treatment of a sale have not been met. These securities must be available to meet ADB s obligation to counterparties. Included in Investments as of 31 December 2015 were securities transferred under securities lending arrangements of government or government-guaranteed obligations totaling $24 million ($32 million 2014).
77 70 OCR-9 continued The currency composition of the investment portfolio as of 31 December 2015 and 2014 expressed in US dollars was as follows: ($ million) Currency US dollar $ 12,677 $ 14,682 Yen 5,779 3,877 Won 2,005 1,002 Euro Australian dollar Canadian dollar Yuan New Zealand dollar Indian Rupee Others 522 1,055 Total $ 23,315 $ 23,006 The estimated FV and amortized cost of the investments by contractual maturity at 31 December 2015 and 2014 were as follows: ($ million) Estimated Amortized Estimated Amortized Fair Value Cost Fair Value Cost Due in one year or less $ 7,279 $ 7,274 $ 8,462 $ 8,443 Due after one year through five years 15,735 15,758 13,983 13,922 Due after five years through ten years Due after ten years through fifteen years Total $ 23,315 $ 23,310 $ 23,006 $ 22,902 Additional information relating to investments in government or government-guaranteed obligations and other securities classified as available for sale are as follows: ($ million) As of 31 December Amortized cost $ 22,002 $ 18,932 Estimated fair value 22,007 19,036 Gross unrealized gains Gross unrealized losses (81) (37) For the year ended 31 December Change in net unrealized gains from prior year (99) $ (31) Proceeds from sales 12,377 8,858 Gross gain on sales Gross loss on sales (1) (1)
78 71 OCR-9 continued The table below provides a listing of investments that sustained unrealized losses as of 31 December Five government or government-guaranteed obligations ( ), and 31 corporate obligations ( ) sustained unrealized losses for over one year, representing 2.92% (9.74% 2014) of the total investments. Comparative details for 2015 and 2014 are as follows: ($ million) One year or less Over one year Total Fair Unrealized Fair Unrealized Fair Unrealized Value Losses Value Losses Value Losses 2015 Government or governmentguaranteed obligations $ 10,142 $ 69 $ 164 $ 6 $ 10,306 $ 75 Other securities Corporate obligations ,163 6 Total $ 10,787 $ 73 $ 682 $ 8 $ 11,469 $ Government or governmentguaranteed obligations $ 4,530 $ 13 $ 2,152 $ 22 $ 6,682 $ 35 Other securities Corporate obligations Total $ 4,932 $ 14 $ 2,240 $ 23 $ 7,172 $ 37
79 72 OCR-9 continued Fair Value Disclosure The fair value of INVESTMENTS and related financial assets as of 31 December 2015 and 2014 was as follows: ($ million) Fair Value Measurements 2015 Total Level 1 Level 2 Level 3 Investments Government or government-guaranteed obligations $ 20,635 $ 19,303 $ 1,332 $ Time deposits 1,308 1,308 Other securities 1,372 1, Securities transferred under repurchase agreements Securities purchased under resale arrangements Total at fair value $ 23,441 $ 20,656 $ 2,779 $ Investments Government or government-guaranteed obligations $ 18,177 $ 16,138 $ 2,039 $ Time deposits 3,971 3,971 Other securities Securities transferred under repurchase agreements Securities purchased under resale arrangements 1,257 1,257 Total at fair value $ 24,293 $ 17,017 $ 7,270 $ 6 If available, active market quotes are used to assign fair values to investment securities and related financial assets. These include most government or government-guaranteed obligations, corporate obligations, and other debt securities. Investments and related financial assets where active market quotes are not available are categorized as Level 2 or Level 3, and valuation is provided by independent valuation services, custodians, and asset managers, or based on discounted cash flow model using market observable inputs, such as interest rates, foreign exchange rates, basis spreads, cross currency rates, and volatilities, and unobservable inputs, such as option adjusted spreads, and other techniques. Time deposits are reported at cost, which approximates FV. OCR s INVESTMENTS are governed by the Investment Authority approved by the Board of Directors. The asset and liability management committee and risk committee are involved in overseeing the activities and performance of the investment portfolio. ADB maintains documented processes and internal controls to value the investment securities and financial assets. The data management unit in the treasury department is responsible for providing the valuation in accordance with the business process. In instances where ADB relies primarily on prices from third party pricing information, there are procedures in place to validate the appropriateness of those values in determining the hierarchy levels. This involves evaluating the nature of prices provided by third party pricing sources to determine if they are indicative or binding prices. The significant unobservable inputs used in valuing the other securities classified as Level 3 include the internal rate of return (IRR) incorporating fluctuation in the foreign exchange rate between the US dollar and the Indian rupee. The IRR ranged from 10% - 15% as of 31 December 2015 and 31 December 2014.
80 73 OCR-9 continued The table below provides the details of transfers between Levels 1 and 2, which are attributed to the availability or absence of market quotes for the years ended 31 December 2015 and 2014: ($ million) Level 1 Level 2 Level 1 Level 2 Investments Government or government-guaranteed obligations Transfers into (out of) $ 20 $ (20) $ 68 $ (68) Transfers (out of) into (35) 35 (20) 20 Corporate obligations Transfers into (out of) 249 (249) 10 (10) Transfers (out of) into (11) 11 (2) 2 $ 223 $ (223) $ 56 $ (56) The following table presents the changes in the carrying amounts of ADB s Level 3 investments for the years ended 31 December 2015 and 2014: ($ million) Balance, beginning of year $ 6 $ Total gains (losses) - (realized/unrealized) Included in other comprehensive loss (Note M) Accumulated translation adjustments (0) (0) Unrealized investment holding gains 0 0 Purchases 6 Balance, end of year $ 6 $ 6 The amount of total gains for the year recognized in other comprehensive loss attributable to the change in net unrealized gains or losses a relating to assets still held at the reporting date $ 0 $ 0 Note: There were no realized gains and losses included in earnings and transfers in and out of Level 3. a Included in unrealized investment holding gains for the period (Note M). 0 = less than $0.5 million
81 74 OCR-9 continued NOTE E SECURITIES TRANSFERRED UNDER REPURCHASE AGREEMENTS ADB has entered into Global Master Repurchase Agreements with counterparties in which ADB agrees to transfer securities under repurchase agreements. The agreements provide for the right of a party to terminate if any of the various events of default and termination events specified occur and includes provisions to offset the sum due from one party against the sum due from the other. All securities transferred under repurchase agreements are in government or government-guaranteed securities that are rated investment grade. ADB monitors daily the FV of margin securities for compliance with the repurchase agreement. The gross amounts of PAYABLE UNDER SECURITIES REPURCHASE AGREEMENTS subject to enforceable master netting agreements presented in the balance sheet as of 31 December 2014 are summarized below. There is none as of 31 December (See Note I for Derivative Instruments.) ($ million) (a) (b) (c) = (a) - (b) Gross amount of Gross amounts not offset in the liabilities balance sheet presented in the Financial 2014 balance sheet instruments Collateral pledged Net amount Payable under securities repurchase agreement $ 30 $ 30 $ $ 0 Total $ 30 $ 30 $ $ 0 0 = less than $0.5 million There are no repurchase agreements accounted for as secured borrowings as of 31 December The following table shows the details as of 31 December ($ million) Remaining contractual maturity of the agreements Days Days > 90 Days Total Payable under securities repurchase agreement Government or government-guaranteed obligations $ 30 $ $ $ 30 Total $ 30 $ $ $ 30 Gross amount of recognized liabilities for repurchase agreements disclosed above 30 Amounts related to agreements not included in offsetting disclosure
82 75 OCR-9 continued NOTE F LOANS Loans The carrying amount and estimated FV of loans outstanding by lending window at 31 December 2015 and 2014 were as follows: ($ million) Carrying Estimated Carrying Estimated Value Fair Value Value Fair Value Pool-based single currency loans (yen) $ 181 $ 181 $ 391 $ 391 Pool-based single currency loans (US$) 2,600 3,019 3,013 3,524 LIBOR-based loans a 58,181 58,385 51,546 51,748 Local currency loans 979 1, ,394 Total $ 61,941 $ 62,604 $ 55,890 $ 57,057 a This includes market-based loans. On 1 July 1986, ADB adopted a multicurrency pool-based variable lending rate system. In July 1992, ADB introduced a US dollar pool-based variable lending rate system, and in November 1994, a market-based lending rate system was made available to sovereign and nonsovereign borrowers. The outstanding balances of pool-based multicurrency loans were subsequently transformed into pool-based single currency loans in yen, effective 1 January ADB introduced LIBOR-based loans (LBLs) in the following currencies US dollar, euro, and yen on 1 July The LBL lending facility offers borrowers (i) choice of currency and interest rate basis; (ii) flexibility to change the original loan terms (currency and interest rate basis) at any time during the life of the loan; and (iii) options to cap or collar the floating lending rate at any time during the life of the loan. With the introduction of LBLs, prior loan windows are no longer offered to borrowers. ADB enhanced the LBL lending facility to sovereign LBLs negotiated after 1 January 2007, offering additional major currencies that ADB can efficiently intermediate, and additional repayment options including (i) annuity method with various discount factors, (ii) straight-line repayment, (iii) bullet repayment, and (iv) custom-tailored repayment. In November 2002, ADB started to offer local currency loans (LCL) to nonsovereign borrowers and extended the LCL to sovereign borrowers in In June 2009, ADB established a Countercyclical Support Facility (CSF) in response to the global economic crisis that spread to Asia and the Pacific. Loans approved under the CSF carry a lending spread of 2.0% above ADB s average funding cost, and have a maturity of 5 years, including a 3-year grace period. As of 31 December 2015, outstanding CSF loans amounted to $1,500 million (nil 2014). In April 2011, ADB established the project design facility on a pilot basis to support project preparation, particularly detailed engineering designs, through project design advances (PDA). The facility is designed to be refinanced from the proceeds of the ADB loan for the ensuing project. PDAs approved carry standard lending rates. Payment of interest is deferred until the PDA is refinanced out of the loans proceeds, or other repayment terms take effect. During 2015, ADB received prepayments for eight loans (six loans 2014) amounting to $154 million ($317 million 2014), of which $39 million was for sovereign loans ($5 million 2014) and $115 million was for nonsovereign loans ($312 million 2014).
83 76 OCR-9 continued Waiver on Loan Charges For eligible sovereign loans negotiated before 1 October 2007, ADB continued to provide a waiver of a portion of interest on loans and commitment charges on undisbursed balances. The reduction in net income from the waivers on loan charges for the years ended 31 December 2015 and 2014 is summarized below: ($ million) Interest waiver $ 6 $ 20 Commitment charge waiver 0 0 Total $ 6 $ 20 0 = less than $0.5 million Loans in Non-accrual Status ADB places loans in non-accrual status when they are past due by six months. As of 31 December 2015 and 2014, there were no loans in non-accrual status. An analysis of the age of the recorded loans outstanding that are past due as of 31 December 2015 and 2014 is as follows: ($ million) Overdue Loan Service Payments 1 90 Days > 90 Days Total Current Total Loans 2015 Sovereign Loans $ 0 $ $ 0 $ 57,432 $ 57,432 Nonsovereign Loans ,454 4,457 Total $ 2 $ 1 $ 3 $ 61,886 61,889 Allowance for loan losses (34) Unamortized loan origination costs net 86 Net Loans Outstanding $ 61, Sovereign Loans $ 0 $ $ 0 52,239 $ 52,239 Nonsovereign Loans 3,606 3,606 Total $ 0 $ $ 0 $ 55,845 55,845 Allowance for loan losses (35) Unamortized loan origination costs net 80 Net Loans Outstanding $ 55,890 0 = less than $0.5 million
84 77 OCR-9 continued Undisbursed loan commitments and an analysis of loans by borrower as of 31 December 2015 are shown in OCR-6. The carrying amounts of loan outstanding by loan products at 31 December 2015 and 2014 were as follows: ($ million) Sovereign Loans Pool-based single currency loans (yen) $ 181 $ 391 Pool-based single currency loans (US$) 2,600 3,013 LIBOR-based loans 54,586 48,714 Local currency loans ,432 52,239 Allowance for loan losses Unamortized direct loan origination cost net Subtotal 57,555 52,351 Nonsovereign Loans LIBOR-based loans 3,534 2,779 Local currency loans ,457 3,606 Allowance for loan losses (34) (35) Unamortized front-end fee net (37) (32) (71) (67) Subtotal 4,386 3,539 Total $ 61,941 $ 55,890 Allowance for Loan Losses ADB has not suffered any losses of principal on sovereign loans to date. During the year, no loan loss provision has been made against outstanding sovereign loans (nil 2014). There was no accumulated loan loss provision for sovereign loans as of 31 December 2015 and A net writeback of $1 million was made for nonsovereign loans ($1 million writeback 2014) consisting of $2 million provision ($3 million 2014), and $3 million write-back ($4 million write-back 2014).
85 78 OCR-9 continued The changes in the allowance for loan losses during 2015 and 2014 as well as information pertaining to loans which were subject to specific allowance for loan losses were as follows: ($ million) Sovereign Loans Nonsovereign Loans Total Sovereign Loans Nonsovereign Loans Total Allowance for Credit Losses: Beginning balance $ $ 35 $ 35 $ $ 36 $ 36 Provision during the year Written back/off (3) (3) (4) (4) Ending Balance $ $ 34 $ 34 $ $ 35 $ 35 Outstanding Allowance on: Individually evaluated for loan losses $ $ 6 $ 6 $ $ 7 $ 7 Collectively evaluated for loan losses $ $ 28 $ 28 $ $ 28 $ 28 Outstanding Loans $ 57,432 $ 4,457 $ 61,889 $ 52,239 $ 3,606 $ 55,845 Individually evaluated for loan losses $ $ 18 $ 18 $ $ 21 $ 21 Collectively evaluated for loan losses $ $ 4,439 $ 4,439 $ $ 3,585 $ 3,585 Loans subject to provisioning with related allowance for loan losses during 2015 and 2014 were as follows: ($ million) Recorded Loan Receivable No loans were modified or restructured for the years ended 31 December 2015 and Credit Risks and Quality of Loans Unpaid Principal balance Related allowance Recorded Loan Receivable Unpaid Principal balance Related allowance Sovereign Loans $ $ $ $ $ $ Nonsovereign Loans ADB is exposed to credit risks in the loan portfolio if a borrower defaults or its creditworthiness deteriorates. Credit risks represent the potential loss due to possible nonperformance by obligors and counterparties under the terms of the contract. ADB manages credit risk for lending operations through continuous monitoring of creditworthiness of the borrowers and the capital adequacy framework. ADB monitors credit quality of the loans by assigning a risk rating to each loan on an internal scale from 1 to 14 with 1 denoting the lowest expectation of credit risk and 14 denoting that the borrower has defaulted. The rating scale corresponds to the rating scales used by international rating agencies. For sovereign loans, ADB has a process of assigning internal ratings to provide more accurate inputs for risk measurements. For nonsovereign loans, each transaction is reviewed and assigned a rating based on a methodology that is broadly aligned with the rating approach of international rating agencies. The risk ratings are used to monitor the credit risks in the portfolio.
86 79 OCR-9 continued The following table summarizes the credit quality of sovereign and nonsovereign loans after the effect of risk transfers. High credit risk includes $18 million in nonsovereign loans that were considered impaired ($21 million in nonsovereign loans 2014). ($ million) Sovereign Loans Nonsovereign Loans Risk Class Risk Rating Low credit risk 1 5 (AAA to BBB ) $ 44,447 $ 40,458 $ 2,001 $ 1,576 Medium credit risk 6 11 (BB+ to B ) 12,955 7,335 2,368 1,741 High credit risk (CCC+ to D) 30 4, Total $ 57,432 $ 52,239 $ 4,457 $ 3,606 As of 31 December 2015, ADB s loan and guarantee portfolios had a significant concentration of credit risk to Asia and the Pacific region. The credit exposure determined based on FV amounted to $64,011 million ($58,797 million 2014). Fair Value Disclosure ADB does not sell its sovereign loans, nor does it believe there is a market for its sovereign loans. As of 31 December 2015 and 2014, all loans are carried at amortized cost. Fair valuation is based on internal discounted cash flow models in which expected cash flows are discounted at applicable market yield curves, plus ADB's lending spread, reduced by the specific and collective provisions. Inputs for the models are based on available market data such as yield curves, interest rates, volatilities, credit curves, and foreign exchange rates. Parameters and models used for valuation are subject to internal review and periodic external validation. The accounting division is responsible for determining and reporting the FV of the loan portfolio. The office of risk management is primarily responsible for determining the specific and collective provisions for the nonsovereign loans and the accounting division, in coordination with regional departments, is responsible for determining the specific provisions for sovereign loans. The provisioning levels are discussed at the risk committee and reported to the Board of Directors quarterly. The significant observable inputs used in valuing the various classes of loans classified as Level 2 include foreign exchange rates and yield curves specified to index fixed rates, deposit and swap interest rates, and yield curves specified to LIBOR. The significant unobservable inputs used in valuing the various classes of loans classified as Level 3 include probability of default, weighted average cost of fixed and floating rate borrowings attached to pool-based single currency loans and swaps spreads for selected currencies. Significant increase (decrease) in these unobservable inputs, independently, will generally decrease (increase) the FV of the loan. The hierarchy of estimated FV of ADB loans as of 31 December 2015 and 2014 was as follows: ($ million) Level 1 $ $ Level 2 56,815 50,362 Level 3 5,789 6,695 Total loans at fair value $ 62,604 $ 57,057
87 80 OCR-9 continued Cofinancing ADB functions as lead lender in cofinancing arrangements with other participating financial institutions who also provide funds to ADB s sovereign and nonsovereign borrowers. In such capacity, ADB provides loan administration services, which include loan disbursements and/or loan collections. The participating financial institutions have no recourse to ADB for their outstanding loan balances. These loans are not recorded as part of OCR s Balance Sheet. Loans administered by ADB on behalf of participating institutions during the year ended 31 December 2015 and 2014 were as follows: ($ million) No.of No.of Amount Loans Amount Loans Sovereign loans $ 1, $ 1, Nonsovereign loans 1, Total $ 2, $ 2, NOTE G GUARANTEES ADB provides guarantees under its sovereign and nonsovereign operations. Such guarantees include (i) credit guarantees where certain principal and/or interest payments are covered; (ii) political risk guarantees, which provide coverage against well-defined country risk events; and (iii) guarantees for certain traderelated obligations. While counter-guarantees from the host government are required for all sovereign guarantees, guarantees for nonsovereign projects may be provided with or without a host government counter-guarantee. ADB also seeks risk-sharing arrangements that set ADB s net exposure under a guarantee at the lowest level required to mobilize the necessary financing while maintaining a participation that is meaningful to its financing partners. A counter-guarantee takes the form of a counter-guarantor s agreement to indemnify ADB for any payment it makes under the guarantee. In the event that a guarantee is called, ADB has the contractual right to require payment from the counter-guarantor, on demand, or as ADB may otherwise direct. Tenors of guarantees are subject to risk considerations and market conditions. They should normally not exceed the maximum tenor of ADB s ordinary capital resources lending operations, as may be adjusted from time to time, and there is no minimum tenor. In some cases however, guarantees may be for short tenors if the underlying obligations are short term, such as trade related products..
88 81 OCR-9 continued The committed and outstanding amounts of these guarantee obligations as of 31 December 2015 and 2014 covered: ($ million) Committed Outstanding Committed Outstanding Amount Amount Amount Amount Credit Guarantees Trade Related with counterguarantee $ 135 $ 135 $ 280 $ 280 without counterguarantee Non-Trade Related with counterguarantee without counterguarantee , Subtotal 1,789 1,334 1,996 1,626 Political Risk Guarantees Non-Trade Related with counterguarantee without counterguarantee Subtotal Total $ 1,975 $ 1,407 $ 2,186 $ 1,740 The committed amount represents the maximum potential amount of undiscounted future payments that ADB could be required to make, inclusive of standby portion for which ADB is committed but not currently at risk. The outstanding amount represents the guaranteed amount utilized under the related loans, which have been disbursed as of the end of the year, exclusive of the standby portion. As of 31 December 2015, a total liability of $21 million ($25 million 2014) relating to standby ready obligations for eight credit risk guarantees (six 2014) and three political risk guarantees (three 2014) has been included in ACCOUNTS PAYABLE AND OTHER LIABILITIES Miscellaneous on the Balance Sheet for all guarantees issued after 31 December As of 31 December 2015 and 2014, no credit guarantee with nonsovereign counter-guarantee had collateral from a counter-guarantor. Fair Value Disclosure As of 31 December 2015 and 2014, all of ADB s future guarantee receivables and guarantee liabilities are classified as Level 3 within the FV hierarchy. The accounting division is responsible for determining and reporting the FV of guarantees reported in the balance sheet. Future guarantee receivables and guarantee liabilities are stated at discounted present value using significant unobservable inputs such as discount rates applicable to individual guarantee contracts that are internally determined and are classified under Level 3. An increase (decrease) in discount rates generally results in a decrease (increase) in the FV of the guarantees.
89 82 OCR-9 continued The valuation technique and significant unobservable quantitative inputs for guarantee receivables/ guarantee liabilities classified as Level 3 as of 31 December 2015 and 2014 were summarized below: Valuation Unobservable Range (Average) Portfolio Technique Inputs Guarantee receivable/ Guarantee liability Discounted cash flows Discount rates 3.04% to 5.37% (3.5%) 3.04% to 5.37% (3.6%) The following table presents the changes in the carrying amounts of ADB s Level 3 future guarantee receivable/liability for the years ended 31 December 2015 and 2014: ($ million) Guarantee Receivable/Liability Balance, 1 January $ 25 $ 32 Issuances Amortization (17) (19) Balance, 31 December $ 21 $ 25 Note: There were no realized/unrealized gains and losses included in earnings and other comprehensive loss. NOTE H EQUITY INVESTMENTS ADB s equity investments may be in the form of direct equity investments (e.g. common, preferred, or other capital stock) or through investment funds (e.g. private equity funds). They are reported: (i) at fair value; (ii) under the equity method; and (iii) at cost or written down value as follows: ($ million) Equity method $ 578 $ 577 Cost method Fair value method Total $ 862 $ 862 Equity investments with readily determinable FVs that are not accounted for under the equity method are reported at FV. As of 31 December 2015, these included an equity investment which was classified as available for sale amounting to $23 million ($63 million 2014) and equity investments with associated derivative amounting to $11 million ($9 million 2014). There were no equity investments classified as available for sale that sustained unrealized losses in 2015 and 2014.
90 83 OCR-9 continued Additional information relating to equity investments classified as available for sale is as follows: ($ million) As of 31 December Amortized cost $ 11 $ 24 Estimated fair value Gross unrealized gains Gross unrealized losses For the years ended 31 December Change in unrealized gains from prior year (27) (45) Proceeds from sales Gross gain on sales Gross loss on sales Approved equity investments that have not been disbursed totaled $432 million at 31 December 2015 ($433 million 2014). Fair Value Disclosure ADB s equity investments reported at FV as of 31 December 2015 were $34 million ($72 million 2014). Equity investments with readily determinable market prices are valued using quoted prices in active markets and are classified as Level 1. Equity investments valued with financial models using unobservable inputs are classified as Level 3. The office of risk management is primarily responsible for determining the FV of equity investments with associated derivatives using discounted cash flow models. Inputs for the models are based on significant unobservable inputs such as discount rates and asset growth rates applicable to individual equity investment contracts that are internally determined and are classified as Level 3. An increase (decrease) in discount rates results in a decrease (increase) in the FV of the equity investments. The FV hierarchy of ADB s equity investments at FV as of 31 December 2015 and 2014 was as follows: ($ million) Level 1 $ 23 $ 63 Level 2 Level Total equity investments at fair value $ 34 $ 72
91 84 OCR-9 continued The valuation technique and significant unobservable inputs for equity investment classified as Level 3 as of 31 December 2015 and 2014 were as presented below. Valuation Unobservable Range (Average) Portfolio Technique Inputs Equity investment Discounted cash flows Discount rates 23.35% 20.00% to 25.00% (23.35%) Asset growth rates 20.00% to 30.00% (23.33%) 20.00% to 25.00% (25.00%) The following table presents the changes in the carrying amounts of ADB s Level 3 equity investments for the years ended 31 December 2015 and 2014: ($ million) Balance, beginning of year $ 9 $ 6 Total gains (losses) - (realized/unrealized) Included in earnings a 2 3 Included in other comprehensive loss b (2) (1) Purchases 2 1 Balance, end of year $ 11 $ 9 The amount of total gains for the year included in earnings attributable to the change in unrealized gains relating to assets still held at reporting date a $ 2 $ 3 a Included in net unrealized gains (losses) (OCR-2). b Included in accumulated translation adjustments (Note M). NOTE I DERIVATIVE INSTRUMENTS ADB uses derivative instruments such as interest rate swaps, currency swaps, and foreign exchange swaps and forwards for asset and liability management of individual positions and portfolios. The FV of outstanding currency and interest rate swap agreements is determined at the estimated amount that ADB would receive or pay to terminate the agreements using market-based valuation models. The basis of valuation is the present value of expected cash flows based on market data. Included in DERIVATIVE ASSETS/DERIVATIVE LIABILITIES Borrowings are interest rate and currency swaps that ADB has entered into for the purpose of hedging specific borrowings. The terms of ADB s interest rate swap and currency swap agreements usually match the terms of particular borrowings. Included in DERIVATIVE ASSETS/DERIVATIVE LIABILITIES Investments are interest rate, currency and foreign exchange swaps and forwards that ADB has entered into for the purpose of hedging specific investments. Included in DERIVATIVE ASSETS/DERIVATIVE LIABILITIES Loans are interest rate and currency swaps that ADB has entered into for the purpose of hedging specific loans. The loan related swaps were executed to better align the composition of certain outstanding loans with funding sources. Future dated derivatives as of 31 December 2015 amounted to $9 million for derivative assets ($9 million 2014) and $0.04 million for derivative liabilities ($0.2 million 2014).
92 85 OCR-9 continued Fair Value Disclosure The FV hierarchy of ADB s derivatives and the balance sheet location as of 31 December 2015 and 2014 were as follows: ($ million) Balance Sheet Fair Value Measurements 2015 Location Total Level 1 Level 2 Level 3 Assets Borrowings related derivatives Derivative Assets Currency swaps - Borrowings $ 21,194 $ $ 19,576 $ 1,618 Interest rate swaps Investments related derivatives Derivative Assets Currency swaps - Investments 5,822 5,822 Interest rate swaps Foreign exchange swaps 1,286 1,286 Foreign exchange forwards 4 4 Loans related derivatives Derivative Assets Currency swaps - Loans Interest rate swaps Total assets at fair value $ 29,538 $ $ 27,920 $ 1,618 Liabilities Borrowings related derivatives Derivative Liabilities Currency swaps - Borrowings $ 24,886 24,886 Interest rate swaps Investments related derivatives Derivative Liabilities Currency swaps - Investments 5,341 5,341 Interest rate swaps Foreign exchange swaps 1,287 1,287 Foreign exchange forwards 4 4 Loans related derivatives Derivative Liabilities Currency swaps - Loans Interest rate swaps Total liabilities at fair value $ 32,272 $ $ 31,787 $ 485
93 86 OCR-9 continued ($ million) Balance Sheet Fair Value Measurements 2014 Location Total Level 1 Level 2 Level 3 Assets Borrowings related derivatives Derivative Assets Currency swaps - Borrowings $ 26,149 $ $ 20,173 $ 5,976 Interest rate swaps Investments related derivatives Derivative Assets Currency swaps - Investments 5,099 5,099 Interest rate swaps Foreign exchange swaps Foreign exchange forwards Loans related derivatives Derivative Assets Currency swaps - Loans Interest rate swaps Total assets at fair value $ 33,092 $ $ 27,087 $ 6,005 Liabilities Borrowings related derivatives Derivative Liabilities Currency swaps - Borrowings $ 28,295 $ $ 28,295 $ Interest rate swaps Investments related derivatives Derivative Liabilities Currency swaps - Investments 4,495 4,495 Interest rate swaps Foreign exchange swaps Foreign exchange forwards Loans related derivatives Derivative Liabilities Currency swaps - Loans Interest rate swaps Total liabilities at fair value $ 33,987 $ $ 33,424 $ = less than $0.5 million. The office of risk management is primarily responsible for determining the FV of derivatives using discounted cash flow models. Market inputs, such as yield curves, foreign exchange rates, basis spreads, cross currency rates, and volatilities are obtained from pricing services and brokers and applied to the models. ADB has a process to validate the appropriateness of the models and inputs in determining the hierarchy levels. This involves evaluating the nature of rates and spreads to determine if they are indicative and binding. For derivatives classified under Level 3, basis swaps spreads for selected currencies are considered to be significant unobservable inputs to derive the discount rates based on benchmark yield curves adjusted with a basis swap spread. A significant increase (decrease) in the basis swap spread will generally decrease (increase) the FV of derivatives. There were no transfers between Levels 1 and 2 in the derivatives portfolio during 2015 and 2014.
94 87 OCR-9 continued The valuation techniques and quantitative information on significant unobservable inputs used in valuing ADB s derivative instruments classified as Level 3 as of 31 December 2015 and 2014 are presented below: Valuation Unobservable Range (Weighted Average) Portfolio Technique Inputs Borrowings related swaps/ Discounted Basis Loans related swaps cash flows swap spreads -1.06% to 10% (-1.53%) -1.17% to 8.10% (-0.58%) The following tables present the changes in the carrying amounts of ADB s Level 3 derivative assets and derivative liabilities for the years ended 31 December 2015 and 2014: ($ million) Borrowings related derivatives Loans related derivatives 2015 Assets Liabilities Assets Liabilities Balance, beginning of year $ 6,004 $ (27) $ 1 $ (536) Total gains (losses) - (realized/unrealized) Included in earnings a (177) (0) (28) Included in other comprehensive loss b (386) (0) 86 Issuances 239 (82) c Maturities/Redemptions (1,799) 50 Transfer out of Level 3 d (2,263) 27 (0) 25 Balance, end of year $ 1,618 $ $ 0 $ (485) The amount of total (losses) gains for the year included in earnings attributable to the change in net unrealized gains or losses a relating to assets/liabilities still held at the reporting date $ (33) $ $ (0) $ 27 a Included in net unrealized gains (losses) (OCR-2). b Included in accumulated translation adjustments (Note M). c Including accretion of $24 million. d Transferred to Level 2 due to availability of observable market data. 0 = less than $0.5 million ($ million) Borrowings related derivatives Loans related derivatives 2014 Assets Liabilities Assets Liabilities Balance, beginning of year $ 6,096 $ (52) $ 2 $ (521) Total gains (losses) - (realized/unrealized) Included in earnings a (0) 4 Included in other comprehensiveloss b (389) 1 (0) 26 Issuances 1,171 (88) Maturities/Redemptions (981) 11 (1) 43 Transfer out of Level 3 Balance, end of year $ 6,004 $ (27) $ 1 $ (536) The amount of total gains (losses) for the year included in earnings attributable to the change in net unrealized gains or losses a relating to assets/liabilities still held at the reporting date $ 118 $ 14 $ (0) $ 4 a b Included in net unrealized gains (losses) (OCR-2). Included in accumulated translation adjustments (Note M). 0 = less than $0.5 million
95 88 OCR-9 continued Effect of Derivative Instruments on the Statement of Income and Expenses ADB reports changes in the FV of its derivative instruments as part of net unrealized gains and losses in its Statement of Income and Expenses while all interest income, expenses, and related amortization of discounts, premiums, and fees are reported as part of revenue and expenses. These are summarized below: ($ million) Amount of Gain (Loss) recognized in Income (Expenses) on Derivatives Location of Gain (Loss) recognized in Income (Expenses) on Derivatives Borrowings related derivatives Currency swaps Net Unrealized Gains (Losses) $ (16) $ 828 Borrowing and related expenses Interest rate swaps Net Unrealized Gains (Losses) 231 (108) Net Realized Gains 9 Borrowing and related expenses Foreign exchange swaps Net Unrealized Gains (Losses) (0) Borrowing and related expenses 1 $ 1,492 $ 2,296 Investments related derivatives Currency swaps Net Unrealized Gains (Losses) $ 4 $ (1) Revenue from Investments 8 2 Interest rate swaps Net Unrealized Gains (Losses) 6 (3) Revenue from Investments (12) (10) Foreign exchange swaps Net Unrealized Gains (Losses) (0) (0) Revenue from Investments 14 4 Foreign exchange forwards Net Unrealized Gains (Losses) (0) Net Realized Gains 0 $ 20 $ (8) Loans related derivatives Currency swaps Net Unrealized Gains (Losses) $ (22) $ 8 Revenue from Loans (20) (20) Interest rate swaps Net Unrealized Gains (Losses) 9 8 Revenue from Loans (15) (13) $ (48) $ (17) 0 = less than $0.5 million.
96 89 OCR-9 continued Counterparty Credit Risks ADB undertakes derivative transactions with its eligible counterparties and transacts in various financial instruments as part of liquidity and asset/liability management purposes that may involve credit risks. For all investment securities and their derivatives, ADB manages credit risks by following the policies set forth in the Investment Authority and other risk management guidelines. ADB has a potential risk of loss if the derivative counterparty fails to perform its obligations. In order to reduce credit risk, ADB transacts with counterparties eligible under ADB s swap guidelines which include a requirement that the counterparties have at least a credit rating of A or higher and generally requires entering into master swap agreements which contain legally enforceable close-out netting provisions for all counterparties with outstanding swap transactions. The reduction in exposure as a result of these netting provisions can vary as additional transactions are entered into under these agreements. The extent of the reduction in exposure may therefore change substantially within a short period of time following the balance sheet date. Counterparty credit risk is also mitigated by requiring counterparties to post collateral based on specified credit rating driven thresholds. As of 31 December 2015, ADB had received collateral of $912 million ($1,116 million 2014) in connection with the swap agreements. Of this amount, $494 million ($478 million 2014) was recorded as swap related collateral in the balance sheet. ADB has entered into several agreements with its derivative counterparties under the ISDA Master Agreement and the Master Agreement of the National Association of Financial Market Institutional Investors (NAFMII). The agreements provide for the right of a party to terminate the derivative transaction if any of the various events of default and termination events specified occur. Events of default include failure to pay and cross default. Termination events include the situation where the long term unsecured and unsubordinated indebtedness of ADB or the counterparty ceases to be rated at least Baa3 by Moody s Investor Service, Inc. or BBB by Standard and Poor s Ratings Group, or such indebtedness ceases to be rated by Moody s or S&P. If ADB s counterparties are entitled under the agreements to terminate their derivative transactions with ADB, ADB will be required to pay an amount equal to its net liability position with each counterparty (in the case of counterparties who have entered into the ISDA Master Agreement absent of local market constraints) and an amount equal to its gross liability position with each counterparty (in the case of counterparties without enforceable netting agreement). The aggregate FV of all derivative instruments that ADB has under the enforceable ISDA Master Agreement that are in a net liability (negative markedto-market) position as of 31 December 2015 was $3,559 million ($1,983 million 2014). The gross liability position in the aggregate FV of all derivative instruments that ADB has no enforceable netting agreement amounted to $12 million as of 31 December 2015 ($26 million 2014). ADB has elected not to offset any derivative instruments by counterparty in the balance sheet. Gross amounts of DERIVATIVE ASSETS and DERIVATIVE LIABILITIES not offset in the balance sheet that are subject to enforceable master netting arrangements as of 31 December 2015 and 2014 were as follows: (See Note E for PAYABLE UNDER SECURITIES REPURCHASE ARRANGEMENTS.) ($ million) (a) (b) (c) = (a) - (b) (a) (b) (c) = (a) - (b) Gross amount of assets presented in the balance sheet a Financial Gross amounts not offset in the Gross amount of Gross amounts not offset in the balance balance sheet assets presented sheet Financial in the balance instruments Collateral received b Net amount sheet a instruments Collateral received b Net amount Derivative Assets $ 29,518 $ 28,701 $ 761 $ 56 $ 33,063 $ 31,978 $ 913 $ 172 Total $ 29,518 $ 28,701 $ 761 $ 56 $ 33,063 $ 31,978 $ 913 $ 172
97 90 OCR-9 continued ($ million) (a) (b) (c) = (a) - (b) (a) (b) (c) = (a) - (b) Gross amount of liabilities presented in the balance sheet c Gross amounts not offset in the balance sheet Financial instruments Collateral pledged Net amount Gross amount of liabilities presented in the balance sheet c Gross amounts not offset in the balance sheet Financial instruments Collateral pledged Net amount Derivative Liabilities $ 32,260 $ 28,701 $ $ 3,559 $ 33,961 $ 31,978 $ $ 1,983 Total $ 32,260 $ 28,701 $ $ 3,559 $ 33,961 $ 31,978 $ $ 1,983 a This excludes gross amount of DERIVATIVE ASSETS presented in the balance sheet not subject to enforceable master netting agreements amounting to $20 million ($29 million ). b Collateral received includes both cash and securities collateral. c This excludes gross amount of DERIVATIVE LIABILITIES presented in the balance sheet not subject to enforceable master netting agreements amounting to $12 million ($26 million ). NOTE J PROPERTY, FURNITURE, AND EQUIPMENT In 1991, under the terms of an agreement with the Philippines (Government), ADB returned the former headquarters (HQ) premises, which had been provided by the Government. In accordance with the agreement as supplemented by a memorandum of understanding, ADB was compensated $22,657,000 for the return of these premises. The compensation is in lieu of being provided premises under the agreement and accordingly, is deferred and amortized over the estimated life of the current HQ building as a reduction of occupancy expense. HQ depreciation for the year ended 31 December 2015 amounted to $4 million ($4 million 2014), net of amortization of the compensation for the former HQ building. At 31 December 2015, the unamortized deferred compensation balance (included in ACCOUNTS PAYABLE AND OTHER LIABILITIES Miscellaneous) was $6 million ($6 million 2014). In 2014, the expansion of the HQ building was completed and $25 million was transferred from Work in Progress and capitalized. At 31 December 2015, accumulated depreciation for property, furniture, and equipment was $278 million ($257 million 2014). The changes in the property, furniture, and equipment during 2015 and 2014, as well as information pertaining to accumulated depreciation, were as follows: ($ million) Property, Furniture and Equipment Buildings Office Furniture and and Work in Land Improvements Equipment Progress Total Cost: Balance, 1 January 2015 $ 10 $ 252 $ 167 $ 1 $ 430 Additions during the year Transfers during the year 1 (1) Disposals during the year (3) (3) Balance, 31 December Accumulated Depreciation: Balance, 1 January 2015 (122) (135) (257) Depreciation during the year (8) (15) (23) Disposals during the year 2 2 Balance, 31 December 2015 (130) (148) (278) Net Book Value, 31 December 2015 $ 10 $ 127 $ 28 $ 3 $ 168
98 91 OCR-9 continued ($ million) Property, Furniture and Equipment Buildings Office Furniture and and Work in Land Improvements Equipment Progress Total Cost: Balance, 1 January 2014 $ 10 $ 218 $ 163 $ 17 $ 408 Additions during the year Transfers during the year 25 0 (25) Disposals during the year (7) (7) Balance, 31 December Accumulated Depreciation: Balance, 1 January 2014 (114) (127) (241) Depreciation during the year (8) (15) (23) Disposals during the year 7 7 Balance, 31 December 2014 (122) (135) (257) Net Book Value, 31 December 2014 $ 10 $ 130 $ 32 $ 1 $ = less than $0.5 million. NOTE K BORROWINGS The key objective of ADB s borrowing strategy is to raise funds at the most stable and lowest possible cost for the benefit of its borrowers. ADB uses financial derivative instruments in connection with its borrowing activities to increase cost efficiency, while achieving risk management objectives. Currency and interest rate swaps enable ADB to raise operationally needed currencies in a cost-efficient way and to maintain its borrowing presence in the major capital markets. Interest rate swaps are used to reduce interest rate mismatches arising from lending and liquidity operations. Fair Value Disclosure The office of risk management is primarily responsible for determining the FV of the borrowings. Parameters and models used for determining the FV of borrowings are subject to internal review and periodic external validation. Plain vanilla borrowings are valued using discounted cash flow methods with market-based observable inputs such as yield curves, foreign exchange rates, basis spreads and funding spreads. On some borrowings, significant unobservable input is also used such as derived credit spread. Structured borrowings issued by ADB are valued using financial models that discount future cash flows and simulated expected cash flows. These involve the use of pay-off profiles within the realm of accepted market valuation models such as Hull-White and Black-Scholes. The model incorporates market observable inputs, such as yield curves, foreign exchange rates, basis spreads, funding spreads and interest rate volatilities.
99 92 OCR-9 continued The FV hierarchy of ADB s outstanding borrowing as of 31 December 2015 and 2014 were as follows: ($ million) at Amortized cost Level 1 $ $ Level 2 4,685 4,426 Level Sub-total $ 4,887 $ 4,426 at Fair value Level 1 $ $ Level 2 59,341 52,551 Level 3 2,454 6,488 Sub-total $ 61,795 $ 59,039 Total borrowings at fair value $ 66,682 $ 63,465 ADB uses the discounted cash flow method using derived credit spreads in determining the FVs of borrowings classified as Level 3. The derived credit spread adjusts the discount rate in valuing the borrowings. A significant increase (decrease) in credit spreads generally decreases (increases) the FV of the borrowings. There were no transfers between Levels 1 and 2 in the borrowings portfolio during 2015 and For borrowings carried at FV, the quantitative information on significant unobservable inputs used for valuation as of 31 December 2015 and 2014 are presented below: Valuation Unobservable Range (Weighted Average) Portfolio Technique Inputs Borrowings Discounted cash flows Derived credit spreads -0.96% to 0.93% (-0.15%) -1.67% to 0.92% (-0.65%)
100 93 OCR-9 continued The following table presents the changes in the carrying amounts of ADB s Level 3 borrowings reported at FV for the years ended 31 December 2015 and 2014: ($ million) Balance, beginning of year $ 6,488 $ 6,674 Total (gains) losses - (realized/unrealized) Included in earnings a (203) 83 Included in other comprehensive loss b (455) (405) Issuances 302 1,187 Maturities/Redemptions (1,957) (1,051) Transfer out of Level 3 c (1,721) Balance, end of year $ 2,454 $ 6,488 The amount of total (gains) losses for the year included in earnings attributable to the change in net unrealized gains or losses a relating to liabilities still held at the reporting date $ (62) $ 104 a Included in net unrealized gains (losses) (OCR-2). b Included in accumulated translation adjustments (Note M). c Transferred to Level 2 due to availability of observable market data. Refer to OCR-7 for Summary Statement of Borrowings. NOTE L CAPITAL STOCK, CAPITAL TRANSFERRED TO ASIAN DEVELOPMENT FUND, MAINTENANCE OF VALUE OF CURRENCY HOLDINGS, AND MEMBERSHIP Capital Stock The authorized capital stock of ADB as of 31 December 2015 and 2014 consists of 10,638,933 shares, of which 10,603,211 shares (10,567, ) have been subscribed by members. Of the subscribed shares, 10,071,512 (10,037, ) are callable and 531,699 (530, ) are paid-in. The callable share capital is subject to call by ADB only as and when required to meet ADB s obligations incurred on borrowings of funds for inclusion in its OCR or on guarantees chargeable to such resources. The paid-in share capital has been paid or is payable in installments, partly in convertible currencies and partly in the currency of the subscribing member which may be convertible. In accordance with Article 6, paragraph 3 of the Charter, ADB accepts nonnegotiable, noninterest-bearing demand obligations in satisfaction of the portion payable in the currency of the member, provided such currency is not required by ADB for the conduct of its operations. Nonnegotiable, noninterest-bearing demand obligations received on demand amounted to $257 million ($420 million 2014), while those notes received with fixed encashment schedules totaled $603 million ($678 million 2014). In January 2011, the Board of Directors approved the temporary reduction of shares and voting power of members in proportion to the delayed amount of paid-in shares if ADB does not receive confirmation of subscription payments within 45 days of the respective due dates thereof. The affected shares and voting power will be automatically restored upon receipt of the installment to the extent that the installment payments are made by 1 April In March 2015, the Board of Directors deferred this deadline to 18 May Payments received beyond this date will be referred to the Board of Directors for approval of the restoration of affected shares and voting power.
101 94 OCR-9 continued As of 31 December 2015, all matured installments amounting to $7,374 million ($7,313 million 2014) had been received. Capital Transferred to Asian Development Fund Pursuant to the provisions of Article 19, paragraph 1(i) of the Charter, the Board of Governors has authorized the setting aside of 10% of the unimpaired paid-in capital paid by members pursuant to Article 6, paragraph 2(a) of the Charter and of the convertible currency portion paid by members pursuant to Article 6, paragraph 2(b) of the Charter as of 28 April 1973 to be used as a part of the Special Funds of ADB. The resources so set aside amounting to $66 million as of 31 December 2015 ($69 million 2014) expressed in terms of the SDR on the basis of $ ($ ) per SDR ($57 million in terms of $ per 1966 dollar Note B), were allocated and transferred to the Asian Development Fund. Maintenance of Value of Currency Holdings Prior to 1 April 1978, the effective date of the Second Amendment to the IMF Articles, ADB implemented maintenance of value (MOV) in respect of holdings of member currencies in terms of 1966 dollars, in accordance with the provisions of Article 25 of the Charter and relevant resolutions of the Board of Directors. Since then, settlement of MOV has been put in abeyance. In as much as the valuation of ADB s capital stock and the basis of determining possible MOV obligations are still under consideration, notional amounts have been calculated provisionally in terms of the SDR as receivable from or payable to members in order to maintain the value of members currency holdings. The notional MOV amounts of receivables and payables are offset against one another and shown as net notional amounts required to maintain value of currency holdings in the EQUITY portion of the Balance Sheet. The carrying book value for such receivables and payables approximates its FV. The net notional amounts as of 31 December 2015 consisted of (i) the net increase of $954 million ($1,176 million 2014) in amounts required to maintain the value of currency holdings to the extent of matured and paid-in capital subscriptions due to the increase in the value of the SDR in relation to the US dollar during the period from 1 April 1978 to 31 December 2015 and (ii) the net increase of $662 million (net increase of $361 million 2014) in the value of such currency holdings in relation to the US dollar during the same period. In terms of receivable from and payable to members, they are as follows: ($ million) Notional MOV Receivables $ 1,621 $ 1,542 Notional MOV Payables 5 5 Total $ 1,616 $ 1,537 Membership As of 31 December 2015 and 2014, ADB s shareholders consist of 67 members, 48 from the region and 19 from outside the region (OCR-8).
102 95 OCR-9 continued NOTE M RESERVES Ordinary Reserve and Net Income Under the provisions of Article 40 of the Charter, the Board of Governors shall determine annually what part of the net income shall be allocated, after making provision for reserves, to surplus and what part, if any, shall be distributed to the members. In May 2015, the Board of Governors approved the following with respect to ADB's 2014 net income of $366 million, after appropriation of guarantee fees to special reserve: (i) $183 million representing the ASC 815/825 adjustments and the unrealized portion of net income from equity investments accounted for under the equity method for the year ended 31 December 2014, be added from the Cumulative Revaluation Adjustments account; (ii) $15 million representing the adjustment to the Loan Loss Reserve as of 31 December 2014, be added from the loan loss reserve to the net income; (iii) $384 million be allocated to the Ordinary Reserve; (iv) $120 million be allocated to ADF; (v) $40 million be allocated to Technical Assistance Special Fund (TASF) ; and (vi) $20 million be allocated to Asia Pacific Disaster Response Fund (APDRF). In May 2014, the Board of Governors approved the allocation of 2013 net income of $548 million, after appropriation of guarantee fees to special reserve, as follows: (i) $31 million representing adjustment to the Loan Loss Reserve as of 31 December 2013, be added from the Loan Loss Reserve to the net income; (ii) $97 million representing the ASC 815/825 adjustments and the unrealized portion of net income from equity investments accounted for under the equity method, to the Cumulative Revaluation Adjustment account; (iii) $332 million to the Ordinary Reserve; (iv) $120 million to the ADF; and (v) $30 million to the TASF. The revaluation of the capital stock for purposes of these financial statements on the basis of the SDR instead of the 1966 dollar (Note B) resulted in a net credit of $38 million to the Ordinary Reserve during the year ended 31 December 2015 (net credit of $58 million 2014). That credit is the decrease in the value of the matured and paid-in capital subscriptions caused by the change during the year in the value of the SDR in relation to the US dollar not allocated to members as notional maintenance of value adjustments in accordance with resolutions of the Board of Directors. In 2014, the unutilized funds of the Pakistan Earthquake Fund amounting to $3 million were returned to ordinary reserve. Cumulative Revaluation Adjustments Account In May 2002, the Board of Governors approved the allocation of net income representing the cumulative net unrealized gains (losses) on derivatives, as required by ASC 815 to a separate category of Reserves Cumulative Revaluation Adjustments Account. Beginning 2008, the unrealized portion of net income from equity investments accounted under equity method is also transferred to this account. During 2015, the 2014 net unrealized losses on derivatives of $193 million (net unrealized gains of $150 million 2014) and net unrealized gains from equity investments accounted for under the equity method of $9 million (net unrealized losses of $53 million 2014) resulted in a debit balance in the Cumulative Revaluation Adjustments account at 31 December 2015 of $125 million (credit balance of $59 million 2014). Special Reserve The Special Reserve includes commissions on loans and guarantee fees received which are required to be set aside pursuant to Article 17 of the Charter to meet liabilities on guarantees. For the year ended 31 December 2015, guarantee fees amounting to $19 million ($21 million 2014) were appropriated to Special Reserve.
103 96 OCR-9 continued Loan Loss Reserve ADB sets aside Loan Loss Reserve as part of EQUITY to be used as a basis for capital adequacy against the estimated expected loss in ADB s sovereign and nonsovereign loans and guarantees portfolio. The loan loss reserve is estimated based on expected loss using ADB s credit risk model net of allowance for loan losses recorded in the balance sheet. As of 31 December 2015, the loan loss reserve was $215 million ($230 million 2014). Surplus Surplus represents funds for future use to be determined by the Board of Governors. Accumulated Other Comprehensive Income (Loss) Comprehensive income (loss) has two major components: net income (loss) and other comprehensive income (loss) comprising gains and losses affecting equity that, under US GAAP, are excluded from net income (loss). Other comprehensive income (loss) includes items such as unrealized gains and losses on financial instruments classified as available for sale, translation adjustments, and pension and postretirement liability adjustment. The changes in Accumulated Other Comprehensive Loss balances for the years ended 31 December 2015 and 2014 were as follows: ($ million) Accumulated Unrealized Holding Gains Pension/Postretirement Accumulated Translation Equity Liability Other Comprehensive Adjustments Investments Investments a Adjustments Loss Balance, 1 January $ (156) $ (56) $ 104 $ 123 $ 36 $ 74 $ (1,222) $ (782) $ (1,238) $ (641) Other comprehensive (loss) income before reclassifications (136) (100) (76) 13 (12) (497) (173) (513) Amounts reclassified from accumulated other comprehensive loss (23) (32) (14) (109) (84) Net current-period other comprehensive (loss) income (136) (100) $ (99) $ (19) $ (26) $ (38) $ 133 $ (440) $ (128) $ (597) Balance, 31 December $ (292) $ (156) $ 5 $ 104 $ 10 $ 36 $ (1,089) $ (1,222) $ (1,366) $ (1,238) a This represents unrealized gains/(losses) on equity investments classified as available for sale (AFS). It also includes ADB's proportionate share on the unrealized gains/ (losses) of AFS of investee companies accounted under the equity method. The reclassifications of Accumulated Other Comprehensive Income (Loss) to Net Income for the year ended 31 December 2015 and 2014 are presented below: ($ million) Accumulated Other Comprehensive Income (Loss) Components Amounts Reclassified from Accumulated Other Comprehensive Income (Loss) a Unrealized Holding Gains (Losses) Investments $ 23 $ 32 NET REALIZED GAINS From investments Equity investments NET REALIZED GAINS From equity investments $ 37 $ 141 Pension/Postretirement Liability Adjustments Actuarial losses $ (82) $ (57) Administrative expenses Total reclassifications for the period $ (45) $ 84 a Amounts in parentheses indicate debits to net income. Affected Line Item in the Statement of Income and Expenses
104 97 OCR-9 continued NOTE N INCOME AND EXPENSES Total income from loans for the year ended 31 December 2015 was $678 million ($605 million 2014). The average yield on the loan portfolio during the year was 1.16% (1.15% 2014), including risk transfer costs. Total income from investments including net realized gains on sales, interest earned for securities transferred under repurchase agreements and resale arrangements for the year ended 31 December 2015 was $365 million ($352 million 2014). The annualized rate of return on the average investments held during the year, based on the portfolio held at the beginning and end of each month, was 1.33% (1.30% 2014) excluding unrealized gains and losses on investments and 0.98% (1.23% 2014) including unrealized gains and losses on investments. Net income from equity investment operations resulted in net loss of $7 million (net income of $258 million 2014) for the year ended 31 December This included net equity losses of $28 million (net equity gain of $3 million 2014), and $7 million ($9 million 2014) other than temporary impairment losses. These were offset by gains from divestments of $19 million ($250 million 2014) and dividend income of $8 million ($13 million 2014). Income from other sources primarily included income received as executing agency amounting to $16 million ($15 million 2014), and other miscellaneous income amounting to $10 million ($8 million 2014). Total borrowing expense of $374 million ($317 million 2014) consisted of interest expense and other related expenses such as amortization of issuance costs and derivatives, while the average cost of borrowings outstanding after swaps was 0.19% (0.82% 2014). Total depreciation expense incurred for the year ended 31 December 2015 amounted to $23 million ($22 million 2014). ADB leases office spaces and other assets. Annual rental expenses under operating leases for the years ended 31 December 2015 and 2014 were about $11 million. The minimum rental payments required under operating leases that have initial or noncancelable lease terms in excess of one year as of 31 December 2015 are as follows: Minimum amount of future rentals Year ending 31 December 2016 ($ million) Later years 5 Administrative expenses (other than those pertaining directly to ordinary operations and special operations) for the year ended 31 December 2015 were apportioned between OCR and ADF in proportion to the relative volume of operational activities. Of the total administrative expenses of $682 million ($666 million 2014), $278 million ($289 million 2014) was charged to ADF. The balance of administrative expenses represents the amount allocated to OCR which was reduced by the deferral of direct loan origination costs of $21 million ($25 million 2014) related to new loans made effective in 2015 (Note B). For the year ended 31 December 2015, net write-back for loan losses of $1 million ($1 million 2014) consisted of $2 million additional loan loss provision ($3 million 2014) and $3 million ($4 million writeback 2014) write-backs.
105 98 OCR-9 continued The following table provides information on the unrealized gains or losses included in income for the years ended 31 December 2015 and 2014: ($ million) Unrealized gains (losses) on: Borrowings and related swaps $ 244 $ (205) Investments related swaps 10 (3) Loans related swaps (13) 16 Equity investments 2 3 Translation adjustments of non-functional currencies (4) (4) Total $ 239 $ (193) NOTE O RELATED PARTY TRANSACTIONS At 31 December 2015 and 2014, ADB had the following net receivables from and payable to Special Funds and externally funded trust funds under ADB administration (Agency Trust Funds) resulting from administrative arrangements and operating activities which are included in Miscellaneous under OTHER ASSETS and ACCOUNTS PAYABLE AND OTHER LIABILITIES: ($ million) Amounts receivable from: Asian Development Fund $ 51 $ 41 Other Special Funds 0 0 Employee Benefit Plans 2 13 Total $ 53 $ 54 Amounts payable to: Agency Trust Funds net $ 1 $ 2 Total $ 1 $ 2 0 = less than $0.5 million As of 31 December 2015 and 2014, the related parties include (i) other Special Funds consisting of TASF, Japan Special Fund, ADB Institute, Regional Cooperation and Integration Fund, Climate Change Fund, APDRF, and Financial Sector Development Partnership Special Fund; and (ii) employee benefit plans such as the Staff Retirement Plan (SRP) and the Retiree Medical Plan Fund (RMPF).
106 99 OCR-9 continued NOTE P STAFF PENSION AND POSTRETIREMENT MEDICAL BENEFITS Staff Retirement Plan ADB has a contributory defined pension benefit plan called the SRP. Every employee, as defined under the SRP, shall, as a condition of service, become a participant from the first day of service, provided the employee has not reached the normal retirement age of 60 at that time. The plan applies also to members of the Board of Directors who elect to join. Retirement benefits are based on an annual accrual rate, length of service and the highest average two years remuneration during eligible service. The plan assets are segregated in a separate fund. The costs of administering the plan are absorbed by ADB, except for fees paid to the investment managers and related charges, including custodian fees, which are borne by the Plan. Participants hired prior to 1 October 2006 are required to contribute 9 1/3% of their salary to the plan while those hired on or after 1 October 2006 are not required to contribute. The annual accrual rate is 2.95% for staff hired prior to 1 October 2006 and 1.5% for those hired on or after 1 October Participants may also make discretionary contributions. ADB s contribution is determined at a rate sufficient to cover that part of the costs of the SRP not covered by the participants contributions. Expected Contributions ADB s contribution to the SRP varies from year to year, as determined by the Pension Committee, which bases its judgment on the results of annual actuarial valuations of the assets and liabilities of the plan. ADB is expected to contribute $52 million for 2016 based on a budgeted contribution of 23% of salary. ADB s staff members are expected to contribute $24 million representing participants mandatory contribution of $9 million and discretionary contributions of $15 million. Investment Strategy Contributions in excess of current benefits payments are invested in international financial markets and in a variety of investment vehicles. The SRP employs nine external asset managers and one global custodian who are required to operate within the guidelines established by the SRP s Investment Committee. The investment of these assets, over the long term, is expected to produce higher returns than short-term investments. The investment policy incorporates the plan s package of desired investment return and tolerance for risk, taking into account the nature and duration of its liabilities. The SRP s assets are diversified among different markets and different asset classes. The use of derivatives for speculation, leverage or taking risks is prohibited. Selected derivatives are used for hedging and transactional efficiency purposes. The SRP s investment policy is periodically reviewed and revised to reflect the best interest of the SRP s participants and beneficiaries. As approved by the Pension Committee on 27 October 2015, the SRP s new long-term target asset-mix, which will be implemented in 2016, is 35% US equity, 30% non-us equity, 15% global fixed income, 10% globally high yield, and 10% diversified asset. The asset mix approved for 2015 was based on the policy adopted in 2011, which is 40% US equity, 30% non-us equity and 30% global fixed income. For the year ended 31 December 2015, the net return on the SRP assets was -0.47% (6.33% 2014). ADB expects the long-term rate of return on the assets to be 7.0% (7.5% 2014).
107 100 OCR-9 continued Assumptions The assumed overall rate of return takes into account long-term return expectations of the underlying asset classes within the investment portfolio mix, and the expected duration of the SRP s liabilities. Return expectations are forward looking and, in general, not much weight is given to short-term experience. Unless there is a drastic change in investment policy or market environment, as well as in the liability/benefit policy side, the assumed average long-term investment return of 7.0% on the SRP s assets is expected to remain on average broadly the same, year to year. Effective for the 2015 actuarial valuation, as part of the regular assumptions review, some revisions were made to the previous actuarial assumptions based on the experience. The assumptions that were revised include changes to the investment return, salary progression, pension increases, rates of withdrawal, early and incapacity retirement rates, retirement and post-incapacity retirement mortality rates, percent of international staff who commute, and other commutation factors. Post-Retirement Group Medical Insurance Plan In 1993, ADB adopted a cost-sharing arrangement for the Post-Retirement Group Medical Insurance Plan (PRGMIP). Under this plan, ADB is obligated to pay 75% of the PRGMIP premiums for retirees, which includes retired members of the Board of Directors, and their eligible dependents who elected to participate. In December 2014, the Board of Directors approved the funding of the PRGMIP. ADB established the Retiree Medical Plan Fund (RMPF) where the ADB s contributions would be deposited and invested to fund the accumulated obligations of the PRGMIP. The income of RMPF consists of ADB s contributions and investment earnings; it does not have any component attributable to participants share of PRGMIP costs. The RMPF assets are segregated in a separate fund and held in trust, hence are not included in the balance sheet of ADB. In 2015, insurance premium paid by ADB for the PRGMIP is considered ADB s contribution to the fund. The costs of administering the RMPF are absorbed by ADB, while investment management and custodian fees are paid from the RMPF. The SRP Pension Committee is responsible for the overall financial management of the RMPF and is assisted by the SRP Investment Committee. Expected Contribution Subsequent to the establishment of the RMPF, ADB transferred $315 million into the RMPF. ADB s expected contribution to the RMPF is based on the recommendation of the SRP Pension Committee. For 2016, ADB is expected to contribute $5 million, which is equivalent to 2% of salary. Investment Strategy The RMPF employs three external asset managers and one global custodian who are required to operate within the guidelines established by the SRP s Investment Committee. The investment of these assets, over the long term, is expected to produce higher returns than short-term investments. Similar to SRP, the investment policy incorporates the RMPF s package of desired investment return and tolerance for risk, taking into account the nature and duration of its liabilities. The RMPF s assets are diversified among different markets and asset classes. The use of derivatives for speculation, leverage or taking risks is prohibited. Selected derivatives are used for hedging and transactional efficiency purposes. In October 2015, the Pension Committee approved the RMPF s investment policy. Based on the approved policy, the RMPF s long-term target asset-mix is 40% US equity, 30% non-us equity, and 30% global fixed income.
108 101 OCR-9 continued Assumptions The overall long-term rate of return is 7% per annum, similar to the SRP. Effective for the 2015 actuarial valuation, as part of the regular assumptions review, some revisions were made to the previous actuarial assumptions based on the experience. The assumptions that were revised include retirement mortality rates and PRGMIP election rates, among others. The following table sets forth the funded status of pension and postretirement medical benefits at 31 December 2015 and 2014: ($ million) Pension Benefits Postretirement Medical Benefits Change in projected benefit obligation: Projected benefit obligation at beginning of year $ 3,542 $ 2,935 $ 430 $ 334 Service cost Interest cost Plan participants' contributions Actuarial (gain) loss (197) 427 (50) 63 Benefits paid (116) (113) (5) (3) Projected benefit obligation at end of year $ 3,557 $ 3,542 $ 418 $ 430 Change in plan assets: Fair value of plan assets at beginning of year $ 2,305 $ 2,021 $ 315 $ Actual return on plan assets (9) 129 (7) Employer's contribution Plan participants' contributions Benefits paid (116) (113) (4) (3) Fair value of plan assets at end of year $ 2,409 $ 2,305 $ 308 $ 315 Funded status $ (1,148) $ (1,237) $ (110) $ (115) Amounts recognized in the Balance sheet as Accrued pension and postretirement medical benefit costs $ (1,148) $ (1,237) $ (110) $ (115) Amounts recognized in the Accumulated other comprehensive loss as Pension/Postretirement liability adjustments (Note M) $ 1,034 $ 1,139 $ 55 $ 83 Weighted-average assumptions as of 31 December (%) Discount rate Expected return on plan assets Rate of compensation increase varies with age and averages N/A N/A
109 102 OCR-9 continued For measurement purposes, a 7.0% annual rate of increase in the per capita cost of covered postretirement medical benefits was assumed for the valuation as of 31 December 2015 and The rate was assumed to decrease gradually to 5.0% by 2021 and remain at the level thereafter. The following table summarizes the benefit costs associated with pension and postretirement medical benefits for the year ended 31 December 2015 and 2014: ($ million) Pension Benefits Postretirement Medical Benefits Components of net periodic benefit cost: Service cost $ 95 $ 73 $ 24 $ 19 Interest cost Expected return on plan assets (162) (136) (19) Recognized actuarial loss (Note M) Net periodic benefit cost $ 161 $ 143 $ 27 $ 36 The accumulated benefit obligation of the pension plan as of 31 December 2015 was $3,346 million ($3,312 million 2014). The estimated net loss for the defined benefit pension plans and postretirement medical benefits plan that will be amortized from accumulated other comprehensive income into net periodic benefit cost over the next fiscal year amounted to $52 million and $0.2 million, respectively. Assumed postretirement medical benefits cost trend rates have a significant effect on the amounts reported for the postretirement medical benefits plan. A one-percentage-point change in the assumed trend rates would have the following effects: ($ million) 1-Percentage- Point Increase 1-Percentage- Point Decrease Effect on total service and interest cost components 13 (9) Effect on postretirement medical benefit obligation 96 (73) Estimated Future Benefits Payments The following table shows the benefit payments expected to be paid in each of the next five years and subsequent five years. The expected benefit payments are based on the same assumptions used to measure the benefit obligation at 31 December 2015: ($ million) Pension Postretirement Year Benefits Medical Benefits 2016 $ 130 $ ,001 73
110 103 OCR-9 continued Fair Value Disclosure The FV of the SRP and RMPF s assets measured on a recurring basis as of 31 December 2015 and 2014 was shown below: ($ million) Fair Value Measurements 2015 Total Level 1 Level 2 Level 3 Staff Retirement Plan Cash and cash equivalents $ 60 $ $ 60 $ Common/preferred stocks Investment funds 1,076 1,076 Government or governmentguaranteed securities Corporate debt securities Mortgage/Asset-backed securities: Mortgage-backed securities Collateralized mortgage obligations Asset-backed securities Short term investments Derivatives (5) (0) (5) Other asset/liabilities a net (39) (39) Total fair value of SRP assets $ 2,409 $ 2,240 $ 160 $ 9 Retiree Medical Plan Fund Cash and cash equivalents $ 10 $ $ 10 $ Common/preferred stocks Investment funds Government or governmentguaranteed securities Corporate debt securities Mortgage/Asset-backed securities: Mortgage-backed securities Collateralized mortgage obligations Asset-backed securities 0 0 Short term investments 0 0 Derivatives (1) (0) (1) Other asset/liabilities a net (5) (5) Total fair value of RMPF assets $ 308 $ 298 $ 10 $ 0 a Incudes receivables and liabilities carried at amounts that approximate fair value. 0 = less than $0.5 million.
111 104 OCR-9 continued ($ million) Fair Value Measurements 2014 Total Level 1 Level 2 Level 3 Staff Retirement Plan Cash and cash equivalents $ 52 $ $ 52 $ Common/preferred stocks Investment funds 1,160 1,160 Government or governmentguaranteed securities Corporate debt securities Mortgage/Asset-backed securities: Mortgage-backed securities Collateralized mortgage obligations Asset-backed securities 1 1 Short term investments Derivatives Other asset/liabilities a net (30) (30) Total fair value of SRP assets $ 2,305 $ 2,237 $ 62 $ 6 Retiree Medical Plan Fund Short term investments $ 315 $ $ 315 $ Total fair value of RMPF assets $ 315 $ $ 315 $ a Incudes receivables and liabilities carried at amounts that approximate fair value. 0 = less than $0.5 million. The SRP s Investment Committee and SRP investment unit meet periodically and are involved in overseeing the activities and performance of the investment portfolios. The FV of the SRP investments is provided by the SRP s global custodian from various independent pricing providers. The accounting division in coordination with data management unit of treasury services division evaluates the FV in determining the hierarchy level. All investments including equity securities, fixed income securities and derivatives are provided by independent pricing providers. Equity securities include common and preferred stocks and mutual funds. Fixed income securities include government or governmentguaranteed securities, corporate obligations, asset and mortgage-backed securities, and short-term investments. Derivatives include futures, swaps and currency forward contracts. The table below provides details of transfers of SRP s assets between Levels 1 and 2, which are attributed to the availability or absence of market quotes, for the years ended 31 December 2015 and There were no inter level transfers for RMPF. ($ million) Level 1 Level 2 Level 1 Level 2 Investments - Staff Retirement Plan Government or government-guaranteed securities Transfers into (out of) $ $ $ 0 $ (0) Transfers (out of) into (4) 4 Corporate debt securities Transfers into (out of) 2 (2) 2 (2) Transfers (out of) into (2) 2 $ (4) $ 4 $ 2 $ (2) 0 = less than $0.5 million.
112 105 OCR-9 continued The following tables present the changes in the carrying amounts of SRP and RMPF s Level 3 investments for the years ended 31 December 2015 and 2014: ($ million) Retiree Medical Plan Staff Retirement Plan Fund Common / preferred Government or gov't.-guaranteed Corporate debt Mortgage / Assetbacked Mortgage / Asset-backed 2015 stocks securities securities securities securities Balance, beginning of the year $ 0 $ $ 1 $ 5 $ Total realized/unrealized (losses)/gains in: Net increase (decrease) in net assets available for benefits (0) (0) (0) (0) Purchases Sales/Maturities (15) (1) Settlement and others 0 (1) Transfers out of Level 3 (1) Balance, end of the year $ $ $ 6 $ 3 $ 0 Total unrealized gains (losses) included in income related to financial assets still held at the reporting date $ $ $ 0 $ 0 $ 2014 Balance, beginning of the year $ 0 $ 2 $ 1 $ 5 $ Total realized/unrealized (losses)/gains in: Net increase (decrease) in net assets available for benefits 0 0 (0) Purchases 2 2 Sales/Maturities (0) (1) (0) Settlement and others (2) Transfers out of Level 3 (2) (1) (0) Balance, end of the year $ 0 $ 1 $ 5 $ Total unrealized gains (losses) included in income related to financial assets still held at the reporting date $ 0 $ $ 0 $ (0) $ 0 = less than $0.5 million. Transfers into and out of Level 3 in 2015 and 2014 are due to the availability or absence of market observable inputs.
113 106 OCR-9 continued NOTE Q OTHER FAIR VALUE DISCLOSURES The carrying amounts and estimated FVs of ADB s financial instruments as of 31 December 2015 and 2014 are summarized below: ($ million) Carrying Estimated Carrying Estimated Amount Fair Value Amount Fair Value On-balance sheet financial instruments: ASSETS: Due from banks $ 753 $ 753 $ 417 $ 417 Investments (Note D) 23,315 23,315 23,006 23,006 Securities transferred under repurchase agreements (Note E) Securities purchased under resale arrangements ,257 1,257 Loans outstanding (Note F) 61,941 62,604 55,890 57,057 Equity investments carried at fair value (Note H) Derivative assets - borrowings (Note I) 21,664 21,664 26,830 26,830 Derivative assets - investments (Note I) 7,112 7,112 5,596 5,596 Derivative assets - loans (Note I) Swap related collateral (Note I) Future guarantee receivable (Note G) LIABILITIES: Borrowings (Note K) 66,054 66,682 62,701 63,465 Derivative liabilities - borrowings (Note I) 24,985 24,985 28,372 28,372 Derivative liabilities - investments (Note I) 6,679 6,679 5,034 5,034 Derivative liabilities - loans (Note I) Payable under securities repurchase agreements (Note E) Swap related collateral (Note I) Guarantee liability (Note G) Off-balance sheet financial instruments: ASSETS: Future guarantee receivable n/a $ 7 n/a $ 8 LIABILITIES: Guarantee liability n/a 7 n/a 8 As of 31 December 2015 and 2014, ADB has no material assets or liabilities measured at FV on a nonrecurring basis.
114 107 OCR-9 continued NOTE R SPECIAL AND OTHER FUNDS ADB s operations include special operations, which are financed from Special Funds resources. The OCR and Special Funds resources are at all times used, committed, and invested entirely separately from each other. The Board of Governors may approve allocation of the net income of OCR to Special Funds, based on the funding and operational requirements for the funds. The administrative and operational expenses pertaining to the OCR and Special Funds are charged to the respective Special Funds. The administrative expenses of ADB are allocated amongst OCR and Special Funds and are settled regularly. In addition, ADB, alone or jointly with donors, administers on behalf of the donors, including members of ADB, their agencies and other development institutions, projects/programs supplementing ADB s operations. Such projects/programs are funded with external funds administered by ADB and with external funds not under ADB s administration (referred as trust funds). ADB charges administrative fees for external funds administered by ADB. The trust funds are restricted for specific uses including technical assistance to borrowers and for regional programs, grants for projects, and loans. The responsibilities of ADB under these arrangements range from project processing to project implementation including the facilitation of procurement of goods and services. These funds are held in trust with ADB, and are held in a separate investment portfolio. The assets of trust funds are not commingled with ADB s resources, nor are they included in the assets of ADB. Special Funds and trust funds are not included in the assets of OCR. The net assets as of 31 December 2015 and 2014 are summarized below: ($ million) Total Net Total Net Assets No. Assets No. Special Funds Asian Development Fund $ 30,784 1 $ 31,478 1 Technical Assistance Special Fund Japan Special Fund Asian Development Bank Institute Regional Cooperation and Integration Fund Climate Change Fund Asia Pacific Disaster Response Fund Financial Sector Development Partnership Special Fund Subtotal 31, ,838 8 Trust Funds (including project specific cofinancing) 2, , Total $ 33, $ 33, During the year ended 31 December 2015, a total of $12 million ($12 million 2014) was recorded as compensation for administering projects/programs. The amount has been included in REVENUE From other sources net.
115 108 OCR-9 continued NOTE S VARIABLE INTEREST ENTITIES An entity is subject to the ASC 810 VIE Subsections and is considered a VIE if it (i) lacks equity that is sufficient to permit the entity to finance its activities without additional subordinated financial support from other parties; or (ii) if holders of the equity investment at risk lack decision-making rights about the entity s activities that most significantly impact the entity s economic performance; or do not have the obligation to absorb the expected losses or the right to receive the residual returns of the entity. A VIE is consolidated by the primary beneficiary, which is the party that has the power to direct the VIE's activities that most significantly impact its economic performance and the obligation to absorb losses of or the right to receive benefits from the VIE that could potentially be significant to the VIE. As of 31 December 2015, ADB did not identify any VIE in which ADB is the primary beneficiary, requiring consolidation in OCR financial statements. ADB may hold variable interests in VIE, which require disclosures. The review of ADB s loan, equity investments, and guarantee portfolio, has identified 33 ( ) investments in VIEs in which ADB is not the primary beneficiary. These non-consolidated VIEs are operating entities where the total equity invested is considered insufficient to finance its activities without additional subordinated financial support and investment funds, where the general partner or fund manager does not have substantive equity at risk and the equity holders lack decision making rights. These VIEs are in the finance, telecommunication, and energy sectors. ADB s involvement in these non-consolidated VIEs includes loans, guarantees and equity investments. Based on the most recent available data from these VIEs at 31 December 2015, the assets of these nonconsolidated VIEs totaled $13,765 million ($13,076 million 2014). The table below shows the carrying value of ADB interests in the non-consolidated VIEs and the maximum exposure to loss of these interests. For guarantees, the maximum exposure is the notional amount of such guarantee, less any counter-guarantee. ($ million) Carrying value of the ADB s Variable Interests Assets $ 1,108 $ 1,295 Liabilities 3 4 Maximum Exposure to Loss in Nonconsolidated VIEs Loans $ 992 $ 1,166 Equity Investments Guarantees Total $ 1,250 $ 1,387 No. of VIEs Total Assets of the Entities $ 13,765 $ 13,076
116 109 OCR-9 continued NOTE T SEGMENT REPORTING Based on an evaluation of OCR s operations, Management has determined that OCR has only one reportable segment since OCR does not manage its operations by allocating resources based on a determination of the contribution to net income from individual borrowers. The following table presents OCR s loan, guarantee and equity investments outstanding balances and associated revenue, by geographic region, as of and for the years ended 31 December 2015 and 2014: ($ million) Country Outstanding Balance Outstanding Revenue Balance Revenue People s Republic of China $ 15,795 $ 231 $ 15,031 $ 212 India 14, , Indonesia 8, , Pakistan 4, , Philippines 5, , Others 14, , Total $ 64,210 $ 678 $ 58,493 $ 643 Revenue comprises income from loans, equity investments, and guarantees and excludes net realized gains. For the year ended 31 December 2015, sovereign loans to three members (three 2014) individually generated more than 10 percent of loan revenue which amounted to $186 million, $103 million, and $97 million ($176 million, $109 million, and $80 million 2014). NOTE U SUBSEQUENT EVENTS ADB has evaluated subsequent events after 31 December 2015 through 11 March 2016, the date these Financial Statements are available for issuance. During this period, ADB has raised additional borrowings of approximately $8,398 million in various currencies.
117 110 ASIAN DEVELOPMENT FUND MANAGEMENT'S REPORT ON INTERNAL CONTROL OVER FINANCIAL REPORTING The management of Asian Development Bank ("ADB") is responsible for establishing and maintaining adequate internal control over financial reporting. ADB's internal control over financial reporting is a process designed to provide reasonable assurance regarding the reliability of financial reporting and the preparation of special purpose financial statements in accordance with accounting policies as described in Note B of the special purpose financial statements. ADB's internal control over financial reporting includes those policies and procedures that (i) pertain to the maintenance of records that, in reasonable detail, accurately and fairly reflect the transactions and dispositions of the assets of ADB; (ii) provide reasonable assurance that transactions are recorded as necessary to permit preparation of special purpose financial statements in accordance with accounting policies as described in Note B of the special purpose financial statements, and that receipts and expenditures of ADB are being made only in accordance with authorizations of management and directors of ADB; and (iii) provide reasonable assurance regarding prevention or timely detection and correction of unauthorized acquisition, use, or disposition of ADB's assets that could have a material effect on the special purpose financial statements. Because of its inherent limitations, internal control over financial reporting may not prevent or detect misstatements. Also, projections of any evaluation of effectiveness to future periods are subject to the risk that controls may become inadequate because of changes in conditions, or that the degree of compliance with the policies or procedures may deteriorate. ADB's management assessed the effectiveness of ADB's internal control over financial reporting as of 31 December In making this assessment, ADB's management used the criteria set forth by the Committee of Sponsoring Organizations of the Treadway Commission in Internal Control Integrated Framework (2013). Based on that assessment, management believes that as of 31 December 2015, ADB's internal control over financial reporting is effective based upon the criteria established in Internal Control Integrated Framework (2013). Takehiko Nakao President Thierry de Longuemar Vice-President (Finance and Risk Management) 11 March 2016 Chai S. Kim Controller
118 111
119 112
120 113
121 114
122 115
123 116 ADF-1 ASIAN DEVELOPMENT BANK ASIAN DEVELOPMENT FUND SPECIAL PURPOSE STATEMENT OF ASSETS, LIABILITIES, AND FUND BALANCES 31 December 2015 and 2014 Expressed in Millions of US Dollars ASSETS DUE FROM BANKS $ 63 $ 60 INVESTMENTS (Notes C and K) Government or government-guaranteed obligations $ 5,591 $ 5,363 Time deposits 402 5, ,198 SECURITIES PURCHASED UNDER RESALE ARRANGEMENTS (Note C) LOANS OUTSTANDING (ADF-6) (Notes D and K) Sovereign 27,270 27,604 Less allowance for HIPC Debt Relief 65 27, ,534 ACCRUED REVENUE On investments On loans OTHER ASSETS (Note F) TOTAL $ 33,583 $ 34,439 LIABILITIES AND FUND BALANCES PAYABLE TO RELATED FUNDS (Note E) $ 51 $ 41 ADVANCE PAYMENTS ON CONTRIBUTIONS (Note F) UNDISBURSED COMMITMENTS (Notes J and K) 2,581 2,735 TOTAL LIABILITIES 2,799 2,961 FUND BALANCES (ADF-4) Contributions received (ADF-7) Contributed resources (Note F) $ 31,830 $ 31,830 Unamortized discount (28) (36) 31,802 31,794 Set-aside resources (Note H) Transfers from Ordinary Capital Resources and Technical Assistance Special Fund 1,583 1,463 33,451 33,326 Nonnegotiable, noninterest-bearing demand obligations on account of contributions (Note F) (1,738) (1,841) Accumulated (deficit) surplus (111) 206 Accumulated other comprehensive loss (Note I) (818) 30,784 (213) 31,478 TOTAL $ 33,583 $ 34,439 The accompanying notes are an integral part of these special purpose financial statements (ADF-8).
124 117 ADF-2 ASIAN DEVELOPMENT BANK ASIAN DEVELOPMENT FUND SPECIAL PURPOSE STATEMENT OF REVENUE AND EXPENSES For the Years Ended 31 December 2015 and 2014 Expressed in Millions of US Dollars REVENUE From loans (Note D) $ 308 $ 321 From investments (Note C) EXPENSES Grants (Note J) Administrative expenses (Note G) Amortization of discounts on contributions ,156 NET REALIZED GAINS FROM INVESTMENTS (Notes C and I) 8 11 NET UNREALIZED LOSSES (56) (72) REVENUE LESS THAN EXPENSES $ (317) $ (843) The accompanying notes are an integral part of these special purpose financial statements (ADF-8). SPECIAL PURPOSE STATEMENT OF COMPREHENSIVE LOSS For the Years Ended 31 December 2015 and 2014 Expressed in Millions of US dollars ADF-3 REVENUE LESS THAN EXPENSES (ADF-2) $ (317) $ (843) Other comprehensive (loss) income (Note I) Currency translation adjustments $ (586) $ 294 Unrealized investment holding losses (19) (605) (7) 287 COMPREHENSIVE LOSS $ (922) $ (556) The accompanying notes are an integral part of these special purpose financial statements (ADF-8).
125 118 ASIAN DEVELOPMENT BANK ASIAN DEVELOPMENT FUND SPECIAL PURPOSE STATEMENT OF CHANGES IN FUND BALANCES For the Years Ended 31 December 2015 and 2014 Expressed in Millions of US dollars Nonnegotiable, Accumulated Transfers Noninterest- Other Contributed Set-Aside from OCR bearing Demand Accumulated Comprehensive Resources Resources & TASF Obligations Surplus Loss Total ADF-4 Balance, 1 January 2014 $ 33,499 $ 73 $ 1,344 $ (2,106) $ 1,049 $ (500) $ 33,359 Comprehensive (loss) income (ADF-3) (Note I) (843) 287 (556) Contributions made available for operational commitment 1,093 1,093 Amortization of discount on donor's contribution Demand obligations received (823) (823) Encashment of demand obligations Transfer from OCR Translation adjustments (2,817) (4) (1) 174 (2,648) Balance, 31 December 2014 $ 31,794 $ 69 $ 1,463 $ (1,841) $ 206 $ (213) $ 31,478 Comprehensive loss (ADF-3) (Note I) (317) (605) (922) Contributions made available for operational commitment Amortization of discount on donor's contribution 7 7 Demand obligations received (568) (568) Encashment of demand obligations Transfer from OCR Translation adjustments (837) (3) 56 (784) Balance, 31 December 2015 $ 31,802 $ 66 $ 1,583 $ (1,738) $ (111) $ (818) $ 30,784 OCR = ordinary capital resources, TASF = Technical Assistance Special Fund. The accompanying notes are an integral part of these special purpose financial statements (ADF-8).
126 119 ADF-5 ASIAN DEVELOPMENT BANK ASIAN DEVELOPMENT FUND SPECIAL PURPOSE STATEMENT OF CASH FLOWS For the Years Ended 31 December 2015 and 2014 Expressed in Millions of US Dollars CASH FLOWS FROM OPERATING ACTIVITIES Interest charges on loans received $ 273 $ 307 Interest received from investments Administrative expenses paid (267) (282) Grants disbursed (503) (429) Net Cash Used in Operating Activities (412) (305) CASH FLOWS FROM INVESTING ACTIVITIES Sales of investments 2,422 2,586 Maturities of investments 62, ,958 Purchases of investments (64,558) (112,424) Receipts from securities purchased under resale arrangements 41,941 92,936 Payments for securities purchased under resale arrangements (41,624) (93,109) Principal collected on loans 1,242 1,291 Loans disbursed (2,024) (2,180) Net Cash Used in Investing Activities (586) (942) CASH FLOWS FROM FINANCING ACTIVITIES Contributions received and encashed ,192 Cash received from ordinary capital resources Net Cash Provided by Financing Activities 1,000 1,312 Effect of Exchange Rate Changes on Due from Banks 1 (8) Net Increase in Due from Banks 3 57 Due from Banks at Beginning of Year 60 3 Due from Banks at End of Year $ 63 $ 60 RECONCILIATION OF REVENUE LESS THAN EXPENSES TO NET CASH USED IN OPERATING ACTIVITIES: Revenue less than expenses (ADF-2) $ (317) $ (843) Adjustments to reconcile revenue less than expenses to net cash used in operating activities: Amortization of discounts/premiums on investments Amortization of discount on donor s contributions 8 19 Grants approved and effective Capitalized charges on loans (24) (24) Net gain on sale of investments (8) (11) Change in accrued revenue on investments and loans (10) 20 Change in other assets (1) (3) Change in payable to related funds 11 6 Change in undisbursed commitments (502) (425) Exchange losses net Net Cash Used in Operating Activities $ (412) $ (305) Supplementary disclosure on noncash financing activities: 1 Nonnegotiable, noninterest-bearing demand promissory notes amounting to $668 million ($809 million 2014) were received from contributing members. The accompanying notes are an integral part of these special purpose financial statements (ADF-8).
127 120 ASIAN DEVELOPMENT BANK ASIAN DEVELOPMENT FUND SPECIAL PURPOSE SUMMARY STATEMENT OF LOANS 31 December 2015 and 2014 Expressed in Millions of US dollars Undisbursed Loans Loans Balances of Not Yet Total Percent of Borrowers/Guarantors 1 Outstanding Effective Loans 2,3 Effective 4 Loans Total Loans Afghanistan $ 614 $ 13 $ $ Armenia Azerbaijan Bangladesh 5,864 1, , Bhutan Cambodia 1, , Cook Islands Georgia Indonesia Kazakhstan Kiribati Kyrgyz Republic Lao People s Democratic Republic , Maldives Marshall Islands Micronesia, Federated States of Mongolia Myanmar Nepal 1, , Pakistan 5, , Palau Papua New Guinea Philippines Samoa Solomon Islands Sri Lanka 2, , Tajikistan Timor-Leste Tonga Tuvalu Uzbekistan Vanuatu Viet Nam 4,068 1, , Regional TOTAL 31 December 2015 $ 27,270 $ 6,854 $ 1,436 $ 35, Allowance for HIPC Debt Relief (65) (65) NET BALANCE 31 December 2015 $ 27,205 $ 6,854 $ 1,436 $ 35,495 NET BALANCE 31 December 2014 $ 27,534 $ 6,586 $ 1,680 $ 35,800 0 = less than $0.5 million. 1 Loans other than those made directly to a member or to its central bank have been guaranteed by the member. 2 Loans negotiated before 1 January 1983 were denominated in current US dollars. Loans negotiated after that date are denominated in special drawing rights (SDR) for the purpose of commitment. The undisbursed portions of such SDR loans are translated into US dollars at the applicable exchange rates as of the end of a reporting period. Of the undisbursed balances, ADB has entered into irrevocable commitments to disburse various amounts totaling $45 million ($34 million ).
128 121 ADF-6 MATURITY OF EFFECTIVE LOANS AS OF 31 DECEMBER 2015 Twelve Months Five Years Ending Ending 31 December Amount 31 December Amount 2016 $ 1, , , , , , , , , , Total $ 34,124 SUMMARY OF CURRENCIES RECEIVABLE ON LOANS OUTSTANDING Currency Currency Australian dollar $ 30 $ 50 Norwegian krone Canadian dollar Pound sterling Danish krone Singapore dollar 0 0 Euro 1,293 1,714 Swedish krona Yen 2,504 3,075 Swiss franc Won Baht 0 1 Ringgit 0 1 US dollar 1,581 1,861 New Zealand dollar 1 1 Special Drawing Rights 5 21,328 20,180 Total $ 27,270 $ 27,604 3 Refer to the unwithdrawn portions of effective loans as of 31 December Refer to approved loans that have not become effective as of 31 December 2015, pending borrowers' compliance with effectiveness conditions specified in the loan regulations and the loan agreements. 5 Basket of currencies defined by the International Monetary Fund consisting of the euro, yen, pound sterling, and US dollar. The accompanying notes are an integral part of these special purpose financial statements (ADF-8).
129 122 ASIAN DEVELOPMENT BANK ASIAN DEVELOPMENT FUND SPECIAL PURPOSE STATEMENT OF RESOURCES 31 December 2015 Expressed in Millions of US dollars Effective Amounts Committed 1 CONTRIBUTED RESOURCES Australia $ 2,393 $ 2,014 Austria Belgium Brunei Darussalam Canada 1,951 1,940 China, People s Republic of Denmark Finland France 1,363 1,237 Germany 1,862 1,751 Hong Kong, China India Indonesia Ireland Italy 1, Japan 11,959 14,055 Kazakhstan 5 4 Korea, Republic of Luxembourg Malaysia Nauru 0 0 The Netherlands New Zealand Norway Portugal Singapore Spain Sweden Switzerland Taipei,China Thailand Turkey United Kingdom 1,557 1,256 United States 4,522 4,069 Total 31,599 31,802 SET-ASIDE RESOURCES 66 TRANSFERS FROM ORDINARY CAPITAL RESOURCES 1,580 TRANSFERS FROM TECHNICAL ASSISTANCE SPECIAL FUND 3 ADF-7 Contributions Received TOTAL $ 31,599 $ 33,451 Notes: Numbers may not sum precisely because of rounding. 0 = less than $0.5 million. 1 At exchange rates per Resolutions. The accompanying notes are an integral part of these special purpose financial statements (ADF-8).
130 123 ADF-8 ASIAN DEVELOPMENT BANK ASIAN DEVELOPMENT FUND NOTES TO SPECIAL PURPOSE FINANCIAL STATEMENTS 31 December 2015 and 2014 NOTE A NATURE OF OPERATIONS The Asian Development Bank (ADB), a multilateral development financial institution, was established in 1966 with its headquarters in Manila, Philippines. ADB and its operations are governed by the Agreement Establishing the Asian Development Bank (the Charter). Its purpose is to foster economic development and co-operation in Asia and the Pacific region and to contribute to the acceleration of the process of economic development of the developing member countries (DMCs) in the region, collectively and individually. Since 1999, ADB s corporate vision and mission has been to help DMCs reduce poverty in the region. This was reaffirmed under the long-term strategic framework for (Strategy 2020). Under Strategy 2020, ADB s corporate vision continues to be An Asia and Pacific Free of Poverty and its mission has been to help its DMCs reduce poverty and improve living conditions and quality of life. ADB has been pursuing its mission and vision by focusing on three complementary strategic agendas: inclusive growth, environmentally sustainable growth, and regional integration. ADB provides financial and technical assistance for projects and programs, which will contribute to achieve this purpose. These are financed through ordinary capital resources (OCR) and Special Funds. 1 The Asian Development Fund (ADF) was established in 1974 to more effectively carry out the special operations of the ADB by providing resources on concessional terms for economic and social development of the less developed member countries. The resources of ADF have been augmented by ten replenishments, the most recent of which (ADF XI and the fifth regularized replenishment of the Technical Assistance Special Fund [TASF]) was adopted by the Board of Governors in July 2012 and became effective on 4 June 2013 for the four-year period from January The replenishment provided substantial resources to the ADF to finance ADB s concessional program, and to the TASF to finance technical assistance operations. Total replenishment size was SDR8,415 million, of which SDR3,090 million was to come from new donor contributions. The donors agreed to allocate 3% of the total replenishment size (equivalent to about 8% of total donor contributions) to TASF. As of 31 December 2015, ADB had received instruments of contribution from 31 donors with a total amount equivalent to SDR3,047 million, including qualified contributions amounting to SDR368 million. ADB is immune from taxation pursuant to Chapter VIII, Article 56, Exemption from Taxation, of the Charter. Combined ADF-OCR Lending Operations In April 2015, the Board of Governors adopted a resolution authorizing the termination of ADF loan operations and the transfer of ADF loans, resources originally set-aside from the OCR, and certain other assets as may be determined by the Board of Directors to OCR effective 1 January After the effective date of this transfer, ADF will continue to provide assistance to developing member countries through its grant operations. NOTE B SUMMARY OF SIGNIFICANT ACCOUNTING POLICIES In May 2001, the Board of Directors approved the adoption of the special purpose financial statements for ADF. The financial statements have been prepared for the specific purpose of reflecting the sources and applications of member contributions and are presented in US dollar equivalents at the reporting dates. With the adoption of the special purpose financial statements, loan loss provisioning, other than those for the debt relief loan write-off resulting from the implementation of the Heavily Indebted Poor Countries (HIPC) 1 Asian Development Fund (ADF), Technical Assistance Special Fund (TASF), Japan Special Fund (JSF), ADB Institute (ADBI), Regional Cooperation and Integration Fund (RCIF), Climate Change Fund (CCF), Asia Pacific Disaster Response Fund (APDRF), and Financial Sector Development Partnership Special Fund (FSDPSF).
131 124 ADF-8 continued Debt Initiative discussed in Note D, has been eliminated. With the exception of the aforementioned, the ADF financial statements are prepared in accordance with accounting principles generally accepted in the United States of America (US GAAP). In November 2005, the Board of Governors accepted a resolution to adopt a special drawing rights (SDR) currency management framework to facilitate resource administration and operational planning for the benefit of borrowers. The currency management framework was implemented on 1 January 2006 whereby ADB is authorized to convert ADF resources held in various currencies into one of the SDR basket of currencies (US dollar, euro, pound sterling, and yen), to value disbursements, repayments and loan charges in terms of SDR, and to determine the value of contributors paid-in contributions and all other resources of the ADF in terms of SDR, in case of withdrawal of a Contributor or termination of ADF. In July 2007 ADB offered ADF borrowers the option to convert their existing liability (i.e., disbursed and outstanding loan balance) in various currencies into SDR, while the undisbursed portions would be treated as new loans. The conversion was made available beginning 1 January 2008, and as of 31 December 2015, 20 out of 29 ADF borrowing countries had opted to convert their loans, which were carried out on the nearest loan service payment dates at least one month from their concurrence. Functional Currencies and Reporting Currency The US dollar is the reporting currency of the ADF for the purpose of presenting the financial position and the result of its operations. With the implementation of the SDR currency management framework, ADF conducts its operations in SDRs and the SDR basket of currencies, which are US dollar, euro, pound sterling, and yen. The SDR and the SDR basket of currencies comprise the functional currencies of ADF. Translation of Currencies ADB adopts the use of daily exchange rates for accounting and financial reporting purposes. This allows transactions in currencies other than USD to be translated to the reporting currency using exchange rates applicable at the time of the transactions. Assets and liabilities are translated using the applicable exchange rates at the end of each reporting period, except for Contributed Resources received in nonfunctional currencies. Translation adjustments relating to set-aside resources (Note H) are recorded as notional amounts receivable from or payable to OCR. Translation adjustments relating to revaluation of assets, liabilities, and fund balances denominated in ADF s functional currencies and all investments classified as available for sale are reported as Accumulated Translation Adjustments in FUND BALANCES as part of Accumulated other comprehensive loss. Translation adjustments relating to other non-functional currencies are reported as NET UNREALIZED LOSSES in the Special Purpose Statement of Revenue and Expenses. Investments Investment securities and negotiable certificates of deposit are classified as available for sale and are reported at fair value. Unrealized gains and losses are reported in FUND BALANCES as part of Accumulated other comprehensive loss. Realized gains and losses are measured by the difference between amortized cost and the net proceeds of sales. Interest income on investment securities and time deposits is recognized as earned and reported, net of amortizations of premiums and discounts.
132 125 ADF-8 continued Securities Purchased Under Resale Arrangements ADF accounts for transfers of financial assets in accordance with Financial Accounting Standards Board (FASB) Accounting Standards Codification (ASC) 860, Transfers and Servicing. Transfers are accounted for as sales when control over the transferred assets has been relinquished. Otherwise the transfers are accounted for as resale agreements and collateralized financing arrangements. Under resale arrangements, securities purchased are recorded as assets and are not re-pledged. Loans Loan interest income is recognized on an accrual basis. It is the policy of ADF to place in non-accrual status loans made to eligible borrowing member countries if the principal or interest with respect to any such loans is overdue by six months. Interest on non-accruing loans is included in revenue only to the extent that payments have actually been received by ADF. ADB maintains a position of not taking part in debt rescheduling agreements with respect to sovereign loans. When ADB decides that a particular loan is no longer collectible, the entire amount is expensed during the period. Contributed Resources Contributions by donors are included in the special purpose financial statements as amounts committed and are reported in Contributed Resources as part of FUND BALANCES from the date Instruments of Contribution are deposited and related formalities are completed and made available for operational commitments. Contributions are generally received in the currency of the contributor either in cash or notes. Under ADF IX, ADF X, and ADF XI, contributors have the option to pay their contributions under the accelerated note encashment program and receive a discount. ADF invests the cash generated from this program and the investment income is used to finance operations. The related contributions are recorded at the full undiscounted amount, and the discount is amortized over the standard encashment period of 10 years for ADF IX and 9 years for ADF X and ADF XI. Advanced Payments on Contributions Payments received in advance or as qualified contributions that cannot be made available for operational commitment are recorded as advance payments on contributions and included under LIABILITIES. Grants and Undisbursed Commitments Grants are recognized in the special purpose financial statements when the grant is approved and becomes effective. Upon completion of a project or cancellation of a grant, any undisbursed amount is written back as a reduction in the grants for the year and the corresponding undisbursed commitment is eliminated accordingly. Fair Value of Financial Instruments ASC 820, Fair Value Measurement defines fair value as the price that would be received to sell an asset or paid to transfer a liability at measurement date in an orderly transaction among willing participants with an assumption that the transaction takes place in the entity s principal market, or in the absence of principal market, in the most advantageous market for the asset or liability. The most advantageous market is the market where the sale of the asset or transfer of liability would maximize the amount received for the asset or minimize the amount paid to transfer the liability. The fair value measurement is not adjusted for transaction costs.
133 126 ADF-8 continued Fair Value Hierarchy ASC 820 establishes a fair value hierarchy that gives the highest priority to quoted prices in active markets for identical assets or liabilities (Level 1), next priority to observable market inputs or market corroborated data (Level 2), and the lowest priority to unobservable inputs without market corroborated data (Level 3). The fair values of ADB s financial assets and liabilities are categorized as follows: Level 1: fair values are based on unadjusted quoted prices for identical assets or liabilities in active markets. Level 2: fair values are based on quoted prices for similar assets or liabilities in active markets or markets that are not active; or valuation models for which significant inputs are obtained from market-based data that are observable. Level 3: fair values are based on prices or valuation models for which significant inputs to the model are unobservable. Inter-level transfers from one year to another may occur due to changes in market activities affecting the availability of quoted market prices or observable market data. ADB s policy is to recognize transfers in and transfers out of levels as of the end of the reporting period in which they occur. Accounting Estimates The preparation of special purpose financial statements requires management to make reasonable estimates and assumptions that affect the reported amounts of assets, liabilities, and fund balances as of the end of the year and the reported amounts of revenue and expenses during the year. The actual results could differ from those estimates. Judgments have been used in the valuation of certain financial instruments. Accounting and Reporting Developments In April 2014, the Financial Accounting Standards Board (FASB) issued Accounting Standard Update (ASU) , Reporting Discontinued Operations and Disclosures of Disposals of Components of an Entity, to change the requirements for reporting discontinued operations in Subtopic The new guidance requires discontinued operations treatment for disposals of a (group of) component(s) that represents a strategic shift that has or will have a major impact on an entity's operations or financial results. The ASU is applicable to all entities and is effective for annual periods beginning on or after 15 December 2014 and interim periods within those years. The planned termination and transfer of ADF loan operations are disclosed in Note A. In May 2014, the FASB issued ASU Revenue from Contracts with Customers (Topic 606) to improve financial reporting by creating common revenue recognition guidance for US GAAP and the International Financial Reporting Standards. An entity is required to apply the amendments prospectively for annual reporting periods beginning after 15 December In August 2015, FASB issued ASU deferring the effective date by one year. ADB is currently assessing the impact on ADF s financial statements. In June 2014, the FASB issued ASU Transfers and Servicing (Topic 860) Repurchase-to- Maturity Transactions, Repurchase Financings, and Disclosures to change the accounting for repurchase-to-maturity transactions and linked repurchase financings to secured borrowing accounting, which is consistent with the accounting for other repurchase agreements. The amendments also require an entity to disclose information on transfers accounted for as sales in transactions that are economically similar to repurchase agreements and to provide increased transparency about the types of collateral pledged in repurchase agreements and similar transactions accounted for as secured borrowings. An
134 127 ADF-8 continued entity is required to apply the amendments prospectively for annual reporting periods beginning after 15 December 2014, and for interim periods after 15 March This ASU is not applicable to ADF. In August 2014, the FASB issued ASU , Presentation of Financial Statements Going Concern (Subtopic ), to require management to perform interim and annual assessments of an entity s ability to continue as a going concern within one year of the date the financial statements are issued. An entity must provide certain disclosures if conditions or events raise substantial doubt about the entity s ability to continue as a going concern. The ASU applies to all entities and is effective for annual periods ending after 15 December 2016, and interim periods thereafter. This ASU is not expected to impact ADF s financial statements. In January 2016, the FASB issued ASU , Financial Instruments Overall (Subtopic ) - Recognition and Measurement of Financial Assets and Financial Liabilities. This Update enhances the reporting requirements for financial instruments. Specifically, this Update (i) requires that investments in equity securities measured at FV, recognize changes in FV in net income, (ii) simplifies the impairment assessment of equity investments for which FV is not readily determinable by requiring entities to perform a qualitative assessment to identify impairment, (iii) amends certain disclosure requirements associated with the FV of financial instruments, and (iv) requires to present separately in other comprehensive income the portion of the total change in the FV of financial liabilities measured at FV resulting from a change in the instrument-specific credit risk. This Update is effective for fiscal years beginning after 15 December 2017 and interim periods thereafter. ADB is currently assessing the impact of this ASU on ADF s financial statements. Special Purpose Statement of Cash Flows For the purposes of the Special Purpose Statement of Cash Flows, ADF considers that its cash and cash equivalents are limited to DUE FROM BANKS, which consists of cash on hand and current accounts in banks used for (i) operational disbursements, (ii) receipt of funds from encashment of donor countries promissory notes, and (iii) clearing accounts. NOTE C INVESTMENTS The main investment management objective is to maintain security and liquidity. Subject to these parameters, ADB seeks the highest possible return on its investments. Investments are governed by the Investment Authority approved by the Board of Directors. ADB may engage in securities lending of government or government-guaranteed obligations for which ADB receives a guarantee from the securities custodian and a fee. Transfers of securities by ADB to counterparties are not accounted for as sales as the accounting criteria for the treatment of a sale have not been met. These securities must be available to meet ADB s obligation to counterparties. Included in Investments as of 31 December 2015 were government or government-guaranteed obligations transferred under securities lending arrangements amounting to $17 million ($4 million 2014).
135 128 ADF-8 continued The currency composition of the investment portfolio as of 31 December 2015 and 2014 expressed in US dollars was as follows: ($ million) Currency US dollar $ 2,983 $ 2,798 Euro 1,891 2,401 Pound sterling Yen Total $ 5,993 $ 6,198 The estimated fair value and amortized cost of the investments as of 31 December 2015 and 2014 were as follows: ($ million) Estimated Amortized Estimated Amortized Fair Value Cost Fair Value Cost Due in one year or less $ 1,443 $ 1,440 $ 2,327 $ 2,323 Due after one year through five years 4,133 4,136 3,713 3,700 Due after five years through ten years Due after ten years through fifteen years Total $ 5,993 $ 5,990 $ 6,198 $ 6,176 Additional information relating to investments in government or government-guaranteed obligations classified as available for sale is as follows: ($ million) As of 31 December Amortized cost $ 5,588 $ 5,341 Estimated fair value 5,591 5,363 Gross unrealized gains Gross unrealized losses (13) (4) For the years ended 31 December Change in net unrealized losses from prior year (19) $ (7) Proceeds from sales 2,422 2,586 Gross gain on sales 8 11 Gross loss on sales (0) (0) 0 = less than $0.5 million.
136 129 ADF-8 continued The rate of return on the average investments held during the year, including securities purchased under resale arrangements, based on the portfolio held at the beginning and end of each month, was 0.95% (0.90% 2014) excluding unrealized gains and losses on investment securities, and 0.67% (0.80% 2014) including unrealized gains and losses on investments. There were no government or government-guaranteed obligations (nil 31 December 2014) that sustained losses for over one year. Comparative details for 2015 and 2014 are as follows: ($ million) One year or less Over one year Total Fair Unrealized Fair Unrealized Fair Unrealized Value Losses Value Losses Value Losses As of 31 December 2015 Government or governmentguaranteed obligations $ 2,639 $ 13 $ $ $ 2,639 $ 13 ($ million) One year or less Over one year Total Fair Unrealized Fair Unrealized Fair Unrealized Value Losses Value Losses Value Losses As of 31 December 2014 Government or governmentguaranteed obligations $ 1,420 $ 4 $ $ $ 1,420 $ 4 Fair Value Disclosure The fair value of INVESTMENTS and related financial assets as of 31 December 2015 and 2014 was as follows: ($ million) Fair Value Measurements Total Level 1 Level 2 Level 3 31 December 2015 Investments Government or governmentguaranteed obligations $ 5,591 $ 5,586 $ 5 $ Time deposits Securities purchased under resale arrangements Total at fair value $ 6,030 $ 5,586 $ 444 $ ($ million) Fair Value Measurements Total Level 1 Level 2 Level 3 31 December 2014 Investments Government or governmentguaranteed obligations $ 5,363 $ 5,247 $ 116 $ Time deposits Securities purchased under resale arrangements Total at fair value $ 6,559 $ 5,247 $ 1,312 $
137 130 ADF-8 continued If available, investment securities are fair valued based on active market quotes. These include most government or government-guaranteed obligations. For investments where active market quotes are not available, investments are categorized as Level 2 or Level 3, and valuation is provided by independent valuation services or based on discounted cash flow models using market observable inputs, such as interest rates, foreign exchange rates, basis spreads, cross currency rates, and volatilities. Time deposits are reported at cost, which approximates fair value. The table below provides details of transfers between Level 1 and Level 2 for the years ended 31 December 2015 and 2014: ($ million) Level 1 Level 2 Level 1 Level 2 Investments Government or governmentguaranteed obligations Transfers into (out of) $ $ $ 16 $ (16) Transfers (out of) into (5) 5 The inter-level transfers are attributed to the absence or availability of market quotes. ADB maintains documented processes and internal controls to value the investment securities and financial assets. The data management unit in the treasury department is responsible for providing the valuation in accordance with the business process. In instances where ADB relies primarily on prices from third party pricing information, there are procedures in place to validate the appropriateness of those values in determining the hierarchy levels. This involves evaluating the nature of prices provided by third party pricing sources to determine if they are indicative or binding prices. There were no investments categorized as Level 3 as of 31 December 2015 and NOTE D LOANS AND HIPC INITIATIVE Prior to 1 January 1999, loans of ADF extended to eligible borrowing members bore a service charge of 1% and required repayment over periods ranging from 35 to 40 years. On 14 December 1998, the Board of Directors approved an amendment to ADF loan terms, as follows: (i) for loans to finance specific projects, the maturity was shortened to 32 years including an 8-year grace period; (ii) for program loans to support sector development, the maturity was shortened to 24 years including an 8-year grace period; and (iii) all new loans bear a 1% interest charge during the grace period, and 1.5% during the amortization period, with equal amortization. The revised ADF lending terms took effect on 1 January 1999 for loans for which formal loan negotiations were completed on or after 1 January ADF requires borrowers to absorb exchange rate risks attributable to fluctuations in the value of the currencies disbursed. In September 2007, the Board of Directors approved a new hard-term ADF lending facility. The facility will have a fixed interest rate of 150 basis points below the weighted average of the ten-year fixed swap rates of the special drawing rights component currencies plus the OCR lending spread, or the current ADF rate, whichever is higher. Other terms are similar to those of regular ADF loans. The interest rate will be reset every January and will apply to all hard-term loans approved that year and will be fixed for the life of the loan. In June 2012, the Board of Directors approved the hardening of lending terms to blend countries: (a) for project and policy-based loans financed from ADF resources, a 25-year tenor including a 5-year grace period, 2.0% per year interest rate throughout the loan tenor, and equal amortization; and (b) for hardterm loans, a 25-year tenor including a 5-year grace period, an interest rate calculated as 150 basis points below the weighted average of the 10-year fixed swap rates of the SDR component currencies plus the OCR lending spread, or the applicable ADF interest rates, whichever is higher, throughout the loan
138 131 ADF-8 continued tenor, and equal amortization. These new lending terms were applicable to loans for which formal loan negotiations were completed on or after 1 January For hard-term ADF loans approved in 2015, the interest rate was set at (i) 1.0% during the grace period and 1.5% thereafter (1.77% fixed for the life of the loans 2014) for ADF-only countries; and (ii) 2.0% fixed for the life of the loans for blend countries (2.0% fixed 2014). In April 2008, the Board of Governors adopted the resolution on providing HIPC Relief from ADF Debt which allowed ADB to participate in the HIPC Initiative. Subsequently, the Board of Directors approved the provision of debt relief under HIPC to Afghanistan. ADB believes that because there is no comparable market for ADF loans and because they do not intend to sell these loans, using market data to calculate the fair value of the loans is not meaningful. As such, the fair value of loans is determined based on the terms at which a similar loan would currently be made by ADB to a similar borrower. For such loans, carrying amount approximates the fair value. Any credit risks adjustment on the fair value of loans is considered not to have a material effect based on ADB s experience with its borrowers. Undisbursed loan commitments and an analysis of loans by country as of 31 December 2015 are shown in ADF-6. As of 31 December 2015 and 2014, outstanding loans to borrowers that exceeded 5% of total outstanding loans were as follows: ($ million) Bangladesh $ 5,864 $ 6,022 Pakistan 5,346 5,422 Viet Nam 4,068 3,907 Sri Lanka 2,363 2,433 Nepal 1,437 1,456 Others (individually less than 5% of total loans) 8,192 8,364 Total Outstanding Loans 27,270 27,604 Allowance for HIPC Debt Relief (65) (70) Net Outstanding Loans $ 27,205 $ 27,534 There were no outstanding loans in non-accrual status as of 31 December 2015 and Credit Quality of Loans ADF loans are provided for the economic and social development of the less developed member countries, which generally have lower credit quality than OCR borrowers. ADB uses a performance based allocation (PBA) system to allocate ADF resources among the many competing needs in the region and to direct the funds to where they will be used most effectively. ADB regularly reviews the borrowers debt sustaining capacity in determining the proportion of grant and loan that would be provided to each borrower. The credit quality of ADF loans has been classified by mapping the external sovereign ratings of the borrowers to ADB s internal risk rating scale used for OCR loans.
139 132 ADF-8 continued The credit quality of ADF loans was as follows: ($ million) Risk Class Risk Rating Low credit risk 1 5 (AAA to BBB ) $ 1,310 $ 1,585 Medium credit risk 6 11 (BB+ to B ) 23,614 17,419 High credit risk (CCC+ to D) 2,346 8,600 Total $ 27,270 $ 27,604 Provision for HIPC Debt Relief amounting to $82 million relating to the Afghanistan debt relief under the HIPC Initiative was recognized and charged to income in Of this amount, a total of $17 million was written-off as the loan service payments of affected loans fell due. This brought the balance of Allowance for HIPC debt relief as of 31 December 2015 to $65 million. NOTE E RELATED PARTY TRANSACTIONS The OCR and Special Funds resources are at all times used, committed, and invested entirely separate from each other. Payable to related funds of $51 million ($41 million 2014) is an amount due to OCR, representing the unpaid balance of ADF s share in the administrative and operational expenses of ADB. The allocation of expenses is based on operational activities and are settled regularly. See Note G ADMINISTRATIVE EXPENSES. Under ADF XI and the fifth regularized replenishment of TASF, a specific portion of the total contributions is to be allocated to TASF. ADF receives contributions from members and subsequently transfers the specified portion to TASF. As of 31 December 2015 and 2014, ADF has transferred all allocated contributions to TASF. NOTE F CONTRIBUTED RESOURCES AND ADVANCED CONTRIBUTIONS In May 2015, the Board of Governors approved the transfer of $120 million to the ADF as part of OCR s 2014 net income allocation. ADF receives cash or nonnegotiable, noninterest-bearing demand obligations as payment for the contributions. Subject to certain restrictions imposed by applicable Board of Governors resolutions, demand obligations are encashable by ADB at par upon demand. The unencashed balance as of 31 December 2015 is reported as a reduction in the Fund Balances, which ADB currently expects to be encashed in varying amounts over the standard encashment period ending 31 December 2017 for ADF X, and 31 December 2021 for ADF XI. As of 31 December 2015, contributions from 31 donors totaling $3,564 million were committed for ADF XI. Of these, $2,391 million including amortized discount of $2 million were received and recorded in Contributed Resources. Advance contributions received from donors outstanding as of 31 December 2015 total $167 million ($185 million 2014). Of this, contributions totaling $120 million ($117 million 2014) were received in demand obligations, and are included in OTHER ASSETS. The remaining $47 million ($68 million 2014) was received in cash.
140 133 ADF-8 continued NOTE G ADMINISTRATIVE EXPENSES Administrative expenses represent administration charges from OCR which is an apportionment of all administrative expenses of ADB (other than those pertaining directly to ordinary operations and special operations), in the proportion of the relative volume of operational activities. NOTE H SET-ASIDE RESOURCES Pursuant to the provisions of Article 19, paragraph 1(i) of the Charter, the Board of Governors has authorized the setting aside of 10% of the unimpaired paid-in capital paid by members pursuant to Article 6, paragraph 2(a) of the Charter and of the convertible currency portion paid by members pursuant to Article 6, paragraph 2(b) of the Charter as of 28 April 1973, to be used as a part of the Special Funds of ADB. The set aside capital was allocated and transferred from the OCR to ADF as Set-Aside Resources. The capital stock of ADB is defined in Article 4, paragraph 1 of the Charter, in terms of US dollars of the weight and fineness in effect on 31 January 1966 (the 1966 dollar). Therefore, Set-Aside Resources had historically been translated into the current US dollar (ADB s unit of account), on the basis of its par value in terms of gold. From 1973 until 31 March 1978, the rate arrived at on this basis was $ per 1966 dollar. Since 1 April 1978, at which time the Second Amendment to the Articles of Agreement of the International Monetary Fund (IMF) came into effect, currencies no longer had par values in terms of gold. Pending ADB s selection of the appropriate successor to the 1966 dollar, the Set-Aside Resources have been valued for purposes of the accompanying special purpose financial statements in terms of the SDR, at the value in current US dollars as denominated by the IMF. As of 31 December 2015, the value of the SDR in terms of the current US dollar was $ ($ ). On this basis, Set-Aside Resources amounted to $66 million ($69 million 2014). If the capital stock of ADB as of 31 December 2015 had been valued in terms of $12, per share, Set-Aside Resources would have been $57 million. NOTE I ACCUMULATED OTHER COMPREHENSIVE INCOME (LOSS) Comprehensive Income (Loss) has two major components: revenue less than expenses (ADF-2) and other comprehensive income (loss) (ADF-3). Other Comprehensive Income (Loss) includes unrealized gains and losses on Available for Sale securities and translation adjustments of assets and liabilities denominated in one of the functional currencies. The changes in Accumulated Other Comprehensive Loss balances for the years ended 31 December 2015 and 2014 were as follows: ($ million) Unrealized Holding Accumulated Translation Gains (Losses) Accumulated Other Adjustments Investments Comprehensive Loss Balance, 1 January $ (235) $ (529) $ 22 $ 29 $ (213) $ (500) Other comprehensive (loss) income before reclassification (586) 294 (12) (2) (598) 292 Amounts reclassified from accumulated other comprehensive loss (7) (5) (7) (5) Net current-period other comprehensive (loss) income (586) 294 (19) (7) (605) 287 Balance, 31 December $ (821) $ (235) $ 3 $ 22 $ (818) $ (213)
141 134 ADF-8 continued The reclassifications of Accumulated Other Comprehensive Loss to Revenue and Expenses for the year ended 31 December 2015 and 2014 were as follows: ($ million) Amounts Reclassified Accumulated Other from Accumulated Other Affected Line Item in the Comprehensive Loss Comprehensive Loss Special Purpose Components Statement of Revenue and Expenses Unrealized Holding Gains on Investments $ 7 $ 5 NET REALIZED GAINS FROM INVESTMENTS NOTE J GRANTS AND UNDISBURSED COMMITMENTS ADF IX introduced financing in the form of grants for the first time. During 2015, 15 grants ( ) totaling $358 million ($405 million 2014) were approved, while $348 million ($848 million 2014), net of $12 million ($7 million 2014) write-back of undisbursed commitments for financially closed and/or cancelled grants, became effective. The fair value of undisbursed commitments approximates the amount outstanding, because ADB expects that disbursements will substantially be made for all the projects/programs covered by the commitments. NOTE K OTHER FAIR VALUE DISCLOSURES As of 31 December 2015 and 2014, ADF has no assets or liabilities measured at fair value on a nonrecurring basis. See Notes C, D, and J for discussions relating to investments, loans, and undisbursed commitments, respectively. In all other cases, the carrying amounts of ADF s assets and liabilities are considered to approximate fair values. NOTE L SUBSEQUENT EVENTS ADB has evaluated subsequent events after 31 December 2015 through 11 March 2016, the date these Special Purpose Financial Statements are available for issuance. As a result of this evaluation, there are no subsequent events, as defined, that require recognition or disclosure in the ADF s Financial Statements as of 31 December 2015.
142 135 TECHNICAL ASSISTANCE SPECIAL FUND MANAGEMENT'S REPORT ON INTERNAL CONTROL OVER FINANCIAL REPORTING The management of Asian Development Bank ("ADB") is responsible for establishing and maintaining adequate internal control over financial reporting. ADB's internal control over financial reporting is a process designed to provide reasonable assurance regarding the reliability of financial reporting and the preparation of financial statements for external purposes in accordance with generally accepted accounting principles in the United States of America. ADB's internal control over financial reporting includes those policies and procedures that (i) pertain to the maintenance of records that, in reasonable detail, accurately and fairly reflect the transactions and dispositions of the assets of ADB; (ii) provide reasonable assurance that transactions are recorded as necessary to permit preparation of financial statements in accordance with generally accepted accounting principles in the United States of America, and that receipts and expenditures of ADB are being made only in accordance with authorizations of management and directors of ADB; and (iii) provide reasonable assurance regarding prevention or timely detection and correction of unauthorized acquisition, use, or disposition of ADB's assets that could have a material effect on the financial statements. Because of its inherent limitations, internal control over financial reporting may not prevent or detect misstatements. Also, projections of any evaluation of effectiveness to future periods are subject to the risk that controls may become inadequate because of changes in conditions, or that the degree of compliance with the policies or procedures may deteriorate. ADB's management assessed the effectiveness of ADB's internal control over financial reporting as of 31 December In making this assessment, ADB's management used the criteria set forth by the Committee of Sponsoring Organizations of the Treadway Commission in Internal Control Integrated Framework (2013). Based on that assessment, management believes that as of 31 December 2015, ADB's internal control over financial reporting is effective based upon the criteria established in Internal Control Integrated Framework (2013). Takehiko Nakao President Thierry de Longuemar Vice-President (Finance and Risk Management) Chai S. Kim Controller 11 March 2016

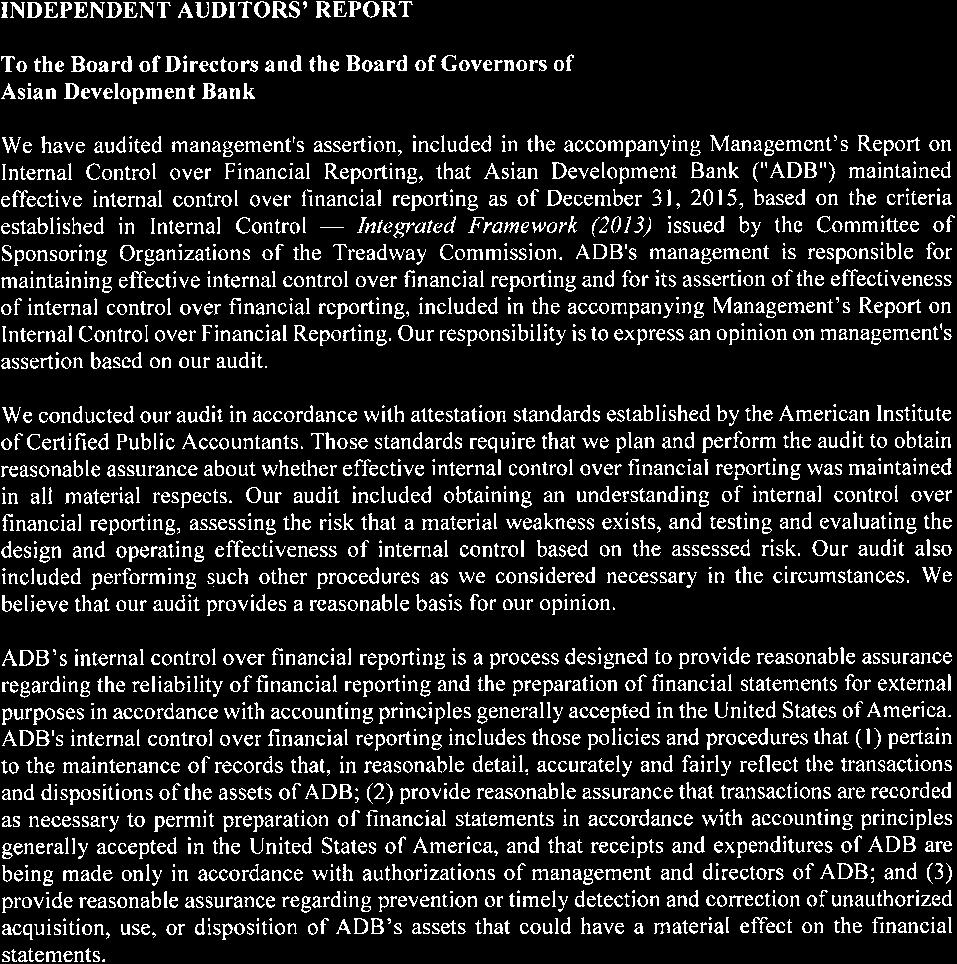
143 136
144 137
145 138
146 139
147 140 TASF-1 ASIAN DEVELOPMENT BANK TECHNICAL ASSISTANCE SPECIAL FUND STATEMENT OF FINANCIAL POSITION 31 December 2015 and 2014 Expressed in Thousands of US Dollars ASSETS DUE FROM BANKS $ 6,972 $ 1,228 INVESTMENTS (Notes C and G) Time deposits 366, ,457 SECURITIES PURCHASED UNDER RESALE ARRANGEMENTS (Note C) 84 ACCRUED REVENUE DUE FROM CONTRIBUTORS (Note F) 112, ,839 ADVANCES FOR GRANTS AND OTHER ASSETS (Note D) 2,550 5,024 TOTAL $ 488,936 $ 561,717 LIABILITIES AND UNCOMMITTED BALANCES ACCOUNTS PAYABLE AND OTHER LIABILITIES (Notes D and E) $ 1,443 $ 471 UNDISBURSED COMMITMENTS (Notes E and G) 340, ,378 TOTAL LIABILITIES 342, ,849 UNCOMMITTED BALANCES (TASF-2 and TASF-4) (Note F), represented by: Unrestricted net assets 146, ,868 TOTAL $ 488,936 $ 561,717 The accompanying notes are an integral part of these financial statements (TASF-6).
148 141 TASF-2 ASIAN DEVELOPMENT BANK TECHNICAL ASSISTANCE SPECIAL FUND STATEMENT OF ACTIVITIES AND CHANGES IN NET ASSETS For the Years Ended 31 December 2015 and 2014 Expressed in Thousands of US Dollars CHANGES IN UNRESTRICTED NET ASSETS CONTRIBUTIONS (TASF-4) (Note F) $ 68,407 $ 32,013 REVENUE From investments (Note C) 2,214 2,595 From other sources (Notes D and E) 7,570 9 Total 78,191 34,617 EXPENSES Technical assistance net (TASF-5) (Note E) 123, ,316 Administrative expenses (Note D) 6,169 Financial expenses Other expenses 297 Total 129, ,623 CONTRIBUTIONS AND REVENUE LESS THAN EXPENSES (51,592) (79,006) EXCHANGE LOSSES net (22,377) (29,720) DECREASE IN NET ASSETS (73,969) (108,726) NET ASSETS AT BEGINNING OF YEAR 220, ,594 NET ASSETS AT END OF YEAR $ 146,899 $ 220,868 The accompanying notes are an integral part of these financial statements (TASF-6).
149 142 TASF-3 ASIAN DEVELOPMENT BANK TECHNICAL ASSISTANCE SPECIAL FUND STATEMENT OF CASH FLOWS For the Years Ended 31 December 2015 and 2014 Expressed in Thousands of US Dollars CASH FLOWS FROM OPERATING ACTIVITIES Contributions received $ 113,489 $ 105,743 Interest on investments received 2,245 2,559 Net cash received from other activities 6 9 Technical assistance disbursed (121,187) (120,783) Financial expenses paid (13) (10) Other expenses paid 1,395 (297) Net Cash Used In Operating Activities (4,065) (12,779) CASH FLOWS FROM INVESTING ACTIVITIES Maturities of investments 14,514,359 16,542,793 Purchases of investments (14,504,112) (16,529,407) Receipts from securities purchased under resale arrangements 5, ,977 Payments for securities purchased under resale arrangements (5,537) (736,759) Net Cash Provided by Investing Activities 10,330 11,604 Effect of Exchange Rate Changes on Due from Banks (521) (179) Net Increase (Decrease) in Due from Banks 5,744 (1,354) Due from Banks at Beginning of Year 1,228 2,582 Due from Banks at End of Year $ 6,972 $ 1,228 RECONCILIATION OF DECREASE IN NET ASSETS TO NET CASH USED IN OPERATING ACTIVITIES: Decrease in net assets (TASF-2) $ (73,969) $ (108,726) Adjustments to reconcile decrease in net assets to net cash used in operating activities: Change in accrued revenue 30 (36) Change in due from contributors 66,469 86,946 Change in advances for grants and other assets 3,623 (4,140) Change in accounts payable and other liabilities 980 (53) Change in undisbursed commitments 217 (6,370) Exchange (gains) losses net (1,415) 19,600 Net Cash Used in Operating Activities $ (4,065) $ (12,779) The accompanying notes are an integral part of these financial statements (TASF-6).
150 143 TASF-4 ASIAN DEVELOPMENT BANK TECHNICAL ASSISTANCE SPECIAL FUND STATEMENT OF RESOURCES 31 December 2015 Expressed in Thousands of US Dollars Contributions Direct Committed Voluntary Regularized Total Contributor During 2015 Contributions Replenishment 1 Contributions Australia $ $ 2,484 $ 103,809 $ 106,294 Austria ,582 10,741 Bangladesh Belgium 1,394 8,535 9,929 Brunei Darussalam Canada 3,346 58,087 61,433 China, People's Republic of 1,600 8,358 9,958 Denmark 1,963 7,656 9,618 Finland 237 6,979 7,216 France 1,697 43,704 45,402 Germany 3,315 59,811 63,126 Hong Kong, China 100 6,120 6,220 India 4,494 4,494 Indonesia Ireland 5,771 5,771 Italy ,458 37,232 Japan 47, , ,345 Kazakhstan Korea, Republic of 1,900 33,347 35,247 Luxembourg 1,502 1,502 Malaysia 909 1,572 2,481 Nauru The Netherlands 1,337 26,869 28,206 New Zealand 1,096 7,400 8,496 Norway 3,279 11,430 14,709 Pakistan 70 2,086 2,086 Portugal 3,635 3,635 Singapore 1,100 1,398 2,498 Spain ,564 16,754 Sri Lanka 6 6 Sweden ,209 19,071 Switzerland 1,035 13,498 14,533 Taipei,China 200 5,215 5,415 Thailand Turkey 3,694 3,694 United Kingdom 5,617 64,238 69,855 United States 28,337 1, , ,957 Total 28,407 90,688 1,144,840 1,235,528 Transfer to Asian Development Fund (3,472) Allocation from OCR Net Income 40, ,000 Other Resources 2 204,728 TOTAL $ 68,407 $ 2,385,785 Note: Numbers may not sum precisely because of rounding. 1 Represents TASF portion of contributions to the replenishment of the Asian Development Fund and the Technical Assistance Special Fund authorized by Governors' Resolution Nos. 182, 214, 300, 333 and 357 at historical values. 2 Represents income, repayments, and reimbursements accruing to TASF since The accompanying notes are an integral part of these financial statements (TASF-6).
151 144 ASIAN DEVELOPMENT BANK TECHNICAL ASSISTANCE SPECIAL FUND SUMMARY STATEMENT OF TECHNICAL ASSISTANCE APPROVED AND EFFECTIVE For the Year Ended 31 December 2015 Expressed in Thousands of US Dollars Project Research and Policy and Capacity Recipient Preparation Advisory Development Advisory Development Total TASF-5 Afghanistan $ $ $ $ (16) $ 1,516 $ 1,501 Armenia 546 (30) 1,225 1,741 Azerbaijan 2,200 2,200 Bangladesh (26) (330) 2,028 1,673 Bhutan 2,137 2,137 Cambodia 748 (4) (135) 2,088 2,697 China, People's Republic of 5,053 (169) 4,177 1,341 10,402 Cook Islands (4) (4) Fiji Georgia (254) India 1,245 2,264 3,509 Indonesia 1,670 (768) 1,725 (243) 2,385 Kazakhstan 1,625 1,000 2,625 Kiribati (275) (275) Kyrgyz Republic ,384 Lao People s Democratic Republic 2,175 (109) 1,049 3,115 Malaysia (15) (15) Maldives 1, ,850 Mongolia 2,500 1,600 2,579 6,679 Myanmar 1,375 1,355 1,813 4,543 Nauru (136) (136) Nepal 2,168 2,913 5,081 Pakistan 6,025 (27) 1,832 7,830 Papua New Guinea (162) (162) Philippines 852 (224) (79) 548 Samoa (85) Solomon Islands Sri Lanka 195 (80) 1,854 1,970 Tajikistan 927 (33) 895 Thailand (226) (226) Timor-Leste 500 (19) 481 Tonga Tuvalu Uzbekistan 2, ,749 Vanuatu (86) (86) Viet Nam 1, ,648 3,664 Regional (104) 12,428 6,196 32,604 51,125 Total $ 36,132 $ (941) $ 12,428 $ 16,804 $ 60, ,846 Regional Activities (1,246) TOTAL $ 123,601 Notes: (i) Numbers may not sum precisely because of rounding. (ii) Negative amounts represent net undisbursed commitments written back to balances available for future commitments (Note E). The accompanying notes are an integral part of these financial statements (TASF-6).
152 145 TASF-6 ASIAN DEVELOPMENT BANK TECHNICAL ASSISTANCE SPECIAL FUND NOTES TO FINANCIAL STATEMENTS 31 December 2015 and 2014 NOTE A NATURE OF OPERATIONS The Asian Development Bank (ADB), a multilateral development financial institution, was established in 1966 with its headquarters in Manila, Philippines. ADB and its operations are governed by the Agreement Establishing the Asian Development Bank (the Charter). Its purpose is to foster economic development and co-operation in Asia and the Pacific region and to contribute to the acceleration of the process of economic development of the developing member countries (DMCs) in the region, collectively and individually. Since 1999, ADB s corporate vision and mission has been to help DMCs reduce poverty in the region. This was reaffirmed under the long-term strategic framework for (Strategy 2020). Under Strategy 2020, ADB s corporate vision continues to be An Asia and Pacific Free of Poverty and its mission has been to help its DMCs reduce poverty and improve living conditions and quality of life. ADB has been pursuing its mission and vision by focusing on three complementary strategic agendas: inclusive growth, environmentally sustainable growth, and regional integration. ADB provides financial and technical assistance for projects and programs, which will contribute to achieve this purpose. These are financed through ordinary capital resources (OCR) and Special Funds. 1 The TASF was established to provide technical assistance on a grant basis to DMCs of the ADB and for regional technical assistance. TASF resources consist of regularized replenishments and direct voluntary contributions by members, allocations from the net income of OCR, and revenue from investments and other sources. In July 2012, the Board of Governors adopted the resolution providing for the tenth replenishment of the Asian Development Fund (ADF XI) and the fifth regularized replenishment of the TASF. The replenishment provides substantial resources to the ADF to finance ADB s concessional program, and to the TASF to finance technical assistance operations. Total replenishment size was SDR8,415 million, of which SDR3,090 million will come from new donor contributions. The donors agreed to allocate 3% of the total replenishment size (equivalent to about 8% of total donor contributions) to TASF. The replenishment became effective on 4 June As of 31 December 2015, ADB had received instruments of contribution from 31 donors with the total amount equivalent to SDR3,047 million including qualified contributions amounting to SDR368 million. ADB is immune from taxation pursuant to Chapter VIII, Article 56, Exemption from Taxation, of the Charter. NOTE B SUMMARY OF SIGNIFICANT ACCOUNTING POLICIES Presentation of the Financial Statements The financial statements of the TASF are prepared in accordance with accounting principles generally accepted in the United States of America (US GAAP), and are presented on the basis of those for not-forprofit organizations. TASF reports donors contributions of cash and other assets as unrestricted assets as these are made available to TASF without conditions other than for the purpose of pursuing its objectives. Functional and Reporting Currency The US dollar is the functional and reporting currency, representing the currency of the primary economic operating environment of TASF. 1 Asian Development Fund (ADF), Technical Assistance Special Fund (TASF), Japan Special Fund (JSF), ADB Institute (ADBI), Regional Cooperation and Integration Fund (RCIF), Climate Change Fund (CCF), Asia Pacific Disaster Response Fund (APDRF), and Financial Sector Development Partnership Special Fund (FSDPSF).
153 146 TASF-6 continued Translation of Currencies ADB adopts the use of daily exchange rates for accounting and financial reporting purposes. This allows transactions denominated in non-us dollar currencies to be translated to the reporting currency using exchange rates applicable at the time of the transactions. Contributions included in the financial statements during the year are recognized at applicable exchange rates as of the respective dates of commitment. At the end of each accounting month, translations of assets, liabilities, and uncommitted balances which are denominated in non-us dollar currencies are adjusted using the applicable rates of exchange at the end of the reporting period. These translation adjustments are accounted for as exchange gains or losses and are credited or charged to operations. Investments All investment securities held by TASF are reported at fair value. Realized and unrealized gains and losses are included in REVENUE From investments. Interest income on time deposits is recognized as earned and reported in REVENUE From investments. Securities Purchased Under Resale Arrangements TASF accounts for the transfer of financial assets in accordance with Financial Accounting Standards Board (FASB) Accounting Standards Codification (ASC) 860, Transfers and Servicing. Transfers are accounted for as sales under ASC 860 when control over the transferred assets has been relinquished. Otherwise, the transfers are accounted for as resale arrangements and collateralized financing arrangements. Securities purchased under resale arrangements are recorded as assets and are not re-pledged. Contributions The contributions from donors and the allocations from OCR net income are included in the financial statements from the date of effectivity of the contribution agreement, and the Board of Governors approval, respectively. Technical Assistance, Grants and Undisbursed Commitments Technical assistance (TA) and grants are recognized in the financial statements when the project is approved and becomes effective. Upon completion or cancellation of a TA project or grant, any undisbursed amount is written back as a reduction in TA or grants for the year and the corresponding undisbursed commitment is eliminated accordingly. Advances are provided from TA and grants to the executing agency or co-operating institution, for the purpose of making payments for eligible expenses. The advances are subject to liquidation and charged against undisbursed commitments. Any unutilized portion is required to be returned to the fund. These are included in ADVANCES FOR GRANTS AND OTHER ASSETS. Fair Value of Financial Instruments ASC 820, Fair Value Measurement defines fair value as the price that would be received to sell an asset or paid to transfer a liability at measurement date in an orderly transaction among willing participants with an assumption that the transaction takes place in the entity s principal market, or in the absence of principal market, in the most advantageous market for the asset or liability. The most advantageous market is the market where the sale of the asset or transfer of liability would maximize the amount received for the asset or minimize the amount paid to transfer the liability. The fair value measurement is not adjusted for transaction costs.
154 147 TASF-6 continued Fair Value Hierarchy ASC 820 establishes a fair value hierarchy that gives the highest priority to quoted prices in active markets for identical assets or liabilities (Level 1), next priority to observable market inputs or market corroborated data (Level 2), and the lowest priority to unobservable inputs without market corroborated data (Level 3). The fair values of ADB s financial assets and liabilities are categorized as follows: Level 1: fair values are based on unadjusted quoted prices for identical assets or liabilities in active markets. Level 2: fair values are based on quoted prices for similar assets or liabilities in active markets or markets that are not active; or valuation models for which significant inputs are obtained from market-based data that are observable. Level 3: fair values are based on prices or valuation models for which significant inputs to the model are unobservable. Inter-level transfers from one year to another may occur due to changes in market activities affecting the availability of quoted market prices or observable market data. ADB s policy is to recognize transfers in and transfers out of levels as of the end of the reporting period in which they occur. Accounting Estimates The preparation of financial statements in conformity with generally accepted accounting principles requires management to make reasonable estimates and assumptions that affect the reported amounts of assets and liabilities and uncommitted balances as of the end of the year and the reported amounts of revenue and expenses during the year. The actual results could differ from those estimates. Accounting and Reporting Developments In April 2013, the Financial Accounting Standards Board (FASB) issued Accounting Standard Update (ASU) , Not-for-Profit Entities (Topic 958), to require a recipient not-for-profit entity to recognize all services received from personnel of an affiliate that directly benefit the recipient not-for-profit entity. The recipient not-for-profit entity may elect to recognize that service received either at the cost recognized by the affiliate for the personnel providing that services or at the fair value. The amendments in this Update are effective prospectively for fiscal years beginning after 15 June 2014, and interim and annual periods thereafter. See Note D for the required disclosures. In May 2014, the FASB issued ASU Revenue from Contracts with Customers (Topic 606) to improve financial reporting by creating common revenue recognition guidance for US GAAP and the International Financial Reporting Standards. An entity is required to apply the amendments prospectively for annual reporting periods beginning after 15 December In August 2015, FASB issued ASU deferring the effective date by one year. ADB is currently assessing the impact on TASF s financial statements. In June 2014, the FASB issued ASU Transfers and Servicing (Topic 860) Repurchase-to- Maturity Transactions, Repurchase Financings, and Disclosures to change the accounting for repurchase-to-maturity transactions and linked repurchase financings to secured borrowing accounting, which is consistent with the accounting for other repurchase agreements. The amendments also require an entity to disclose information on transfers accounted for as sales in transactions that are economically similar to repurchase agreements and to provide increased transparency about the types of collateral pledged in repurchase agreements and similar transactions accounted for as secured borrowings. An entity is required to apply the amendments prospectively for annual reporting periods beginning after 15 December 2014, and for interim periods after 15 March This ASU is not applicable to TASF.
155 148 TASF-6 continued In August 2014, the FASB issued ASU Presentation of Financial Statements Going Concern (Subtopic ) to require management to perform interim and annual assessments of an entity s ability to continue as a going concern within one year of the date the financial statements are issued. An entity must provide certain disclosures if conditions or events raise substantial doubt about the entity s ability to continue as a going concern. The ASU applies to all entities and is effective for annual periods ending after 15 December 2016, and interim periods thereafter. This ASU is not expected to impact TASF s financial statements. In January 2016, the FASB issued ASU , Financial Instruments Overall (Subtopic ) - Recognition and Measurement of Financial Assets and Financial Liabilities. This Update enhances the reporting requirements for financial instruments. Specifically, this Update (i) requires that investments in equity securities measured at FV, recognize changes in FV in net income, (ii) simplifies the impairment assessment of equity investments for which FV is not readily determinable by requiring entities to perform a qualitative assessment to identify impairment, (iii) amends certain disclosure requirements associated with the FV of financial instruments, and (iv) requires to present separately in other comprehensive income the portion of the total change in the FV of financial liabilities measured at FV resulting from a change in the instrument-specific credit risk. This Update is effective for fiscal years beginning after 15 December 2017 and interim periods thereafter. ADB is currently assessing the impact of this ASU on TASF s financial statements. Statement of Cash Flows For the purposes of the Statement of Cash Flows, the TASF considers that its cash and cash equivalents are limited to DUE FROM BANKS, which consists of cash on hand and current accounts in banks used for (i) operational disbursements, (ii) receipt of funds from encashment of donor countries promissory notes, and (iii) clearing accounts. NOTE C INVESTMENTS The main investment management objective is to maintain security and liquidity. Subject to these parameters, ADB seeks the highest possible return on its investments. Investments are governed by the Investment Authority approved by the Board of Directors. All investments held as of 31 December 2015 and 2014 were in time deposits. The currency composition of the investment portfolio as of 31 December 2015 and 2014 expressed in US dollars was as follows: ($ thousand) Currency US dollar $ 235,246 $ 262,033 Australian dollar 67,763 66,054 Pound sterling 38,078 34,855 Canadian dollar 25,468 27,515 Total $ 366,555 $ 390,457 The annualized rate of return on the average investments held during the period ended 31 December 2015, including securities purchased under resale arrangements, based on the portfolio held at the beginning and end of each month, was 0.60% (0.65% 2014).
156 149 TASF-6 continued Fair Value Disclosure The fair value of INVESTMENTS and related financial assets as of 31 December 2015 and 2014 was as follows: ($ thousand) Fair Value Measurements Total Level 1 Level 2 Level 3 31 December 2015 Investments Time deposits $ 366,555 $ $ 366,555 $ 31 December 2014 Investments Time deposits $ 390,457 $ $ 390,457 $ Securities purchased under resale arrangements Total at fair value $ 390,541 $ $ 390,541 $ ADB maintains documented processes and internal controls to value investment securities. If available, investment securities are fair valued based on active market quotes. Time deposits are reported at cost, which approximates fair value. NOTE D RELATED PARTY TRANSACTIONS The OCR and Special Funds resources are at all times used, committed, and invested entirely separately from each other. Under ADF IX, ADF X, and ADF XI, a specific portion of the total contributions under each is to be allocated to the TASF as third, fourth and fifth regularized replenishments, respectively. ADF receives the contributions from members and subsequently transfers the specified portion to the TASF. Regional technical assistance projects and programs activities may be cofinanced by ADB s other Special Funds and trust funds administered by ADB (Agency Trust Funds). Interfund accounts are settled regularly between the TASF and the other funds. ADB does not allocate any service fees to TASF for administering TA which involves a range of personnel services. Effective 1 January 2015, TASF has estimated the fair value of personnel services involved in administering TAs to be 5% of amounts disbursed for TA projects. For the year ended 31 December 2015, the calculated service fee was $6,169,000 and recorded as EXPENSES Administrative expenses and REVENUE From other sources. The transaction has no impact on the net assets of TASF.
157 150 TASF-6 continued The interfund account balances included in ADVANCES FOR GRANTS AND OTHER ASSETS and ACCOUNTS PAYABLE AND OTHER LIABILITIES are as follows: ($ thousand) Receivable from: Japan Special Fund $ 10 Regional Cooperation and Integration Fund Financial Sector Development Partnership Special Fund 28 Agency Trust Funds net Total $ 497 $ 974 Payable to: Ordinary capital resources $ 91 $ 92 Climate Change Fund 0 37 Total $ 91 $ = Less than $500. NOTE E UNDISBURSED COMMITMENTS Undisbursed commitments are denominated in US dollars and represent effective ongoing grant-financed TA projects/programs which are not yet disbursed and unliquidated as of the end of the year. During 2015, $23,975,000 ($25,243, ) representing completed and canceled TA projects was written back as a reduction in technical assistance for the period and the corresponding undisbursed commitment was eliminated. The fair value of undisbursed commitments approximates the amounts undisbursed, because ADB expects that disbursements will be made for all projects/programs covered by the commitments. ADB normally finances all TA on a grant basis. However, some TA operations are subject to arrangements for recovery of the full cost of the TA or provided on a reimbursable basis. During 2015, $1,395,000 (nil 2014) was included in REVENUE From other sources as reimbursement for the TA. As of 31 December 2015, $1,240,000 (nil ) was included in ACCOUNTS PAYABLE AND OTHER LIABILITIES as reimbursement for the TA, received in advance of the TA approval. NOTE F CONTRIBUTIONS AND UNCOMMITTED BALANCES Since inception in 1967, direct contributions have been made by 29 member countries. In 2015, TASF received direct and voluntary contributions from Pakistan amounting to $70,000. In 1986, 1992, 2005, 2009 and 2013, the Board of Governors of ADB, in authorizing replenishments of the ADF, provided for allocations to the TASF in aggregate amounts equivalent to $72,000,000, $141,000,000, $221,000,000, $339,000,000 and $371,000,000, respectively, to be used for technical assistance to ADF borrowing DMCs and for regional technical assistance. During the year, the fund received $94,806,000 ($103,000 ADF IX; $4,019,000 ADF X; $90,684,000 ADF XI) in cash and promissory notes, leaving a total of $112,809,000 ($7,156,000 ADF IX; $20,120,000 ADF X; $85,533,000 ADF XI) as DUE FROM CONTRIBUTORS. In 2015, $40,000,000 was allocated from OCR net income to TASF bringing the accumulated allocation from OCR net income to $949,000,000.
158 151 TASF-6 continued Some of the direct contributions received can be subject to restricted procurement sources, while some are given on condition that the technical assistance be made on a reimbursable basis. The total contributions received for the years ended 31 December 2015 and 2014 were without any restrictions. Uncommitted balances comprise amounts which have not been committed by ADB as of 31 December 2015 and These balances include approved TA projects/programs that are not yet effective. NOTE G OTHER FAIR VALUE DISCLOSURES As of 31 December 2015 and 2014, TASF has no assets or liabilities measured at fair value on a nonrecurring basis. See Notes C and E for discussions relating to investments and undisbursed commitments, respectively. In all other cases, the carrying amount of TASF s assets and liabilities is considered to approximate fair value. NOTE H SUBSEQUENT EVENTS ADB has evaluated subsequent events after 31 December 2015 through 11 March 2016, the date these Financial Statements are available for issuance. As a result of this evaluation, there are no subsequent events, as defined, that require recognition or disclosure in the TASF s Financial Statements as of 31 December 2015.
159 152 JAPAN SPECIAL FUND MANAGEMENT'S REPORT ON INTERNAL CONTROL OVER FINANCIAL REPORTING The management of Asian Development Bank ("ADB") is responsible for establishing and maintaining adequate internal control over financial reporting. ADB's internal control over financial reporting is a process designed to provide reasonable assurance regarding the reliability of financial reporting and the preparation of financial statements for external purposes in accordance with generally accepted accounting principles in the United States of America. ADB's internal control over financial reporting includes those policies and procedures that (i) pertain to the maintenance of records that, in reasonable detail, accurately and fairly reflect the transactions and dispositions of the assets of ADB; (ii) provide reasonable assurance that transactions are recorded as necessary to permit preparation of financial statements in accordance with generally accepted accounting principles in the United States of America, and that receipts and expenditures of ADB are being made only in accordance with authorizations of management and directors of ADB; and (iii) provide reasonable assurance regarding prevention or timely detection and correction of unauthorized acquisition, use, or disposition of ADB's assets that could have a material effect on the financial statements. Because of its inherent limitations, internal control over financial reporting may not prevent or detect misstatements. Also, projections of any evaluation of effectiveness to future periods are subject to the risk that controls may become inadequate because of changes in conditions, or that the degree of compliance with the policies or procedures may deteriorate. ADB's management assessed the effectiveness of ADB's internal control over financial reporting as of 31 December In making this assessment, ADB's management used the criteria set forth by the Committee of Sponsoring Organizations of the Treadway Commission in Internal Control Integrated Framework (2013). Based on that assessment, management believes that as of 31 December 2015, ADB's internal control over financial reporting is effective based upon the criteria established in Internal Control Integrated Framework (2013). Takehiko Nakao President Thierry de Longuemar Vice-President (Finance and Risk Management) Chai S. Kim Controller 11 March 2016
160 153
161 154
162 155
163 156
164 157 JSF-1 ASIAN DEVELOPMENT BANK JAPAN SPECIAL FUND STATEMENT OF FINANCIAL POSITION 31 December 2015 and 2014 Expressed in Thousands of US Dollars ASSETS JSF JSF Regular and Regular and ACCSF Supplementary Total ACCSF Supplementary Total DUE FROM BANKS $ 181 $ 2,010 $ 2,191 $ 181 $ 287 $ 468 INVESTMENTS (Notes C and G) Time deposits 36,845 68, ,553 36,765 72, ,314 ACCRUED REVENUE ADVANCES FOR TECHNICAL ASSISTANCE AND OTHER ASSETS (Note D) TOTAL $ 37,029 $ 70,722 $ 107,751 $ 36,950 $ 72,856 $ 109,806 LIABILITIES AND NET ASSETS ACCOUNTS PAYABLE AND OTHER LIABILITIES (Note D) $ $ 39 $ 39 $ 0 $ 43 $ 43 UNDISBURSED COMMITMENTS (Notes E and G) 2,744 2,744 7,357 7,357 TOTAL LIABILITIES 2,783 2,783 7,400 7,400 NET ASSETS (JSF-2), represented by: Uncommitted balances (Note F) Unrestricted 67,939 67,939 65,456 65,456 Temporarily restricted 28,199 28,199 28,199 28,199 28,199 67,939 96,138 28,199 65,456 93,655 Net accumulated investment income (Note F) Temporarily restricted 8,830 8,830 8,751 8,751 37,029 67, ,968 36,950 65, ,406 TOTAL $ 37,029 $ 70,722 $ 107,751 $ 36,950 $ 72,856 $ 109,806 0 = Less than $500. The accompanying notes are an integral part of these financial statements (JSF-4).
165 158 JSF-2 ASIAN DEVELOPMENT BANK JAPAN SPECIAL FUND STATEMENT OF ACTIVITIES AND CHANGES IN NET ASSETS For the Years Ended 31 December 2015 and 2014 Expressed in Thousands of US Dollars CHANGES IN UNRESTRICTED NET ASSETS JSF JSF Regular and Regular and ACCSF Supplementary Total ACCSF Supplementary Total REVENUE FROM INVESTMENTS (Note C) $ $ 138 $ 138 $ $ 124 $ 124 REVENUE FROM OTHER SOURCES 9 9 NET ASSETS REVERTED FROM TEMPORARILY RESTRICTED ASSETS Total EXPENSES Technical assistance net (Note E) (2,631) (2,631) (2,978) (2,978) Administrative and financial expenses Total 0 (2,336) (2,336) 0 (2,698) (2,698) REVENUE IN EXCESS OF EXPENSES 2,483 2,483 2,822 2,822 EXCHANGE GAINS (LOSSES) net 0 0 (0) (0) INCREASE IN UNRESTRICTED NET ASSETS 2,483 2,483 2,822 2,822 CHANGES IN TEMPORARILY RESTRICTED NET ASSETS REVENUE FROM INVESTMENTS AND OTHER SOURCES NET ASSETS REVERTED TO TEMPORARILY RESTRICTED ASSETS (0) (0) (0) (0) INCREASE IN TEMPORARILY RESTRICTED NET ASSETS INCREASE IN NET ASSETS 79 2,483 2, ,822 2,902 NET ASSETS AT BEGINNING OF YEAR 36,950 65, ,406 36,870 62,634 99,504 NET ASSETS AT END OF YEAR $ 37,029 $ 67,939 $ 104,968 $ 36,950 $ 65,456 $ 102,406 0 = Less than $500. The accompanying notes are an integral part of these financial statements (JSF-4).
166 159 JSF-3 ASIAN DEVELOPMENT BANK JAPAN SPECIAL FUND STATEMENT OF CASH FLOWS For the Years Ended 31 December 2015 and 2014 Expressed in Thousands of US Dollars JSF JSF Regular and Regular and ACCSF Supplementary Total ACCSF Supplementary Total CASH FLOWS FROM OPERATING ACTIVITIES Interest on investments received $ 79 $ 139 $ 218 $ 78 $ 122 $ 200 Net cash received from other sources Technical assistance disbursed (1,964) (1,964) (3,481) (3,481) Administrative and financial expenses paid (0) (302) (302) 0 (282) (282) Net Cash Provided by (Used in) Operating Activities 79 (2,118) (2,039) 78 (3,641) (3,563) CASH FLOWS FROM INVESTING ACTIVITIES Maturities of investments 1,656,361 3,470,529 5,126,890 1,652,454 3,637,311 5,289,765 Purchases of investments (1,656,440) (3,466,688) (5,123,128) (1,652,532) (3,634,014) (5,286,546) Net Cash (Used in) Provided by Investing Activities (79) 3,841 3,762 (78) 3,297 3,219 Net (Decrease) Increase in Due from Banks (0) 1,723 1,723 0 (344) (344) Due from Banks at Beginning of Year Due from Banks at End of Year $ 181 $ 2,010 $ 2,191 $ 181 $ 287 $ 468 RECONCILIATION OF INCREASE IN NET ASSETS TO NET CASH PROVIDED BY (USED IN) OPERATING ACTIVITIES: Increase in net assets (JSF-2) $ 79 $ 2,483 $ 2,562 $ 80 $ 2,822 $ 2,902 Adjustments to reconcile increase in net assets to net cash provided by (used in) operating activities: Change in accrued revenue (0) 1 1 (2) (2) (4) Change in advances for technical assistance and other assets Change in accounts payable and other liabilities (4) (4) (9) (9) Change in undisbursed commitments (4,613) (4,613) (6,522) (6,522) Exchange gains net (0) (0) (0) (0) Net Cash Provided by (Used in) Operating Activities $ 79 $ (2,118) $ (2,039) $ 78 $ (3,641) $ (3,563) 0 = Less than $500. The accompanying notes are an integral part of these financial statements (JSF-4).
167 160 JSF-4 ASIAN DEVELOPMENT BANK JAPAN SPECIAL FUND NOTES TO FINANCIAL STATEMENTS 31 December 2015 and 2014 NOTE A NATURE OF OPERATIONS The Asian Development Bank (ADB), a multilateral development financial institution, was established in 1966 with its headquarters in Manila, Philippines. ADB and its operations are governed by the Agreement Establishing the Asian Development Bank (the Charter). Its purpose is to foster economic development and co-operation in Asia and the Pacific region and to contribute to the acceleration of the process of economic development of the developing member countries (DMCs) in the region, collectively and individually. Since 1999, ADB s corporate vision and mission has been to help DMCs reduce poverty in the region. This was reaffirmed under the long-term strategic framework for (Strategy 2020). Under Strategy 2020, ADB s corporate vision continues to be An Asia and Pacific Free of Poverty and its mission has been to help its DMCs reduce poverty and improve living conditions and quality of life. ADB has been pursuing its mission and vision by focusing on three complementary strategic agendas: inclusive growth, environmentally sustainable growth, and regional integration. ADB provides financial and technical assistance for projects and programs, which will contribute to achieve this purpose. These are financed through ordinary capital resources (OCR) and Special Funds. 1 The JSF was established in March 1988 when the Government of Japan and ADB entered into a financial arrangement whereby the Government of Japan agreed to make an initial contribution and ADB became the administrator. The purpose of JSF is to help DMCs of ADB restructure their economies and broaden the scope of opportunities for new investments, thereby assisting the recycling of funds to DMCs of ADB. While JSF resources are used mainly to finance technical assistance (TA) operations, these resources may also be used for equity investment operations in ADB s DMCs. Under the agreement between ADB and Japan, ADB may invest the proceeds of JSF pending disbursement. In March 1999, the Board approved the acceptance and administration by ADB of the Asian Currency Crisis Support Facility (ACCSF) to assist Asian currency crisis-affected member countries (CAMCs). Funded by the Government of Japan, ACCSF was established within JSF to assist in the economic recovery of CAMCs through interest payment assistance (IPA) grants, TA grants, and guarantees. With the general fulfillment of the purpose of the facility, the Government of Japan and ADB agreed to terminate the ACCSF on 22 March 2002 and all projects were financially completed as of 31 December Subject to the Government of Japan s instruction, the remaining funds will be retained in ACCSF. ADB is immune from taxation pursuant to Chapter VIII, Article 56, Exemption from Taxation, of the Charter. NOTE B SUMMARY OF SIGNIFICANT ACCOUNTING POLICIES Presentation of the Financial Statements The financial statements of JSF are prepared in accordance with accounting principles generally accepted in the United States of America (US GAAP), and are presented on the basis of those for not-for-profit organizations and as unrestricted and temporarily restricted net assets. ACCSF funds are separately reported in the financial statements. JSF reports the contributions of cash and other assets as restricted support if they are received with donor stipulations that limit the use of the donated assets. When the donor restriction expires, that is, when a stipulated time or purpose restriction is accomplished, temporarily restricted net assets are reclassified to unrestricted net assets and reported in the Statement of Activities and Changes in Net Assets as NET ASSETS REVERTED TO TEMPORARILY RESTRICTED ASSETS. 1 Asian Development Fund (ADF), Technical Assistance Special Fund (TASF), Japan Special Fund (JSF), ADB Institute (ADBI), Regional Cooperation and Integration Fund (RCIF), Climate Change Fund (CCF), Asia Pacific Disaster Response Fund (APDRF), and Financial Sector Development Partnership Special Fund (FSDPSF).
168 161 JSF-4 continued Functional and Reporting Currency The US dollar is the functional and reporting currency, representing the currency of the primary economic operating environment of JSF. Translation of Currencies ADB adopts the use of daily exchange rates for accounting and financial reporting purposes. This allows transactions denominated in non-us dollar currencies to be translated to the reporting currency using exchange rates applicable at the time of the transactions. Contributions included in the financial statements during the year are recognized at applicable exchange rates as of the respective dates of commitment. At the end of each accounting month, translations of assets, liabilities, and uncommitted balances which are denominated in non-us dollar currencies are adjusted using the applicable rates of exchange at the end of the reporting period. These translation adjustments are accounted for as exchange gains or losses and are credited or charged to operations. Investments All investment securities held by JSF are reported at fair value. Realized and unrealized gains and losses are included in REVENUE FROM INVESTMENTS. Interest income on time deposits are recognized as earned and reported, as REVENUE FROM INVESTMENTS. Technical Assistance, Grants and Undisbursed Commitments Technical assistance (TA) and grants are recognized in the financial statements when the project is approved and becomes effective. Upon completion or cancellation of a TA project or grant, any undisbursed amount is written back as a reduction in the TA or grants for the year and the corresponding undisbursed commitment is eliminated accordingly. Advances are provided from TA and grants to the executing agency or co-operating institution, for the purpose of making payments for eligible expenses. The advances are subject to liquidation and charged against undisbursed commitments. Any unutilized portion is required to be returned to the fund. These are included in ADVANCES FOR TECHNICAL ASSISTANCE AND OTHER ASSETS. Fair Value of Financial Instruments ASC 820, Fair Value Measurement defines fair value as the price that would be received to sell an asset or paid to transfer a liability at measurement date in an orderly transaction among willing participants with an assumption that the transaction takes place in the entity s principal market, or in the absence of principal market, in the most advantageous market for the asset or liability. The most advantageous market is the market where the sale of the asset or transfer of liability would maximize the amount received for the asset or minimize the amount paid to transfer the liability. The fair value measurement is not adjusted for transaction costs. Fair Value Hierarchy ASC 820 establishes a fair value hierarchy that gives the highest priority to quoted prices in active markets for identical assets or liabilities (Level 1), next priority to observable market inputs or market corroborated data (Level 2), and the lowest priority to unobservable inputs without market corroborated data (Level 3).
169 162 JSF-4 continued The fair values of ADB s financial assets and liabilities are categorized as follows: Level 1: fair values are based on unadjusted quoted prices for identical assets or liabilities in active markets. Level 2: fair values are based on quoted prices for similar assets or liabilities in active markets or markets that are not active; or valuation models for which significant inputs are obtained from marketbased data that are observable. Level 3: fair values are based on prices or valuation models for which significant inputs to the model are unobservable. Inter-level transfers from one year to another may occur due to changes in market activities affecting the availability of quoted market prices or observable market data. ADB s policy is to recognize transfers in and transfers out of levels as of the end of the reporting period in which they occur. Accounting Estimates The preparation of financial statements in conformity with generally accepted accounting principles requires management to make reasonable estimates and assumptions that affect the reported amounts of assets and liabilities as of the end of the year and the reported amounts of revenue and expenses during the year. The actual results could differ from those estimates. Accounting and Reporting Developments In May 2014, the Financial Accounting Standards Board (FASB) issued Accounting Standard Update (ASU) Revenue from Contracts with Customers (Topic 606) to improve financial reporting by creating common revenue recognition guidance for US GAAP and the International Financial Reporting Standards. An entity is required to apply the amendments prospectively for annual reporting periods beginning after 15 December In August 2015, FASB issued ASU deferring the effective date by one year. ADB is currently assessing the impact on JSF s financial statements. In August 2014, the FASB issued ASU Presentation of Financial Statements Going Concern (Subtopic ) to require management to perform interim and annual assessments of an entity s ability to continue as a going concern within one year of the date the financial statements are issued. An entity must provide certain disclosures if conditions or events raise substantial doubt about the entity s ability to continue as a going concern. The ASU applies to all entities and is effective for annual periods ending after 15 December 2016, and interim periods thereafter. This ASU is not expected to impact JSF s financial statements. Statement of Cash Flows For the purposes of the Statement of Cash Flows, the JSF considers that its cash and cash equivalents are limited to DUE FROM BANKS, which consists of cash on hand and current accounts in banks used for operational disbursements.
170 163 JSF-4 continued NOTE C INVESTMENTS The main investment management objective is to maintain security and liquidity. Subject to these parameters, ADB seeks the highest possible return on its investments. Investments are governed by the Investment Authority approved by the Board of Directors. All investments held as of 31 December 2015 and 2014 were in US dollar time deposits. The annualized rates of return on the average investments held under ACCSF and JSF during the year, based on the portfolio held at the beginning and end of each month, were 0.22% and 0.20%, respectively (0.22% and 0.17%, respectively 2014). Fair Value Disclosure The fair value of INVESTMENTS as of 31 December 2015 and 2014 was as follows: ($ thousand) Fair Value Measurements 31 December 2015 Total Level 1 Level 2 Level 3 Investments Time deposits $ 105,553 $ $ 105,553 $ 31 December 2014 Investments Time deposits $ 109,314 $ $ 109,314 $ ADB maintains documented processes and internal controls to value investment securities. Time deposits are reported at cost, which approximates fair value. NOTE D RELATED PARTY TRANSACTIONS The OCR and Special Funds resources are at all times used, committed, and invested entirely separately from each other. The administrative and operational expenses pertaining to JSF are settled regularly with OCR and other funds. Regional technical assistance projects and programs may be combined activities financed by Special Funds and trust funds. The interfund account balances included in ADVANCES FOR TECHNICAL ASSISTANCE AND OTHER ASSETS and ACCOUNTS PAYABLE AND OTHER LIABILITIES were as follows: ($ thousand) Amounts Receivable by: JSF from: Regional Cooperation Integration Fund $ 0 $ Amounts Payable by: JSF to: Ordinary Capital Resources $ 23 $ 17 Technical Assistance Special Fund 10 Total $ 23 $ 27 0 = less than $500.
171 164 JSF-4 continued NOTE E UNDISBURSED COMMITMENTS Undisbursed commitments are denominated in US dollars and represent effective TA projects/programs not yet disbursed and unliquidated. During 2015, $2,631,000 ($2,978, ) representing completed but partially cancelled TA projects were written back as a reduction in technical assistance for the period, and the corresponding undisbursed commitments were eliminated. None of this amount corresponds to ACCSF (nil 2014). The fair value of undisbursed commitments approximates the amounts outstanding, because ADB expects that disbursements will substantially be made for all the projects/programs covered by the commitments. NOTE F UNCOMMITTED BALANCES Effective 31 December 2002, all remaining temporarily restricted net assets under JSF were transferred and integrated into the unrestricted regular net assets, as concurred by Japan, to optimize the use of JSF. Similarly, Japan lifted the restriction over the use of net accumulated investment income, which under the original terms of agreement between ADB and Japan, may only be used for defraying JSF s administrative expenses. Japan agreed to use the net accumulated investment income as additional resources for funding future JSF operations. Uncommitted balances comprise amounts which have not been committed by ADB as of 31 December 2015 and These balances include approved TA projects/programs that are not yet effective. As of 31 December 2015 and 2014 these balances were as follows: ($ thousand) JSF JSF Regular and Regular and ACCSF Supplementary Total ACCSF Supplementary Total Uncommitted balances available for new commitments $ 28,199 $ 67,939 $ 96,138 $ 28,199 $ 65,456 $ 93,655 The temporarily restricted uncommitted balance remaining available as of 31 December 2015 corresponds to funds under ACCSF of $28,199,000 ($28,199, ) and the amount of net accumulated investment income of $8,830,000 ($8,751, ) for settlement of all administrative expenses. Net assets reverted to temporarily restricted assets under ACCSF relate to savings on financially completed technical assistance net of amounts from accumulated investment income, released from restrictions to defray the administrative expenses of ACCSF. NOTE G OTHER FAIR VALUE DISCLOSURES As of 31 December 2015 and 2014, JSF has no assets or liabilities measured at fair value on a nonrecurring basis. See Notes C and E for discussions relating to investments and undisbursed commitments, respectively. In all other cases, the carrying amount of JSF s assets and liabilities is considered to approximate fair value. NOTE H SUBSEQUENT EVENTS ADB has evaluated subsequent events after 31 December 2015 through 11 March 2016, the date these Financial Statements are available for issuance. As a result of this evaluation, there are no subsequent events, as defined, that require recognition or disclosure in the JSF s Financial Statements as of 31 December 2015.
172 165
173 166
174 167 ADBI-1 ASIAN DEVELOPMENT BANK ASIAN DEVELOPMENT BANK INSTITUTE STATEMENT OF FINANCIAL POSITION 31 December 2015 and 2014 Expressed in Thousands of US Dollars ASSETS DUE FROM BANKS $ 10,396 $ 1,231 INVESTMENTS (Notes C and L) 1,000 SECURITIES PURCHASED UNDER RESALE ARRANGEMENTS (Notes C and L) 6,194 PROPERTY, FURNITURE, AND EQUIPMENT (Note D) Property, Furniture, and Equipment $ 2,889 $ 2,915 Less allowance for depreciation 2, , DUE FROM CONTRIBUTORS (Note G) 6,076 5,625 LONG-TERM GUARANTEE DEPOSITS (Note E) 1,328 1,340 OTHER ASSETS (Note J) TOTAL $ 18,118 $ 15,824 LIABILITIES AND UNCOMMITTED BALANCES ACCOUNTS PAYABLE AND OTHER LIABILITIES Accrued pension and postretirement medical benefit costs (Note K) $ 6,716 $ 6,653 Asset reinstatement obligations (Note F) Others (Note J) 1,116 $ 8, $ 8,231 UNCOMMITTED BALANCES (ADBI-2) Unrestricted net assets 9,389 7,593 TOTAL $ 18,118 $ 15,824 The accompanying notes are an integral part of these financial statements (ADBI-4).
175 168 ADBI-2 ASIAN DEVELOPMENT BANK ASIAN DEVELOPMENT BANK INSTITUTE STATEMENT OF ACTIVITIES AND CHANGES IN NET ASSETS For the Years Ended 31 December 2015 and 2014 Expressed in Thousands of US Dollars CHANGES IN UNRESTRICTED NET ASSETS CONTRIBUTIONS (Note G) $ 12,260 $ 12,254 REVENUE From rental (Note H) From investments (Note C) 1 2 From other sources net (Note J) Total 12,639 12,645 EXPENSES Administrative expenses (Notes I and J) 8,183 9,333 Program expenses 3,002 3,309 Total 11,185 12,642 CONTRIBUTIONS AND REVENUE IN EXCESS OF EXPENSES 1,454 3 EXCHANGE LOSSES net (60) (808) TRANSLATION ADJUSTMENTS (28) (448) PENSION/POST RETIREMENT LIABILITY ADJUSTMENTS 430 (346) INCREASE (DECREASE) IN NET ASSETS 1,796 (1,599) NET ASSETS AT BEGINNING OF YEAR 7,593 9,192 NET ASSETS AT END OF YEAR $ 9,389 $ 7,593 The accompanying notes are an integral part of these financial statements (ADBI-4).
176 169 ADBI-3 ASIAN DEVELOPMENT BANK ASIAN DEVELOPMENT BANK INSTITUTE STATEMENT OF CASH FLOWS For the Years Ended 31 December 2015 and 2014 Expressed in Thousands of US Dollars CASH FLOWS FROM OPERATING ACTIVITIES Contributions received $ 11,863 $ 13,045 Interest on investments received 1 2 Expenses paid (10,131) (12,238) Others net 317 (419) Net Cash Provided by Operating Activities 2, CASH FLOWS FROM INVESTING ACTIVITIES Receipts from securities purchased under resale arrangements 1,404,045 2,170,718 Payments for securities purchased under resale arrangements (1,398,303) (2,172,477) Maturities of investments 1,000 Purchases of investments (1,000) Net Cash Provided by (Used in) Investing Activities 6,742 (2,759) Effect of Exchange Rate Changes on Due from Banks Net Increase (Decrease) in Due from Banks 9,165 (1,846) Due from Banks at Beginning of Year 1,231 3,077 Due from Banks at End of Year $ 10,396 $ 1,231 RECONCILIATION OF INCREASE (DECREASE) IN UNRESTRICTED NET ASSETS TO NET CASH PROVIDED BY OPERATING ACTIVITIES: Increase (Decrease) in unrestricted net assets (ADBI-2) $ 1,796 $ (1,599) Adjustments to reconcile increase (decrease) in unrestricted net assets to net cash provided by operating activities: Depreciation Change in due from contributors (399) 792 Change in long-term guarantee deposits Change in other assets 86 (49) Change in accrued pension and postretirement medical benefit costs Change in asset reinstatement obligations (8) (124) Change in other liabilities 443 (180) Translation adjustments Net Cash Provided by Operating Activities $ 2,050 $ 390 The accompanying notes are an integral part of these financial statements (ADBI-4).
177 170 ADBI-4 ASIAN DEVELOPMENT BANK ASIAN DEVELOPMENT BANK INSTITUTE NOTES TO FINANCIAL STATEMENTS 31 December 2015 and 2014 NOTE A NATURE OF OPERATIONS The Asian Development Bank (ADB), a multilateral development financial institution, was established in 1966 with its headquarters in Manila, Philippines. ADB and its operations are governed by the Agreement Establishing the Asian Development Bank (the Charter). Its purpose is to foster economic development and co-operation in Asia and the Pacific region and to contribute to the acceleration of the process of economic development of the developing member countries (DMCs) in the region, collectively and individually. Since 1999, ADB s corporate vision and mission has been to help DMCs reduce poverty in the region. This was reaffirmed under the long-term strategic framework for (Strategy 2020). Under Strategy 2020, ADB s corporate vision continues to be An Asia and Pacific Free of Poverty and its mission has been to help its DMCs reduce poverty and improve living conditions and quality of life. ADB has been pursuing its mission and vision by focusing on three complementary strategic agendas: inclusive growth, environmentally sustainable growth, and regional integration. ADB provides financial and technical assistance for projects and programs, which will contribute to achieve this purpose. These are financed through ordinary capital resources (OCR) and Special Funds. 1 In 1996, ADB approved the establishment of the Asian Development Bank Institute (the Institute) in Tokyo, Japan as a subsidiary body of ADB. The Institute commenced its operations upon the receipt of the first funds from Japan on 24 March 1997, and it was inaugurated on 10 December The Institute s funds may consist of voluntary contributions, donations, and grants from ADB members, non-government organizations, and foundations. The Special Fund for the Institute is administered by ADB. The objectives of the Institute, as defined under its Statute, are to identify effective development strategies and capacity improvement for sound development management in developing member countries. ADB is immune from taxation pursuant to Chapter VIII, Article 56, Exemption from Taxation, of the Charter. NOTE B SUMMARY OF SIGNIFICANT ACCOUNTING POLICIES Presentation of the Financial Statements The financial statements of the Institute are prepared in accordance with accounting principles generally accepted in the United States of America (US GAAP), and are presented on the basis of those for not-forprofit organizations. The Institute reports donor s contributed cash and other assets as unrestricted support as these are made available to the Institute without conditions other than for the purposes of pursuing the objectives of the Institute. Functional Currency and Reporting Currency The functional currency of the Institute is yen, representing the currency of primary economic operating environment of the Institute. The reporting currency is the US dollar. 1 Asian Development Fund (ADF), Technical Assistance Special Fund (TASF), Japan Special Fund (JSF), ADB Institute (ADBI), Regional Cooperation and Integration Fund (RCIF), Climate Change Fund (CCF), Asia Pacific Disaster Response Fund (APDRF), and Financial Sector Development Partnership Special Fund (FSDPSF).
178 171 ADBI-4 continued Translation of Currencies Assets, liabilities, and uncommitted balances are translated from the functional currency to the reporting currency at the applicable rates of exchange at the end of a reporting period. Commitments included in the financial statements during the year are recognized at the applicable exchange rates as of the end of the month of commitment. Revenue and expense amounts are translated at the applicable rates of exchange at the end of each month; such practice approximates the application of average rates in effect during the period. Translation adjustments are recorded as TRANSLATION ADJUSTMENTS and included in CHANGES IN UNRESTRICTED ASSETS. Monetary assets and liabilities denominated in currency other than yen are translated into yen at year-end exchange rates. Exchange gains and losses are recorded as EXCHANGE LOSSES net and included in the CHANGES IN UNRESTRICTED ASSETS. Investments All investment securities held in the Institute Special Fund are reported at fair value. Realized and unrealized gains and losses are included in REVENUE From investments. Interest income on time deposits is recognized as earned and reported in REVENUE From investments. Securities Purchased Under Resale Arrangements The Institute accounts for transfer of financial assets in accordance with Financial Accounting Standards Board (FASB) Accounting Standards Codification (ASC) 860, Transfers and Servicing. Transfers are accounted for as sales under ASC 860 when control over the transferred assets has been relinquished. Otherwise, the transfers are accounted for as resale arrangements and collateralized financing arrangements. Securities purchased under resale arrangements are recorded as assets and are not repledged. Interest income on investment securities is recognized as earned and reported net of amortizations of premiums and discounts in REVENUE From investments. Property, Furniture, and Equipment Property, furniture, and equipment are stated at cost and depreciated over their estimated useful lives using the straight-line method. Maintenance, repairs and minor betterments are charged to expense. Expenditures amounting to more than $30,000 for a single asset or a combination of assets forming an integral part of a separate asset are capitalized. Contributions Contributions from donors are included in the financial statements from the date committed.
179 172 ADBI-4 continued Fair Value of Financial Instruments ASC 820, Fair Value Measurement defines fair value as the price that would be received to sell an asset or paid to transfer a liability at measurement date in an orderly transaction among willing participants with an assumption that the transaction takes place in the entity s principal market, or in the absence of principal market, in the most advantageous market for the asset or liability. The most advantageous market is the market where the sale of the asset or transfer of liability would maximize the amount received for the asset or minimize the amount paid to transfer the liability. The fair value measurement is not adjusted for transaction cost. Fair Value Hierarchy ASC 820 establishes a fair value hierarchy that gives the highest priority to quoted prices in active markets for identical assets or liabilities (Level 1), next priority to observable market inputs or market corroborated data (Level 2), and the lowest priority to unobservable inputs without market corroborated data (Level 3). The fair values of ADB s financial assets and liabilities are categorized as follows: Level 1: fair values are based on unadjusted quoted prices for identical assets or liabilities in active markets. Level 2: fair values are based on quoted prices for similar assets or liabilities in active markets or markets that are not active; or valuation models for which significant inputs are obtained from market-based data that are observable. Level 3: fair values are based on prices or valuation models for which significant inputs to the model are unobservable. Inter-level transfers from one year to another may occur due to changes in market activities affecting the availability of quoted market prices or observable market data. ADB s policy is to recognize transfers in and transfers out of levels as of the end of the reporting period in which they occur. Accounting Estimates The preparation of the financial statements in conformity with generally accepted accounting principles requires management to make estimates and assumptions that affect the reported amounts of assets and liabilities and uncommitted balances as of the end of the year and the reported amounts of revenue and expenses during the year. Actual results could differ from those estimates. Accounting and Reporting Developments In April 2013, the FASB issued Accounting Standard Update (ASU) , Not-for-Profit Entities (Topic 958), to require a recipient not-for-profit entity to recognize all services received from personnel of an affiliate that directly benefit the recipient not-for-profit entity. The recipient not-for-profit entity may elect to recognize that service received either at the cost recognized by the affiliate for the personnel providing that service or at the fair value. The amendments in this Update are effective prospectively for fiscal years beginning after 15 June 2014, and interim and annual periods thereafter. See Note J for the required disclosures.
180 173 ADBI-4 continued In May 2014, the FASB issued ASU Revenue from Contracts with Customers (Topic 606) to improve financial reporting by creating common revenue recognition guidance for US GAAP and the International Financial Reporting Standards. An entity is required to apply the amendments prospectively for annual reporting periods beginning after 15 December In August 2015, FASB issued ASU deferring the effective date by one year. ADB is currently assessing the impact on the Institute s financial statements. In June 2014, the FASB issued ASU Transfers and Servicing (Topic 860) Repurchase-to- Maturity Transactions, Repurchase Financings, and Disclosures to change the accounting for repurchase-to-maturity transactions and linked repurchase financings to secured borrowing accounting, which is consistent with the accounting for other repurchase agreements. The amendments also require an entity to disclose information on transfers accounted for as sales in transactions that are economically similar to repurchase agreements and to provide increased transparency about the types of collateral pledged in repurchase agreements and similar transactions accounted for as secured borrowings. An entity is required to apply the amendments prospectively for annual reporting periods beginning after 15 December 2014, and for interim periods after 15 March This ASU is not applicable to the Institute. In August 2014, the FASB issued ASU , Presentation of Financial Statements Going Concern (Subtopic ), to require management to perform interim and annual assessments of an entity s ability to continue as a going concern within one year of the date the financial statements are issued. An entity must provide certain disclosures if conditions or events raise substantial doubt about the entity s ability to continue as a going concern. The ASU applies to all entities and is effective for annual periods ending after 15 December 2016, and interim periods thereafter. This ASU is not expected to impact the Institute s financial statements. In January 2016, the FASB issued ASU , Financial Instruments Overall (Subtopic ) - Recognition and Measurement of Financial Assets and Financial Liabilities. This Update enhances the reporting requirements for financial instruments. Specifically, this Update (i) requires that investments in equity securities measured at FV, recognize changes in FV in net income, (ii) simplifies the impairment assessment of equity investments for which FV is not readily determinable by requiring entities to perform a qualitative assessment to identify impairment, (iii) amends certain disclosure requirements associated with the FV of financial instruments, and (iv) requires to present separately in other comprehensive income the portion of the total change in the FV of financial liabilities measured at FV resulting from a change in the instrument-specific credit risk. This Update is effective for fiscal years beginning after 15 December 2017 and interim periods thereafter. ADB is currently assessing the impact of this ASU on the Institute s financial statements. In February 2016, the FASB issued ASU , Leases (Topic 842), Amendments to the FASB Accounting Standards Codification. The amendment requires the recognition of lease assets and lease liabilities by lessees for those leases classified as operating leases. The updates require qualitative disclosures along with specific quantitative disclosures. The Update is effective for fiscal years beginning after 15 December 2018 and interim periods thereafter. ADB is currently assessing the impact of this ASU on the Institute s financial statements. Statement of Cash Flows For the purposes of the Statement of Cash Flows, the Institute considers that its cash and cash equivalents are limited to Due from Banks, which consists of cash on hand and current accounts in banks used for operational disbursements.
181 174 ADBI-4 continued NOTE C INVESTMENTS All investments held as of 31 December 2014 were in time deposits. As of 30 September 2015, all time deposits have matured. The annualized rate of return on the average investments held during the period ended 31 December 2015, including securities purchased under resale arrangements, based on the portfolio held at the beginning and end of each month was 0.04% (0.03% 2014). Fair Value Disclosure The fair value of INVESTMENTS and related financial assets as of 31 December 2014 was as follows: ($ thousand) Fair Value Measurements Total Level 1 Level 2 Level 3 31 December 2014 Investments Time deposits $ 1,000 $ $ 1,000 $ Securities purchased under resale arrangements 6,194 6,194 Total at fair value $ 7,194 $ $ 7,194 $ ADB maintains documented processes and internal controls to value the investment securities. If available, investment securities are fair valued based on active market quotes. Time deposits are reported at cost, which approximates fair value. NOTE D PROPERTY, FURNITURE, AND EQUIPMENT Property, furniture and equipment consist of one-time establishment cost (comprising the office furniture, fixtures and equipment purchased at inception for use in the operations of the Institute), and subsequently purchased furniture and equipment.
182 175 ADBI-4 continued The changes in the property, furniture, and equipment during 2015 and 2014, as well as information pertaining to accumulated depreciation, were as follows: ($ thousand) Property, Furniture and Equipment One-time establishment cost Furniture Equipment Leased Property Grand Total Cost: Balance, 1 January 2015 $ 2,385 $ 50 $ 296 $ 184 $ 2,915 Additions during the year Disposals during the year Translation adjustments (22) (2) (2) (26) Balance, 31 December , ,889 Accumulated Depreciation: Balance, 1 January , ,846 Depreciation during the year Disposals during the year Translation adjustments (22) (1) (2) (25) Balance, 31 December , ,850 Net Book Value, 31 December 2015 $ $ $ 39 $ $ 39 ($ thousand) Property, Furniture and Equipment One-time establishment cost Furniture Equipment Leased Property Grand Total Cost: Balance, 1 January 2014 $ 2,709 $ 57 $ 337 $ 209 $ 3,312 Additions during the year Disposals during the year Translation adjustments (324) (7) (41) (25) (397) Balance, 31 December , ,915 Accumulated Depreciation: Balance, 1 January , ,179 Depreciation during the year Disposals during the year Translation adjustments (324) (7) (31) (25) (387) Balance, 31 December , ,846 Net Book Value, 31 December 2014 $ $ $ 69 $ $ 69 Total depreciation expense incurred for the year ended 31 December 2015 amounted to $29,000 ($54, ).
183 176 ADBI-4 continued NOTE E LONG-TERM GUARANTEE DEPOSITS The Institute leases office space and deposits the equivalent of six months of office rent to the lessor, as stipulated in the contract of lease signed in The amount is updated every contract renewal. The last renewal date was 1 April NOTE F ASSET REINSTATEMENT OBLIGATIONS The Institute has recorded the estimated asset reinstatement obligations related to leased office space. NOTE G CONTRIBUTIONS AND UNCOMMITTED BALANCES In December 2015, the Government of Japan committed its 26th contribution to the Institute amounting to 672,069,000 ($5,576,000). As of 31 December 2015, this was reported in the Statement of Financial Position as DUE FROM CONTRIBUTORS. In December 2015, the Government of Republic of Korea committed its 2nd contribution to the Institute amounting to $700,000. This was received on 15 December In September 2015, the Government of Indonesia committed its 1st contribution to the Institute amounting to $500,000. As of 31 December 2015, this was reported in the Statement of Financial Position as DUE FROM CONTRIBUTORS. In June 2015, the Government of Japan committed its 25th contribution to the Institute amounting to 672,070,000 ($5,484,000 equivalent). This was received on 1 July In December 2014, the Government of Japan committed its 24th contribution to the Institute amounting to 672,069,000 ($5,625,000 equivalent). This was received on 7 January In June 2014, the Government of Japan committed its 23rd contribution to the Institute amounting to 672,070,000 ($6,629,000 equivalent). This was received on 2 July Uncommitted balances comprise amounts which have not been committed by the Institute as of 31 December 2015 and NOTE H REVENUE FROM RENTAL REVENUE From rental in 2015 consists of sublease rental income of $324,000 ($366, ), received according to a space-sharing agreement with the Japanese Representative Office of ADB. The transactions with ADB were made in the ordinary course of business and were negotiated at arm s length. NOTE I LEASES The Institute leases office space and other assets. Rental expenses under operating leases for the years ended 31 December 2015 and 2014 were $2,731,000 and $3,087,000, respectively. As of 31 December 2015, the Institute has the following operating lease commitments: ($ thousand) Year ending 31 December Minimum future rentals ,
184 177 ADBI-4 continued NOTE J RELATED PARTY TRANSACTIONS ADB has not allocated service fees to the Institute for a range of administrative and financial services such as managing the investments or administering the Staff Retirement Plan (SRP) and Post-Retirement Group Medical Insurance Plan (PRGMIP). Effective 1 January 2015, the fair value of those personnel services has been estimated to be 10 basis points of the average balance of the Institute s liquid assets. For the year ended 31 December 2015, the calculated service fee was $11,000 and recorded as Administrative expenses and REVENUE From other sources net. The transaction has no impact on the net assets of the Institute. ACCOUNTS PAYABLE AND OTHER LIABILITIES include amounts net payable to OCR of $237,000 at 31 December 2015 ($31,000 net receivable 31 December 2014). The payable resulted from transactions in the normal course of business. NOTE K STAFF PENSION AND POSTRETIREMENT MEDICAL BENEFITS Staff Retirement Plan Eligible employees of the Institute are entitled by its Statute to be participants of ADB s defined benefit SRP. An eligible employee, as defined under SRP, shall, as a condition of service, become a participant from the first day of service, provided the employee has not reached the normal retirement age of 60 at that time. Retirement benefits are based on an annual accrual rate, length of service and the highest average remuneration during two years of eligible service. The SRP assets are segregated in a separate fund. The costs of administering the SRP are absorbed by ADB, except for fees paid to the investment managers and related charges, including custodian fees, which are borne by the SRP. Participants hired prior to 1 October 2006 are required to contribute 9 1/3% of their salary to the SRP while those hired on or after 1 October 2006 are not required to contribute. The annual accrual rate is 2.95% for staff hired prior to 1 October 2006 and 1.5% for those hired on or after 1 October Participants may also make discretionary contributions. The Institute s contribution is determined at a rate sufficient to cover that part of the costs of the SRP not covered by the participants contributions. Expected Contributions The Institute is expected to contribute $280,000 to the SRP for 2016 based on the budgeted contribution of 23% of salary of Institute participants. The Institute s staff members are expected to contribute $108,000 representing participants' mandatory contribution of $16,000 assuming full year service and discretionary contributions of $92,000. Investment Strategy Contributions in excess of current benefits payments are invested in international financial markets and in a variety of investment vehicles. The SRP employs nine external asset managers and one global custodian who are required to operate within the guidelines established by the SRP s Investment Committee. The investment of these assets, over the long term, is expected to produce higher returns than short-term investments. The investment policy incorporates the SRP s package of desired investment return and tolerance for risk, taking into account the nature and duration of its liabilities. The SRP s assets are diversified among different markets and different asset classes. The use of derivatives for speculation, leverage or taking risks is prohibited. Selected derivatives are used for hedging and transactional efficiency purposes.
185 178 ADBI-4 continued The SRP s investment policy is periodically reviewed and revised to reflect the best interest of the SRP s participants and beneficiaries. As approved by the Pension Committee on 27 October 2015, the SRP s new long-term target asset-mix, which will be implemented in 2016, is 35% US equity, 30% non-us equity, 15% global fixed income, 10% globally high yield, and 10% diversified asset. The asset mix approved for 2015 was based on the policy adopted in 2011, which is 40% US equity, 30% non-us equity and 30% global fixed income. For the year ended 31 December 2015, the net return on the SRP assets was -0.47% (6.3% 2014). ADB expects the long-term rate of return on the assets to be 7.0% (7.5% 2014). Assumptions The assumed overall rate of return takes into account long-term return expectations of the underlying asset classes within the investment portfolio mix, and the expected duration of the SRP s liabilities. Return expectations are forward looking and, in general, not much weight is given to short-term experience. Unless there is a drastic change in investment policy or market environment, as well as in the liability/benefit policy side, the assumed average long term investment return of 7.0% on the SRP s assets is expected to remain on average broadly the same, year to year. Effective for the 2015 actuarial valuation, as part of the regular assumptions review, some revisions were made to the previous actuarial assumptions based on the experience. The assumptions that were revised include changes to the investment return, salary progression, pension increases, rates of withdrawal, early and incapacity retirement rates, retirement and post-incapacity retirement mortality rates, and percent of international staff who commute, and other commutation factors. Post-Retirement Group Medical Insurance Plan The Institute participates in the cost-sharing arrangement of ADB s PRGMIP. Under this plan, the Institute is obligated to pay 75% of the PRGMIP premiums for its retirees, which includes retired members and their eligible dependents who elected to participate. Currently, no Institute retiree has elected to participate. In December 2014, the Board of Directors approved the funding of the PRGMIP. ADB established the Retiree Medical Plan Fund (RMPF) where the ADB s contributions would be deposited and invested to fund the accumulated obligations of the PRGMIP. The income of RMPF consists of ADB s contributions and investment earnings; it does not have any component attributable to participants share of PRGMIP costs. The RMPF assets are segregated in a separate fund and held in trust, hence are not included in the balance sheet of ADB. In 2015, insurance premium paid by ADB for the PRGMIP is considered ADB s contribution to the fund. The costs of administering RMPF are absorbed by ADB, while investment management and custodian fees are paid from the RMPF. The SRP Pension Committee is responsible for the overall financial management of the RMPF and is assisted by the SRP Investment Committee. Expected Contribution Subsequent to the establishment of the RMPF, ADB transferred $315 million into the RMPF, none of which relates to the Institute s contribution. The Institute s expected contribution to the RMPF will be determined based on the recommendation of the SRP Pension Committee. For 2016, the Institute is not expected to contribute to the RMPF.
186 179 ADBI-4 continued Investment Strategy The RMPF employs three external asset managers and one global custodian who are required to operate within the guidelines established by the SRP s Investment Committee. The investment of these assets, over the long term, is expected to produce higher returns than short-term investments. Similar to SRP, the investment policy incorporates the RMPF s package of desired investment return and tolerance for risk, taking into account the nature and duration of its liabilities. The RMPF s assets are diversified among different markets and asset classes. The use of derivatives for speculation, leverage or taking risks is prohibited. Selected derivatives are used for hedging and transactional efficiency purposes. In October 2015, the Pension Committee approved the RMPF s investment policy. Based on the approved policy, the RMPF s long-term target asset-mix is 40% US equity, 30% non-us equity, and 30% global fixed income. Assumptions The overall long-term rate of return is 7.0% per annum, similar to the SRP. Effective for the 2015 actuarial valuation, as part of the regular assumptions review, some revisions were made to the previous actuarial assumptions based on the experience. The assumptions that were revised include retirement mortality rates and PRGMIP election rates, among others. The following table sets forth the Institute s participants pension and postretirement medical benefits at 31 December 2015 and 2014: ($ thousand) Postretirement Pension Benefits Medical Benefits Change in benefit obligation: Projected benefit obligation at beginning of year $ 11,427 $ 10,324 $ 457 $ 402 Service cost Interest cost Plan participants contributions Actuarial (gain) loss (536) 453 (233) (82) Benefits paid (481) (433) (22) (21) Projected benefit obligation at end of year $ 11,552 $ 11,427 $ 332 $ 457 Change in plan assets: Fair value of plan assets at beginning of year $ 5,231 $ 4,939 $ $ Actual return on plan assets (17) 303 Employer s contribution Plan participants contributions Benefits paid (481) (433) (22) (21) Fair value of plan assets at end of year $ 5,168 $ 5,231 $ $ Funded Status $ (6,384) $ (6,196) $ (332) $ (457)
187 180 ADBI-4 continued table continued ($ thousand) Postretirement Pension Benefits Medical Benefits Amounts recognized in the Balance sheet consist of: Noncurrent liabilities $ (6,384) $ (6,196) $ (332) $ (457) Amounts recognized in the Unrestricted net assets consist of: Net actuarial loss (gain) $ 2,034 $ 2,270 $ (629) $ (435) Weighted-average assumptions as of 31 December Discount rate 4.55% 4.15% 4.55% 4.15% Expected return on plan assets 7.00% 7.50% 7.00% 7.50% Rate of compensation increase varies with age and averages 3.25% 3.25% N/A N/A For measurement purposes, a 7.0% annual rate of increase in the per capita cost of covered postretirement medical care benefits was assumed for the valuation as of 31 December 2015 and The rate was assumed to decrease gradually to 5.0% by 2021 and remain at the level thereafter. The following table summarizes the benefit costs associated with pension and postretirement medical benefits for the years ended 31 December 2015 and 2014: ($ thousand) Pension Benefits Postretirement Medical Benefits Components of net periodic benefit cost: Service cost $ 468 $ 433 $ 107 $ 131 Interest cost Expected return on plan assets (398) (356) (1) Recognized actuarial loss (gain) (38) (33) Net periodic benefit cost $ 677 $ 720 $ 91 $ 125 The Institute s accumulated benefit obligation of the pension plan as of 31 December 2015 was $11,392,000 ($11,097, ). The estimated net loss for the defined benefit pension plan that will be amortized from unrestricted net assets into net periodic benefit cost over the next fiscal year amounted to $96,000. The estimated net gains for the postretirement medical benefits plan that will be amortized from unrestricted net assets into net periodic benefit cost over the next fiscal year is $48,000.
188 181 ADBI-4 continued Assumed postretirement medical benefits cost trend rates have a significant effect on the amounts reported for the postretirement medical benefits plan. A one-percentage-point change in the assumed trend rates would have the following effects: ($ thousand) 1-Percentage- Point Increase 1-Percentage- Point Decrease Effect on total service and interest cost components $ 35 $ (27) Effect on postretirement medical benefit obligation 83 (67) Estimated Future Benefits Payments The following table shows the benefit payments expected to be paid in each of the next five years and subsequent five years. The expected benefit payments are based on the same assumptions used to measure the benefit obligation at 31 December 2015: ($ thousand) Pension Postretirement Benefits Medical Benefits 2016 $ 411 $ , = less than $500. Fair Value Disclosure The fair value of the Institute s SRP asset s measured on a recurring basis as of 31 December 2015 and 2014 was shown below: ($ thousand) Fair Value Measurements Total Level 1 Level 2 Level 3 31 December 2015 Cash and cash equivalents $ 128 $ $ 128 $ Common/preferred stocks Investment funds 2,309 2,309 Government or governmentguaranteed securities Corporate debt securities Mortgage/asset-backed securities: Mortgage-backed securities Collateralized mortgage obligations Asset-backed securities Short-term investments Derivatives (10) (0) (10) Other asset/liabilities a net (83) (83) Total fair value of SRP assets $ 5,168 $ 4,804 $ 345 $ 19 0 = Less than $500. a Incudes receivables and liabilities carried at amounts that approximate fair value.
189 182 ADBI-4 continued ($ thousand) Fair Value Measurements Total Level 1 Level 2 Level 3 31 December 2014 Cash and cash equivalents $ 117 $ $ 117 $ Common/preferred stocks 1,098 1,098 0 Investment funds 2,632 2,632 Government or governmentguaranteed securities Corporate debt securities Mortgage/asset-backed securities: Mortgage-backed securities Collateralized mortgage obligations Asset-backed securities 3 3 Short-term investments Derivatives Other asset/liabilities a net (68) (68) Total fair value of SRP assets $ 5,231 $ 5,076 $ 141 $ 14 0 = Less than $500. a Incudes receivables and liabilities carried at amounts that approximate fair value. The SRP s Investment Committee and SRP investment unit meet periodically and are involved in overseeing the activities and performance of the investment portfolios. The fair value of the SRP investments is provided by the SRP s global custodian from various independent pricing providers. ADB s accounting division in coordination with data management unit of treasury services division evaluates the fair value in determining the hierarchy level. All investments including equity securities, fixed income securities and derivatives are provided by independent pricing providers. Equity securities include common and preferred stocks and mutual funds. Fixed income securities include government or government-guaranteed securities, corporate obligations, asset and mortgage-backed securities, and short-term investments. Derivatives include futures, swaps and currency forward contracts. The table below provides details of transfers of the Institute s SRP s assets between Levels 1 and 2, which are attributed to the availability or absence of market quotes, for the years ended 31 December 2015 and 2014: ($ thousand) Level 1 Level 2 Level 1 Level 2 Investments Government or governmentguaranteed securities Transfers into (out of) $ $ $ 0 $ (0) Transfers (out of) into (9) 9 Corporate debt securities Transfers into (out of) 4 (4) 5 (5) Transfers (out of) into (4) 4 0 = Less than $500. $ (9) $ 9 $ 5 $ (5)
190 183 ADBI-4 continued The following tables present the changes in the carrying amounts of the Institute s SRP Level 3 investments for the years ended 31 December 2015 and 2014: ($ thousand) Investments Common/ Government or gov't.- Mortgage/ preferred stocks guaranteed securities Corporate debt securities Asset-backed securities Balance, 31 December 2014 $ 0 $ $ 3 $ 11 Total realized/unrealized (losses)/gains in: Net increase (decrease) in net assets available for benefits (0) (1) (0) Purchases 43 2 Sales/Maturities (32) (2) Settlement and others (1) (2) Transfers out of Level 3 (2) Balance, 31 December 2015 $ $ $ 12 $ 7 Total unrealized gains (losses) included in income related to financial assets and liabilities still held at the reporting date $ $ $ (0) $ 0 0 = Less than $500. ($ thousand) Investments Common/ Government or gov't.- Mortgage/ preferred stocks guaranteed securities Corporate debt securities Asset-backed securities Balance, 31 December 2013 $ 0 $ 4 $ 3 $ 13 Total realized/unrealized (losses)/gains in: Net decrease in net assets available for benefits 0 0 (1) Purchases 6 5 Sales/Maturities (0) (3) (1) Settlement and others (4) Transfers into Level 3 (4) (3) (1) Balance, 31 December 2014 $ 0 $ $ 3 $ 11 Total unrealized gains (losses) included in income related to financial assets and liabilities still held at the reporting date $ 0 $ $ 0 $ (1) 0 = Less than $500. Transfers into and out of Level 3 in 2015 and 2014 are due to the availability or absence of market observable inputs. NOTE L OTHER FAIR VALUE DISCLOSURES As of 31 December 2015 and 2014, the Institute has no assets or liabilities measured at fair value on a non-recurring basis. See Note C for discussions relating to investments and securities purchased under resale arrangements. In all other cases, the carrying amounts of the Institute s assets and liabilities are considered to approximate fair values.
191 184 ADBI-4 continued NOTE M SUBSEQUENT EVENTS The Institute has evaluated subsequent events after 31 December 2015 through 11 March 2016, the date these Financial Statements are available for issuance. On 5 January and 15 January 2016, the Institute received the 1st contribution from the Government of Indonesia and 26th contribution from the Government of Japan, respectively.
192 185 REGIONAL COOPERATION AND INTEGRATION FUND MANAGEMENT'S REPORT ON INTERNAL CONTROL OVER FINANCIAL REPORTING The management of Asian Development Bank ("ADB") is responsible for establishing and maintaining adequate internal control over financial reporting. ADB's internal control over financial reporting is a process designed to provide reasonable assurance regarding the reliability of financial reporting and the preparation of financial statements for external purposes in accordance with generally accepted accounting principles in the United States of America. ADB's internal control over financial reporting includes those policies and procedures that (i) pertain to the maintenance of records that, in reasonable detail, accurately and fairly reflect the transactions and dispositions of the assets of ADB; (ii) provide reasonable assurance that transactions are recorded as necessary to permit preparation of financial statements in accordance with generally accepted accounting principles in the United States of America, and that receipts and expenditures of ADB are being made only in accordance with authorizations of management and directors of ADB; and (iii) provide reasonable assurance regarding prevention or timely detection and correction of unauthorized acquisition, use, or disposition of ADB's assets that could have a material effect on the financial statements. Because of its inherent limitations, internal control over financial reporting may not prevent or detect misstatements. Also, projections of any evaluation of effectiveness to future periods are subject to the risk that controls may become inadequate because of changes in conditions, or that the degree of compliance with the policies or procedures may deteriorate. ADB's management assessed the effectiveness of ADB's internal control over financial reporting as of 31 December In making this assessment, ADB's management used the criteria set forth by the Committee of Sponsoring Organizations of the Treadway Commission in Internal Control Integrated Framework (2013). Based on that assessment, management believes that as of 31 December 2015, ADB's internal control over financial reporting is effective based upon the criteria established in Internal Control Integrated Framework (2013). Takehiko Nakao President Thierry de Longuemar Vice-President (Finance and Risk Management) Chai S. Kim Controller 11 March 2016
193 186
194 187
195 188
196 189
197 190 RCIF-1 ASIAN DEVELOPMENT BANK REGIONAL COOPERATION AND INTEGRATION FUND STATEMENT OF FINANCIAL POSITION 31 December 2015 and 2014 Expressed in Thousands of US Dollars ASSETS DUE FROM BANKS $ 2,503 $ 333 INVESTMENTS (Notes C and G) Time deposits 14,692 17,268 ACCRUED REVENUE 1 0 DUE FROM CONTRIBUTORS (Note F) 1,218 ADVANCES FOR GRANTS AND OTHER ASSETS (Note D) TOTAL $ 17,260 $ 19,171 LIABILITIES AND UNCOMMITTED BALANCES ACCOUNTS PAYABLE AND OTHER LIABILITIES (Note D) $ 241 $ 75 UNDISBURSED COMMITMENTS (Notes E and G) 9,177 11,048 TOTAL LIABILITIES 9,418 11,123 UNCOMMITTED BALANCES (RCIF-2) (Note F), represented by: Unrestricted net assets 7,842 8,048 TOTAL $ 17,260 $ 19,171 0 = Less than $500. The accompanying notes are an integral part of these financial statements (RCIF-4).
198 191 RCIF-2 ASIAN DEVELOPMENT BANK REGIONAL COOPERATION AND INTEGRATION FUND STATEMENT OF ACTIVITIES AND CHANGES IN NET ASSETS For the Years Ended 31 December 2015 and 2014 Expressed in Thousands of US Dollars CHANGES IN UNRESTRICTED NET ASSETS CONTRIBUTIONS (Note F) $ $ 3,631 REVENUE From investments (Note C) From other sources 5 4 Total 29 3,657 EXPENSES Technical assistance net (Note E) Administrative and financial expenses (Note D) Total CONTRIBUTIONS AND REVENUE (LESS THAN) IN EXCESS OF EXPENSES (201) 2,961 EXCHANGE LOSSES net (5) (33) (DECREASE) INCREASE IN NET ASSETS (206) 2,928 NET ASSETS AT BEGINNING OF YEAR 8,048 5,120 NET ASSETS AT END OF YEAR $ 7,842 $ 8,048 The accompanying notes are an integral part of these financial statements (RCIF-4).
199 192 RCIF-3 ASIAN DEVELOPMENT BANK REGIONAL COOPERATION AND INTEGRATION FUND STATEMENT OF CASH FLOWS For the Years Ended 31 December 2015 and 2014 Expressed in Thousands of US Dollars CASH FLOWS FROM OPERATING ACTIVITIES Contributions received $ 1,215 $ 2,380 Interest on investments received Cash received from other sources 5 4 Technical assistance disbursed (1,608) (2,440) Administrative and financial expenses paid (42) (177) Net Cash Used in Operating Activities (406) (210) CASH FLOWS FROM INVESTING ACTIVITIES Maturities of investments 756, ,319 Purchases of investments (754,120) (788,042) Net Cash Provided by Investing Activities 2, Net Increase in Due From Banks 2, Due from Banks at Beginning of Year Due from Banks at End of Year $ 2,503 $ 333 RECONCILIATION OF (DECREASE) INCREASE IN NET ASSETS TO NET CASH USED IN OPERATING ACTIVITIES: (Decrease) Increase in net assets (RCIF-2) $ (206) $ 2,928 Adjustments to reconcile (decrease) increase in net assets to net cash used in operating activities: Change in due from contributors 1,226 (1,226) Change in accrued revenue (1) Change in advances for grants and other assets Change in accounts payable and other liabilities 166 (60) Change in undisbursed commitments (1,871) (2,325) Exchange (gains) losses net (8) 8 Net Cash Used in Operating Activities $ (406) $ (210) The accompanying notes are an integral part of these financial statements (RCIF-4)
200 193 RCIF-4 ASIAN DEVELOPMENT BANK REGIONAL COOPERATION AND INTEGRATION FUND NOTES TO FINANCIAL STATEMENTS 31 December 2015 and 2014 NOTE A NATURE OF OPERATIONS The Asian Development Bank (ADB), a multilateral development financial institution, was established in 1966 with its headquarters in Manila, Philippines. ADB and its operations are governed by the Agreement Establishing the Asian Development Bank (the Charter). Its purpose is to foster economic development and co-operation in Asia and the Pacific region and to contribute to the acceleration of the process of economic development of the developing member countries (DMCs) in the region, collectively and individually. Since 1999, ADB s corporate vision and mission has been to help DMCs reduce poverty in the region. This was reaffirmed under the long-term strategic framework for (Strategy 2020). Under Strategy 2020, ADB s corporate vision continues to be An Asia and Pacific Free of Poverty and its mission has been to help its DMCs reduce poverty and improve living conditions and quality of life. ADB has been pursuing its mission and vision by focusing on three complementary strategic agendas: inclusive growth, environmentally sustainable growth, and regional integration. ADB provides financial and technical assistance for projects and programs, which will contribute to achieve this purpose. These are financed through ordinary capital resources (OCR) and Special Funds. 1 The RCIF, together with the Regional Cooperation and Integration (RCI) Trust Funds, was established on 26 February 2007 under the umbrella of the Regional Cooperation and Integration Financing Partnership Facility (RCIFPF), in response to the increasing demand for regional cooperation and integration activities among ADB s members in Asia and the Pacific. Its main objective is to enhance regional cooperation and integration in Asia and the Pacific by facilitating the pooling and provision of additional financial and knowledge resources to support RCI activities. Financial assistance will be provided in the form of untied grants for technical assistance (TA), including advisory, project preparatory, and regional TA. RCIF s resources may consist of contributions from ADB and other bilateral, multilateral, and individual sources, including companies and foundations. ADB is immune from taxation pursuant to Chapter VIII, Article 56, Exemption from Taxation, of the Charter. NOTE B SUMMARY OF SIGNIFICANT ACCOUNTING POLICIES Presentation of the Financial Statements The financial statements of the RCIF are prepared in accordance with accounting principles generally accepted in the United States of America (US GAAP), and are presented on the basis of those for not-forprofit organizations. RCIF reports donors contributions of cash and other assets as unrestricted assets as these are made available to RCIF without conditions other than for the purpose of pursuing its objectives. Functional and Reporting Currency The US dollar is the functional and reporting currency, representing the currency of the primary economic operating environment of RCIF. 1 Asian Development Fund (ADF), Technical Assistance Special Fund (TASF), Japan Special Fund (JSF), ADB Institute (ADBI), Regional Cooperation and Integration Fund (RCIF), Climate Change Fund (CCF), Asia Pacific Disaster Response Fund (APDRF), and Financial Sector Development Partnership Special Fund (FSDPSF).
201 194 RCIF-4 continued Translation of Currencies ADB adopts the use of daily exchange rates for accounting and financial reporting purposes. This allows transactions denominated in non-us dollar currencies to be translated to the reporting currency using exchange rates applicable at the time of the transactions. Contributions included in the financial statements during the year are recognized at applicable exchange rates as of the respective dates of commitment. At the end of each accounting month, translations of assets, liabilities, and uncommitted balances which are denominated in non-us dollar currencies are adjusted using the applicable rates of exchange at the end of the reporting period. These translation adjustments are accounted for as exchange gains or losses and are credited or charged to operations. Investments All investment securities held by RCIF are reported at fair value. Realized and unrealized gains and losses are included in REVENUE From investments. Interest income on time deposits is recognized as earned and reported in REVENUE From investments. Contributions The contributions from donors and the allocations from net income of OCR are included in the financial statements, from the date of effectivity of the contributions agreement, and the Board of Governors approval, respectively. Technical Assistance, Grants and Undisbursed Commitments Technical assistance (TA) and grants are recognized in the financial statements when the project is approved and becomes effective. Upon completion or cancellation of a TA project or grant, any undisbursed amount is written back as a reduction in TA or grants for the year and the corresponding undisbursed commitment is eliminated accordingly. Advances are provided from TA and grants to the executing agency or co-operating institution, for the purpose of making payments for eligible expenses. The advances are subject to liquidation and charged against undisbursed commitments. Any unutilized portion is required to be returned to the fund. These are included in ADVANCES FOR GRANTS AND OTHER ASSETS. Fair Value of Financial Instruments ASC 820, Fair Value Measurement defines fair value as the price that would be received to sell an asset or paid to transfer a liability at measurement date in an orderly transaction among willing participants with an assumption that the transaction takes place in the entity s principal market, or in the absence of principal market, in the most advantageous market for the asset or liability. The most advantageous market is the market where the sale of the asset or transfer of liability would maximize the amount received for the asset or minimize the amount paid to transfer the liability. The fair value measurement is not adjusted for transaction costs. Fair Value Hierarchy ASC 820 establishes a fair value hierarchy that gives the highest priority to quoted prices in active markets for identical assets or liabilities (Level 1), next priority to observable market inputs or market corroborated data (Level 2), and the lowest priority to unobservable inputs without market corroborated data (Level 3).
202 195 RCIF-4 continued The fair values of ADB s financial assets and liabilities are categorized as follows: Level 1: fair values are based on unadjusted quoted prices for identical assets or liabilities in active markets. Level 2: fair values are based on quoted prices for similar assets or liabilities in active markets or markets that are not active; or valuation models for which significant inputs are obtained from market-based data that are observable. Level 3: fair values are based on prices or valuation models for which significant inputs to the model are unobservable. Inter-level transfers from one year to another may occur due to changes in market activities affecting the availability of quoted market prices or observable market data. ADB s policy is to recognize transfers in and transfers out of levels as of the end of the reporting period in which they occur. Accounting Estimates The preparation of financial statements in conformity with generally accepted accounting principles requires management to make reasonable estimates and assumptions that affect the reported amounts of assets and liabilities and uncommitted balances as of the end of the year and the reported amounts of revenue and expenses during the year. The actual results could differ from those estimates. Accounting and Reporting Developments In May 2014, the Financial Accounting Standards Board (FASB) issued Accounting Standards Update (ASU) Revenue from Contracts with Customers (Topic 606) to improve financial reporting by creating common revenue recognition guidance for US GAAP and the International Financial Reporting Standards. An entity is required to apply the amendments prospectively for annual reporting periods beginning after 15 December In August 2015, FASB issued ASU deferring the effective date by one year. ADB is currently assessing the impact on RCIF s financial statements. In August 2014, the FASB issued ASU Presentation of Financial Statements Going Concern (Subtopic ) to require management to perform interim and annual assessments of an entity s ability to continue as a going concern within one year of the date the financial statements are issued. An entity must provide certain disclosures if conditions or events raise substantial doubt about the entity s ability to continue as a going concern. The ASU applies to all entities and is effective for annual periods ending after 15 December 2016, and interim periods thereafter. This ASU is not expected to impact RCIF s financial statements. Statement of Cash Flows For the purposes of the Statement of Cash Flows, RCIF considers that its cash and cash equivalents are limited to DUE FROM BANKS, which consists of cash on hand and current accounts in banks used for operational disbursements.
203 196 RCIF-4 continued NOTE C INVESTMENTS The main investment management objective is to maintain security and liquidity. Subject to these parameters, ADB seeks the highest possible return on its investments. Investments are governed by the Investment Authority approved by the Board of Directors. All investments held as of 31 December 2015 and 2014 were in time deposits. The annualized rate of return on the average investments held during the period ended 31 December 2015, based on the portfolio held at the beginning and end of each month, was 0.17% (0.14% 2014). Fair Value Disclosure The fair value of INVESTMENTS as of 31 December 2015 and 2014 was as follows: ($ thousand) Fair Value Measurements 31 December 2015 Total Level 1 Level 2 Level 3 Investments Time deposits $ 14,692 $ $ 14,692 $ 31 December 2014 Investments Time deposits $ 17,268 $ $ 17,268 $ ADB maintains documented processes and internal controls to value investment securities. Time deposits are reported at cost, which approximates fair value. NOTE D RELATED PARTY TRANSACTIONS The OCR and Special Funds resources are at all times used, committed, and invested entirely separately from each other. The administrative and operational expenses pertaining to RCIF are settled regularly with OCR and the other funds. Regional technical assistance projects and programs may be combined activities financed by Special Funds and trust funds. ADB charges a service fee to cover ADB s incremental cost for the administration, management, supervision and operation of the RCIF and RCI Trust Fund, a trust fund administered by ADB. The service fee is currently 5% of the amount disbursed for technical assistance and 2% of the amount disbursed for grant components of investment projects.
204 197 RCIF-4 continued The interfund account balances included in ADVANCES FOR GRANTS AND OTHER ASSETS and ACCOUNTS PAYABLE AND OTHER LIABILITIES are as follows: ($ thousand) Receivable from: Agency Trust Funds net $ 37 $ Payable to: Ordinary capital resources $ 39 $ 26 Technical Assistance Special Fund Japan Special Fund 0 Financial Sector Development Partnership Special Fund 24 Agency Trust Funds net 9 Total $ 225 $ 68 0 = Less than $500. NOTE E UNDISBURSED COMMITMENTS Undisbursed commitments are denominated in US dollars and represent effective TA and grants not yet disbursed and unliquidated. During 2015, $1,334,000 ($1,662, ) representing completed and canceled TA projects and grants were written back as a reduction in technical assistance for the period and the corresponding undisbursed commitment was eliminated. The fair value of undisbursed commitments approximates the amounts outstanding, because ADB expects that disbursements will substantially be made for all the projects/programs covered by the commitments. NOTE F CONTRIBUTIONS AND UNCOMMITTED BALANCES In December 2014, the Government of Japan committed its 2nd contribution to the RCIF amounting to 145,500,000 ($1,226,000 equivalent). This was received on 9 January In March 2014, the Government of Japan committed and paid its 1st contribution to the RCIF amounting to 246,000,000 ($2,405,000 equivalent). This was received on 13 March Uncommitted balances comprise amounts which have not been committed by ADB as of 31 December 2015 and NOTE G OTHER FAIR VALUE DISCLOSURES As of 31 December 2015 and 2014, RCIF has no assets or liabilities measured at fair value on a nonrecurring basis. See Notes C and E for discussions relating to investments and undisbursed commitments, respectively. In all other cases, the carrying amount of RCIF s assets and liabilities is considered to approximate fair value. NOTE H SUBSEQUENT EVENTS ADB has evaluated subsequent events after 31 December 2015 through 11 March 2016, the date these Financial Statements are available for issuance. As a result of this evaluation, there are no subsequent events, as defined, that require recognition or disclosure in the RCIF s Financial Statements as of 31 December 2015.
205 198 CLIMATE CHANGE FUND MANAGEMENT'S REPORT ON INTERNAL CONTROL OVER FINANCIAL REPORTING The management of Asian Development Bank ("ADB") is responsible for establishing and maintaining adequate internal control over financial reporting. ADB's internal control over financial reporting is a process designed to provide reasonable assurance regarding the reliability of financial reporting and the preparation of financial statements for external purposes in accordance with generally accepted accounting principles in the United States of America. ADB's internal control over financial reporting includes those policies and procedures that (i) pertain to the maintenance of records that, in reasonable detail, accurately and fairly reflect the transactions and dispositions of the assets of ADB; (ii) provide reasonable assurance that transactions are recorded as necessary to permit preparation of financial statements in accordance with generally accepted accounting principles in the United States of America, and that receipts and expenditures of ADB are being made only in accordance with authorizations of management and directors of ADB; and (iii) provide reasonable assurance regarding prevention or timely detection and correction of unauthorized acquisition, use, or disposition of ADB's assets that could have a material effect on the financial statements. Because of its inherent limitations, internal control over financial reporting may not prevent or detect misstatements. Also, projections of any evaluation of effectiveness to future periods are subject to the risk that controls may become inadequate because of changes in conditions, or that the degree of compliance with the policies or procedures may deteriorate. ADB's management assessed the effectiveness of ADB's internal control over financial reporting as of 31 December In making this assessment, ADB's management used the criteria set forth by the Committee of Sponsoring Organizations of the Treadway Commission in Internal Control Integrated Framework (2013). Based on that assessment, management believes that as of 31 December 2015, ADB's internal control over financial reporting is effective based upon the criteria established in Internal Control Integrated Framework (2013). Takehiko Nakao President Thierry de Longuemar Vice-President (Finance and Risk Management) Chai S. Kim Controller 11 March 2016
206 199
207 200
208 201
209 202
210 203 CCF-1 ASIAN DEVELOPMENT BANK CLIMATE CHANGE FUND STATEMENT OF FINANCIAL POSITION 31 December 2015 and 2014 Expressed in Thousands of US Dollars ASSETS DUE FROM BANKS $ 1,562 $ 514 INVESTMENTS (Notes C and G) Time deposits 20,725 26,290 ACCRUED REVENUE 2 0 ADVANCES FOR GRANTS AND OTHER ASSETS (Note D) 669 1,105 TOTAL $ 22,958 $ 27,909 LIABILITIES AND UNCOMMITTED BALANCES ACCOUNTS PAYABLE AND OTHER LIABILITIES (Note D) $ 133 $ 97 UNDISBURSED COMMITMENTS (Notes E and G) 12,114 17,348 TOTAL LIABILITIES 12,247 17,445 UNCOMMITTED BALANCES (CCF-2) (Note F), represented by: Unrestricted net assets 10,711 10,464 TOTAL $ 22,958 $ 27,909 0 = Less than $500. The accompanying notes are an integral part of these financial statements (CCF-4).
211 204 CCF-2 ASIAN DEVELOPMENT BANK CLIMATE CHANGE FUND STATEMENT OF ACTIVITIES AND CHANGES IN NET ASSETS For the Years Ended 31 December 2015 and 2014 Expressed in Thousands of US Dollars CHANGES IN UNRESTRICTED NET ASSETS REVENUE FROM INVESTMENTS (Note C) $ 37 $ 45 EXPENSES Technical assistance and grants net (Note E) (830) 2,767 Administrative and financial expenses (Note D) Total (213) 3,146 REVENUE IN EXCESS OF (LESS THAN) EXPENSES 250 (3,101) EXCHANGE LOSSES net (3) (8) INCREASE (DECREASE) IN NET ASSETS 247 (3,109) NET ASSETS AT BEGINNING OF YEAR 10,464 13,573 NET ASSETS AT END OF YEAR $ 10,711 $ 10,464 The accompanying notes are an integral part of these financial statements (CCF-4).
212 205 CCF-3 ASIAN DEVELOPMENT BANK CLIMATE CHANGE FUND STATEMENT OF CASH FLOWS For the Years Ended 31 December 2015 and 2014 Expressed in Thousands of US Dollars CASH FLOWS FROM OPERATING ACTIVITIES Interest on investments received $ 36 $ 47 Technical assistance and grants disbursed (4,276) (11,573) Administrative and financial expenses paid (276) (289) Net Cash Used in Operating Activities (4,516) (11,815) CASH FLOWS FROM INVESTING ACTIVITIES Maturities of investments 1,129,661 1,643,580 Purchases of investments (1,124,097) (1,632,927) Net Cash Provided by Investing Activities 5,564 10,653 Net Increase (Decrease) in Due From Banks 1,048 (1,162) Due from Banks at Beginning of Year 514 1,676 Due from Banks at End of Year $ 1,562 $ 514 RECONCILIATION OF INCREASE (DECREASE) IN NET ASSETS TO NET CASH USED IN OPERATING ACTIVITIES: Increase (Decrease) in net assets (CCF-2) $ 247 $ (3,109) Adjustments to reconcile increase (decrease) in net assets to net cash used in by operating activities: Change in accrued revenue (1) 2 Change in advances for grants and other assets 436 (14) Change in accounts payable and other liabilities Change in undisbursed commitments (5,234) (8,742) Net Cash Used in Operating Activities $ (4,516) $ (11,815) The accompanying notes are an integral part of these financial statements (CCF-4).
213 206 CCF-4 ASIAN DEVELOPMENT BANK CLIMATE CHANGE FUND NOTES TO FINANCIAL STATEMENTS 31 December 2015 and 2014 NOTE A NATURE OF OPERATIONS The Asian Development Bank (ADB), a multilateral development financial institution, was established in 1966 with its headquarters in Manila, Philippines. ADB and its operations are governed by the Agreement Establishing the Asian Development Bank (the Charter). Its purpose is to foster economic development and co-operation in Asia and the Pacific region and to contribute to the acceleration of the process of economic development of the developing member countries (DMCs) in the region, collectively and individually. Since 1999, ADB s corporate vision and mission has been to help DMCs reduce poverty in the region. This was reaffirmed under the long-term strategic framework for (Strategy 2020). Under Strategy 2020, ADB s corporate vision continues to be An Asia and Pacific Free of Poverty and its mission has been to help its DMCs reduce poverty and improve living conditions and quality of life. ADB has been pursuing its mission and vision by focusing on three complementary strategic agendas: inclusive growth, environmentally sustainable growth, and regional integration. ADB provides financial and technical assistance for projects and programs, which will contribute to achieve this purpose. These are financed through ordinary capital resources (OCR) and Special Funds. 1 The CCF was established on 7 April 2008 to facilitate greater investments in DMCs to address the causes and consequences of climate change alongside ADB s own assistance in various related sectors. The CCF is a key mechanism to pool resources within ADB to address climate change through (i) technical assistance (TA), (ii) investment components for both private and public sector projects, and (iii) any other form of cooperation that ADB and its partners may agree upon for a defined program of activities. Financial assistance is provided in the form of untied grants for components of investment projects, for advisory, project preparatory, and regional TA; as well as for any other activities that may be agreed between external contributors and ADB. CCF s resources may consist of contributions from ADB and other bilateral, multilateral, and individual sources, including companies and foundations. ADB is immune from taxation pursuant to Chapter VIII, Article 56, Exemption from Taxation, of the Charter. NOTE B SUMMARY OF SIGNIFICANT ACCOUNTING POLICIES Presentation of the Financial Statements The financial statements of the CCF are prepared in accordance with accounting principles generally accepted in the United States of America (US GAAP), and are presented on the basis of those for not-forprofit organizations. CCF reports donors contributions of cash and other assets as unrestricted assets as these are made available to CCF without conditions other than for the purpose of pursuing its objectives. Functional and Reporting Currency The US dollar is the functional and reporting currency, representing the currency of the primary economic operating environment of CCF. 1 Asian Development Fund (ADF), Technical Assistance Special Fund (TASF), Japan Special Fund (JSF), ADB Institute (ADBI), Regional Cooperation and Integration Fund (RCIF), Climate Change Fund (CCF), Asia Pacific Disaster Response Fund (APDRF), and Financial Sector Development Partnership Special Fund (FSDPSF).
214 207 CCF-4 continued Translation of Currencies ADB adopts the use of daily exchange rates for accounting and financial reporting purposes. This allows transactions denominated in non-us dollar currencies to be translated to the reporting currency using exchange rates applicable at the time of the transactions. Contributions included in the financial statements during the year are recognized at applicable exchange rates as of the respective dates of commitment. At the end of each accounting month, translations of assets, liabilities, and uncommitted balances which are denominated in non-us dollar currencies are adjusted using the applicable rates of exchange at the end of the reporting period. These translation adjustments are accounted for as exchange gains or losses and are credited or charged to operations. Investments All investment securities held by CCF are reported at fair value. Realized and unrealized gains and losses are included in REVENUE FROM INVESTMENTS. Interest income on time deposits is recognized as earned and reported in REVENUE FROM INVESTMENTS. Contributions The contributions from donors and the allocations from net income of OCR are included in the financial statements, from the date of effectivity of the contributions agreement, and the Board of Governors approval, respectively. Technical Assistance, Grants and Undisbursed Commitments Technical assistance and grants are recognized in the financial statements when the project is approved and becomes effective. Upon completion or cancellation of a TA project or grant, any undisbursed amount is written back as a reduction in TA or grants for the year and the corresponding undisbursed commitment is eliminated accordingly. Advances are provided from TA and grants to the executing agency or co-operating institution, for the purpose of making payments for eligible expenses. The advances are subject to liquidation and charged against undisbursed commitments. Any unutilized portion is required to be returned to the fund. These are included in ADVANCES FOR GRANTS AND OTHER ASSETS. Fair Value of Financial Instruments ASC 820, Fair Value Measurement defines fair value as the price that would be received to sell an asset or paid to transfer a liability at measurement date in an orderly transaction among willing participants with an assumption that the transaction takes place in the entity s principal market, or in the absence of principal market, in the most advantageous market for the asset or liability. The most advantageous market is the market where the sale of the asset or transfer of liability would maximize the amount received for the asset or minimize the amount paid to transfer the liability. The fair value measurement is not adjusted for transaction costs. Fair Value Hierarchy ASC 820 establishes a fair value hierarchy that gives the highest priority to quoted prices in active markets for identical assets or liabilities (Level 1), next priority to observable market inputs or market corroborated data (Level 2), and the lowest priority to unobservable inputs without market corroborated data (Level 3).
215 208 CCF-4 continued The fair values of ADB s financial assets and liabilities are categorized as follows: Level 1: fair values are based on unadjusted quoted prices for identical assets or liabilities in active markets. Level 2: fair values are based on quoted prices for similar assets or liabilities in active markets or markets that are not active; or valuation models for which significant inputs are obtained from market-based data that are observable. Level 3: fair values are based on prices or valuation models for which significant inputs to the model are unobservable. Inter-level transfers from one year to another may occur due to changes in market activities affecting the availability of quoted market prices or observable market data. ADB s policy is to recognize transfers in and transfers out of levels as of the end of the reporting period in which they occur. Accounting Estimates The preparation of financial statements in conformity with generally accepted accounting principles requires management to make reasonable estimates and assumptions that affect the reported amounts of assets and liabilities and uncommitted balances as of the end of the year and the reported amounts of revenue and expenses during the year. The actual results could differ from those estimates. Accounting and Reporting Developments In May 2014, the Financial Accounting Standards Board (FASB) issued Accounting Standards Update (ASU) Revenue from Contracts with Customers (Topic 606) to improve financial reporting by creating common revenue recognition guidance for US GAAP and the International Financial Reporting Standards. An entity is required to apply the amendments prospectively for annual reporting periods beginning after 15 December In August 2015, FASB issued ASU deferring the effective date by one year. ADB is currently assessing the impact on CCF s financial statements. In August 2014, the FASB issued ASU Presentation of Financial Statements Going Concern (Subtopic ) to require management to perform interim and annual assessments of an entity s ability to continue as a going concern within one year of the date the financial statements are issued. An entity must provide certain disclosures if conditions or events raise substantial doubt about the entity s ability to continue as a going concern. The ASU applies to all entities and is effective for annual periods ending after 15 December 2016, and interim periods thereafter. This ASU is not expected to impact CCF s financial statements. Statement of Cash Flows For the purposes of the Statement of Cash Flows, CCF considers that its cash and cash equivalents are limited to DUE FROM BANKS, which consists of cash on hand and current accounts in banks used for operational disbursements. NOTE C INVESTMENTS The main investment management objective is to maintain security and liquidity. Subject to these parameters, ADB seeks the highest possible return on its investments. Investments are governed by the Investment Authority approved by the Board of Directors. All investments held as of 31 December 2015 and 2014 were in time deposits.
216 209 CCF-4 continued The annualized rate of return on the average investments held during the period ended 31 December 2015, based on the portfolio held at the beginning and end of each month, was 0.17% (0.14% 2014). Fair Value Disclosure The fair value of INVESTMENTS as of 31 December 2015 and 2014 was as follows: ($ thousand) Fair Value Measurements 31 December 2015 Total Level 1 Level 2 Level 3 Investments Time deposits $ 20,725 $ $ 20,725 $ 31 December 2014 Investments Time deposits $ 26,290 $ $ 26,290 $ ADB maintains documented processes and internal controls to value investment securities. Time deposits are reported at cost, which approximates fair value. NOTE D RELATED PARTY TRANSACTIONS The OCR and Special Funds resources are at all times used, committed, and invested entirely separately from each other. The administrative and operational expenses pertaining to CCF are settled regularly with OCR and the other funds. Regional technical assistance projects and programs may be combined activities financed by Special Funds and trust funds. ADB charges a service fee to cover ADB s incremental cost for the administration, management, supervision and operation of the CCF. The service fee is currently 5% of the amount disbursed for technical assistance and 2% of the amount disbursed for grant components of investment projects. The interfund account balances included in ADVANCES FOR GRANTS AND OTHERS ASSETS and ACCOUNTS PAYABLE AND OTHER LIABILITIES are as follows: ($ thousand) Receivable from: Technical Assistance Special Fund $ 0 $ 37 Agency Trust Funds 0 6 Total $ 0 $ 43 Payable to: Ordinary capital resources $ 118 $ 83 0 = Less than $500.
217 210 CCF-4 continued NOTE E UNDISBURSED COMMITMENTS Undisbursed commitments are denominated in US dollars and represent effective TA not yet disbursed and unliquidated. During 2015, $830,000 ($556, ) representing completed and canceled TA projects were written back as a reduction in technical assistance for the period and the corresponding undisbursed commitment was eliminated. The fair value of undisbursed commitments approximates the amounts outstanding, because ADB expects that disbursements will substantially be made for all the projects/programs covered by the commitments. NOTE F CONTRIBUTIONS AND UNCOMMITTED BALANCES No contributions were received during 2015 and Uncommitted balances comprise amounts which have not been committed by ADB as of 31 December 2015 and These balances include approved TA projects/programs that are not yet effective. NOTE G OTHER FAIR VALUE DISCLOSURES As of 31 December 2015 and 2014, CCF has no assets or liabilities measured at fair value on a nonrecurring basis. See Notes C and E for discussions relating to investments and undisbursed commitments, respectively. In all other cases, the carrying amount of CCF s assets and liabilities is considered to approximate fair value. NOTE H SUBSEQUENT EVENTS ADB has evaluated subsequent events after 31 December 2015 through 11 March 2016, the date these Financial Statements are available for issuance. As a result of this evaluation, there are no subsequent events, as defined, that require recognition or disclosure in the CCF s Financial Statements as of 31 December 2015.
218 211 ASIA PACIFIC DISASTER RESPONSE FUND MANAGEMENT'S REPORT ON INTERNAL CONTROL OVER FINANCIAL REPORTING The management of Asian Development Bank ("ADB") is responsible for establishing and maintaining adequate internal control over financial reporting. ADB's internal control over financial reporting is a process designed to provide reasonable assurance regarding the reliability of financial reporting and the preparation of financial statements for external purposes in accordance with generally accepted accounting principles in the United States of America. ADB's internal control over financial reporting includes those policies and procedures that (i) pertain to the maintenance of records that, in reasonable detail, accurately and fairly reflect the transactions and dispositions of the assets of ADB; (ii) provide reasonable assurance that transactions are recorded as necessary to permit preparation of financial statements in accordance with generally accepted accounting principles in the United States of America, and that receipts and expenditures of ADB are being made only in accordance with authorizations of management and directors of ADB; and (iii) provide reasonable assurance regarding prevention or timely detection and correction of unauthorized acquisition, use, or disposition of ADB's assets that could have a material effect on the financial statements. Because of its inherent limitations, internal control over financial reporting may not prevent or detect misstatements. Also, projections of any evaluation of effectiveness to future periods are subject to the risk that controls may become inadequate because of changes in conditions, or that the degree of compliance with the policies or procedures may deteriorate. ADB's management assessed the effectiveness of ADB's internal control over financial reporting as of 31 December In making this assessment, ADB's management used the criteria set forth by the Committee of Sponsoring Organizations of the Treadway Commission in Internal Control Integrated Framework (2013). Based on that assessment, management believes that as of 31 December 2015, ADB's internal control over financial reporting is effective based upon the criteria established in Internal Control Integrated Framework (2013). Takehiko Nakao President Thierry de Longuemar Vice-President (Finance and Risk Management) Chai S. Kim Controller 11 March 2016
219 212
220 213
221 214
222 215
223 216 APDRF-1 ASIAN DEVELOPMENT BANK ASIA PACIFIC DISASTER RESPONSE FUND STATEMENT OF FINANCIAL POSITION 31 December 2015 and 2014 Expressed in Thousands of US Dollars ASSETS DUE FROM BANKS $ 6,345 $ 4,344 INVESTMENTS (Notes C and G) 11,018 ACCRUED REVENUE 1 ADVANCES FOR GRANTS 10,008 3,729 TOTAL $ 27,372 $ 8,073 LIABILITIES AND UNCOMMITTED BALANCES ACCOUNTS PAYABLE AND OTHER LIABILITIES (Note D) $ 15 $ 14 UNDISBURSED COMMITMENTS (Notes E and G) 10,008 3,729 TOTAL LIABILITIES 10,023 3,743 UNCOMMITTED BALANCES (APDRF-2) (Note F), represented by: Unrestricted net assets 17,349 4,330 TOTAL $ 27,372 $ 8,073 The accompanying notes are an integral part of these financial statements (APDRF-4).
224 217 APDRF-2 ASIAN DEVELOPMENT BANK ASIA PACIFIC DISASTER RESPONSE FUND STATEMENT OF ACTIVITIES AND CHANGES IN NET ASSETS For the Years Ended 31 December 2015 and 2014 Expressed in Thousands of US Dollars CHANGES IN UNRESTRICTED NET ASSETS CONTRIBUTIONS (Note F) $ 20,000 $ REVENUE From investments (Note C) 19 From other sources 4 6 Total 20,023 6 EXPENSES Grants net (Note E) 6, Administrative and financial expenses (Note D) Total 7, INCREASE (DECREASE) IN NET ASSETS 13,019 (327) NET ASSETS AT BEGINNING OF YEAR 4,330 4,657 NET ASSETS AT END OF YEAR $ 17,349 $ 4,330 The accompanying notes are an integral part of these financial statements (APDRF-4).
225 218 APDRF-3 ASIAN DEVELOPMENT BANK ASIA PACIFIC DISASTER RESPONSE FUND STATEMENT OF CASH FLOWS For the Years Ended 31 December 2015 and 2014 Expressed in Thousands of US Dollars CASH FLOWS FROM OPERATING ACTIVITIES Contributions received $ 20,000 $ Interest on investments received 18 Cash received from other sources 4 6 Grants disbursed (6,975) (200) Administrative and financial expenses paid (28) (133) Net Cash Provided by (Used) in Operating Activities 13,019 (327) CASH FLOWS FROM INVESTING ACTIVITIES Maturities of investments 682,322 Purchases of investments (693,340) Net Cash Used in Investing Activities (11,018) Net Increase (Decrease) in Due From Banks 2,001 (327) Due from Banks at Beginning of Year 4,344 4,671 Due from Banks at End of Year $ 6,345 $ 4,344 RECONCILIATION OF INCREASE (DECREASE) IN NET ASSETS TO NET CASH PROVIDED BY (USED IN) OPERATING ACTIVITIES: Increase (Decrease) in net assets (APDRF-2) $ 13,019 $ (327) Adjustments to reconcile increase (decrease) in net assets to net cash provided by (used in) operating activities: Change in accrued revenue (1) Change in advances for grants 6,279 5,771 Change in accounts payable and other liabilities 1 0 Change in undisbursed commitments (6,279) (5,771) Net Cash Provided by (Used in) Operating Activities $ 13,019 $ (327) 0 = Less than $500. The accompanying notes are an integral part of these financial statements (APDRF-4).
226 219 APDRF-4 ASIAN DEVELOPMENT BANK ASIA PACIFIC DISASTER RESPONSE FUND NOTES TO FINANCIAL STATEMENTS 31 December 2015 and 2014 NOTE A NATURE OF OPERATIONS The Asian Development Bank (ADB), a multilateral development financial institution, was established in 1966 with its headquarters in Manila, Philippines. ADB and its operations are governed by the Agreement Establishing the Asian Development Bank (the Charter). Its purpose is to foster economic development and co-operation in Asia and the Pacific region and to contribute to the acceleration of the process of economic development of the developing member countries (DMCs) in the region, collectively and individually. Since 1999, ADB s corporate vision and mission has been to help DMCs reduce poverty in the region. This was reaffirmed under the long-term strategic framework for (Strategy 2020). Under Strategy 2020, ADB s corporate vision continues to be An Asia and Pacific Free of Poverty and its mission has been to help its DMCs reduce poverty and improve living conditions and quality of life. ADB has been pursuing its mission and vision by focusing on three complementary strategic agendas: inclusive growth, environmentally sustainable growth, and regional integration. ADB provides financial and technical assistance for projects and programs, which will contribute to achieve this purpose. These are financed through ordinary capital resources (OCR) and Special Funds. 1 The APDRF was established on 1 April 2009, to provide timely incremental grant resources to DMCs affected by a natural disaster. The APDRF will help bridge the gap between existing ADB arrangements that assist DMCs to reduce disaster risk through hazard mitigation loans and grants, and longer-term postdisaster reconstruction lending. The APDRF will provide quick-disbursing grants to assist DMCs in meeting immediate expenses to restore life-saving services to affected populations following a declared disaster and to augment aid provided by other donors in times of national crisis. Financial assistance will be provided in the form of grants in an amount totaling up to $3,000,000 per event. APDRF s resources may consist of contributions from ADB and other bilateral, multilateral, and individual sources, including companies and foundations. ADB is immune from taxation pursuant to Chapter VIII, Article 56, Exemption from Taxation, of the Charter. NOTE B SUMMARY OF SIGNIFICANT ACCOUNTING POLICIES Presentation of the Financial Statements The financial statements of the APDRF are prepared in accordance with accounting principles generally accepted in the United States of America (US GAAP), and are presented on the basis of those for not-forprofit organizations. APDRF reports donors contributions of cash and other assets as unrestricted assets as these are made available to APDRF without conditions other than for the purpose of pursuing its objectives. Functional and Reporting Currency The US dollar is the functional and reporting currency, representing the currency of the primary economic operating environment of APDRF. 1 Asian Development Fund (ADF), Technical Assistance Special Fund (TASF), Japan Special Fund (JSF), ADB Institute (ADBI), Regional Cooperation and Integration Fund (RCIF), Climate Change Fund (CCF), Asia Pacific Disaster Response Fund (APDRF), and Financial Sector Development Partnership Special Fund (FSDPSF).
227 220 APDRF-4 continued Translation of Currencies ADB adopts the use of daily exchange rates for accounting and financial reporting purposes. This allows transactions denominated in non-us dollar currencies to be translated to the reporting currency using exchange rates applicable at the time of the transactions. Contributions included in the financial statements during the year are recognized at applicable exchange rates as of the respective dates of commitment. At the end of each accounting month, translations of assets, liabilities, and uncommitted balances which are denominated in non-us dollar currencies are adjusted using the applicable rates of exchange at the end of the reporting period. These translation adjustments are accounted for as exchange gains or losses and are credited or charged to operations. Investments All investment securities held by APDRF are reported at fair value. Realized and unrealized gains and losses are included in REVENUE From investments. Interest income on time deposits is recognized as earned and reported in REVENUE From investments. Contributions The contributions from donors and the allocations from net income of OCR are included in the financial statements, from the date of effectivity of the contributions agreement, and the Board of Governors approval, respectively. Technical Assistance, Grants and Undisbursed Commitments Technical assistance (TA) and grants are recognized in the financial statements when the project is approved and becomes effective. Upon completion or cancellation of a TA project or grant, any undisbursed amount is written back as a reduction in TA or grants for the year and the corresponding undisbursed commitment is eliminated accordingly. Advances are provided from TA and grants to the executing agency or co-operating institution, for the purpose of making payments for eligible expenses. The advances are subject to liquidation and charged against undisbursed commitments. Any unutilized portion is required to be returned to the fund. These are included in ADVANCES FOR GRANTS. Fair Value of Financial Instruments ASC 820, Fair Value Measurement defines fair value as the price that would be received to sell an asset or paid to transfer a liability at measurement date in an orderly transaction among willing participants with an assumption that the transaction takes place in the entity s principal market, or in the absence of principal market, in the most advantageous market for the asset or liability. The most advantageous market is the market where the sale of the asset or transfer of liability would maximize the amount received for the asset or minimize the amount paid to transfer the liability. The fair value measurement is not adjusted for transaction costs. Fair Value Hierarchy ASC 820 establishes a fair value hierarchy that gives the highest priority to quoted prices in active markets for identical assets or liabilities (Level 1), next priority to observable market inputs or market corroborated data (Level 2), and the lowest priority to unobservable inputs without market corroborated data (Level 3).
228 221 APDRF-4 continued The fair values of ADB s financial assets and liabilities are categorized as follows: Level 1: fair values are based on unadjusted quoted prices for identical assets or liabilities in active markets. Level 2: fair values are based on quoted prices for similar assets or liabilities in active markets or markets that are not active; or valuation models for which significant inputs are obtained from market-based data that are observable. Level 3: fair values are based on prices or valuation models for which significant inputs to the model are unobservable. Inter-level transfers from one year to another may occur due to changes in market activities affecting the availability of quoted market prices or observable market data. ADB s policy is to recognize transfers in and transfers out of levels as of the end of the reporting period in which they occur. Accounting Estimates The preparation of financial statements in conformity with generally accepted accounting principles requires management to make reasonable estimates and assumptions that affect the reported amounts of assets and liabilities and uncommitted balances as of the end of the year and the reported amounts of revenue and expenses during the year. The actual results could differ from those estimates. Accounting and Reporting Developments In May 2014, the Financial Accounting Standards Board (FASB) issued Accounting Standards Update (ASU) Revenue from Contracts with Customers (Topic 606) to improve financial reporting by creating common revenue recognition guidance for US GAAP and the International Financial Reporting Standards. An entity is required to apply the amendments prospectively for annual reporting periods beginning after 15 December In August 2015, FASB issued ASU deferring the effective date by one year. ADB is currently assessing the impact on APDRF s financial statements. In August 2014, the FASB issued ASU Presentation of Financial Statements Going Concern (Subtopic ) to require management to perform interim and annual assessments of an entity s ability to continue as a going concern within one year of the date the financial statements are issued. An entity must provide certain disclosures if conditions or events raise substantial doubt about the entity s ability to continue as a going concern. The ASU applies to all entities and is effective for annual periods ending after 15 December 2016, and interim periods thereafter. This ASU is not expected to impact APDRF s financial statements. Statement of Cash Flows For the purposes of the Statement of Cash Flows, APDRF considers that its cash and cash equivalents are limited to DUE FROM BANKS, which consists of cash on hand and current accounts in banks used for operational disbursements.
229 222 APDRF-4 continued NOTE C INVESTMENTS The main investment management objective is to maintain security and liquidity. Subject to these parameters, ADB seeks the highest possible return on its investments. Investments are governed by the Investment Authority approved by the Board of Directors. All investments held as of 31 December 2015 were in time deposits. The annualized rate of return on the average investments held during the period ended 31 December 2015, based on the portfolio held at the beginning and end of each month, was 0.20% (nil 2014). Fair Value Disclosure The fair value of INVESTMENTS as of 31 December 2015 was as follows: ($ thousand) Fair Value Measurements Total Level 1 Level 2 Level 3 31 December 2015 Investments Time deposits $ 11,018 $ $ 11,018 $ NOTE D RELATED PARTY TRANSACTIONS The OCR and Special Funds resources are at all times used, committed, and invested entirely separately from each other. The administrative and operational expenses pertaining to APDRF are settled regularly with OCR and the other funds. Regional technical assistance projects and programs may be combined activities financed by Special Funds and trust funds. ADB charges a service fee to cover ADB s cost for the administration, management, supervision and operation of the APDRF. The service fee is currently 2% of the amount disbursed for investment projects. As of 31 December 2015, there was no payable to OCR ($7, ). NOTE E UNDISBURSED COMMITMENTS Undisbursed commitments are denominated in US dollars and represent effective TA and grants not yet disbursed and unliquidated. During 2015, $25,000 (nil 2014) undisbursed amounts were written back from financially completed and/or cancelled grant. The fair value of undisbursed commitments approximates the amounts outstanding, because ADB expects that disbursements will substantially be made for all the projects/programs covered by the commitments. NOTE F CONTRIBUTIONS AND UNCOMMITTED BALANCES In May 2015, $20,000,000 was allocated from OCR s 2014 net income to APDRF. Uncommitted balances comprise amounts which have not been committed by ADB as of 31 December 2015 and 2014.
230 223 APDRF-4 continued NOTE G OTHER FAIR VALUE DISCLOSURES As of 31 December 2015 and 2014, APDRF has no assets or liabilities measured at fair value on a nonrecurring basis. See Notes C and E for discussions relating to investments and undisbursed commitments, respectively. In all other cases, the carrying amount of APDRF s assets and liabilities is considered to approximate fair value. NOTE H SUBSEQUENT EVENTS ADB has evaluated subsequent events after 31 December 2015 through 11 March 2016, the date these Financial Statements are available for issuance. As a result of this evaluation, there are no subsequent events, as defined, that require recognition or disclosure in the APDRF s Financial Statements as of 31 December 2015.
231 224 FINANCIAL SECTOR DEVELOPMENT PARTNERSHIP SPECIAL FUND MANAGEMENT'S REPORT ON INTERNAL CONTROL OVER FINANCIAL REPORTING The management of Asian Development Bank ("ADB") is responsible for establishing and maintaining adequate internal control over financial reporting. ADB's internal control over financial reporting is a process designed to provide reasonable assurance regarding the reliability of financial reporting and the preparation of financial statements for external purposes in accordance with generally accepted accounting principles in the United States of America. ADB's internal control over financial reporting includes those policies and procedures that (i) pertain to the maintenance of records that, in reasonable detail, accurately and fairly reflect the transactions and dispositions of the assets of ADB; (ii) provide reasonable assurance that transactions are recorded as necessary to permit preparation of financial statements in accordance with generally accepted accounting principles in the United States of America, and that receipts and expenditures of ADB are being made only in accordance with authorizations of management and directors of ADB; and (iii) provide reasonable assurance regarding prevention or timely detection and correction of unauthorized acquisition, use, or disposition of ADB's assets that could have a material effect on the financial statements. Because of its inherent limitations, internal control over financial reporting may not prevent or detect misstatements. Also, projections of any evaluation of effectiveness to future periods are subject to the risk that controls may become inadequate because of changes in conditions, or that the degree of compliance with the policies or procedures may deteriorate. ADB's management assessed the effectiveness of ADB's internal control over financial reporting as of 31 December In making this assessment, ADB's management used the criteria set forth by the Committee of Sponsoring Organizations of the Treadway Commission in Internal Control Integrated Framework (2013). Based on that assessment, management believes that as of 31 December 2015, ADB's internal control over financial reporting is effective based upon the criteria established in Internal Control Integrated Framework (2013). Takehiko Nakao President Thierry de Longuemar Vice-President (Finance and Risk Management) Chai S. Kim Controller 11 March 2016

232 225
233 226
234 227
235 228
ASIAN DEVELOPMENT BANK FINANCIAL REPORT MANAGEMENT S DISCUSSION AND ANALYSIS AND ANNUAL FINANCIAL STATEMENTS
 ASIAN DEVELOPMENT BANK FINANCIAL REPORT MANAGEMENT S DISCUSSION AND ANALYSIS AND ANNUAL FINANCIAL STATEMENTS Management s Discussion and Analysis and Annual Financial Statements 31 December 2017 Distribution
FINANCIAL REPORT. Improving lives throughout Asia and the Pacific ASIAN DEVELOPMENT BANK
 Improving lives throughout Asia and the Pacific FINANCIAL REPORT ASIAN DEVELOPMENT BANK MANAGEMENT S DISCUSSION AND ANALYSIS AND ANNUAL FINANCIAL STATEMENTS Management s Discussion and Analysis and Annual
Management s Discussion and Analysis and Condensed Quarterly Financial Statements
 Management s Discussion and Analysis and Condensed Quarterly Financial Statements 31 March 201 (Unaudited) Distribution of this document is restricted until it has been approved by the Board of Directors.
INFORMATION STATEMENT
 INFORMATION STATEMENT The Asian Development Bank (ADB) intends to issue its notes and bonds (Securities) from time to time with maturities and on terms determined by market conditions at the time of sale.
ISBN (Print), (PDF) Publication Stock No. RPS135460
, (PDF) Publication Stock No. RPS135460") ADB FINANCIAL PROFILE 2013 ADB FINANCIAL PROFILE 2013 2013 Asian Development Bank All rights reserved. Published 2013. Printed in the Philippines. ISBN 978-92-9092-999-4 (Print), 978-92-9254-034-0 (PDF)
ADB FINANCIAL PROFILE 2013 ADB FINANCIAL PROFILE 2013 2013 Asian Development Bank All rights reserved. Published 2013. Printed in the Philippines. ISBN 978-92-9092-999-4 (Print), 978-92-9254-034-0 (PDF)
ADB FINANCIAL PROFILE 2012
 ADB FINANCIAL PROFILE 2012 ADB FINANCIAL PROFILE 2012 2012 Asian Development Bank All rights reserved. Published 2012. Printed in the Philippines. ISBN 978-92-9092-644-3 (Print), 978-92-9092-645-0 (PDF)
Statement of the Asian Development Bank s Operations in 2017
 February 208 Statement of the Asian Development Bank s Operations in 207 This document is being disclosed to the public in accordance with ADB s Public Communications Policy 20. I. OVERVIEW OF OPERATIONS.
A History of financial MAnAgeMent At the AsiAn DevelopMent BAnk. Engineering Financial Innovation and Impact on an Emerging Asia
 A History of financial MAnAgeMent At the AsiAn DevelopMent BAnk Engineering Financial Innovation and Impact on an Emerging Asia A HISTORY OF FINANCIAL MANAGEMENT AT THE ASIAN DEVELOPMENT BANK Engineering
International Bank for Reconstruction and Development
 Information Statement International Bank for Reconstruction and Development 13AUG200501453077 The International Bank for Reconstruction and Development (IBRD) intends from time to time to issue its notes
OPERATIONS MANUAL BANK POLICIES (BP) These policies were prepared for use by ADB staff and are not necessarily a complete treatment of the subject.
 These policies were prepared for use by ADB staff and are not necessarily a complete treatment of the subject.") Page 1 of 4 These policies were prepared for use by ADB staff and are not necessarily a complete treatment of the subject. A. Introduction FOREIGN EXCHANGE RISK 1. Article 13 of the Agreement Establishing
Page 1 of 4 These policies were prepared for use by ADB staff and are not necessarily a complete treatment of the subject. A. Introduction FOREIGN EXCHANGE RISK 1. Article 13 of the Agreement Establishing
Policy Paper. March Establishing the Project Design Facility
 Policy Paper March 2011 Establishing the Project Design Facility ABBREVIATIONS ADB Asian Development Bank ADF Asian Development Fund COBP country operations business plan DMC developing member country
ADB Financial Products
 ADB Financial Products ADB Financial Products Contents 1 Introduction 3 9 13 16 19 21 23 LIBOR-based Loan Product Local Currency Loan Product Debt Management Products Term Sheet: LIBOR-based Loan and
International Bank for Reconstruction and Development
 International Bank for Reconstruction and Development Management s Discussion & Analysis and Financial Statements June 30, 2014 SECTION I: EXECUTIVE SUMMARY 5 IBRD and the New World Bank Group Strategy
ADB s Local Currency Loan Product. Responding to Borrowers Evolving Needs
 ADB s Local Currency Loan Product Responding to Borrowers Evolving Needs Contents Introduction v Rationale for the Local Currency Loan Product 1 Eligible Borrowers 4 Main Features of the Local Currency
OPERATIONS MANUAL BANK POLICIES AND PROCEDURES NONSOVEREIGN OPERATIONS
 Page 1 of 7 These policies and procedures were prepared for use by ADB staff and are not necessarily a complete treatment of the subject. This Operations Manual is issued by the Strategy and Policy Department
Establishment of the Leading Asia s Private Sector Infrastructure Fund
 March 2016 Establishment of the Leading Asia s Private Sector Infrastructure Fund This document is being disclosed to the public prior to Board consideration in accordance with ADB s Public Communications
International Bank for Reconstruction and Development
 International Bank for Reconstruction and Development Management s Discussion & Analysis and Condensed Quarterly Financial Statements December 31, 2014 (Unaudited) I N T E R N A T I O N A L B A N K F
International Bank for Reconstruction and Development
 International Bank for Reconstruction and Development Public Disclosure Authorized Public Disclosure Authorized Public Disclosure Authorized Public Disclosure Authorized Management s Discussion & Analysis
Annual Report 2016 Financial Statements
 Annual Report 2016 Financial Statements Letter of Transmittal As required by the By-Laws of the Inter-American Development Bank, the Board of Executive Directors hereby submits to the Board of Governors
International Bank for Reconstruction and Development
 International Bank for Reconstruction and Development Management s Discussion & Analysis and Condensed Quarterly Financial Statements September 30, 2017 (Unaudited) Management s Discussion and Analysis
INTERNATIONAL FINANCE CORPORATION
 Management s Discussion and Analysis and Condensed Consolidated Financial Statements September 30, 2010 Page 2 MANAGEMENT S DISCUSSION AND ANALYSIS September 30, 2010 Contents Page I Overview... 3 II Financial
INTERNATIONAL FINANCE CORPORATION
 Management s Discussion and Analysis and Condensed Consolidated Financial Statements December 31, 2010 Page 2 MANAGEMENT S DISCUSSION AND ANALYSIS December 31, 2010 Contents Page I Overview... 3 II Financial
FINANCIAL PROFILE Asian Development Bank
 FINANCIAL PROFILE Asian Development Bank 2001 49 CONTENTS Page Introduction... 1 Capital Structure... 6 Borrowing Operations...10 Financial Risk Management...23 Results of Operations...29 Lending Operations
Establishment of the High-Level Technology Fund
 April 2017 Establishment of the High-Level Technology Fund Distribution of this document is restricted until it has been approved by Management. Following such approval, ADB will disclose the document
International Bank for Reconstruction and Development
 International Bank for Reconstruction and Development Management s Discussion & Analysis and Condensed Quarterly Financial Statements September 30, 2014 (Unaudited) I NTERNATIONAL B ANK FOR R ECONSTRUCTION
Asian Development Bank
 Asian Development Bank FIGHTING POVERTY IN ASIA AND THE PACIFIC Bretton Woods: Multilateral Roundtable Discussion by Thierry de Longuemar Vice President for Finance and Risk Management 15 February 2013
International Bank for Reconstruction and Development
 International Bank for Reconstruction and Development Management s Discussion & Analysis and Condensed Quarterly Financial Statements December 31, 2018 (Unaudited) Management s Discussion and Analysis
Inter-American Development Bank. Ordinary Capital
 Inter-American Development Bank Ordinary Capital Management s Discussion and Analysis and Condensed Quarterly Financial Statements September 30, 2017 (Unaudited) TABLE OF CONTENTS MANAGEMENT S DISCUSSION
International Bank for Reconstruction and Development
 International Bank for Reconstruction and Development Management s Discussion & Analysis and Condensed Quarterly Financial Statements December 31, 2016 (Unaudited) I N T E R N A T I O N A L B A N K F
International Bank for Reconstruction and Development
 International Bank for Reconstruction and Development Management s Discussion & Analysis and Condensed Quarterly Financial Statements September 30, 2009 (Unaudited) INTERNATIONAL BANK FOR RECONSTRUCTION
International Development Association. Management s Discussion & Analysis and Condensed Quarterly Financial Statements March 31, 2018 (Unaudited)
") International Development Association Management s Discussion & Analysis and Condensed Quarterly Financial Statements March 31, 2018 (Unaudited) International Development Association (IDA) Contents March
International Development Association Management s Discussion & Analysis and Condensed Quarterly Financial Statements March 31, 2018 (Unaudited) International Development Association (IDA) Contents March
Management s Discussion and Analysis and Condensed Consolidated Financial Statements March 31, 2018 (Unaudited)
") Management s Discussion and Analysis and Condensed Consolidated Financial Statements March 31, 2018 (Unaudited) Page 2 Management s Discussion and Analysis March 31, 2018 CONTENTS Page I Introduction...
Management s Discussion and Analysis and Condensed Consolidated Financial Statements March 31, 2018 (Unaudited) Page 2 Management s Discussion and Analysis March 31, 2018 CONTENTS Page I Introduction...
INTERNATIONAL FINANCE CORPORATION
 Management s Discussion and Analysis And Consolidated Financial Statements June 30, 2010 Page 2 MANAGEMENT S DISCUSSION AND ANALYSIS June 30, 2010 Contents Page I Overview... 3 II Financial Summary...
International Bank for Reconstruction and Development
 International Bank for Reconstruction and Development Management s Discussion & Analysis and Financial Statements June 30, 2017 Contents I: Executive Summary 2 3 II: Overview 4 4 4 5 8 III: Financial
OPERATIONS MANUAL BANK POLICIES (BP) These policies were prepared for use by ADB staff and are not necessarily a complete treatment of the subject.
 These policies were prepared for use by ADB staff and are not necessarily a complete treatment of the subject.") OM Section H5/BP Page 1 of 4 BANK POLICIES (BP) These policies were prepared for use by ADB staff and are not necessarily a complete treatment of the subject. A. Introduction ADDITIONAL FINANCING 1. The
OM Section H5/BP Page 1 of 4 BANK POLICIES (BP) These policies were prepared for use by ADB staff and are not necessarily a complete treatment of the subject. A. Introduction ADDITIONAL FINANCING 1. The
International Bank for Reconstruction and Development
 International Bank for Reconstruction and Development Management s Discussion & Analysis and Condensed Quarterly Financial Statements March 31, 2017 (Unaudited) I NT ERNAT I O NAL BANK F O R R ECONST
Management s Discussion and Analysis and Condensed Consolidated Financial Statements December 31, 2017 (Unaudited)
") Management s Discussion and Analysis and Condensed Consolidated Financial Statements December 31, 2017 (Unaudited) Page 2 Management s Discussion and Analysis December 31, 2017 CONTENTS Page I Introduction...
Management s Discussion and Analysis and Condensed Consolidated Financial Statements December 31, 2017 (Unaudited) Page 2 Management s Discussion and Analysis December 31, 2017 CONTENTS Page I Introduction...
International Bank for Reconstruction and Development
 International Bank for Reconstruction and Development Management s Discussion & Analysis and Condensed Quarterly Financial Statements December 31, 2017 (Unaudited) Management s Discussion and Analysis
Information Statement. Inter-American Development Bank
 Information Statement Inter-American Development Bank The Inter-American Development Bank (Bank or IADB) intends from time to time to issue its debt securities with maturities and on terms based on market
Policy on Loans with Sovereign Guarantee. New Development Bank Policy on Loans with Sovereign Guarantee
 New Development Bank Policy on Loans with Sovereign Guarantee Owner: Operations Division Approved Date: January 21, 2016 Change Log Revision Date Chapter revised Revision Details November 2016 See separate
MARKET-BASED PROJECT COFINANCING
 Distribution: Restricted EB 2000/71/R.10 1 November 2000 Original: English Agenda Item 6 English IFAD Executive Board Seventy-First Session Rome, 6-7 December 2000 MARKET-BASED PROJECT COFINANCING I. INTRODUCTION
BALANCE SHEET AS AT DECEMBER 31, 2014 (UA thousands Note B)
") Chapter 7 African Development Bank BALANCE SHEET AS AT DECEMBER 31, 2014 (UA thousands Note B) ASSETS 2014 2013 CASH 406,709 954,133 DEMAND OBLIGATIONS 3,801 3,801 SECURITIES PURCHASED UNDER RESALE AGREEMENTS
Chapter 7 African Development Bank BALANCE SHEET AS AT DECEMBER 31, 2014 (UA thousands Note B) ASSETS 2014 2013 CASH 406,709 954,133 DEMAND OBLIGATIONS 3,801 3,801 SECURITIES PURCHASED UNDER RESALE AGREEMENTS
International Bank for Reconstruction and Development
 International Bank for Reconstruction and Development Management s Discussion & Analysis and Condensed Quarterly Financial Statements 2010 (Unaudited) INTERNATIONAL BANK FOR RECONSTRUCTION AND DEVELOPMENT
International Development Association. Management s Discussion & Analysis and Condensed Quarterly Financial Statements December 31, 2017 (Unaudited)
") International Development Association Management s Discussion & Analysis and Condensed Quarterly Financial Statements December 31, 2017 (Unaudited) Management s Discussion and Analysis I N T E R N A T
International Development Association Management s Discussion & Analysis and Condensed Quarterly Financial Statements December 31, 2017 (Unaudited) Management s Discussion and Analysis I N T E R N A T
Information Statement International Bank for Reconstruction and Development
 Information Statement International Bank for Reconstruction and Development The International Bank for Reconstruction and Development (IBRD) intends from time to time to issue its notes and bonds with
THIRD QUARTER INTERIM UNAUDITED Condensed Consolidated Financial Statements and Notes
 THIRD QUARTER 2015 INTERIM UNAUDITED Condensed Consolidated Financial Statements and Notes November 5, 2015 CONSOLIDATED STATEMENT OF FINANCIAL POSITION Unaudited, December 31, (Canadian dollars in millions)
International Bank for Reconstruction and Development
 International Bank for Reconstruction and Development Management s Discussion & Analysis and Condensed Quarterly Financial Statements September 30, 2018 (Unaudited) Management s Discussion and Analysis
Husky Injection Molding Systems Ltd. For the year ending July 31, 2004
 Husky Injection Molding Systems Ltd. For the year ending July 31, 2004 TSX/S&P Industry Class = 20 2004 Annual Revenue = Canadian $1,007.0 million (translated from U.S. dollars at US$1 = Cdn $1.3015) 2004
Annual Report 2015 Financial Statements
 Annual Report 2015 Financial Statements Letter of Transmittal As required by the By-Laws of the Inter-American Development Bank, the Board of Executive Directors hereby submits to the Board of Governors
AFRICAN EXPORT-IMPORT BANK
 BANQUE AFRICAINE D IMPORT-EXPORT (AFREXIMBANK) ` REVIEW OF OPERATING RESULTS AND FINANCIAL STATEMENTS FOR THE INTERIM PERIOD ENDED 30 JUNE 2017 REVIEW OF OPERATING RESULTS FOR THE SIX MONTHS ENDED 30 JUNE
OPERATIONAL POLICY ON FINANCING
 OPERATIONAL POLICY ON FINANCING January 2016 (updated March 21, 2017) I. PURPOSE; CONTENTS 1.1. Purpose. The purpose of this Operational Policy on Financing (Policy) is to set out the Bank s policy on
Condensed Quarterly Financial Statements
 Condensed Quarterly Financial Statements U N A U D I T E D March 31, 2018 MIGA Condensed Quarterly Financial Statements (Unaudited) Table of Contents Condensed Balance Sheets...1 Condensed Statements of
PROLOGIS FORM 10-Q. (Quarterly Report) Filed 05/05/10 for the Period Ending 03/31/10
 Filed 05/05/10 for the Period Ending 03/31/10") PROLOGIS FORM 10-Q (Quarterly Report) Filed 05/05/10 for the Period Ending 03/31/10 Address 4545 AIRPORT WAY DENVER, CO 80239 Telephone 3033759292 CIK 0000899881 Symbol PLD SIC Code 6798 - Real Estate
PROLOGIS FORM 10-Q (Quarterly Report) Filed 05/05/10 for the Period Ending 03/31/10 Address 4545 AIRPORT WAY DENVER, CO 80239 Telephone 3033759292 CIK 0000899881 Symbol PLD SIC Code 6798 - Real Estate
ASIAN INFRASTRUCTURE INVESTMENT BANK CONDENSED INTERIM FINANCIAL STATEMENTS FOR THE NINE MONTHS ENDED SEPTEMBER 30, 2017 (UNAUDITED)
") CONDENSED INTERIM FINANCIAL STATEMENTS FOR THE NINE MONTHS ENDED SEPTEMBER 30, 2017 (UNAUDITED) CONTENTS CONDENSED INTERIM FINANCIAL STATEMENTS Condensed Statement of Comprehensive Income... 1 Condensed
CONDENSED INTERIM FINANCIAL STATEMENTS FOR THE NINE MONTHS ENDED SEPTEMBER 30, 2017 (UNAUDITED) CONTENTS CONDENSED INTERIM FINANCIAL STATEMENTS Condensed Statement of Comprehensive Income... 1 Condensed
Country Operations Business Plan. Fiji September 2017
 Country Operations Business Plan September 2017 Fiji 2018 2020 This document is being disclosed to the public in accordance with ADB's Public Communications Policy 2011. CURRENCY EQUIVALENTS (as of 13
THE UNIVERSITY OF WESTERN ONTARIO COMBINED FINANCIAL STATEMENTS APRIL 30, 2018
 COMBINED FINANCIAL STATEMENTS APRIL 30, 2018 SUMMARY OF REVENUES AND EXPENSES Total Revenues and Expenses For the year ended April 30, 2018 (millions of dollars) 2014 2015 2016 2017 2018 $ $ $ $ $ Revenues
Loan Accounting Division Financial Control Department. Version : African Development Bank Group
 D e b t S e r v i c i n g H a n d b o o k Loan Accounting Division Financial Control Department Version : 2011 African Development Bank Group D e b t S e r v i c i n g H a n d b o o k African Development
African Development Bank
 Financial Statements Three months ended 31 March 2016 Balance Sheet 1-2 Income Statement 3 Statement of Comprehensive Income 4 Statement of Changes in Equity 5 Statement of Cash Flows 6 Notes to the Financial
Unlocking Investment in Transport Infrastructure: The role of ADB
 Unlocking Investment in Transport Infrastructure: The role of ADB Asian Highway Investment Forum 8 October, 2013 Hideaki Iwasaki Principal Infrastructure Specialist Asian Development Bank Asian Development
Audited Financial Statements as of December 31, 2014 and 2013
 Audited Financial Statements as of December 31, 2014 and 2013 2014 ANNUAL REPORT cover Independent Auditors Report The Board of Governors Inter-American Investment Corporation: We have audited the accompanying
CISCO SYSTEMS, INC. (Exact name of Registrant as specified in its charter)
") UNITED STATES SECURITIES AND EXCHANGE COMMISSION WASHINGTON, D.C. 20549 (Mark one) FORM 10-Q QUARTERLY REPORT PURSUANT TO SECTION 13 OR 15(d) OF THE SECURITIES EXCHANGE ACT OF 1934 For the quarterly period
UNITED STATES SECURITIES AND EXCHANGE COMMISSION WASHINGTON, D.C. 20549 (Mark one) FORM 10-Q QUARTERLY REPORT PURSUANT TO SECTION 13 OR 15(d) OF THE SECURITIES EXCHANGE ACT OF 1934 For the quarterly period
Condensed Consolidated Financial Statements of CEQUENCE ENERGY LTD. September 30, 2018 and 2017
 Condensed Consolidated Financial Statements of CEQUENCE ENERGY LTD. 2018 and 2017 Condensed Consolidated Balance Sheets (Unaudited)(Expressed in thousands of Canadian dollars) 2018 December 31, 2017 ASSETS
Second Quarter INTERIM UNAUDITED Condensed Consolidated Financial Statements and Notes
 Second Quarter 2015 INTERIM UNAUDITED Condensed Consolidated Financial Statements and Notes August 12, 2015 CONSOLIDATED STATEMENT OF FINANCIAL POSITION Unaudited, December 31, (Canadian dollars in millions)
Country Operations Business Plan. Georgia September 2018
 Country Operations Business Plan September 2018 Georgia 2019 2021 This document is being disclosed to the public in accordance with ADB s Public Communications Policy 2011. CURRENCY EQUIVALENTS (as of
Condensed Quarterly Financial Statements
 Condensed Quarterly Financial Statements U N A U D I T E D September 30, 2015 MIGA Condensed Quarterly Financial Statements (Unaudited) Table of Contents Condensed Balance Sheet... 1 Condensed Statement
Notes to Consolidated Financial Statements Kubota Corporation and Subsidiaries Years Ended March 31, 2002, 2001, and 2000
 Notes to Consolidated Financial Statements Kubota Corporation and Subsidiaries Years Ended March 31, 2002, 2001, and 2000 1. SUMMARY OF SIGNIFICANT ACCOUNTING POLICIES Basis of Financial Statements The
Alberta Heritage Savings Trust Fund Room 434, Street Edmonton, Alberta TKK 2C3. Phone: (780)
") Alberta Heritage Savings Trust Fund Room 434, 9515-107 Street Edmonton, Alberta TKK 2C3 Phone: (780) 427-5364 SECOND Q U A R T E R U P D A T E SEPTEMBER 30, 2005 Alberta Heritage Savings Trust Fund QUARTER
Alberta Heritage Savings Trust Fund Room 434, 9515-107 Street Edmonton, Alberta TKK 2C3 Phone: (780) 427-5364 SECOND Q U A R T E R U P D A T E SEPTEMBER 30, 2005 Alberta Heritage Savings Trust Fund QUARTER
INTERNATIONAL FINANCE CORPORATION
 Management s Discussion and Analysis and Condensed Consolidated Financial Statements September 30, 2013 (Unaudited) Page 2 Management s Discussion and Analysis September 30, 2013 Contents Page I Introduction...
International Bank for Reconstruction and Development
 International Bank for Reconstruction and Development Public Disclosure Authorized Public Disclosure Authorized Public Disclosure Authorized Public Disclosure Authorized Management s Discussion & Analysis
THE KAGOSHIMA BANK, LTD. and consolidated subsidiaries
 THE KAGOSHIMA BANK, LTD. and consolidated subsidiaries Consolidated Financial Statements for the Year Ended March 31, 2013, and Independent Auditor s Report THE KAGOSHIMA BANK, LTD. and Consolidated Subsidiaries
Increasing impact The year in review 2006
 Colin J. Warren Increasing impact The year in review 2006 International Finance Corporation 2006 Annual Report volume 2 Volume 2 Contents Management s Discussion and Analysis 2 Responsibility for External
Guarantees As a means of stimulating additional private sector investments in Low-Income Countries (LICs), the ADF Partial Risk
, the ADF Partial Risk") Chapter 6 African Development Fund THE AFRICAN DEVELOPMENT FUND FINANCIAL MANAGEMENT Subscriptions ADF Replenishments The resources of the African Development Fund (the ADF or the Fund) primarily consist
Chapter 6 African Development Fund THE AFRICAN DEVELOPMENT FUND FINANCIAL MANAGEMENT Subscriptions ADF Replenishments The resources of the African Development Fund (the ADF or the Fund) primarily consist
Nauru Country Operations Business Plan. August 2015
 Country Operations Business Plan August 2015 Nauru 2016 2018 This document is being disclosed to the public in accordance with ADB s Public Communications Policy 2011. CURRENCY EQUIVALENTS (as of 1 July
Management s Discussion and Analysis and Condensed Consolidated Financial Statements September 30, 2016 (Unaudited)
") Management s Discussion and Analysis and Condensed Consolidated Financial Statements September 30, 2016 (Unaudited) Page 2 Management s Discussion and Analysis September 30, 2016 Contents Page I Introduction...
Management s Discussion and Analysis and Condensed Consolidated Financial Statements September 30, 2016 (Unaudited) Page 2 Management s Discussion and Analysis September 30, 2016 Contents Page I Introduction...
Policy Paper. November 2016
 Policy Paper November 2016 Ordinary Operations (Concessional) Loan Regulations and Revised Ordinary Operations Loan Regulations, Special Operations Grant Regulations, and Externally Financed Grant Regulations
International Development Association. Management s Discussion & Analysis and Condensed Quarterly Financial Statements December 31, 2016 (Unaudited)
") International Development Association Management s Discussion & Analysis and Condensed Quarterly Financial Statements December 31, 2016 (Unaudited) I NT ERNAT I O NAL DEVELO P ME NT A S SO CIAT I O N
International Development Association Management s Discussion & Analysis and Condensed Quarterly Financial Statements December 31, 2016 (Unaudited) I NT ERNAT I O NAL DEVELO P ME NT A S SO CIAT I O N
Consolidated Financial Statements. Element Financial Corporation December 31, 2013
 Consolidated Financial Statements Element Financial Corporation INDEPENDENT AUDITORS' REPORT To the Shareholders of Element Financial Corporation We have audited the accompanying consolidated financial
Alberta Heritage Savings Trust Fund. SECOND QUARTER UPDATE For the six months ended September 30, 2008
 Alberta Heritage Savings Trust Fund SECOND QUARTER UPDATE For the six months ended September 30, 2008 Alberta Finance and Enterprise Alberta Heritage Savings Trust Fund September 30, 2008 C O N T E N T
Country Operations Business Plan. Fiji October 2016
 1 Country Operations Business Plan October 2016 Fiji 2017 2019 This document is being disclosed to the public in accordance with ADB's Public Communications Policy 2011. CURRENCY EQUIVALENTS (as of 29
Unaudited Condensed Consolidated Interim Financial Statements. Element Financial Corporation As at and for the three months ended March 31, 2013
 Unaudited Condensed Consolidated Interim Financial Statements Element Financial Corporation As at and for the three months ended CONSOLIDATED INTERIM STATEMENTS OF FINANCIAL POSITION [unaudited, in thousands
Management s Discussion and Analysis and Condensed Consolidated Financial Statements September 30, 2017 (Unaudited)
") Management s Discussion and Analysis and Condensed Consolidated Financial Statements September 30, 2017 (Unaudited) Page 2 Management s Discussion and Analysis September 30, 2017 CONTENTS Page I Introduction...
Management s Discussion and Analysis and Condensed Consolidated Financial Statements September 30, 2017 (Unaudited) Page 2 Management s Discussion and Analysis September 30, 2017 CONTENTS Page I Introduction...
Harley-Davidson, Inc. (Exact name of registrant as specified in its charter)
") UNITED STATES SECURITIES AND EXCHANGE COMMISSION WASHINGTON, D. C. 20549 FORM 10-Q x QUARTERLY REPORT PURSUANT TO SECTION 13 OR 15(d) OF THE SECURITIES EXCHANGE ACT OF 1934 For the quarterly period ended
UNITED STATES SECURITIES AND EXCHANGE COMMISSION WASHINGTON, D. C. 20549 FORM 10-Q x QUARTERLY REPORT PURSUANT TO SECTION 13 OR 15(d) OF THE SECURITIES EXCHANGE ACT OF 1934 For the quarterly period ended
Review of ADB s Lending Instruments for Crisis Response
 Policy Paper June 2016 Review of ADB s Lending Instruments for Crisis Response Distribution of this document is restricted until it has been approved by the Board of Directors. Following such approval,
International Development Association. Management s Discussion & Analysis and Condensed Quarterly Financial Statements September 30, 2017 (Unaudited)
") International Development Association Management s Discussion & Analysis and Condensed Quarterly Financial Statements September 30, 2017 (Unaudited) I NTERNATIONAL D EVELOPMENT A SSOCIATION (IDA) C ONTENTS
International Development Association Management s Discussion & Analysis and Condensed Quarterly Financial Statements September 30, 2017 (Unaudited) I NTERNATIONAL D EVELOPMENT A SSOCIATION (IDA) C ONTENTS
INTER-AMERICAN INVESTMENT CORPORATION Condensed Financial Statements (Unaudited) March 31, 2018
 March 31, 2018") Condensed Financial Statements (Unaudited) March 31, 2018 BALANCE SHEET (Unaudited) USD Thousands March 31, 2018 December 31, 2017 ASSETS Cash and cash equivalents $ 20,542 $ 20,755 Investment securities
Condensed Financial Statements (Unaudited) March 31, 2018 BALANCE SHEET (Unaudited) USD Thousands March 31, 2018 December 31, 2017 ASSETS Cash and cash equivalents $ 20,542 $ 20,755 Investment securities
Condensed Quarterly Financial Statements
 Condensed Quarterly Financial Statements U N A U D I T E D September 30, 2016 MIGA Condensed Quarterly Financial Statements (Unaudited) Table of Contents Condensed Balance Sheet... 1 Condensed Statement
Interim condensed consolidated financial statements. ECN Capital Corp. March 31, 2017
 Interim condensed consolidated financial statements ECN Capital Corp. Interim condensed consolidated statements of financial position [unaudited, in thousands of Canadian dollars] As at As at March 31,
Financial Section Consolidated Statements of Cash Flows
 Consolidated Statements of Cash Flows Years Ended March 31, and Cash flows from operating activities: Income before income taxes and other items Adjustments to reconcile income before income taxes and
FROM BILLIONS TO TRILLIONS:
 98023 FROM BILLIONS TO TRILLIONS: MDB Contributions to Financing for Development In 2015, the international community is due to agree on a new set of comprehensive and universal sustainable development
MANAGEMENT S RESPONSIBILITY FOR FINANCIAL REPORTING
 MANAGEMENT S RESPONSIBILITY FOR FINANCIAL REPORTING The accompanying financial statements have been prepared by RBC Global Asset Management Inc. ( RBC GAM ) as manager of the RBC Corporate Class Funds
Financial Section Consolidated Statements of Cash Flows
 Consolidated Statements of Cash Flows Years Ended March 31, 2004 and Cash flows from operating activities: Income before income taxes and other items Adjustments to reconcile income before income taxes
NOTES TO CONSOLIDATED FINANCIAL STATEMENTS 1. SUMMARY OF SIGNIFICANT ACCOUNTING POLICIES
 NOTES TO CONSOLIDATED FINANCIAL STATEMENTS Kubota Corporation and Subsidiaries Years Ended March 31, 2000, 1999, and 1998 1. SUMMARY OF SIGNIFICANT ACCOUNTING POLICIES Basis of Financial Statements The
Latvian Credit Union Limited Financial Statements For the year ended March 31, 2015
 Financial Statements Table of Contents Page Management s Responsibility 1 Independent Auditors Report 2 Financial Statements Statement of Financial Position 3 Statement of Comprehensive Income 4 Statement
Financial Statements April 30, 2014
 Financial Statements April 30, 2014 IMF Financial Statements 2014 General Department Independent Auditors Report 4 Consolidated statements of financial position 5 Consolidated statements of comprehensive
International Finance Corporation
 Information Statement International Finance Corporation I N T E R N A T I O N A L C O R P O R A T I O N F I N A N C E International Finance Corporation ( IFC or the Corporation ) intends from time to time
Condensed Quarterly Financial Statements
 Condensed Quarterly Financial Statements U N A U D I T E D December 31, 2017 MIGA Condensed Quarterly Financial Statements (Unaudited) Table of Contents Condensed Balance Sheets...1 Condensed Statements
Management s Discussion and Analysis and Condensed Consolidated Financial Statements September 30, 2018 (Unaudited)
") Management s Discussion and Analysis and Condensed Consolidated Financial Statements September 30, 2018 (Unaudited) Page 2 Management s Discussion and Analysis September 30, 2018 CONTENTS Page I Introduction...
Management s Discussion and Analysis and Condensed Consolidated Financial Statements September 30, 2018 (Unaudited) Page 2 Management s Discussion and Analysis September 30, 2018 CONTENTS Page I Introduction...
UNITED STATES SECURITIES AND EXCHANGE COMMISSION. Washington, D.C FORM 10-Q
 UNITED STATES SECURITIES AND EXCHANGE COMMISSION Washington, D.C. 20549 FORM 10-Q QUARTERLY REPORT PURSUANT TO SECTION 13 OR 15(d) OF THE SECURITIES EXCHANGE ACT OF 1934 For the quarterly period ended
First Quarter 2014 Interim Unaudited Condensed Consolidated Financial Statements and Notes
 First Quarter 2014 Interim Unaudited May 15, 2014 CONSOLIDATED STATEMENT OF FINANCIAL POSITION Unaudited March 31, (Canadian dollars in millions) 2014 ASSETS Current December 31, 2013 Cash and cash equivalents
Consolidated Financial Statements
 Consolidated Financial Statements For the Year Ended April 30 Our mission is to create the premier university environment for our students, faculty and staff in which to learn, work and live. 2015 TABLE