MANAGEMENT S DISCUSSION AND ANALYSIS AND CONSOLIDATED FINANCIAL STATEMENTS
|
|
|
- Linda Wilkerson
- 6 years ago
- Views:
Transcription


1 MANAGEMENT S DISCUSSION AND ANALYSIS AND CONSOLIDATED FINANCIAL STATEMENTS For the Years Ended December 31, 2017 and 2016
2 Page left intentionally blank.
3 TABLE OF CONTENTS OVERVIEW...5 Continuing Operations - Financial Overview...6 FINANCIAL AND OPERATING HIGHLIGHTS Compared with Q Compared with Q Fourth Quarter 2017 Sequential Overview Significant Events...7 BUSINESS ENVIRONMENT OUTLOOK...8 Capital Expenditures...9 Primary Objectives...9 CONTINUING OPERATIONS - COMPARATIVE QUARTERLY INCOME STATEMENTS Sales Mix...10 Fourth Quarter 2017 Overview (Compared to Prior Year)...11 Fourth Quarter 2017 Other Expenses and Income (Compared to Prior Year)...11 Fourth Quarter 2017 Summary (Compared with Third Quarter 2017)...12 FOURTH QUARTER DISCONTINUED OPERATIONS (COMPARED TO PRIOR YEAR)...12 CONTINUING OPERATIONS - COMPARATIVE ANNUAL INCOME STATEMENTS Overview (Compared to Prior Year)...13 Overall Results Summary Other Expenses and Income (Compared to Prior Year)...14 ANNUAL DISCONTINUED OPERATIONS (COMPARED TO PRIOR YEAR)...15 LIQUIDITY, CAPITAL RESOURCES AND FUTURE OPERATIONS...15 Working Capital and Cash Requirements...15 Operating Activities...15 Investing Activities...15 Capital Expenditures...15 Financing Activities...15 Other Commitments and Contingencies...16 INVESTMENTS IN KEANE...17 SUMMARY OF QUARTERLY RESULTS FINANCIAL INSTRUMENTS Off-Balance Sheet Arrangements...19 ACCOUNTING POLICIES AND ESTIMATES...19 Critical Accounting Estimates and Judgments...19 Key Sources of Estimation Uncertainty...19 Judgments...19 Estimates...19 MD&A Years Ended December 31, 2017 &
4 BUSINESS RISKS Credit Risk and Dependence on Major Customers...21 Integration Risk...21 Transportation Risk Specific to Canadian Oil and Natural Gas Prices Trading Below North American Pricing Index...21 CONTROLS AND PROCEDURES Disclosure Controls and Procedures...21 Internal Control Over Financial Reporting...21 TRICAN ESTIMATED COMBINED FINANCIAL RESULTS...22 NON-GAAP DISCLOSURE...23 Consolidated Gross Income / (Loss) to Adjusted Consolidated Operating Income / (Loss) Adjusted Administrative Expenses...24 Other Non-Standard Financial Terms...24 COMMON INDUSTRY TERMS...25 FORWARD-LOOKING STATEMENTS MANAGEMENT'S RESPONSIBILITY FOR FINANCIAL STATEMENTS INDEPENDENT AUDITORS' REPORT...30 CONSOLIDATED STATEMENTS OF FINANCIAL POSITION CONSOLIDATED STATEMENTS OF COMPREHENSIVE INCOME / (LOSS) CONSOLIDATED STATEMENTS OF CHANGES IN EQUITY CONSOLIDATED STATEMENTS OF CASH FLOWS...34 NOTES TO THE CONSOLIDATED FINANCIAL STATEMENTS Note 1 - Nature of Business, Future Operations & Basis of Presentation Note 2 - Significant Accounting Policies...37 Note 3 - Business Combination...43 Note 4 - Assets Held for Sale and Discontinued Operations...44 Note 5 - Cash and Cash Equivalents Note 6 - Trade and Other Receivables Note 7 - Inventory Note 8 - Property and Equipment...47 Note 9 - Intangible Assets and Goodwill Note 10 - Trade and Other Payables Note 11 - Loans and Borrowings Note 12 - Share Capital and Accumulated Other Comprehensive Loss...51 Note 13 - Earnings / (Loss) Per Share Note 14 - Share-Based Payments Note 15 - Cost of Sales and Administrative Expenses...55 Note 16 - Annual Impairment Assessment Note 17 - Income Taxes Note 18 - Financial Instruments Note 19 - Capital Management...64 Note 20 - Other Commitments and Contingencies...64 Note 21 - Finance Income and Costs Note 22 - Related Party Transactions Note 23 - Employee Benefit Expense Note 24 - Research and Development Costs Note 25 - Subsequent Events MD&A Years Ended December 31, 2017 & 2016
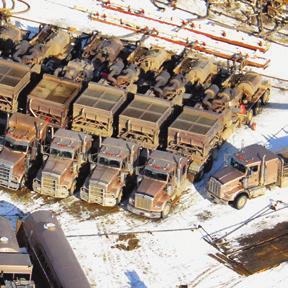
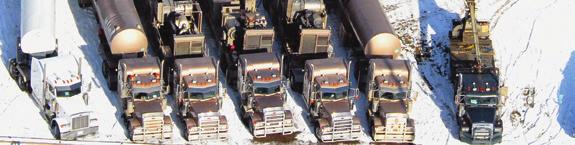
5 MANAGEMENT S DISCUSSION AND ANALYSIS AND CONSOLIDATED FINANCIAL STATEMENTS For the Years Ended December 31, 2017 and 2016 This management discussion and analysis ( MD&A ) is dated February 21, It should be read in conjunction with the audited consolidated financial statements and notes of Trican Well Service Ltd. ( Trican or the Company ) as at and for the years ended December 31, 2017 and Additional information relating to the Company, including the Company s Annual Information Form ( AIF ) for the year ended December 31, 2016, is available online at Basis of Presentation: Unless otherwise noted, all financial information has been prepared in accordance with International Financial Reporting Standards ( IFRS ) as issued by the International Accounting Standards Board ( IASB ). All financial information is reported in Canadian dollars, unless otherwise noted. Certain figures have been reclassified to conform to the current year presentation of this MD&A. The financial results for the current quarter and year-ended December 31, 2017 include the results of Trican s business and the results of Canyon Services Group Inc. ( Canyon ). Canyon was acquired by Trican effective June 2, 2017 and is primarily a provider of fracturing services in addition to coiled tubing, remedial cementing, nitrogen and fluid handling services. Non-GAAP Measures: Trican makes reference to operating income / (loss), adjusted operating income / (loss), and adjusted general and administrative expenses. These measures are not recognized under IFRS and are considered non-gaap measures. Management believes that, in addition to gross profit / (loss) and net income / (loss), operating income / (loss), adjusted operating income / (loss), and adjusted general and administrative expenses are useful supplemental measures. These financial measures are reconciled to IFRS measures in the Quarterly Financial Review, Annual Financial Review, and Non-GAAP Measures section of this MD&A. Common Industry Terms: For a list of abbreviations and terms that may be used in this MD&A, refer to Common Industry Terms section of this MD&A. Risks and Forward-Looking Statements: The Company s financial and operational performance is potentially affected by a number of factors, including, but not limited to, the factors described in the Business Risks section of this MD&A and the Company s other disclosure documents. This MD&A includes forward-looking information based on the Company s current expectations, estimates, projections and assumptions. This information is subject to a number of risks and uncertainties, many of which are beyond the Company s control. Users of this information are cautioned that the actual results may differ materially. Refer to the Forward-Looking Statements section of this MD&A for information on material risk factors and assumptions underlying our forward-looking information. OVERVIEW Headquartered in Calgary, Alberta, Trican has continuing operations in Canada which provide a comprehensive array of specialized products, equipment and services that are used during the exploration and development of oil and gas reserves provided by a highly trained workforce dedicated to safety and operational excellence. The Company also has a minority ownership interest in Keane Investor Holdings, LLC ( Keane Holdings ), a Delaware limited liability company whose only asset is common shares in Keane Group, Inc. ( Keane ), a New York Stock Exchange Listed company that operates in the United States. MD&A Years Ended December 31, 2017 &
6 (1, 2) Continuing Operations - Financial Review ($ millions, except per share amounts; job count; proppant 2 (thousands); and HHP 2 (thousands); (three month information unaudited) Dec. 31, 2017 Three months ended Dec. 31, 2016 Sept. 30, 2017 Dec. 31, 2017 Dec. 31, 2016 Year ended Dec. 31, 2015 Revenue $280.5 $114.8 $362.8 $929.9 $325.2 $649.7 Gross profit / (loss) 30.7 (10.1) (83.5) (26.7) Operating income / (loss) (1) 44.2 (7.4) (69.8) 16.0 Adjusted operating income / (loss) (1) (37.4) 34.9 Net income / (loss) (40.7) (62.8) Per share - basic $0.05 $0.29 $0.14 $0.07 ($0.24) ($0.42) Per share - diluted $0.05 $0.29 $0.13 $0.07 ($0.24) ($0.42) Job count (2) 2,909 2,780 3,200 11,930 9,071 11,977 Proppant pumped (tonnes) (2) 397, , ,000 1,488, , ,000 Canadian segment hydraulic pumping capacity: Active crewed HHP (2) N/A Active, maintenance / not crewed HHP (2) N/A Parked HHP (2) ($ millions, except per share amounts) As at Dec. 31, 2017 As at Dec. 31, 2016 As at Dec. 31, 2015 Cash and cash equivalents $12.7 $20.3 $49.1 Working capital (1) $148.8 $103.6 $254.3 Total loans and borrowings $103.8 $221.6 $569.6 Total assets $1,506.2 $915.4 $1,349.0 Dividends (per share) $- $- $0.15 FINANCIAL & OPERATING HIGHLIGHTS 2017 Compared with 2016 Consolidated revenue from continuing operations for 2017 was $929.9 million, an increase of 186% compared to Adjusted operating income 1 for the year was $183.3 million, compared to an adjusted operating loss of $37.4 million in The acquisition of Canyon, coupled with an increase in activity and fracturing intensity led to significant growth in the volume of proppant pumped this year, increasing 219% when compared to A net debt 1 balance at December 31, 2017 of $94.1 million, a reduction of $107.9 million when compared to the prior year annual results varied significantly from 2016 primarily as a result of the acquisition of Canyon, and improved commodity prices (see Business Environment below). This created strong demand for our services, and the Company pumped 1,488,000 tonnes of proppant in 2017, which was 219% higher than the 466,000 tonnes pumped in Improved demand allowed Trican to obtain increased prices for fracturing services. (1) See Non-GAAP Measures described on page 23 of this MD&A. (2) See Common Industry Terms. 6 MD&A Years Ended December 31, 2017 & 2016
7 Q Compared with Q Consolidated revenue from continuing operations for Q was $280.5 million, an increase of 144% compared to Q Adjusted operating income 1 for the quarter was $47.0 million, compared to $1.1 million in Q4 2016, which is net of $5 million for tax reassessments and expenses for stainless steel fluid ends. The acquisition of Canyon, coupled with an increase in activity and fracturing intensity led to significant growth in the volume of proppant pumped this quarter, increasing 119% when compared to Q In 2017, approximately 83% of Trican s revenue came from customers focused on oil or liquids rich gas plays, whereas 17% came from customers focused on dry gas plays. In 2016, dry gas wells comprised 50.3%; liquids rich gas plays were 26.8%; and oil was 22.9% of our revenue. Fourth quarter results improved dramatically from the same period in Some of the key factors positively affecting the fourth quarter 2017 results include higher activity levels, as evidenced by proppant pumped, the acquisition of Canyon, and significantly improved prices. Fourth Quarter 2017 Sequential Overview Strong customer demand for services continued from Q into the first half of Q4 2017, resulting in high utilization across our primary service lines. However, utilization in the second half of the quarter was affected by a number of customers finalizing their 2017 production targets and/ or their capital programs sooner than initially anticipated. This resulted in our customers temporarily stopping their programs on short notice which did not give us an opportunity to backfill this work. Our customers recommenced their work programs with us in January. The slow-down in customer activity resulted in a temporary oversupply of equipment in the industry, as a result, spot market pricing became competitive in the latter part of the quarter and Trican did not lower our prices for this short-term slow-down. Total proppant pumped declined 30% sequentially from Q to 397,000 tonnes, with the steepest decline coming during the second half of the quarter. The sequential decline in revenue was less than the percentage decline in proppant pumped, as the customer mix shifted away from customers that provided their own proppant. Operating income 1 from continuing operations was $44.2 million, and adjusted operating income 1 was $47.0 million for the quarter. The sequential decrease in revenue caused a larger percentage decline in both operating income and adjusted operating income due to our fixed operating costs, sales, general and administrative expenses ( SG&A ) and maintenance costs not declining at the same rate as the revenue decline. Trican utilized the Q4 slowdown in activity to reduce our maintenance backlog and prepare our fleet for the high utilization anticipated in Q The increase in available equipment will allow us to cycle equipment more effectively, reducing future maintenance costs. Additionally, fourth quarter 2017 adjusted operating income 1 was negatively affected by the recognition of $3 million for prior period PST reassessments, $0.7 million vehicle registration costs associated with the Canyon acquisition and $2 million related to the determination that stainless steel fluid ends would no longer be capitalized, but rather expensed to operating income. The higher duty cycles and the continued trend towards 24 hour pad style work programs results in stainless steel fluid ends reaching their maximum lifespan within a 12 month period (see Outlook for a further discussion regarding changes to our capital expenditure plans) Significant Events Some of the key events from 2017 are as follows: Trican entered into an agreement in March 2017 to acquire Canyon Services Group Inc. ( Canyon ) in an all share transaction that was valued at $627 million. The transaction created Canada s largest pressure pumping company, and provides a platform for continued growth and enhanced ability to meet more complex customer requirements. The integration of the two companies has proceeded as expected, and the combined company realized $31 million of annualized synergies 1 achieved through reduced costs, improved buying power, and more efficient operations. (1) See Non-GAAP Measures described on page 23 of this MD&A. MD&A Years Ended December 31, 2017 &
8 In January 2017, Trican sold its shares in National Oilwell Varco ( NOV ) and monetized a portion of its ownership in Keane Holdings ( Investments in Keane ) for net proceeds of approximately USD $20.7 million and USD $28.4 million, respectively. The proceeds of these sales were used to further pay down Trican s outstanding long-term debt. The partial monetization of Investments in Keane was a result of Keane s Initial Public Offering ( Keane IPO ) on January 20, The Company announced a Normal Course Issuer Bid ( NCIB ) in September 2017, believing that the investment of excess cash flow into common shares is preferable at this time to the investments into additional equipment. The Company purchased 8,325,989 common shares during 2017 at a weighted average price per share of $4.30. An additional 3,570,900 million shares have been purchased subsequent to December 31, 2017 at a weighted average price per share of $4.20). BUSINESS ENVIRONMENT Oil (NYMEX WTI) and natural gas (AECO) prices are important factors that affect the results of Trican s exploration and production (E&P) customers, and therefore ultimately affect Trican s financial results. The US$/CDN$ exchange rate provides context for WTI oil prices which are priced in US$. Oilfield services industry activity statistics help provide context to the operational and financial results of Trican relative to general oilfield service activity levels. Three months ended Year ended (Unaudited) Dec. 31, 2017 Dec. 31, 2016 Dec. 31, 2015 Dec. 31, 2017 Dec. 31, 2016 Dec. 31, 2015 NYMEX WTI - Average Price (US$/bbl) $55.30 $49.29 $42.16 $50.85 $43.47 $48.41 AECO-C Spot Average Price (CDN$/mcf) $1.67 $3.11 $2.48 $2.23 $2.18 $2.71 Average Exchange Rate (US$/CDN$) $0.78 $0.75 $0.75 $0.77 $0.76 $0.78 Thousands of Meters Drilled (2) 4,786 2,076 3,308 19,118 9,493 13,356 Canadian Average Drilling Rig Count (2) Canadian Well Completions (1) 1, ,165 6,434 3,253 5,293 Trican s revenue rates are influenced by crude oil and natural gas pricing. Changes in these prices directly affect our customer s ability to generate cash flow and ultimately utilize Trican s services. WTI crude prices in 2017 improved materially from 2016 as global supply and demand dynamics improved. AECO natural gas spot prices weakened towards the end of 2017 and early on in 2018, as pipeline constraints and US natural gas production reduced demand for Canadian natural gas. Natural gas extraction also produces by-products such as condensate, ethane, propane, butane, isobutane, and pentane, which are more commonly known as natural gas liquids (NGLs). Pricing for NGLs is more correlated to WTI than AECO prices, which has kept economics favorable for most of Trican s gas focused customers OUTLOOK Our outlook remains positive for Weak AECO natural gas prices will reduce demand from certain of our customers, however, we are seeing increased demand from other customers who are weighted to oil and natural gas liquids pricing. We expect customer spending will shift further away from dry gas plays to oil and liquids rich plays, and will continue the trend of higher service intensity per well. Higher sand loadings are expected to continue, leading to a continued shift in customer capital expenditure allocation to fracturing services. We continue to work closely with our customers to improve our efficiencies. We have made significant investments into personnel, technology and infrastructure that increase returns (1) See Non-GAAP Measures described on page 23 of this MD&A. (2) Source: Nickle's Energy Group 8 MD&A Years Ended December 31, 2017 & 2016
9 to Trican and also reduce the overall cost to our customer by reducing product costs and service times. Industry demand and our strong customer service has resulted in our equipment being fully booked through Q1 2018, with second quarter bookings remaining stronger than a typical spring break-up 1. The Company s customer commitments remain strong through to the second half of the year. We recognize demand in the second half will be dependent on commodity prices. However, approximately one-half of the Company s fleets are firmly committed to customer work programs with soft commitments on the balance of the fleet. We anticipate these commitments will be firmed up during the second quarter. We have received strong customer interest in adding additional fracturing capacity to our active fleet. We have 111,000 HP parked and would only require nominal capital to re-activate additional equipment. The most significant barrier to activating additional crews remains the scarcity of qualified labour. We plan to add one additional crew to our active fleet in the first half of this year and will make decisions to add additional crews if customer commitments can be secured at the leading edge of our pricing to provide Trican with rates of return in excess of our cost of capital. In 2017 we have been able to return pricing to profitable levels, and anticipate that pricing will remain stable through We have negotiated agreements with our customers to increase pricing in the event of cost inflation on certain input costs. Wage rate market adjustments affecting our compensation costs are not included in the cost inflation formulas. Wage rate adjustments are anticipated to cost Trican approximately $15 million on an annualized basis. The integration of Canyon continues to proceed as expected. Significant progress has been made in harmonizing the foundational systems that underpin our financial and operational processes. This progress has enabled us to more deeply leverage the synergies and cost advantages that come from our size and scale across Canada. Capital Expenditures The Company s first half 2018 capital expenditure program is now projected to be $33 million, lower than the previously announced capital program as a result of stainless steel fluid ends now being expensed. We believe expensing, rather than capitalizing fluid ends, will result in a decrease to our annual full year capital expenditure program by $25 million to $30 million. The Company continues to see an increase to maintenance capital expenditures as the intensity of hydraulic fracturing increases; however, we believe that current pricing levels reflect this anticipated increase in fracturing intensity. Primary Objectives The Company s short term objectives remain essentially unchanged from the prior quarter: Personnel retention and recruitment: increasing our headcount, and/or reducing our turnover, to lower personnel costs and provide flexibility to reactivate idled equipment to service excess customer demand. Managing cost inflation: minimizing the effects that increasing pressure pumping activity will have on the Company s ongoing cost of operating. Optimization of our capital structure: debt repayment, credit renegotiation and share repurchases under our NCIB program. Driving efficiency: using our scale to further optimize our field operations to improve our clients and our economic returns. Adding equipment back into the market if economic returns remain at current levels. Our strong financial position will allow us to pursue our primary long term objective of seeking out attractive investment activities that will add both long-term value on a per share basis and diversify our reliance on activity tied directly to drilling and completion activity. (1) See Common Industry Terms. MD&A Years Ended December 31, 2017 &
10 CONTINUING OPERATIONS - COMPARATIVE QUARTERLY INCOME STATEMENTS (1, 2) ($thousands, except tonnes, unaudited) Three months ended Dec. 31, 2017 % of Revenue Dec. 31, 2016 % of Revenue Sept. 30, 2017 % of Revenue Revenue 280, % 114, % 362, % Expenses Materials and operating (1) 218,420 78% 109,546 95% 246,393 68% General and administrative (1) 17,874 6% 12,612 11% 24,276 7% Operating income / (loss) (1) 44,201 16% (7,389) (6%) 92,148 25% Finance costs 4,212 2% 4,655 4% 3,998 1% Depreciation and amortization 31,703 11% 16,281 14% 33,157 9% Foreign exchange loss (331) - 2,520 1% (Gain) on Investments in Keane (20,651) (7%) - - (6,420) (2%) Asset impairment 6,523 2% 3,136 3% - - Finance and other income (2,148) (1%) (66,524) (58%) (847) - Income before income taxes 24,163 9% 35,394 31% 59,740 16% Income tax expense / (recovery) 10,161 4% (21,539) (19%) 12,827 4% Net income - Continuing Operations 14,002 5% 56,933 50% 46,913 13% Adjusted operating income (1) 46,990 17% 1,111 1% 98,045 27% Gross profit / (loss) (1) 30,743 11% (10,064) (9%) 83,724 23% Job count (2) 2,909 2,780 3,200 Revenue per job (1) 96,354 40, ,816 Proppant pumped (tonnes) (2) 397, , ,000 The above financial results reflect the acquisition of Canyon therefore, financial results, when compared to comparative periods, will be affected by the addition of Canyon effective June 2, Sales Mix (unaudited) Three months ended, Dec. 31, 2017 Dec. 31, 2016 Sept. 30, 2017 % of Total Revenue Fracturing 70% 57% 74% Cementing 14% 26% 12% Fluid Management 4% - 4% Coiled Tubing 3% 3% 4% Nitrogen 3% 3% 4% Acidizing 2% 4% 1% Industrial Services 3% 5% 1% Other 1% 2% -% Total 100% 100% 100% (1) See Non-GAAP Measures described on page 23 of this MD&A. (2) See Common Industry Terms. 10 MD&A Years Ended December 31, 2017 & 2016
11 Fourth Quarter 2017 Overview (Compared to Prior Year) Revenue Continued strong customer demand, increased pricing, and favorable weather and operating conditions, resulted in revenue increasing by 144% from the fourth quarter of An improved economic environment for our customers resulted in an increase to the WCSB 1 rig count of 12% in Q compared to Q The higher rig count resulted in strong demand for completions activity, allowing Trican to achieve improved utilization of our personnel and manned equipment in Q relative to the same period in This is evidenced by a 119% increase in total proppant pumped 1 during the quarter. The general undersupply of manned fracturing equipment in the WCSB 1 during 2017 allowed Trican to increase pricing, and combined with larger job sizes, resulted in an increased revenue per job 2. The change in revenue per job is due to the full quarter addition of Canyon s equipment which was more heavily weighted to fracturing operations. Additionally, relatively larger pricing increases in fracturing compared to other service lines also contributed to the increased revenue per job. Operating Expenses Materials and operating expenses decreased to 78% of revenue compared to 95% of revenue for Q The significant improvement in operating leverage is due to pricing improvement, increased activity and fracturing intensity, a positive impact of realized synergies from the Canyon acquisition, a lower fixed cost structure and the fact that certain clients supply their own proppant. SG&A SG&A increased for the period primarily due the addition of the acquired Canyon business. Adjusted administrative expenses 2 increased to $15.1 million in Q from $8.8 million in Q as a result of the addition of Canyon, offset by a reduction in the recognized expense from cash-settled share-based compensation expenses. Cash-settled sharebased compensation includes restricted share unit expenses, deferred share unit expenses and performance share unit expenses. Increases or decreases in these expenses are correlated to the number of vested units and the movement in Trican s share price. Overall Results Summary Revenue, gross profit and adjusted operating income 2 in Q increased to $280.5 million, $30.7 million and $47.0 million, respectively, when compared to the fourth quarter of This reflects a significant improvement in pricing and activity levels, the acquisition of Canyon, and an improved fixed cost structure. Net income in the fourth quarter of 2017 decreased by $39.7 million from Q The fourth quarter of 2016 included $65.2 million gain on Keane Class C profits interest (see Investments in Keane for further discussion on Keane). Fourth Quarter 2017 Other Expenses and Income (Compared to Prior Year) Finance Costs Finance costs for the fourth quarter of 2017 decreased 10% when compared to the same period of This decrease is mainly due to the decrease in interest expense on loans and borrowings, due to lower average borrowings, lower impact of debt issue expenses, and lower bank fees associated with debt agreement renegotiations. Depreciation and Amortization Depreciation and amortization expense increased during Q compared to Q as a result of the recognition of amortization expense associated with equipment and intangible assets originating from the Canyon acquisition. Foreign Exchange A foreign exchange loss of $0.4 million has been recorded in the fourth quarter of 2017, compared to $0.3 million gain recorded for the same period in This is mostly due to foreign exchange losses related to the Company s Investments in Keane. The foreign currency translation of the net assets of international entities are reported in discontinued operations. Income Taxes The Company recorded an income tax expense of $7.0 million during the fourth quarter of 2017 compared to a recovery of $21.5 million for the same period of The expense for the quarter was a result of the Company generating taxable income and approximated the Company s effective tax rate. (1) See Common Industry Terms. (2) See Non-GAAP Measures described on page 23 of this MD&A. MD&A Years Ended December 31, 2017 &
12 Gain/Loss on Investments in Keane During the fourth quarter of 2017, the Company recorded $20.7 million of unrealized gains. See Investments in Keane for further discussion. Other Comprehensive Income ( OCI ) OCI includes the effects of foreign currency translation ( FCTA ) adjusted by the reclassification of FCTA to net income for entities that have been sold or substantially disposed. OCI also includes the change in fair value, net of tax, of Trican s Class A shares, held in Keane Holdings, adjusted by the reclassification to net income for realized gains on the Class A shares. Class A Shares have been classified as available-for-sale. The Company recorded other OCI of $20.7 million during the fourth quarter of 2017, compared to income of $31.7 million during the comparative period. The income included the net unrealized gain on Trican s Class A shares in Keane Holdings which was $20.6 million, and foreign currency translation gain of $0.1 million. Fourth Quarter 2017 Summary (Compared with Third Quarter 2017) The strong activity levels experienced in the third quarter continued through the first half of the fourth quarter however, as a number of our customers finalized their 2017 capital programs, activity levels decreased in the second half of the fourth quarter. This, combined with the typical December holiday slowdown resulted in a 23% decrease in revenue when compared with the third quarter of 2017 (see Fourth Quarter Sequential Overview for further discussion). FOURTH QUARTER DISCONTINUED OPERATIONS (COMPARED TO PRIOR YEAR) Discontinued operations include the results of pressure pumping operations in the United States and International operations, which were suspended or sold throughout 2015 and Additionally, discontinued operations include the completion tools business, which was sold in July The completion tools business had operations in Canada, the United States, Norway and Russia. The decisions to discontinue these businesses are not anticipated to have a significant effect on the continuing operations of the Company. The net loss from discontinued operations was $2.4 million in the fourth quarter of 2017, compared to a net loss for the three month period ended December 31, 2016 of $4.2 million. Management continues its efforts to wind up foreign operations resulting in assets being classified as held for sale. At December 31, 2017, the net carrying value of the assets and liabilities located in these regions was $3.1 million and $3.4 million respectively. The Company also had assets held for sale with a net carrying value of $10.0 million in continuing operations which consisted mainly of real estate property. Results from discontinued operations have not been included in the tables above. For information related to Trican s discontinued operations, please see audited annual consolidated financial statements and accompanying notes for the years ended December 31, 2017 and MD&A Years Ended December 31, 2017 & 2016
13 CONTINUING OPERATIONS - COMPARATIVE ANNUAL INCOME STATEMENTS (1, 2) ($thousands, except tonnes, unaudited) Year ended Dec. 31, 2017 % of Revenue Dec. 31, 2016 % of Revenue Yearover-year change % of Change Revenue 929, % 325, % 604, % Expenses Materials and operating (1) 700,202 75% 341, % 358, % General and administrative (1) 74,699 8% 53,664 17% 21,035 39% Operating income / (loss) (1) 155,011 17% (69,760) (21%) 224, % Finance costs 14,806 2% 26,016 8% (11,210) (43%) Depreciation and amortization 101,997 11% 70,440 22% 31,557 45% Foreign exchange loss 4,915-3,058-1,857 61% Gain on Investments in Keane (21,406) (2%) - - (21,406) 100% Asset impairment 6,523 1% 5,135 2% 1,388 27% Finance and other income (6,766) (1%) (70,455) (22%) 63,689 (90%) Income / (loss) before income taxes 54,942 6% (103,954) (32%) 158,896 (153%) Income tax expense / (recovery) 34,825 4% (63,225) (17%) 98,050 (162%) Net income / (loss) - Continuing Operations 20,117 2% (40,729) (13%) 56,356 (138%) Adjusted operating income / (loss) (1) 183,314 20% (37,369) (11%) 220,683 (591%) Gross profit / (loss) (1) 131,942 14% (83,533) (26%) 215,475 (258%) Job count (2) 11,930 9,071 2,859 32% Revenue per job (1) 87,609 35,448 52, % Proppant pumped (tonnes) (2) 1,488, ,000 1,022, % The above financial results reflect the acquisition of Canyon and include revenue and expenses for the period from June 2, 2017 to December 31, Financial results, when compared to prior periods, will be affected by the addition of Canyon on June 2, Overview (Compared to Prior Year) Revenue Strong demand for the Company s services in 2017 resulted in revenues increasing by 186% when compared with the prior year. An improvement in the commodity price environment resulted in an increase of the WCSB rig count by 57%, resulting in increased demand for our services. Outside of spring break-up and the second half of Q4 2017, utilization was at or near full capacity during 2017, leading to an increase in job count 1 of 32% and proppant pumped of 219% when compared to the With the improvement in operating conditions, the Company was able to increase pricing over the prior year. This pricing increase, combined with a shift in the sales mix to fracturing, which has larger job sizes, led to a 147% increase in revenue per job 1 compared to the prior year. Operating Expenses Materials and operating expenses primarily relate to product (proppant and chemicals), personnel, and maintenance. Expenses decreased to 75% of revenue compared to 105% of revenue for the same period in The significant improvement in operating leverage is due to pricing improvement, increased activity, synergies realized from the Canyon acquisition, and a lower fixed cost structure. SG&A SG&A increased 39% for the period primarily due to the acquisition of Canyon, and related transaction and severance costs, and the Keane indemnity claim, which was settled in the second quarter of Adjusted administrative expenses 1 for the year-ended December 31, 2017, increased to $46.4 million compared to $39.7 million in Cost (1) See Non-GAAP Measures described on page 23 of this MD&A. (2) See Common Industry Terms. MD&A Years Ended December 31, 2017 &
14 reduction initiatives that occurred throughout 2016 partially offset the increase in adjusted administrative expenses 2 resulting from the acquired Canyon business. Additionally, cash-settled share-based compensation decreased significantly to $1.3 million in 2017 compared to $10.4 million in Cash-settled share-based compensation includes restricted share unit expenses, deferred share unit expenses and performance share unit expenses. Increases or decreases in these expenses are correlated to the number of vested units and the movement in Trican s share price. Overall Results Summary Gross profit and adjusted operating income 2 for the yearended December 31, 2017, increased by $215.5 million and $222.2 million, respectively, when compared to Net income for the year-ended December 31, 2017, was $20.1 million compared to a net loss of $40.7 million for the same period last year. This reflects a significant improvement in pricing and activity, the acquisition of Canyon, a gain in the current period from Investments in Keane, and an improved fixed cost structure offset by Canyon acquisition costs Other Expenses and Income (Compared to Prior Year) Finance Costs Finance costs for 2017 decreased by $11.2 million when compared to the same period of This decrease was mainly due to the decrease in the average borrowings resulting in a lower interest expense. Depreciation and Amortization Depreciation and amortization expense of $102.0 million increased 45% for the year-ended December 31, 2017, compared to the same period of The increase in depreciation and amortization was primarily due to the acquisition of the Canyon assets. Foreign Exchange A foreign exchange loss of $4.9 million was recorded for the year-ended December 31, 2017, compared to a loss of $3.1 million for the same period in This is mostly due to foreign exchange losses related to the Company s Investments in Keane. The foreign currency translation of the net assets of international entities are reported in discontinued operations. Income Taxes The Company recorded an income tax expense of $34.8 million during the year-ended December 31, 2017, compared to an income tax recovery of $63.2 million for the same period of The higher than anticipated tax rate during 2017 is due to non-deductibility of equity settled stock-based compensation, non-deductibility of certain advisory fees in relation to the Canyon transaction, and due to the transfer of deferred income tax expense from OCI to net income in relation to the Company s realized gain on its investment in Keane. U.S. tax losses are recognized within net income when the initial Keane unrealized gain is recorded in OCI (see Investments in Keane for further discussion). The 2016 recovery is due to the difference between taxable losses from the Company s Canadian operations in concert with the recognition of previously unrecognized operating losses of the US entities that offset the taxable gain on the appreciation of the value of Investments in Keane in Gain/Loss on Investments in Keane The Company recorded a gain of $21.4 million during the year-ended December 31, 2017 ( gain of $65.2 million). See Investments in Keane for further discussion. Other Comprehensive Income OCI includes the effects of FCTA, adjusted by the reclassification of FCTA to net income for entities that have been sold or substantially disposed. OCI also includes the change in fair value, net of tax, of Trican s Class A shares in Keane Holdings, adjusted by the reclassification to net income for realized gains on the Class A shares. Class A shares have been classified as available-for-sale. The Company had an other comprehensive loss of $4.4 million during the year-ended December 31, 2017, compared to a loss of $25.3 million during the same period of The loss included the net unrealized loss on Trican s Class A shares in Keane Holdings which was $4.7 million, and a foreign currency translation gain of $0.3 million. (1) See Common Industry Terms. (2) See Non-GAAP Measures described on page 23 of this MD&A. 14 MD&A Years Ended December 31, 2017 & 2016
15 ANNUAL DISCONTINUED OPERATIONS (COMPARED TO PRIOR YEAR) The net loss from discontinued operations was $4.6 million for the year-ended December 31, 2017, compared to net income for the year-ended period ended December 31, 2016 of $11.4 million. Results from discontinued operations have not been included in the tables above. For information related to Trican s discontinued operations, please see audited annual consolidated financial statements and accompanying notes for the years ended December 31, 2017 and LIQUIDITY, CAPITAL RESOURCES AND FUTURE OPERATIONS Working Capital and Cash Requirements As at December 31, 2017, the Company had a working capital balance of $148.8 million compared to $103.6 million as at December 31, As at December 31, 2017 trade and other receivables increased to $209.6 million from $108.3 million as at December 31, 2016 due to increased activity levels and increased pricing. Inventories increased by $10.5 million primarily due to higher chemical and proppant levels required for increased activity levels. The Company s working capital position and available operating credit facilities exceed the level required to manage timing differences between cash collections and cash payments. The Company continually monitors individual customer trade receivables, taking into account numerous factors including industry conditions, payment history and financial condition in assessing credit risk. The Company establishes an allowance for doubtful accounts for specifically identified customer balances which are assessed to have credit risk exposure and also a general provision for financial credit risk. When it is determined that no recovery of the doubtful accounts is expected, the doubtful account is reclassified as a bad debt expense. As at December 31, 2017, accounts receivable includes an allowance for doubtful accounts of $2.5 million ( $2.2 million). Operating Activities Cash flow from continuing operations was $143.7 million during the year-ended December 31, 2017, compared to cash flow used in continuing operations for the year-ended December 31, 2016, of $37.2 million. The net increase in cash flows provided by continuing operations was due to strong operational activity (see Continuing Operations Comparative Year-to-Date Income Statements) offset by funds used in working capital 1. Investing Activities During 2017, Trican sold its National Oilwell Varco Inc. ( NOV ) shares and monetized a portion of the Investments in Keane. Trican obtained net proceeds of approximately US$21.4 million ($28.0 million) for the sale of its NOV shares and US$28.4 million ($37.8 million) from the sale of shares in the secondary offering of the Keane IPO. The combined net proceeds of approximately US$49.8 million or $65.8 million were used to pay down debt. Trican continues to hold Investments in Keane (see Investments in Keane for further discussion of this investment). The Company acquired all of the issued and outstanding shares of Canyon by issuing million common shares to Canyon shareholders. The financial statement components of Canyon recognized by Trican are described in note 3 of the consolidated financial statements. Capital Expenditures Capital expenditures related to continuing operations for the year-ended December 31, 2017, totaled $30.3 million ( $1.4 million) and proceeds from the sale of property and equipment totaled $10.6 million for 2017 ( $8.4 million). Trican regularly reviews its capital equipment requirements and will continue to follow its policy of adjusting the capital budget on a quarterly basis to reflect changing operating conditions, cash flow and capital equipment needs (see Outlook section of this MD&A for a description of the 2018 anticipated capital expenditure program). Financing Activities Senior Notes The Company has several series of senior notes outstanding as at December 31, During the year-ended December 31, 2017, the Company retired the principle amount of Series A Senior Notes on maturity and retired portions in advance of its Series F and G Senior Notes using proceeds from the sale of its marketable securities. (1) See Non-GAAP Measures described on page 23 of this MD&A. MD&A Years Ended December 31, 2017 &
16 Revolving Credit Facility As at December 31, 2017, Trican had a $227.3 million (2016 $250 million) extendible revolving credit facility ( RCF ) with a syndicate of banks that is committed until April 18, The RCF is secured and bears interest at the applicable Canadian prime rate, U.S. prime rate, Banker s Acceptance rate, or at LIBOR, plus 125 to 400 basis points (2016 Canadian prime rate, U.S. prime rate, Banker s Acceptance rate, or at LIBOR, plus 350 to 625 basis points), dependent on certain financial ratios of the Company. The undrawn amount of the RCF is $184.3 million ( $110 million) of which $179.5 million is accessible ( $35 million accessible) due to the Company s Letters of Credit and amounts drawn on the U.S. dollar swing line as at December 31, As at December 31, 2017, Trican has a $10 million ( $10 million) Letter of Credit facility with its syndicate of banks included in the $227.3 million above. As at December 31, 2017, Trican had $4.4 million in letters of credit outstanding ( $5.1 million). The Company is required to comply with covenants that are applicable to the RCF and to the Senior Notes. Trican is required to comply with the following leverage and interest coverage ratio covenants: For the Quarter Ended Leverage Ratio Interest Coverage Ratio Calculation Basis December 31, 2017 <4.0x >2.5x Last twelve months Thereafter <3.0x >3.0x Last twelve months During the quarter ended December 31, 2017, Trican was in compliance with the required debt covenant ratios and we continue to forecast compliance with our covenants in future periods. The Leverage Ratio is defined as debt excluding Subordinated Make Whole Notes plus Letter of Credit facility minus cash divided by adjusted EBITDA. As at December 31, 2017, the Leverage Ratio was 0.4 (2016 not applicable). The Interest Coverage Ratio is defined as adjusted EBITDA divided by interest expense minus paid in-kind interest. As at December 31, 2017, the Interest Coverage Ratio was 18.4 (2016 not applicable). Certain non-cash expenses and personnel based expenses such as severance are permitted to be added back to EBITDA to arrive at adjusted EBITDA for covenant calculation purposes. Share Capital As at February 21, 2018, Trican had 334,971,237 common shares and 10,274,223 employee stock options outstanding. Normal Course Issuer Bid On September 28, 2017, the Company announced a new Normal Course Issuer Bid ( NCIB ), commencing October 3, 2017, to purchase up to million common shares for cancellation before October 2, All purchases will be made at the prevailing market price at the time of purchase and will be subject to a maximum daily purchase volume of 458,628 (being 25% of the average daily trading volume of the common shares for the six months ending August 31, 2017 of 1,834,515 common shares) except as otherwise permitted under the TSX NCIB rules. All common shares purchased under the NCIB will be returned to treasury and cancelled. For the year-ended December 31, 2017, the Company purchased and cancelled 8,325,989 common shares at a weighted average price per share of $4.30. As at February 21, 2018, the Company had purchased and cancelled an additional 3,570,900 common shares at a weighted average price per share of $4.20 pursuant to its NCIB. Other Commitments and Contingencies The Company has commitments for operating lease agreements, primarily for office space, with minimum payments due as of December 31, 2017, and capital commitments, primarily related to major equipment as follows: 16 MD&A Years Ended December 31, 2017 & 2016
17 Payments Due by Period December 31, year or less 1 to 5 years 5 years & thereafter Total Trade and other payables $124,119 $- $- $124,119 Senior Notes (including interest) 3,821 41,359 6,017 51,197 RCF (including interest) 1,966 45,553-47,519 Finance leases 3,052 5,576 - $8,628 Operating leases 4,940 9,063 8,324 22,327 Total commitments $137,898 $101,551 $14,341 $253,790 In addition to the above commitments, the Company has committed to capital expenditures of $4.7 million, see Outlook for further discussion of the Company s 2018 capital program. Management is satisfied that the Company has sufficient liquidity and capital resources to meet the Company s obligations and commitments as they come due. Other Litigation and Contingencies The tax regulations and legislation in the various jurisdictions that the Company operates in are continually changing. As a result, there are usually some tax matters under review. Management believes that it has adequately met and provided for taxes based on the Company s interpretation of the relevant tax legislation and regulations INVESTMENTS IN KEANE The book value of Trican s Investments in Keane as at December 31, 2017, was $176.7 million ( $231.0 million). The decrease was a result of net proceeds received of US$28.4 million ($37.8 million) from the sale of shares in the secondary offering of the Keane IPO resulting in a realized gain of $24.5 million. Although Keane s share price at December 31, 2017, was US$19.01 compared to the IPO price of US$19.00, the share price fluctuated significantly since the IPO, which highlights how the commodity price and oilfield services industry environment will likely drive significant volatility in the value of the investments for the duration of our ownership period. The timing of further liquidity events are largely under the control of Cerberus Capital Management ( Cerberus ), a private equity firm. Effective July 21, 2017, Investments in Keane were no longer subject to the hold period mandated by the Keane IPO. We believe that our interests are aligned with Cerberus to maximize value under a liquidation strategy. Subsequent to December 31, 2017, the Company received US$27 million of distributions from its Investments in Keane. Keane Investor Holdings, LLC (Trican holds a 10% ownership) sold 15,230,015 shares of Keane common stock at a price to the public of US$18.25 per share. For more information on our Investments in Keane, refer to our AIF dated March 29, 2017, and the notes to our audited annual consolidated financial statements for the years ended December 31, 2017 and 2016, which are available under Trican s profile at MD&A Years Ended December 31, 2017 &
18 SUMMARY OF QUARTERLY RESULTS ($ millions, except per share, unaudited) Q4 Q3 Q2 Q1 Q4 Q3 Q2 Q1 Revenue from continuing operations Profit / (loss) from continuing operations (48.9) 56.9 (14.7) (40.4) (42.5) Per share - basic (0.25) 0.30 (0.08) (0.26) (0.20) Per share - diluted (0.25) 0.30 (0.08) (0.26) (0.20) Profit / (loss) from discontinued operations (2.4) - (2.2) (1.3) (4.1) (23.4) (24.7) 63.4 Per share - basic and diluted (0.01) - (0.01) (0.01) (0.03) (0.12) (0.16) 0.37 Profit / (loss) for the period (50.2) 52.8 (38.1) (65.1) 20.9 Per share - basic (0.26) 0.27 (0.20) (0.42) 0.17 Per share - diluted (0.26) 0.27 (0.20) (0.42) 0.17 Increased revenue during Q3 and Q is due in part to the acquisition of Canyon on June 2, The Company experienced weak financial results from continuing operations in 2016 as lower revenues and loss were negatively impacted by lower commodity prices (For further discussion of the industry environment, see Business Environment). Q was positively affected by gains on its Investments in Keane. Revenue during Q was negatively impacted by seasonal weather related delays typical of spring break-up has experienced progressively improved pricing which has resulted in overall improved financial results. FINANCIAL INSTRUMENTS The Company initially measures its financial instruments at fair value upon initial recognition of the transaction. Measurement in subsequent periods is dependent on whether the instrument is classified as financial liabilities measured at amortized cost, a financial asset or financial liability at fair value through profit or loss, or financial assets or financial liabilities at fair value through other comprehensive income. The Company s financial liabilities measured at amortized cost" consist of loans and borrowings and trade and other payables. They are recognized at amortized cost, using the effective interest rate method. Transaction costs related to the issuance of any long-term debt are netted against the carrying value of the associated long-term debt and amortized as part of financing costs over the life of the debt using the effective interest rate method. (1) See Common Industry Terms. On January 20, 2017, Keane Group, Inc. completed its initial public offering ( IPO ) and its shares became publicly traded on the New York Stock Exchange under the ticker symbol FRAC. As a result of the IPO, Trican s ownership interests in Keane Group Holdings, LLC have been transferred to Keane Holdings. Effectively, our Class A shares and Class C profits interest in Keane Group Holdings, LLC are now Class A common shares (Equity Interest) and Class C shares (Profit Interest) in Keane Holdings. The Company owns 100% of the Class C shares ( Profits Interest in Keane ) in Keane Holdings on the close of the sale of its U.S. pressure pumping business which has been categorized as a financial asset or financial liability at fair value through profit or loss. Changes in fair value are recognized in the consolidated statement of operations and comprehensive income (loss). The Company owns 10% of the Class A shares in Keane ( Equity Interest in Keane ) in Keane Holdings on the close of the sale of its U.S. pressure pumping business which has been categorized as financial assets or financial liabilities at fair value through other comprehensive income. Changes in fair value are recognized in other comprehensive loss in the consolidated statement of comprehensive income. The fair value of Class A and Class C shares was calculated based on an estimate of Trican s portion of future liquidity events using US$19.01 per FRAC share, and a model risk adjusted rate of 30% for the Class C shares. The risk adjustment considered several estimates for uncertainties relating to Trican s non-controlling interest in the Keane Holdings and the timing and price of future liquidity events. The calculation of the fair value of the Class A and Class C shares also utilized the following distribution schedule: 18 MD&A Years Ended December 31, 2017 & 2016
MANAGEMENT S DISCUSSION AND ANALYSIS THIRD QUARTER 2017
 MANAGEMENT S DISCUSSION AND ANALYSIS THIRD QUARTER 2017 Overview... 2 Third Quarter Highlights... 3 Outlook... 3 Continuing Operations Comparative Quarterly Income Statements,... 5 Third Quarter Discontinued
TRICAN WELL SERVICE LTD. Q INTERIM REPORT
 TRICAN WELL SERVICE LTD. Q2 2018 INTERIM REPORT Management's Discussion & Analysis and Financial Statements Six Months Ended 2018 TABLE OF CONTENTS MANAGEMENT'S DISCUSSION AND ANALYSIS...4 OVERVIEW...4
TRICAN REPORTS ANNUAL RESULTS FOR 2018
 News Release TSX - TCW February 20, 2019 TRICAN REPORTS ANNUAL RESULTS FOR Calgary, Alberta - February 20, 2019 - Trican Well Service Ltd. ( Trican or the Company ) is pleased to announce its annual results
CONDENSED CONSOLIDATED STATEMENTS OF FINANCIAL POSITION
 CONDENSED CONSOLIDATED STATEMENTS OF FINANCIAL POSITION 2018 December 31, 2017 (Stated in thousands; unaudited) ASSETS Current assets Cash and cash equivalents $21,636 $12,739 Trade and other receivables
INVESTOR PRESENTATION. January 2019
 INVESTOR PRESENTATION January 2019 FORWARD LOOKING STATEMENTS This document contains statements that constitute forward-looking statements within the meaning of applicable securities legislation. These
TRICAN REPORTS FIRST QUARTER RESULTS FOR 2018 AND ANNOUNCES ITS SECOND HALF 2018 CAPITAL PROGRAM
 News Release TSX TCW May 10, 2018 TRICAN REPORTS FIRST QUARTER RESULTS FOR 2018 AND ANNOUNCES ITS SECOND HALF 2018 CAPITAL PROGRAM Calgary, Alberta May 10, 2018 Trican Well Service Ltd. ( Trican or the
TRICAN REPORTS FOURTH QUARTER RESULTS FOR 2013
 Press Release TSX TCW February 25, 2014 TRICAN REPORTS FOURTH QUARTER RESULTS FOR 2013 Financial Review Three months ended Twelve months ended Dec. 31, Dec. 31, Sept. 30, Dec. 31, Dec. 31, ($ millions,
INVESTOR PRESENTATION. July 2018
 INVESTOR PRESENTATION July 2018 FORWARD LOOKING STATEMENTS This document contains statements that constitute forward-looking statements within the meaning of applicable securities legislation. These forward-looking
INVESTOR PRESENTATION. September 2018
 INVESTOR PRESENTATION September 2018 FORWARD LOOKING STATEMENTS This document contains statements that constitute forward-looking statements within the meaning of applicable securities legislation. These
INVESTOR PRESENTATION. April 2019
 INVESTOR PRESENTATION April 2019 FORWARD LOOKING STATEMENTS This document contains statements that constitute forward-looking statements within the meaning of applicable securities legislation. These forward-looking
INVESTOR PRESENTATION. November 2018
 INVESTOR PRESENTATION November 2018 FORWARD LOOKING STATEMENTS This document contains statements that constitute forward-looking statements within the meaning of applicable securities legislation. These
INVESTOR PRESENTATION. April 2018
 INVESTOR PRESENTATION April 2018 FORWARD LOOKING STATEMENTS This document contains statements that constitute forward-looking statements within the meaning of applicable securities legislation. These forward-looking
INVESTOR PRESENTATION. March 2018
 INVESTOR PRESENTATION March 2018 FORWARD LOOKING STATEMENTS This document contains statements that constitute forward-looking statements within the meaning of applicable securities legislation. These forward-looking
Q3 Interim Report Nine Months Ended September 30, 2009
 Q3 Interim Report Nine Months Ended September 30, 2009 Financial Review Three months ended Nine months ended Sept. 30, Sept 30, June 30, Sept. 30, Sept. 30, ($ millions, except per share amounts; unaudited)
INVESTOR PRESENTATION. January 2018
 INVESTOR PRESENTATION January 2018 FORWARD LOOKING STATEMENTS This document contains statements that constitute forward-looking statements within the meaning of applicable securities legislation. These
Canadian Equipment Rentals Corp. Announces 2016 Year End Results
 Canadian Equipment Rentals Corp. Announces Year End Results CALGARY, ALBERTA April 25, 2017: Canadian Equipment Rentals Corp. (the "Company") (TSX VENTURE: CFL) today announced its financial and operating
CWC ENERGY SERVICES CORP.
 Unaudited Condensed Interim Consolidated Financial Statements For the three and nine months ended September 30, 2018 and 2017 CONSOLIDATED STATEMENTS OF FINANCIAL POSITION September 30, December 31, Stated
MANAGEMENT S DISCUSSION AND ANALYSIS For the Year ended September 30, 2017 Dated: December 28, 2017
 MANAGEMENT S DISCUSSION AND ANALYSIS For the Year ended, 2017 Dated: December 28, 2017 MANAGEMENT S DISCUSSION & ANALYSIS This Management s Discussion and Analysis ( MD&A ) presents management s view of
Mammoth Energy Service, Inc. Announces First Quarter 2017 Operational and Financial Results
 May 3, 2017 Mammoth Energy Service, Inc. Announces First Quarter 2017 Operational and Financial Results OKLAHOMA CITY, May 03, 2017 (GLOBE NEWSWIRE) -- Mammoth Energy Service, Inc. ("Mammoth" or the "Company")
CWC ENERGY SERVICES CORP. ANNOUNCES FOURTH QUARTER AND YEAR END 2017 OPERATIONAL AND FINANCIAL RESULTS AND RECORD 2017 SERVICE RIG OPERATING HOURS
 For Immediate Release: February 28, 2018 CWC ENERGY SERVICES CORP. ANNOUNCES FOURTH QUARTER AND YEAR END OPERATIONAL AND FINANCIAL RESULTS AND RECORD SERVICE RIG OPERATING HOURS CALGARY, ALBERTA (TSXV:
Condensed Interim Consolidated Financial Statements
 Condensed Interim Consolidated Financial Statements As at and for the three and six months ended 2017 STEP ENERGY SERVICES LTD. INTERIM CONSOLIDATED STATEMENTS OF FINANCIAL POSITION Unaudited As at December
MANAGEMENT S RESPONSIBILITY FOR FINANCIAL STATEMENTS
 MANAGEMENT S RESPONSIBILITY FOR FINANCIAL STATEMENTS The management of Trican Well Service Ltd. is responsible for the preparation and integrity of the accompanying consolidated financial statements and
ESSENTIAL ENERGY SERVICES ANNOUNCES THIRD QUARTER RESULTS AND DECLARES QUARTERLY DIVIDEND
 NEWS RELEASE ESSENTIAL ENERGY SERVICES ANNOUNCES THIRD QUARTER RESULTS AND DECLARES QUARTERLY DIVIDEND Calgary, Alberta November 6, 2013 Essential Energy Services Ltd. (TSX: ESN) ( Essential or the Company
Badger Daylighting Ltd. Interim Condensed Consolidated Financial Statements (Unaudited) For the three months ended March 31, 2018 and 2017
 For the three months ended March 31, 2018 and 2017") Badger Daylighting Ltd. Interim Condensed Consolidated Financial Statements (Unaudited) For the three months ended March 31, 2018 and 2017 Interim Condensed Consolidated Statement of Financial Position
Badger Daylighting Ltd. Interim Condensed Consolidated Financial Statements (Unaudited) For the three months ended March 31, 2018 and 2017 Interim Condensed Consolidated Statement of Financial Position
FOLD LINES FOLD LINES
 Focused 2016 THIRD QUARTER REPORT For the three and nine months ended September 30, 2016 TABLE OF CONTENTS 01 Management s Discussion & Analysis 02 Financial Highlights 03 Operating Highlights 07 Industry
Condensed Interim Consolidated Financial Statements
 Condensed Interim Consolidated Financial Statements As at and for the three and nine months ended 2017 Page 0 STEP ENERGY SERVICES LTD. INTERIM CONSOLIDATED STATEMENTS OF FINANCIAL POSITION Unaudited As
ESSENTIAL ENERGY SERVICES ANNOUNCES SECOND QUARTER RESULTS AND INCREASES THE QUARTERLY DIVIDEND
 NEWS RELEASE ESSENTIAL ENERGY SERVICES ANNOUNCES SECOND QUARTER RESULTS AND INCREASES THE QUARTERLY DIVIDEND Calgary, Alberta August 7, 2013 Essential Energy Services Ltd. (TSX: ESN) ( Essential or the
NEWS RELEASE REPORTS 2011 THIRD QUARTER FINANCIAL RESULTS
 PRECISION DRILLING CORPORATION Calgary, Alberta, Canada October 21, 2011 (Canadian dollars except as indicated) NEWS RELEASE PRECISION DRILLING CORPORATION REPORTS 2011 THIRD QUARTER FINANCIAL RESULTS
INVESTOR PRESENTATION. March 2017
 INVESTOR PRESENTATION March 2017 FORWARD LOOKING STATEMENTS This document contains statements that constitute forward-looking statements within the meaning of applicable securities legislation. These forward-looking
Condensed Interim Consolidated Financial Statements. For the 13-week and 39-week periods ended October 29, 2017 and October 30, 2016
 Condensed Interim Consolidated Financial Statements For the 13-week and 39-week periods ended and (Unaudited, expressed in thousands of Canadian dollars, unless otherwise noted) Interim Consolidated Statement
MANAGEMENT S DISCUSSION AND ANALYSIS
 MANAGEMENT S DISCUSSION AND ANALYSIS This Management s Discussion and Analysis ( MD&A ) for Ltd. ( STEP or the Company ) has been prepared by management as of November 7, and is a review of the Company
Badger Daylighting Ltd. Interim Condensed Consolidated Financial Statements (Unaudited) For the three and six months ended June 30, 2018 and 2017
 For the three and six months ended June 30, 2018 and 2017") Badger Daylighting Ltd. Interim Condensed Consolidated Financial Statements (Unaudited) For the three and six months ended June 30, 2018 and 2017 Interim Condensed Consolidated Statement of Financial Position
Badger Daylighting Ltd. Interim Condensed Consolidated Financial Statements (Unaudited) For the three and six months ended June 30, 2018 and 2017 Interim Condensed Consolidated Statement of Financial Position
2018 Q33 Report CWC-2018Q1d.indd :39 PM
 2018 Q3 3 Report CWC-2018Q1d.indd 1 2018-06-06 3:39 PM CWC-2018Q1d.indd 2 2018-06-06 3:39 PM MANAGEMENT S DISCUSSION AND ANALYSIS ( MD&A ) Management s Discussion and Analysis ( MD&A ) is a review of the
2018 First Quarter Report
 2018 First Quarter Report TABLE OF CONTENTS Management s Discussion & Analysis 01 Financial Highlights 02 Operating Highlights 03 Industry Statistics Results from Operations Consolidated Financial Statements
2018 Third Quarter Report
 2018 Third Quarter Report TABLE OF CONTENTS Management s Discussion & Analysis 01 Financial Highlights 02 Operating Highlights 03 Industry Statistics Results from Operations Consolidated Financial Statements
Canada, Ford in Texas from the
 MANAGEMENT S DISCUSSION AND ANALYSIS S This Management s Discussion and Analysis ( MD&A ) for STEP Energy Services Ltd. ( STEP or the Company ) has been prepared by management as of August 8, and is a
CWC ENERGY SERVICES CORP. ANNOUNCES FIRST QUARTER 2018 RESULTS AND RECORD Q REVENUE AND SERVICE RIG OPERATING HOURS
 For Immediate Release: May 2, 2018 CWC ENERGY SERVICES CORP. ANNOUNCES FIRST QUARTER 2018 RESULTS AND RECORD Q1 2018 REVENUE AND SERVICE RIG OPERATING HOURS CALGARY, ALBERTA (TSXV: CWC) CWC Energy Services
ESSENTIAL ENERGY SERVICES ANNOUNCES 2010 FIRST QUARTER RESULTS AND INCREASED CAPITAL SPENDING BUDGET
 NEWS RELEASE ESSENTIAL ENERGY SERVICES ANNOUNCES 2010 FIRST QUARTER RESULTS AND INCREASED CAPITAL SPENDING BUDGET CALGARY, ALBERTA May 11, 2010 - Essential Energy Services Ltd. (TSX: ESN) announces 2010
LIQUOR STORES INCOME FUND
 LIQUOR STORES INCOME FUND MANAGEMENT S DISCUSSION AND ANALYSIS OF FINANCIAL CONDITION AND RESULTS OF OPERATIONS For the Year Ended December 31, 2005 As of February 16, 2006 MANAGEMENT S DISCUSSION AND
3Q 18 Earnings Call Presentation NOVEMBER 1, 2018
 3Q 18 Earnings Call Presentation NOVEMBER 1, 2018 1 Important Disclaimer This presentation contains certain statements and information that may constitute forward-looking statements within the meaning
LETTER TO THE SHAREOWNERS
 Q1 AKITA 2018 Q1 REPORT LETTER TO THE SHAREOWNERS Drilling Ltd. s net loss for the three months ended March 31, 2018 was $1,912,000 (net loss of $0.11 per share basic and diluted) on revenue of $27,089,000,
Calfrac Announces First Quarter Results and Update on 2018 Capital Program
 Calfrac Announces First Quarter Results and Update on Capital Program CALGARY, ALBERTA - May 1, - Calfrac Well Services Ltd. ( Calfrac or the Company ) (TSX-CFW) announces its financial and operating results
Total Energy Services Inc. Announces Q results
 Total Energy Services Inc. Announces Q2 2018 results CALGARY, Alberta, Aug. 09, 2018 -- Total Energy Services Inc. (TSX:TOT) ( Total Energy or the Company ) announces its consolidated financial results
CWC ENERGY SERVICES CORP. ANNOUNCES THIRD QUARTER 2018 OPERATIONAL AND FINANCIAL RESULTS
 For Immediate Release: October 31, CWC ENERGY SERVICES CORP. ANNOUNCES THIRD QUARTER OPERATIONAL AND FINANCIAL RESULTS CALGARY, ALBERTA (TSXV: CWC) CWC Energy Services Corp. ( CWC or the Company ) announces
CWC WELL SERVICES CORP. RELEASES RECORD YEAR END AND FOURTH QUARTER 2011 FINANCIAL RESULTS
 For Immediate Release: March 1, 2012 CWC WELL SERVICES CORP. RELEASES RECORD YEAR END AND FOURTH QUARTER 2011 FINANCIAL RESULTS CALGARY, ALBERTA (TSXV: CWC) CWC Well Services Corp. ( CWC or the Company
Management s Discussion & Analysis. MATRRIX Energy Technologies Inc. For the three and six month periods ended June 30, 2018 and 2017
 Management s Discussion & Analysis MATRRIX Energy Technologies Inc. For the three and six month periods ended 2018 and 2017 (Expressed in Canadian Dollars) MATRRIX ENERGY TECHNOLOGIES INC. (also referred
Tamarack Valley Energy Ltd. Announces Third Quarter 2018 Production and Financial Results Driven by Record Oil Weighting
 TSX: TVE Tamarack Valley Energy Ltd. Announces Third Quarter 2018 Production and Financial Results Driven by Record Oil Weighting Calgary, Alberta November 7, 2018 Tamarack Valley Energy Ltd. ( Tamarack
PRECISION DRILLING CORPORATION ANNOUNCES 2018 FOURTH QUARTER AND YEAR END UNAUDITED FINANCIAL RESULTS
 NEWS RELEASE Calgary, Alberta, Canada February 14, 2019 (Canadian dollars except as indicated) PRECISION DRILLING CORPORATION ANNOUNCES 2018 FOURTH QUARTER AND YEAR END UNAUDITED FINANCIAL RESULTS This
TERVITA MANAGEMENT S DISCUSSION & ANALYSIS
 TERVITA MANAGEMENT S DISCUSSION & ANALYSIS November 14, 2018 ABOUT THIS MANAGEMENT S DISCUSSION AND ANALYSIS The following management s discussion and analysis ( MD&A ) is a summary of the financial position
Precision Drilling Corporation First Quarter Report for the three months ended March 31, 2015 and 2014
 Precision Drilling Corporation First Quarter Report for the three months ended March 31, 2015 and 2014 MANAGEMENT S DISCUSSION AND ANALYSIS Management s Discussion and Analysis for the three month period
Condensed Interim Consolidated Financial Statements. For the 13-week periods ended April 30, 2017 and May 1, 2016
 Condensed Interim Consolidated Financial Statements For the 13-week periods ended and May 1, 2016 (Unaudited, expressed in thousands of Canadian dollars, unless otherwise noted) Consolidated Interim Statement
TSX:CFW. CALFRAC WELL SERVICES LTD. Investor Presentation June 2016
 TSX:CFW CALFRAC WELL SERVICES LTD. Investor Presentation June 2016 Forward Looking Statement Certain information contained within this presentation and statements made in conjunction with this presentation
Vertex Resource Group Ltd.
 Condensed Consolidated Interim Financial Statements of For the three-month period ended (Unaudited) Table of contents Condensed consolidated interim statements of financial position... 1 Condensed consolidated
Financial Report First Quarter 2018
 Financial Report First Quarter 2018 www.eagleenergy.com Management s Discussion and Analysis May 10, 2018 This Management s Discussion and Analysis ( MD&A ) of financial condition and results of operations
ESSENTIAL ENERGY SERVICES ANNOUNCES FOURTH QUARTER AND YEAR END RESULTS, SALE PROCESS FOR ITS COLOMBIAN OPERATIONS AND QUARTERLY DIVIDEND
 NEWS RELEASE ESSENTIAL ENERGY SERVICES ANNOUNCES FOURTH QUARTER AND YEAR END RESULTS, SALE PROCESS FOR ITS COLOMBIAN OPERATIONS AND QUARTERLY DIVIDEND Calgary, Alberta March 6, 2013 Essential Energy Services
"Growth through sustainable cash flow"
 For the Three and Six Months Ended June 30, 2018 "Growth through sustainable cash flow" www.mosaiccapitalcorp.com 400, 2424 4 th Street SW, Calgary, Alberta T2S 2T4 Telephone 403-218-6500 Fax 403-266-1541
FOR THE THREE AND NINE MONTHS ENDED SEPTEMBER 30, 2018
 FOR THE THREE AND NINE MONTHS ENDED SEPTEMBER 30, 2018 Management s Discussion and Analysis This Management s Discussion and Analysis ( MD&A ) for PrairieSky Royalty Ltd. ( PrairieSky or the Company )
"Growth through sustainable cash flow"
 For the Three and Nine Months Ended September 30, 2018 "Growth through sustainable cash flow" www.mosaiccapitalcorp.com 400, 2424 4 th Street SW, Calgary, Alberta T2S 2T4 Telephone 403-218-6500 Fax 403-266-1541
Vertex Resource Group Ltd.
 Condensed Consolidated Interim Financial Statements of Vertex Resource Group Ltd. For the three and nine month periods ended (Unaudited) Table of contents Condensed consolidated interim statements of financial
Consolidated Financial Statements
 Consolidated Financial Statements As at and for the year ended December 31, 2017 Page 0 MANAGEMENT S RESPONSIBILITY FOR FINANCIAL STATEMENTS The management of STEP Energy Services Ltd. is responsible for
Precision Drilling Corporation
 Precision Drilling Corporation First Quarter Report for the three months ended March 31, 2018 and 2017 MANAGEMENT S DISCUSSION AND ANALYSIS Management s Discussion and Analysis for the three month period
MANAGEMENT S DISCUSSION AND ANALYSIS
 MANAGEMENT S DISCUSSION AND ANALYSIS Management's discussion and analysis ( MD&A ) is dated May 2, 2018 and should be read in conjunction with the unaudited consolidated financial statements for the period
Vertex Resource Group Ltd.
 Condensed Consolidated Interim Financial Statements of Vertex Resource Group Ltd. For the three and six month periods ended (Unaudited) Table of contents Condensed consolidated interim statements of financial
CWC ENERGY SERVICES CORP. ANNOUNCES THIRD QUARTER 2015 OPERATIONAL AND FINANCIAL RESULTS
 For Immediate Release: November 11, CWC ENERGY SERVICES CORP. ANNOUNCES THIRD QUARTER OPERATIONAL AND FINANCIAL RESULTS CALGARY, ALBERTA (TSXV: CWC) CWC Energy Services Corp. ( CWC or the Company ) announces
MANAGEMENT S DISCUSSION AND ANALYSIS
 MANAGEMENT S DISCUSSION AND ANALYSIS FOR THE THREE MONTHS ENDED MARCH 31, 2018 www.sourceenergyservices.com 500, 438 11 Ave SE, Calgary, AB Canada T2G 0Y4 Telephone 403-262-1312 MANAGEMENT S DISCUSSION
MANAGEMENT S DISCUSSION AND ANALYSIS OF FINANCIAL CONDITION AND RESULTS OF OPERATIONS
 MANAGEMENT S DISCUSSION AND ANALYSIS OF FINANCIAL CONDITION AND RESULTS OF OPERATIONS For Three and Nine Month Periods Ended September 30, 2007 As of November 8, 2007 MANAGEMENT S DISCUSSION AND ANALYSIS
Balance Sheets. Central Alberta Well Services Corp. For the periods ended June 30, 2008 and December 31, 2007
 Balance Sheets For the periods ended June 30, 2008 and December 31, 2007 2008 (Unaudited) 2007 ASSETS Current assets Cash $ $ 1,870,034 Restricted cash 20,000 415,000 Accounts receivable 15,365,024 10,868,117
Condensed Interim Consolidated Financial Statements. For the 13-week and 39-week periods ended October 30, 2016 and November 1, 2015
 Condensed Interim Consolidated Financial Statements For the 13-week and 39-week periods ended and November 1, (Unaudited, expressed in thousands of Canadian dollars, unless otherwise noted) Consolidated
ProPetro Reports Full Year and Fourth Quarter 2017 Results
 March 26, 2018 ProPetro Reports Full Year and Fourth Quarter 2017 Results Most Successful Year in Company s 12-Year History Grew Year-Over-Year Revenue and Year-End HHP Capacity by 125% and 64%, Respectively
IBI Group 2015 Third-Quarter Management Discussion and Analysis
 IBI Group 2015 Third-Quarter Management Discussion and Analysis THREE MONTHS ENDED JUNE 30, 2015 IBI Group Inc. Management discussion and analysis For the three and nine months September 30, 2015 The following
CWC ENERGY SERVICES CORP. ANNOUNCES FOURTH QUARTER AND YEAR END 2018 OPERATIONAL AND FINANCIAL RESULTS AND RECORD 2018 SERVICE RIG OPERATING HOURS
 For Immediate Release: February 28, 2019 CWC ENERGY SERVICES CORP. ANNOUNCES FOURTH QUARTER AND YEAR END OPERATIONAL AND FINANCIAL RESULTS AND RECORD SERVICE RIG OPERATING HOURS CALGARY, ALBERTA (TSXV:
MANAGEMENT S RESPONSIBILITY FOR FINANCIAL STATEMENTS
 MANAGEMENT S RESPONSIBILITY FOR FINANCIAL STATEMENTS The management of Trican Well Service Ltd. is responsible for the preparation and integrity of the accompanying consolidated financial statements and
Condensed Interim Consolidated Financial Statements
 Condensed Interim Consolidated Financial Statements As at and for the three and six months ended 2018 Page 0 STEP ENERGY SERVICES LTD. INTERIM CONSOLIDATED STATEMENTS OF FINANCIAL POSITION As at December
MANAGEMENT S DISCUSSION AND ANALYSIS OF FINANCIAL CONDITION AND RESULTS OF OPERATIONS
 MANAGEMENT S DISCUSSION AND ANALYSIS OF FINANCIAL CONDITION AND RESULTS OF OPERATIONS For Three and Six Month Periods Ended June 30, 2007 As of August 13, 2007 MANAGEMENT S DISCUSSION AND ANALYSIS OF FINANCIAL
Unaudited Condensed Consolidated Interim Financial Statements
 Unaudited Condensed Consolidated Interim Financial Statements Essential Energy Services Ltd. 2018 CONSOLIDATED INTERIM STATEMENTS OF FINANCIAL POSITION (Unaudited) (in thousands of dollars) Assets Current
Q Financial Information
 Q3 2015 Financial Information Financial Information 3 Key Figures 8 Interim Consolidated Financial Information (unaudited) 8 Interim Consolidated Income Statements 9 Interim Condensed Consolidated Statements
CEMATRIX CORPORATION Management s Discussion and Analysis Three and Nine Months Ended September 30, Date Completed: November 15, 2017
 CEMATRIX CORPORATION Management s Discussion and Analysis Three and Nine Months Ended September 30, 2017 Date Completed: November 15, 2017 CEMATRIX CORPORATION www.cematrix.com Form 51-102F1 - Management
Independent Auditor s Report. To the Shareholders of Xtreme Drilling and Coil Services Corp.
 Independent Auditor s Report To the Shareholders of Xtreme Drilling and Coil Services Corp. We have audited the accompanying consolidated financial statements of Xtreme Drilling and Coil Services Corp.
MANAGEMENT S DISCUSSION & ANALYSIS FOR THE FIRST QUARTER ENDING MARCH 31, 2018
 \ MANAGEMENT S DISCUSSION & ANALYSIS FOR THE FIRST QUARTER ENDING MARCH 31, 2018 FINANCIAL AND OPERATING HIGHLIGHTS (Expressed in thousands of Canadian dollars except per boe and share amounts) OPERATIONS
Precision Drilling Corporation
 Precision Drilling Corporation Second Quarter Report for the three and six months ended June 30, 2018 and 2017 MANAGEMENT S DISCUSSION AND ANALYSIS Management s Discussion and Analysis for the three-month
Leveraging Our Strengths
 Leveraging Our Strengths First Quarterly Report for the Three Months Ended March 31, 2016 Management s Discussion and Analysis of Financial Conditions and Results of Operations For the three months ended
Q MANAGEMENT S DISCUSSION AND ANALYSIS Page 2 NAME CHANGE AND SHARE CONSOLIDATION FORWARD-LOOKING STATEMENTS NON-IFRS MEASUREMENTS
 MANAGEMENT S DISCUSSION AND ANALYSIS FOR THE QUARTERS ENDED SEPTEMBER 30, 2014 AND 2013 The following Management s Discussion and Analysis ( MD&A ) of financial results as provided by the management of
TRINIDAD DRILLING 2011 SECOND QUARTER REPORT
 TRINIDAD DRILLING 2011 SECOND QUARTER REPORT FOR THE THREE AND SIX MONTHS ENDING JUNE 30, 2011 TRINIDAD SECOND QUARTER REPORT 2011 + 1 TRINIDAD DRILLING LTD. REPORTS SOLID SECOND QUARTER AND YEAR TO DATE
FORACO INTERNATIONAL S.A.
 FORACO INTERNATIONAL S.A. Unaudited Condensed Interim Consolidated Financial Statements Three-month period and year ended December 31, 2017 1 Table of Contents Unaudited condensed interim consolidated
GEAR ENERGY LTD. INTERIM CONDENSED BALANCE SHEETS (unaudited) As at
 As at") GEAR ENERGY LTD. INTERIM CONDENSED BALANCE SHEETS (unaudited) As at June 30, 2017 December 31, 2016 (Cdn$ thousands) ASSETS Current assets Accounts receivable $ 11,454 $ 9,526 Prepaid expenses 2,637 2,774
GEAR ENERGY LTD. INTERIM CONDENSED BALANCE SHEETS (unaudited) As at June 30, 2017 December 31, 2016 (Cdn$ thousands) ASSETS Current assets Accounts receivable $ 11,454 $ 9,526 Prepaid expenses 2,637 2,774
TRINIDAD DRILLING 2017 THIRD QUARTER REPORT 2017 THIRD QUARTER REPORT
 TRINIDAD DRILLING 2017 THIRD QUARTER REPORT 2017 THIRD QUARTER REPORT TABLE OF CONTENTS 01 Management s Discussion & Analysis 02 Financial Highlights 03 Operating Highlights 07 Industry Statistics 11 Results
2O16 FIRST QUARTERLY REPORT
 2O16 FIRST QUARTERLY REPORT Intertape Polymer Group Inc. Management s Discussion and Analysis Consolidated Quarterly Statements of Earnings Three month periods ended (In thousands of US dollars, except
Q 1. To the Shareowners
 DRILLING LTD. Q 1 Interim report for 3 months ended, 2011 To the Shareowners Commencing with this quarterly report, all financial information is reported in accordance with IFRS including for comparative
Condensed Interim Consolidated Financial Statements
 Condensed Interim Consolidated Financial Statements As at and for the three and nine months ended 2018 Page 0 STEP ENERGY SERVICES LTD. INTERIM CONSOLIDATED STATEMENTS OF FINANCIAL POSITION As at December
Condensed Consolidated Financial Statements (unaudited) For the three months ended March 31, 2017 and (Expressed in Canadian Dollars)
 For the three months ended March 31, 2017 and (Expressed in Canadian Dollars)") Condensed Consolidated Financial Statements (unaudited) (Expressed in Canadian Dollars) Condensed Consolidated Statements of Financial Position ($000's) (unaudited) Notes March 31, 2017 December 31, 2016
Condensed Consolidated Financial Statements (unaudited) (Expressed in Canadian Dollars) Condensed Consolidated Statements of Financial Position ($000's) (unaudited) Notes March 31, 2017 December 31, 2016
Cenovus Energy Inc. Interim Consolidated Financial Statements (unaudited) For the Period Ended March 31, (Canadian Dollars)
 For the Period Ended March 31, (Canadian Dollars)") Cenovus Energy Inc. Interim Consolidated Financial Statements (unaudited) For the Period Ended March 31, 2016 (Canadian Dollars) CONSOLIDATED FINANCIAL STATEMENTS (unaudited) TABLE OF CONTENTS CONSOLIDATED
Cenovus Energy Inc. Interim Consolidated Financial Statements (unaudited) For the Period Ended March 31, 2016 (Canadian Dollars) CONSOLIDATED FINANCIAL STATEMENTS (unaudited) TABLE OF CONTENTS CONSOLIDATED
Cenovus Energy Inc. Interim Consolidated Financial Statements (unaudited) For the Period Ended December 31, (Canadian Dollars)
 For the Period Ended December 31, (Canadian Dollars)") Cenovus Energy Inc. Interim Consolidated Financial Statements (unaudited) For the Period Ended December 31, 2016 (Canadian Dollars) CONSOLIDATED FINANCIAL STATEMENTS (unaudited) TABLE OF CONTENTS CONSOLIDATED
Cenovus Energy Inc. Interim Consolidated Financial Statements (unaudited) For the Period Ended December 31, 2016 (Canadian Dollars) CONSOLIDATED FINANCIAL STATEMENTS (unaudited) TABLE OF CONTENTS CONSOLIDATED
2011 Annual Report DEEPENING OUR HORIZONS GROWING OUR VALUE
 2011 Annual Report DEEPENING OUR HORIZONS GROWING OUR VALUE Annual Report 2011 1 Financial and Operating Highlights Three months ended Year ended (000 s except per share amounts) December 31 December 31
LETTER TO SHAREHOLDERS
 LETTER TO SHAREHOLDERS The Company continued to deliver strong financial and operating results in the third quarter of 2011. Both of our business segments experienced increased revenues compared to the
CONNACHER OIL AND GAS LIMITED MANAGEMENT S DISCUSSION AND ANALYSIS FOR THE THREE AND NINE MONTHS ENDED SEPTEMBER 30, 2015 OVERVIEW
 CONNACHER OIL AND GAS LIMITED MANAGEMENT S DISCUSSION AND ANALYSIS FOR THE THREE AND NINE MONTHS ENDED SEPTEMBER 30, 2015 This Management s Discussion and Analysis ( MD&A ) for Connacher Oil and Gas Limited
FIRST QUARTER REPORT HIGHLIGHTS
 FIRST QUARTER REPORT For the three months ended March 31, 2018 Petrus Resources Ltd. ( Petrus or the Company ) (TSX: PRQ) is pleased to report financial and operating results for the first quarter of 2018.
INTERIM REPORT RAPPORT INTERMÉDIAIRE
 INTERIM REPORT RAPPORT INTERMÉDIAIRE POUR LES FOR NEUFS THE NINE MOIS MONTHS TERMINÉS ENDED LE 27 OCTOBER OCTOBRE 27, 2018 2018 MESSAGE TO SHAREHOLDERS Dear shareholders, Sales for the third quarter ended
Financial Report Third Quarter 2018
 Financial Report Third Quarter www.eagleenergy.com EAGLE THIRD QUARTER REPORT Management s Discussion and Analysis November 8, This Management s Discussion and Analysis ( MD&A ) of financial condition
Management s Discussion and Analysis
 Management s Discussion and Analysis The following Management s Discussion and Analysis (MD&A) should be read in conjunction with the attached unaudited interim consolidated financial statements of Badger
Unaudited Condensed Consolidated Financial Statements of. MATRRIX Energy Technologies Inc. For the three months ended March 31, 2018 and 2017
 Unaudited Condensed Consolidated Financial Statements of MATRRIX Energy Technologies Inc. For the three months ended (Expressed in Canadian Dollars) See accompanying notes to these condensed consolidated