CapitaLand Commercial Trust Singapore s First Commercial REIT Investor meetings in Hong Kong
|
|
|
- Lilian Robbins
- 6 years ago
- Views:
Transcription
1 CapitaLand Commercial Trust Singapore s First Commercial REIT Investor meetings in Hong Kong 1 24 and 25 August 2015
2 Important Notice This presentation shall be read in conjunction with CCT s 2Q 2015 Unaudited Financial Statement Announcement. The past performance of CCT is not indicative of the future performance of CCT. Similarly, the past performance of CapitaLand Commercial Trust Management Limited, the manager of CCT is not indicative of the future performance of the Manager. The value of units in CCT (CCT Units) and the income derived from them may fall as well as rise. The CCT Units are not obligations of, deposits in, or guaranteed by, the CCT Manager. An investment in the CCT Units is subject to investment risks, including the possible loss of the principal amount invested. Investors have no right to request that the CCT Manager redeem or purchase their CCT Units while the CCT Units are listed. It is intended that holders of the CCT Units may only deal in their CCT Units through trading on Singapore Exchange Securities Trading Limited (SGX-ST). Listing of the CCT Units on the SGX-ST does not guarantee a liquid market for the CCT Units. This presentation may contain forward-looking statements that involve assumptions, risks and uncertainties. Actual future performance, outcomes and results may differ materially from those expressed in forwardlooking statements as a result of a number of risks, uncertainties and assumptions. Representative examples of these factors include (without limitation) general industry and economic conditions, interest rate trends, cost of capital and capital availability, competition from other developments or companies, shifts in expected levels of occupancy rate, property rental income, charge out collections, changes in operating expenses (including employee wages, benefits and training costs), governmental and public policy changes and the continued availability of financing in the amounts and the terms necessary to support future business. You are cautioned not to place undue reliance on these forward-looking statements, which are based on the current view of the CCT Manager on future events. 2
3 Content 1. Highlights Q 2015 Financial Results and 14 Prudent Capital Management 3. CapitaGreen - Distributable income 21 contribution from 40% stake expected in Resilient Portfolio Singapore Office Market Summary Supplementary Information 46 Slide No. *Any discrepancies in the tables and charts between the listed figures and totals thereof are due to rounding. 3


4 1. Highlights Capital Tower, Singapore 4
5 1H 2015 DPU rose by 2.1% y-o-y, driven by resilient portfolio performance Distribution per unit (DPU) Contribution from operating properties in Singapore including JVs (Taxable) Contribution from holdings in MRCB-Quill REIT (Tax-exempt) 2Q 2015 (cents) 2Q 2014 (cents) Change % 1H 2015 (cents) 1H 2014 (cents) Change % (1) NM NM Note: (1) DPU for 1H 2014 of 4.22 cents consisted of the adjusted DPU of 2.04 cents from 2.08 cents for 1Q 2014 and DPU of 2.18 cents for 2Q The adjustment took into account the conversion of S$61.5 million of convertible bonds due 2015 (CB 2015) into 51.6 million CCT units in 1H

 Continued increase in committed rents pushed monthly average office portfolio rent up 1.1% q-o-q to S$8.")
6 Highlights of performance Resilient portfolio 3.6% higher net property income driven by resilient portfolio performance Portfolio committed occupancy rate: 99.7% without CapitaGreen 98.0% including CapitaGreen CapitaGreen secured committed occupancy of 80.4% (1) Continued increase in committed rents pushed monthly average office portfolio rent up 1.1% q-o-q to S$8.88 psf CCT portfolio committed occupancy 2Q Q % 99.7% Valuation of portfolio up by 0.9% as at 30 June 2015 due to higher net property income Note: (1) CapitaGreen s total net lettable area is 703,000 sf as at 30 June
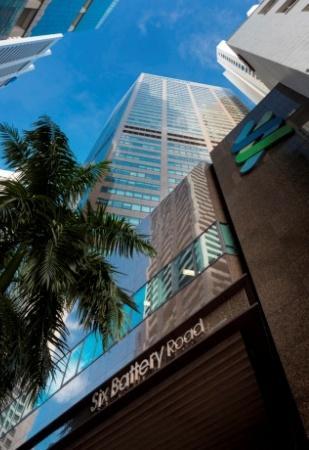
7 Active portfolio leasing In 2Q 2015, CCT signed approximately 179,000 square feet (1) of new leases and renewals, of which 57% are new leases. The above includes retail space of approximately 51,000 square feet. For 2Q 2015, new and renewed tenants include: Tenant Trade Sector Building Rakuten Asia Pte. Ltd. IT, Media and Telecommunications CapitaGreen Marubeni Asean Pte. Ltd. Energy and Commodities CapitaGreen Bank Islam Brunei Darussalam Berhad Elion International Merchant Trading Asia Pte. Ltd. Vertex Venture Management Pte. Ltd. Total Trading Gas & Power Asia Private Limited Banking, Insurance and Financial Services Energy and Commodities Banking, Insurance and Financial Services Energy and Commodities Six Battery Road One George Street Raffles City Tower Raffles City Tower Note: (1) Includes CapitaGreen 7
8 New demand in CCT s portfolio supported by tenants from diverse trade sectors 48% 36% 7% 5% 2% 1% 1% Business Consultancy, IT, Media and Telecommunications Energy, Commodities, Maritime and Logistics Banking, Insurance and Financial Services Education and Services Retail Products and Services Manufacturing and Distribution Food and Beverage Note: (1) Based on net lettable area of new leases committed and using 100% basis for Raffles City Singapore and CapitaGreen 8
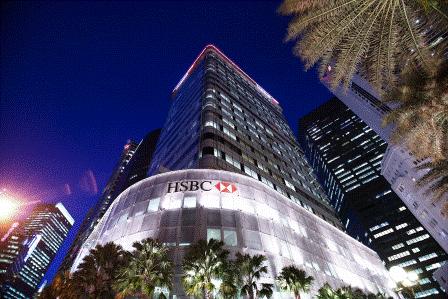
9 Portfolio valuation up 0.9% mainly due to higher net property income Capital values per sq ft still below market transactions Investment Properties 31 Dec 2014 $m 30 Jun 2015 $m 6-month Variance (Dec 2014 to Jun 2015) % 30 Jun 2015 Capital Value $psf Capital Tower 1, , ,768 Six Battery Road 1, , ,722 One George Street , ,235 Twenty Anson ,097 HSBC Building ,255 Golden Shoe Car Park NM (1) Wilkie Edge ,266 Bugis Village (2) (0.4) 456 Sub- Total 4, , Raffles City (60%) 1, , NM (1) CapitaGreen (40%) ,226 Total 7, , Notes: (1) NM indicates Not Meaningful. (2) The valuation of Bugis Village takes into account the right of the President of the Republic of Singapore, as Lessor under the State Lease, to terminate the said Lease on 1 April 2019 upon payment of S$6,610, plus accrued interest. 9
10 Higher values supported by higher achieved rents Office rent growth rates (1) assumed for discounted cashflow method remained at an average 3.9% (2) per annum over 10 years. Terminal yields (3) same as capitalisation rates for Six Battery Road and HSBC Building which have 999-year lease tenures, 0.25% higher than capitalisation rates for the rest of the portfolio Dec 10 Dec 11 Capitalisation Rates Dec 12 Dec 13 Dec 14 Jun 15 Dec 10 Dec 11 Discount Rates Capital Tower Six Battery Road One George Street HSBC Building Twenty Anson NA NA NA NA Wilkie Edge (4) CapitaGreen NA NA NA NA NA NA NA NA Raffles City SG Dec 12 Dec 13 Dec 14 Jun 15 Office Retail Hotel Notes: (1) Excludes Golden Shoe Car Park and Bugis Village (2) Calculated on a simple average basis (3) Excludes Bugis Village due to the right of the President of the Republic of Singapore, as Lessor under the State Lease, to terminate the said Lease on 1 April 2019 upon payment of S$6,610, plus accrued interest (4) Refers to office capitalisation rate only (5) CBRE was the appointed valuer for CCT properties and Raffles City Singapore for Jun For CapitaGreen, the appointed valuer was Knight Frank and CBRE for Dec 2014 and Jun 2015 respectively.
11 Robust balance sheet with strong credit metrics Financial flexibility for growth and to mitigate economic risks Low gearing Debt headroom 29.5% 2Q 2014: 28.8% S$1.3 billion Assuming 40% gearing Average cost of debt 2.4% p.a. No change from 2.4% p.a. in 2Q 2014 Interest coverage (1) 7.6 times 2Q 2014: 6.8 times Gross borrowings on fixed rate 83% 2Q 2014: 80% Note: (1) Ratio of EBITDA over finance costs which includes amortisation and transaction costs 11

12 CCT deposited properties grew 4.4% y-o-y Deposited Properties S$7,676.2 million 4.4% YoY Adjusted NAV Total per Net Unit Lettable Market Area: 703,000 Capitalisation sq ft No. of storeys: 40 S$1.72 Committed Occupancy: S$4,201.6 approximately 565,200 sq ft or 80.4% million 3.0% YoY As at 31 July 2015 Capital Tower One George Street Six Battery Road CapitaGreen 12
13 CCT trading at 388 bps risk premium above 10-year government bond yield CCT's distribution yield (1) 6.5% FTSE REIT Index dividend yield 6.3% CCT's net property yield (2) 4.8% Straits Times Index dividend yield 3.7% Office property transacted yields 2.5% to 3.5% 10-year government bond yield 2.6% CPF (ordinary) account interest rate 2.5% Bank fixed deposit rate (12-month) Bank savings deposit rate 0.1% 0.3% CCT s distribution yield at 388 bps above 10-year government bond yield Notes: (1) CCT Group distribution yield is based on annualised 1H 2015 DPU of 4.31 cents over closing price of S$1.335 as at 17 Aug 2015 (2) CCT Group (including RCS Trust and excluding CapitaGreen) net property yield based on 1H 2015 net property income and Jun 2015 valuation (3) All information as at 30 Jun 2015 except for FTSE REIT Index, STI and 10-year government bond yield which are as at 17 Aug Sources: Bloomberg, Monetary Authority of Singapore, Central Provident Fund, Singapore Government Securities, CBRE Pte. Ltd. 13

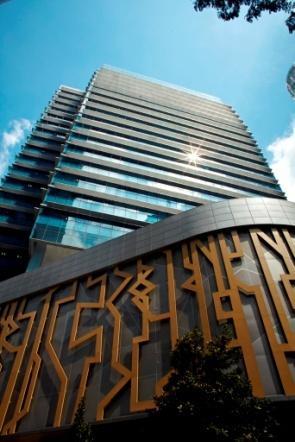
14 2. 2Q 2015 Financial Results and Prudent Capital Management One George Street, Singapore 14
 64.")
15 2Q 2015 distributable income rose by 0.5% y-o-y Gross Revenue S$69.1 million 5.0% YoY Net Property Income S$53.9 million 3.6% YoY Distributable Income (1) S$64.4 million 0.5% YoY S$ million Q Q 2015 (2) 64.4 Gross Revenue Net Property Income Distributable Income Growth in revenue due to higher rents and occupancy rate Mainly due to revenue growth offset by higher property tax Higher NPI for CCT portfolio and more distributable income from RCS Trust Note: 1. Distributable income in 2Q 2014 had included S$2.4 million of tax-exempt income from MRCB-Quill REIT (MQREIT formerly Quill Capita Trust). 15
16 1H 2015 distributable income rose by 2.5% y-o-y Gross Revenue S$137.3 million 5.7% YoY Net Property Income S$107.8 million 5.0% YoY Distributable Income (1) S$127.2 million 2.5% YoY S$ million H H Gross Revenue Net Property Income Distributable Income Growth in revenue due to higher rents and occupancy rate Mainly due to revenue growth offset by higher property tax Higher NPI for CCT portfolio and more distributable income from RCS Trust Note: 1. Distributable income in 1H 2014 had included S$2.4 million of tax-exempt income from MQREIT. 16
17 Robust balance sheet Statement of Financial Position As at 30 Jun 2015 S$ '000 S$ '000 Non-current Assets 6,425,536 Deposited Properties (2) 7,676,174 Current Assets 132,117 Total Assets 6,557,653 Net Asset Value Per Unit $1.76 Current Liabilities (1) 259,657 Adjusted Net Asset Value Per Unit $1.72 Non-current Liabilities 1,101,140 (excluding distributable income) Total Liabilities 1,360,797 Net Assets 5,196,856 Credit Rating Unitholders' Funds 5,196,856 A- by S&P A3 by Moody's Units in issue ('000) 2,948,514 Outlook Stable Notes: (1) There are sufficient credit facilities to refinance borrowings due in (2) Deposited properties for CCT Group includes CCT s 60.0% interest in total assets of RCS Trust (S$1.88 billion) and 40.0% interest in MSO Trust (S$0.63 billion). 17
18 Strong financial ratios 1Q Q 2015 Remarks Total Gross Debt (1) S$2,263.7 m S$2,265.3 m Increased Gearing (2) 29.9% 29.5% Decreased (Higher value of deposited properties) Net Debt / EBITDA (3) 5.0 times 4.9 times Stable Unencumbered Assets as % of Total Assets (4) 100.0% 100.0% Stable Average Term to Maturity 4.1 years 3.9 years Decreased (Passing of time) Average Cost of Debt (p.a.) (5) 2.4% 2.4% Stable Interest Coverage (6) 7.6 times 7.6 times Stable Notes: (1) Total gross debt includes CCT s 60.0% interest in RCS Trust and 40.0% interest in MSO Trust. (2) In accordance with Property Funds Appendix, CCT s proportionate share of its joint ventures borrowings and deposited property values are included when computing the gearing ratio. (3) Net debt excludes borrowings of RCS Trust and MSO Trust. EBITDA refers to earnings before interest, tax, depreciation and amortisation but after share of profit of associate and joint ventures. (4) Investment properties at CCT Trust and Twenty Anson (held through CCT s 100.0% interest in FirstOffice Pte. Ltd.) are all unencumbered. (5) Ratio of interest expense over weighted average borrowings. (6) Ratio of EBITDA over finance costs which includes amortisation and transaction costs. 18
 $120m (5%) $21m (1%) $356m (16%) $200m (9%) $480m")
 (a) $100m (4%) (a) Note: (1 CCT issued S$100.")

19 S$ million (% of total borrowings) Diversified funding sources and well spread debt maturity profile As at 30 Jun 2015 (2) $120m (5%) $21m (1%) $356m (16%) $200m (9%) $480m (21%) $175m (8%) $200m (9%) $100m (4%) $240m $148m (11%) (7%) $50m (2%) $75m (3%) (a) (a) $100m (4%) (a) Note: (1 CCT issued S$100.0 million 2.96% p.a. fixed rate notes due August 2021 on 13 August 2015, of which S$90.0 million was used to repay revolving bank loan due in This is not reflected in the chart. 19


20 83% of fixed rate borrowings provides certainty of interest expense CCT bank loans $180m RCS revolving facility loan $21m Proforma FY2015 impact: Interest expense (1) Assuming +0.5% p.a. increase in interest rate +$1.0 million p.a. MSO bank loan $180m Borrowings on Floating Rate 17% Annualised 1H 2015 DPU cents (0.4% of annualised DPU) Borrowings on Fixed Rate 83% Note: (1) Excludes floating rate borrowings of MSO Trust (owns CapitaGreen) 20

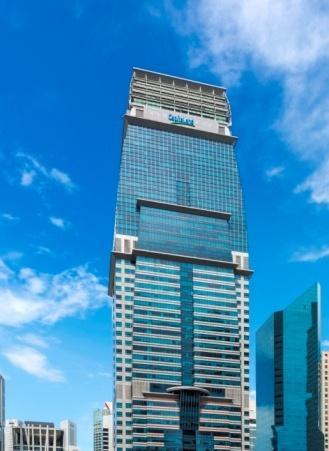
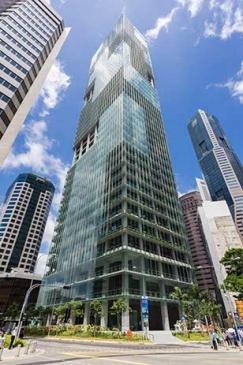
21 3. CapitaGreen Distributable income contribution from 40% stake expected in 2016 Six Battery Road, Singapore 21
 of NLA or 566,000 sq ft Committed tenants are on long term leases and 74% predominantly from the Insurance, Energy and Commodities and IT sectors Tenant trade mix (2) for CapitaGreen Lease")
22 CapitaGreen committed leases for approximately 80.4% (1) of NLA or 566,000 sq ft Committed tenants are on long term leases and 74% predominantly from the Insurance, Energy and Commodities and IT sectors Tenant trade mix (2) for CapitaGreen Lease expiry profile for CapitaGreen Banking and Financial Services, 15% Education and Services, 3% Real Estate and Property Services, 5% Legal, 2% Food and Beverage, 1% Insurance, 30% 84% 87% 16% 13% IT, Media and Telecommunications, 21% Energy and Commodities, 23% No leases expiring from 2015 to and beyond Committed Monthly Gross Rental Income Committed Net Lettable Area 22 Notes: (1) CapitaGreen s total net lettable area is 703,000 sf as at 30 June 2015 (2) Based on net lettable area of leases committed at CapitaGreen


 Space taken by New Set-up/New Concept (6%) Note: (1) Based on net lettable area of leases committed")
23 Drivers of CapitaGreen s committed NLA Half of the committed space leased by tenants who are expanding (1) Consolidation from Other Buildings and Centralisation, 12% Flight to Quality, 7% New Set-up/New Concept, 6% Committed area in sf 350, , , , ,000 Increase in demand for space by 113% Increase of 113% 33, , ,000 sf of new demand 100,000 50, , ,000 Consolidation for Operational Efficiency, 25% Expansion, 50% 0 Previous Location Leases at CapitaGreen (as at 30 Jun 15) Original Space at Previous Location New Expanded Space at CapitaGreen (50%) Space taken by New Set-up/New Concept (6%) Note: (1) Based on net lettable area of leases committed at CapitaGreen 23
 Exercise period: within 3 years after completion (2015 to 2017) Note: (1) Based on actual costs incurred since commencement of development in 2011 and compounded at 6.")
24 Potential acquisition pipeline of remaining 60.0% CapitaGreen 138 Market Street CapitaGreen Total project development cost of S$1.4 billion CCT owns 40.0% share of CapitaGreen Has call option to acquire balance 60.0% from JV partners Purchase price at market valuation Subject to minimum of development cost compounded at 6.3% p.a. (1) Exercise period: within 3 years after completion (2015 to 2017) Note: (1) Based on actual costs incurred since commencement of development in 2011 and compounded at 6.3% p.a. 24


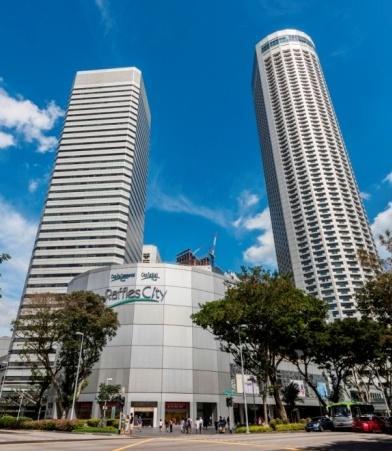
25 4. Resilient Portfolio 25 Raffles City Singapore
26 CCT s portfolio occupancy of 98.0% above market occupancy of 96.2% Including CapitaGreen CCT Committed Occupancy Excluding CapitaGreen Market Occupancy Level (2) 2Q 2015 (1) 1Q Q Q Q Q 2015 Grade A office 97.1% 95.7% 99.8% 100.0% 95.6% 94.9% Portfolio 98.0% 97.0% 99.7% 99.7% 96.2% 96.1% CCT's Committed Occupancy Since Inception 100% 90% 95.9% 99.6% 99.4% 99.3% 97.0% 98.0% 92.3% 90.8% 90.9% 88.0% 96.7% 93.7% 90.0% 98.2% 95.1% 96.0% 94.4% 92.4% 90.7% 87.5% 87.9% 88.3% 95.3% 93.2% 90.8% 99.4% 98.0% 95.7% 96.2% 90.0% 90.2% 85.0% 80% 2Q 3Q 4Q 1Q 2Q 3Q 4Q 1Q 2Q 3Q 4Q 1Q 2Q 3Q 4Q 1Q 2Q 3Q 4Q 1Q 2Q 3Q 4Q 1Q 2Q 3Q 4Q 1Q 2Q 3Q 4Q 1Q 2Q 3Q 4Q 1Q 2Q 3Q 4Q 1Q 2Q 3Q 4Q 1Q 2Q Notes: (3) (4) CCT URA CBRE's Core CBD Occupancy Rate (1) Including CapitaGreen s occupancy of 80.4% as at 30 Jun 2015 (2) Source: CBRE Pte. Ltd. (3) Source: URA. (4) Covers Raffles Place, Marina Centre, Shenton Way and Marina Bay, data only available from 3Q 2005 onwards 26
27 Overall positive rental reversions for CCT s Grade A office leases committed in 2Q 2015 S$ psf per month Average Expired Rents Committed Rents (1) Sub-Market Market Rents of Comparative Sub-Market Colliers (2) DTZ (3) CapitaGreen (5) Premium Grade Raffles Place S$11.93 S$10.80 Six Battery Road Grade A Raffles Place S$10.43 S$10.80 One George Street Grade A Raffles Place S$10.43 S$10.80 Notes: (1) Renewal/new leases committed in 2Q 2015 (2) Source: Colliers International 2Q 2015 (3) DTZ average gross rent for Raffles Place. Source: DTZ 2Q (4) CBRE Pte. Ltd. s 2Q 2015 Grade A rent is S$11.30 psf per month and they do not publish sub-market rents (5) Rents committed up to 30 June
28 Monthly average office rent of CCT s portfolio (1)(2) up by 1.1% q-o-q $9.00 $8.50 $8.00 $7.50 $7.00 $6.50 $6.00 $5.50 $5.00 $ Sep-11 Dec-11 Mar-12 Jun-12 Sep-12 Dec-12 Mar-13 Jun-13 Sep-13 Dec-13 Mar-14 Jun-14 Sep-14 Dec-14 Mar-15 Jun % 10003% 10006% 10008% 10010% 10013% 10015% 10018% 10020% 10022% 10025% 10027% 10030% 10032% 10034% 10037% 10039% 10042% 10044% 10046% 10049% 10051% 10054% 10056% 10058% 10061% 10063% 10066% 10068% 10070% 10073% 10075% 10078% 10080% 10082% 10085% 10087% 10090% 10092% 10094% 10097% 10099% 10102% 10104% 10106% 10109% 10111% 10114% 10116% 10118% 10121% 10123% 10126% 10128% 10130% 10133% 10135% 10138% 10140% 10142% 10145% 10147% 10150% 10152% 10154% 10157% 10159% 10162% 10164% 10166% 10169% 10171% 10174% 10176% 10178% 10181% 10183% 10186% 10188% 10190% 10193% 10195% 10198% 10200% 9000% 9002% 9005% 9007% 9010% 9012% 9014% 9017% 9019% 9022% 9024% 9026% 9029% 9031% 9034% 9036% 9038% 9041% 9043% 9046% 9048% 9050% 9053% 9055% 9058% 9060% 9062% 9065% 9067% 9070% 9072% 9074% 9077% 9079% 9082% 9084% 9086% 9089% 9091% 9094% 9096% 9098% 9101% 9103% 9106% 9108% 9110% 9113% 9115% 9118% 9120% 9122% 9125% 9127% 9130% 9132% 9134% 9137% 9139% 9142% 9144% 9146% 9149% 9151% 9154% 9156% 9158% 9161% 9163% 9166% 9168% 9170% 9173% 9175% 9178% 9180% 9182% 9185% 9187% 9190% 9192% 9194% 9197% 9199% 9202% 9204% 9206% 9209% 9211% 9214% 9216% 9218% 9221% 9223% 9226% 9228% 9230% 9233% 9235% 9238% 9240% 9242% 9245% 9247% 9250% 9252% 9254% 9257% 9259% 9262% 9264% 9266% 9269% 9271% 9274% 9276% 9278% 9281% 9283% 9286% 9288% 9290% 9293% 9295% 9298% 9300% 9302% 9305% 9307% 9310% 9312% 9314% 9317% 9319% 9322% 9324% 9326% 9329% 9331% 9334% 9336% 9338% 9341% 9343% 9346% 9348% 9350% 9353% 9355% 9358% 9360% 9362% 9365% 9367% 9370% 9372% 9374% 9377% 9379% 9382% 9384% 9386% 9389% 9391% 9394% 9396% 9398% 9401% 9403% 9406% 9408% 9410% 9413% 9415% 9418% 9420% 9422% 9425% 9427% 9430% 9432% 9434% 9437% 9439% 9442% 9444% 9446% 9449% 9451% 9454% 9456% 9458% 9461% 9463% 9466% 9468% 9470% 9473% 9475% 9478% 9480% 9482% 9485% 9487% 9490% 9492% 9494% 9497% 9499% 9502% 9504% 9506% 9509% 9511% 9514% 9516% 9518% 9521% 9523% 9526% 9528% 9530% 9533% 9535% 9538% 9540% 9542% 9545% 9547% 9550% 9552% 9554% 9557% 9559% 9562% 9564% 9566% 9569% 9571% 9574% 9576% 9578% 9581% 9583% 9586% 9588% 9590% 9593% 9595% 9598% 9600% 9602% 9605% 9607% 9610% 9612% 9614% 9617% 9619% 9622% 9624% 9626% 9629% 9631% 9634% 9636% 9638% 9641% 9643% 9646% 9648% 9650% 9653% 9655% 9658% 9660% 9662% 9665% 9667% 9670% 9672% 9674% 9677% 9679% 9682% 9684% 9686% 9689% 9691% 9694% 9696% 9698% 9701% 9703% 9706% 9708% 9710% 9713% 9715% 9718% 9720% 9722% 9725% 9727% 9730% 9732% 9734% 9737% 9739% 9742% 9744% 9746% 9749% 9751% 9754% 9756% 9758% 9761% 9763% 9766% 9768% 9770% 9773% 9775% 9778% 9780% 9782% 9785% 9787% 9790% 9792% 9794% 9797% 9799% 9802% 9804% 9806% 9809% 9811% 9814% 9816% 9818% 9821% 9823% 9826% 9828% 9830% 9833% 9835% 9838% 9840% 9842% 9845% 9847% 9850% 9852% 9854% 9857% 9859% 9862% 9864% 9866% 9869% 9871% 9874% 9876% 9878% 9881% 9883% 9886% 9888% 9890% 9893% 9895% 9898% 9900% 9902% 9905% 9907% 9910% 9912% 9914% 9917% 9919% 9922% 9924% 9926% 9929% 9931% 9934% 9936% 9938% 9941% 9943% 9946% 9948% 9950% 9953% 9955% 9958% 9960% 9962% 9965% 9967% 9970% 9972% 9974% 9977% 9979% 9982% 9984% 9986% 9989% 9991% 9994% 9996% 9998% Notes: Committed occupancy of office portfolio (%) (1) Average gross rent per month for office portfolio (S$ psf) = Total committed gross rent for office per month Committed area of office per month (2) Includes 40.0% interest in CapitaGreen with effect from Dec 2014 Average gross rent per month for office portfolio (S$ psf) 28
29 Top 10 blue-chip tenants contribute 42% of monthly gross rental income (1) Most of the top 10 tenants have leases expiring beyond 2018 as a result of our strategic leasing focus 13% 5% 5% 4% 4% 3% 2% 2% 2% 2% RC Hotels (Pte) Ltd GIC Private Limited The JPMorgan Hongkong Chase Bank, and N.A. Shanghai Banking Corporation Limited Standard Chartered Bank CapitaLand Group Robinson & Company (Singapore) Private Limited Mizuho Bank, Ltd. Notes: (1) Based on monthly gross rental income of top ten tenants as at 30 Jun 2015, excluding retail turnover rent (2) Mizuho Bank s lease expired on 30 Jun 2015 (2) The Royal Bank of Scotland PLC Credit Agricole Corporate and Investment Bank 29
30 Well spread portfolio lease expiry profile Lease expiry profile (1) as a percentage of committed monthly gross rental income (2) 36% 4% 13% 4% 2% 11% 6% 10% 11% 3% 4% 4% 9% and beyond Office Retail Hotels and Convention Centre Completed Portfolio WALE (3) by NLA as at end Jun 2015 = 7.7 years Notes: (1) Includes CapitaGreen (2) Excludes retail and hotel turnover rent (3) WALE: Weighted Average Lease term to Expiry 30
31 Office lease expiry profile Office lease expiry profile (1) as a percentage of committed net lettable area and committed monthly gross rental income 50% 54% 18% 23% 15% 15% 14% 16% 12% 13% 5% 6% and beyond Monthly Gross Rental Income Net Lettable Area Completed Note: (1) Includes CapitaGreen 31
32 Expiring rents below current market rent 2Q 2015 Industry Statistics (1) Grade A Office Average Market Rent: S$11.30 psf per month 60% 2015 Average rent of remaining leases expiring is S$8.59psf (1) % % 0% % 0.3% 1% 1% Capital Tower Six Battery Road One George Street Raffles City Tower Average monthly gross rental rate for expiring leases (S$ psf / month) Monthly gross rental income for leases expiring at respective properties X 100% Monthly gross rental income for office portfolio Note: (1) Source: CBRE Pte. Ltd. as at 2Q
33 Continue to renew leases ahead of expiries 60% 2016 Average rent of leases expiring is S$9.82psf (1) 20 60% 2017 Average rent of leases expiring is S$10.24psf (1) 20 40% 20% % 20% % 1% Capital Tower 6% Six Battery Road 4% 2% One George Street Raffles City Tower 4 0 0% No leases due Capital Tower 5% 4% 2% Six Battery Road One George Street Raffles City Tower 4 0 Average monthly gross rental rate for expiring leases (S$ psf/month) Monthly gross rental income for leases expiring at respective properties X 100% Monthly gross rental income for office portfolio Note: (1) Three Grade A buildings and Raffles City Tower only 33
34 Focus on managing controllable costs Achieved year-on-year savings in utilities of 27.9% in 2Q 2015 (1) Locked in electricity tariff rates for three years from 1Q 2015 S$mil Savings of 27.9% Q Q Q Q Q Q 2015 Utilities cost Note: (1) Excludes Raffles City Singapore and CapitaGreen 34


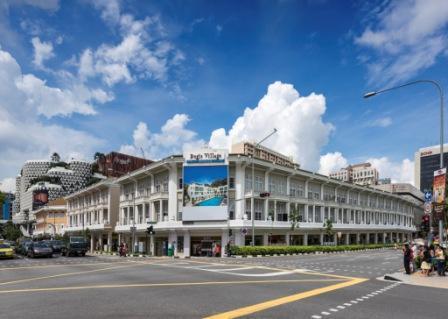
35 5. Singapore office market Wilkie Edge, Singapore 35
36 sq ft million Limited new supply in CBD in 2015; CBD Core occupancy at 96.2% as at end Jun Singapore Private Office Space (Central Area) Net Demand & Supply Post-Asian financial crisis, SARs & GFC -weak demand & undersupply H Net Supply Net Demand Forecast average annual gross new supply (2015 to 2019): 1.1 mil sq ft Forecast new supply in 2015 are strata offices (3) (4) major new supply includes Marina One, DUO, and Guoco Tower F 2016F 2017F 2018F< Forecast Supply 36 Periods Average annual net supply Average annual net demand (through 10-year property market cycles) 0.8m sq ft 1.0m sq ft (five years period post GFC) 1.0m sq ft 1.2m sq ft (gross supply) 1.1m sq ft N.A. Notes: (1) Central Area comprises The Downtown Core, Orchard and Rest of Central Area (2) Supply is calculated as net change of stock over the quarter and may include office stock removed from market due to conversions or demolitions (3) Source: Historical data from URA statistics as at 2Q 2015; Forecast supply from CBRE Pte. Ltd. as at 2Q 2015 (4) South Beach Development obtained TOP in 1Q 2015; 2015 forecast new supply are strata offices, namely, SBF Centre and EON Shenton
37 Known Future Office Supply in Central Area ( <) Expected completion Proposed Office Projects Location NLA (sq ft) 2015 SBF Centre (Strata Office) Shenton Way 353, PS100 (Strata Office) Tanjong Pagar 71, EON Shenton (Redevelopment of Marina House) (Strata Office) Shenton Way 101,000 Subtotal (2015): 525,000 3Q 2016 DUO Bugis 570,000 3Q 2016 Guoco Tower Tanjong Pagar 850,000 4Q 2016 V on Shenton (Former UIC Building at 5 Shenton Way) Shenton Way 278,000 4Q 2016 Marina One Marina Bay 1,876,000 4Q 2016 GSH Building (Strata Office) (Remodeling of existing buildings) Raffles Place 282, Redevelopment of International Factors Building and Robinson Towers Subtotal (2016): 3,856,000 Robinson Road 215, Oxley Tower (Strata Office) Shenton Way 112,000 Subtotal (2017): 327,000 2Q 2018 Frasers Tower Shenton Way 645,000 Subtotal (2018 and beyond): 645,000 TOTAL FORECAST SUPPLY ( <) 5,353,000 Total forecast supply excluding strata offices 4,434, Note: (1) Source: CBRE Pte. Ltd.


38 Core CBD office space constitutes 49.5% of total office stock Total island-wide office stock in Singapore: 55.8m sq ft Decentralised Areas 23.3% CBD 49.5% Region Area (sq ft) (1) % of total stock Core CBD 27.6m 49.5% Fringe CBD 15.2m 27.2% Decentralised Areas 13.0m 23.3% Total 55.8m 100% CBD Fringe 27.2% Notes: (1) Total area may not add up due to rounding (2) Source: CBRE Pte. Ltd. (2Q 2015) 38
39 1Q02 2Q02 3Q02 4Q02 1Q03 2Q03 3Q03 4Q03 1Q04 2Q04 3Q04 4Q04 1Q05 2Q05 3Q05 4Q05 1Q06 2Q06 3Q06 4Q06 1Q07 2Q07 3Q07 4Q07 1Q08 2Q08 3Q08 4Q08 1Q09 2Q09 3Q09 4Q09 1Q10 2Q10 3Q10 4Q10 1Q11 2Q11 3Q11 4Q11 1Q12 2Q12 3Q12 4Q12 1Q13 2Q13 3Q13 4Q13 1Q14 2Q14 3Q14 4Q14 1Q15 2Q15 Monthly gross rent by per square foot Grade A office market rent eased by 0.9% in 2Q Q 14 3Q 14 4Q 14 1Q 15 2Q 15* $20 $18 Mthly rent (S$ / sq ft ) % change +3.4% +3.3% +2.3% +1.8% -0.9% S$18.80 $16 $14 S$11.06 S$11.30 $12 $10 S$8.00 $8 S$4.48 $6 $4 $2 Post-SARs, Dot.com crash Global financial crisis Euro-zone crisis $0 Source of data: CBRE Pte. Ltd. (figures as at end of each quarter). 39

40 Wong Chow Mein, CapitaLand Building People Photography Competition Summary Raffles City Singapore 40
 Global financial crisis and Euro-zone debt crisis Distribution Per Unit (cents) Global financial crisis and Euro-zone debt crisis 11 120.4 153 198.5 249.")
 CAGR: Compounded Annual Growth Rate; After taking into")
41 Established track record: CCT delivered higher returns y-o-y through property market cycles Due to successful portfolio reconstitution strategy including recycling of capital, AEI, acquisition and development Distributable Income (S$ million) Global financial crisis and Euro-zone debt crisis Distribution Per Unit (cents) Global financial crisis and Euro-zone debt crisis (2) (3) (4) H H 2015 Notes: (1) CAGR: Compounded Annual Growth Rate; After taking into consideration the issue of rights units in July 2009 (2) Annualised (3) After taking into consideration the issue of rights units in July 2009 (4) Decline in 2011 DPU compared to 2010 was due to divestment of two properties in 2010, Robinson Point and StarHub Centre 41
42 Outlook 2016 outlook External Growth Financial Flexibility Resilient existing portfolio Additional contribution from 40.0% stake in CapitaGreen will mitigate potential headwinds in the office market Acquisition pipeline: Call option to buy 60.0% interest in CapitaGreen within 3 years ( ) after completion Growth through development supported by strong balance sheet Debt headroom of S$1.3 billion assuming 40% gearing 42
43 CCT 1H 2015 Distribution Details Distribution period 1 January to 30 June 2015 DPU Taxable cents Distribution Payment Date Thursday, 27 August

44 Accolades CapitaGreen was named winner of Best Tall Building in Asia and Australasia by the Council on Tall Buildings and Urban Habitats (CTBUH) on 22 June CTBUH is the world s leading resource for professionals focused on the design and construction of tall buildings and future cities. 44
 168 Robinson Road, #28-00 Capital Tower, Singapore 068912 Tel: (65) 6713 2888; Fax: (65) 6713 2999")
45 Thank you 45 For enquiries, please contact: Ms Ho Mei Peng, Head, Investor Relations & Communications, Direct: (65) CapitaLand Commercial Trust Management Limited ( 168 Robinson Road, #28-00 Capital Tower, Singapore Tel: (65) ; Fax: (65)


46 Ng Hock How, CapitaLand Building People Photography Competition Supplementary Information Raffles City Singapore 46
47 Gross Revenue up 5.7% YoY (1) Gross Revenue by property 1H H S$ million Capital Tower Six Battery Road One George Street Twenty Anson HSBC Building Golden Shoe Car Park Bugis Village Wilkie Edge 60% interest in Raffles City Singapore 40% interest in CapitaGreen Note: (1) Excludes joint ventures 47
 Capital Tower Six Battery Road One George Street Twenty Anson HSBC Building Golden Shoe Car Park Bugis Village Wilkie Edge 60% interest in Raffles City 40% interest in CapitaGreen Note: (1)")
48 Net Property Income up 5.0% YoY (1) Net Property Income by property 1H H S$ million (0.1) (2.8) Capital Tower Six Battery Road One George Street Twenty Anson HSBC Building Golden Shoe Car Park Bugis Village Wilkie Edge 60% interest in Raffles City 40% interest in CapitaGreen Note: (1) Excludes joint ventures 48
49 Portfolio committed occupancy rate (1) consistently above 90% Q Q 2015 Capital Tower Six Battery Road (2) 93.0 (2) 98.6 (2) Bugis Village Golden Shoe Car Park HSBC Building Raffles City (60% interest) Wilkie Edge One George Street Twenty Anson CapitaGreen (40% interest) (3) Portfolio Occupancy (4) Notes: (1) For years 2004 to 2009, portfolio occupancy rate includes Starhub Centre and Robinson Point which were divested in 2010 (2) Six Battery Road s AEI was completed in Dec 2013 (3) CapitaGreen is a Grade A office tower on the former site of Market Street Car Park. It obtained TOP on 18 Dec 2014 (4) Portfolio occupancy rate excluding CapitaGreen as at 30 Jun 2015 is 99.7% 49

 S$4.")


 32% Owned by")

 Bugis Village")


50 CapitaLand Commercial Trust First Commercial REIT in Singapore (since 11 May 2004) S$4.2b # Market Capitalisation 10 Properties in Singapore s Central Area S$7.7b* Deposited Properties About 4 million sq ft NLA (100% basis) 32% Owned by CapitaLand Group HSBC Building CapitaGreen Raffles City Singapore (40% stake) (60% stake) Bugis Village Six Battery Road Capital Tower One George Street Twenty Anson Wilkie Edge Golden Shoe Car Park 50 # Market Capitalisation as at 31Jul 2015 * Deposited Properties as at 30 Jun 2015
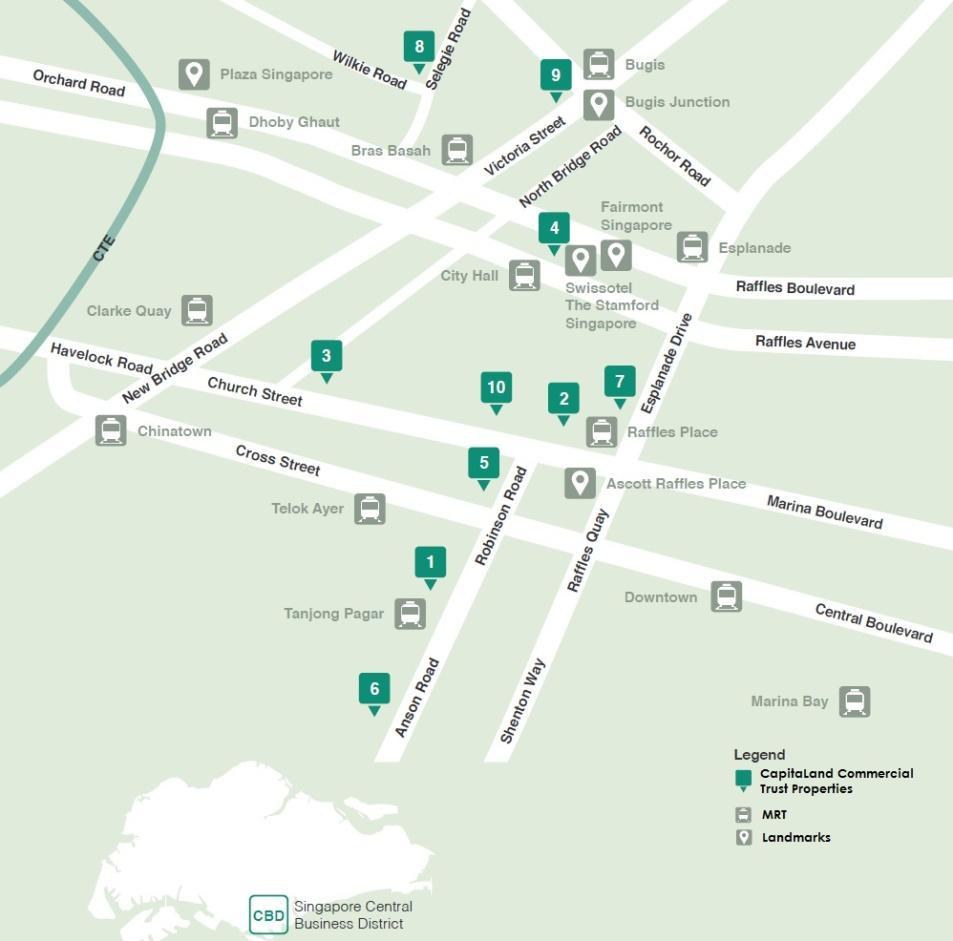
51 Owns 10 centrally-located quality commercial properties Capital Tower 6. Twenty Anson 2. Six Battery Road 7. HSBC Building 3. One George Street 8. Wilkie Edge Raffles City Singapore 9. Bugis Village 5. CapitaGreen 10. Golden Shoe Car Park (obtained TOP on 18 Dec 2014)
 Based on gross rental income from 1 Jan 2015 to 30 Jun 2015,")
52 67% of gross rental income (1) contributed by office and 33% by retail and hotel & convention centre CCT s income contribution by sector Mainly from 60% interest in Raffles City Hotels & Hotels & Convention Centre, Centre, 13% 13% Master lease to hotel operator with over 70% of rent on fixed basis Office, 67% Retail, 20% Note: (1) Based on gross rental income from 1 Jan 2015 to 30 Jun 2015, including gross rental income from CCT s 60.0% interest in Raffles City Singapore and excluding retail turnover rent 52


53 Portfolio diversification with focus on quality 91% of Net Property Income (1) from Grade A and prime offices HSBC Building, 6% Golden Shoe Car Park, 3% Twenty Anson, 5% Wilkie Edge, 3% Bugis Village, 3% Raffles City Singapore (60%), 33% One George Street, 13% Six Battery Road, 17% Capital Tower, 17% Note: (1) Based on net property income from 1 Jan 2015 to 30 Jun 2015, including net property income from CCT s 60.0% interest in Raffles City Singapore 53


 Based on committed monthly gross")

54 Diverse tenant mix in CCT s portfolio (1) Tenant mix in CCT portfolio Legal, 3% Government, 3% Education and Services, 4% Energy, Commodities, Maritime and Logistics, 5% Real Estate and Property Services, 6% Food and Beverage, 7% Manufacturing and Distribution, 7% Banking, Insurance and Financial Services, 34% Of the 34%, the following key tenants collectively contribute approximately 50%: - GIC - HSBC - JPMorgan - Standard Chartered Bank Business Consultancy, IT, Media and Telecommunications, 8% Hospitality, 12% Retail Products and Services, 11% Note: (1) Based on committed monthly gross rental income of tenants as at 30 Jun 2015, including CCT s 60.0% interest in Raffles City Singapore and 40.0% interest in CapitaGreen, and excluding retail turnover rent 54

55 Capital Tower AEI: Work in progress Budget of $40m with a target return on investment of 7.8% Completed Works Restrooms refurbished Passenger lifts upgraded Main and mezzanine lobby upgraded Security enhanced by introduction of turnstiles and self registration kiosks Chillers replaced and upgraded Ongoing Works Upper lift lobbies upgrade Completed 18 out of 39 floors AEI on schedule for completion in 4Q 2015 S$32.1 m incurred to date Refurbished and spacious main lobby 55


56 Successful portfolio reconstitution strategy has re-positioned CCT for further growth 2005: Acquired HSBC Building 2006: Acquired 60.0% interest in RCS Trust which owns Raffles City Singapore 2008: Acquired Wilkie Edge and One George Street 2010: Sale of Robinson Point and StarHub Centre 2011: Entered into joint venture for redevelopment of Market Street Car Park into a Grade A office Building called CapitaGreen 2012: Acquired Twenty Anson 18 Dec 2014: Completion of CapitaGreen 56
 Platinum 4 Capital Tower Platinum 5 One")
 Since 18 September 2009, CCT has been and continues to be a constituent of FTSE4Good Index Series (FTSE4Good), a series of benchmark")
57 Commitment to environmental sustainability and improved energy efficiency No. CCT Properties Green Mark Award 1 Six Battery Road Platinum 2 Twenty Anson Platinum 3 CapitaGreen (completed on 18 Dec 2014) Platinum 4 Capital Tower Platinum 5 One George Street Gold PLUS 6 Golden Shoe Car Park Gold PLUS 7 Raffles City Singapore Gold 8 Wilkie Edge Gold 9 HSBC Building Certified 10 Six Battery Road Tenant Service Centre Gold PLUS (Office Interior) Since 18 September 2009, CCT has been and continues to be a constituent of FTSE4Good Index Series (FTSE4Good), a series of benchmark and tradable indices derived from the globally recognized FTSE Global Equity Index Series 57

 250/252 North Bridge")
 Twenty Anson 20 Anson Road 206,000")

 S$1,872.9m (60.")
58 Property details (1) Address Capital Tower 168 Robinson Road Six Battery Road 6 Battery Road One George Street 1 George Street NLA (sq ft) 741, , ,000 Leasehold expiring Raffles City Singapore (100%) 250/252 North Bridge Road; 2 Stamford Road; 80 Bras Basah Road 801,000 (Office: 381,000, Retail: 420,000) Twenty Anson 20 Anson Road 206, Dec Apr Jan Jul Nov-2106 Committed occupancy 100.0% 100.0% 99.4% 99.0% 100.0% Valuation (30 Jun 2015) S$1,310.0m S$1,345.0m S$1,000.0m S$3,121.5m (100.0%) S$1,872.9m (60.0%) S$431.0 m Car park lots ,
 Victoria Street 50 Market Street 138 Market Street NLA (sq ft) 200,000 153,000 121,000 47,000 703,000 Leasehold expiring Committed")
 S$626.4m(40.")
 Figures shown are 100% interest. CCT owns 40.")
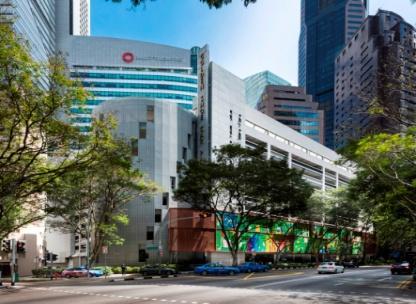
59 Property details (2) HSBC Building Wilkie Edge Bugis Village (1) Golden Shoe Car Park CapitaGreen (2) (100%) Address 21 Collyer Quay 8 Wilkie Road 62 to 67 Queen Street, 151 to 166 Rochor Road, 229 to 253 (odd nos only) Victoria Street 50 Market Street 138 Market Street NLA (sq ft) 200, , ,000 47, ,000 Leasehold expiring Committed occupancy 18-Dec Feb Mar Jan Mar % 100.0% 98.3% 100.0% 80.4% Valuation (30 Jun 2015) S$452.0m S$194.0m S$55.2m S$141.0m S$1,566.0m (100.0%) S$626.4m(40.0%) Car park lots NA 1, Notes: (1) The leasehold title and the valuation take into account the right of the President of the Republic of Singapore, as Lessor under the State Lease, to terminate the State Lease on 1 Apr 2019 upon payment of S$6,610, plus accrued interest. (2) Figures shown are 100% interest. CCT owns 40.0% of CapitaGreen development with a call option to acquire balance 60.0% within 3 years upon receipt of temporary occupation permit. CapitaGreen obtained TOP on 18 Dec
CapitaLand Commercial Trust Singapore s First Listed Commercial REIT Nomura Investment Forum Asia 2015
 CapitaLand Commercial Trust Singapore s First Listed Commercial REIT Nomura Investment Forum Asia 2015 1 Tuesday, 2 June 2015 Important Notice This presentation shall be read in conjunction with CCT s
CapitaCommercial Trust Investing in Singapore's largest office REIT (by market cap) Singapore Investment Week 2014
 Singapore Investment Week 2014") CapitaCommercial Trust Investing in Singapore's largest office REIT (by market cap) Singapore Investment Week 2014 24 May 2014 1 Important Notice This presentation shall be read in conjunction with CCT
CapitaCommercial Trust Investing in Singapore's largest office REIT (by market cap) Singapore Investment Week 2014 24 May 2014 1 Important Notice This presentation shall be read in conjunction with CCT
CapitaCommercial Trust Singapore s First Listed Commercial REIT. First Quarter 2014 Financial Results
 CapitaCommercial Trust Singapore s First Listed Commercial REIT First Quarter 2014 Financial Results Thursday, 17 April 2014 1 Important Notice This presentation shall be read in conjunction with CCT s
CapitaCommercial Trust Singapore s First Listed Commercial REIT. Presentation for investor meetings in Europe
 CapitaCommercial Trust Singapore s First Listed Commercial REIT Presentation for investor meetings in Europe 5 November 8 November 2013 1 Important Notice This presentation shall be read in conjunction
CapitaLand Commercial Trust Singapore s First and Largest Commercial REIT 2016 Financial Results
 CapitaLand Commercial Trust Singapore s First and Largest Commercial REIT 2016 Financial Results 1 Wednesday, 18 January 2017 Important Notice This presentation shall be read in conjunction with CCT s
CapitaCommercial Trust Singapore s First Listed Commercial REIT. J.P. Morgan Asia Pacific Property Conference 2014
 CapitaCommercial Trust Singapore s First Listed Commercial REIT J.P. Morgan Asia Pacific Property Conference 2014 2 April 2014 1 Important Notice This presentation shall be read in conjunction with CCT
CapitaLand Commercial Trust Singapore s First and Largest Commercial REIT
 CapitaLand Commercial Trust Singapore s First and Largest Commercial REIT 1 Presentation for investor meetings Maybank-Kim Eng Invest ASEAN 2017 Singapore 22 March 2017 Important Notice This presentation
CapitaLand Commercial Trust Singapore s First Commercial REIT Proposed Acquisition of CapitaGreen Acquiring 60.0% interest in MSO Trust units
 CapitaLand Commercial Trust Singapore s First Commercial REIT Proposed Acquisition of CapitaGreen Acquiring 60.0% interest in MSO Trust units 1 Monday, 23 May 2016 Disclaimer The past performance of CCT
CapitaLand Commercial Trust Singapore s First Commercial REIT Proposed Acquisition of 60.0% of units in MSO Trust which holds CapitaGreen
 CapitaLand Commercial Trust Singapore s First Commercial REIT Proposed Acquisition of 60.0% of units in MSO Trust which holds CapitaGreen 1 Tuesday, 21 June 2016 Disclaimer The past performance of CCT
CapitaCommercial Trust Singapore s first listed commercial REIT. Presentation for investor meetings
 CapitaCommercial Trust Singapore s first listed commercial REIT Presentation for investor meetings 3 7 September 2012 1 Important Notice This presentation shall be read in conjunction with CCT s 2Q 2012
CapitaCommercial Trust Annual General Meeting
 CapitaCommercial Trust Annual General Meeting 16 April 2013 1 Important Notice This presentation shall be read in conjunction with CCT s 2012 Full Year Unaudited Financial Statement Announcement. The past
CapitaCommercial Trust Singapore s First Listed Commercial REIT. Managed challenges, increased returns
 CapitaCommercial Trust Singapore s First Listed Commercial REIT FY 2012 Financial i Results Managed challenges, increased returns 23 January 2013 1 Important Notice This presentation shall be read in conjunction
CapitaCommercial Trust Singapore s First Listed Commercial REIT. Real Estate Investment World Asia 2013 Presentation by Ms Lynette Leong, CEO
 CapitaCommercial Trust Singapore s First Listed Commercial REIT Real Estate Investment World Asia 2013 Presentation by Ms Lynette Leong, CEO 26 June 2013 1 Important Notice This presentation shall be read
CapitaLand Commercial Trust Singapore s First and Largest Commercial REIT CapitaLand & REITs Corporate Day, Bangkok
 CapitaLand Commercial Trust Singapore s First and Largest Commercial REIT CapitaLand & REITs Corporate Day, Bangkok 1 17 August 2018 Important Notice This presentation shall be read in conjunction with
First Listed Commercial REIT. 2 September 2010
 CapitaCommercial a Trust First Listed Commercial REIT UBS ASEAN Conference UBS ASEAN Conference 2 September 2010 Important Notice This presentation shall be read in conjunction with CCT s 2010 Second Quarter
CapitaLand Commercial Trust Singapore s First and Largest Commercial REIT Annual General Meeting
 CapitaLand Commercial Trust Singapore s First and Largest Commercial REIT Annual General Meeting 1 19 April 2018 Important Notice This presentation shall be read in conjunction with CCT s FY 2017 Financial
CapitaCommercial Trust First listed commercial REIT. 3 to 4 November 2010
 CapitaCommercial Trust First listed commercial REIT Presentation for investor meetings in Hong Kong 3 to 4 November 2010 Important Notice This presentation shall be read in conjunction with CCT s 2010
CapitaCommercial Trust. 2 November 2010
 CapitaCommercial Trust First listed commercial REIT Exane Asian Convertible Bonds Conference 2010 2 November 2010 Important Notice This presentation shall be read in conjunction with CCT s 2010 Third Quarter
CapitaLand Commercial Trust Singapore s First and Largest Commercial REIT Annual General Meeting
 CapitaLand Commercial Trust Singapore s First and Largest Commercial REIT Annual General Meeting 1 18 April 2017 Important Notice This presentation shall be read in conjunction with CCT s FY 2016 Financial
CapitaLand Commercial Trust Singapore s First and Largest Commercial REIT Nomura Investment Forum Asia 2018
 CapitaLand Commercial Trust Singapore s First and Largest Commercial REIT Nomura Investment Forum Asia 2018 1 5 June 2018 Important Notice This presentation shall be read in conjunction with CCT s 1Q 2018
Annual General Meeting. 28 April 2010
 CapitaCommercial Trust Annual General Meeting Presentation 28 April 2010 Important Notice The past performance of CCT is not indicative of the future performance of CCT. Similarly, the past performance
FY 2010 Financial Results
 CapitaCommercial Trust FY 2010 Financial Results 19 January 2011 Important Notice This presentation shall be read in conjunction with CCT s 2010 Full Year Unaudited Financial Statement Announcement. The
CapitaLand Commercial Trust Singapore s First and Largest Commercial REIT Third Quarter 2018 Financial Results
 CapitaLand Commercial Trust Singapore s First and Largest Commercial REIT Third Quarter 2018 Financial Results 1 26 October 2018 Important Notice This presentation shall be read in conjunction with CCT
CCT to augment portfolio income with proposed acquisition of remaining 60.0% interest in CapitaGreen
 NEWS RELEASE For Immediate Release CCT to augment portfolio income with proposed acquisition of remaining 60.0% interest in CapitaGreen Continued strengthening of CCT s foothold in Singapore s Central
CAPITALAND COMMERCIAL TRUST 2018 FIRST QUARTER UNAUDITED FINANCIAL STATEMENT AND DISTRIBUTION ANNOUNCEMENT TABLE OF CONTENTS
 CAPITALAND COMMERCIAL TRUST DISTRIBUTION ANNOUNCEMENT TABLE OF CONTENTS Item No. Description Page No. - Summary of CCT Results 2 - Introduction 2 1(a)(i) Statement of Total Return & Distribution Statement
Citi-REITAS-SGX C-Suite Singapore REITs and Sponsors Forum
 Citi-REITAS-SGX C-Suite Singapore REITs and Sponsors Forum 23 August 2018 Important Notice This presentation shall be read in conjunction with OUE Commercial REIT s Financial Results announcement for 2Q
Investor Presentation for Tokyo Non-Deal Roadshow. 25 August 2016
 Investor Presentation for Tokyo Non-Deal Roadshow 25 August 2016 Important Notice This presentation shall be read in conjunction with OUE Commercial REIT s Financial Results announcement for 1Q 2016 dated
Financial Results for 4 th Quarter and Year Ended 31 December January 2019
 Financial Results for 4 th Quarter and Year Ended 31 December 2018 30 January 2019 Important Notice This presentation should be read in conjunction with the announcements released by OUE Commercial REIT
Presentation for REITs Symposium 2017
 Presentation for REITs Symposium 2017 27 May 2017 Important Notice This presentation shall be read in conjunction with OUE Commercial REIT s Financial Results announcement for 1Q 2017 dated 5 May 2017.
Macquarie ASEAN Conference. 26 Aug 2014
 Macquarie ASEAN Conference 26 Aug 2014 Important Notice Standard Chartered Securities (Singapore) Pte. Limited, CIMB Bank Berhad, Singapore Branch and Oversea-Chinese Banking Corporation Limited were the
REITs Symposium May 2018
 REITs Symposium 2018 19 May 2018 Important Notice This presentation shall be read in conjunction with OUE Commercial REIT s Financial Results announcement for 1Q 2018 dated 10 May 2018. This presentation
SGX - DBS Vickers - REITAS SREITS Corporate Day Investor Presentation
 SGX - DBS Vickers - REITAS SREITS Corporate Day Investor Presentation 27 Feb 1 Mar 2018 Important Notice This presentation shall be read in conjunction with OUE Commercial REIT s Financial Results announcement
2013 FULL YEAR UNAUDITED FINANCIAL STATEMENT AND DISTRIBUTION ANNOUNCEMENT
 2013 FULL YEAR UNAUDITED FINANCIAL STATEMENT AND DISTRIBUTION ANNOUNCEMENT TABLE OF CONTENTS Item No. Description Page No. - Introduction 2 - Summary of CCT GROUP Results 2 1(a) Statement of Total Return
2010 FULL YEAR UNAUDITED FINANCIAL STATEMENT AND DISTRIBUTION ANNOUNCEMENT
 2010 FULL YEAR UNAUDITED FINANCIAL STATEMENT AND TABLE OF CONTENTS Item No. Description Page No. - Summary of CCT GROUP Results 2 - Introduction 3 1(a) Statement of Total Return & Distribution Statement
2011 SECOND QUARTER UNAUDITED FINANCIAL STATEMENT AND DISTRIBUTION ANNOUNCEMENT
 2011 SECOND QUARTER UNAUDITED FINANCIAL STATEMENT AND TABLE OF CONTENTS Item No. Description Page No. - Summary of CCT GROUP Results 2 - Introduction 3 1(a) Statement of Total Return & Distribution Statement
Financial Results for 3 rd Quarter 2016
 Financial Results for 3 rd Quarter 2016 1 November 2016 Important Notice This presentation shall be read in conjunction with OUE Commercial REIT s Financial Results announcement for 3Q 2016 dated 1 November
Financial Results for 4 th Quarter 2017 and Year Ended 31 December 2017
 Financial Results for 4 th Quarter 2017 and Year Ended 31 December 2017 31 January 2018 Important Notice This presentation shall be read in conjunction with OUE Commercial REIT s Financial Results announcement
FINANCIAL RESULTS For First Quarter ended 31 March 2015
 FINANCIAL RESULTS For First Quarter ended 31 March 2015 AGENDA Q1 Highlights Financial Performance Portfolio Performance AEI Updates Looking Ahead Unit Performance 2 Q1 HIGHLIGHTS Q1 HIGHLIGHTS FINANCIAL
CAPITALAND MALL TRUST Singapore s First & Largest Retail REIT. First Quarter 2017 Financial Results
 CAPITALAND MALL TRUST Singapore s First & Largest Retail REIT First Quarter 2017 Financial Results 20 April 2017 Disclaimer This presentation may contain forward-looking statements that involve assumptions,
CAPITALAND COMMERCIAL TRUST 2018 FULL YEAR UNAUDITED FINANCIAL STATEMENT AND DISTRIBUTION ANNOUNCEMENT TABLE OF CONTENTS
 CAPITALAND COMMERCIAL TRUST TABLE OF CONTENTS Item No. Description Page No. - Summary of CCT Results 2 - Introduction 3 1(a) Statement of Total Return & Distribution Statement 4 10 1(b)(i) Statement of
Financial Results for 3 rd Quarter November 2017
 Financial Results for 3 rd Quarter 2017 2 November 2017 Important Notice This presentation shall be read in conjunction with OUE Commercial REIT s Financial Results announcement for 3Q 2017 dated 2 November
1H 2009 FINANCIAL RESULTS. 20 Jul 2009
 1H 2009 FINANCIAL RESULTS 20 Jul 2009 1 Contents Operations Review Portfolio Analysis Capital Management Market Review & Outlook Going Forward 2 Highlights 1H 2009 distributable income 29.6% y-o-y Net
Investor Presentation for Citi ASEAN Investor Conference. 12 June 2014
 Investor Presentation for Citi ASEAN Investor Conference 2 June 204 Important Notice Standard Chartered Securities (Singapore) Pte. Limited, CIMB Bank Berhad, Singapore Branch and Oversea-Chinese Banking
CAPITALAND MALL TRUST
 CAPITALAND MALL TRUST Singapore s First & Largest Retail REIT First Quarter 2018 Financial Results 20 April 2018 1 Disclaimer This presentation may contain forward-looking statements that involve assumptions,
CAPITALAND MALL TRUST Singapore s First & Largest REIT
 Photo Credit: Chun Kwong Leong, Singapore CAPITALAND MALL TRUST Singapore s First & Largest REIT 1Q 2016 Financial Results 15 April 2016 Disclaimer This presentation may contain forward-looking statements
CAPITALAND COMMERCIAL TRUST 2018 THIRD QUARTER UNAUDITED FINANCIAL STATEMENT AND DISTRIBUTION ANNOUNCEMENT TABLE OF CONTENTS
 CAPITALAND COMMERCIAL TRUST DISTRIBUTION ANNOUNCEMENT TABLE OF CONTENTS Item No. Description Page No. - Summary of CCT Results 2 - Introduction 3 1(a) Statement of Total Return & Distribution Statement
K-REIT Asia s Distributable Income for First Half 2012 (1H 2012) Grew by 94.6% Year-on-Year
 Grew by 94.6% Year-on-Year") PRESS RELEASE K-REIT Asia Unaudited Results for the Second Quarter and Half Year Ended 30 June 2012 16 July 2012 The Directors of K-REIT Asia Management Limited, as manager of K-REIT Asia, announce the
PRESS RELEASE K-REIT Asia Unaudited Results for the Second Quarter and Half Year Ended 30 June 2012 16 July 2012 The Directors of K-REIT Asia Management Limited, as manager of K-REIT Asia, announce the
CCT Announces 1-for-1 Rights Issue
 Not for distribution in the United States This release is not an offer for sale of the securities in the United States. The Rights Units and Nil- Paid Rights may not be offered or sold in the United States
CapitaCommercial Trust 3Q 2004 Results Presentation. 13 October 2004
 CapitaCommercial Trust 3Q 2004 Results Presentation 13 October 2004 Disclaimer This presentation is focused on comparing actual results versus forecast stated in the Introductory Document dated 16 March
Unaudited Results of Keppel REIT for the Second Quarter and Half Year Ended 30 June 2013
 MEDIA RELEASE Unaudited Results of Keppel REIT for the Second Quarter and Half Year Ended 30 June 2013 15 July 2013 The Directors of Keppel REIT Management Limited, as manager of Keppel REIT, are pleased
K-REIT Asia Unaudited Results for the Second Quarter and Half Year Ended 30 June 2011
 PRESS RELEASE K-REIT Asia Unaudited Results for the Second Quarter and Half Year Ended 30 June 2011 18 July 2011 The Directors of K-REIT Asia Management Limited, as manager of K-REIT Asia, announce the
3Q 2012 Presentation Slides. 1 Nov 2012
 3Q 2012 Presentation Slides 1 Nov 2012 2 Important Notice This material shall be read in conjunction with CIT s financial statements for the financial period ended 30 Sep 2012. The value of units in CIT
The Directors of Keppel REIT Management Limited, as manager of Keppel REIT, are pleased to announce the
 MEDIA RELEASE Unaudited Results of Keppel REIT for the Quarter Ended 31 March 2013 15 April 2013 The Directors of Keppel REIT Management Limited, as manager of Keppel REIT, are pleased to announce the
Raffles City Adds 41,000 sq ft of Retail Space in Phase 1 Asset Enhancement Works
 News Release 25 April 2007 For Immediate Release Raffles City Adds 41,000 sq ft of Retail Space in Phase 1 Asset Enhancement Works Incremental annual gross revenue of S$9.3 million; High levels of interest
CAPITALAND COMMERCIAL TRUST 2018 SECOND QUARTER UNAUDITED FINANCIAL STATEMENT AND DISTRIBUTION ANNOUNCEMENT TABLE OF CONTENTS
 CAPITALAND COMMERCIAL TRUST DISTRIBUTION ANNOUNCEMENT TABLE OF CONTENTS Item No. Description Page No. - Summary of CCT Results 2 - Introduction 3 1(a) Statement of Total Return & Distribution Statement
CAPITALAND COMMERCIAL TRUST 2017 FULL YEAR UNAUDITED FINANCIAL STATEMENT AND DISTRIBUTION ANNOUNCEMENT TABLE OF CONTENTS
 TABLE OF CONTENTS Item No. Description Page No. - Summary of CCT Results 2 - Introduction 3 1(a)(i) Statement of Total Return & Distribution Statement 4 11 1(b)(i) Statement of Financial Position 12 13
CAPITALAND MALL TRUST Singapore s First & Largest Retail REIT. Third Quarter 2017 Financial Results
 CAPITALAND MALL TRUST Singapore s First & Largest Retail REIT Third Quarter 2017 Financial Results 20 October 2017 Disclaimer This presentation may contain forward-looking statements that involve assumptions,
2007 FULL YEAR UNAUDITED FINANCIAL STATEMENT AND DISTRIBUTION ANNOUNCEMENT
 2007 FULL YEAR UNAUDITED FINANCIAL STATEMENT AND TABLE OF CONTENTS Item No. Description Page No. - Summary of CCT Results 2 - Introduction 3 1(a) Statement of Total Return & Distribution Statement 4 7
First Quarter 2017 Financial Results 19 April Q 2017 Financial Results 19 April 2017
 First Quarter 2017 Financial Results 19 April 2017 1Q 2017 Financial Results 19 April 2017 Outline Key Highlights for 1Q 2017 3 Financial Highlights & Capital Management 4 Portfolio Performance 10 Market
The Directors of Keppel REIT Management Limited, as Manager of Keppel REIT, are pleased to announce
 MEDIA RELEASE Unaudited Results of Keppel REIT for the First Quarter Ended 31 March 2016 14 April 2016 The Directors of Keppel REIT Management Limited, as Manager of Keppel REIT, are pleased to announce
Section 1 K REIT Asia Overview
 Investor Presentation October 2010 Important notice The past performance of K REIT Asia is not necessarily indicative of its future performance. Certain statements made in this presentation may not be
Cambridge Industrial Trust Presentation on 3Q2007 Results. 30 Oct 2007
 Cambridge Industrial Trust Presentation on 3Q2007 Results 30 Oct 2007 References in this presentation Unless otherwise stated, all capitalised terms used shall have the same meaning as in the prospectus
CapitaLand Debt Investors Day 2015 Presentation by Mr Wilson Tan, CEO, CapitaLand Mall Trust Management Limited
 Photo Credit: Kwek Swee Seng, Singapore Photo Credit: Kwek Swee Seng, Singapore CapitaLand Debt Investors Day 2015 Presentation by Mr Wilson Tan, CEO, CapitaLand Mall Trust Management Limited 7 September
Keppel REIT. Second Quarter and First Half 2017 Financial Results. 18 July 2017
 Keppel REIT Second Quarter and First Half 2017 Financial Results 18 July 2017 Outline Key Highlights for 1H 2017 3 Financial Performance & Capital Management 6 Portfolio Performance 10 Market Updates 14
CAPITALAND MALL TRUST Singapore s First & Largest REIT
 Photo Credit: Kwek Swee Seng, Singapore Photo Credit: Kwek Swee Seng, Singapore CAPITALAND MALL TRUST Singapore s First & Largest REIT First Half 2015 Financial Results 22 July 2015 Disclaimer This presentation
CAPITALAND MALL TRUST
 CAPITALAND MALL TRUST Singapore s First & Largest Retail REIT Third Quarter 2018 Financial Results 25 October 2018 Disclaimer This presentation may contain forward-looking statements that involve assumptions,
OSK DMG ASEAN & Hong Kong Corporate Day June 2012
 OSK DMG ASEAN & Hong Kong Corporate Day 26-28 June 2012 2 Important Notice This material shall be read in conjunction with CIT s financial statements for the financial period ended 31 March 2012. The value
PROPOSED ACQUISITION OF 100% EQUITY INTEREST IN FIRSTOFFICE PTE. LTD., WHICH OWNS THE OFFICE BUILDING KNOWN AS TWENTY ANSON
 (Constituted in the Republic of Singapore pursuant to a Trust Deed dated 6 February 2004 (as amended)) PROPOSED ACQUISITION OF 100% EQUITY INTEREST IN FIRSTOFFICE PTE. LTD., WHICH OWNS THE OFFICE BUILDING
Notice of Annual General Meeting
 7 th Annual General Meeting 18 July 2017 Important Notice This presentation shall be read in conjunction with Mapletree Industrial Trust s ( MIT ) financial statements for the financial year ended 31 March
FINANCIAL STATEMENTS CapitaCommercial Trust
 FINANCIAL STATEMENTS 63 REPORT OF THE EE 64 STATEMENT BY THE MANAGER 65 AUDITORS REPORT TO THE UNITHOLDERS OF CAPITACOMMERCIAL 67 BALANCE SHEETS 69 STATEMENTS OF TOTAL RETURN 70 DISTRIBUTION STATEMENTS
Cambridge Industrial Trust. 29 Jan 2008
 Cambridge Industrial Trust Full Year 2007 Results 29 Jan 2008 FY2007 Results Presentation Outline FY 2007 Milestones 4Q2007 Financial Results Capital Management Strategy Acquisition Highlights Portfolio
2008 FULL YEAR UNAUDITED FINANCIAL STATEMENT AND DISTRIBUTION ANNOUNCEMENT
 2008 FULL YEAR UNAUDITED FINANCIAL STATEMENT AND TABLE OF CONTENTS Item No. Description Page No. - Summary of CCT GROUP Results 2 - Introduction 3 1(a) Statement of Total Return & Distribution Statement
Keppel REIT Annual General Meeting 20 April 2018
 Keppel REIT Annual General Meeting 20 April 2018 Outline Overview 3 Performance Update for FY 2017 6 Key Highlights for 1Q 2018 14 IMPORTANT NOTICE: The past performance of Keppel REIT is not necessarily
Frasers Commercial Trust 3QFY13 Financial Results. 24 July 2013
 Frasers Commercial Trust 3QFY13 Financial Results 24 July 2013 Important notice Certain statements in this Presentation constitute forward-looking statements, including forward-looking financial information.
27 January ARA-CWT Trust Management (Cache) Limited
 Limited") 4Q 2010 Financial Results 27 January 2011 ARA-CWT Trust Management (Cache) Limited Agenda 4Q 2010 Financial Results Portfolio Update Going Forward 2 Highlights 4Q 2010 Results Net Property Income of S$14.4m
4Q 2010 Financial Results 27 January 2011 ARA-CWT Trust Management (Cache) Limited Agenda 4Q 2010 Financial Results Portfolio Update Going Forward 2 Highlights 4Q 2010 Results Net Property Income of S$14.4m
CAPITALAND MALL TRUST
 CAPITALAND MALL TRUST Singapore s First & Largest Retail REIT First Half 2018 Financial Results 20 July 2018 Disclaimer This presentation may contain forward-looking statements that involve assumptions,
FY2014 Financial Results Presentation
 FY2014 Financial Results Presentation 16 January 2015 16 International Business Park Important Notice This material shall be read in conjunction with CIT s results announcements for the financial period
Presentation for DBS Pulse of Asia Conference. January 2016
 Presentation for DBS Pulse of Asia Conference January 2016 Important Notice Standard Chartered Securities (Singapore) Pte. Limited, CIMB Bank Berhad, Singapore Branch and Oversea-Chinese Banking Corporation
OUE C-REIT s FY2015 Distribution 22.2% Higher YoY, 4Q 2015 DPU Exceeded Circular Forecast by 20.4%
 PRESS RELEASE For Immediate Release OUE C-REIT s FY2015 Distribution 22.2% Higher YoY, 4Q 2015 DPU Exceeded Circular Forecast by 20.4% Key Highlights: 4Q 2015 distribution per unit ( DPU ) exceeded Circular
Investor Presentation March 2016
 Investor Presentation March 2016 Important Notice This presentation shall be read in conjunction with Mapletree Industrial Trust s ( MIT ) financial results for Third Quarter Financial Year 2015/2016 in
Hong Kong Non-Deal Roadshow Hong Kong, 4 March International Business Park
 Hong Kong Non-Deal Roadshow Hong Kong, 4 March 2016 16 International Business Park 2 Content CIT FY2015 Results Executive Summary Financial Summary Real Estate Highlights Financial & Capital Management
AIMS AMP CAPITAL INDUSTRIAL REIT
 AIMS AMP CAPITAL INDUSTRIAL REIT FY2014: Third Quarter ended 31 December 2013 Results Presentation 29 January 2014 Important notice Disclaimer This Presentation is focused on comparing actual results for
CapitaMalls Malaysia Trust
 CapitaMalls Malaysia Trust Malaysia s only pure-play shopping mall REIT with an income - and geographically - diversified portfolio Annual General Meeting 4 April 2013 Disclaimer These materials may contain
UNAUDITED RESULTS FOR THE THIRD QUARTER AND NINE MONTHS ENDED 30 SEPTEMBER 2009
 K-REIT ASIA THIRD QUARTER 2009 FINANCIAL STATEMENT ANNOUNCEMENT (Constituted in the Republic of Singapore pursuant to UNAUDITED RESULTS FOR THE THIRD QUARTER AND NINE MONTHS ENDED 30 SEPTEMBER 2009 TABLE
FY2012 Financial Results Presentation
 FY2012 Financial Results Presentation 21 January 2013 Knowing. Believing. Delivering ARA-CWT Trust Management (Cache) Limited Agenda Overview & FY12 Key Highlights 4QFY12 & FY12 Full Year Financial Performance
Frasers Commercial Trust Bank of America Merrill Lynch Asian Stars Conference May 2011
 Frasers Commercial Trust Bank of America Merrill Lynch Asian Stars Conference 2011 18 May 2011 Important notice Certain statements in this Presentation constitute forward-looking statements, including
Financial Statements
 Financial Statements 62 Report of the Trustee 63 Statement by the Manager 64 Auditors Report to the Unitholders of CapitaCommercial Trust 65 Balance Sheets 67 Statements of Total Return 68 Distribution
AIMS AMP CAPITAL INDUSTRIAL REIT
 AIMS AMP CAPITAL INDUSTRIAL REIT FY2016: Second Quarter Financial Results Ended 30 September 2015 Results Presentation 29 October 2015 Important notice Disclaimer This Presentation is focused on comparing
Investor Presentation November 2015
 Investor Presentation November 2015 Important Notice This presentation shall be read in conjunction with Mapletree Industrial Trust s ( MIT ) financial results for Second Quarter Financial Year 2015/2016
ACQUISITION OF PLAZA SINGAPURA
 ACQUISITION OF PLAZA SINGAPURA Extraordinary General Meeting 8 July 2004 Insert pic of Plaza Sing Important Notice This material or our presentation is for informational purposes only and should be read
CLSA Asean Forum Bangkok, March International Business Park
 CLSA Asean Forum Bangkok, March 2016 16 International Business Park 2 Content Overview of CIT CIT FY2015 Financial Results Overview Financial & Capital Management Highlights Real Estate Highlights Singapore
TABLE OF CONTENTS Item No. Description Page No. - Introduction 3. 1(a) Statements of Total Return & Distribution Statements 4-6
 Statements of Total Return & Distribution Statements 4-6") CAPITALAND MALL TRUST 2016 FIRST QUARTER UNAUDITED FINANCIAL STATEMENT AND DISTRIBUTION ANNOUNCEMENT TABLE OF CONTENTS Item No. Description Page No. - Summary of CMT Results 2 - Introduction 3 1(a) Statements
CAPITALAND MALL TRUST 2016 FIRST QUARTER UNAUDITED FINANCIAL STATEMENT AND DISTRIBUTION ANNOUNCEMENT TABLE OF CONTENTS Item No. Description Page No. - Summary of CMT Results 2 - Introduction 3 1(a) Statements
CAPITALAND MALL TRUST Singapore s First & Largest Retail REIT. First Half 2017 Financial Results
 CAPITALAND MALL TRUST Singapore s First & Largest Retail REIT First Half 2017 Financial Results 21 July 2017 Disclaimer This presentation may contain forward-looking statements that involve assumptions,
1Q FY2009/10 Financial Results Presentation 17 July 2009
 1Q FY2009/10 Financial Results Presentation 17 July 2009 Disclaimers This Presentation is focused on comparing results for the three months ended 30 June 2009 versus actual results year-on-year ( yoy ).
TABLE OF CONTENTS Item No. Description Page No. - Introduction 3. 1(a) Statements of Total Return & Distribution Statements 4-9
 Statements of Total Return & Distribution Statements 4-9") CAPITALAND MALL TRUST 2017 FULL YEAR UNAUDITED FINANCIAL STATEMENT AND DISTRIBUTION ANNOUNCEMENT TABLE OF CONTENTS Item No. Description Page No. - Summary of CMT Results 2 - Introduction 3 1(a) Statements
CAPITALAND MALL TRUST 2017 FULL YEAR UNAUDITED FINANCIAL STATEMENT AND DISTRIBUTION ANNOUNCEMENT TABLE OF CONTENTS Item No. Description Page No. - Summary of CMT Results 2 - Introduction 3 1(a) Statements
FY2015 Financial Results Presentation
 FY2015 Financial Results Presentation 14 January 2016 16 International Business Park 2 Content Executive Summary Financial Summary Real Estate Highlights Financial & Capital Management Highlights Appendix
OUE C-REIT Achieved Higher YoY Distribution of S$17.8 million in 2Q 2017
 PRESS RELEASE For Immediate Release OUE C-REIT Achieved Higher YoY Distribution of S$17.8 million in 2Q 2017 Key Highlights: 2Q 2017 amount available for distribution of S$17.8 million increased 0.6% year-on-year
TABLE OF CONTENTS Item No. Description Page No. - Introduction 3. 1(a) Statements of Total Return & Distribution Statements 4-9
 Statements of Total Return & Distribution Statements 4-9") CAPITALAND MALL TRUST 2016 FULL YEAR UNAUDITED FINANCIAL STATEMENT AND DISTRIBUTION ANNOUNCEMENT TABLE OF CONTENTS Item No. Description Page No. - Summary of CMT Results 2 - Introduction 3 1(a) Statements
CAPITALAND MALL TRUST 2016 FULL YEAR UNAUDITED FINANCIAL STATEMENT AND DISTRIBUTION ANNOUNCEMENT TABLE OF CONTENTS Item No. Description Page No. - Summary of CMT Results 2 - Introduction 3 1(a) Statements
CapitaLand Commercial Trust Singapore s First and Largest Commercial REIT
 CapitaLand Commercial Trust Singapore s First and Largest Commercial REIT The Acquisition of Gallileo, a Grade A Commercial Property in Frankfurt, Germany 1 17 May 2018 Important Notice This presentation
AIMS AMP CAPITAL INDUSTRIAL REIT
 AIMS AMP CAPITAL INDUSTRIAL REIT FY2013: 2 nd Quarter Ended 30 September 2012 Results Presentation 24 October 2012 Important Notice Disclaimer This Presentation is focused on comparing actual results for