Dual Momentum Investing. Gary Antonacci Portfolio Management Consultants
|
|
|
- Ashlyn Collins
- 6 years ago
- Views:
Transcription

1 Dual Momentum Investing Gary Antonacci Portfolio Management Consultants

2 Gary Antonacci Over 4 years experience with underexploited investments first place winner of the NAAIM Wagner Award Author of Dual Momentum Investing: An Innovative Approach to Higher Returns with Lower Risk
3 Topics for Today What is momentum? Why does it work? What are its issues? How to best use it?

4 What is Momentum?
 A body in")

5 Sir Isaac Newton (643-) A body in motion tends to stay in motion.
6
7
8
9

10 David Riccardo (-3) Cut your losses short, and let your profits run on. The Great Metropolis, 3


11 Jesse Livermore and Richard Wyckoff

12 Modern Momentum Alfred Cowles III & Herbert Jones Econometrica, July 3 NYSE stocks from -35
13 Stocks that have exceeded the median in one year exceed it also in the following year. Cowles & Jones

14 Random Walk Hypothesis

15 Efficient Market Hypothesis

16 Academics Begin to See the Light
17 Behavioral finance -
18 Behavioral finance - Mean reversion,
19 Behavioral finance - Mean reversion, Value and size factors
20 Jegadeesh & Titman Seminal 3 study using 6 to US stock data
21 Jegadeesh & Titman Seminal 3 study using 6 to US stock data Deciles ranked by momentum
22 Jegadeesh & Titman Seminal 3 study using 6 to US stock data Deciles ranked by momentum 3 to month momentum works!
23 U.S. Stock Momentum Top and bottom %, months - momentum Jan -Dec 4, rebalanced monthly Winner Loser SP5 CAGR.% -.5%.% Standard Deviation.6% 33.%.% Downside Deviation 6.%.% 4.% Sharpe Ratio Worst Drawdown -.% -.% -4.6% Source: Ken French Data Library and Standard & Poor s. Results are hypothetical, and are NOT an indicator of future results, and do NOT represent returns that any investor actually attained.
24 Momentum works well with stocks, stock indices, sectors, bonds, commodities, and currencies from until now!
, 5 years of Global Multi-Asset Momentum:")
25 Multi-Asset Class Momentum by Decade Source: Geczy and Samonov (5), 5 years of Global Multi-Asset Momentum: -4
26 Source: Geczy and Samonov (5), 5 years of Global Multi-Asset Momentum: -4
27 WHY MOMENTUM WORKS
28 Underreaction and Overreaction
29 Initial Underreaction Anchoring/Conservatism
30 Initial Underreaction Anchoring/Conservatism Slow diffusion of information
31 Initial Underreaction Anchoring/Conservatism Slow diffusion of information Disposition effect
32 Herding Later Overreaction
33 Later Overreaction Herding Recency bias
34 Later Overreaction Herding Recency bias Overconfidence
35 Systematic Momentum High and consistent returns Has persisted over time Works with all assets Good reasons for it

36 Fama & French The premier market anomaly is momentum. Dissecting Anomalies Journal of Finance, July


37 Want To Do Stock Momentum?
38 Stock momentum is persistent, pervasive, robust, and intuitive but is it investable?
39 Scalability 5 Stock Portfolio Stock Portfolio 5 Stock Portfolio Stock Portfolio 5 Stock Portfolio 3 Stock Portfolio 5 Stock Universe month hold.% 4.4% 3.6%.%.%.5%.% month hold 6.% 4.% 3.%.6%.%.4%.% 3 month hold 5.% 3.%.%.3%.%.%.% 4 month hold 4.5% 3.5%.%.%.6%.%.% 5 month hold 4.4% 3.3%.6%.%.6%.%.% 6 month hold 3.% 3.%.4%.%.5%.%.% month hold 3.%.%.%.%.3%.%.% month hold 3.4%.6%.%.5%.%.%.% month hold.%.%.6%.%.%.%.% month hold.6%.%.4%.%.%.%.% month hold.%.6%.%.%.%.5%.% month hold.%.3%.%.6%.5%.4%.% Results are hypothetical, and are NOT an indicator of future results, and do NOT represent returns that any investor actually attained. Please see disclosures for additional information.
40 the abnormal returns associated with these trading strategies creates an illusion of profit opportunities when, in fact, none exists. -Lesmond, Schill & Zhou () The Illusionary Nature of Momentum Profits
41 the abnormal returns associated with these trading strategies creates an illusion of profit opportunities when, in fact, none exists. -Lesmond, Schill & Zhou () The Illusionary Nature of Momentum Profits as much as $5 billion may be invested in some momentum-based strategies before the opportunity profit vanishes. -Korajcyzk & Sadka (4) Are Momentum Profits Robust to Trading Costs?

42 Source: Novy-Marx and Velikov (5), A Taxonomy of Anomalies and their Trading Costs
43 Source: Beck, Hsu, Kalesnik & Kostka (6), Will Your Factor Deliver? An Examination of Factor Robustness and Implementation Costs?

44 Oldest Momentum Funds

45 PowerShares DWA Momentum

46 AQR Large Cap Momentum
47 Stock Momentum Fund Performance Annual Returns from Inception to Jan PowerShares DWA Momentum 6.3% Russell 3 Growth Index.4% Difference -.% AQR Large Cap Momentum 4.3% Russell Growth Index 5.% Difference -.5%

48 Want To Do Stock Momentum?

49 So What To Do?
50

51 World Stock Market Capitalization
52 Relative Momentum Switch between the S&P 5 and the MSCI All Country World Index (ACWI) ex-us Monthly rebalancing, -month look back
53 base = Relative Momentum S&P 5 MSCI ACWI ex-us
54 Vertical Diversification S&P 5 55% always MSCI ACWI ex-us 45% always
55 Horizontal Diversification S&P 5 MSCI ACWI ex-us 55% of the time 45% of the time

56 Global Macro Strategy

57 Global Macro Strategy
58 base = Relative Momentum S&P 5 MSCI ACWI ex-us
59 base = Relative Momentum S&P 5 MSCI ACWI ex-us
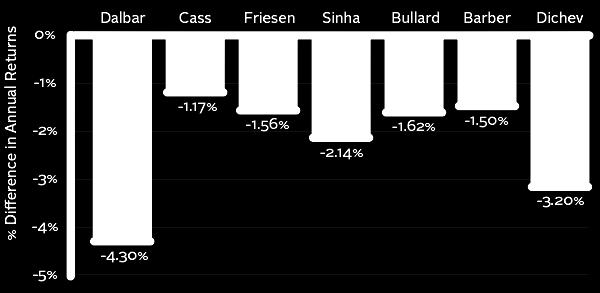
60 Behavioral Gaps

61 Source: Dalbar, Inc, Quantitative Analysis of Investor Behavior

62 We don t have people with investment problems. We have investments with people problems. -Gregg Fisher

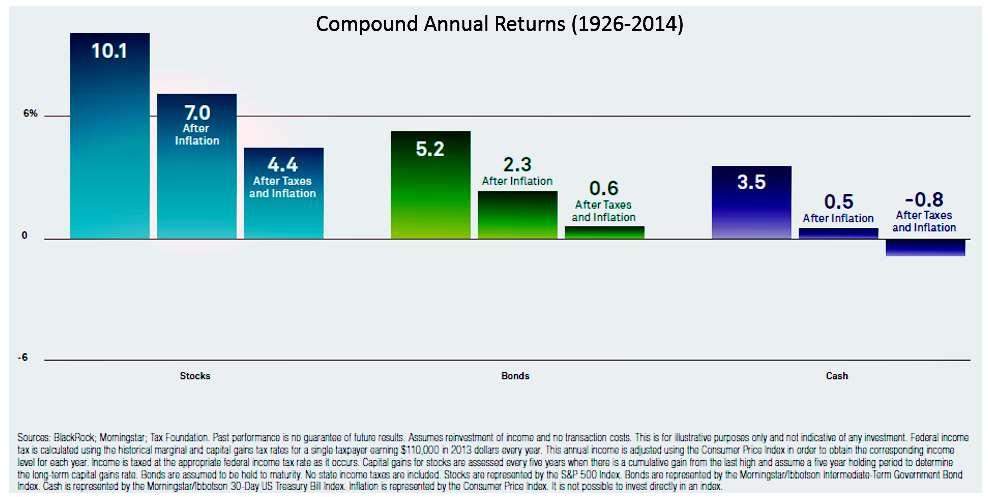
63 Bonds
64 Source: Credit Suisse Global Investment Returns Yearbook 5

65 Stock and Bond Risks Source: Credit Suisse Global Investment Returns Yearbook 5
66 Two Types of Momentum Relative (cross-sectional) compare performance to our peers Absolute (time-series) compare performance to our self
67 Absolute Momentum Switch between the S&P 5 and the Barclays US Aggregate Bond index Monthly rebalancing, -month look back
68 base = S&P 5 Absolute Momentum S&P 5 Aggregate Bonds
69 . S&P 5 Abs Mom S&P Data is from Standard and Poor s and Ibbotson Associates. Results are hypothetical, and are NOT an indicator of future results, and do NOT represent returns that any investor actually attained.
70 Worst S&P 5 Drawdowns January December 6 Date S&P 5 S&P 5 Abs Mom Jul -Feb -5.% +5.% Apr -Sep -43.% +.4% Jan 3-Sep 4-4.% +.% Mar 3-Mar 3-5.% -.4% Sep -Jun 3-3.4% -.% Results are hypothetical, are NOT an indicator of future results, and do NOT represent returns that any investor actually attained. Indexes are unmanaged, do not reflect management or trading fees, and one cannot invest directly in an index.
71 S&P 5 Trend Up versus Trend Down Jan -Dec 6 All Months Trend Up Trend Down Average Annual Return.% 4.%.% Standard Deviation.% 4.% 4.% % of Months % 66% 34% Results are hypothetical, are NOT an indicator of future results, and do NOT represent returns that any investor actually attained. Indexes are unmanaged, do not reflect management or trading fees, and one cannot invest directly in an index.
72 Momentum Since 3, Really! Source: Greyserman and Kaminski, Trend Following with Managed Futures, John Wiley & Sons, Inc, 4
73 Absolute Momentum and Moving Averages Zakamulin study on 55 years of S&P data: Absolute Momentum (MOM) Simple Moving Average (SMA) Reverse Exponential Moving Average (REMA) Double EMA Crossover Method (DCM) Source: Zakamulin (5), A Comprehensive Look at the Empirical Performance of Moving Average Trading Strategies
74 Absolute Momentum and Moving Averages CONCLUSIONS: Best performing method: MOM Worst performing method: DCM Only MOM & REMA are statistically significant Source: Zakamulin (5), A Comprehensive Look at the Empirical Performance of Moving Average Trading Strategies
75 Dual Momentum Absolute momentum switches between stocks and bonds Relative momentum switches between the S&P 5 and the ACWI ex-us Monthly rebalancing, -month look back
76 base = Dual Momentum Relative Momentum Absolute Momentum S&P 5 MSCI ACWI ex-us
77 Dual Momentum Jan - Dec 6 CAGR Standard Deviation Sharpe Ratio Worst Drawdown Dual Momentum.%.5%. -.% Absolute Momentum.%.% % Relative Momentum 3.5% 5.% % S&P 5 Index.% 5.%.4-5.% MSCI ACWI ex-u.s..%.%.3-5.4% Results are hypothetical, are NOT an indicator of future results, and do NOT represent returns that any investor actually attained. Indexes are unmanaged, do not reflect management or trading fees, and one cannot invest directly in an index.
78 Bull Markets Bull Markets S&P 5 Abs Mom Dual Mom Jan -Dec 36.% 3.6% 65.6% Oct 4-Nov.3%.6% 3.3% Aug -Aug.% 46.3% 56.% Dec -Aug 6.6%.4% 3.5% Oct -Oct.3%.4%.6% Mar -Jul5.% 36.% 6.4% Average.%.%.% Results are hypothetical, are NOT an indicator of future results, and do NOT represent returns that any investor actually attained. Indexes are unmanaged, do not reflect management or trading fees, and one cannot invest directly in an index.
79 Bear Markets Bear Markets S&P 5 Rel Mom Dual Mom Jan 3-Sep 4-4.6% -35.6% 5.% Dec -Jul -6.5% -6.% 6.% Sep -Nov -.6% -5.% -5.% Sep -Sep -44.% -43.4% 4.% Nov -Feb -5.% -54.6% -3.% Average -36.% -33.% 3.6% Results are hypothetical, are NOT an indicator of future results, and do NOT represent returns that any investor actually attained. Indexes are unmanaged, do not reflect management or trading fees, and one cannot invest directly in an index.
80
81 Advantages of Dual Momentum Extensively Researched High Expected Returns High Scalability Low Trading Costs Low Drawdowns

82 Why Isn t Everyone Doing It?

83 Too Simple

84

85 Counter Intuitive
86 Other Behavioral Biases Familiarity Bias Anchoring/Conservatism Slow diffusion of information Preference for stocks not indices
87 WHY WE NEED TO OVERCOME
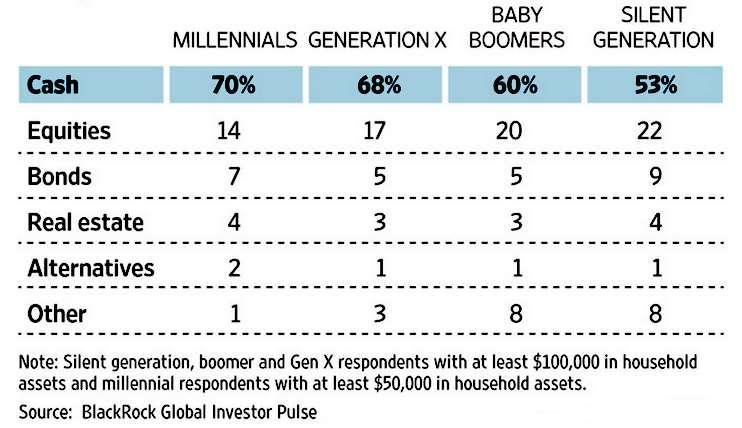
88 Investment Allocations
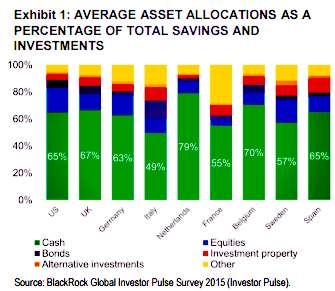
89 Investment Allocations
90
91 55 Which Do You Want? base = Dual Momentum Treasury Bills 5

92 Risks?

93 Tracking Error

94 Whipsaws

95

96

97 Patience

98 Discipline

99 Understanding

100 Dual Momentum Investing USA Best Book Award Over 5 5 Star Reviews Easy D-I-Y Instructions

101

102 The most important metric is not the returns achieved but the returns weighed against the risks incurred. Nothing should be more important than the ability to sleep soundly at night. -Seth Klarman

103

104 May the Momentum Be With You!
105 Disclosures This presentation is for educational and informational purposes only. Nothing contained therein should be interpreted as personalized investment advice. Under no circumstances does this information represent a recommendation to buy, sell or hold any security. Users should be aware that all investments carry risk and may lose value. Users of these sites are urged to consult their own independent financial advisors with respect to any investment. We are not liable for any errors or inaccuracies, regardless of cause, or for the delay or interruptions in the transmission of information to our users. Opinions and analysis included therein are based on sources believed to be reliable and written in good faith, but no representation or warranty is made as to their accuracy, completeness, or timeliness. You should always obtain your own current information and perform due diligence before making any investment decisions. All performance represents total returns and includes reinvestment of interest and dividends but does not reflect management fees, transaction costs, taxes, or other expenses. You cannot invest directly in indexes. Future performance of these models may differ significantly from historical performance. Hypothetical performance results are presented for illustrative purposes only and should not be interpreted as an indication of future performance. Hypothetical performance results (e.g., quantitative back tests) have many inherent limitations, some of which, but not all, are described herein. One of the limitations of hypothetical performance results is that they are generally prepared with the benefit of hindsight. In addition, hypothetical trading does not involve financial risk, and no hypothetical trading record can completely account for the impact of financial risk in actual trading. For example, the ability to withstand losses or adhere to a particular trading program in spite of trading losses can adversely affect actual trading results. The hypothetical performance results contained herein represent the application of the quantitative models as currently in effect, and there can be no assurance that the models or portfolio constituents will remain the same in the future or that an application of the current models in the future will produce similar results because the relevant market and economic conditions that prevailed during the hypothetical performance period will not necessarily recur. The term maximum drawdown as used on this site refers to means the maximum cumulative peak-to-valley retracement on a month-end basis. Intra-month maximum drawdowns may be substantially higher, and future maximum drawdowns may be higher still. There are numerous other factors related to the markets in general or to the implementation of any specific trading program which cannot be fully accounted for in the preparation of hypothetical performance results, all of which can adversely affect actual trading results.
106 Gary Antonacci Portfolio Management Consultants website: optimalmomentum.com blog: dualmomentum.net
MOMENTUM INVESTING: SIMPLE, BUT NOT EASY
 MOMENTUM INVESTING: SIMPLE, BUT NOT EASY As Of Date: 9/5/2018 Wesley R. Gray, PhD T: +1.215.882.9983 F: +1.216.245.3686 ir@alphaarchitect.com 213 Foxcroft Road Broomall, PA 19008 Empower Investors Through
Global Tactical Asset Allocation
 Global Tactical Asset Allocation This material is solely for informational purposes to be viewed in conjunction with this presentation. The information presented should not be construed as representative
QUANTITATIVE MOMENTUM INDEXES (QM AND IQM INDEX)
") QUANTITATIVE MOMENTUM INDEXES (QM AND IQM INDEX) As Of Date: 5/3/2018 Wesley R. Gray, PhD T: +1.215.882.9983 F: +1.216.245.3686 ir@alphaarchitect.com 213 Foxcroft Road Broomall, PA 19008 Empower Investors
QUANTITATIVE MOMENTUM INDEXES (QM AND IQM INDEX) As Of Date: 5/3/2018 Wesley R. Gray, PhD T: +1.215.882.9983 F: +1.216.245.3686 ir@alphaarchitect.com 213 Foxcroft Road Broomall, PA 19008 Empower Investors
ALTERNATIVE MOMENTUM STRATEGIES. Faculdade de Economia da Universidade do Porto Rua Dr. Roberto Frias Porto Portugal
 FINANCIAL MARKETS ALTERNATIVE MOMENTUM STRATEGIES António de Melo da Costa Cerqueira, amelo@fep.up.pt, Faculdade de Economia da UP Elísio Fernando Moreira Brandão, ebrandao@fep.up.pt, Faculdade de Economia
PROFITABILITY OF CAPM MOMENTUM STRATEGIES IN THE US STOCK MARKET
 International Journal of Business and Society, Vol. 18 No. 2, 2017, 347-362 PROFITABILITY OF CAPM MOMENTUM STRATEGIES IN THE US STOCK MARKET Terence Tai-Leung Chong The Chinese University of Hong Kong
Public Pension Funding Forum
 Public Pension Funding Forum September 12, 2017 Presented By Biagio Manieri, PhD, CFA PFM Asset Management PFM 1 Historical Plan Performance vs. Index Median Plan Performance Index BSB (1991) 13.4% 13.5%
WHY VALUE INVESTING IS SIMPLE, BUT NOT EASY
 WHY VALUE INVESTING IS SIMPLE, BUT NOT EASY Prepared: 3/10/2015 Wesley R. Gray, PhD T: +1.215.882.9983 F: +1.216.245.3686 ir@alphaarchitect.com 213 Foxcroft Road Broomall, PA 19008 Affordable Active Management
W.E. Donoghue Power Dividend Total Return Index TM (PWRDXTR)
") W.E. Donoghue Power Dividend Total Return Index TM (PWRDXTR) A Tactical Dividend Strategy for Today s Low Yield World For more information call: 800 642-4276 S&P 500 Index Since the Turn of the Millennium
W.E. Donoghue Power Dividend Total Return Index TM (PWRDXTR) A Tactical Dividend Strategy for Today s Low Yield World For more information call: 800 642-4276 S&P 500 Index Since the Turn of the Millennium
INDEX PERFORMANCE HISTORY MARKET CYCLE ANALYSIS*
 OVERVIEW Index Name: Helios Alpha Index Ticker: Inception Date: September 30, 2003 S&P Launch Date: March 3, 2017 Benchmark: MSCI ACWI Index INDEX PERFORMANCE HISTORY As of: October 31, 2018 DESCRIPTION
BROAD COMMODITY INDEX
 BROAD COMMODITY INDEX COMMENTARY + STRATEGY FACTS APRIL 2017 80.00% CUMULATIVE PERFORMANCE ( SINCE JANUARY 2007* ) 60.00% 40.00% 20.00% 0.00% -20.00% -40.00% -60.00% -80.00% ABCERI S&P GSCI ER BCOMM ER
BROAD COMMODITY INDEX
 BROAD COMMODITY INDEX COMMENTARY + STRATEGY FACTS JUNE 2017 80.00% CUMULATIVE PERFORMANCE ( SINCE JANUARY 2007* ) 60.00% 40.00% 20.00% 0.00% -20.00% -40.00% -60.00% -80.00% ABCERI S&P GSCI ER BCOMM ER
INDEX PERFORMANCE HISTORY MARKET CYCLE ANALYSIS*
 OVERVIEW Index Name: Helios Diversified Index Ticker: Inception Date: September 30, 2003 S&P Launch Date: March 3, 2017 : 45% MSCI ACWI / 25% BBgBarc Agg Bond / 30% Morningstar Div Alts Morningstar SecID:
The Compelling Case for Value
 The Compelling Case for Value July 2, 2018 SOLELY FOR THE USE OF INSTITUTIONAL INVESTORS AND PROFESSIONAL ADVISORS 0 Jan-75 Jan-77 Jan-79 Jan-81 Jan-83 Jan-85 Jan-87 Jan-89 Jan-91 Jan-93 Jan-95 Jan-97
Dividend Growth as a Defensive Equity Strategy August 24, 2012
 Dividend Growth as a Defensive Equity Strategy August 24, 2012 Introduction: The Case for Defensive Equity Strategies Most institutional investment committees meet three to four times per year to review
ACCELERATOR- ES HYPOTHETICAL PERFORMANCE CAPSULE - Trading One Lot. Jul- 09. Jul- 10. Jan- 10. Jan- 11
 System Name: Accelerator- ES Auto Trade Developer: Addwins LLC dba Trading Systems Live System Type: Intraday Futures Trades: Emini S&P Subscription Cost: $650 USD Year Dates Covered: Jan 2007- Mar 31
Rivkin Momentum Strategy
 Overview Starting from 1 April, Rivkin will be introducing a new systematic equity strategy based on the concept of relative momentum. This investment strategy will trade in US stocks that are contained
VALUE MOMENTUM TREND INDEX (VMOT & AA L/S INDEX)
") VALUE MOMENTUM TREND INDEX (VMOT & AA L/S INDEX) As Of Date: 12/5/2017 Wesley R. Gray, PhD T: +1.215.882.9983 F: +1.216.245.3686 ir@alphaarchitect.com 213 Foxcroft Road Broomall, PA 19008 Empower Investors
VALUE MOMENTUM TREND INDEX (VMOT & AA L/S INDEX) As Of Date: 12/5/2017 Wesley R. Gray, PhD T: +1.215.882.9983 F: +1.216.245.3686 ir@alphaarchitect.com 213 Foxcroft Road Broomall, PA 19008 Empower Investors
INDEX PERFORMANCE HISTORY MARKET CYCLE ANALYSIS*
 Jun 09 Dec 09 Jun 10 Dec 10 Jun 11 Dec 11 Jun 12 Dec 12 Jun 13 Dec 13 Jun 14 Dec 14 Jun 15 Dec 15 Jun 16 Dec 16 Jun 17 Dec 17 Jun 18 Dec 18 Dec 07 Jan 08 Feb 08 Mar 08 Apr 08 May 08 Jun 08 Jul 08 Aug 08
BROAD COMMODITY INDEX
 BROAD COMMODITY INDEX COMMENTARY + STRATEGY FACTS JANUARY 2018 100.00% 80.00% 60.00% 40.00% 20.00% 0.00% -20.00% -40.00% -60.00% CUMULATIVE PERFORMANCE ( SINCE JANUARY 2007* ) -80.00% ABCERI S&P GSCI ER
DAC Wealth Builder: $10,000 Growth from Inception
 DAC Wealth Builder: $10,000 Growth from Inception $13,500 $13,416 $13,000 $12,500 $12,000 $11,500 $11,000 $10,500 $10,000 12/2014 03/2015 06/2015 09/2015 12/2015 03/2016 06/2016 09/2016 12/2016 03/2017
ETF portfolio review, 30th September ETF portfolios with ESG overlay. market overview. portfolio performance
 ETF portfolio review, 30th September 2017 market overview All our ETF portfolios performed better than s in September and all portfolios bar fixed-income continued to add to their gains year-to-date. Our
Profitability of CAPM Momentum Strategies in the US Stock Market
 MPRA Munich Personal RePEc Archive Profitability of CAPM Momentum Strategies in the US Stock Market Terence Tai Leung Chong and Qing He and Hugo Tak Sang Ip and Jonathan T. Siu The Chinese University of
INDEX PERFORMANCE HISTORY MARKET CYCLE ANALYSIS*
 OVERVIEW Index Name: Helios Dynamic Risk 13% Index Ticker: Inception Date: February 28, 2005 S&P Launch Date: March 3, 2017 Benchmark: 65% MSCI ACWI / 35% BBgBarc Agg Bond Morningstar SecID: F00000YYHJ
MANAGED FUTURES INDEX
 MANAGED FUTURES INDEX COMMENTARY + STRATEGY FACTS JUNE 2018 CUMULATIVE PERFORMANCE ( SINCE JANUARY 2007* ) 120.00% 100.00% 80.00% 60.00% 40.00% 20.00% 0.00% AMFERI BARCLAY BTOP50 CTA INDEX S&P 500 S&P
Aspiriant Risk-Managed Equity Allocation Fund RMEAX Q4 2018
 Aspiriant Risk-Managed Equity Allocation Fund Q4 2018 Investment Objective Description The Aspiriant Risk-Managed Equity Allocation Fund ( or the Fund ) seeks to achieve long-term capital appreciation
DAC Wealth Protector: $10,000 Growth from Inception
 DAC Wealth Protector: $10,000 Growth from Inception $11,600 $11,661 $11,400 $11,200 $11,000 $10,800 $10,600 $10,400 $10,200 $10,000 12/2014 03/2015 06/2015 09/2015 12/2015 03/2016 06/2016 09/2016 12/2016
Evolving Equity Investing: Delivering Long-Term Returns in Short-Tempered Markets
 March 2012 Evolving Equity Investing: Delivering Long-Term Returns in Short-Tempered Markets Kent Hargis Portfolio Manager Low Volatility Equities Director of Quantitative Research Equities This information
Crabel Capital Management, LLC
 Commodity Trading Advisors (CTAs) provide advice and services related to trading and investment strategies utilizing futures contracts and options on futures contracts on a wide variety of physical goods
MANAGED FUTURES INDEX
 MANAGED FUTURES INDEX COMMENTARY + STRATEGY FACTS JULY 2017 CUMULATIVE PERFORMANCE ( SINCE JANUARY 2007* ) 120.00% 100.00% 80.00% 60.00% 40.00% 20.00% 0.00% AMFERI BARCLAY BTOP50 CTA INDEX S&P 500 S&P
A Novel Business Cycle Multi-Asset Allocation Strategy
 BUSINESS CYCLE ASSET ALLOCATION A Novel Business Cycle Multi-Asset Allocation Strategy May, 2017 Proforma Performance Comparison AASE Strategy v. S&P500 v. Stock/Bond Portfolio Proforma Performance Comparison
Correlation and Asset Management
 Correlation and Asset Management Michael Mendelson Principal Ernst Schaumburg Vice President May 2017 AQR Capital Management, LLC Two Greenwich Plaza Greenwich, CT 06830 p: +1.203.742.3600 w: aqr.com 1
A Novel Business Cycle Multi-Asset Allocation Strategy
 BUSINESS CYCLE ASSET ALLOCATION A Novel Business Cycle Multi-Asset Allocation Strategy June, 2017 Proforma Performance Comparison AASE Strategy v. S&P500 v. Stock/Bond Portfolio Proforma Performance Comparison
MANAGED FUTURES INDEX
 MANAGED FUTURES INDEX COMMENTARY + STRATEGY FACTS JANUARY 2019 CUMULATIVE PERFORMANCE ( SINCE JANUARY 2007* ) 140.00% 120.00% 100.00% 80.00% 60.00% 40.00% 20.00% 0.00% AMFERI BARCLAY BTOP50 CTA INDEX S&P
BROAD COMMODITY INDEX
 BROAD COMMODITY INDEX COMMENTARY + STRATEGY FACTS AUGUST 2018 120.00% 100.00% 80.00% 60.00% 40.00% 20.00% 0.00% -20.00% -40.00% -60.00% CUMULATIVE PERFORMANCE ( SINCE JANUARY 2007* ) -80.00% ABCERI S&P
Factor Mixology: Blending Factor Strategies to Improve Consistency
 May 2016 Factor Mixology: Blending Factor Strategies to Improve Consistency Vassilii Nemtchinov, Ph.D. Director of Research Equity Strategies Mahesh Pritamani, Ph.D., CFA Senior Researcher Factor strategies
MANAGED FUTURES INDEX
 MANAGED FUTURES INDEX COMMENTARY + STRATEGY FACTS SEPTEMBER 2018 CUMULATIVE PERFORMANCE ( SINCE JANUARY 2007* ) 140.00% 120.00% 100.00% 80.00% 60.00% 40.00% 20.00% 0.00% AMFERI BARCLAY BTOP50 CTA INDEX
BROAD COMMODITY INDEX
 BROAD COMMODITY INDEX COMMENTARY + STRATEGY FACTS JULY 2018 100.00% 80.00% 60.00% 40.00% 20.00% 0.00% -20.00% -40.00% -60.00% CUMULATIVE PERFORMANCE ( SINCE JANUARY 2007* ) -80.00% ABCERI S&P GSCI ER BCOMM
MANAGED FUTURES INDEX
 MANAGED FUTURES INDEX COMMENTARY + STRATEGY FACTS JANUARY 2018 CUMULATIVE PERFORMANCE ( SINCE JANUARY 2007* ) 120.00% 100.00% 80.00% 60.00% 40.00% 20.00% 0.00% AMFERI BARCLAY BTOP50 CTA INDEX S&P 500 S&P
BEYOND SMART BETA: WHAT IS GLOBAL MULTI-FACTOR INVESTING AND HOW DOES IT WORK?
 INVESTING INSIGHTS BEYOND SMART BETA: WHAT IS GLOBAL MULTI-FACTOR INVESTING AND HOW DOES IT WORK? Multi-Factor investing works by identifying characteristics, or factors, of stocks or other securities
Alpha Bonds Strategy
 Alpha Bonds Strategy Strategy Overview The Alpha Bonds Strategy combines conservative bond funds with Alpha s fourth quarter power periods to create what we believe is a unique solution to the conservative
Thinking. Alternative. Alternative Thinking Q4 2016: Superstar Investors. U.K. Supplement. Supplement released November 2017
 Alternative Thinking Supplement released November 2017 Alternative Thinking Q4 2016: Superstar Investors U.K. Supplement This document accompanies AQR s 2016 article Superstar Investors, which analyzed
Portfolio Construction Matters
 November 2017 Portfolio Construction Matters A Simple Example Using Value and Momentum Themes Shaun Fitzgibbons Vice President Peter Hecht, Ph.D. Managing Director Nicholas McQuinn Analyst Laura Serban,
Smart Beta #
 Smart Beta This information is provided for registered investment advisors and institutional investors and is not intended for public use. Dimensional Fund Advisors LP is an investment advisor registered
MANAGED FUTURES INDEX
 MANAGED FUTURES INDEX COMMENTARY + STRATEGY FACTS JULY 2018 CUMULATIVE PERFORMANCE ( SINCE JANUARY 2007* ) 120.00% 100.00% 80.00% 60.00% 40.00% 20.00% 0.00% AMFERI BARCLAY BTOP50 CTA INDEX S&P 500 S&P
Kensington Analytics LLC. Convertible Income Strategy
 Kensington Analytics LLC Convertible Income Strategy Investment Process About Convertible Bonds Coupon income tends to instill some level of downside price resilience on convertible bond prices. This explains
The Equity Imperative
 The Equity Imperative Factor-based Investment Strategies 2015 Northern Trust Corporation Can You Define, or Better Yet, Decipher? 1 Spectrum of Equity Investing Techniques Alpha Beta Traditional Active
2015 ANNUAL RETURNS YTD
 Stephen Somers, William Somers 1410 Russell Road, Suite 100, Paoli, PA 19301 USA ph. +1-484-576-3371 fax +1-610-688-9261 http://www.somersbrothers.com ANNUAL RETURNS 2011 2012 2013 2014 2015 YTD Advisor
Persistence in Mutual Fund Performance: Analysis of Holdings Returns
 Persistence in Mutual Fund Performance: Analysis of Holdings Returns Samuel Kruger * June 2007 Abstract: Do mutual funds that performed well in the past select stocks that perform well in the future? I
The Role of Hedge Funds SDCERA 2014 Board of Trustees Retreat March Lee Partridge, CFA Roberto Croce, Ph.D. Todd Centurino, CFA
 The Role of Hedge Funds SDCERA 2014 Board of Trustees Retreat March 2014 Lee Partridge, CFA Roberto Croce, Ph.D. Todd Centurino, CFA Disclosures The opinions expressed in these materials represent the
Managed Futures Trading Program
 Managed Futures Trading Program 1 TRADING FUTURES AND OPTIONS INVOLVES SUBSTANTIAL RISK OF LOSS AND IS NOT SUITABLE FOR ALL INVESTORS. THERE ARE NO GUARANTEES OF PROFIT NO MATTER WHO IS MANAGING YOUR MONEY.
Morgan Stanley ETF-MAP 2 Index Information
 Morgan Stanley ETF-MAP 2 Index Information Investing in instruments linked to the Morgan Stanley ETF-MAP 2 Index involves risks not associated with an investment in other instruments. See Risk Factors
Citi Dynamic Asset Selector 5 Excess Return Index
 Multi-Asset Index Factsheet & Performance Update - 31 st August 2016 FOR U.S. USE ONLY Citi Dynamic Asset Selector 5 Excess Return Index Navigating U.S. equity market regimes. Index Overview The Citi Dynamic
Insights from Morningstar Investment Services. Market Volatility: A Guide to Riding the Waves
 Insights from Morningstar Investment Services Market Volatility: A Guide to Riding the Waves If you ve invested for almost any length of time, you ve experienced at least one of those don t-look-at-your
2018 ANNUAL RETURNS YTD
 Howard A. Bernstein 38608 Oyster Catcher Drive, Ocean View, DE 20171 USA ph. +1-302-616-1970 fax http://www.hbinvesting.com ANNUAL RETURNS 2014 2015 2016 2017 2018 YTD Advisor 5.90% -1.06% 2.55% 8.24%
Short Term Alpha as a Predictor of Future Mutual Fund Performance
 Short Term Alpha as a Predictor of Future Mutual Fund Performance Submitted for Review by the National Association of Active Investment Managers - Wagner Award 2012 - by Michael K. Hartmann, MSAcc, CPA
1 Crosby, Daniel. The Behavioral Investor
 December 28th, 2018 1 This is provided for informational purposes only and should not be considered a recommendation to buy or sell a particular security. Past performance is no guarantee of future returns.
Foundations of Investing
 www.edwardjones.com Member SIPC Foundations of Investing 1 5 HOW CAN I STAY ON TRACK? 4 HOW DO I GET THERE? 1 WHERE AM I TODAY? MY FINANCIAL NEEDS 3 CAN I GET THERE? 2 WHERE WOULD I LIKE TO BE? 2 Develop
Momentum Crashes. Kent Daniel. Columbia University Graduate School of Business. Columbia University Quantitative Trading & Asset Management Conference
 Crashes Kent Daniel Columbia University Graduate School of Business Columbia University Quantitative Trading & Asset Management Conference 9 November 2010 Kent Daniel, Crashes Columbia - Quant. Trading
Risk-Adjusted Momentum: A Superior Approach to Momentum Investing
 Bridgeway Capital Management, Inc. Rasool Shaik, CFA Portfolio Manager Fall 2011 : A Superior Approach to Investing Synopsis This paper summarizes our methodology and findings on a risk-adjusted momentum
MANAGED FUTURES INDEX
 MANAGED FUTURES INDEX COMMENTARY + STRATEGY FACTS NOVEMBER 2018 CUMULATIVE PERFORMANCE ( SINCE JANUARY 2007* ) 140.00% 120.00% 100.00% 80.00% 60.00% 40.00% 20.00% 0.00% AMFERI BARCLAY BTOP50 CTA INDEX
THE VALUE OF VALUE INVESTING. Stephen Horan, Ph.D., CFA, CIPM Managing Director, Credentialing CFA Institute
 THE VALUE OF VALUE INVESTING Stephen Horan, Ph.D., CFA, CIPM Managing Director, Credentialing CFA Institute TODAY S AGENDA Characterize Value Investing Potential Benefits (Real and Imagined) Compare and
Spheria Australian Smaller Companies Fund
 29-Jun-18 $ 2.7686 $ 2.7603 $ 2.7520 28-Jun-18 $ 2.7764 $ 2.7681 $ 2.7598 27-Jun-18 $ 2.7804 $ 2.7721 $ 2.7638 26-Jun-18 $ 2.7857 $ 2.7774 $ 2.7690 25-Jun-18 $ 2.7931 $ 2.7848 $ 2.7764 22-Jun-18 $ 2.7771
Manager Comparison Report June 28, Report Created on: July 25, 2013
 Manager Comparison Report June 28, 213 Report Created on: July 25, 213 Page 1 of 14 Performance Evaluation Manager Performance Growth of $1 Cumulative Performance & Monthly s 3748 3578 348 3238 368 2898
Diversification Weighted Performance Evaluation Short Form Executive Summary for Financial Advisors 12/1/1996.
 Diversification Weighted Performance Evaluation Short Form Executive Summary for Financial Advisors October 7, 2014 Introduction Using the components of the S&P 500 Index, we investigate an alternative,
Smart Beta and the Evolution of Factor-Based Investing
 Smart Beta and the Evolution of Factor-Based Investing September 2016 Donald J. Hohman Managing Director, Product Management Hitesh C. Patel, Ph.D Managing Director Structured Equity Douglas J. Roman,
RISK PARITY AND ALTERNATIVE RISK PREMIA: A HAPPY MARRIAGE
 AJAY JAIN Head of Multi-Asset Class Portfolio Management WAI LEE Global Head of Quantitative Investments VANESSA ROSENTHAL Portfolio Specialist, Quantitative and Multi-Asset Class Investment Team OCTOBER
Factors have delivered similar risk-adjusted performance as asset classes, but may perform worse going forward
 Are Factors Better and More Diversifying Than Asset Classes? (For the most part, we don t think so) February 2018 By: Maneesh Shanbhag, CFA Executive Summary - Factor investing promises outperformance
TAKE CONTROL OF YOUR INVESTMENT DESTINY Increasing control over your investments.
 TAKE CONTROL OF YOUR INVESTMENT DESTINY Increasing control over your investments. Challenge for Investors Case for Factor-based Investing What Next? The Real World Economic and Market Outlooks are Constrained
Sustainable Investment Solutions Personalized Investment Plan
 Sustainable Investment Solutions Personalized Investment Plan Portfolio Recommendation and Investment Policy Statement Prepared for John Q. Sample and Mary R. Sample February 11, 2014 By First Affirmative
DIA SPDR Dow Jones Industrial Average ETF Trust
 SPDR Dow Jones Industrial Average ETF Trust ETF.com segment: Equity: U.S. - Large Cap Competing ETFs: SPY, IVV, VOO, IWB, SCHX Related ETF Channels: North America, Large Cap, U.S., Broad-based, DJ Industrial
Top 10 Reasons This Remains A Misunderstood and Underutilized Asset Class. Please see last page for important disclosures.
 18 INTERNATIONAL SMALL CAP Top 10 Reasons This Remains A Misunderstood and Underutilized Asset Class Please see last page for important disclosures. 1 INTERNATIONAL INVESTING IS RISKY. 2 INTERNATIONAL
ACSI American Customer Satisfaction ETF
 American Customer Satisfaction ETF ETF.com segment: Equity: U.S. - Large Cap Competing ETFs: SHE, JUST, CATH, MAGA, BIBL Related ETF Channels: North America, Smart-Beta ETFs, Large Cap, U.S., Broad-based,
Factoring in Behavior
 Factoring in Behavior Mike Fardy, National Sales Manager, CIMA, FlexShares Not For Use with Retail Investors Return (%) Global Equities Performance 300 240 180 120 60 0-60 Dec-08 Dec-11 Dec-14 Dec-17 U.S.
 Table I Descriptive Statistics This table shows the breakdown of the eligible funds as at May 2011. AUM refers to assets under management. Panel A: Fund Breakdown Fund Count Vintage count Avg AUM US$ MM
FDM First Trust Dow Jones Select MicroCap Index Fund
 First Trust Dow Jones Select MicroCap Index Fund ETF.com segment: Equity: U.S. - Micro Cap Competing ETFs: PZI, WMCR, IWC Related ETF Channels: North America, U.S., Micro-cap, Smart-Beta ETFs, Fundamental,
RSP Invesco S&P 500 Equal Weight ETF
 Invesco S&P 500 Equal Weight ETF ETF.com segment: Equity: U.S. - Large Cap Competing ETFs: EQAL, EQL, EQWL, GSEW, EDOW Related ETF Channels: North America, Equal-Weighted, Smart-Beta ETFs, Large Cap, U.S.,
High Dividend Stocks In Rising Interest Rate Environments
 High Dividend Stocks In Rising Interest Rate Environments July 2016 Disclosure: This research is provided for educational purposes only and is not intended to provide investment or tax advice. All numbers
Schindler Capital Management, LLC / Dairy Advantage Program. Year Jan Feb Mar Apr May Jun Jul Aug Sep Oct Nov Dec
 Schindler Capital Management, LLC / Dairy Advantage Program Fundamental / Ag & Livestock Performance Since August 2005 Year Jan Feb Mar Apr May Jun Jul Aug Sep Oct Nov Dec 2005-11.20% 3.20% -6.67% -13.73%
4Q17 Global & International Equity GLOBAL EQUITY. 10+ Years of Providing High Income Through Global Dividends
 4Q17 Global & International Equity GLOBAL EQUITY INCOME FUND 10+ Years of Providing High Income Through Global Dividends A: HFQAX C: HFQCX I: HFQIX N: HFQRX S: HFQSX T: HFQTX Overall Morningstar Rating
SYSTEMATIC GLOBAL MACRO ( CTAs ):
:") G R A H M C A P I T A L M A N G E M N T G R A H A M C A P I T A L M A N A G E M E N T GC SYSTEMATIC GLOBAL MACRO ( CTAs ): PERFORMANCE, RISK, AND CORRELATION CHARACTERISTICS ROBERT E. MURRAY, CHIEF OPERATING
G R A H M C A P I T A L M A N G E M N T G R A H A M C A P I T A L M A N A G E M E N T GC SYSTEMATIC GLOBAL MACRO ( CTAs ): PERFORMANCE, RISK, AND CORRELATION CHARACTERISTICS ROBERT E. MURRAY, CHIEF OPERATING
TAKE CONTROL OF YOUR INVESTMENT DESTINY Increasing control over your investments.
 TAKE CONTROL OF YOUR INVESTMENT DESTINY Increasing control over your investments. To appreciate the power of Factors, consider this: Humankind is formed from just 23 Chromosome pairs CMINST-13427 2 1 Yet,
DWTR Invesco DWA Tactical Sector Rotation ETF
 Invesco DWA Tactical Sector Rotation ETF ETF.com segment: Equity: U.S. - Total Market Competing ETFs: MTUM, PDP, QMOM, DWAQ, MMTM Related ETF Channels: North America, Smart-Beta ETFs, U.S., Total Market,
FUND OF HEDGE FUNDS DO THEY REALLY ADD VALUE?
 FUND OF HEDGE FUNDS DO THEY REALLY ADD VALUE? Florian Albrecht, Jean-Francois Bacmann, Pierre Jeanneret & Stefan Scholz, RMF Investment Management Man Investments Hedge funds have attracted significant
MTA Educational Web Series
 MTA Educational Web Series One Practitioner s Guide to Combining Macro, Fundamentals and Technical Analysis Presented by: Keith Lerner, CFA, CMT Chief Market Strategist SunTrust Bank July 2014 Outline:
The Role of Managed Futures Strategies Within Investment Portfolios
 The Role of Managed Futures Strategies Within Investment Portfolios Presented By Mark Rosenberg Chairman and Chief Investment Officer YALE UNIVERSITY November 4, 2005 SSARIS Advisors, LLC Financial Centre
The Bull Market: Six Years Old And Not Over
 The Bull Market: Six Years Old And Not Over April 22-24, 2015 FOR PROFESSIONAL USE ONLY. FURTHER DISTRIBUTION OF THE INFORMATION CONTAINED HEREIN IS PROHIBITED WITHOUT PRIOR PERMISSION. Disclosures This
Voya Indexed Universal Life-Protector
 calculation examples Values as of 07/28/2018 Voya ed Universal Life-Protector Issued by Security Life of Denver Insurance Company Required training! VFA Registered Representatives must review the Required
USEQ Invesco Russell 1000 Enhanced Equal Weight ETF
 Invesco Russell 1000 Enhanced Equal Weight ETF ETF.com segment: Equity: U.S. - Large Cap Competing ETFs: GSLC, SPHD, FEX, JKD, CFO Related ETF Channels: North America, U.S., Smart-Beta ETFs, Large Cap,
- Victor Haghani, Founder Elm. Watch the full talk here
 "After more than 20 years in finance, from the LSE to Salomon Brothers to LTCM, you d have thought that I d have figured out how to invest my family s savings. Well, it was 2002, I just turned 40, and
Identifying a defensive strategy
 In our previous paper Defensive equity: A defensive strategy to Canadian equity investing, we discussed the merits of employing a defensive mandate within the Canadian equity portfolio for some institutional
Sample Report PERFORMANCE REPORT I YOUR FUND
 Produced on //28 Data as of 6/3/28 PERFORMANCE REPORT I 5 East 57 th Street, Floor, New York, NY 22 Tel (22) 248-532 Fax (646) 45-884 7 Seventh Avenue, Suite 2, Seattle, WA 98 Tel (26) 47-254 Fax (26)
AlphaCentric Hedged Market Opportunity Fund
 AlphaCentric Hedged Market Opportunity Fund HMXAX HMXCX HMXIX Q1 2018 Presentation Seeks to achieve capital appreciation with lower overall volatility than the equity market For Registered Investment Professional
The Evolution of Alternative Beta: Using Index-Based Investment Strategies
 Filed pursuant to Rule 433 Registration Statement No. 333-180300-03 Investor Solutions The Evolution of Alternative Beta: Using Index-Based Investment Strategies This presentation may not be altered except
Common stock prices 1. New York Stock Exchange indexes (Dec. 31,1965=50)2. Transportation. Utility 3. Finance
2. Transportation. Utility 3. Finance") Digitized for FRASER http://fraser.stlouisfed.org/ Federal Reserve Bank of St. Louis 000 97 98 99 I90 9 9 9 9 9 9 97 98 99 970 97 97 ""..".'..'.."... 97 97 97 97 977 978 979 980 98 98 98 98 98 98 987 988
Digitized for FRASER http://fraser.stlouisfed.org/ Federal Reserve Bank of St. Louis 000 97 98 99 I90 9 9 9 9 9 9 97 98 99 970 97 97 ""..".'..'.."... 97 97 97 97 977 978 979 980 98 98 98 98 98 98 987 988
Dimensions of Equity Returns in Europe
 RESEARCH Dimensions of Equity Returns in Europe November 2015 Stanley Black, PhD Vice President Research Philipp Meyer-Brauns, PhD Research Size, value, and profitability premiums are well documented in
Hedge Funds, Hedge Fund Beta, and the Future for Both. Clifford Asness. Managing and Founding Principal AQR Capital Management, LLC
 Hedge Funds, Hedge Fund Beta, and the Future for Both Clifford Asness Managing and Founding Principal AQR Capital Management, LLC An Alternative Future Seven years ago, I wrote a paper about hedge funds
DAC Short Term: $10,000 Growth from Inception
 DAC Short Term: $10,000 Growth from Inception $10,900 $10,909 $10,800 $10,700 $10,600 $10,500 $10,400 $10,300 $10,200 $10,100 $10,000 11/2014 02/2015 05/2015 08/2015 11/2015 02/2016 05/2016 08/2016 11/2016
Can We Lower Portfolio Volatility and Still Meet Equity Return Expectations?
 Can We Lower Portfolio Volatility and Still Meet Equity Return Expectations? Richard Yasenchak, CFA Senior Vice President, Client Portfolio Manager, INTECH FOR INSTITUTIONAL INVESTOR USE/NOT FOR PUBLIC
Maycrest Balanced Fund Richard Davis, Maria Davis 1275 Gator Trl, West Palm Beach, FL USA ph fax
 Richard Davis, Maria Davis 1275 Gator Trl, West Palm Beach, FL 33409 USA ph. +1-203-722-8824 fax http://www.maycrestcapital.com Primary Category: Equity Long-Bias ANNUAL RETURNS 2014 2015 2016 2017 2018
Factor-based Investing Inspired by Wall Street Greats like Lynch & Buffett. John P. Reese, Founder & CEO Validea Validea Capital Management
 Factor-based Investing Inspired by Wall Street Greats like Lynch & Buffett John P. Reese, Founder & CEO Validea Validea Capital Management A few quick questions How many of you have heard of factorbased