Annual Report 2016 ANSALDO STS S.p.A.
|
|
|
- Wilfred Beasley
- 6 years ago
- Views:
Transcription

1 Annual Report 2016

2 Overview Highlights Mission 3 The CEO s Report 4 Profi le Who we are and where we come from 6 Geographical Structure 8 Corporate Management Roles 11 The Business The market and commercial situation 12 Key Orders 16 Analysis of the income statement, the balance sheet and the fi nancial position 17 Risks and uncertainties 22 Corporate Governance 29 Company bodies and committees 33 Human resources and organisation 34 Parent Company Accounts 39 Separate fi nancial statements 40 Consolidated Accounts 45 Consolidated fi nancial statements 46 Notes 50 External Auditors Report 106 Shareholder Information 108
3 Ansaldo STS Annual Report 2016 Welcome to ANSALDO STS A Company limited by shares, listed since 2006, leader in signalling, rail and subway transport systems, operating in over 30 Countries worldwide. Highlights 2016 (IFRS compliant amounts in EUR million) Orders Order-book Revenues , , , , , ,383.8 EBIT R.O.S. Net Profit % 9.8% Net Working Capital Net Cash (338.0) (338.7) 1

4 Overview Mission 2
5 Ansaldo STS Annual Report 2016 Mission We combine our experience and technological, financial and human resources to supply innovative solutions for the design and production of equipment and systems used in signaling and the automation of subway networks and conventional and high-speed railways lines. Our objective is threefold: to realize ever more advanced and reliable products leading to the development of the most environmentfriendly transport system currently available; to create value for all our Stakeholders, by responding efficiently to a continually increasing demand for mobility; to become world leader in our industry by promoting a culture of quality, safety and responsibility. 3


6 Overview The CEO s Report The CEO s Report I am pleased that this year, my first as CEO, was a successful one for Ansaldo STS including the acquisition of significant new contracts despite challenges. Andrew Barr CEO Ansaldo STS Group 4

7 Ansaldo STS Annual Report 2016 The progress on our existing projects was also substantial and provided a strong base from which to deliver more growth in With these results, I am proud to say that Ansaldo STS has strong capabilities with very professional management and staff. I look forward to 2017 where there will be more investment in the company and R&D and ensure that we have the key resources we need to continue its excellent delivery record. 5
8 Profile Who we are and where we come from Who we are and where we come from Our Parent Company Ansaldo STS has its headquarters in Genoa and is listed in the STAR segment of the Italian stock exchange % of company capital is held by Hitachi Rail Italy Investments, which is therefore the company s principal shareholder. The Group is an industry leader in Signalling and rail Transport systems. The Group, with its worldwide presence, operates in Central and Eastern Europe, Middle East, Western Europe, North Africa, the Americas and Asia Pacific. We operate throughout the world as lead contractors, system integrators and turnkey suppliers of the largest railway and subway mass transit projects. Group companies provide traffic management, train control, production of Signalling systems and maintenance services, all aiming to achieve lasting efficiency and safety for both clients and end-users. We are the only company listed both on the main board of the Italian stock exchange, FTSE MIB (which includes Italy s most highly capitalized concerns) and in the Star segment, which groups companies of excellence according to specific requisites, (liquidity, corporate governance and transparent disclosure) Our origins lie in signalling and transport systems, which until the mid-1990s were carried on by Ansaldo Trasporti, a company that pioneered many innovations in its over 150 years of history, such as the design and management of over half the high-speed train systems running in the world, as well as the design of the first driverless subway train This year saw the formation of Ansaldo Signal and subsequently Ansaldo Trasporti Sistemi Ferroviari, together with Ansaldo Breda in the rolling stock industry, all wholly owned by Finmeccanica, which led to a reorganisation of the whole transportation business Finmeccanica floated the signaling and transport systems businesses on the stock exchange after bringing them under a model of unitary management in order to optimise industrial and commercial synergies The reorganisation was completed when Ansaldo STS was formed specifically for the purpose of acquiring from Finmeccanica its entire stake in both Ansaldo Signal (which controlled all the Group s signaling businesses) and Ansaldo Trasporti Sistemi Ferroviari (in which the Transport systems businesses were concentrated). As of 31 March 2006 Ansaldo STS was listed in the STAR segment on the Milan stock exchange. To realise greater synergy and fully coordinate the various businesses - by increasing its size and overall profitability, further expanding in its markets and entering new product segments a further reorganization process was set in train in 2006 through which the Group aimed to: include in the mission of the Signalling businesses came to include the development of a Transportation solutions unit, using shared know-how and experience; rebrand the Group s subsidiaries under the Ansaldo STS name and uniform the brand, as well as increasing the sense of belonging to a single entity; place the Dutch sub-holding, Ansaldo Signal NV, in liquidation and transfer the Group s equity interests and legal obligations to Ansaldo STS by means of absorption; merge the two Italian subsidiaries Ansaldo Signalling Ferroviario and Ansaldo Trasporti Sistemi Ferroviari into the holding company Ansaldo STS to which operational functions were assigned Effective 1 January, the subsidiaries Ansaldo Segnalamento Ferroviario S.p.A. and Ansaldo Trasporti Sistemi Ferroviari S.p.A. were merged into Ansaldo STS S.p.A., approved on 20 June 2008 and signed on 26 September The US subsidiaries were renamed as follows: Union Switch and Signal Inc. became Ansaldo STS USA Inc. Union Switch and Signal International Co. became Ansaldo STS USA International Co. Union Switch and Signal International Projects Co. became Ansaldo STS USA International Projects Co. Transcontrol Corporation became Union Switch and Signal Inc. From 29 March of this year Ansaldo STS was included in the FTSE MIB index. Starting from the 30 June 2009 first-half report, the Segnalamento and Sistemi 6
9 Ansaldo STS Annual Report 2016 di Trasporto Business Units were renamed the Signalling and Transportation Solutions Business Units with no change to their respective businesses. This change was purely terminological: accordingly, all the Group s profit and loss and financial disclosures by Business Unit made to date (prior periods and comparative periods), including the values given in the IPO prospectus of March 2006, are fully comparable. On 1 October the merger of the Dutch subsidiary Ansaldo Signal N.V. into Ansaldo STS S.p.A. became effective In December 2009 a new company was formed in Brazil under the name Ansaldo STS Sistemas de Transporte e Sinalização Ltda. Capital was paid in This subsidiary is consolidated at net equity. Our Chinese subsidiary, Ansaldo Railway System Technical Service (Beijing) Ltd, was renamed Ansaldo Railway System Trading (Beijing) Ltd. Effective December 2010 Kazakhstan TZ-Ansaldo STS LLP a joint venture incorporated with JSC Remlokomotiv (of which joint control is governed by a shareholders agreement), has been consolidated using the proportional method. Our stake is 49%. In 2010 Ansaldo STS, acquired from Corridor Infrastructure Development Holdings (Pty) Ltd its 49.3% stake in Ansaldo STSInfradev South Africa (Pty) Ltd. through its subsidiary Ansaldo STS Australia. This brought our shareholding to 100% of the South African company. On 21 June 2010 the company name was changed to Ansaldo STS South Africa (Pty) Ltd At the end of 2011, effective January 2012, a joint venture between our indirect subsidiary ASTS South Africa Pty (Ltd) and Sinosa Rail Solutions South Africa Pty (Ltd) was set up in South Africa. The company name will change to Ansaldo STS - Sinosa Rail Solutions South Africa (Pty) Ltd In September 2012 it was decided to place our indirect subsidiary Ansaldo STS Finland OY in liquidation; this company was dormant In June 2013, Ansaldo STS s board of directors approved the dissolution of the JV in Kazakhstan with JSC Remlokomotiv and authorised the early closure and liquidation of Kazakhstan TZ-Ansaldo STS Italy LLP. The liquidation process is presently underway. In September 2013, the board of directors authorised the negotiations for the sale to a local operator of 31% of the shares currently held by the parent via its direct subsidiary, Ansaldo STS Australia PTY Ltd, in the subsidiary Ansaldo STS Sinosa Rail Solutions South Africa (Pty) Ltd, representing 51% of the entire share capital. Negotiations are still underway. In September 2013, the closure of the indirect subsidiary Ansaldo STS Finland OY took effect and this company was therefore excluded from the consolidation scope from such date. The directors had approved this company s liquidation in their meeting of 28 September In December 2013, in order to seize the strong sales opportunities arising in the Mass Transit sector, the directors resolved to set up a new company in Brazil. Ansaldo STS do Brasil Sistemas de Trasporte Ferroviario e Metropolitano LTDA was thus set up on 5 February 2014, with registered office in Fortaleza, in the state of Ceará in order to keep any commercial opportunities arising in Mass Transit market In December 2014, in order to boost group efficiency, on 16 December 2014, the board of directors authorised the early dissolution and, consequently, the liquidation of the subsidiary, Ansaldo STS Ireland LTD, now inactive. The process began in January 2015 and will presumably end during the first quarter of 2015 and in order to streamline the group s corporate structure in North America, Ansaldo STS USA International Projects Co., to date inactive, was merged into Ansaldo STS USA International Co On 2 November 2015, Finmeccanica S.p.A. executed the sale of its investment in Ansaldo STS to Hitachi Rail Italy Investments S.r.l., wholly owned by Hitachi Ltd.. Accordingly, Hitachi Ltd. became the company s controlling shareholder. On 21 December 2015, the company s board of directors verified that it is managed and coordinated by Hitachi Ltd. in accordance with article 2497 and subsequent articles of the Italian Civil Code. In order to boost group efficiency, on 25 November 2015, Ansaldo STS France, as the sole shareholder of Acelec, resolved to wind up this company with effect from 31 December In order to constantly streamline the group s corporate and organisational structure, the process of winding up the Company Kazakhstan TZ-Ansaldo STS Italy LLP was completed in November

10 Profile Geographical Structure In ANSALDO STS we draw on experience gained throughout the world to take care of all design features and all specific techincal solutions to meet the local needs of all our clients. Headquarter (Genoa) Regional HQ / Offices Current Projects REVENUE (K ) ORDERS (K ) GEOGRAPHICAL AREAS Italy 308, , , ,870 Rest of Europe 390, , , ,584 North Africa and Middle East 122, ,593 3,659 76,038 Americas 255, , , ,761 Asia Pacific 251, , , ,773 Total 1,327,386 1,383,837 1,475,836 1,336,

11 Ansaldo STS Annual Report 2016 HEADCOUNT (units) LEGAL ENTITIES ASTS ITALY* 1,712 1,555 ASTS FRANCE** ASTS USA ASTS APAC ASTS CHINA Total 3,951 3,772 * Includes Ansaldo STS Deutschland GmbH. ** Includes Ansaldo STS UK Ltd., Ansaldo STS Sweden AB

12 Profile Corporate Management Roles 10
13 Ansaldo STS Annual Report 2016 Corporate Management Roles: Andrew Thomas Barr: Chief Executive Officer and General Manager Christian Andi: Chief Operating Officer Roberto Corsanego: Vice President Investor Relations Filippo Corsi: Senior Vice President General Counsel & Chief Compliance Officer Cristiano Crinisio: Head of CEO Office Michele Fracchiolla: President Freight Business Unit Giacomo Galli*: Internal Audit Responsible Renato Gallo**: Chief Financial Officer Giuseppe Gaudiello: President Railways & Mass Transit Business Unit Leonardo Impagliazzo: Senior Vice President RAMS Edoardo La Ficara: Senior Vice President Institutional Affairs, External Relations & Communication Massimo Mele: Vice President Risk Management Andrea Razeto: Vice President External Communication Francesco Romano: Senior Vice President Human Resources & Organization Ulderigo Zona: Senior Vice President Hse, Facility Management & Physical Security_Supply Planning Construction & Maintenance * Managing director and country leader of the advisory firm Protiviti, ad interim manager of the internal audit unit of Ansaldo STS S.p.A.. ** Appointed on March 28 th, 2017 to replace Roberto Carassai. 11
14 The Business The market and commercial situation The market and commercial situation New orders acquired in 2016 approximated 1,476 million (2015: 1,336 million). The key events of the year are described below: ITALY The orders acquired during the period amount to roughly 429 million. Of particular note were contracts related to the technological upgrade of the Florence-Rome high-speed line (roughly 75 million in total), which envisages the implementation of the ERTMS L2 Trackside Subsystem and the ACC-M, and the contract relating to the Milan-Genoa highspeed line (the Terzo Valico dei Giovi ), for a value of around 175 million, the work scope of which regards the supply of technological systems relating to railway signalling equipment, the command and control system (SCCM/AV), the light and utility power system and the tunnel safety monitoring system. In addition, there were order variations on existing contracts, in particular those relating to the Line 6 project for the Naples metro for around 30 million and assistance and components contracts for a total of 28 million. REST OF EUROPE Orders amounted to approximately 427 million, consisting primarily of contracts in the UK, relating to the modernisation of the Glasgow metro with CBTC driverless signalling technology, including maintenance and an option exercised in the last part of the year, for 139 million, and the resignalling of the Ferriby - Gilberdyke line ( 20 million) with CBI SEI technology and the contract in Belgium relating to the automation of lines 1 and 5 of the Brussels metro with CBTC technology ( 88 million). In France, orders totalled around 79 million, including the contract with the customer RATP for the maintenance of the Paris metro line (approximately 27 million). As regards Northern Europe, orders amounted to around 81 million, consisting primarily of the ERTMS L2 contract in the town of Haparanda in Sweden ( 21 million) and variations relating to the Copenhagen metro. NORTH AFRICA AND THE MIDDLE EAST Orders in this area totalled around 4 million, consisting almost exclusively of variations on the maintenance contract for the metro line dedicated to the Princess Nourah women s university in Riyadh. AMERICAS In the Americas, orders acquired during the period amounted to roughly 129 million; the main order relates to an approximately 38 million contract entered into with Long Island Rail Road (LIRR) for the design and construction of a new computerised train control signalling system. In addition, roughly 55 million related to the sale of components, maintenance and modernisation for freight lines and around 17 million to the LIRR Mid Day Yard contract with the Long Island Rail Road (LIRR) for the supply of interlocking, switch machines and track circuits. ASIA PACIFIC Orders during the period amount to roughly 486 million. In Australia, orders amounted to approximately 139 million, primarily relating to lines for heavy haul mining and freight transport, including order variations relating to the Rio Tinto project ( 96 million); there is also a contract in place relating to the railway line connecting the town of Forrestfield to the Perth airport ( 30 million). Around 37 million in orders was recorded in Malaysia for signalling works in a section of the Klang Valley railway network. The main purchase order in the area regards the turnkey agreement entered into by the consortium consisting of Ansaldo STS, Hitachi Ltd. and RSEA Engineering Corp. with NCTG DORTS (New Taipei City Government Department of Rapid Transit System), relating to the San- Ying (Sanxia-Yingge) line of the Taipei underground railway system. The scope of work for Ansaldo STS, as consortium leader, involves the supply of CBTC (Communication Based Train Control) technology and all electro-mechanical systems (power supply, telecommunications, platform doors, ticketing systems, SCADA and depot equipment), for a value of around 220 million. Lastly, the orders acquired in India came to roughly 46 million, consisting primarily of the contract entered into with NMRC (Noida Metro Rail Corporation) relating to the implementation of CBTC signalling system for the Noida - Greater Noida Metro project (around 26 million). 12

15 Ansaldo STS Annual Report 2016 Business performance Revenue in 2016 came to 1,327.4 million, compared to 1,383.8 million in the previous year. The key production activities are summarised by geographical segment below. ITALY With respect to the high-speed railways business segment, production activities were focused on the Treviglio-Brescia section as part of the Saturno consortium. The 56 km line was activated in December in accordance with the accelerated schedule requested by the customer RFI. With respect to the on-board SCMT/ ERTMS systems, work to equip the ETR1000 high speed trains for the Trenitalia fleet continued. Production by the central automated system business unit mainly related to the project for the technological upgrade of the Turin-Padua line. In the reference period, an additional project milestone was achieved relating to the activation of a further 50 km section of the line (4 stations). Civil works continued for Line 6 of the Naples metro as well as the electro-mechanical installations for the Mergellina-S. Pasquale line. The S. Pasquale station has been essentially completed in accordance with the updated schedule. In March, civil works for the Rome metro line C resumed, for the construction of the San Giovanni station and the T3 section (from San Giovanni to Fori Imperiali), which were previously suspended. For the Milan metro Line 4, engineering and procurement activities continue. The initial access to the line is expected in the coming year. REST OF EUROPE In France, activities related primarily to the on-board systems and equipment for the country s highspeed network (in particular the two main projects relating to the LGV Sud Europe Atlantique Tours Bordeaux Tours and the LGV Bretagne Pays de la Loire lines), as well as the maintenance, assistance and production of individual parts contracts. In particular, for the LGV Bretagne Pays de la Loire project, the reference period saw the roll-out and start of field testing. In late June, a popular referendum approved the United Kingdom s exit from the European Union. There were no significant economic or financial impacts during the year. In Scotland, planning activities continued with respect to Glasgow metro modernisation, for which a dedicated contract for hedging currency risk has been entered into. In Sweden, production mainly related to the development of technological systems for the Stockholm Red Line metro, for which line installations continue, and the Ester project to upgrade the Swedish railway network to the ERTMS L2 standard. In Germany, activities moved forward on the software development project related to the supply of on-board devices for the Siemens Velaro D and Velaro Eurostar high-speed trains for the end customers DB, Eurostar and SCNF. 13
16 The Business The market and commercial situation In Turkey, recent geopolitical events have not yet had consequences on contracts in progress. With reference to the Mersin- Toprakkale project, works continued to install and roll out the multi-station equipment for the south section as well. During the period, a further multistation system relating to 50 km of line was activated. With respect to the Ankara metro, since March 2016, the safety assessment documents were issued as well as the relative certification of lines M1, M2 and M3 for the regular entry into service in CBTC mode. The CBTC system for these lines is therefore available for the customer s use, ready for passenger service. In Greece, with reference to the project for the construction of the Thessaloniki metro, works continue pending the conclusion of an agreement with the customer to close the arbitration procedure concerning the request by the contractor consortium for the recognition of higher expenses and/or costs incurred. In Denmark, the project relating to the Copenhagen Cityringen metro line is moving forward, for which the design and material procurement activities are being carried out in parallel with the dynamic testing activities on the trial rail. The activities related to supplies and installation will continue during The O&M activities related to the existing metro line, will progress steadily. In addition, installation activities proceed along the line for the construction of the tramway in the city of Aarhus, albeit with delays in reaching certain milestones. AMERICAS Activities for the construction of the Honolulu metro continued in Hawaii: specifically, static testing began on the first two trains that arrived on site. There were delays in the completion of civil works that were not part of the scope of work of ASTS, but were in preparation for it. In the United States, as regards the Positive Train Control project for the customer SEPTA in Philadelphia, the works are in the completion phase with a provisional roll-out. In parallel, design and procurement activities continue for two projects for the design and implementation of the Positive Train Control system for 15 lines of the customer MBTA in Boston, and to equip the Sharon Hill railway/tramway line in Philadelphia managed by the customer SEPTA with CBTC technology. Production for the sale of components for the existing eight product lines continued. In Peru, the design and procurement activities moved forward on Lines 2 and 4 of the Lima metro. The planning of the first phase can be deemed concluded and second phase planning is in the completion stage. The civil works are still affected by the delays caused by the difficulties in acquiring the areas to be expropriated. During 2017 goods supply and engineering activities are expected to progress based upon the ongoing negotiations with the final customer. It is expected also the final acceptance for engineering activities regarding the project phase 1 & 2 and a further progress related to phase 3. In addition, during this year, the impact of the delays related to civil works and the possible changes on track line will be assessed. NORTH AFRICA AND THE MIDDLE EAST The Libyan railway project is on hold and it is difficult to say when it will resume. With respect to the contract with the Russian customer Zarubezhstroytechnology for the Sirth - Benghazi line in Libya, the arbitration initiated by the customer in Vienna against the Ansaldo STS - Selex ES joint venture was concluded with the almost complete acceptance of the demands of the opposing party. In Saudi Arabia, design activities for the Riyadh Metro Line 3 project have been delayed compared to the initial schedule due to project modifications and variations requested by the customer. During 2017 it is expected the completion of the shipping of goods as well as the beginning of the installation phase. ASIA - ASIA PACIFIC In Australia, production activities mainly focused on projects covered by the framework agreement with Rio Tinto (RAFA), the Roy Hill project and Moreton Bay Rail Link. With respect to the RAFA projects, of particular note were activities in relation to the AutoHaul project, in which software upgrade and installation activities continued on the locomotives as well as system testing on the line. The project is currently expected to be completed in the first half of With respect to the Roy Hill project, stage 3 (IETO) was delivered, while stage 4 (CBS) activities continue, although with a delay compared to the original schedules. In Queensland, the Moreton Bay Rail Link line has been rolled out. For RAFA, Roy Hill and Moreton Bay Rail Link, negotiations are taking place with the customers about the claims for higher costs incurred. 14

17 Ansaldo STS Annual Report 2016 In India, works for the implementation of signalling systems relating to the KFW project continued. Due to the numerous modifications requested by the customer, delays are being accumulated, which lead us to believe that the project will not be completed before the end of next year. It should be noted that the supervision system passed inspection during the period. Despite the customer s reassignment of the rolling stock supply contract, the Kolkata metro project also continues to incur delays caused by the civil works and the unavailability of design inputs. Preliminary activities in Malaysia continue in relation to the signalling project for the Rawang - Salak Selatan section of the Klang Valley railway network, for which in any event certain aspects relating to the scope of the works still need to be defined. In South Korea, despite the issues relating to the completion of civil works, the high-speed section of the Sudokwon project was rolled out in December. In China, activities for the projects to supply CBTC technology for the Chengdu, Dalian, Hangzhou, Xi an, Zhengzhou and Shenyang metros continued as scheduled. Design and production activities continued for the construction of the Taipei Metro Circular Line metro. The delays in civil works further impacted the metro construction times, and the new works schedule is still being negotiated with the customer. During the reference period, the first train arrived on site. In parallel, also in Taipei, the engineering and procurement activities began for the new contract for the construction of the new San-Ying metro line. 15
 Taiwan Sanying Line MRT System NCTG DRTS 220 Italy Milan-Genoa high speed Saturno Consortium 175 Great Britain Glasgow")
18 The Business Key orders Key orders New orders for the year totalled 1,475.8 million compared to 1,336.0 million in the previous year. Key orders acquired in 2016 are as follows: Country Project Customer Amount ( m) Taiwan Sanying Line MRT System NCTG DRTS 220 Italy Milan-Genoa high speed Saturno Consortium 175 Great Britain Glasgow Metro - including maintenance Strathclyde Partnership for Transport 139 Australia Auto Haul - variations Rio Tinto Iron Ore 96 Belgium Brussels metro STIB 88 Italy ACC-MDD Rome-Florence including SST ERTMS ETCS Lev.2 RFI 75 USA LIRR Ronkonkoma LIRR 38 Malaysia KVDT Dhaya Maju Infrastructure 37 Italy Line 6 - Variations Naples municipality 30 Australia Forrest field Airport Link Salini Impregilo Spa - NWR Pty Ltd Joint Venture 30 France Maintenance 2016 RATP 27 India Noida Metro Delhi Metro Rail Corporation Limited 26 Sweden ESTER - Line 2 Trafikverket 21 Great Britain Ferriby Gilberdyke Network Rail 20 USA LIRR MID-DAY - Depot LIRR 17 Various EU / Asia Service & Maintenance Various 65 Various EU / Asia Components Various 49 USA Components Various 50 New orders for ( m) 1, ,336.0 December 2016 December
19 Ansaldo STS Annual Report 2016 Analysis of the income statement, the balance sheet and the financial position The profit for the year totalled 77.9 million ( 93.0 million for 2015). Revenue amounted to 1,327.4 million, down 56.5 million with respect to 1,383.8 million in 2015; the decrease, resulting in large part from reaching the final phase of several significant contracts in the Asia-Pacific area, was only partially offset by contracts acquired in recent years. Operating profit (EBIT) came to million, down 9.0 million on the previous year ( million); ROS was 9.6% (9.8% in 2015). Net invested capital amounted to million compared to million for The increase of 53.4 million was substantially due to the rise in net working capital ( 56.1 million). In particular, the increase in trade receivables was offset by the rise in trade payables and other liabilities, while the reduction in advances from customers (also correlated with the results of the arbitration on the project in Libya) was only partially offset by the decline in work in progress within the item progress payments and advances from customers. The net financial position (greater loan assets and cash and cash equivalents than loans and borrowings) was million, in line with million at 31 December Please note that dividends of 36.0 million were paid during the year ( 30.0 million in 2015). Loan assets include the euro equivalent amount of the Libyan dinar advance on the first of the two contracts in Libya obtained by the parent and deposited in a local bank and tied up pending the resumption of activities ( 28.4 thousand). The net financial position in 2015 included the 29.3 million remainder of the advance received from the Russian customer, Zarubezhstroytechnology (ZST), for the project agreed in August 2010 and suspended as from 21 February 2011, for the development of signalling, automation, telecommunication, power supply, security and ticketing systems on the Sirth to Benghazi section in Libya. In 2013, a dispute began with ZST, which launched an arbitration procedure at the Vienna International Arbitral Centre, which in May 2016 decided in favour of the Russian customer, almost completely rejecting the demands of Ansaldo STS. In October 2016, the company reimbursed ZST for its part of the advance held by the JV in addition to legal expenses and interest accrued until the repayment date ( 37.4 million). 17
 (1,182,421) (1,233,338) Amortisation, depreciation and impairment losses (18,325) (18,725) Other net operating income (**) 674 4,259 Change in work-in-progress, semi-finished products and")
20 The Business Analysis of the income statement, the balance sheet and the financial position Reclassified income statement ( 000) Revenue 1,327,386 1,383,837 Purchases and personnel expense (*) (1,182,421) (1,233,338) Amortisation, depreciation and impairment losses (18,325) (18,725) Other net operating income (**) 674 4,259 Change in work-in-progress, semi-finished products and finished goods (513) (264) Adjusted EBIT 126, ,769 Restructuring costs - - Operating profit (EBIT) 126, ,769 Net financial income (expense) (10,152) 943 Income taxes (38,746) (43,676) Profit (loss) from discontinued operations - - Profit for the year 77,903 93,036 attributable to the owners of the parent 77,968 93,228 attributable to non-controlling interests (65) (192) Earnings per share Basic and diluted Reconciliation between the reclassified income statement and the income statement included in the consolidated financial statements: (*) Includes the captions Purchases, Services, Personnel expense (net of restructuring costs) and Accrual to (use of) the provision for expected losses to complete contracts net of Internal work capitalised. (**) Includes the net amount of Other operating income and Other operating expense (net of restructuring costs and accrual to (use of) the provision for expected losses to complete contracts). 18

21 Ansaldo STS Annual Report 2016 Statement of financial position ( 000) Non-current assets 310, ,250 Non-current liabilities (61,131) (55,312) 249, ,938 Inventories 125, ,217 Contract work in progress 358, ,353 Trade receivables 728, ,558 Trade payables (458,119) (415,973) Progress payments and advances from customers (598,012) (635,785) Working capital 156,653 79,370 Provisions for risks and charges (14,040) (11,126) Other liabilities, net (*) (22,081) (3,763) Net working capital 120,532 64,481 Net invested capital 369, ,419 Equity attributable to the owners of the parent 707, ,787 Equity attributable to non-controlling interests Equity 707, ,093 Non-current assets held for sale - - Net financial position (338,039) (338,674) (*) Includes Tax assets and Other current assets, net of Tax liabilities and Other current liabilities. 19
22 The Business Analysis of the income statement, the balance sheet and the financial position Net financial position ( 000) Current loans and borrowings 1,780 1,628 Cash and cash equivalents (305,586) (304,306) NET CASH AND CASH EQUIVALENTS (303,806) (302,678) Related party loan assets (267) (563) Other loan assets (33,966) (37,933) LOAN ASSETS (34,233) (38,496) Related party loans and borrowings - 2,500 Other current loans and borrowings - - OTHER LOANS AND BORROWINGS - 2,500 NET FINANCIAL POSITION (338,039) (338,674) Reclassified statement of cash flows ( 000) Opening cash and cash equivalents 304, ,067 Profit for the year 77,903 93,036 Share of profits (losses) of equity-accounted investees (4,345) (5,324) Income taxes 38,746 43,676 Italian post-employment and other employee benefits Stock grant plans 4,731 1,891 Net gains on the sale of assets Net financial income 14,497 4,381 Amortisation, depreciation and impairment losses 18,325 18,725 Accruals to/reversals of provisions for risks 4,814 2,344 Other operating income/expense 3,118 7,802 Write-downs/reversals of write-downs of inventories and work in progress (4,498) (5,223) Gross cash flows from operating activities 154, ,008 Changes in other operating assets and liabilities (17,275) (68,499) Funds from operations 136,874 93,509 Change in working capital (83,152) 8,894 Cash flows from operating activities 53, ,403 Cash flows used in ordinary investing activities (15,778) (14,702) Free Operating Cash Flow 37,944 87,701 Strategic transactions (2,100) (15,092) Other changes in investing activities 3,205 5,968 Cash flows used in investing activities (14,673) (23,826) Dividends paid (36,000) (30,000) Cash flows from (used in) other financing activities (1,290) (18,027) Cash flows from (used in) financing activities (37,290) (48,027) Net exchange rate gains (479) 3,689 Closing cash and cash equivalents 305, ,306 20

23 Ansaldo STS Annual Report

24 The Business Risks and uncertainties Risks and uncertainties The risks described below stem from a consideration of the features of Ansaldo STS group s market (demand and offer) and business, together with the key findings of the updated risk assessment process. Risk assessment aims at identifying and evaluating the main risks that could have an impact on achieving objectives, for those processes identified as relevant, and the related mitigating actions, as well as defining additional actions to be taken to further reduce the risk or improve process performance. Ansaldo STS s risk assessment process is based on the Committee of Sponsoring Organisations of the Treadway Commission s internationallyrecognised Enterprise Risk Management framework (COSO report) and seeks to integrate risk assessment into the processes of planning, pursuing corporate and internal control targets in order to create value while properly managing risks and mitigation plans, in addition to exploiting any opportunities. The key risks and uncertainties faced by Ansaldo STS S.p.A. and the group are outlined below following the classification adopted by the group (strategic, operational, financial and IT risks). Risks may exist that have not yet been identified or that are deemed immaterial but which could nonetheless impact group operations. 22
25 Ansaldo STS Annual Report Strategic risks Changes in the macroeconomic and market context Ansaldo STS group operates internationally and is exposed to risks arising from macroeconomic/ geopolitical changes and a reference market presenting the greatest opportunities in emerging nations and those with the highest growth rates. Moreover, the market has seen greater volatility in the acquisition of contacts, due partly to the fact that projects tend to grow in size and scope and there is an increasingly consolidated trend towards the standardisation of products and technological solutions, especially in the signalling business unit. This leads to tougher competition, with decreasing prices and market consolidation even though the market shows modest growth in the medium term. The clauses in new contracts are more complex and generate greater risks which include the greater resort to project financing due to the contraction in funding available to customers. This market situation could negatively impact Ansaldo STS group s competitive edge and performance, e.g., difficulties in obtaining new contracts, contracting margins on new orders and exposure to less advantageous contractual terms. Macroeconomic and geopolitical factors that could impact the group s operations include the growth rate in the reference countries and public spending on infrastructure. The current macroeconomic and financial uncertainty, the drop in raw material prices, which reduces customers spending capacity in certain markets, political instability in some geographical areas of interest and plans to reduce public debt could generate delays or reductions in new orders, delays in payments and less favourable terms for new contracts, having a negative impact on Ansaldo STS group s performance. The group s strategy may not be immediately updated and adjusted in response to these many variables and uncertainties in the macroeconomic and market context, negatively impacting its competitiveness and performance. A key element of Ansaldo STS group s strategy is to optimise its operating structure by standardising the solutions and products offered and greater efficiency/optimisation in the use of resources during project implementation Innovation: a competitive factor The group s business units feature a high level of technological innovation and this represents an important competitive factor. Ansaldo STS group s ability to anticipate technological changes and implement an efficient investment policy is therefore paramount. If it fails to accurately assess innovation requirements, the contents of innovation and development projects, their benefits and related priorities, the group runs the risk of delays in the availability of new products and technical solutions, instability of new products, additional development costs on projects and lost sales. Processes to update the product portfolio and regularly assess products technical competitiveness are in place to mitigate these risks and ensure greater optimisation when making bids. The features and degree of technological innovation of the group s products and technical solutions generate a risk of obsolescence. There are specific processes in place to ensure its effective management. 23
26 The Business Risks and uncertainties 1.2 Operational risks Country risk The group s policy of penetrating new markets, particularly those with the highest rates of development, expose it to risks such as: political, social and economic instability, not accurately evaluating local legislation (as applies to companies, the sector and tax), the challenge of protecting intellectual property, exchange rate fluctuations, as well as the creditworthiness of counterparties, which can negatively impact the group s financial position and results of operations. Country risk is assessed when the group decides which offers and bids to make. Any mitigating actions are also contemplated at the time the bids are prepared and contracts managed Reliance on public customers and complex long-term contracts Group operations are highly dependent on public customers and, particularly in the turnkey systems business, on complex long-term contracts of a significant amount. Delays, amendments, revisions or cancellations of one or more significant contracts acquired could negatively impact the group s operations and its financial position and results of operations. Assessing long-term contracts using the percentage of completion method requires the estimates of costs to complete the activities, project risks (technical, legal, tax and commercial) and contract progress. These estimates are based on assumptions related to the impact of future events which, by their very nature and given the complexity of the projects underway, may not occur as envisaged, thus negatively impacting the project s financial and economic performance. Indeed, there is often an element of uncertainty related to third-party performance of civil works for transportation infrastructure and the group cannot always cover the related impacts on programs with contractual clauses. Market diversification and monitoring of country and compliance risk, structured project review processes involving senior management, the regular review and adjustment of contract and programme estimates and the adoption of risk management processes both at the time the bid is made and throughout project implementation, as well as lifecycle management processes involving the regular comparison of physical and accounting progress are in place to mitigate these risks Budgeting and project planning Ineffective project planning and control processes and weak project technical management could mean the project team cannot implement the project within the set budget and timeframes, especially complex projects. These risks could cause delays in identifying issues during project roll-out and related remedial actions as well as inaccurate reporting and planning, with a consequent negative impact on the group s financial position and results of operations. To mitigate this risk, there are formalised and monitored processes to check physical and accounting progress and risk management, clear allocation of responsibilities within the project team, managerial review of project performance, review of the estimates during the bidding and project phases and an independent review carried out by the risk management department Third parties (subcontractors, subsuppliers and partners) Ansaldo STS group makes considerable use of subcontractors to supply subsystems or assembly and installation services and of subsuppliers for goods or services in its business. The group s ability to fulfil its obligations to customers therefore relies on both subcontractors and subsuppliers properly fulfilling their contractual obligations. A breach thereby could in turn cause a breach by Ansaldo STS group, negatively impacting its reputation and, unless it is possible to obtain compensation from the subcontractors and subsuppliers, the group s financial position and results of operations. Moreover, particularly in the turnkey projects business, Ansaldo STS group also carries out contracts in conjunction with other operators. In these cases, each operator generally has joint and several responsibility vis-à-vis the customer for the completion of the entire contract. In the event of a breach or damage caused to the customer by an operator, the group could be called on to replace the operator causing the breach or damage, and to compensate the damage caused to the customer in full, without prejudice to the group s right of recourse vis-à-vis the defaulting operator. If the right of recourse against the operator responsible for the breach or damage is ineffective or protracted, this could negatively impact the Ansaldo STS group s operations as well as its financial position and results of operations. The preliminary assessment and consequent qualification of partners, suppliers, subcontractors and subsuppliers, particularly in new markets, may be inadequate, with negative impacts on the competitive nature of the technical solutions offered, 24
.")
27 Ansaldo STS Annual Report 2016 project performance and on the effectiveness of partnership governance (for instance, differences of opinion between the partners, misalignment of risks and costs/benefits for the individual partners). To mitigate these risks, the group has processes in place to select and evaluate suppliers, subcontractors and subsuppliers, it works with known and reliable partners, it defines, agrees and manages appropriate contractual and joint venture clauses, it has risk management processes and it requests specific guarantees, where applicable Efficient technical operations and relevant technical references Development and engineering activities carried out without a clear understanding and identification of the requirements, specifications or effective configuration management could negatively affect the project budget, compliance with deadlines, performance and customer satisfaction. To mitigate this risk, the group has requirement and configuration management processes in place to ensure quality, compliance with deadlines and efficiency in projects and development management. It has rolled out special projects to monitor the proper implementation of these processes during projects. Furthermore, if Ansaldo STS group does not have adequate market and operating references for products, this could lead to lost sales and noncompliant project implementation, negatively impacting the group s competitiveness and its financial position and results of operations. Such risk is carefully assessed when the bid is being prepared. It is managed through processes designed to ensure adequate interaction between the engineering unit, which communicates the customers requirements, the portfolio unit, which assesses the market s technical requirements and possible technical solutions, and the development unit, as well as via the development and monitoring of the product development roadmap. 25

28 The Business Risks and uncertainties Liability to customers or third parties for product defects or delivery delays Technological complexity and tight delivery times for group products and systems could leave it liable for delays in or failure to supply contractually-agreed products or services, for their non-compliance with customer requirements (for instance, due to design or construction faults) and for breaches of and/or delays in roll-out, the provision of post-sales services and product maintenance and servicing. Moreover, many products and systems supplied by the group are subject to certifications and approval, including by third-party bodies. Such liability could be directly attributable to Ansaldo STS group or to third-party operators such as subsuppliers or subcontractors. These risks could negatively impact the group s operations, its financial position and results of operations and its reputation, and could also result in the group incurring costs to repair faulty products or their withdrawal from the market in extreme cases. Even if adequate insurance is in place, the sum insured could be exceeded or the premiums could be raised following a claim, negatively impacting the group s financial position and results of operations. To mitigate these risks, the group agrees specific insurance coverage, carefully supervises its engineering, validation and returns monitoring processes and identifies mitigating actions and provides for contingencies in the bid in conjunction with the risk management process Legal disputes The complexity of dealings with third parties (customers, subcontractors/ subsuppliers and partners), especially for international projects and the content of systems and products developed, as well as specific business risks expose the group to a significant risk of legal disputes. Legal disputes could also relate to the awarding of bids. The settlement of disputes could be complex and take a long time, leading to delays in completing projects and negative impacts on the group s operations and its financial position and results of operations. To mitigate this risk, there are risk management processes in place during both the bid and management stages, disputes are monitored closely, contractual clauses are examined carefully with the legal department, and a prudent approach is adopted in recognising specific items under contract costs and provisions for risks. In addition, as the company operates within a complex international environment, it could be exposed to trade compliance risks. The lack of awareness or underestimation of trade compliance risk could negatively impact the company s reputation and profitability. 26

29 Ansaldo STS Annual Report 2016 To mitigate this risk, the company has initiated a process of mapping and evaluating the controls in place and those to be implemented, which is currently in the completion phase Human resource management Ansaldo STS group supplies products and systems featuring cutting-edge technology on a global scale and to do so, it requires human resources with specific expertise, which can be difficult to procure on the labour market. The success of the business development plans, especially in new markets, also depends on the group s ability to attract, retain and develop the skills of its human resources, particularly in order to operate in a global group and market context and on complex projects. To mitigate this risk, human resource management policies reflect the business needs. Ansaldo STS group also has an integrated human resource management and development system under which regular checks of expertise and performance are carried out and relevant training initiatives identified, as well as enabling the best possible allocation of resources Health, safety and environmental compliance Ansaldo STS group has to comply with health, safety and environmental legislation in the various countries in which it operates. Failure to comply with such legislation as a result of operating processes which are not adequately monitored or - especially in new markets in countries where standards are below-par or that are exposed to specific risks (e.g., high crime rates, terrorist attacks or epidemic risks) - due to an inadequate evaluation of such requirements and necessary measures, could expose the group to risks having significant impacts on its operations, its financial position and results of operations and its reputation. To mitigate this risk, Ansaldo STS group adopts health, safety and environmental management systems ensuring rigorous compliance with legislation in accordance with best practices, subject to internal and external monitoring and integrated with the security processes monitored by an independent internal unit. These management systems are certified (to OHSAS standard for workplace safety and ISO14001 for the environment) in the group s key companies. Requirements in new markets are evaluated at the time the bid is prepared and the assistance of external consultants is also sought. Policies and procedures have also been set to ensure a consistent approach throughout the group s various companies while still allowing for specific local legislation. 27
30 The Business Risks and uncertainties 1.3 Financial risks 1.4 IT risks Ability to finance a high level of current assets and obtain guarantees To carry out contracts, Ansaldo STS group requires: - adequate funding of current assets; - bank and/or insurance guarantees issued to the customer in the various project stages (bid bond, advance payment bond, performance bond, retention money bond and warranty bond) and/or guarantees issued by the parent (parent company guarantees). Current assets are usually funded by customer advances and progress payments. Ansaldo STS group s ability to obtain guarantees at good rates depends on the evaluation of its financial position and results of operations, which is usually based on various indices including an analysis of its financial position, analysis of the contract risk and experience and competitive positioning in the reference sector. Ansaldo STS group believes it complies with the relevant parameters. At 31 December 2016, it had guarantees of 3,982,516 thousand. Difficulty in negotiating suitable financial terms for new contracts, payment delays and/or suspension and deterioration of existing terms of payments, or the inability or greater difficulty in obtaining guarantees at good rates, would negatively impact the group s and the parent s operations and financial position and results of operations. To mitigate these risks, Ansaldo STS group has commercial and contract management policies focussed on financial aspects, centralised treasury management which optimises the cash flows of the various group companies; its financial position is solid and the contract parameters are assessed right from the time of the bid stage. In the present economic and market context, due to new contracts which have less favourable financial terms, working capital is monitored closely and specific initiatives are in place to mitigate its impact IT system IT systems are a vital part of Ansaldo STS group s operating structure and their management must be in line with the group s strategic objectives. IT solutions that do not match business needs, or upgrades thereof that do not meet users needs, or inefficient system or outsourcer management, could compromise the efficiency and effectiveness of group operations. Moreover, the unavailability or interruption of IT services or network and data loss or damage (including sensitive data or intellectual property), also as a result of hacking, could compromise group operations. To mitigate this risk, the IT policies took into account the organisational and process change initiatives. Moreover, Ansaldo STS group has a governance system based on best practices and follows structured and monitored processes for hardware and software management, including cyber-security aspects. 28

31 Ansaldo STS Annual Report 2016 Corporate Governance The Ansaldo STS shares have been listed on the Star segment of the markets organised and managed by Borsa Italiana S.p.A. since 29 March They were included in the FTSE MIB index from 23 March 2009 to 23 March 2014 and in the FTSE Italia Mid Cap index from 24 March 2014 until 6 April They then were re-included in the FTSE MIB index from 7 April 2015 until 20 December Since 21 December 2015, the shares have been included in the FTSE Italia Mid Cap index again. With the approval of the board of directors given on 19 December 2006, Ansaldo STS adopted the Code of conduct endorsed by Borsa Italiana S.p.A. in March 2006 and came into line with its requirements during Borsa Italiana S.p.A. s corporate governance committee adopted a new Code of conduct in December On 18 December 2012, Ansaldo STS s board of directors resolved to comply with the principles of this new code and to update its own governance systems to comply with them. The committee adopted a new version of such code in July 2014 and, furthermore, in July 2015; Ansaldo STS s corporate governance system basically comply with the latest version. Lastly, Ansaldo STS is completing a review of its documents and operating protocols in order to align its corporate governance system with the new regulations on market abuse introduced with Directive 2014/57/ EU (MAD 2) and Regulation (EU) 569/2014 (MAR), which repealed Directive 2003/6/EC and Directives 2003/124/EC, 2003/125/EC and 2004/72/EC. Detailed disclosure on the parent s corporate governance structure is provided in the section of the directors report covering corporate governance and the adoption of the Code of conduct for listed companies related to 2016, approved by the board of directors on 27 February 2017, published at the same time as this annual report. On 9 November 2015, the board of directors, pursuant to article 2386 of the Italian Civil Code, appointed Alessandra Piccinino as new non-executive independent director to replace Barbara Poggiali. Furthermore, on 25 November 2015, in relation to Mr. Hirayangi s resignation, the board of directors pursuant to article 2386 of the Italian Civil Code, appointed Mario Garraffo as new non-executive independent director. On the same date, the directors appointed Karen Boswell as the company s new deputy chairperson. Ms. Piccinino and Mr. Garraffo remained in office until the next shareholders meeting as provided for by article 2386 Paragraph 1 second part of the Italian Civil Code. 29
32 The Business Corporate Governance Subsequently, following the resignation on 30 March 2016 of Alistair Dormer, Karen Boswell and Stefano Siragusa, and as the majority of directors appointed by the shareholders meeting held on 2 November 2015 were no longer in office, the board of directors, taking into account the provisions of article 16.8 of the by-laws, called the shareholders meeting to, inter alia, appoint the new board of directors. The shareholders meeting held on 13 May 2016 determined that there would be nine directors and then appointed the new board for In particular, the meeting appointed the following as new directors of Ansaldo STS S.p.A.: Alistair Dormer (chairperson), Katherine Jane Mingay, Andrew Thomas Barr, Giuseppe Bivona, Rosa Cipriotti, Mario Garraffo, Alberto de Benedictis, Fabio Labruna and Katharine Rosalind Painter. Subsequently, at its meeting on 16 May 2016, the board of directors appointed Katherine Jane Mingay as deputy chairperson of the board of directors. On 24 May 2016, the board of directors appointed Andrew Thomas Barr as chief executive officer and general manager of Ansaldo STS S.p.A. Lastly, following the resignation of Katherine Jane Mingay from the role of deputy chairperson of Ansaldo STS S.p.A. on 21 October 2016 effective immediately, during its meeting on 28 October 2016 the board of directors appointed Alberto de Benedictis as deputy chairperson of the board of directors. During the meeting held on 28 October 2016, the board of directors resolved by majority to establish an executive committee (the bid committee). The committee was vested with the power to evaluate and approve bids for the acquisition of contracts for public and private sector customers exceeding 150 million and within the limit of 350 million per transaction. The executive committee consists of chairperson Alistair Dormer, chief executive officer Andrew Thomas Barr and director Katherine Jane Mingay. The company s board of statutory auditors, appointed for the three-year term from 2014 to 2016 by the shareholders on 15 April 2014, includes Giacinto Sarubbi (chairperson), Renato Righetti and Maria Enrica Spinardi and the substitute statutory auditors Fabrizio Riccardo Di Giusto, Giorgio Mosci and Daniela Rosina. On 16 May 2016, the board of directors appointed Francesco Gianni as board secretary. On 16 May 2016, the board of directors appointed the members of the risk and control committee (Alberto de Benedictis chairperson, Mario Garraffo and Katharine Rosalind Painter) and the appointments and remuneration committee (Katharine Rosalind Painter chairperson, Alberto de Benedictis and Mario Garraffo). On 24 May 2016, the board of directors also confirmed the CFO Roberto Carassai as manager in charge of financial reporting pursuant to article 154-bis of Italian Legislative decree no. 58/1998. On 19 October 2016, Roberto Carassai signed a consensual termination agreement with the company, based on which he will take leave of his role as CFO and Manager in charge of financial reporting as of 28 February On their appointment, the directors Giuseppe Bivona, Rosa Cipriotti, Fabio Labruna, Katharine Rosalind Painter, Alberto de Benedictis and Mario Garraffo confirmed that they meet the requirements for independence pursuant to the current legislation and the Code of conduct. The board of directors also assessed these requirements on 16 May 2016 and, with respect to Mr. Garraffo, on 24 May Also at the request of the board of statutory auditors, on 11 July and 19 December 2016 the board of directors evaluated whether director Alberto de Benedictis continued to meet the independence requirements. Furthermore, in the meeting held on 24 May 2016, pursuant to principle 7.P.3 of the Code of conduct, the company s board of directors appointed the CEO, Andrew Thomas Barr, as director in charge of the internal control and risk management system. During the same meeting, the board of directors also confirmed the assignment of the internal audit function to the external company Protiviti S.r.l., and Giacomo Galli, managing director and country leader of that company as internal audit manager. On the same date, the board of directors confirmed Nicoletta Garaventa and Alberto Quagli as chairperson and external member, respectively, of the company s supervisory body, as well as Filippo Corsi, general counsel of Ansaldo STS, as the internal member of the supervisory body. 30
33 Ansaldo STS Annual Report 2016 Pursuant to the Code of conduct, during the first meeting of the board of statutory auditors, held on 15 April 2014, the statutory auditors Giacinto Sarubbi, Renato Righetti and Maria Enrica Spinardi, also confirmed that they meet the independence requirements pursuant to current legislation and stated thereby at the time of their appointment. Compliance with the independence requirements was subsequently verified and confirmed by the members of the board of statutory auditors during the meetings held on 9 December 2014 and 2 February 2016, for 2015, as well as on 28 November With respect to the independent auditors appointed to perform the legally-required audit of Ansaldo STS S.p.A. s financial statements, in their meeting of 7 May 2012, the shareholders awarded the audit engagement for the period to KPMG S.p.A.. Following the resignation of the independent auditors KPMG S.p.A. received on 14 November 2016, at its meeting held on 24 November 2016 the board of directors called the ordinary shareholders meeting to engage a new auditor. On 19 January 2017, the shareholders awarded the audit engagement for the period to EY S.p.A.. Lastly, on 25 February 2016 the board of directors approved the parent s remuneration policy for the year 2016, in compliance with the recommendations of article 6 of the Code of conduct, on the basis of the proposal prepared by the appointments and remuneration committee dated 25 February On 25 February 2016, after discussion with the appointments and remuneration committee, the board of directors also approved the remuneration report prepared by the company pursuant to article 123-ter of the Consolidated finance act and article 84-quater of the Issuer regulation. Finally, pursuant to article 123-ter, paragraph 6 of the Consolidated finance act, the ordinary shareholders meeting held on 13 May 2016, approved the first section of the above-mentioned report required by article 123-ter, paragraph 3 of the Consolidated finance act, which describes the company s remuneration policy for its officers and key managers, and the procedure followed to implement and describe this policy. Pursuant to articles 70, paragraph 8 and 71, paragraph 1-bis of the Issuer regulation, we note that, on 28 January 2013, in compliance with articles 70, paragraph 8 and 71, paragraph 1-bis of the Issuer regulation, the Board of directors of the parent resolved to opt out of the requirement to publish the relevant documents for transactions such as mergers, demergers, share capital increases via contributions in kind, acquisitions and sales. The key corporate governance tools that the company has implemented in compliance with the most recent legislative and regulatory requirements, as well as by the Code of conduct and national and international best practices, are as follows: By-laws; Code of ethics; Organisational, management and control model pursuant to Italian Legislative decree no. 231/01; Shareholders meeting regulations; Board of directors regulations; Executive committee (i.e. bid committee) regulations; Risk and control committee regulations; Appointments and remuneration committee regulations; Related party transactions - Procedure adopted pursuant to article 4 of CONSOB regulation no of 12 March 2010 as amended; Procedure for the establishment and updating of the list of people with access to privileged information; Procedure for the handling and communication of privileged and confidential information; Internal Dealing code of conduct. For further details on the parent s corporate governance, reference should be made to the Corporate governance report, comprising all disclosure required by article 123-bis of the Consolidated finance act, available on the company s website 31

34 The Business Company bodies and committees 32
35 Ansaldo STS Annual Report 2016 Company bodies and committees BOARD OF DIRECTORS (elected by the shareholders on 13 May 2016 for the three-year period) ALISTAIR DORMER (1) Chairperson ALBERTO DE BENEDICTIS (2) (3) (4) Deputy chairperson* BOARD OF STATUTORY AUDITORS (for the three-year period) GIACINTO SARUBBI Chairperson RENATO RIGHETTI MARIA ENRICA SPINARDI ANDREW THOMAS BARR (1) Chief executive officer and general manager ROSA CIPRIOTTI (4) MICHELE ALBERTO FABIANO CRISOSTOMO ** (4) MARIO GARRAFFO (2) (3) (4) FABIO LABRUNA (4) KATHERINE JANE MINGAY (1) KATHARINE ROSALIND PAINTER (2) (3) (4) FRANCESCO GIANNI*** Board secretary SUBSTITUTE STATUTORY AUDITORS (for the three-year period) FABRIZIO RICCARDO DI GIUSTO GIORGIO MOSCI DANIELA ROSINA INDEPENDENT AUDITORS (for the period) EY S.p.A. **** (1) Member of the executive committee (i.e. bid committee) (2) Member of the risk and control committee (3) Member of the appointments and remuneration committee (4) Member meeting independence requirements * Position held by Katherine Jane Mingay from 13 May 2016 to 28 October Alberto De Benedictis was appointed deputy chairperson by the board of directors during the meeting of 28 October ** Michele Alberto Fabiano Crisostomo was appointed director of Ansaldo STS S.p.A. by the shareholders meeting of 19 January 2017, to replace Giuseppe Bivona who, pursuant to art of the Italian Civil Code, was removed from the position of company director. *** Appointed on 16 May 2016 to replace Filippo Corsi. **** Following the resignation of KPMG S.p.A. on 14 November 2016, the shareholders meeting of 19 January 2017 appointed the independent auditors EY S.p.A. to audit the company s accounts for the years
36 The Business Human Resources and Organization Human Resources and Organization The Human resources & organisation department continued to assist the business during the year by strengthening and disseminating specialist technical knowledge and a managerial culture to ensure greater efficiency and effectiveness in implementing internal processes and contract activities ,000 1,500 1,712 1,555 1, ASTS Italy ASTS France ASTS USA ASTS APAC ASTS China COMPANY/REGION Change ASTS Italy* 1,712 1, ASTS France** ASTS USA ASTS APAC (59) ASTS China (5) * Includes the employees of Ansaldo STS Deutschland GmbH. ** Includes the employees of Ansaldo STS UK Ltd. and Ansaldo STS Sweden AB. All training programmes aimed at managerial talent (key resources and rockets) were completed and the strategic initiatives meant to ensure the transfer and capitalisation of skills and technological expertise were rolled out. Within the talent management programme, the HR department s efforts are focused on employees who are considered leaders in cutting-edge technology (knowledge owners). The group consists of 76 employees identified worldwide based on a structured process of interviews conducted by the Human Resources Department and champions, or those with the most expertise in the company in the relative technology. In 2016, the Human Resources Department launched two surveys for the company population (the Cultural Survey and the Global Employee Survey) to collect feedback and suggestions aimed at improving employee alignment with business objectives and the motivation to achieve them. The results of the surveys, in which roughly 80% of the global population participated, will be used to define actions for improvement with the involvement of the company management in the course of
37 Ansaldo STS Annual Report 2016 Ansaldo STS In 2016, the following changes were made in the company s governance: On 30 March 2016, the board of directors acknowledged the resignations of directors Alistair Dormer (chairperson), Karen Boswell (deputy chairperson) and Stefano Siragusa (chief executive officer) from their offices in Ansaldo STS S.p.A.. On 13 May 2016, the shareholders meeting of Ansaldo STS S.p.A. appointed Alistair Dormer as chairman of the company Ansaldo STS S.p.A.. On 16 May, the board of directors appointed Katherine Jane Mingay as deputy chairperson. On 24 May 2016, the board of directors of the company appointed Andrew Thomas Barr as chief executive officer. In addition, on the same date, the board of directors appointed Andrew Thomas Barr as general manager reporting directly to the board itself. Subsequently, on 21 October 2016, Katherine Jane Mingay resigned from the role of deputy chairperson effective immediately. On 28 October 2016, the board of directors therefore appointed Alberto de Benedictis as deputy chairperson of the company s board of directors, effective immediately. As a result, the following people are in office at 31 December 2016: (i) Chairperson of the board of directors: Alistair Dormer; (ii) Deputy chairperson of the board of directors: Alberto de Benedictis; (iii) Chief executive officer and general manager: Andrew Thomas Barr. In addition, on 15 March 2016 the board of directors appointed Giacomo Galli, managing director and country leader of the advisory firm Protiviti, ad interim manager of the internal audit unit of Ansaldo STS S.p.A. to replace Mauro Giganti, who resigned on 20 January On 19 October 2016, Roberto Carassai signed a consensual termination agreement with the company, based on which he will take leave of his role as CFO and Manager in charge of financial reporting as of 28 February (iv) On 25 November 2016, Marco Fumagalli left the company. Therefore, the Strategy, Quality & Improvement function was assigned to the CEO for the interim period Subsidiaries On 4 December 2015, Davide Cucino resigned from his role as Executive Director Country Representative Ansaldo Railway System Trading (Beijing) LTD. effective immediately as of 1 January On 25 November 2016, as noted above, Marco Fumagalli left the company and as a result also his role as Country Representative Ansaldo STS USA. Therefore, the country representatives of Ansaldo STS s major entities at 31 December 2016 are as follows: Country Representative Ansaldo STS France S.A.S.: Gilles Pascault. Country Representative Ansaldo STS USA INC.: Joseph Pozza. Country Representative Ansaldo STS Australia PTY LTD: Raphael Ferreira. Country Representative Ansaldo Railway System Trading (Beijing) LTD: Luciano Libanori. 35

38 Contents Contents Parent Company Accounts Separate financial statements Income statement Statement of comprehensive income Statement of financial position Statement of cash flows Statement of changes in equity 43 Consolidated Accounts Consolidated financial statements Consolidated Income statement Consolidated Statement of comprehensive income Consolidated Statement of financial position Consolidated Statement of cash flows Consolidated Statement of changes in equity Notes Notes to the consolidated financial statements at 31 December General information Basis of preparation Accounting policies Segment reporting Notes to the statement of financial position Related party assets and liabilities Intangible assets Property, plant and equipment Equity investments Loans and receivables and other non-current assets Inventories Work in progress and progress payments and advances from customers Trade receivables and loan assets Tax assets and liabilities Other current assets Cash and cash equivalents Share capital 77 36

39 Ansaldo STS Annual Report Retained earnings Other reserves Equity attributable to non-controlling interests Loans and borrowings Provisions for risks and charges and contingent liabilities Employee benefits Other current and non-current liabilities Trade payables Derivatives Guarantees and other commitments Notes to the income statement Impact of related party transactions on profit or loss Revenue Other operating income Purchases and services Personnel expense Amortisation, depreciation and impairment losses Other operating expense Internal work capitalised Net financial expense Share of profits (losses) of equity-accounted investees Income taxes Earnings per share Cash flows from operating activities Financial risk management Key managers remuneration Outlook Information pursuant to article 149-duodecies of Consob Issuer Regulation Statement on the consolidated financial statements pursuant to article 81-ter of Consob regulation no of 14 May 1999 and subsequent amendments and integrations and article 154-bis.2 of Italian Legislative decree no. 58 of 24 February 1998 and subsequent amendments and integrations 105 External Auditors Report 106 Shareholder information
40 Titoloxxxxxxxxx 38
41 Ansaldo STS Annual Report 2016 Parent Company Accounts 1. Separate financial statements At 31 December
42 Parent Company Accounts Separate financial statements 1. Separate financial statements 1.1 Income statement (in euros) 2016 of which, related parties 2015 of which, related parties Revenue 829,991, ,334, ,730, ,347,373 Other operating income 18,327,633 12,023,183 21,895,916 15,496,056 Purchases (275,734,297) (49,115,871) (222,092,924) (19,741,621) Services (356,683,508) (67,058,233) (327,321,269) (64,864,925) Personnel expense (144,064,413) 897,999 (128,781,324) 1,655,524 Amortisation, depreciation and impairment losses (12,246,977) - (12,103,590) - Other operating expense (4,203,676) (4,386) (8,272,397) - Changes in finished goods, work-in-progress and semi-finished products 620,482-85,170 - (-) Internal work capitalised 4,700,268-4,693,608 - Operating profit (EBIT) 60,707,289 49,833,990 Financial income 121,097, ,489,712 23,626,798 6,807,354 Financial expense (19,842,036) (270,423) (21,918,494) (2,572,357) Profit before taxes and discontinued operations 161,962,774 51,542,294 Income taxes (16,105,536) - (15,641,407) - Profit (loss) from discontinued operations Profit for the year 145,857,238 35,900, Statement of comprehensive income (in euros) Profit for the year 145,857,238 35,900,887 Items that will not be reclassified to profit or loss: - Actuarial gains (losses) on defined benefit plans (37,009) 527,271 - Income tax 11,783 (145,000) (25,226) 382,271 Items that will or may be reclassified to profit or loss: - Change in fair value of cash flow hedges (1,129,428) (3,158,877) - Foreign operations foreign currency translation differences 114,715 5,215,420 - Income tax 394,817 (565,550) (619,896) 1,490,993 Other comprehensive income (expense), net of taxes (645,122) 1,873,264 Comprehensive income for the year 145,212,116 37,774,151 40
43 Ansaldo STS Annual Report Statement of financial position (in euros) 2016 of which, related parties 2015 of which, related parties Non-current assets Intangible assets 10,061,520-12,252,228 - Property, plant and equipment 62,792,005-63,767,725 - Equity investments 169,786, ,181,485 - Loans and receivables 27,634,202 25,521,827 25,234,362 21,210,250 Deferred tax assets 18,120,644-18,320,643 - Other non-current assets 16,090,169-18,332,007 36, ,485, ,088,450 Current assets Inventories 95,279,408-95,642,164 - Contract work in progress 178,438, ,482,642 - Trade receivables 606,054,373 97,035, ,538,790 92,272,983 Tax assets 17,446,617-15,008,472 - Loan assets 51,233,847 22,790,842 50,521,847 22,078,842 Derivatives 9,801,950-8,437,775 - Other current assets 57,280,535 4,334 64,811,967 4,334 Cash and cash equivalents 202,995, ,636,361-1,218,530,442 1,141,080,018 Total assets 1,523,015,795 1,446,168,468 Equity Share capital 100,000, ,000,000 - Other reserves 98,276,030-95,418,260 - Retained earnings, including the profit for the year 277,047, ,190,109 - Total equity 475,323, ,608,369 Non-current liabilities Loans and borrowings Employee benefits 18,294,171-17,947,846 - Deferred tax liabilities 9,218,684-8,730,698 - Other non-current liabilities 3,508,509-3,520,020-31,021,364 30,198,564 Current liabilities Progress payments and advances from customers 427,931, ,572,919 - Trade payables 398,666,380 40,389, ,524,783 37,078,022 Loans and borrowings 93,978,687 92,207, ,531, ,923,893 Tax liabilities 8,303,752-4,726,387 - Provisions for risks and charges 2,104,648-2,475,119 - Derivatives 22,615,176-16,436,212 - Other current liabilities 63,070, ,694 57,094, ,109 1,016,671,054 1,053,361,535 Total liabilities 1,047,692,418 1,083,560,099 Total liabilities and equity 1,523,015,795 1,446,168,468 41
44 Parent Company Accounts Separate financial statements 1.4 Statement of cash flows (in euros) 2016 of which, related parties 2015 of which, related parties Gross cash flows from operating activities: Profit for the year 145,857,238-35,900,887 - Depreciation and impairment losses 12,246,978-12,103,590 - Income texes 16,105,536-15,641,407 - Accruals to provisions 646, ,564 - Italian post-employment benefits 518, ,994 - Defined benefit plans and stock grant plans 3,921,212-1,521,911 - Financial income (expenses), net of impairment losses on equity investments measured at cost (101,255,485) - (1,708,304) - Gross cash flows from operating activities 78,040,272 (114,219,290) 64,628,049 (4,234,997) Inventories 362,756 - (15,619,887) - Work in progress and progress payments and advances from customers (26,596,460) - (51,141,178) - Trade receivables and Payables (4,373,986) - 51,252,365 - Change in operating working capital (30,607,690) (1,451,055) (15,508,700) 35,246,258 Changes in other operating assets and liabilities (2,389,555) 378,085 (9,999,108) (246,524) Net interest paid (9,554,091) - (7,706,439) (4,234,997) Income taxes paid (3,098,222) - (6,188,142) - Cash flows from operating activities 32,390,713 25,225,660 Cash flows from investing activities: Acquisitions of companies, net of cash acquired (2,099,400) - (15,502,713) - Investments in property, plant and equipment and intangible assets (2,601,749) - (4,221,421) - Dividends received from ASTS group companies 111,092, ,092,053 3,100,000 3,100,000 Other investing activities (158,001) (1,765,301) (2,017,368) (4,542,874) Cash flows used in investing activities 106,232,903 (18,641,502) Cash flows from financing activities: Net change in loan assets and loans and borrowings (78,264,289) - 22,671,008 33,387,496 Dividends paid (36,000,000) - (29,999,789) - Cash flows from (used in) financing activities (114,264,289) (7,328,781) Net increase (decrease) in cash and cash equivalents 24,359,327 - (744,623) - Opening cash and cash equivalents 178,636, ,380,984 - Closing cash and cash equivalents 202,995, ,636,361 42
45 Ansaldo STS Annual Report Statement of changes in equity (in euros) Share capital Retained earnings Stock grant reserve Hedging reserve Other reserves Total equity Equity at 1 January ,999, ,579,070 3,183,342 3,369,245 86,830, ,960,999 Use of treasury shares for SGP Other comprehensive income (expense), net of taxes (3,158,878) 5,032,142 1,873,264 Change in SGP reserves - Ansaldo STS S.p.A. - (290,059) 189, (100,817) Change in SGP reserves - other companies (26,877) (26,877) Dividends (199,998,595 x 0.15) - (29,999,789) (29,999,789) Profit for the year ended 31 December ,900, ,900,887 Equity at 31 December ,000, ,190,109 3,372, ,367 91,835, ,608,369 Other comprehensive income (expense), net of taxes (1,129,428) 484,306 (645,122) Change in SGP reserves - Ansaldo STS S.p.A ,948, ,948,771 Change in SGP reserves - other companies , ,121 Dividends (200,000,000 x 0.18) - (36,000,000) (36,000,000) Profit for the year ended 31 December ,857, ,857,238 Equity at 31 December ,000, ,047,347 6,321,355 (919,061) 92,873, ,323,377 43
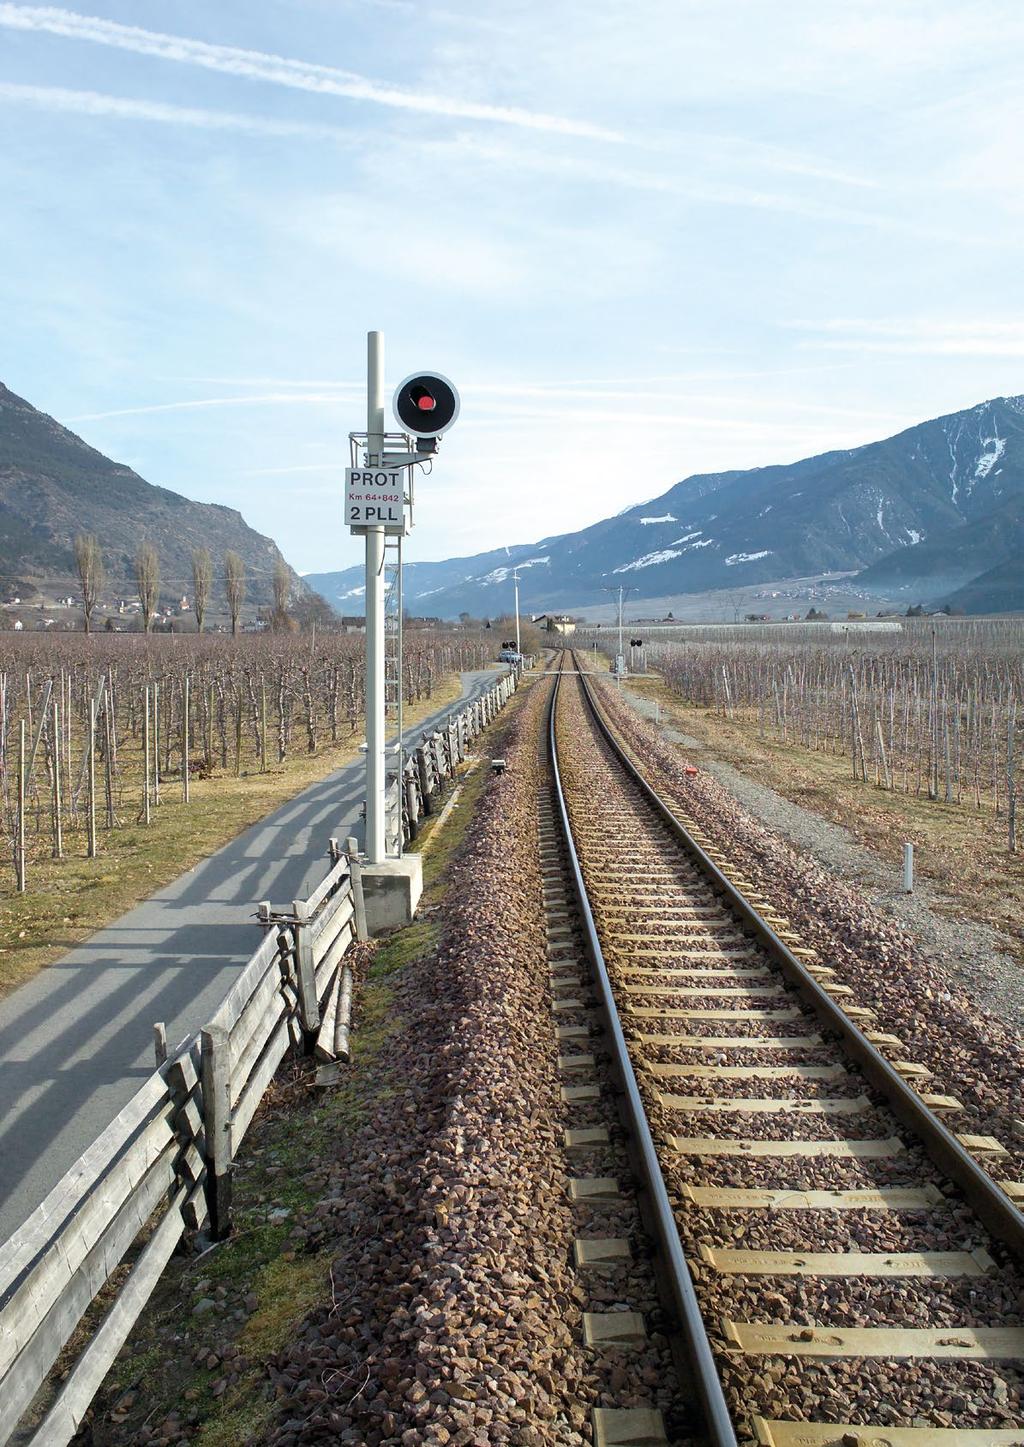
46 Titoloxxxxxxxxx 44
47 Ansaldo STS Annual Report 2016 Consolidated Accounts 2. Consolidated financial statements 3. Notes At 31 December
48 Consolidated Accounts Consolidated financial statements 2. Consolidated financial statements 2.1 Consolidated Income statement ( 000) Note of which, related parties of which, related parties Revenue ,327,386 92,118 1,383,837 73,202 Other operating income ,256 1,300 24,758 4,151 Purchases (354,006) (23,648) (351,875) (12,477) Services (500,283) (41,339) (561,014) (44,282) Personnel expense (332,338) - (321,676) - Amortisation, depreciation and impairment losses (18,325) - (18,725) - Other operating expense (21,507) (4) (24,584) - Changes in finished goods, work-in-progress and semi-finished products (513) - (264) - (-) Internal work capitalised ,131-5,312 - Operating profit 126, ,769 Financial income ,441-30, Financial expense (26,938) - (35,221) - Share of profits (losses) of equity-accounted investees ,345-5,324 - Profit (loss) 116, ,712 Income taxes (38,746) - (43,676) - Profit for the year 77,903 93,036 attributable to the owners of the parent 77,968 93,228 attributable to non-controlling interests (65) (192) Earnings per share Basic and diluted Consolidated Statement of comprehensive income ( 000) Note Profit for the year 77,903 93,036 Items that will not be reclassified to profit or loss: - Actuarial gains (losses) on defined benefit plans (2,091) Income tax (184) (1,388) 449 Items that will or may be reclassified to profit or loss: - Net change in fair value of cash flow hedges ,511 (5,484) - Net exchange rate gains ,718 23,667 - Income tax (1,767) 1,640 10,463 19,823 Other comprehensive income, net of taxes 9,074 20,272 Comprehensive income for the year 86, ,308 Attributable to: - the owners of the parent 87, ,535 - non-controlling interests (86) (227) 46
49 Ansaldo STS Annual Report Consolidated Statement of financial position ( 000) Note of which, related parties of which, related parties ASSETS Non-current assets Intangible assets ,262-51,546 - Property, plant and equipment ,198-87,012 - Equity investments ,047-69,041 - Loans and receivables ,485 25,522 41,832 21,211 Deferred tax assets ,324-39,487 - Other non-current assets ,090-18, , ,250 Current assets Inventories , ,217 - Contract work in progress , ,353 - Trade receivables ,852 62, ,558 58,952 Tax assets ,649-26,378 - Loan assets , , Other current assets , ,930 4 Cash and cash equivalents , ,306-1,659,856 1,592,238 Total assets 1,970,262 1,899,488 EQUITY AND LIABILITIES Equity Share capital , ,000 - Reserves , ,787 - Equity attributable to the owners of the parent 707, ,787 Equity attributable to non-controlling interests Total equity 707, ,093 Non-current liabilities Employee benefits ,048-33,155 - Deferred tax liabilities ,175-10,365 - Other non-current liabilities ,908-11,792-61,131 55,312 Current liabilities Progress payments and advances from customers , ,785 - Trade payables ,119 19, ,973 25,247 Loans and borrowings ,780-4,128 2,500 Tax liabilities ,978-10,816 - Provisions for risks and charges ,040-11,126 - Other current liabilities , , ,201,285 1,189,083 Total liabilities 1,262,416 1,244,395 Total liabilities and equity 1,970,262 1,899,488 47
50 Consolidated Accounts Consolidated financial statements 2.4 Consolidated Statement of cash flows ( 000) Note of which, related parties of which, related parties Cash flows from operating activities Profit ofr the year 77,903-93,036 - Share of profits (losses) of equity-accounted investees (4,345) - (5,324) - Income taxes 38,746-43,676 - Italian post-employment and other employee benefits Stock grant plans 4,731-1,891 - Net gains on the sale of assets Net financial income 14,497-4,381 - Amortisation, depreciation and impairment losses 18,325-18,725 - Accruals to/reversals of provisions for risks 4,814-2,344 - Other operating income/expense 3,118-7,802 - Write-downs/reversals of write-downs of inventories and work in progress (4,498) - (5,223) - Cash flows from operating activities , ,008 Inventories (2,981) - (14,223) - Work in progress and progress payments and advances from customers (63,094) - (28,366) - Trade receivables and payables (17,077) (2,152) 51,483 (54,318) Changes in working capital 3.6 (83,152) 8,894 Changes in other operating items 17,041 8 (33,747) 4,377 Net financial items (13,388) - (1,749) - Taxes paid (20,928) - (33,003) - Cash flows generated (used in) from operative activities: , ,403 Cash flows from investing activities: Investments in property, plant and equipment and intangible assets and others (15,812) - (14,764) - Sales of property, plant and equipment and intangible assets and others 3,278-2,011 - Acquisition of equity investments, net of cash acquired - - 4,000 - Sales of equity investments (39) Cash flows used for strategic transactions (2,100) - (15,092) - Cash flows used in investing activities (14,673) (23,826) Cash flows from financing activities: Net change in other financing activities (1,290) (2,796) (18,027) (12,464) Dividends paid (36,000) - (30,000) - Cash flows from (used in) financing activities (37,290) (48,027) Net increase in cash and cash equivalents 1,759-30,550 - Net exchange rate gains (479) - 3,689 - Opening cash and cash equivalents 304, ,067 - Closing cash and cash equivalents 305, ,306 48
51 Ansaldo STS Annual Report Consolidated Statement of changes in equity Changes in equity are shown in the following table: ( 000) Share capital Retained earnings and consolidation reserves Hedging reserve Stock grant reserve Translation reserve Other reserves Equity attributable to the owners of the parent Equity attributable to non-controlling interests Total equity Equity at 1 January , ,581 4,015 4,262 3,458 16, ,644 1, ,922 Reclassification from/to reserves (64) Change in consolidation scope - (4,368) - - 1,562 - (2,805) 11 (2,795) Net change in stock grant reserve Other comprehensive income (expense), net of taxes - - (5,484) - 23,702 2,089 20,307 (35) 20,272 Allocation of profit for the year to the legal reserve Dividends - (30,000) (30,000) (755) (30,755) Net change in treasury shares 1 (1) Other changes Profit for the year ended 31 December , ,228 (192) 93,036 Equity at 31 December , ,504 (1,469) 4,611 28,722 18, , ,093 Equity at 1 January , ,504 (1,469) 4,611 28,722 18, , ,093 Reclassification from/to reserves Change in consolidation scope - (2,022) (1,728) - (1,728) Net change in stock grant reserve , ,504-3,504 Other comprehensive income (expense), net of taxes - - 4,511-7,739 (3,155) 9,096 (21) 9,074 Allocation of profit for the year to the legal reserve Dividends - (36,000) (36,000) - (36,000) Net change in treasury shares Other changes Profit for the year ended 31 December , ,968 (65) 77,903 Equity at 31 December , ,451 3,042 8,115 36,755 15, , ,846 49
52 Consolidated Accounts Notes 3. Notes 3.1 Notes to the consolidated financial statements at 31 December General information The parent Ansaldo STS S.p.A. is a company limited by shares with its registered office in Via Paolo Mantovani 3-5, Genoa and a branch in Via Argine 425, Naples. It has been listed on the Star segment of the stock exchange managed by Borsa Italiana S.p.A. since 29 March Its shares were included in the FTSE MIB index from 23 March 2009 to 23 March 2014 and in the FTSE Italia Mid Cap index from 24 March 2014 until 6 April They then were re-included in the FTSE MIB index from 7 April 2015 until 20 December Since 21 December 2015, the shares have been included in the FTSE Italia Mid Cap index again. The parent s fully subscribed and paid-up share capital equals 100,000,000.00, comprising 200,000,000 ordinary shares of a nominal amount of 0.50 each. Please note that Hitachi Rail Italy Investments S.r.l. currently holds 101,544,702 ordinary shares of the company, equal to % of the share capital of Ansaldo STS S.p.A. In addition, please note that Hitachi Ltd. exercises management and coordination activities with respect to Ansaldo STS S.p.A. pursuant to articles 2497 et seq. of the Italian Civil Code. Ansaldo STS group operates internationally in the design, construction and operation of signalling and transport systems for above-ground and underground railway lines, both for freight and passengers. It operates worldwide as a main contractor and supplier of turnkey systems. Ansaldo STS S.p.A., as parent, also exercises industrial and strategic guidance and control, coordinating the activities of its operating subsidiaries (together, Ansaldo STS group or the group ) Basis of preparation Ansaldo STS group s consolidated financial statements at 31 December 2016 are drafted in accordance with the International Financial Reporting Standards (IFRS) endorsed by the European Commission pursuant to EC regulation no. 1606/2002 of 19 July 2002, integrated by the interpretations of the Standing Interpretations Committee (SIC) and the International Financial Reporting Standard Interpretations Committee (IFRSIC) issued by the International Accounting Standards Board (IASB) applicable at such date. These consolidated financial statements have been prepared on a cost basis, except for those captions which, as required by the IFRS, are to be recognised at fair value or for which this methodology is chosen, as described in the relevant accounting policies. They are comprised of an income statement, a statement of comprehensive income, a statement of financial position, a statement of cash flows, a statement of changes in equity and the notes thereto. As permitted by IAS 1, assets and liabilities are presented in the statement of financial position as current and non-current (assets and liabilities are considered current when it is expected to realized or settled in their normal operating cycle), while income statement captions are shown by nature. The statement of cash flows was prepared using the indirect method. The income statements presents the Operating profit (EBIT), a significant indicator of the operating performance of the Group. The Operating profit is equal to the unadjusted profit before income taxes and financial income and expense. It does not include income and expense on non-consolidated equity investments and securities or the gains (losses) on the disposal of consolidated equity investments, classified in Financial income and expense in the financial statements or, for equity-accounted investees, in the caption Share of profit or loss of equityaccounted investees. 50
53 Ansaldo STS Annual Report 2016 Amounts are shown in thousands of euros, as allowed by law, unless stated otherwise. The consolidated financial statements of Ansaldo STS group at 31 December 2016 were approved and authorised for publication on 27 February 2017 by the board of directors in accordance with ruling legislation. These consolidated financial statements have been prepared in accordance with the IFRS endorsed by the EU and audited by EY S.p.A Accounting policies Basis and scope of consolidation Ansaldo STS group s consolidated financial statements at 31 December 2016 include the financial statements at 31 December 2016, or at the date of the most recently approved financial statements, as detailed in note 13.4, of the companies/entities in the consolidation scope (the consolidated entities ) drafted pursuant to the IFRS endorsed by the EU applied by Ansaldo STS group. The consolidated entities are listed below, showing the group s related direct or indirect interest therein: Companies consolidated on a line-by-line basis NAME INVESTMENT TYPE REGISTERED OFFICE SHARE/ QUOTA CAPITAL ( 000) CURRENCY INVESTMENT % ANSALDO STS AUSTRALIA PTY LTD Direct Eagle Farm (Australia) 5,026 AUD 100 ANSALDO STS SWEDEN AB Direct Solna (Sweden) 4,000 SEK 100 ANSALDO STS UK LTD Direct London (United Kingdom) 1,000 GBP 100 ANSALDO STS ESPAÑA S.A.U. Indirect Madrid (Spain) 1,500 EUR 100 ANSALDO STS BEIJING LTD Indirect Beijing (China) 837 EUR 80 ANSALDO STS HONG KONG LTD Indirect Hong Kong (China) 100 HKD 100 ANSALDO STS FRANCE Société par actions simplifiée Direct Les Ulis (France) 5,000 EUR 100 UNION SWITCH & SIGNAL INC Indirect Wilmington (Delaware USA) 1 USD 100 ANSALDO STS MALAYSIA SDN BHD Indirect Petaling Jaya (Malaysia) 3,000 MYR 100 ANSALDO STS CANADA INC Indirect Kingstone (Canada) - CAD 100 ANSALDO STS USA INC Direct Wilmington (Delaware USA) USD 100 ANSALDO STS USA INTERNATIONAL CO Indirect Wilmington (Delaware USA) 1 USD 100 ANSALDO STS TRANSPORTATION SYSTEMS INDIA PVT LTD Indirect Bangalore (India) 5,612,915 INR 100 ANSALDO STS DEUTSCHLAND GMBH Direct Munich (Germany) 26 EUR 100 ANSALDO RAILWAY SYSTEM TRADING (BEIJING) LTD Direct Beijing (China) 1,500 USD 100 ANSALDO STS SOUTHERN AFRICA PTY LTD Indirect Gaborone (Botswana) 0.1 BWP 100 Companies measured using the equity method NAME INVESTMENT TYPE REGISTERED OFFICE SHARE/ QUOTA CAPITAL ( 000) CURRENCY INVESTMENT % ALIFANA SCARL Direct Naples (Italy) 26 EUR ALIFANA DUE SCARL Direct Naples (Italy) 26 EUR PEGASO SCARL (in liq.) Direct Rome (Italy) 260 EUR Metro 5 S.p.A. Direct Milan (Italy) 53,300 EUR 24.6 Metro Brescia S.r.l. Direct Brescia (Italy) 4,020 EUR INTERNATIONAL METRO SERVICE S.r.l. Direct Milan (Italy) 700 EUR 49 BALFOUR BEATTY ANSALDO SYSTEMS JV SDN BHD Indirect Kuala Lumpur (Malaysia) 6,000 MYR 40 51
54 Consolidated Accounts Notes Companies measured using the cost method NAME INVESTMENT TYPE REGISTERED OFFICE SHARE/ QUOTA CAPITAL ( 000) CURRENCY INVESTMENT % Metro C S.c.p.A. Direct Rome (Italy) 150,000 EUR 14 I.M. Intermetro S.p.A. Direct Rome (Italy) 2,461 EUR Società Tram di Firenze S.p.A. Direct Florence (Italy) 7,000 EUR 3.8 Iricav Uno consortium Direct Rome (Italy) 520 EUR Iricav Due consortium Direct Rome (Italy) 510 EUR Ferroviario Vesuviano consortium Direct Naples (Italy) 153 EUR San Giorgio Volla consortium Direct Naples (Italy) 71 EUR San Giorgio Volla2 consortium Direct Naples (Italy) 71 EUR Cris consortium Direct Naples (Italy) 2,377 EUR 1 Ascosa Quattro consortium Direct Rome (Italy) 57 EUR Siit S.C.p.A. Direct Genoa (Italy) 600 EUR 2.33 Saturno Consortium Direct Rome (Italy) 31 EUR Train consortium Direct Rome (Italy) 120 EUR 4.55 Sesamo S.c.a.r.l. Direct Naples (Italy) 100 EUR 2 ISICT consortium Direct Genoa (Italy) 43 EUR Cosila consortium (in liq.) Direct Naples (Italy) 100 EUR 1 MM4 consortium Direct Milan (Italy) 200 EUR Radiolabs consortium Direct Rome (Italy) 258 EUR 25 SPV M4 S.p.A. Direct Milan (Italy) 26,700 EUR 5.55 Ansaldo STS do Brasil Sistemas de Transporte Ferroviario e Metropolitano LTDA Direct Fortaleza (Brazil) 1,000 BRL Metro de Lima Linea 2 S.A. Direct Lima (Peru) 368,808 PEN TOP IN S.ca.r.l. Direct Naples (Italy) 80 EUR 5.29 D.I.T.S. Development & Innovation in Transportation Systems S.r.l. Direct Rome (Italy) 40 EUR 12 Dattilo S.c.a.r.l. Direct Naples (Italy) 100 EUR 14 S.p. M4 S.c.p.A. (in liq.) Direct Milan (Italy) 360 EUR 16.9 MetroB S.r.l. Direct Rome (Italy) 20,000 EUR 2.47 In November, the subsidiary Kazakhstan TZ Ansaldo STS Italy LLP was definitively wound up with the closure of the company, a process that was activated in June Subsidiaries and jointly-controlled entities Entities over which Ansaldo STS group has control by owning directly or indirectly more than half of the voting rights or by exerting the power to govern the financial and operating policies of entities/companies, so as to obtain benefits from their activities, including regardless of the percentage of equity investments, are consolidated on a line-by-line basis. All subsidiary entities are included in the scope of consolidation as of the date on which control is acquired by the group. The entities are excluded from the scope of consolidation as of the date on which the group transfers control. Investments in entities (including special purpose entities) control over which is exercised jointly with third parties are equity-accounted. The reporting period of all consolidated companies ends on 31 December. The group s consolidated financial statements are based on the figures at 31 December Business combination transactions Business combination transactions are accounted for by applying the purchase method when the acquisition cost is equal to the fair value, at the acquisition date, of the assets acquired, the liabilities incurred or assumed and any equity instruments issued by the buyer. The cost of the transaction is allocated by recognising the identifiable assets, liabilities and contingent liabilities of the acquiree at their fair values at the acquisition date. Any difference between the consideration paid and the acquisition-date, the minority recorded applying the partial goodwill method, and fair value of the acquired assets and liabilities is allocated to goodwill. If the purchase price allocation process gives rise to negative goodwill, it is recognised in profit or loss at the acquisition date. 52
55 Ansaldo STS Annual Report 2016 Acquisition-related costs are recognised in profit or loss when the related services are rendered. In the event of acquisition of control of investees, goodwill is recognised only to the extent of the parent s share. Non-controlling interests are calculated in proportion to the equity investments held by non-controlling interests in the acquiree s identifiable net assets. In a business combination achieved in stages, when control is taken, the previously-held equity interests in the acquiree are remeasured at fair value and the resulting gain or loss is recognised in profit or loss. Balances related to transactions between consolidated companies are eliminated, specifically as relate to receivables and payables in place at year end, costs and revenue and financial income and expense and other items recognised in profit or loss. Other equity investments Equity investments over which the company has significant influence, generally accompanied by an investment percentage of between 20% (10% if listed) and 50% (investments in associates), are measured using the equity method. When this method is applied, the carrying amount of the investment equals equity adjusted, where necessary, to reflect the application of the IFRS endorsed by the EU. It includes the recognition of goodwill, net of impairment losses, when this is identified upon acquisition and following the effects of adjustments required by the standards governing the preparation of consolidated financial statements. Gains and losses realised among companies consolidated using the equity method, are eliminated, as are those among other group companies, including those consolidated on a line-by-line basis. The fair value of equity investments in portfolio, provided that such criterion is applicable, is calculated based on the bid price of the last trading day of the month to which the IFRS financial statements refer (31 December 2016 in the case of these consolidated financial statements), or based on financial valuation techniques for unlisted instruments as set forth by IFRS13. Any equity investments held for sale, such as those that are acquired solely for the purpose of sale within twelve months, are classified separately as assets held for sale. Entities not consolidated Following the cases in which the entities are not consolidated line-by-line: non-equity consortium companies as well as controlling interests in equity consortia which, as the costs are charged back to the shareholders, do not have their own operating results and whose financial statements, net of intra-group assets and liabilities, do not have significant equity values or; companies in certain phases of evolution, for example those which are no longer operating, have no assets and have no personnel or; companies whose liquidation process appears to be almost concluded, would be irrelevant from a quantitative and qualitative perspective in order to provide a true and fair view of the equity, economic and financial position of the Group. These investments are equity-accounted. These entities are not consolidated on line by line basis because, their consoldiation would irrelevant or potentially distortive for understanding the operation performance of the Group. With particular reference to consortium, the are non-profit vehicles set up for sharing common costs related to a specific project; for this reason consortium normally has no profit or loss at year-end. Segment reporting Starting in 2014, following an internal reorganisation and business management restructuring, the business segments identified previously (signalling and transportation solutions) were merged together due to their similarities in terms of the nature of the products and services, production processes and customer type; as a result, a single operating segment has been identified pursuant to IFRS 8 Operating Segments. In addition, in the case of the Ansaldo STS Group, the single operating segment also corresponds to a single cash generating unit (CGU) for the purposes of IAS 36 Impairment of Assets. Functional currency The balances included in the financial statements of each group company/entity are recognised in the currency of the primary economic environment in which the entity operates (functional currency). The consolidated financial statements of Ansaldo STS group are presented in euros, which is the parent s functional currency. Foreign currency transactions Foreign currency monetary items, cash and cash equivalents, assets and liabilities to be received or settled in 53
56 Consolidated Accounts Notes established or determinable monetary amounts, etc., as well as non-monetary items, advances to suppliers of goods and/or services, goodwill, intangible assets, etc., are initially recognised at the transaction date exchange rate. Subsequently, monetary amounts are translated into the functional currency at the closing rate and any translation differences are taken to profit or loss. Non-monetary amounts are maintained at the exchange rate ruling at the date of the transaction, unless continuing adverse economic trends affect the rate, in which case exchange rate differences are taken to profit or loss. Translation of financial statements of foreign operations The rules for the translation of financial statements of foreign operations into the functional currency, with the exception of currency in hyper-inflationary economies (which do not affect the group), are as follows: assets and liabilities are translated at the closing rate; costs and revenue, income and expense are translated at the average exchange rate of the year or at the transaction date exchange rate if it varies significantly from the average rate of the year; exchange rate gains or losses arising from the translation of captions at a rate that differs from the closing rate and from the translation of opening equity at a rate that differs from the closing rate are taken to the translation reserve. This reserve is released to profit or loss when the equity investment is sold. Goodwill and fair value adjustments relating to the acquisition of foreign operations are recognised as assets and liabilities of the foreign operation and translated at the closing rate. The following exchange rates were adopted to translate the foreign currency financial statements and balances for the current and previous years: Spot rate at Average rate for the year ended Spot rate at Average rate for the year ended USD CAD GBP HKD SEK AUD INR MYR BRL CNY VEB BWP ZAR KZT JPY AED KRW Intangible assets Intangible assets are identifiable non-monetary assets without physical substance that generate future economic benefits for the group. They are recognised at purchase and/or production cost, including directly related charges incurred to prepare them for use, net of accumulated amortisation, except for assets with an indefinite useful life, and any impairment losses. Amortisation begins when the asset becomes available for use and is calculated systematically over the residual useful life of each asset. Amortisation is calculated considering the actual use of the asset in the year in which an intangible asset is initially recognised. (i) Goodwill Goodwill recognised as an intangible asset arises from business combinations and reflects an excess in the acquisition cost of the business or business unit over the total fair value at the acquisition date of acquired assets and liabilities. As it has an indefinite useful life, goodwill is not amortised. Instead, it is tested for impairment at least once 54
57 Ansaldo STS Annual Report 2016 a year, unless the market and management indicators identified by the group show that the test has to be conducted when preparing interim financial statements. The Group identifies the entire business as its only CGU. The organisational and business breakdown between structures responsible for revenue (sales/bidding, project management and operation & maintenance) and those that generate costs does not make it possible to divide the operating segment into further independent cash generating units aside from by individual project (by contract) which, as it is not independent, cannot represent a CGU. Goodwill on acquisitions of consolidated companies is recognised in intangible assets, while that related to unconsolidated subsidiaries or associates is included in the carrying amount of the related equity investments. (ii) Concessions, licences and trademarks These include trademarks identifying the origin of products or goods from a specific company and licences to use third-party know-how or software. The costs, including direct and indirect expenses incurred to obtain these rights, are capitalised after the rights have been acquired and are amortised systematically over the shorter of the period of expected use and the period for which the right has been acquired. (iii) Research and development expense Research expense is taken to profit or loss when incurred. Internally generated intangible assets and the related development expense are recognised only when all the following conditions exist simultaneously: the asset can be identified; the asset may generate future economic benefits; the cost to develop the asset can be measured reliably; there is a reference market for the product generated by the development activity. If these conditions are not met, development expense is recognised in profit or loss when incurred. This expense, which is capitalised only when the four above conditions are met, is amortised on a straight-line basis over the asset s useful life. The initial capitalisation of development costs is also based on whether the management s opinion on the technical and economic feasibility of the project is confirmed, and capitalisation includes only expenses incurred which may be attributed directly to the development process. Leased assets (i) Finance leases where group companies are lessees As lessee, at the date of initial recognition, the group recognises leased assets under assets and recognises a financial liability at the same time equal to the lower of the asset s fair value and the present value of minimum future payments due at inception of the lease, using the implicit interest rate of the lease or the marginal interest rate of the loan. Subsequently, the group takes amortisation applied to the asset and interest separated from the payments of the year to profit or loss. (ii) Finance leases where group companies are lessors At the date of initial recognition, the leased asset is derecognised and a receivable of an amount equal to the net investment in the lease is recognised. The net investment in the lease is the aggregate of the minimum lease payments and any unguaranteed residual value, discounted at the interest rate implicit in the lease. Subsequently, the group expenses finance income over the lease term on a systematic basis, to reflect a constant periodic rate of return on the residual net investment. Estimated unguaranteed residual values are reviewed regularly to check if any impairment indicators exist. (iii) Operating leases Operating lease income and expense are taken to profit or loss over the term of the lease on a straight-line basis. Property, plant and equipment Property, plant and equipment are measured at purchase or construction cost, net of accumulated depreciation and any impairment losses. Cost includes direct charges incurred to prepare assets for use and any disposal and removal costs that will be incurred to restore the site to its original conditions. Costs for ordinary and/or routine maintenance and repairs are taken directly to profit or loss when incurred. Costs to expand, upgrade or improve owned or leased assets are capitalised only to the extent they meet the requirements to 55
58 Consolidated Accounts Notes be classified separately as assets or part of an asset. Grants related to assets are taken as a direct decrease in the cost of the asset to which they relate. The carrying amount of each asset is depreciated on a systematic basis. Depreciation is calculated on a straightline basis each year over the residual useful lives of assets. Depreciation is calculated considering the actual use of the asset in the year in which an item of property, plant and equipment is initially recognised. The following table lists depreciation periods for each item of property, plant and equipment: Land: Buildings: Plant and machinery: Equipment: Other assets: indefinite useful life years 5-10 years 3-7 years 3-8 years The estimated residual value and the useful life of an asset are reviewed periodically. Depreciation of an asset ceases on the date the asset is sold or classified as held for sale. If a depreciable asset is comprised of separately identifiable components with estimated useful lives that differ significantly from the other components comprising the asset, depreciation is calculated separately for each component, using the component approach. Profits and losses on the sale of assets or groups of assets are measured by comparing the sales price with the related carrying amount. Borrowing costs that are directly attributable to the acquisition, construction or production of an asset that necessarily takes a substantial period of time to get ready for its intended use or sale (qualifying assets) are capitalised as part of the cost of that asset. Investment property Property held to earn rentals or for capital appreciation is classified under Investment property and is measured at purchase or production cost, increased by transaction costs, if any, and net of accumulated depreciation and any impairment losses. Impairment losses Assets with an indefinite useful life are not depreciated/amortised, but are tested for impairment annually. Depreciable assets are tested to check whether there is any indication that they may be impaired. If any such indication exists, the recoverable amount of the asset is estimated and any excess thereof is recognised in profit or loss. Recoverable amount is the higher of an asset s fair value less costs to sell and its value in use, calculated based on the discounted cash flow model. The discount rate, including taxation, includes the risks specific to the asset for which the future cash flow estimates have not been adjusted. Assets that do not generate independent cash flows are tested based on the cash-generating unit. When, subsequently, impairment losses no longer exist, the carrying amount of the asset is restored to the amount that it would have had had the impairment not been recognised. Reversals of impairment losses are recognised in profit or loss. An impairment loss recognised for goodwill is never reversed. Inventories Inventories are measured at the lower of cost, calculated using the weighted average cost method, and net realisable value. Financial expense and overheads are not included in inventories. Net realisable value is the estimated sales price in the ordinary course of business considering any costs of completion and the estimated costs necessary to make the sale. Contract work in progress Contract work in progress is recognised in accordance with the percentage of completion method whereby contract cost, revenue and contract profits/(losses) are recognised based on the progress of production activities, which is calculated as the costs incurred at the measurement date and total estimated project costs or based on the product units delivered. 56
59 Ansaldo STS Annual Report 2016 The measurement reflects the best estimate of projects completed at the reporting date. The group periodically updates these estimates. Any effects are recognised in the year in which the adjustments are made. The estimations also include the evaluation of the probability of occurrence of potential liabilities (projects risks like, for example, delivery delaies); these estimations are considered in preparing projects budget costs if the underlined risk is considered probable. With reference to claims that could arose during the execution of the project or even and the end, they are considered in evaluating write-downs of work in progress if the underlined risk is considered probable. The expected loss on a contract is recognised entirely under operating expense when it becomes reasonably foreseeable, along with an accrual to the provision for expected losses to complete contracts. Contract work in progress is recognised net of any allowances, expected losses and progress payments and advances relating to contracts in progress. This analysis is performed individually for each contract, recognising the positive difference (work in progress in excess of payments on account) under contract work in progress and the negative difference under Progress payment and advances from customers. If the amount recognised under advances is not collected at the preparation date of the annual and/or interim financial statements, a balancing entry is recognised under trade receivables. Contracts with consideration in a currency other than the functional currency (the Euro for the group) are measured by translating the portion of consideration accrued, as per the percentage of completion method, at the closing rate. However, under the group s policy governing currency risk, all contracts whose cash inflows and outflows are significantly exposed to exchange rate fluctuations are adequately hedged, as described in the note on Hedging construction contracts against currency risk. Loans and receivables and financial assets Financial assets are classified as follows: financial assets at fair value through profit or loss; loans and receivables; held-to-maturity investments; available-for-sale financial assets. Financial assets are classified by management upon initial recognition. (i) Financial assets at fair value through profit or loss This category includes financial assets acquired for the purpose of trading in the short term, in addition to derivative instruments, in relation to which reference should be made to the paragraph below. The fair value of these instruments is based on the bid price at the reporting date: the fair value of unlisted instruments is determined using generally accepted financial valuation techniques. Fair value gains or losses of the financial instruments included in this category are recognised immediately in profit or loss. Classification as current or non-current reflects management expectations about trading: they are included under current assets when they are expected to be traded within the next twelve months or when they are recognised as held for trading. (ii) Loans and receivables This category includes non-derivative financial assets with fixed or determinable payments that are not quoted in an active market. They are initially recognised at fair value, adjusted to reflect any transaction costs, and subsequently measured at amortised cost using the effective interest method. If there is objective evidence of impairment, the carrying amount of the asset is reduced to that of discounted future cash flows. Impairment losses identified by means of impairment tests are recognised in profit or loss. If, in subsequent years, the reasons underlying the previous impairment losses no longer exist, the carrying amount of the asset is restored to the extent of the carrying amount that would have been obtained had the impairment not been recognised. They are included in the current section, except for those which are due after more than twelve months after the reporting date which are therefore included under the non-current section. The factoring of receivables without recourse based on which all risks and benefits are substantially transferred to the assignee results in the derecognition of the receivables from the balance sheet assets, as the requirements laid out in IAS 39 are met. 57
60 Consolidated Accounts Notes (iii) Held-to-maturity investments These are non-derivative financial assets with fixed maturity that the group has the positive intention and ability to hold to maturity. They are classified under current assets when their contractual maturity is within twelve months. If there is objective evidence of impairment, the carrying amount of the asset is reduced to the discounted future cash flows. Impairment losses identified by means of impairment tests are recognised in profit or loss. If, in subsequent years, the reasons underlying the impairment loss cease to exist, the carrying amount of the asset is restored to the amount that it would have had had the impairment not been recognised. (iv) Available-for-sale financial assets These are non-derivative financial assets that are designated as available for sale or are not classified under any of the above categories. They are measured at fair value, which is based on market prices at the annual or interim reporting date, or on financial valuation models and techniques. Fair value gains or losses are taken to an equity reserve ( reserve for available-for-sale financial assets ) which is recognised in profit or loss only when the financial asset is actually sold or, in the case of cumulative losses, when the impairment loss recognised in equity will not be recovered. Classification under current or non-current assets depends on management choices about the asset and its actual trading possibilities. Assets which are expected to be realised within one year of the reporting date are recognised as current assets. If there is objective evidence of impairment, the carrying amount of the asset is reduced to the discounted future cash flows. Impairment losses previously recognised under equity reserves are recognised in profit or loss. For non-equity instruments, if the reasons underlying the impairment loss cease to exist, the impairment loss is reversed. Derivatives The group uses only derivatives as part of its strategies of hedging the risk of fluctuations in expected cash flows on contractual or highly probable transactions (cash flow hedges) or fluctuations in the fair value of recognised assets or liabilities or due to contractual commitments (fair value hedges), using the so-called forward instruments which, sometimes, despite a substantial and operating hedging effect, do not qualify for hedge accounting under IAS 39. Specifically, fluctuations in the fair value of these instruments and the related underlying items are recognised immediately in profit or loss, under financial items. For information on the policy governing the currency risk on construction contracts, reference should be made to the note on Hedging construction contracts against currency risk. The effectiveness of hedges is documented at the inception of the transaction, as well as periodically at each annual or interim reporting date. Hedge effectiveness is measured by comparing the variations in the fair value of the hedging instrument with those of the hedged item (dollar offset ratio), or, for more complex instruments, using statistical analyses based on risk variations. (i) Fair value hedges Changes in the fair value of derivatives designated as fair value hedges and which qualify as such are recognised in profit or loss, as are changes in the fair value of the underlying assets or liabilities attributable to the risk eliminated by the hedging transaction. (ii) Cash flow hedges Changes in the fair value of derivatives designated as cash flow hedges and which qualify as such are recognised to the extent of the portion determined to be effective, in a specific equity reserve ( hedging reserve ). This is subsequently recognised in profit or loss when the forecast transaction affects profit or losses. The change in the fair value of the ineffective portion is recognised immediately in profit or loss. If the forecast transaction is no longer highly probable, the relevant portion of the hedging reserve is recognised immediately in profit or loss. If the hedging instrument is sold or no longer meets the criteria for hedge accounting, the relevant portion of the hedging reserve continues to be recognised until the underlying contract takes place. (iii) Determining the fair value of financial instruments The fair value of financial instruments quoted on active markets is calculated using the bid price at the reporting date. The fair value of unlisted derivatives is measured using financial valuation techniques: specifically, the fair value of 58
61 Ansaldo STS Annual Report 2016 interest rate swaps is calculated discounting the future cash flows, while that of currency forwards is determined on the basis of market rates at the reporting date and the exchange rate spreads between the relevant currencies. Financial assets and financial liabilities carried at fair value are classified based on the three following hierarchy levels which reflect the significance of the inputs used in measuring fair value. Specifically: Level 1: financial assets and financial liabilities whose fair value is calculated based on quoted prices (unadjusted) in active markets for identical assets or liabilities; Level 2: financial assets and financial liabilities whose fair value is calculated based on inputs other than the quoted prices referred to in level 1 that may be observed either directly or indirectly; Level 3: financial assets and financial liabilities whose fair value is calculated based on unobservable market data. Cash and cash equivalents This caption includes cash on hand, deposits and current accounts with banks or other credit institutions available for current transactions, post office current accounts and other equivalents. They are recognised at fair value. Equity (i) Share capital Share capital is comprised of the parent s subscribed and paid-in share capital. Any costs closely related to the issue of shares are classified as a decrease in share capital when they are directly related to such operation, net of deferred taxation. (ii) Treasury shares They are classified as a decrease in equity. Profits and losses on the sale, issue or cancellation of treasury shares are not recognised in profit or loss. Payables and other liabilities They are initially recognised at fair value, less any transaction costs, and subsequently measured at amortised cost, using the effective interest method. They are classified under current liabilities, unless the group has the contractual right to settle its obligations after at least twelve months of the interim or annual reporting date. Income taxes The group s taxes are comprised of current and deferred taxes. When they relate to income and expense recognised in comprehensive income, they are recognised with a balancing entry in the same caption. Current taxes are calculated based on the tax legislation applicable and enacted at the reporting date in those countries where the group operates; any risks related to different interpretations of positive and negative income components, as well as the litigation underway with the tax authorities, are measured at least every three months to adjust the accruals recognised. Deferred taxes are recognised in respect of temporary differences between the carrying amounts of assets and liabilities for financial reporting purposes and their tax bases. Deferred tax assets and liabilities are measured at the tax rates that are expected to be enacted when realising assets and settling liabilities, using tax rates enacted or substantively enacted at the reporting date. Deferred tax assets are recognised to the extent that it is probable that sufficient taxable profits will be available in the years the related temporary differences reverse against which the deductible temporary differences can be utilised. Employee benefits (i) Post-employment benefits: Several pension (or supplementary) schemes are in place. They can be analysed as follows: Defined contribution plans under which the group pays fixed contributions into a separate entity (e.g. a fund) and has no legal or constructive obligation to pay further contributions if the fund does not hold sufficient assets to pay employees benefits relating to employee service. Contributions payable to a defined contribution plan are recognised only when employees have rendered service in exchange for such contributions; 59
62 Consolidated Accounts Notes Defined benefit plans whereby the group has an obligation to provide the agreed benefits to current and former employees and bears the actuarial and investment risks of the plan. Consequently, the cost of this plan is not calculated based on the contributions of the year, rather, on the basis of demographic and statistical assumptions and salary increase trends, using the projected unit credit method. Accordingly, the carrying amount of the recognised liability reflects that of the relevant actuarial valuation, fully and immediately recognising actuarial gains and losses when they arise with a direct balancing entry in equity in the actuarial reserve. (ii) Other long-term employee benefits and post-employment benefits Some group company employees are granted benefits such as, for example, jubilee benefits and seniority bonuses which are sometimes paid after retirement (such as medical benefits). The accounting treatment is the same as that applied to defined benefit plans, hence the projected unit credit method is used. However, with respect to other long-term benefits, any actuarial gains and losses are recognised immediately and entirely in profit or loss when they arise. (iii) Termination benefits Termination benefits are recognised as a liability and an expense when the group is demonstrably committed to terminating the employment of an employee or group of employees before their normal retirement date or providing termination benefits as a result of an offer made in order to encourage voluntary redundancy. Termination benefits do not generate future economic benefits for the company and, accordingly, are immediately expensed. (iv) Stock grant plans Stock option and stock grant plans are in place for the group s senior management. The theoretical benefits granted to the beneficiaries are recognised in profit or loss for the years covered by the plan, with a balancing entry in equity. These benefits are calculated by measuring the fair value of the relevant instrument using valuation techniques which include market conditions, if any, and by adjusting the number of options that are expected to be granted at each reporting date. Provisions for risks and charges The provisions for risks and charges are recognised against certain or probable losses and expenses for which the group is uncertain of the timing and/or amount at the reporting date. Provisions for risks and charges are recognised if, at the reporting date, as a result of a past event, the group has a legal or constructive obligation that will lead to an outflow of resources. The amount recognised as a provision is the best estimate of the discounted outlay required to settle the obligation. The discount rate used reflects current market assessments and the additional effects of the risk specific to the liability. Risks for which liabilities are only possible are disclosed in a specific section of the notes on commitments and risks. They are not provided for. Recognition of revenue Revenue is measured at the fair value of the consideration received or due, net of any discounts and volume rebates. Revenue also includes changes in work in progress, with respect to which reference should be made to the note to Contract work in progress. Revenue relating to the sale of goods is recognised when the group has transferred to the buyer the significant risks and rewards of ownership of the goods which generally coincides with transfer of title or possession to the buyer, or when the revenue can be measured reliably. Revenue from the rendering of services is recognised based on the percentage of completion method, provided that it can be estimated reliably. Revenue from contracts with Italian customers only is recognised under progress payments and advances from customers in the statement of financial position and subsequently reversed to profit or loss upon completion of the contract and, hence, of the related work in progress. 60
63 Ansaldo STS Annual Report 2016 Grants Government grants, including non monetary grants at fair value, are only recognised when there is reasonable assurance that the group will comply with the conditions attaching to them and that the grants will be received. Grants related to income are recognised on an accruals basis and in direct correlation with costs incurred when their allocation has been formally approved. Grants related to assets are recognised in profit or loss directly in line with the depreciation/amortisation of the assets/projects to which they relate and are recognised as a direct reduction in depreciation/amortisation. Net financial income/(expense) Interest income and expense are recognised on an accruals basis using the effective interest method, i.e., at the interest rate that makes all cash inflows and outflows (including any premiums, discounts, commissions, etc.) comprising the transaction financially equivalent. Borrowing costs that are directly attributable to the acquisition, construction or production of an asset that necessarily takes a substantial period of time to get ready for its intended use or sale (qualifying assets) are capitalised as part of the cost of that asset. Dividends Dividends are recognised when the right to receive payment is established. This usually coincides with the shareholders resolution approving their distribution. Dividends paid to the shareholders of Ansaldo STS S.p.A. are considered as a change in equity and recognised as a liability in the year in which the distribution was approved by the company s shareholders. Related party transactions All related party transactions take place on an arm s length basis. Costs Costs are recognised based on the criteria of proper qualification, temporal allocation and classification established by the accounting standards adopted by the enterprise. Costs are recognised when they relate to goods and services, excluding contract work in progress, sold or consumed during the year or based on a systematic allotment, or when their future useful life cannot be identified. Personnel expense includes the amount of remuneration paid, accruals to the provisions for pension funds and for unused holidays accrued and social security and pension contributions in application of contracts and legislation in force. Costs for the acquisition of new knowledge or discoveries, the study of alternative products or processes and new techniques or models, the design and construction of prototypes or, in any event, incurred for other scientific research or technological development activities, are generally considered current costs and recognised in the income statement in the year in which they are incurred; these costs are recognised in the balance sheet assets ( Intangible assets ) only when the conditions described in IAS 38 are met. 61
64 Consolidated Accounts Notes New reporting standards (IFRS) and interpretations (IFRIC) At the preparation date of these separate financial statements, the EU has endorsed several standards and interpretations which are not yet mandatory and which the company will apply in the next few years. The main changes (excluding the annual improvements) and potential impacts on the company are as follows: IFRS - IFRIC Nature and impacts on the group IAS 7 Statement of cash flows The amendments to IAS 7 Statement of cash flows are part of the IASB disclosure initiative and require an entity to provide supplemental information that enables users of financial statements to evaluate changes in liabilities linked with financing activities. Application of these amendments are not expected to have any significant effect on the Group s financial statements. The amendments clarify that an entity needs to consider whether tax law restricts the sources of taxable profits against which it may make deductions on the reversal of that deductible temporary difference. Furthermore, the amendments provide guidance on how an entity should determine future taxable profits and explain the circumstances in which taxable profit may include the recovery of some assets for more than their carrying amount. Application of these amendments are not expected to have any significant effect on the company s financial statements. The Group will apply these amendments starting from 1 January Amendment to IAS 12 Income taxes The amendments aim to clarify how to account for deferred tax assets relating to debt instruments measured at fair value. Application of these amendments are not expected to have any significant effect on the Group s financial statements. The Group will apply these amendments starting from 1 January IFRS 2 Share-based Payment The amendments aim to clarify the recognition of certain types of transactions with share-based payment. The impact on the group of adopting this standard is currently being analysed. The Group will apply this standard starting from 1 January IFRS 9 Financial instruments This standard significantly amends the accounting treatment of financial instruments and will eventually replace IAS 39. At present, the IASB has amended the requirements for classifying and measuring financial assets currently set out in IAS 39. Moreover, the IASB has published a document on measuring financial instruments at amortised cost and assessing any impairment indicators. However, the competent bodies are still discussing the new general approach to financial instruments and, at present, it is not yet known when the adoption date will be. The impact on the group of adopting this standard is currently being analysed. The current version of IFRS 9 will be applicable as of 1 January 2018, subject to the EU s endorsement. IFRS 15 Revenue from contracts with customers This standard redefines how to recognise revenue, which must be recognised when control of goods or services is transferred to customers, and requires that additional disclosure be provided. The impact on the Group of adopting such standard is currently being analysed. The Group will apply this standard starting from 1 January IFRS 16 Leases The standard published in January 2016 to replace IAS 17 Leases, IFRIC 4, SIC-15 and SIC-27 defines the principles for the recognition, measurement, presentation and disclosure of leases and requires lessees to account for all leases in the financial statements based on a single model similar to that used to account for financial leases in accordance with IAS 17. The Group will apply this standard starting from 1 January As regards the adoption of IFRS 15 and IFRS 16, analysis activities are under way which will make it possible to evaluate in 2017 any effects deriving from the application of those standards. Insights into IFR15 As mentioned elsewhere in the Notes to the Financial Statements, the IASB issued IFRS 15 Revenue recognition, a comprehensive new revenue recognition standard that will supersede nearly all existing revenue recognition guidance under IFRS, for Ansaldo STS, in particular, the new standard will supersede IAS 11 Construction Contracts and IAS 18 Revenue. The new standard applies to revenue from contracts with customers: its core principle is that a company will recognize revenue when it transfers goods or services to customers at an amount that reflects the consideration to which the company expects to be entitled in exchange for those goods or services. In doing so, management will need to use more judgement and make more estimates than under today s guidance. 62
65 Ansaldo STS Annual Report 2016 Application of the new standard is required for annual periods beginning on or after 1 January 2018; Ansaldo STS will not early adopt the new standard, even if permitted under IFRS. The new standard is required to be applied retrospectively and the transition will follow either a full retrospective approach or a modified retrospective approach. The modified approach allows the standard to be applied to existing contracts beginning with the current period. Ansaldo STS does not decided yet which option adopt for the retrospective approach. IFRS 15 establishes a five-step model that will apply to revenue earned from contracts with a customers (with limited exceptions), regardless of the type of revenue transaction. Regarding revenue streams, they basically fall into two main categories: (i) designing, building, operating and maintaining Railway and Mass Transit solutions that range from fully integrated turnkey solutions to traditional signalling systems for passenger rail systems; (ii) designing and production of a full range of signalling solutions and components and provides operation and maintenance services for Heavy Haul and Freight customers around the world. Implementation plan of IFRS 15 will require Ansaldo STS to review its contracts following the five steps approach of the new standard in order to identify potential effects on net equity and income statements. Based on the preliminary overview performed, the main focus area of analysis and of potential impact have been identified in the following: (i) accounting for contract modification (in particular, change order); (ii) transactions among partners (contracts with customers of Ansaldo STS frequently involved other partners in managing relationships and transactions with the final customers: based on contracts clauses, in accordance with IFRS 15, transactions with partners could not represent revenue for the Company); (iii) costs to obtain contracts (incremental costs sustained to obtain contracts must be capitalized if recoverable through the sale); (iv) performance obligation in the contracts (the new standards requires to identify multiple elements within the contract which could be subject to separate evaluation and accounting with potential impact on revenue and margins from contracts); (v) warranties (based on the characteristics of the warranties required and allowed, they could be considered separate performance obligation to be spin off from the main contract); (vi) transfer of control (critical analysis of contract terms for the purposes of identification of the model that better reflects the principles of the standard based on the transfer of control of goods and services). The timeline of IFRS 15 implementation has been design to complete the analysis of the most significant existing contracts, in terms of size of revenue, within June 2017, in order to be able to provide preliminary conclusions in the consolidated half year report as of and for the six months period ended on June 30, A second a final step of the plan is actually expected within the end of 2017, in order to provide quantitative disclosure of the new standard in the year end consolidated financial statements as of December 31, Significant accounting policies The application of generally accepted accounting principles for the preparation of the financial statements and the interim accounting reports requires the company management to make accounting estimates based on complex and/ or subjective opinions, estimates based on past experience and assumptions deemed reasonable and realistic on the basis of the information known at the moment of the estimate. The use of these accounting estimates impacts the value at which assets and liabilities are recognised and the disclosure on contingent assets and liabilities at the reporting date, as well as the amount of revenue and costs in the reference year. The actual results may differ from those estimated due to the uncertainty characterising the assumptions and conditions on which the estimates are based. The most significant accounting policies which require that directors prepare estimates based on a greater degree of subjectivity and for which a change in one of the underlying conditions would have a significant impact on the consolidated financial statements are described below. Costs estimation to complete construction contracts: the group operates in a business and with contractual arrangements which are recognised using the percentage of completion method. Profits recognised in profit or loss reflect contract progress and the profits which will be recognised for the entire contract once it is completed. Consequently, for the purposes of correctly recognising work in progress and profits related to works yet to be completed, management is required to make an accurate estimate of expected losses, expected increases and delays, additional costs and penalties which could have an impact on the expected margin. More specifically, the expected loss estimate procedure requires estimates of the cost of materials, the number of hours required to 63
66 Consolidated Accounts Notes carry out the works set forth in the contract, the financial expense incurred to cover guarantees issued by financial institutions and the possible outcome of disputes with contractual counterparties, partners and suppliers. In order to better assist management s estimates, the group has adopted contract risk management and analysis procedures which identify, monitor and quantify the risks related to contract performance. Carrying amounts reflect management s best estimate at that time, assisted by the above procedural tools. The valuation of work in progress consider the estimations of the possible impacts arising from disputes with customers; in cases where there are disputes for risk of probable future liabilities, management sets aside special bad debt provision of the work in progress. Bad debt provision for receivables: The Group has a credit analysis procedures aimed to identify, monitor and quantify the risks reflected in the provision for doubtful receivables, which therefore represents the best estimate at the time of preparation of the consolidated financial statements. Impairment losses: the group s assets with an indefinite useful life are tested for impairment at least once each year or more often if there is evidence of impairment. Likewise, all assets showing evidence of impairment are tested, also when depreciation/amortisation has already begun. Impairment tests are usually performed using the discounted cash flow method; however, this method is considered highly sensitive to the assumptions included in the estimate of future cash flows and of the interest rates applied. For the purposes of these valuations, the group uses the plans approved by the body and financial parameters which are in line with those reflecting the current trend of reference markets. Expected cash flows may be quantified in light of the information available at the moment of the estimate on the basis of subjective judgements regarding the future performance of variables such as prices, costs, demand growth rates and production profiles, and are discounted using a rate that takes into account the risk inherent in the activity concerned. Hedging construction contracts against currency risk: to avoid the risk of fluctuations in foreign currency cash inflows and outflows on construction contracts, the group specifically hedges the individual cash flows expected on the contract. Hedges are agreed when commercial contracts are signed. Currency risk is usually hedged using plain vanilla (forward) instruments. If the hedge is not deemed effective, fair value gains or losses on these instruments are immediately expensed as financial items and the related underlying item is measured as if it were not hedged, hence it is exposed to the currency risk. The effects of this accounting treatment are described in the note on financial income and expense. Hedges which fall under the first case are recognised as cash flow hedges, considering the premium or the discount as the ineffective part in the case of forwards, or time value in the case of options. The ineffective part is recognised under financial items. Income taxes. Current taxes for the year are calculated on the basis of estimated taxable income and the tax rates in force at the reporting date. As described above, deferred tax assets are recognised if their recovery is deemed probable; this probability depends on the effective existence of taxable income in the future, which can be used to offset the deductible temporary differences, the determination of which requires conducting a significant estimation process. In determining future taxable income, the results set forth in budgets and plans consistent with those used for impairment testing were taken into consideration, also considering the fact that deferred tax assets refer to temporary differences/tax losses that may be recovered over a long period of time, therefore theoretically even beyond the implicit time horizon of the plans noted above. Effects of amendments to the IFRS The company has adopted certain accounting standards and amendments for the first time which are in force for financial years starting on 1 January The nature and impact of each new accounting standard and amendment are described below: 64
 of profit or loss and OCI and the statement of financial position may be disaggregated;")
67 Ansaldo STS Annual Report 2016 The amendments to IAS 1 clarify, rather than significantly change, existing IAS 1 requirements. The amendments clarify: - The materiality requirements in IAS 1; - That specific line items in the statement(s) of profit or loss and OCI and the statement of financial position may be disaggregated; - That entities have flexibility as to the order in which they present the notes to financial statements; - That the share of OCI of associates and joint ventures accounted for using the equity method must be presented in aggregate as a single line item, and classified between those items that will or will not be subsequently reclassified to profit or loss. Furthermore, the amendments clarify the requirements that apply when additional subtotals are presented in the statement of financial position and the statement(s) of profit or loss and OCI. These amendments do not have any impact on the Group. The amendment to IAS 19, which introduced a simplification of the accounting treatment of certain types of contributions to defined benefit plans by employees or third parties. This has not impacted the company s financial position and results of operations; The amendment to IAS 16 and 38 clarifies that it is inappropriate to use revenue-based methods to calculate the depreciation of an asset as revenues reflect a model of economic benefits which are generated by the running of a business, rather than the economic benefits that are consumed with the use of the asset. Although these new standards and amendments were applied for the first time in 2016, they have not had material impacts on the financial statements or the notes. 65
68 Consolidated Accounts Notes 3.2 Segment reporting Reference should be made to paragraph 2.6 of the directors report for information on the indicators that management uses to assess the group s performance. In compliance with the aggregation criteria laid out in IFRS 8, the ASTS group has identified one single operating segment. Therefore, the information required by IFRS 8 correspond to those presented in the consolidated income statement in line with previous years. Some consolidated accounting information is provided below on a geographical basis, which represents the main way in which the management monitors business performance. Revenue ( 000) Italy 308, ,918 Rest of Europe 390, ,856 North Africa and the Middle East 122, ,593 Americas 255, ,713 Asia/Pacific 251, ,757 Total 1,327,386 1,383,837 Property, plant and equipment and intangible assets ( 000) Italy 105, ,055 Rest of Europe 13,745 14,340 North Africa and the Middle East Americas 12,010 12,354 Asia/Pacific 1,966 1,625 Total 134, ,558 66
69 Ansaldo STS Annual Report Notes to the statement of financial position Related party assets and liabilities Related party trading transactions generally take place on an arm s length basis, as does the settlement of interestbearing receivables and payables where not governed by specific contractual conditions. The relevant statement of financial position balances are shown below. The statement of cash flows presents the impact of related party transaction on cash flows. FINANCIAL ASSETS AT 31 DECEMBER 2016 ( 000) Non current loan assets Other non current financial assets Current loan assets Trade receivables Other current financial assets Total Ultimate parent Hitachi Ltd (Rail) Hitachi Rail Europe Ltd Subsidiaries Alifana S.c.r.l Alifana Due S.c.r.l Associates International Metro Service S.r.l I.M. Intermetro S.p.A. (in liq.) Metro 5 S.p.A. - 22,534-1,391-23,925 Metro Service A.S ,668-1,668 SPV Linea M4 S.p.A. - 2, ,534 SP M4 S.C.p.A. (in liq.) Metro Brescia S.r.l JOINT VENTURES Balfour Beatty Ansaldo Systems JV SDN BHD ,246-2,246 Consortia Saturno Consortium ,529-29,529 Ascosa Quattro consortium ,157-1,157 Ferroviario Vesuviano consortium ,462-1,462 MM4 consortium ,858-12,040 San Giorgio Volla Due consortium , ,493 San Giorgio Volla consortium ,421-1,421 EPC Lima consortium Other group companies Hitachi High Technologies Europe GMBH Hitachi Rail Italy S.p.A ,272-6,272 Total - 25, , ,169 % of the total corresponding financial statements caption 56% 1% 9% 0.004% 67
70 Consolidated Accounts Notes FINANCIAL ASSETS AT 31 DECEMBER 2015 ( 000) Non current loan assets Other non-current financial assets Current loan assets Trade receivables Other current financial assets Total Ultimate parent Hitachi Rail Europe Ltd Subsidiaries Alifana S.c.r.l Alifana Due S.c.r.l Associates International Metro Service S.r.l I.M. Intermetro S.p.A. (in liq.) Metro 5 S.p.A. - 20,733-1,733-22,466 Metro Service A.S SP M4 S.C.p.A. (in liq.) Metro Brescia S.r.l ,070-1,070 JOINT VENTURES Balfour Beatty Ansaldo Systems JV SDN BHD ,860-2,860 Consortia Saturno Consortium ,535-23,535 Ascosa Quattro consortium ,157-1,157 Ferroviario Vesuviano consortium ,168-1,168 MM4 consortium ,142-13,324 San Giorgio Volla Due consortium , ,142 San Giorgio Volla consortium ,421-1,421 EPC Lima consortium Other group companies Hitachi Rail Italy S.p.A ,917-9,917 Total - 21, , ,730 % of the total corresponding financial statements caption - 51% 1% 9% 0.004% 68
71 Ansaldo STS Annual Report 2016 FINANCIAL LIABILITIES AT 31 DECEMBER 2016 ( 000) Non current loans and borrowings Other non current financial liabilities Current loans and borrowings Trade payables Other current financial liabilities Total Subsidiaries Alifana S.c.r.l Alifana Due S.c.r.l Associates Metro Service A.S ,704-2,704 MetroB S.r.l Pegaso S.c.a.r.l. (in liq.) Consortia Saturno Consortium ,066-2,066 Ascosa Quattro consortium San Giorgio Volla Due consortium Ferroviario Vesuviano consortium San Giorgio Volla consortium MM4 consortium Other group companies Hitachi Rail Italy S.p.A ,569-13,569 Total , ,081 % of the total corresponding financial statements caption 4% 0.3% FINANCIAL LIABILITIES AT 31 DECEMBER 2015 ( 000) Non current loans and borrowings Other non-current financial liabilities Current loans and borrowings Trade payables Other current financial liabilities Total Subsidiaries Alifana S.c.r.l Alifana Due S.c.r.l Associates Metro Service A.S ,821-4,821 Metro Brescia S.r.l Metro 5 S.p.A MetroB S.r.l I.M. Intermetro S.p.A. (in liq.) JOINT VENTURES Balfour Beatty Ansaldo Syst. JV SDN BHD Consortia Saturno Consortium , ,237 Ascosa Quattro consortium San Giorgio Volla Due consortium Ferroviario Vesuviano consortium San Giorgio Volla consortium MM4 consortium SP M4 S.C.p.A. (in liq.) Cris consortium Other group companies Hitachi Rail Italy S.p.A ,500 15,998-18,498 Total - - 2,500 25, ,149 % of the total corresponding financial statements caption 61% 6% 0.4% 69
 Goodwill Other development expense Patents and similar rights Concessions, licences and trademarks Assets under development Other Total At 31 December 2015 34,569 4,436")
72 Consolidated Accounts Notes Intangible assets ( 000) Goodwill Other development expense Patents and similar rights Concessions, licences and trademarks Assets under development Other Total At 31 December ,569 4,436 9, ,138 51,546 Acquisitions ,915 Capitalisations - 4, ,282 Amortisation, depreciation and impairment losses - (2,043) (4,046) (311) - (953) (7,353) Opening/average net exchange rate gains Transferred from work-in-progress (223) Reclassifications - (1,141) - - (173) 173 (1,141) At 31 December ,569 5,378 6, ,992 49,262 70
73 Ansaldo STS Annual Report 2016 Intangible assets amount to 49,262 thousand (31 December 2015: 51,546 thousand), while investments of the year are equal to 6,197 thousand and amortisation and impairment losses to 7,353 thousand. Specifically: Goodwill ( 34,569 thousand), which is tested for impairment at year end in accordance with group procedures, was tested at the reporting date with no need for impairment. The test compared net invested capital (including goodwill) at 31 December 2016 against the higher of value in use and fair value. Specifically, value in use is calculated based on the discounted cash flow model, applying the unlevered version to the cash flows as per the guidelines to the five-year plans approved by board of directors ( ) and the present value of the terminal value (calculated on a going concern basis). The growth rate included in the terminal value was equal to 2% calculated considering the inflation outlook in the Country where the Group works (International Monetary Fund outlook). Where available, the related macro-economic assumptions are determined using external sources of information, while the profitability and growth estimates assumed in the business plans are defined by management based on past experience and expectations about the developments of the markets in which the group operates. The cash flows used are those generated by group assets, in their present condition, before financial expense and taxes. They include capital expenditure and monetary changes in working capital and exclude cash flows from financing activities, non-recurring events or dividend distributions. These cash flows are discounted using the WACC (Weighted Average Cost of Capital) method which is calculated based on the Capital Asset Pricing Model. At 31 December 2016 the WACC for the Group is 7.39% compared to 7.45% used in previous year. The comparables panel in 2016 is the same of the previous year. The performed test has pointed out a level of coverage; in addition, there is no other external indicators showing evidence of impairment. The recoverable amount is calculated using the Discounted Cash Flow (DCF) methodology Average Ros has been higher to fair value calculated using the fair value (multiple) methodology. The Company performed a sensitivity analysis considering a WACC about 0.5%, 1.0% and 1.5% and, at the same time, to shorten the terminal value growth rate about 0.5% and 1.0%. The analysis shows a broad coverage about the recoverability of the assets under impairment test. The recoverable amount obtained through fair value was calculated based on the EV/EBITDA market multiples methods, with respect to current stock exchange multiples of a panel of peer companies used also for the WACC calculation. The basic assumptions underlying the projected cash flows for the five-year plans approved by Board of Directors are described in detail in the directors report to which reference should be made. Development expense includes: - the Stream project, which was fully amortised in previous years; - the Satellite and Rail Telecom project to develop satellite technologies for new railway signalling systems. This project is co-financed by the European Space Agency and the Galileo Supervisory Authority. Patents and similar rights relate to: - the CMMI (Capability Maturity Model Integration) project to improve the software development process; - software developed to support the New Controlling Model (NCM) and the Product Data Management (PDM) which were launched as part of a major worldwide reorganisation process (Fast Forward Driven by Business); - development of several tools; in more detail, during the year investments related primarily to the Nuovo Internet Global Company ( 479 thousand), Workload Management System (WMS) ( 58 thousand), Tool IET Enterprise for Facility MGT ( 35 thousand) and New Hyperion Application ( 100 thousand) projects. 71
74 Consolidated Accounts Notes Property, plant and equipment ( 000) Land and buildings Plant and machinery Equipment Assets under construction Other Total At 31 December ,756 7,520 6,334 2,423 9,979 87,012 Acquisitions ,669 3,466 6,656 Capitalisations Sales (7) (11) (22) (45) (19) (104) Amortisation, depreciation and impairment losses (2,317) (2,196) (1,990) - (3,094) (9,597) Opening/average net exchange rate gains Transfer from assets under construction (656) - - Reclassifications (1,346) At 31 December ,731 6,508 6,633 2,374 10,952 85,198 Property, plant and equipment amount to 85,198 thousand (31 December 2015: 87,012 thousand). They are mainly comprised of the properties of the parent Ansaldo STS S.p.A., specifically the residual value of the building located in Genoa, Via Mantovani 3/5. Investments of the year, equal to the sum of acquisitions and capitalisations, amount to 7,505 thousand and mainly relate to the following: Ansaldo STS S.p.A. for restructuring works and equipment purchased for the Tito plant and the Piossasco facilities for 3,765 thousand; Ansaldo STS France group for the purchase of technical laboratory equipment and production tools for the Riom and Les Ulis facilities for 1,498 thousand; Ansaldo STS USA INC. for maintenance at the Batesburg plant and works at the Pittsburgh office and IT equipment for 1,636 thousand. Depreciation and impairment losses of the year amount to 9,597 thousand, while net exchange rate gains total 382 thousand, mainly opening balances. In general, the property, plant and equipment of the ASTS group is not subject to encumbrances or restrictions of any nature. The only exception regards the restriction established by the municipality of Piossasco for the use of the company canteen by third parties Equity investments Investments in non-consolidated companies recognised at cost: ( 000) At 31 December ,403 Acquisitions/subscriptions and capital increases 2,114 Sales/returns (6) At 31 December ,511 Equity-accounted investments 25,536 Total equity investments 73,047 72
75 Ansaldo STS Annual Report 2016 List of equity investments in thousands of euros: Name Registered office Type of activity Reporting date Accounting standards Equity ( 000) Total assets ( 000) Total liabilities ( 000) Currency investment % % of voting rights (%) Holding type > 50% of voting rights without control Holding type < 50% of voting rights with control Holding type > 20% of voting rights without significant influence Holding type < 20% of voting rights with significant influence Amount ( 000) Metro 5 S.p.A. Milan (Italy) Transportation IT GAAP 56, , ,340 Euro 24.60% 24.60% N/A N/A N/A N/A 16,903 International Metro Service S.r.l. Milan (Italy) Transportation IT GAAP 8,044 8, Euro 49.00% 49.00% N/A N/A N/A N/A 2,374 Pegaso S.c.r.l. (in liq.) Rome (Italy) Construction IT GAAP 260 4,551 4,291 Euro 46.87% 46.87% N/A N/A N/A N/A 122 Alifana S.c.a.r.l. Naples (Italy) Transportation IT GAAP Euro 65.85% 65.85% N/A N/A N/A N/A 17 Alifana Due S.c.r.l. Naples (Italy) Transportation IT GAAP 26 1,466 1,440 Euro 53.34% 53.34% N/A N/A N/A N/A 14 Metro Brescia S.r.l. Brescia (Italy) Transportation IT GAAP 5,379 61,014 55,635 Euro 19.80% 19.80% N/A N/A N/A 1,065 Balfour Beatty Ansaldo Systems JV SDN BHD Kuala Lumpur (Malaysia) Transportation IFRS 12,604 37,020 24,416 MYR 40.00% 40.00% N/A N/A N/A N/A 5,041 Total equity-accounted investments 25,536 Metro C S.c.p.A. Rome (Italy) Transportation IT GAAP 149, , ,116 Euro 14.00% 14.00% N/A N/A N/A 21,000 I.M. Intermetro S.p.A. (in liq.) Rome (Italy) Transportation IT GAAP 1,877 5,320 3,443 Euro 21.26% 16.67% N/A N/A N/A 523 Società Tram di Firenze S.p.A. Florence (Italy) Transportation IT GAAP 12, , ,112 Euro 3.80% 3.80% N/A N/A N/A N/A 266 Iricav Uno consortium Rome (Italy) Transportation IT GAAP 520 7,850 7,330 Euro 17.44% 17.44% N/A N/A N/A 91 Iricav Due consortium Rome (Italy) Transportation IT GAAP ,833 85,317 Euro 17.05% 17.05% N/A N/A N/A 88 Ferroviario Vesuviano consortium Naples (Italy) Transportation IT GAAP , ,633 Euro 33.34% 33.34% N/A N/A N/A N/A 51 S. Giorgio Volla consortium Naples (Italy) Transportation IT GAAP 72 6,155 6,083 Euro 25.46% 25.00% N/A N/A N/A N/A 18 S. Giorgio Volla 2 consortium Naples (Italy) Transportation IT GAAP 72 59,001 58,929 Euro 25.46% 25.00% N/A N/A N/A 18 Cris consortium Naples (Italy) Research IT GAAP 2,445 4,583 2,138 Euro 1.00% 1.00% N/A N/A N/A N/A 24 Ascosa Quattro consortium Rome (Italy) Transportation IT GAAP 57 78,574 78,517 Euro 24.92% 25.00% N/A N/A N/A 14 Siit S.c.p.a Genoa (Italy) Research IT GAAP 614 1,991 1,377 Euro 2.33% 2.30% N/A N/A N/A N/A 14 Saturno Consortium Rome (Italy) Transportation IT GAAP 31 1,676,378 1,676,347 Euro 33.34% 33.34% N/A N/A N/A 10 Train consortium Rome (Italy) Transportation IT GAAP 1,180 33,664 32,484 Euro 4.55% 4.55% N/A N/A N/A 6 Sesamo S.c.a.r.l. Naples (Italy) Transportation IT GAAP Euro 2.00% 2.00% N/A N/A N/A N/A 2 ISICT consortium Genoa (Italy) Research IT GAAP Euro 14.29% 14.29% N/A N/A N/A 6 Cosila consortium (in liq.) Naples (Italy) Research IT GAAP Euro 1.00% 0.92% N/A N/A N/A N/A 1 MM4 consortium Milan (Italy) Transportation IT GAAP ,191 16,991 Euro 17.68% 18.20% N/A N/A N/A 36 Radiolabs consortium Rome (Italy) Research IT GAAP 233 1,608 1,375 Euro 25.00% 25.00% N/A N/A N/A 52 SPV Linea M4 S.p.A. Milan (Italy) Transportation IT GAAP 102, , ,435 Euro 5.55% 5.55% N/A N/A N/A N/A 7,740 Metro de Lima Linea 2 S.A. Lima (Peru) Transportation IFRS 118, ,713 80,649 USD 12.24% 16.90% N/A N/A N/A 16,639 TOP IN S.c.a.r.l. Naples (Italy) Transportation IT GAAP Euro 5.29% 5.29% N/A N/A N/A N/A 4 Ansaldo STS do Brasil Sistemas de Transporte Ferroviario e Metropolitano LTDA Fortaleza (Brazil) Transportation BRAZILGAAP BRL 99.99% 99.99% N/A N/A N/A N/A 334 D.I.T.S. Development & Innovation in Transportation Systems S.r.l. Rome (Italy) Research IT GAAP Euro 12.00% 12.00% N/A N/A N/A 5 Dattilo S.c.a.r.l. Naples (Italy) Transportation IT GAAP Euro 14.00% 14.00% N/A N/A N/A 14 S.P. M4 S.c.p.a. (in liq.) Milan (Italy) Transportation IT GAAP 360 4,126 3,766 Euro 16.90% 16.90% N/A N/A N/A 61 MetroB S.r.l. Rome (Italy) Transportation IT GAAP 17,693 17, Euro 2.47% 2.47% N/A N/A N/A 494 Total equity investments recognised at cost 47,511 Total equity investments 73,047 Equity investments at year end amounted to 73,047 thousand (31 December 2015: 69,041 thousand), of which 25,536 thousand (31 December 2015: 23,638 thousand) was measured using the equity method and 47,511 thousand (31 December 2015: 45,403 thousand) at cost. The 2,108 thousand increase on 2015, which relates to equity investments measured at cost, is mainly due to the subscription of a further equity investment in SPV Linea M4 S.p.A. ( 2,100 thousand) which will construct Line M4 of the Milan metro under concession and the increase of 13 thousand in the Ferroviario Vesuviano consortium following the exit of one of the shareholders. The change of 1,898 thousand compared to 2015, relating to equity-accounted investments, was due primarily to the results recorded by the same investees ( 4,345 thousand), details of which are provided in note 15.10, partially offset by 73
76 Consolidated Accounts Notes the distribution of a dividend of 1,568 thousand by International Metro Service S.r.l. Lastly, the process of winding up the subsidiary Kazakhstan TZ Ansaldo STS Italy LLP was concluded in late November ( 32 thousand) Loans and receivables and other non-current assets ( 000) Guarantee deposits 3,163 2,267 Other 16,800 18,355 Other non-current related party loans and receivables 25,522 21,210 Non-current financial assets 45,485 41,832 Other prepayments 16,090 18,332 Other non-current assets 16,090 18,332 Non-current financial assets at 31 December 2016 amount to 45,485 thousand, up by 3,653 thousand on 2015 ( 41,832 thousand), while non-current assets amount to 16,090 thousand (31 December 2015: 18,332 thousand). They may be analysed as follows: guarantee deposits, mainly for advances to lessors ( 3,163 thousand); for the item other, primarily the Pittsburgh facilities lease of the US subsidiary ( 12,883 thousand) relating to USA subsidiaries for the operating leasing of the offices; other non-current related party loans and receivables: - 22,534 thousand related to the shareholder loan (principal of 18,783 thousand and accrued interest of 3,751 thousand) of Metro 5 S.p.A. following the agreements to construct the related section of the Milan metro; - 2,534 thousand related to the shareholder loan (principal of 2,401 thousand and accrued interest of 133 thousand) of SPV Linea M4 S.p.A. following the agreements to construct the related section of the Milan metro; thousand due from the EPC Lima consortium; thousand due from the MM4 consortium. other prepayments relate to the non-current portion of deferred costs for the licence to use the Ansaldo trademark owned by Finmeccanica S.p.A. for a 20-year period ( 12,868 thousand). With reference to the trademark, Ansaldo STS S.p.A. agreed a contract with Finmeccanica S.p.A. on 27 December 2005 allowing the group to use the Ansaldo trademark on the market. Against the advance payment of royalties of 32,213 thousand, this contract gives the group the exclusive right to use this trademark until 27 December Inventories ( 000) Raw materials, consumables and supplies 24,782 19,383 Work-in-progress and semi-finished products 12,668 12,314 Finished goods 9,790 10,854 Advances to suppliers 77,827 78,666 Total 125, ,217 Inventories amount to 125,067 thousand, up by 3,850 thousand on the balance at 31 December 2015 ( 121,217 thousand) relating primarily to a higher value of raw materials. Inventories are shown net of the relevant allowance of 3,269 thousand (31 December 2015: 3,960 thousand). 74
77 Ansaldo STS Annual Report Work in progress and progress payments and advances from customers ( 000) Advances from customers (41,789) (65,594) Progress payments (1,886,966) (1,842,741) Work-in-progress 2,328,511 2,298,527 Provision for expected losses to complete contracts (12,803) (14,947) Allowance for write-down (28,088) (28,892) Work-in-progress (net) 358, ,353 Advances from customers (310,480) (384,195) Progress payments (2,009,246) (1,749,832) Work-in-progress 1,735,070 1,513,214 Provision for expected losses to complete contracts (12,006) (10,272) Allowance for write-down (1,350) (4,700) Progress payments and advances from customers (net) (598,012) (635,785) Work-in-progress, net of progress payments and advances from customers (239,147) (289,432) Work in progress is usually recognised under assets when the related gross carrying amount is higher than advances from customers, or under liabilities when advances are greater than the relevant work in progress. The overall net amount increased by 50,285 thousand. This is due primarily to the reduction in the value of advances from customers, including the return of the remaining advance from the Russian customer Zarubezhstroytechnology (ZST) for the contract in Libya ( 29,345 thousand), only partially offset by the higher turnover in the previous year in relation to the production volume. The net balance of work in progress includes the net advance of 112,154 thousand related to the contract in Libya, which is still halted given the well-known events which have affected this country over the past few years, as detailed in the directors report. This advance amply covers the work carried out to date and not yet invoiced. As a consequence, at the reporting date, there are no probable risks which would require any accrual. The provision for expected losses to complete contracts reflects losses not yet incurred but for which a provision was recognised on an accruals basis when the contract budget corresponds to a loss. This provision refers to the relevant contracts. Specifically, 12,803 thousand reflects the decrease in work in progress (net) and 12,006 thousand to the increase in progress payments and advances from customers (net). Total advances from customers amount to 352,269 thousand (31 December 2015: 449,789 thousand) Trade receivables and loan assets ( 000) Trade receivables Loan assets Trade receivables Loan assets Third parties 666,476 33, ,606 37,933 Total third parties 666,476 33, ,606 37,933 Related parties 62, , Total 728,852 34, ,558 38,496 The nominal value of trade and financial receivables corresponds to their fair value. Total trade receivables at 31 December 2016 ( 728,852 thousand) increased from the balance at the previous year end ( 663,558 thousand). Specifically, trade receivables from third parties increased ( 666,476 thousand, compared to 604,606 thousand at 31 December 2015), mainly due to the positions of the parent. 75
78 Consolidated Accounts Notes Third party loan assets at 31 December 2016 amounted to 33,966 thousand (31 December 2015: 37,933 thousand) and mainly relate to amounts due from the parent, Ansaldo STS India and Ansaldo STS Malaysia Sdn Bhd. Specifically: - 28,443 thousand reflects the euro equivalent amount of the Libyan dinar advance on the first of the two contracts in Libya obtained by the parent and deposited in a local bank and tied up pending the resumption of activities; - 5,523 thousand reflects the short-term deposits made by Ansaldo STS India ( 4,889 thousand) and Ansaldo STS Malaysia Sdn Bhd ( 634 thousand) with leading banks. Related party loan assets amount to 267 thousand (31 December 2015: 563 thousand) and relate to an interestbearing loan granted to S.P. M4 S.C.p.a.. We note that, during the year, the group factored without recourse receivables not yet due for 11,939 thousand relating to the ultimate parent still existing at year end (31 December 2015: 21,946 thousand for the subsidiary Ansaldo STS France S.A.S., which were fully settled in 2015) Tax assets and liabilities ( 000) Assets Liabilities Assets Liabilities Direct taxes 22,649 8,978 26,378 10,816 Total 22,649 8,978 26,378 10,816 Direct tax assets at 31 December 2016 amount to 22,649 thousand, down 3,729 thousand on the 26,378 thousand at 31 December Direct tax assets relate to the parent Ansaldo STS S.p.A. ( 17,447 thousand), the companies of the Ansaldo STS France S.A.S. group ( 3,508 thousand), the Asia Pacific group companies ( 1,315 thousand) and the Ansaldo STS USA INC. group companies ( 379 thousand). The direct tax assets pertaining to the parent Ansaldo STS S.p.A. mainly relate to foreign tax assets ( 12,729 thousand; 31 December 2015: 9,974 thousand) and to a tax credit in connection with the reimbursement claimed pursuant to article 2.1-quater of Decree Law no. 201/2011, related to the smaller IRES due for the period as a result of the IRAP deductibility on personnel expense ( 3,716 thousand). Direct tax liabilities amount to 8,978 thousand, down 1,838 thousand on the balance of 10,816 thousand at 31 December They mainly relate to the parent Ansaldo STS S.p.A. ( 8,304 thousand) and ASTS France S.A.S. s subsidiaries ( 670 thousand). 76
79 Ansaldo STS Annual Report Other current assets ( 000) Prepayments - current portion 12,314 8,328 Research grants 18,944 18,046 Employees 2,006 1,340 Social security institutions Indirect and other tax assets 31,146 42,678 Derivatives 10,515 5,367 Other 9,645 16,117 Total 84,600 91,926 Related parties 4 4 Total 84,604 91,930 Other current third party assets amounted to 84,600 thousand, down 7,326 thousand on the balance of 91,926 thousand at 31 December The main changes relate to the decrease in indirect taxes due to the lower VAT credit for its own and its branches items. With reference to research grants, please refer to the directors report for details on projects financed. Please note that the disbursement of grants is subject to the implementation of a specific project and/or the channelling of grants for the projects financed. Other current related party assets amount to 4 thousand and are stable compared to the previous year ( 4 thousand). For additional information on derivatives, reference should be made to note Cash and cash equivalents ( 000) Cash-in-hand Bank accounts 305, ,180 Total 305, ,306 Cash and cash equivalents at 31 December 2016 amount to 305,586 thousand and mainly relate to Ansaldo STS S.p.A. ( 202,996 thousand), Ansaldo STS France group ( 25,852 thousand), the Asia/Pacific subsidiaries ( 11,300 thousand), Ansaldo STS USA group ( 28,375 thousand), Ansaldo Railway System Trading (Beijing) Company Ltd. ( 22,498 thousand) and Ansaldo STS Sweden ( thousand). They increased by 1,280 thousand in Cash and cash equivalents are totally available and there are no disposal costs Share capital Share capital In euros No. of shares Nominal amount Treasury shares Total 31 December ,000, ,000,000 (702) 99,999,298 Use of treasury shares for SGP December ,000, ,000, ,000,000 Use of treasury shares for SGP December ,000, ,000, ,000,000 The fully paid-up share capital amounts to 100,000,000 and is comprised of 200,000,000 ordinary shares with a nominal amount of 0.50 each. 77
80 Consolidated Accounts Notes The parent has no treasury shares in the portfolio at 31 December Based on the shareholders register and the communications sent to CONSOB and received by the parent pursuant to article 120 of Italian Legislative decree no. 58 of 24 February 1998, and other available information, the table below gives a list of the shareholders which hold more than 3% of Ansaldo STS S.p.A. s share capital at 31 December 2016: Shareholder % held HITACHI RAIL ITALY INVESTMENTS PAUL E. SINGER (as general partner, directly and indirectly, of the Limited Partnerships Elliott International, LP Elliott Associates, LP and The Liverpool Limited Partnership) UBS Retained earnings Retained earnings ( 000): At 31 December ,504 Changes in the consolidation scope (2,022) Profit for the year 77,968 Dividends (36,000) At 31 December ,451 At 31 December 2016, retained earnings, including profit for the year and consolidation reserves, amounted to 544,451 thousand. The increase is mainly due to the group s profit for the year of 77,968 thousand and the dividend distribution of 36,000 thousand Other reserves ( 000) Legal reserve Hedging reserve Stock grant reserve Deferred tax reserve Translation reserve Other Total 31 December ,000 (1,469) 4,611 1,763 28,722 (3,345) 50,283 Change in the consolidation scope Transfers to profit or loss - 4, ,355 Net exchange rate gains ,739-7,739 Increase/decrease - - 3, (2,091) 1,413 Fair value gains (losses) (1,064) - - (908) 31 December ,000 3,042 8, ,755 (5,436) 63,175 Legal reserve The legal reserve amounts to 20,000 thousand and is unchanged from the previous year, having already reached 20% of the share capital at 31 December Hedging reserve This reserve comprises the fair value gains or losses on the derivatives the group uses to hedge its foreign currency exposure equal to 3,042 thousand at 31 December 2016 due to the increases of the period for 4,511 thousand, gross of deferred tax effects, until such time as the hedged underlying affects profit or loss. When this takes place, the reserve is recognised in profit or loss to offset the effects of the hedged transaction. 78
81 Ansaldo STS Annual Report 2016 Stock grant reserve This reserve was set up in 2007 following the board of directors approval of the Stock Grant Plan (SGP) under which Ansaldo STS shares are awarded to strategic and key resources and high potential managers upon reaching the agreed targets. For additional information, reference should be made to section 7 Human resources and organisation in the directors report. This reserve came to 8,115 thousand at 31 December 2016 and the change compared to last year ( 3,504 thousand) is due to: the 4,380 thousand attributable to the shares related to 2016 vesting conditions ( plan) recognised at the grant date ( 10.5 per share); a 876 thousand decrease due to the 2013 awarding of shares related to the stock grant plan. Deferred tax reserve The deferred tax reserve amounts to 699 thousand and changed in relation to the recognition of deferred taxation generated by: actuarial gains (losses) following the adoption of the equity method for defined benefit plans and fair value gains and losses on hedging transactions. Translation reserve This reserve is used to recognise the exchange rate gains and losses generated by the translation of the financial statements of consolidated companies at 31 December 2016 is equal to 36,755 thousand. The variation showed in the consolidated statement of comprehensive income equal to 7,718 thousand include the impact on minorities for 21 thousand. The largest amounts are generated by the consolidation of the subsidiaries Ansaldo STS USA and Ansaldo STS Australia. Other This caption also includes the reserve for defined benefit plans ( -7,513 thousand), to which the change for the year refers ( 2,091 thousand: actuarial losses on defined benefit plans), the revaluation reserve pursuant to Law no. 413/91 ( 832 thousand) and the reserves set up following the signing of agreements envisaging the parent s receipt of research grants ( 1,245 thousand) Equity attributable to non-controlling interests Equity attributable to non-controlling interests relates to Ansaldo STS Beijing Ltd., with its registered office in Beijing (China) (20%), a subsidiary of Ansaldo STS France S.A.S.. ( 000) At 31 December Loss for the year attributable to non-controlling interests (65) Translation reserve attributable to non-controlling interests (21) Dividends - At 31 December Loans and borrowings ( 000) Current Non-current Total Current Non-current Total Bank loans and borrowings Other loans and borrowings 1,770-1,770 1,607-1,607 Related party loans and borrowings ,500-2,500 Total 1,780-1,780 4,128-4,128 79
82 Consolidated Accounts Notes Changes of the year are as follows: ( 000) Increases Decreases Bank loans and borrowings (21) 10 Other loans and borrowings 1,607 1,770 (1,607) 1,770 Related party loans and borrowings 2,500 - (2,500) - Total 4,128 1,780 (4,128) 1,780 Other loans and borrowings Third party loans and borrowings amounted to 1,770 thousand and related primarily to the parent as part of joint ventures for which Ansaldo STS is lead contractor. Financial debt The repayment plan and exposure to interest rate fluctuations for group financial liabilities are as follows: Bank loans and borrowings Other Total 31 December 2016 ( 000) Floating rate Fixed rate Floating rate Fixed rate Floating rate Fixed rate Within one year 10-1,770-1, years After five years Total 10-1,770-1,780 - Bank loans and borrowings Other Total 31 December 2015 ( 000) Floating rate Fixed rate Floating rate Fixed rate Floating rate Fixed rate Within one year 21-4,107-4, years After five years Total 21-4,107-4,128 - The following disclosure is presented in accordance with the format required by CONSOB communication no. DEM/ of 28 July ( 000) A Cash-in-hand B Other cash and cash equivalents (bank current accounts) 305, ,180 C Securities held for trading - - D CASH AND CASH EQUIVALENTS (A+B+C) 305, ,306 E CURRENT LOAN ASSETS 34,233 38,496 F Current bank loans and borrowings G Current portion of non-current loans and borrowings - - H Other current loans and borrowings 1,770 4,107 I CURRENT FINANCIAL DEBT (F+G+H) 1,780 4,128 J NET CURRENT FINANCIAL POSITION (I-E-D) (338,039) (338,674) K Non-current bank loans and borrowings - - L Bonds issued - - M Other non-current financial liabilities - - N NON-CURRENT FINANCIAL DEBT (POSITION) (K+L+M) - - O NET FINANCIAL POSITION (J+N) (338,039) (338,674) 80
83 Ansaldo STS Annual Report Provisions for risks and charges and contingent liabilities ( 000) Product warranties Disputes with employees Other Total At 31 December , ,581 11,126 Accruals 4, ,455 Reversals (670) (287) (59) (1,016) Utilisation (851) (70) (564) (1,485) Other changes (40) - - (40) At 31 December ,848 1,038 1,154 14,040 Current 8, ,581 11,126 Non-current At 31 December , ,581 11,126 Current 11,848 1,038 1,154 14,040 Non-current At 31 December ,848 1,038 1,154 14,040 The provision for risks and charges totalled 14,040 thousand at 31 December 2016, up by 2,914 thousand on the previous year end ( 11,126 thousand). This change is mainly due to the accruals for product warranties of the French subsidiary ( 4,577 thousand) and for the provision for disputes with employees ( 546 thousand) recognised by the parent Ansaldo STS in order to cover new positions and disputes that arose during the year. In relation to the provisions for risks, the activities of the Ansaldo STS group companies relate to business units and markets where disputes are generally only settled after a significant time lapse, especially in cases where the counterparty is a public body. Provisions have been made for risks that are probable and for which the amount can be determined. Based on current information, specific provisions have not been set aside for the various disputes as they are expected to be resolved satisfactorily and without significantly impacting results. For additional information, reference should be made to the Litigation paragraph of the directors report Employee benefits The amount of and changes in post-employment benefits and the defined benefit plans are as follows: ( 000) Italian post-employment benefits 18,294 17,948 Defined benefit pension plans 17,754 15,207 Total 36,048 33,155 ( 000) ITALIAN POST-EMPLOYMENT BENEFITS Defined benefit plans Present value of obligations 18,294 17,948 17,754 15,207 Fair value of plan assets Unrecognised actuarial gain (loss) Total 18,294 17,948 17,754 15,207 81
84 Consolidated Accounts Notes Changes in defined benefit plans and Italian post-employment benefits are as follows: ( 000) ITALIAN POST- EMPLOYMENT BENEFITS Defined benefit plans At 31 December ,948 15,207 Current costs Benefits paid (478) (450) Actuarial losses taken to equity 37 2,007 of which: Actuarial losses taken to equity following changes to financial assumptions 62 1,919 Actuarial gains/(losses) taken to equity following experience-based adjustments (25) 88 At 31 December ,294 17,754 The amount recognised in the income statement is as follows: ITALIAN POST- EMPLOYMENT BENEFITS Defined benefit plans ( 000) Current service costs Interest expense Total The following main actuarial assumptions were used: ITALIAN POST- EMPLOYMENT BENEFITS Defined benefit plans Discount rate (p.a.) 1.50% 1.89% 1.4% 1.9% Salary increase rate N.A. N.A. 2.5% 2.5% Turnover rate 2.09% % 2.09% % 0.91% % 0.91% % A sensitivity analysis was performed for each significant actuarial assumption, showing the effects on the company s obligation: ITALIAN POST- EMPLOYMENT BENEFITS Defined benefit plans -0.25% 0.25% -0.25% 0.25% Discount rate (p.a.) 18,671 17,938 18,495 16,811 Inflation rate 18,027 18,567 16,817 18,485 Turnover rate 18,291 18,297 17,341 17,914 The average term of the Italian post-employment benefits and other defined benefit plans is 13 years. The different pension systems included in the calculation does not have peculiarities that may affect the outlook. 82
85 Ansaldo STS Annual Report Other current and non-current liabilities ( 000) Current Non-current Current Non-current Employees 39,316 8,178 34,995 7,353 Indirect and other tax liabilities 14,471-15,079 - Amounts due to social security institutions 17,401-17,611 - Derivatives 17,008-14,612 - Other 31,750 4,730 28,556 4,439 Total other third party liabilities 119,946 12, ,853 11,792 Other related party liabilities Total 120,356 12, ,255 11,792 Other current and non-current third party liabilities amount to 132,854 thousand, up 10,209 thousand on 31 December 2015 ( 122,645 thousand). As highlighted in the table, the increase relates primarily to the items derivatives, employees and other third party liabilities. Specifically, other third party liabilities include the outstanding 62% of the consideration to be paid for the acquisition of the investment in Metro C S.c.p.A. ( 12,950 thousand) (31 December 2015: 12,950 thousand) and advances for R&D grants of the parent of 10,601 thousand. Other current and non-current related-party liabilities amount to 410 thousand (31 December 2015: 402 thousand). For additional information on derivatives, reference should be made to note Trade payables ( 000) Trade payables 438, ,726 Total third party trade payables 438, ,726 Related party trade payables 19,671 25,247 Total 458, ,973 The nominal value of trade and financial receivables corresponds to their fair value. Total trade payables at 31 December 2016 of 458,119 thousand increased on the previous year s balance of 415,973 thousand. Third party trade payables mainly relate to Ansaldo STS S.p.A. ( 358,277 thousand), Ansaldo STS France group ( 35,872 thousand), Ansaldo STS USA group ( 25,717 thousand) and the Asia/Pacific subsidiaries ( 12,446 thousand) Derivatives Derivative assets and liabilities may be analysed as follows: ( 000) Assets Liabilities Assets Liabilities Fair value hedges 4, , Cash flow hedges 6,472 16,761 1,768 14,449 Currency hedges 10,515 17,008 5,367 14,612 Derivative assets and liabilities at 31 December 2016 increased from the previous year s balance due to the new cash flow hedges. 83
86 Consolidated Accounts Notes Fair value measurement Ansaldo STS group does not hold listed derivative instruments at 31 December The fair value of unlisted derivatives is measured using financial valuation techniques. Specifically, the fair value of currency forwards is determined on the basis of market rates at the reporting date and the exchange rate spreads between the relevant currencies. The fair value of swaps is calculated discounting the future cash flows at market rates. Hedges are mainly undertaken with banks. The group has contracts in place for the following notional foreign currency amounts at the reporting date: ( 000) Euro 56,854 62,345 US dollar 345, ,556 Pound sterling 55,729 10,014 Swedish krona 1,648 29,849 Australian dollar 6,783 34,436 Hong Kong dollar 455 1,291 Indian rupee 5,164 5,133 United Arab Emirates dirham 12,921 12,511 Although it is exposed to a limited extent to the risk of fluctuations in interest rates, the group does not hedge the interest rate risk Guarantees and other commitments Leases The group is party to certain operating leases, mainly for use of property, plant and equipment. Minimum future payments are as follows: ( 000) Operating leases Within one year 3,779 Between two and five years 10,724 After five years - 14,503 Guarantee portfolio Sureties and bonds issued by banks or insurance companies to customers for trading transactions play a fundamental role in the finalisation of national/international tenders and are a basic requirement in the awarding of contracts. Bid bonds This guarantee is given to participate in tenders. Usually, it has a 3/6-month term and reflects 1-3% of the basic bid amount or the estimated bid amount. Because of its nature, the total value of the bid bond with respect to guarantees is usually modest. At 31 December 2016, it accounted for approximately 26 million in the guarantee portfolio. Performance bonds This guarantee ensures the successful performance of the project or the supply. They are usually required when signing contracts and its term reflects that of the works or the supply for which they were issued. They can be of a short-term nature in the case of supply contracts, while they can be of a very long-term nature for turnkey contracts as they include the operation & maintenance stage. The amount depends on the type of contract and the relevant context. Usually, it ranges between 10-15% of the contractual value. This type of guarantee accounted for approximately 1,050 million in the guarantee portfolio at 31 December
87 Ansaldo STS Annual Report 2016 Retention money bonds Where contractually provided for, retention money bonds represent the guarantee given to release the amounts held by the customer as a guarantee on the services provided and invoiced. They are released progressively and for minimum amounts (for example, 5% of works/supplies performed and invoiced). Where not explicitly provided for in the contract, the bond can be also be released upon completion of works. At 31 December 2016, it accounted for approximately 26 million in the guarantee portfolio. Advance payment bonds Advance payment bonds, also called down payment bonds, enable the customer to recover an advance payment made to the supplier at the beginning of the project/supply. They decrease as the advance is reabsorbed through the invoicing of the supplier to the customer. The amount of this guarantee varies according to the contract type and the context in which it has been issued. Generally, it can vary from 10% to 15% of the contractual amount up to 25%- 35% in some international contexts. At 31 December 2016, these guarantees amounted to over 546 million. Counter guarantees Counter guarantees are another type of guarantee. They are presented by the parent Ansaldo STS S.p.A. for contracts agreed as member of consortia and joint ventures. At 31 December 2016, this type of guarantee amounted to approximately 114 million. Part of the sureties detailed above was released at 31 December 2016 by using the credit lines of Hitachi Ltd ( 184 million) and Ansaldo STS S.p.A. ( 288 million) for transactions on behalf of the subsidiaries. Parent company guarantees - Ansaldo STS S.p.A. The parent company guarantee (PCG) represents the guarantee given by the parent in favour of third parties to guarantee the commitments of a subsidiary. This guarantee can be given for various purposes: issuing commercial guarantees, where the parent Ansaldo STS S.p.A. takes over as guarantor with the banks, for a total of approximately 850 million at 31 December 2016, to the guarantees released by the parent to the banks for the credit lines granted to Ansaldo STS group companies totalling 234 million at 31 December Parent Company guarantee Hitachi ltd At 31 December 2016, the parent has parent company guarantees issued by the ultimate parent Hitachi ltd ( 1,284 thousand) to foreign customers of the group. The group has the following guarantees at 31 December 2016: Direct guarantees and hold harmless agreements for guarantees issued by third parties in the interest of the group to customers and other third parties ( 000) Personal guarantees issued by Hitachi (parent company guarantees) to customers for trading transactions 1,284,230.3 Personal guarantees issued by Ansaldo STS (parent company guarantees) to customers for trading transactions 848,165.2 Sureties and bonds (bid bonds, performance bonds, retention bonds, advance payment bonds, counter guarantees and other minor guarantees) issued by banks or insurance companies to customers for trading transactions 1,810,834.4 of which, counter-guaranteed by Hitachi 183,787.8 of which, counter-guaranteed by Ansaldo STS 288,515.9 Direct and other guarantees issued by Ansaldo STS, banks or insurance companies to other third parties for noncontractual/trading guarantees (financial and tax transactions) 39,286.0 Total 3,982,515.9 Total 85
88 Consolidated Accounts Notes 3.4 Notes to the income statement Impact of related party transactions on profit or loss 2016 ( 000) Revenue Other operating income Costs Financial income Financial expense Other operating expense Ultimate parent Hitachi Rail Europe Ltd 25 - (7) Hitachi Ltd (Rail) Subsidiaries Alifana S.c.r.l Alifana Due S.c.r.l Associates International Metro Service S.r.l. (76) Metro 5 S.p.A. 12,979 1, Pegaso S.c.r.l. (in liq.) SP M4 S.C.p.A (in liq.) Metro Brescia S.r.l Metro Service A.S. 6,283-32, JOINT VENTURES Kazakhstan Balfour Beatty Ansaldo Syst. JV SDN BHD (2,385) Consortia Ascosa Quattro consortium Ferroviario Vesuviano consortium Saturno Consortium 34,809-1, San Giorgio Volla 2 consortium 2, San Giorgio Volla consortium (5) MM4 consortium 22, Cris consortium Other group companies Hitachi Rail Italy S.p.A. 12,067-28, Hitachi Rail Inc Hitachi Rail India Pvt Ltd Rail Systems Company Hitachi High Technologies Europe Gmbh I.M. Intermetro S.p.A. (in liquidation) Total 92,118 1,300 64, % of the total corresponding financial statements caption 7% 6% 8% % 86
89 Ansaldo STS Annual Report ( 000) Revenue Other operating income Costs Financial income Financial expense Other operating expense Ultimate parent Hitachi Rail Europe Ltd - - (301) Subsidiaries Alifana S.c.r.l Alifana Due S.c.r.l Associates International Metro Service S.r.l Metro 5 S.p.A. 26,484 4, Pegaso S.c.r.l. (in liq.) SP M4 S.C.p.A (in liq.) Metro Brescia S.r.l. 1, Metro Service A.S , JOINT VENTURES Balfour Beatty Ansaldo Syst. JV SDN BHD (2,770) Consortia Ascosa Quattro consortium Cesit consortium Ferroviario Vesuviano consortium (993) Saturno Consortium 21,343-1, San Giorgio Volla 2 consortium San Giorgio Volla consortium (80) - (4) MM4 consortium 22, Cris consortium Other group companies Hitachi Rail Italy S.p.A.* 4,343-14, I.M. Intermetro S.p.A. (in liquidation) Total 73,202 4,151 56, % of the total corresponding financial statements caption 5% 17% 6% 1% - - * As of 2 November
90 Consolidated Accounts Notes Revenue ( 000) Sales 889,329 2,587,278 Services 153, ,451 1,043,299 2,752,729 Change in work in progress 191,969 (1,442,094) Third party revenue 1,235,268 1,310,635 Related party revenue 92,118 73,202 Total revenue 1,327,386 1,383,837 Revenue amounted to 1,327,386 thousand in 2016, down 56,451 thousand on the 1,383,837 thousand balance in The decrease was mainly due to projects of the subsidiaries Ansaldo STS Australia and USA, only partially offset by the increase of the parent. Related party revenue increased by 18,916 thousand compared to the previous year Other operating income ( 000) R&D grants 1,834 2,683 Training grants Gains on sales of property, plant and equipment and intangible assets Reversals of impairment losses on loans and receivables Reversals of provisions for risks and charges Release of the provision for expected losses to complete contracts 1,334 1,025 Royalties Financial income and exchange rate gains on operating items 1,900 2,218 Tax asset for R&D 3,327 2,974 Other operating income 10,442 10,095 Other third party operating income 19,956 20,607 Other related party operating income 1,300 4,151 Total other operating income 21,256 24,758 Other operating income amounted to 21,256 thousand, down on the balance of the previous year ( 24,758 thousand), primarily due to the reduction in other operating income from related parties due to the closure in 2015 of specific transactions with the consortia/companies of which Ansaldo STS S.p.A. is part. The value of other operating income from third parties declined due to the decrease in grants for research and development projects Purchases and services ( 000) Materials 335, ,717 Change in inventories (4,805) (745) Services 438, ,588 Rentals and operating leases 20,365 21,570 Total third party purchases and services 789, ,130 Total related party purchases and services 64,987 56,759 Total purchases and services 854, ,889 88
91 Ansaldo STS Annual Report 2016 Total purchases and services of 854,289 thousand decreased by 58,600 thousand on those for the previous year ( 912,889 thousand) mainly due to lower production volumes in Purchases of materials and change in inventories amount to 330,358 thousand (2015: 339,972 thousand), down by 9,614 thousand. Services amount to 438,579 thousand (2015: 494,588 thousand), down by 56,009 thousand. Rentals and operating leases amount to 20,365 thousand (2015: 21,570 thousand), down by 1,205 thousand. They mainly relate to long-term rentals of company cars, software licences and the lease of premises. Related party purchases and services rose by 8,228 thousand. Reference should be made to note 15.1 Impact of related party transactions on profit or loss for further details on related party transactions Personnel expense ( 000) Wages and salaries 253, ,532 Stock grant plans 4,731 1,891 Social security and pension contributions 59,306 57,200 Italian post-employment benefits Other defined benefit plans Other defined contribution plans 4,363 4,439 Recovery of personnel expense (836) (1,264) Disputes with personnel Restructuring costs - - Other costs 10,048 7,856 Total 332, ,676 The headcount at 31 December 2016 numbered 3,951, up by 179 employees on the previous year (3,772). The average headcount on the payroll in 2016 numbered 3,828, compared to 3,748 employees in 2015, up by 80 employees. Personnel expense came to 332,338 thousand, up by 10,662 thousand on the previous year ( 321,676 thousand). This was due to higher costs for wages and salaries and for social security and pension contributions, as a result of the higher average headcount, and the recognition of costs correlated with transactions with the company s strategic and non-strategic personnel. In relation to incentive plans which involve assigning shares to employees, on 20 February 2014, the Board of Directors on the basis of the proposal of the parent s remuneration committee approved a three-year stock grant plan for which was subsequently passed by the shareholders in their meeting of 17 April This plan, which applies to a maximum of 46 employees plus the CEO and key managers, has the same vesting conditions as the plan (EVA, FOCF and share performance against the FTSE Italia All-Share index). The stock grant plan cost is recognised on an accruals basis in the reporting period in which the services are rendered. The amount therefore relates to the portion pertaining to the year of the shares related to the 2016 vesting conditions (as per the plan), which will be delivered considering the three-year vesting conditions. In accordance with IFRS 2 Share-based payment and IFRIC 11 Group and treasury share transactions and their current interpretations, the cost for the stock grant plan for 2016, equal to 4,731 thousand (2015: 1,891 thousand), was recognised with a balancing entry in an equity reserve. The Italian post-employment benefit and other defined benefit plan expense represents only the service cost, as interest expense is classified under financial expense following the adoption of the equity method. 89
92 Consolidated Accounts Notes Amortisation, depreciation and impairment losses ( 000) Amortisation and depreciation: - intangible assets 7,353 6,601 - property, plant and equipment 9,597 9,137 16,950 15,738 Impairment losses: - current loans and receivables 1,368 2,968 - other assets ,375 2,987 Total amortisation, depreciation and impairment losses 18,325 18,725 Amortisation, depreciation and impairment losses amount to 18,325 thousand and decreased by 400 thousand on 2015 ( 18,725 thousand). This change was caused by lower impairment losses on current loans and receivables, partially offset by greater amortisation and depreciation for the period. Specifically, 7,353 thousand relates to intangible assets and 9,597 thousand to property, plant and equipment Other operating expense ( 000) Accruals to the provisions for risks and charges 4,873 2,447 Losses to complete contracts 925 4,085 Membership fees Losses on sales of property, plant and equipment and intangible assets Exchange rate losses on operating items 9,181 9,275 Interest and other operating expense 1,347 1,873 Indirect taxes 2,833 3,753 Other operating expense 1,581 2,193 Total other third party operating expense 21,503 24,584 Other related party operating expense 4 - Total other operating expense 21,507 24,584 Other third party and related party operating expense amounted to 21,507 thousand, down by 3,077 thousand on 2015 ( 24,584 thousand). Specifically, the decrease related to lower losses to complete contracts and lower indirect taxes. Starting from 2012, expected losses to complete contracts are no longer recognised against revenue, rather under Other operating expense Internal work capitalised ( 000) Internal work capitalised (5,131) (5,312) Internal work capitalised mainly relates to: - the parent Ansaldo STS S.p.A. ( 4,700 thousand), almost entirely related to the Satellite and Rail Telecom project begun in 2012 to develop satellite technologies for new railway signalling systems. This project is co-financed with the European Space Agency and the Galileo Supervisory Authority; - the French subsidiary Ansaldo STS France S.A.S. ( 431 thousand), with respect to costs for the internal construction (personnel, materials and services) of intangible assets and property, plant and equipment. 90
93 Ansaldo STS Annual Report Net financial expense ( 000) Income Expense Net Income Expense Net Interest and fees 1,001 8,206 (7,205) 1,246 1,786 (540) Exchange rate gains and losses 10,819 12,877 (2,058) 28,828 28,980 (152) Fair value gains and losses 621 4,561 (3,940) 545 3,347 (2,802) Interest on Italian post-employment benefits (268) (289) Interest on other defined benefit plans (286) (265) Other financial income and expense (740) (554) Total net financial expense 12,441 26,938 (14,497) 30,619 35,221 (4,602) Net related party financial income Total 12,441 26,938 (14,497) 30,840 35,221 (4,381) In 2016, net third party financial expense amounted to 14,497 thousand, compared to 4,602 thousand in The decrease of 9,895 thousand is due primarily to the item expense for interest and fees, which includes interest paid to the Russian customer following the conclusion of the arbitration on the Libyan contract ( 7,670 thousand). As shown in the table, interest on the Italian post-employment benefits and defined benefit plans amounts to 268 thousand ( 289 thousand in 2015) and 286 thousand ( 265 thousand in 2015), respectively Share of profits (losses) of equity-accounted investees ( 000) Income Expense Net Income Expense Net Share of profits (losses) of equity-accounted investees 4,345-4,345 5,324-5,324 Total 4,345-4,345 5,324-5,324 The share of profits (losses) of equity-accounted investees is a positive 4,345 thousand and comprises the profit of the investee International Metro Service S.r.l. ( 1,460 thousand), the associates Metro 5 S.p.A. ( 2,502 thousand) and Metro Brescia S.r.l. ( 195 thousand) and Balfour Beatty Ansaldo Systems JV SDN BHD ( 188 thousand) Income taxes This caption comprises: ( 000) IRES 12,663 12,594 IRAP 2,134 1,985 Income from consolidation - - Other foreign taxes 23,312 27,503 Prior year taxes 982 (163) Provisions for tax risks Net deferred tax (income) expense (345) 1,207 Total 38,746 43,676 The value of taxes was 38,746 thousand in 2016, a reduction of 4,930 thousand compared to the previous year, essentially due to the lower pre-tax profit. Specifically: - the 1,552 thousand decrease in net deferred taxes, which declined from net deferred tax income of 1,207 thousand to net deferred tax expense of 345 thousand, due primarily to the recognition of deferred tax assets of the group s foreign subsidiaries; 91
94 Consolidated Accounts Notes - IRES ( 12,663 thousand) and IRAP ( 2,134 thousand), related to the parent, were in line with the previous year; - income taxes of foreign companies ( 23,312 thousand) decreased compared to the previous year ( 27,503 thousand in 2015), primarily due to the decline in their pre-tax profit. The difference between the theoretical and effective tax rates is analysed below: ( 000) amount % amount % Pre-tax profit 116, Taxes calculated at ruling tax rates 32, % 37, % Permanent differences 2, % (356) (98) -0.07% 119,133 32, % 136,356 37, % Different rates on foreign taxes and/or due to losses of the year - 1, % - 3, % IRAP and other taxes calculated on a basis other than pre-tax profit - 3, % - 2, % Prior year taxes % - (163) -0.12% Provisions for tax risks % % Total effective taxes recognised in profit or loss 38, % 43, % At 31 December 2016, the effective tax rate is 33.22%, compared to 31.95% in the previous year, with an increase of 1.27%, due to the different mix of pre-tax profits (losses) of individual group companies. Statement of Income statement financial position ( 000) Assets Liabilities Assets Liabilities Italian post-employment benefits and pension funds 184-5,262 - Remuneration Property, plant and equipment and intangible assets (13) Provisions for risks and charges (1,008) - 18,996 - Research grants - (39) 629 2,191 Allowances for WIP and inventory write-down 68-2,316 - Cash flow hedges - defined benefit plans - - 1,563 2,379 Tax losses (217) - 1,497 - Other 1, ,357 7,027 Total ,324 12,175 The deferred tax assets generated by the Provisions for risks and charges mainly relate to the US subsidiaries ( 5,725 thousand) and the parent ( 13,151 thousand). The deferred tax assets on tax losses fully relate to the subsidiary Ansaldo STS USA ( 1,497 thousand). The deferred tax assets related to the allowance for work-in-progress and inventory write-down mainly relate to the subsidiary Ansaldo STS USA ( 333 thousand), Ansaldo STS France ( 1,790 thousand) and the parent Ansaldo STS S.p.A. ( 193 thousand). Deferred tax assets are recognized taking into consideration their recoverability in each component of the consoldiated financial statements, based on the avilability of the expected forecasted future taxable income. 92
 and Ansaldo STS France ( 773 thousand). Deferred tax liabilities mainly relate to the parent.")
95 Ansaldo STS Annual Report 2016 Other mainly relates to the parent, Ansaldo STS S.p.A. ( 2,496 thousand), the subsidiary Ansaldo STS Australia ( 2,404 thousand) and the subsidiaries Ansaldo STS USA INC. ( 3,684 thousand) and Ansaldo STS France ( 773 thousand). Deferred tax liabilities mainly relate to the parent. Deferred tax assets and liabilities include those recognised with a balancing entry directly in equity, on derivatives recognised as cash-flow hedges (impact of the period of - 1,767 thousand) and actuarial gains/losses following the adoption of the equity method for defined benefit plans (impact of the period of 703 thousand). This equity item changed as follows during the year: ( 000) Transfers to profit or loss Fair value gains or losses Other changes Deferred taxes directly recognised in equity 1,763 - (1,064)
96 Consolidated Accounts Notes 3.5 Earning per share Earnings per share ( EPS ) are calculated by: dividing the profit for the year attributable to holders of ordinary shares by the average number of ordinary shares outstanding in the year, net of treasury shares (basic EPS); dividing the profit for the year by the average number of ordinary shares and those that could arise from the exercise of all options under stock option plans, net of treasury shares (diluted EPS). Basic EPS Average shares outstanding during the year 199,996, ,995,192 Profit for the year ( 000) 77,903 93,036 Basic and diluted EPS Cash flows from operating activities The following table shows the cash flows from operating activities: ( 000) Profit for the year 77,903 93,036 Share of profits (losses) of equity-accounted investees (4,345) (5,324) Income taxes 38,746 43,676 Italian post-employment and other employee benefits Stock grant plans 4,731 1,891 Net gains on the sale of assets Net financial income 14,497 4,381 Amortisation, depreciation and impairment losses 18,325 18,725 Accruals to/reversals of provisions for risks 4,814 2,344 Other operating income/expense 3,118 7,802 Write-downs/reversals of write-downs of inventories and work in progress (4,498) (5,223) Total 154, ,008 The change in working capital, shown net of the impacts of acquisitions and sales of consolidated companies and exchange rate gains and losses, comprises: ( 000) Inventories (2,981) (14,223) Work in progress and progress payments and advances from customers (63,094) (28,366) Trade receivables and payables (17,077) 51,483 Total (83,152) 8,894 The change in other operating assets and liabilities, shown net of the impacts of acquisitions and sales of consolidated companies and exchange rate gains and losses, comprises: ( 000) Payment of Italian and other post-employment benefits (7,547) (7,513) Taxes paid (20,928) (33,003) Changes in other operating items 11,200 (27,983) Total (17,275) (68,499) Reference should be made to section 2.3 on the group s financial position for a discussion of changes in the consolidated statement of cash flows. 94
97 Ansaldo STS Annual Report Financial risk management The group s operations expose it to the following financial risks: market risks, related to currency risk, operations in currencies other than the functional currency, interest rate risk; liquidity risks, related to the availability of financial resources and access to the credit market; credit risk, arising from normal trading transactions or financing activities. The group specifically monitors each of these financial risks and acts promptly to minimise them including via hedging derivatives. Ansaldo STS group s approach to managing these risks, in line with internal policies, is described below. Currency risk As described in the treasury management policy, Ansaldo STS group manages currency risk by pursuing the following objectives: limiting potential losses generated by unfavourable exchange rate fluctuations against the currency used by Ansaldo STS S.p.A. and its subsidiaries; limiting forecast or actual costs related to the implementation of currency risk management policies. Currency risk shall only be hedged if it has a material impact on cash flows, compared to the functional currency. Costs and risks related to a hedging policy (hedge, no hedge or partial hedge) must be acceptable in both financial and commercial terms. Currency risk may be hedged using the following tools: purchase and sale of currency forwards: these are the most commonly used cash flows hedges; funding/lending in foreign currency: used to mitigate the currency risk related to similar receivable and payable positions with banks or group companies. The use of funding and lending in foreign currency as a hedging instrument shall only take place when consistent with Ansaldo STS group s overall treasury management and financial position (both long- and short-term). The purchase and sale of foreign currency is generally the hedge tool used when foreign markets are not sufficiently liquid or when it is the most cost effective hedging method. Currency risk hedging There are three main types of currency risk: 1. The economic risk is the impact exchange rate fluctuations can have on capital budgeting decisions (investments, the location of production facilities and supply markets). 2. Transaction risk is the possibility that exchange rates may fluctuate between the time a commitment is undertaken to make future collections or payments in foreign currency (price list, budgets, orders preparation and invoicing) and when the actual collection or payment takes place, generating either exchange rate gains or losses. 3. The translation risk is the effect on the financial statements of multinational companies of translating dividends, or of consolidating assets and liabilities when exchange rates adopted for consolidation purposes differ from one reporting period to the next. Ansaldo STS group hedges the transaction risk in line with the foreign exchange risk management policy, i.e., via the systematic hedge of cash flows generated by firm contractual commitments to buy and sell, in order to fix the exchange rates at the date the construction contracts are agreed, thereby neutralising the effects of exchange rate fluctuations. Cash flow hedges Hedges are entered into at the time sales contracts are agreed, using plain vanilla instruments (currency swaps and forwards) that qualify for hedge accounting under IAS 39. They are recognised as cash flow hedges, whereby the effective portion of fair value gains or losses on hedging derivatives is recognised in the relevant hedging reserve once the hedging strategy is demonstrated to be effective. 95
98 Consolidated Accounts Notes If the hedge is not deemed effective (i.e., does not fall within the 80% to 125% range), fair value gains or losses on hedging instruments are immediately expensed as financial items and the related fair value gains or losses accumulated in the hedging reserve up to the date of the most recent successful test of effectiveness are reclassified to profit or loss. The calculation of hedge effectiveness does not include the fair value of financial income and expense as it is directly recognised in profit or loss. Accordingly, the impact on profit or loss of this component is not deferred, improving the transparency and consistency of the hedging reserve. Moreover, the result of the forex effectiveness test is simplified as comparison is limited to two notional amounts: the forex and the hedged underlying. Fair value hedges These hedge fair value changes in a recognised asset or liability, an unrecognised firm commitment, an identified portion of this asset, liability or irrevocable commitment, related to a particular risk and that could impact profit or loss. The group hedges fair value gains or losses related to the currency risk on recognised assets and liabilities. Hedges are mainly undertaken with banks. The group has contracts in place for the following notional foreign currency amounts at the reporting date: local currency in 000 Sell16 Buy Sell15 Buy Euro 25,169 31,685 56,854 21,482 40,863 62,345 US dollar 263,912 81, , ,936 66, ,556 Pound sterling 55,729-55,729 10,014-10,014 Swedish krona ,648-29,849 29,849 Australian dollar - 6,783 6,783-34,436 34,436 Hong Kong dollar ,291-1,291 Indian rupee 5,164-5,164 5,133-5,133 United Arab Emirates dirham 12,921-12,921 12,511-12,511 The net fair value of the derivatives in place at 31 December 2016 was a negative 6,493 thousand. Sensitivity analysis of exchange rates For the purposes of the presentation of market risks, IFRS 7 requires a sensitivity analysis that shows the effects of the hypothetical changes in the most relevant market variables on profit or loss and equity. Currency risks arise from recognised financial instruments (including trade receivables and payables) or highly probable cash flows denominated in a currency other than the functional currency. Since the US dollar is the primary foreign currency used by the group, a sensitivity analysis was performed on financial instruments denominated in dollars in place at 31 December 2016, assuming a 5% appreciation (depreciation) of the euro against the US dollar. This analysis showed that an appreciation or depreciation of the euro against the US dollar would have the following impact on the group s consolidated financial statements: ( 000) +5% - appreciation of the euro against the US dollar % - depreciation of the euro against the US dollar +5% - appreciation of the euro against the US dollar -5% - depreciation of the euro against the US dollar Income statement (4,613) 5,098 (6,500) 7,184 Hedging reserve 11,692 (12,920) 13,100 (14,553) The sensitivity of the income statement to the Euro/US dollar exchange rate fluctuations is lower than in 2015, and the impact on the financial position decreased, as a result of the new significant forex positions opened by the parent Ansaldo STS S.p.A. during the year. 96
99 Ansaldo STS Annual Report 2016 Interest rate risk Under the policy, the aim of interest rate risk management is to reduce the negative effects of interest rate fluctuations on the group s financial position, results of operations and weighted average cost of capital. Ansaldo STS group manages interest rate risk to pursue the following objectives: stabilise the weighted average cost of capital; minimise Ansaldo STS group s medium- and long-term weighted average cost of capital by focusing on the effects of interest rates on both debt funding and equity funding; optimise the return on financial investments within a general risk/return trade-off; limit costs related to the implementation of interest rate management policies, including direct costs related to the use of specific instruments and indirect costs linked to the internal structure needed to manage the risk. Again in 2016, the group managed this risk without the use of derivatives. Sensitivity analysis of interest rates A sensitivity analysis was performed on the assets and liabilities exposed to interest rate risk to assess the impact on profit or loss, assuming a parallel and symmetric 50 basis point rise (fall) (0.5%) in interest rates; the adopted range has been chosen by IFRS for the analysis. The impact of these scenarios on the group s financial statements at 31 December 2016 is summarised in the following table: ( 000) +50 bps -50 bps +50 bps -50 bps Income statement 1,222 (1,222) 760 (760) These impacts are the result of lower interest income that would be produced by floating rate net financial position, in the case of interest rates greater or lower by 50 basis points, respectively. The change in interest rates would have no impact on the measurement of recognised financial instruments, as there are no financial assets or liabilities (not derivative) recognised at fair value through profit or loss. Moreover, the derivatives entered into by the group are exclusively exchange rate derivatives and a change in the interest rates of the various currencies would have no relevant impacts on fair value at year end. There are no impacts on equity, as the group has no cash flow hedges on the interest rate risk. The results achieved at 31 December 2016 increased on those of the previous year as a result of to the increase in receivables and payables exposed to interest rate fluctuations. Liquidity risk Ansaldo STS group has rolled out a series of tools to optimise treasury management with a view to the efficient management of cash and cash equivalents and to help its business grow. This was achieved by centralising the treasury function (current accounts between the parent and the group companies) and an active presence on financial markets which has enabled the group to obtain short- and medium- to long-term non-revolving cash and unsecured credit lines to meet its needs. It had a net financial position of ( 338,039) thousand at 31 December 2016, in line with the net financial position of ( 338,674) thousand at 31 December
100 Consolidated Accounts Notes Liquidity analysis amounts in thousands of euros figures at A Financial liabilities excluding derivatives Within one year Between one and five years After five years Non-current liabilities Third party loans and borrowings Related party loans and borrowings Other non-current liabilities 3, Current liabilities Related party trade payables 8,559 11,112 - Third party trade payables 423,167 15,281 - Third party financial liabilities 1, Related party financial liabilities Other financial liabilities Total A 436,672 26,937 - B Negative value of derivatives Hedging derivatives 17, Trading derivatives (economic hedge) Total B 17, Total A + B 453,680 26,937 - The following financial assets were recognised against loans and borrowings and trade payables of 480,617 thousand: C - Financial assets Cash-in-hand and cash and cash equivalents 305,586 Third party trade receivables 666,476 Related party trade receivables 62,376 Receivables at FV - third parties - Receivables at FV - related parties - Loan assets 34,233 Other - Positive value of derivatives 10,515 TOTAL FINANCIAL ASSETS 1,079,186 D Unsecured credit lines 138,961 TOTAL C + D 1,218,147 C+D-(A+B) 737,530 The group has a net credit position and has available liquidity to self-finance and does not have to use banks to finance its operations. Consequently, it has relatively limited exposure to the liquidity market tensions. 98
101 Ansaldo STS Annual Report 2016 Credit risk The group does not have significant credit risks, either in terms of its trading counterparties or its financing and investing activities. Its main customers are public entities or related to public bodies, mostly in the European, US and South-East Asia areas. Ansaldo STS group s typical customer rating is therefore medium-to-high. However, for contracts with customers/counterparties with which the group does not have regular trading transactions, solvency is analysed at the time the offer is placed, in order to identify future credit risks. Given the nature of the group s customers, collection times are longer (and, in certain countries, significantly longer) than those typical of other businesses, leading to overdue amounts, which are sometimes considerable. At 31 December 2016, third party trade receivables amounted to 666,476 thousand (31 December 2015: 604,606 thousand) and were overdue for 258,643 thousand, of which 169,495 thousand by more than 12 months. At 31 December 2016, third party trade receivables mainly relate to the parent Ansaldo STS S.p.A. ( 509,019 thousand), overdue for 216,433 thousand. The following table gives a breakdown of receivables at 31 December 2016: ( 000) Public bodies Other customers Europe Americas Other Europe Americas Other Total - Retentions 40,320 7,222 7,049 20,681 3, ,548 - Not overdue 86,413 17, ,200 8,350 18, ,285 - Overdue by less than six months 22,814 2, ,459 5,138 5,645 67,481 - Overdue between 6 months and 1 year 7, , ,667 - Overdue between one and five years 110,611 5,459 1,911 50, ,495 Total 267,730 33,272 10, ,500 17,406 26, ,476 The allowance for impairment changed as follows: January 22,667 20,470 Accruals 1,366 2,968 Releases/Utilisation (28) (776) Other changes December 24,007 22,667 During the year, the allowance for impairment rose by 1,340 thousand, mainly as a result of the amounts accrued by the parent Ansaldo STS S.p.A. for the collection risk of receivables for interest in arrears and late payment. With respect to the credit risk arising from the positive value of derivatives, the counterparties of derivative contracts are mainly banks. The table below breaks down the positive value of derivatives by the counterparty s rating class. The ratings below are based on S&P s data. Classe di Rating Positive fair value A 28.0% A- 72.0% Total positive fair value 100.0% 99
102 Consolidated Accounts Notes Classification and fair value of financial assets and liabilities The tables below give a breakdown of the group s financial assets and liabilities by the measurement category set out in IAS 39. Financial liabilities are all recognised using the amortised cost method, since the group did not use the fair value option. Derivatives are analysed separately ( 000) Fair value through profit or loss Loans and receivables Held to maturity Total Fair value Non-current assets Non-current related party loans and receivables - 25,522-25,522 25,522 Financial assets measured at fair value through profit or loss Loans and receivables - 19,963-19,963 19,963 Current assets - Current related party loans assets - 62,376-62,376 62,376 Trade receivables - 666, , ,476 Financial assets measured at fair value through profit or loss - 34,233-34,233 34, ( 000) Fair value through profit or loss Amortised cost Held to maturity Total Fair value Current liabilities Current related party liabilities - 19,671-19,671 19,671 Related party loans and borrowings Trade payables - 438, , ,448 Loans and borrowings - 1,780-1,780 1, ( 000) Fair value through profit or loss Loans and receivables Held to maturity Total Fair Value Non-current assets Non-current related party loans and receivables - 21,211-21,211 21,211 Financial assets measured at fair value through profit or loss Loans and receivables - 20,621-20,621 20,621 Current assets - Current related party loans assets - 58,952-58,952 58,952 Trade receivables - 604, , ,606 Financial assets measured at fair value through profit or loss - 38,496-38,496 38, ( 000) Fair value through profit or loss Amortised cost Held to maturity Total Fair Value Current liabilities Current related party liabilities - 25,247-25,247 25,247 Related party loans and borrowings - 2,500-2,500 2,500 Trade payables - 390, , ,726 Loans and borrowings - 1,628-1,628 1,628 The carrying amount of short-term financial instruments, such as trade receivables and payables, represents a fair approximation of fair value. 100
103 Ansaldo STS Annual Report 2016 Derivatives IFRS require the classification of fair value of derivatives on the basis of reference parameters that can be inferred from the market or from other financial indicators (for example: exchange rates, interest rate curve, etc.). Financial derivatives on currencies to hedge the currency risk fall within Level 2 of the hierarchy since the fair value of these instruments is determined by recalculating the present value through official fixing of closing exchange and interest rates listed on the market. The table below shows the fair values of financial instruments in portfolio. Fair value hierarchy at the reporting date Fair value at Fair value at Level 2 Level 2 Assets Currency forwards/swaps/options Trading - - Fair value hedges 4,043 3,599 Cash flow hedges 6,472 1,768 Liabilities Currency forwards/swaps/options Trading - - Fair value hedges Cash flow hedges 16,761 14,449 The group uses cash flow hedges to hedge the currency risk of highly probable future transactions and fair value hedges to hedge the exposure to currency risk of recognised assets and liabilities. With respect to derivatives hedging future cash inflows and outflows in currencies other than the functional currency, the table below shows the maturities of these cash flows, hedged in US dollars. Maturity Notional (USD 000) Notional (USD 000) Collection Payment Collection Payment Within one year 261,553 26, ,863 28,125 Between one and three years 8,627 3,458 71,857 3,899 Between three and nine years After nine years Total 270,180 30, ,720 32,
 2016 2015 Directors")
104 Consolidated Accounts Notes 3.8 Key managers remuneration Fees paid to those who have the power to plan, manage and control the group, including executive and non executive directors, are as follows: ( 000) Directors fees 5,549 4,161 Stock grants Total 5,729 4,408 Fees paid to directors, key managers and the general manager amounted to 5,729 thousand in 2016 (2015: 4,408 thousand). These amounts include fees and any other type of remuneration and social security sums due for the position of director, key manager or general manager in the parent or in other companies included in the consolidation scope, which represented a cost for the group. Costs correlated with transactions with the company s strategic figures were incorporated in A one-off financial incentive was incorporated in 2015 for those persons holding certain key roles within the group, with a view to maintaining business continuity in light of the transfer of the controlling interest in the parent s share capital. Fees include those paid to the members of the board of directors and the supervisory bodies. Statutory auditors fees pertaining to the parent amounted to 210 thousand in 2016 (2015: 210 thousand). In order to implement an incentive and loyalty scheme for the group s employees and consultants, the parent has launched incentive plans which, upon reaching set vesting conditions, provide for the awarding of Ansaldo STS shares. Shares were delivered in 2016 as the 2013 vesting conditions of the plan have a three-year term. In addition, the shares for the 2016 vesting conditions as part of the plan were accrued. 102
105 Ansaldo STS Annual Report 2016 The following table gives a breakdown of the parent s directors, statutory auditors and general managers fees: (in euros) POSITION POSITION Fees for the position held in Name and surname Position Date of appointment End of term the reporting company for 2016 Nonmonetary and other Bonuses benefits incentives Other fees paid Alistair Dormer Chairperson of the BoD Approval of 2018 financial statements 75,000 (1) Alberto de Benedictis (b) (c) (Deputy chairperson) Approval of 2018 financial statements 60,219 (2) Katrarine Rosalind Painter (a) (d) Director Approval of 2018 financial statements 60,219 (3) Andrew Thomas Barr Chief executive officer and general manager since Approval of 2018 financial statements 48,387 (4) 9, ,917* Mario Garraffo (b) (d) Director Approval of 2018 financial statements 75,355 (5) Katherine Jane Mingay Director and Deputy chairperson of the BoD until Approval of 2018 financial statements 31,694 (6) Rosa Cipriotti Director Approval of 2018 financial statements 31,694 (7) Fabio Labruna Director Approval of 2018 financial statements 31,694 (7) Giuseppe Bivona Director Approval of 2018 financial statements 31,694 (7) Karen Boswell Director since , holding the role of deputy chairperson since Approval of 2017 financial statements 18,306 (8) Garaventa Nicoletta (e) Chairperson of the supervisory body three-year term 25,000 Quagli Alberto (f) Member of the supervisory body three-year term 20,000 Sarubbi Giacinto Chairperson of the board of statutory auditors Approval of 2016 financial statements 75,000 15,000** Spinardi Maria Enrica Statutory auditor Approval of 2016 financial statements 50,000 10,000** Righetti Renato Statutory auditor Approval of 2016 financial statements 50,000 10,000** Stefano Siragusa (g) Chief executive officer and general manager until Approval of 2017 financial statements 29,462 (9) 27,534 3,447,471*** Paola Giannotti (m) Director in office until Approval of 2017 financial statements 27,459 (10) Giulio Gallazzi (h) Director in office until Approval of 2017 financial statements 25,628 (11) Alessandra Piccinino (i) Director in office until Approval of 2017 financial statements 23,798 (12) Bruno Pavesi (i) (m) Director in office until Approval of 2017 financial statements 32,951 (13) Giovanni Cavallini (l) Director in office until Approval of 2017 financial statements 29,290 (14) * fixed remuneration of 194,917 for the position of general manager and other fees for 2016 ** fees for positions on committees *** fixed remuneration of 246,470 for the position of general manager and other fees for 2016 until 13/05/2016 and 3,201,001 for termination of the employment relationship. (a) Chairperson of the appointments and remuneration committee (1) chairperson of the BoD (in office since 13/05/2016 with a new mandate) (b) Member of the appointments and remuneration committee (2) in office since 13/05/2016 BoD - ARC - chair. RCC and from 28/10/2016 dep. chair. BoD (c) Chairperson of the risk and control committee (3) in office since 13/05/2016 as member of BoD - RCC and chair. ARC (d) Member of the risk and control committee (4) since 24/05/2016 CEO (e) Chairperson of the supervisory body (5) in office since 02/11/2015 BoD and since 13/05/2016 RCC and ARC (f) Member of the supervisory body (6) BoD and deputy chair. BoD from 13/05/2016 to 28/10/2016 (g) Chief executive officer and general manager until 13/05/2016 (7) BoD since 13/05/2016 (h) Chairperson of the appointments and remuneration committee until 13/05/2016 (i) Member of the appointments and remuneration committee until 13/05/2016 (8) in office BoD from 02/11/2015 to 13/05/2016 and dep. chair. BoD since 25/11/2015 (9) CEO and general manager until 13/05/2016 (l) Chairperson of the risk and control committee until 13/05/2016 (10) BoD and RCC until 13/05/2016 (m) member of the risk and control committee until 13/05/2016 (11) BoD - chair. ARC until 13/05/2016 (12) BoD and ARC until 13/05/2016 (13) BoD - ARC and RCC until 13/05/2016 (14) BoD - chair. RCC until 13/05/2016 In euros Annual unit fees Chairperson of the board of directors 75,000 Member of the board of directors 50,000 Chairperson of the supervisory body 25,000 Member of the supervisory body 20,000 Chairperson of the appointments and remuneration committee 20,000 Member of the appointments and remuneration committee 15,000 Chairperson of the risk and control committee 30,000 Member of the risk and control committee 25,
106 Consolidated Accounts Notes 3.9 Outlook Growth in volumes is expected in 2017, while ROS should remain basically in line with the previous year Information pursuant to article 149-duodecies of consob issuer Regulation The following schedule was prepared in accordance with article 149-duodecies of Consob s Issuer regulation and shows the fees for 2016 for audit and non-audit services provided by the audit company or entities belonging to its network. Please note that on January 19, 2017, followind to the resignation of Kpmg SpA, the Shareholders meeting decided to appoint EY SpA as statutory auditor of the Company. Therefore, the services and fees presented below are only referred to the audit of the year-end separate and consolidated financial statements. ( 000) Service provider Beneficiary 2016 fees Audit KPMG S.p.A. Parent 55 KPMG S.p.A. Subsidiaries 50 EY Sp.A. Parent 136 EY Sp.A. Subsidiaries 318 Attestation services KPMG S.p.A. Parent 72 KPMG S.p.A. Subsidiaries 52 EY Sp.A. Parent - EY Sp.A. Subsidiaries - Tax consultancy services KPMG S.p.A. Parent - KPMG S.p.A. Subsidiaries - EY Sp.A. Parent - EY Sp.A. Subsidiaries - Other services KPMG S.p.A. Parent 10 KPMG S.p.A. Subsidiaries 32 EY Sp.A. Parent 40 EY Sp.A. Subsidiaries Milan, 27 February 2017 On behalf of the board of directors The Chairperson Alistair Dormer 104
107 Ansaldo STS Annual Report Statement on the consolidated financial statements pursuant to article 81-ter of CONSOB Regulation no of 14 May 1999 and subsequent amendments and integrations and article 154-bis.2 of Legislative Decree no. 58 of 24 February 1998 and subsequent amendments and integrations 1. The undersigned, Andrew Thomas Barr, as CEO and general manager, and Roberto Carassai as manager in charge of financial reporting for Ansaldo STS S.p.A., also considering the provisions of article 154-bis.3/4 of Italian Legislative decree no. 58 of 24 February 1998 and subsequent amendments and integrations, state that the administrative and accounting procedures used to draft the separate financial statements at 31 December 2016: are appropriate in relation to the nature of the business and have been effectively applied. 2. There is nothing to report in this regard. 3. Moreover: 3.1 the consolidated financial statements: a) are drafted in compliance with the IFRS endorsed by the European Community, pursuant to EC regulation no. 1606/2002 issued by the European Parliament and Council on 19 July 2002; b) are consistent with the accounting ledgers and accounting entries; c) give a true and fair view of the issuer s financial position and results of operations and the companies included in the consolidation scope The directors report provides a reliable analysis of the important events taking place in the year and the financial position and results of operations of the issuer and the companies included in the consolidation scope, together with a description of the key risks and uncertainties to which they are exposed. Milan, 27 February 2017 Signature of the CEO and general manager Andrew Thomas Barr Signature of the Manager in charge of financial reporting Roberto Carassai 105
108
109
THE BOARD OF DIRECTORS APPROVES THE CONSOLIDATED INTERIM FINANCIAL REPORT AT 30 SEPTEMBER 2016
 Milan, October 28 th 2016 THE BOARD OF DIRECTORS APPROVES THE CONSOLIDATED INTERIM FINANCIAL REPORT AT 30 SEPTEMBER 2016 Order backlog at EUR 6,443.5 million (+6.9%) New orders at EUR 996.1 million (+69.0%)
THE BOARD OF DIRECTORS APPROVES THE FIRST HALF FINANCIAL REPORT AT 30 JUNE 2016 AND REVISES GUIDANCE FOR 2016
 Milan, 27 th July 2016 THE BOARD OF DIRECTORS APPROVES THE FIRST HALF FINANCIAL REPORT AT 30 JUNE 2016 AND REVISES GUIDANCE FOR 2016 New orders at EUR 714.0 million (+53.7%) Order backlog at EUR 6,510.7
Annual Report 2017 ANSALDO STS S.p.A.
 Annual Report 2017 Overview Highlights 2017 1 Mission 3 The CEO s Report 4 Profi le Who we are and where we come from 6 Geographical Structure 8 Corporate Management Roles 11 The Business The market and
FY 2018 RESULTS ANNOUNCEMENT
 Rome, February 5, 2019 FY 2018 RESULTS ANNOUNCEMENT Strong commercial performance with orders intake at EUR 1,889.1 million (+25.9%), leading to a backlog of EUR 6,883.4 million Revenue at EUR 1,437.1
CONSOLIDATED AND DRAFT FINANCIAL STATEMENTS 2017 APPROVED, DIVIDEND PROPOSED OF EUR 0.15 PER SHARE, 2018 GUIDANCE APPROVED
 Genoa, March 14 th 2018 CONSOLIDATED AND DRAFT FINANCIAL STATEMENTS 2017 APPROVED, DIVIDEND PROPOSED OF EUR 0.15 PER SHARE, 2018 GUIDANCE APPROVED New orders of EUR 1,500.8 million (+1.7%) Order Backlog
THE BOARD OF DIRECTORS APPROVES INTERIM CONSOLIDATED REPORT AT 31 MARCH 2016
 London, May 5 th 2016 THE BOARD OF DIRECTORS APPROVES INTERIM CONSOLIDATED REPORT AT 31 MARCH 2016 The main first quarter key performance indicators, as detailed in the table below, are the following:
Connecting Pieces of Your World
 Connecting Pieces of Your World ANNUAL REPORT 2014 Overview Highlights 2014 1 Mission 3 The CEO s Report 4 Profi le Who we are and where we come from 6 Geographical Structure 8 Corporate Management Roles
Ansaldo STS S.p.A. SEPARATE FINANCIAL STATEMENTS AT 31 DECEMBER 2017
 DRAFT FINANCIAL STATEMENTS Ansaldo STS S.p.A. SEPARATE FINANCIAL STATEMENTS AT 31 DECEMBER 2017 Ansaldo STS S.p.A. Registered office: Via P. Mantovani 3-5, Genoa Paid-up share capital: 100,000,000 Genoa
THE BOARD OF DIRECTORS APPROVES THE FIRST-HALF FINANCIAL REPORT AT 30 JUNE 2013
 A Genoa, 26 July 2013 THE BOARD OF DIRECTORS APPROVES THE FIRST-HALF FINANCIAL REPORT AT 30 JUNE 2013 Revenue of EUR 583.4 million (+2.6%) EBIT at EUR 52.6 million (+4.0%) Net profit at EUR 32.4 million
APPROVED THE CONSOLIDATED INTERIM FINANCIAL REPORT AT 30 SEPTEMBER 2018 GUIDANCE FOR THE 15 MONTHS PERIOD (JANUARY 2018 MARCH 2019) APPROVED
 APPROVED") Rome, October 30, 2018 APPROVED THE CONSOLIDATED INTERIM FINANCIAL REPORT AT 30 SEPTEMBER 2018 GUIDANCE FOR THE 15 MONTHS PERIOD (JANUARY 2018 MARCH 2019) APPROVED New orders at EUR 630.3 million (-31.1%)
Rome, October 30, 2018 APPROVED THE CONSOLIDATED INTERIM FINANCIAL REPORT AT 30 SEPTEMBER 2018 GUIDANCE FOR THE 15 MONTHS PERIOD (JANUARY 2018 MARCH 2019) APPROVED New orders at EUR 630.3 million (-31.1%)
THE BOARD OF DIRECTORS APPROVES INTERIM CONSOLIDATED REPORT AT 31 MARCH 2017
 Milan, April 28 th 2017 THE BOARD OF DIRECTORS APPROVES INTERIM CONSOLIDATED REPORT AT 31 MARCH 2017 Order backlog at EUR 6,454.0 million (+0.6%); New Orders acquired in the period at EUR 266.1 million
CONSOLIDATED AND DRAFT FINANCIAL
 A Genoa March 5 th, 2013 CONSOLIDATED AND DRAFT FINANCIAL STATEMENTS 2012 APPROVED, DIVIDEND PROPOSED, GUIDANCE 2013, THE CHAIRMAN RESIGNED FROM THE BOARD OF DIRECTORS Consolidated and draft financial
THE BOARD APPROVES THE RESULTS AT 30 SEPTEMBER 2012
 A Milan, 29 October 2012 THE BOARD APPROVES THE RESULTS AT 30 SEPTEMBER 2012 Revenues of EUR 873.5 million (+3.8%) EBIT at EUR 77.6 million (+0.6%) Profit for the period at EUR 45.6 million (-6.6%) New
THE BOARD APPROVES THE RESULTS TO 30 SEPTEMBER 2010
 Rome, 2 November 2010 THE BOARD APPROVES THE RESULTS TO 30 SEPTEMBER 2010 Results for the first nine months: o Value of production at EUR 879.5 million (+6.3%) o EBIT at EUR 87 million (+1.6%) o Net profit
Connecting Pieces of Your World
 Connecting Pieces of Your World CONSOLIDATED INTERIM FINANCIAL REPORT AT 30 SEPTEMBER 2015 Contents Directors report at 30 september 2015 2 Introduction 2 Key performance indicators 2 Non-IFRS alternative
CONSOLIDATED FINANCIAL STATEMENTS OF THE ANSALDO STS GROUP AT 31 DECEMBER 2017
 CONSOLIDATED FINANCIAL STATEMENTS OF THE ANSALDO STS GROUP AT 31 DECEMBER 2017 ANSALDO STS S.p.A. Registered office: Via P. Mantovani 3-5, Genoa Paid-up share capital: 100,000,000 Genoa company registration
3.1 Notes to the Consolidated Financial Statements at 31 December 2012
 Consolidated Accounts Notes 3. Notes 3.1 Notes to the Consolidated Financial Statements at 31 December 2012 3.1.1 General information Ansaldo STS is a company limited by shares with its registered office
ANSALDO STS, SECOND QUARTER 2006: ORDERS, PROFITABILITY AND CASH FLOW CONTINUE TO RISE
 Genoa, 2 nd August 2006 ANSALDO STS, SECOND QUARTER 2006: ORDERS, PROFITABILITY AND CASH FLOW CONTINUE TO RISE Value of production rises to EUR 236 million (+12% compared with the same period of 2005)
Excellent results for Alstom in the first half 2018/19
 PRESS RELEASE Excellent results for Alstom in the first half 2018/19 Strong commercial momentum with 7 billion orders, leading to a new record-breaking backlog of 38 billion Outstanding operational performance
Ansaldo STS S.p.A ANNUAL REPORT
 (Translation from the Italian original which remains the definitive version) Draft financial statements Ansaldo STS S.p.A. 2015 ANNUAL REPORT Ansaldo STS S.p.A. Registered office: Via P. Mantovani 3-5,
3.1 Notes to the consolidated financial statements at 31 December 2013
 Consolidated Accounts Notes 3. Notes 3.1 Notes to the consolidated financial statements at 31 December 2013 3.1.1 General information Ansaldo STS is a company limited by shares with its registered office
Year End 2009 Results. Milan - 2 th March 2010 Analyst Conference
 Year End 2009 Results Year 2010 Guidance Milan - 2 th March 2010 Analyst Conference YE 2009 Results Key Data million YE YE % mil 2009 2008 change Orders 1,786.0 1,296.6 37.7% Backlog 3,759.7 3,136.4 19.9%
THE BOARD OF DIRECTORS OF ANSALDO STS APPROVES PRELIMINARY RESULTS AT 31 DECEMBER 2006
 Genoa, 14 th February 2007 THE BOARD OF DIRECTORS OF ANSALDO STS APPROVES PRELIMINARY RESULTS AT 31 DECEMBER NET PROFIT : +18.7% TO EUR 45.8 MILLION, NET OF LISTING COSTS FOR EUR 6.8 MILLION, IN VALUE
Consolidated Annual Report at 31 December 2011
 CONSOLIDATED ANNUAL REPORT AT 31 DECEMBER 2011 Consolidated Annual Report at 31 December 2011 This Consolidated Annual Report 2011 has been translated into English solely for the convenience of the international
Connecting Pieces of Your World 2014 ANNUAL REPORT ANSALDO STS GROUP
 Connecting Pieces of Your World 2014 ANNUAL REPORT ANSALDO STS GROUP 2014 Annual Report Ansaldo STS Group (Translation from the Italian original which remains the definitive version) Contents 1 Company
Board of Directors approves first-half results and updates 2010 guidance
 Rome, 27 July 2010 Board of Directors approves first-half results and updates 2010 guidance Value of production: EUR 584.7 million (+6.8%) EBIT: EUR 57.7 million (+1.6%) Net profit: EUR 33.4 million (-10.9%)
DIRECTORS REPORT PART I
 DIRECTORS REPORT PART I Directors Report Financial highlights 24 ANNUAL REPORT 2017 The following tables show the Group s adjusted key financial indicators for 2017 compared to the previous year. Adjustments
Future Fibre Technologies Limited ACN and controlled entities
 Future Fibre Technologies Limited ACN 064 089 318 and controlled entities Appendix 4E Preliminary Final Report For the year ended 30 June 2017 Lodged with the ASX under Listing Rule 4.3A FUTURE FIBRE TECHNOLOGIES
Alstom 2016/17 results
 PRESS RELEASE Alstom 2016/17 results 10 billion order intake leading to a record backlog of 34.8 billion 7.3 billion sales up 6% Adjusted EBIT at 421 million up 15% Positive free cash flow at 182 million
CEF funding for ERTMS deployment in the post-2020 Multiannual Financial Framework
 CEF funding for ERTMS deployment in the post-2020 Multiannual Financial Framework April 2018 1 P a g e About UNIFE Based in Brussels since 1992, UNIFE is the association representing the European rail
Interim Results 2008/2009. Significant events Financial statements Strategy and outlook
 Interim Results 2008/2009 Significant events Financial statements Strategy and outlook Key figures 1 st semester 2008/2009 Change from 1 st semester 2007/2008 Sales 383.7M + 21.3% Percentage of sales outside
FINANCIAL STATEMENTS. Financial statements
 FINANCIAL STATEMENTS CONTENTS GROUP ACCOUNTS Preparation 102 Consolidated Income Statement 104 Consolidated Statement of Comprehensive Income 105 Consolidated Statement of Changes in Equity 105 Consolidated
Reports of Management. Statement of Management s Responsibility. Management s Report on Internal Control Over Financial Reporting
 Reports of Management Statement of Management s Responsibility Cisco s management has always assumed full accountability for maintaining compliance with our established financial accounting policies and
STOCK GRANT PLAN ANSALDO STS S.P.A.
 INFORMATIVE DOCUMENT Pursuant to art. 84-bis, para. 1, of the Regulation adopted by Consob by effect of Resolution no. 11971 of May 14, 1999, as amended and integrated, relevant to the STOCK GRANT PLAN
List of companies consolidated on a line-by-line basis
 Notes to the Consolidated Financial Statements at 31 December 2011 Form, content and applicable accounting standards 11.2.1 Accounting policies adopted Standards and scope of consolidation These Consolidated
Order book at 30 September 1, , %
 Press release of 26 November 2015 FAIVELEY TRANSPORT ANNOUNCES ITS 2015/16 HALF-YEAR RESULTS: SALES GROWTH: 9.5% ADJUSTED GROUP OPERATING PROFIT (a) UP 9.5% SIGNIFICANT INCREASE IN FREE CASH FLOW ANNUAL
Summary Financial Information Year Ended December 2003
 Summary Financial Information Year Ended December 2003 ABB Ltd Summary Consolidated Income Statements 2003 2002 2003 2002 (audited) (audited) (unaudited) (unaudited) (in millions, except per share data)
Investors Conference HSBC SRI Conference. February 7, 2017, Frankfurt. Driving transformation. Shaping the future.
 Investors Conference HSBC SRI Conference February 7, 2017, Frankfurt Driving transformation. Shaping the future. Disclaimer Note: This presentation contains statements concerning the future business trend
THE BOARD OF DIRECTORS OF ASTALDI APPROVES A SHARE CAPITAL INCREASE UP TO A MAXIMUM OF EUR 300 MILLION AND CALLS THE SHAREHOLDERS MEETING
 THE BOARD OF DIRECTORS OF ASTALDI APPROVES A SHARE CAPITAL INCREASE UP TO A MAXIMUM OF EUR 300 MILLION AND CALLS THE SHAREHOLDERS MEETING 2018-2022 STRATEGIC PLAN AND CONSOLIDATED RESULTS OF Q1 2018 ALSO
Q1 Q Q3 Q EUR million Jan-Mar 2018 Jan-Mar 2017 Change, % EUR million Jan-Dec 2017
 Stockholm, Sweden, 4 May Eltel Group Interim report January March January March Group net sales decreased 10.5% to EUR 266.6 million (297.8), mainly as a result of divestments and on-going discontinuation
Scania Year-end Report January-December 2017
 20 March 2018 Scania Year-end Report January-December 2017 Summary of the full year 2017 Operating income, excluding items affecting comparability, amounted to SEK 12,434 m. (10,124) Operating income,
The Supervisory Board approved on 27 May 2014 the financial statements for the year ended 31 March Order book 1, ,
 Press Release of 30 May 2014 FAIVELEY TRANSPORT ANNOUNCES ITS 2013/2014 ANNUAL RESULTS Gennevilliers, 30 May 2014 The Supervisory Board approved on 27 May 2014 the financial statements for the year ended
Signalling and Transportation Solutions Annual Report Lead With Values. Innovation and Excellence. Customer Focus
 Signalling and Transportation Solutions Annual Report 2009 Lead With Values Team Spirit Innovation and Excellence People Integrity Customer Focus OVERVIEW Highlights 2009 1 Mission 3 CEO s Report 5 GROUP
European Bank for Reconstruction and Development. The ETC Local Currency Risk Sharing Special Fund
 European Bank for Reconstruction and Development The ETC Local Currency Risk Sharing Special Fund Annual Financial Report 31 December 2014 Contents Income statement... 1 Statement of comprehensive income...
Pinsent Masons in Spain
 Pinsent Masons in Spain Pinsent Masons in Spain Pinsent Masons is a sector focussed global law firm. Our strategy is to invest in geographies that connect our clients to where they want to do business.
Rakon Limited Preliminary Financial Statements FY2017
 Rakon Limited Preliminary Financial Statements FY2017 Table of Contents Table of Contents 1 Directors Report 2 Statement of Comprehensive Income 3 Statement of Changes in Equity 4 Balance Sheet 5 Statement
INTERIM REPORT Summary HY Zwolle 02 nd August 2018 INTERIM REPORT 2018
 Martin Sallenhag, CEO Reinhard Pusch, COO Arvid Ladega, CFO RoodMicrotec N.V. Rembrandt ; Dokter van Deenweg 58 NL 8025 BC Zwolle +31 38 4215216 @ investor relations@roodmicrotec.com www.roodmicrotec.com
Fitter for the Future Strategic Update
 Fitter for the Future Strategic Update 2017-21 Chairman s remarks Global strategic overview Significant market opportunity Basarab Overpass in Bucharest, Romania Naples underground (Toledo Station), Italy
Half year financial report
 Half year financial report Six-month period ended June 30, 2016 Condensed Consolidated Financial Statements Management Report CEO Attestation Statutory Auditors Review Report Table of contents Condensed
Alstom Q1 2017/18 orders and sales. Order intake of 1.9 billion Sales of 1.9 billion with organic growth at 5% 2020 objectives confirmed
 PRESS RELEASE Alstom Q1 2017/18 orders and sales Order intake of 1.9 billion Sales of 1.9 billion with organic growth at 5% 2020 objectives confirmed 13 July 2017 Over the first quarter 2017/18 (from 1
THE BOARD APPROVES THIRD QUARTER RESULTS
 Genoa, 11 November THE BOARD APPROVES THIRD QUARTER RESULTS Growth trend continues in the first nine months: o Net profit at EUR 50 million (+36.2%); o EBIT at EUR 79 million (+ 26.2%), EBIT margin up
October 27, Interim Report III
 October 27, 26 Interim Report III January September 26 2 BUSINESS GROUPS The Pöyry Group s net sales for the period under review were EUR 45.9 million (378.3 million in the same period 25). Profit before
FINAL RESULTS ANNOUNCEMENT FOR THE YEAR ENDED 31 MARCH 2010 FINANCIAL HIGHLIGHTS. Own stores number reached 764, increased by 11.
 Hong Kong Exchanges and Clearing Limited and The Stock Exchange of Hong Kong Limited take no responsibility for the contents of this announcement, make no representation as to its accuracy or completeness
Management s Discussion and Analysis
 Management s Discussion and Analysis First Quarter of 2017 versus First Quarter of 2016 May 3, 2017 All financial information in Canadian dollars, unless otherwise indicated. Table of Contents 1 Our Business
Creation of a global leader in Mobility. 27 September 2017
 Creation of a global leader in Mobility 27 September 2017 Disclaimer No Offer This communication does not constitute or form any part of an offer to exchange or purchase, or solicitation of an offer to
ANSALDO STS S.p.A. REPORT BY THE BOARD OF AUDITORS. To the Meeting of the Shareholders of Ansaldo STS SpA
 ANSALDO STS S.p.A. REGISTERED OFFICE AT VIA PAOLO MANTOVANI 3/5, GENOA FULLY SUBSCRIBED AND PAID UP COMPANY CAPITAL 50,000,000.00 EUROS GENOA COMPANY REGISTER NO. AND TAX CODE 01371160662 SUBJECT TO MANAGEMENT
Solid underlying development in the fourth quarter
 Interim Report Q4 2016 Full-year summary 2016 2 February 2017 The global leader in door opening solutions Solid underlying development in the fourth quarter Fourth quarter Sales increased by 6% to SEK
Interim Report. Third Quarter and First Nine Months of Fiscal siemens.com/answers
 Interim Report Third Quarter and First Nine Months of Fiscal 2013 siemens.com/answers Table of contents key figures 1 2 Key figures 4 Interim group management report 26 Condensed Interim Consolidated Financial
INTERIM REPORT FOR THE THREE MONTHS ENDED 31 MARCH 2018
 INTERIM REPORT FOR THE THREE MONTHS ENDED 31 MARCH 2018 Registered office in Via della Valle dei Fontanili 29/37 00168 Rome, Italy Share capital: 1,084,200.00 fully paid-in Rome Companies Register, Tax
Connecting Pieces of Your World
 Connecting Pieces of Your World CONSOLIDATED INTERIM FINANCIAL REPORT AT 30 JUNE 2015 Consolidated Interim Financial Report at 30 June 2015 (Translation from the Italian original which remains the defi
INTERIM REPORT ON OPERATIONS AT 31 MARCH Astaldi, consolidated net profit up by 14%
 INTERIM REPORT ON OPERATIONS AT 31 MARCH 2010 1 Astaldi, consolidated net profit up by 14% Total revenues up by 6.9% to EUR 460.7 million EBITDA: +10.5% to EUR 51.8 million, with the EBITDA margin up to
Apolus Holding AB is owned by Apolus Holdco S.a.r.l., Luxemburg (B ) and the principal owner is Triton Fund II LP (reg.nr LP701), Jersey.
 and the principal owner is Triton Fund II LP (reg.nr LP701), Jersey.") The Board of Directors Apolus Holding AB Org nr 556714-1725 hereby submits the Annual accounts and consolidated accounts for the financial year 1 January - 31 December 2011 Administration report 3 (33)
The Board of Directors Apolus Holding AB Org nr 556714-1725 hereby submits the Annual accounts and consolidated accounts for the financial year 1 January - 31 December 2011 Administration report 3 (33)
PRESS RELEASE ACOTEL GROUP: interim report for three months ended 30 September 2013.
 PRESS RELEASE ACOTEL GROUP: interim report for three months ended 30 September 2013. Consolidated results for 9M 2013: Revenue 90.1 million ( 72.9 million in 9M 2012) Negative EBITDA 2 million (positive
Scania Interim Report January June 2007
 26 July Scania Interim Report January June Scania reports strong volume and revenue growth Order bookings continue to be strong, up 39 percent in the first six months Sharp increase in earnings, operating
ANNOUNCEMENT OF INTERIM RESULTS FOR THE SIX MONTHS ENDED 30 JUNE 2009 SUSPENSION OF STOCK APPRECIATION RIGHTS PROGRAM
 Hong Kong Exchanges and Clearing Limited and The Stock Exchange of Hong Kong Limited take no responsibility for the contents of this announcement, make no representation as to its accuracy or completeness
Financial statements. Group accounting policies Accounting policies are included within the relevant note to the Group accounts.
 BAE Systems Annual Report 121 Financial statements Group accounts Preparation 122 Consolidated income statement 124 Consolidated statement of comprehensive income 125 Consolidated statement of changes
Roadshow Kepler Cheuvreux. November 7, 2016, London. Driving transformation. Shaping the future.
 Roadshow Kepler Cheuvreux November 7, 2016, London Driving transformation. Shaping the future. Disclaimer Note: This presentation contains statements concerning the future business trend of the Vossloh
Alstom 2017/18 results
 PRESS RELEASE Alstom 2017/18 results Sales at 8bn with an outstanding growth of 9% (10% organically) Continued profitability improvement with an adjusted EBIT margin reaching 6.5% Positive free cash flow
(Translation from the Italian original which remains the definitive version)
") (Translation from the Italian original which remains the definitive version) DRAFT 2015 FINANCIAL STATEMENTS EVENTS AFTER THE REPORTING DATE GOING CONCERN OUTLOOK FOR 2016 ANNUAL REPORT ON CORPORATE GOVERNANCE
(Translation from the Italian original which remains the definitive version) DRAFT 2015 FINANCIAL STATEMENTS EVENTS AFTER THE REPORTING DATE GOING CONCERN OUTLOOK FOR 2016 ANNUAL REPORT ON CORPORATE GOVERNANCE
2012/2013 ANNUAL RESULTS
 2012/2013 ANNUAL RESULTS 2012/2013 KEY FACTS 2 2012/13: HIGHLIGHTS Solid order intake in target regions (Europe, China, Russia) A less active global market in 2012 Historic entry into high speed in China
Quarterly Report Q1 2018
 Quarterly Report Q1 2018 26 April 2018 The global leader in door opening solutions A good start to the year First quarter Net sales increased by 2% to SEK 18,550 M (18,142), with organic growth of 4% (6)
Rakon Limited. Annual Report 2018
 Rakon Limited Annual Report 2018 Table of Contents Directors Report 3 Statement of Comprehensive Income 4 Statement of Changes in Equity 5 Balance Sheet 6 Statement of Cash Flows 7 Notes to the Financial
Interim Report. Second Quarter and First Half of Fiscal siemens.com/answers
 Interim Report Second Quarter and First Half of Fiscal 2013 siemens.com/answers Table of contents key figures 1 2 Key figures 4 Interim group management report 26 Condensed Interim 32 Notes to Condensed
Statements Chapter 5 CHAPTER 5 STATEMENTS I. FINANCIAL STATEMENTS 71 II. CORPORATE RESPONSIBILTY STATEMENTS 141
 CHAPTER 5 STATEMENTS I. FINANCIAL STATEMENTS 71 II. CORPORATE RESPONSIBILTY STATEMENTS 141 70 I. FINANCIAL STATEMENTS Consolidated statement of financial position 72 Consolidated income statement 73 Consolidated
Economic Stimulus Packages and Steel: A Summary
 Economic Stimulus Packages and Steel: A Summary Steel Committee Meeting 8-9 June 2009 Sources of information on stimulus packages Questionnaire to Steel Committee members, full participants and observers
SCANFIL GROUP S INTERIM REPORT 1 JANUARY 30 SEPTEMBER 2015
 SCANFIL GROUP S INTERIM REPORT 1 JANUARY 30 SEPTEMBER 2015 28 OCTOBER 2015 9.50 A.M. July September - Turnover totalled EUR 135.8 million (Q3 2014: 56.7), up to 140.0% - Operating profit EUR 5.2 million
Management s Responsibility for Financial Reporting
 Management s Responsibility for Financial Reporting The accompanying audited consolidated financial statements ( financial statements ) of SNC-Lavalin Group Inc. and all the information in this financial
At its meeting of 27 May 2015, the Supervisory Board reviewed and approved the financial statements for the 2014/15 financial year.
 Press release of 28 May 2015 Gennevilliers, 28 May 2015 FAIVELEY TRANSPORT ANNOUNCES ITS 2014/15 FULL-YEAR RESULTS STRONG GROWTH IN ORDER BOOK: UP 13% SALES EXCEED 1 BILLION MARK FOR THE FIRST TIME, REACHING
Cavotec 4th Quarter Report 2013 and full year 2013 summary
 Cavotec 4th Quarter Report and full year summary Cavotec 4th Quarter Report and full year summary Order Intake increased 5.8% quarter on quarter at EUR 64,645 thousands (4Q12: 61,113). Revenues amounted
This presentation is being distributed to professional investors only and may not be reproduced, redistributed or published in whole or in part.
 2009 Annual Results Disclaimer This document has been prepared by Vianini Lavori S.p.A. for information purposes only and it is not intended as an offer or solicitation of an offer to purchase or sell
P R E S S R E L E A S E
 P R E S S R E L E A S E from ASSA ABLOY AB (publ) 27 April 2005 No. 8/05 STRONG GROWTH IN USA BUT WEAKER IN EUROPE FOR ASSA ABLOY Sales for the first quarter of 2005 increased organically by 2% to SEK
Consolidated condensed interim financial statements. Balta Group NV. Period Ended June 30, Balta Group NV
 Balta Group NV Consolidated condensed interim financial statements Period Ended June 30, 2017 Balta Group NV Registered office: Wakkensteenweg 2, 8710 Sint-Baafs-Vijve, Belgium Registration number: 0671.974.626
Risk category Category description Risk appetite
 V. RISK MANAGEMENT Doing business inherently involves taking risks. By managing these risks, TNT strives to secure a sustainable performance. Therefore, TNT operates a risk management framework that allows
Interim Report January June 2018
 Interim Report January e APRIL JUNE > Net sales increased by 11 per cent to SEK 415.8 million (376.1). In USD terms, net sales increased by 14 per cent. > Order intake increased by 11 per cent to SEK 409.6
Scania Interim Report January September 2017
 30 October 2017 Scania Interim Report January September 2017 Summary of the first nine months of 2017 Operating income, excluding items affecting comparability, amounted to SEK 9,080 m. (7,492) Operating
Scania Interim Report January-March 2017
 5 May 2017 Scania Interim Report January-March 2017 Summary of the first three months of 2017 Operating income rose by 35 percent to SEK 3,081 m. (2,275) Net sales increased by 23 percent to SEK 28,411
Alstom Presentation. Henri Poupart-Lafarge, Chairman & CEO. JP Morgan Cazenove European Capital Goods CEO Conference, 16 June 2017
 Alstom Presentation Henri Poupart-Lafarge, Chairman & CEO JP Morgan Cazenove European Capital Goods CEO Conference, 16 June 2017 Disclaimer This presentation contains forward-looking statements which are
Consolidated financial statements Year ended 31 March 2018
 Consolidated financial statements Year ended 31 March 2018 1/77 CONSOLIDATED INCOME STATEMENT Year ended (in million) Note 31 March 2018 31 March 2017 Sales (3) 7,951 7,306 Cost of sales (6,686) (6,171)
Consolidated financial statements Year ended 31 March 2017
 Consolidated financial statements Year ended 31 March 2017 1/76 CONSOLIDATED INCOME STATEMENT * includes the reclassification of sustaining costs from Cost of Sales to Research and Development for (29)
FORM 6-K. CGG (Translation of registrant s name into English)
") UNITED STATES SECURITIES AND EXCHANGE COMMISSION Washington, D.C. 20549 FORM 6-K REPORT OF FOREIGN PRIVATE ISSUER PURSUANT TO RULE 13a-16 OR 15d-16 OF THE SECURITIES EXCHANGE ACT OF 1934 For the month
UNITED STATES SECURITIES AND EXCHANGE COMMISSION Washington, D.C. 20549 FORM 6-K REPORT OF FOREIGN PRIVATE ISSUER PURSUANT TO RULE 13a-16 OR 15d-16 OF THE SECURITIES EXCHANGE ACT OF 1934 For the month
A good start to the year
 1 A good start to the year 28 April 2011 No. 17/11 Sales totaled SEK 8,699 M (8,345), representing an increase of 4%, made up of 6% organic growth, 7% acquired growth and exchange-rate effects of 9%. Strong
January-September 2016
 January-September Third Quarter Like-for-like ( L/L ) RevPAR for leased and managed hotels was up by 5.3%. The growth is mainly due to an increase in average room rate. Revenue decreased by 3.9% to 251.3
Interim report May July 2013/14
 September 3, 2013 Interim report May July 2013/14 Order bookings decreased 2* percent to SEK 2,027 M (2,252). Net sales increased 21* percent to SEK 1,912 M (1,695). EBITA amounted to SEK 148 M (131) before
Interim report January March 2018
 Handicare Group AB (publ) Ingmar Bergmans gata 4 SE-114 34 Stockholm, Sweden Tel: +46 8 523 281 00 Corp. Reg. No.: 556982-7115 www.handicaregroup.com Interim report January March 2018 Continued organic
Monetary figures in the financial statements are expressed in millions of euros unless otherwise stated.
 Notes to the consolidated financial statements General information Orion Corporation is a Finnish public limited liability company domiciled in Espoo, Finland, and registered at Orionintie 1, FI-02200
MANAGEMENT S DISCUSSION AND ANALYSIS
 MANAGEMENT S DISCUSSION AND ANALYSIS Q1 2017 February 1, 2017 Basis of Presentation This Management s Discussion and Analysis of the Financial Position and Results of Operations ( MD&A ) is the responsibility
Scania Interim Report January June 2017
 28 July 2017 Scania Interim Report January June 2017 Summary of the first six months of 2017 Operating income rose to SEK 6,464 m. (1,316) Operating income, excluding items affecting comparability, amounts
2010 TNT EXPRESS. Other information 94
 Chapter 5 Combined Financial statements Combined statement of financial position 32 Combined income statement 33 Combined statement of comprehensive income 33 Combined statement of cash flows 34 Combined
EDP Renováveis, S.A. Condensed Consolidated Financial Statements 30 June 2012
 EDP Renováveis, S.A. Condensed Consolidated Financial Statements 30 June 2012 EDP Renováveis, S.A. and subsidiaries Condensed Consolidated Income Statement for the six months period ended 30 June 2012
INTERIM REPORT FOR THE SIX MONTHS ENDED 30 JUNE FDM Group (Holdings) plc
 plc") INTERIM REPORT FOR THE SIX MONTHS ENDED 30 JUNE Highlights Financial 30 June 30 June % change Revenue 117.1m 86.5m +35.4% Mountie revenue 100.8m 76.7m +31.4% Adjusted operating profit 1 22.4m 16.6m +34.9%
INTERIM REPORT FOR THE SIX MONTHS ENDED 30 JUNE Highlights Financial 30 June 30 June % change Revenue 117.1m 86.5m +35.4% Mountie revenue 100.8m 76.7m +31.4% Adjusted operating profit 1 22.4m 16.6m +34.9%