Refreshing business Integrated Annual Report
|
|
|
- Garry Stone
- 6 years ago
- Views:
Transcription

1 Refreshing business 2015 Integrated Annual Report
2 About us 2015 has been an important year for us. We are pleased to have achieved strong results, with volume growth and a significant improvement in margins. We have proven that we are resilient when operating in difficult markets and demonstrated good progress across all our operations. We launched a number of initiatives and adapted the way we operate to create a leaner and a more efficient business. Please read our 2015 Integrated Annual Report and see how we refreshed our business across different markets and returned to growth while maintaining our commitment to sustainability throughout our activities. Contents Strategic Report Highlights 2 Coca-Cola HBC at a glance 3 Our investment case 4 Chairman s Statement 6 Market review 8 Business model 10 Chief Executive Officer s review 12 Play to Win strategic framework 14 Our strategy and KPIs 16 Managing our material issues 24 Established markets 28 Developing markets 32 Emerging markets 36 People 39 Community trust 43 Consumer relevance 45 Customer preference 47 Cost leadership 51 Financial review 55 Risk management Corporate Governance 62 Board of directors 66 Corporate governance report 86 Directors Remuneration Report 104 Statement of Directors Responsibilities About our report The 2015 Integrated Annual Report (the Annual Report ) consolidates Coca-Cola HBC AG s (also referred to as Coca-Cola HBC or the Company or the Group ) UK and Swiss disclosure requirements, while meeting the disclosure requirements for its secondary listing on the Athens Exchange. In addition, the Annual Report aims to deliver against the expectations of the Company s stakeholders and sustainability reporting standards, providing a transparent overview of the Group s performance and progress in sustainable development for Our Play to Win strategic framework serves as the narrative structure of the Annual Report, demonstrating the value this business strategy is creating. The four pillars of our strategy Community Trust, Consumer Relevance, Customer Preference and Cost Leadership combined with our People initiatives, frame the discussion of our activities during The Annual Report is for the year ended 31 December 2015, and its focus is on the primary core business of non-alcoholic ready-to-drink beverages across the 28 countries in which we operate. Our website and any other website referred to in the Annual Report are not incorporated by reference and do not form part of the Annual Report. The consolidated financial statements of the Group, included on pages , have been prepared in accordance with International Financial Reporting Standards (IFRS) as issued by the International Accounting Standards Board (IASB). Coca-Cola HBC AG s statutory financial statements, included on pages , have been prepared in accordance with the Swiss Code of Obligations. Unless otherwise indicated or required by context, all financial information contained in this document has been prepared in accordance with IFRS. For Swiss law purposes, the annual management report consists of the sections Strategic Report, Corporate Governance (without the sub-section Director s Remuneration report ), Supplementary Information and Glossary. Comparable indicators exclude the impact of restructuring, the unrealised impact from the mark-to-market valuation of commodity hedges and specific non-recurring items. For a reconciliation of comparable financial indicators to the respective IFRS financial indicators, see page 54. The sustainability aspects of this Annual Report comply with the AA1000AS Assurance Standard, the Global Reporting Initiative (in accordance with GRI G4 Comprehensive) standards and the advanced level requirements for communication on progress against the 10 Principles of the United Nations Global Compact. In addition, it is aligned with the principles and elements of the International Integrated Reporting Council s (IIRC) framework and the Climate Change Reporting Framework (CDSB). Carbon emissions are calculated by using the GHG Protocol Corporate Accounting and Reporting Standard methodology, and have been verified by an independent organisation. We remain committed to strong corporate governance and leadership as well as transparency in our disclosures. We will continue to review our reporting approach and routines, to ensure they meet best practice reporting standards, the expectations of our stakeholders and maintain the visibility on how we create sustainable value for the communities we serve. Financial Statements 105 Independent Auditor s report 106 Financial statements 112 Notes to the Financial statements Supplementary Information 164 CSR assurance statement 166 GRI Indicators list 189 UN Global Compact Communicating our progress 196 Shareholder information Swiss Statutory Reporting 198 Report of the statutory auditor on Coca-Cola HBC AG s consolidated financial statements 199 Report of the statutory auditor on Coca-Cola HBC AG s financial statements 200 Coca-Cola HBC AG s financial statements 209 Report of the statutory auditor on the Statutory Remuneration Report 210 Statutory Remuneration Report Glossary More information online at


 6,346 2014: 6,510 FX-neutral net sales revenue per unit case ( ) 3.09 2014: 3.")
3 Strategic Report Corporate Governance Financial Statements Supplementary Info & Swiss Statutory Reporting Refreshing business 2015 was a year of strong results and achievements. Everyone at Coca-Cola HBC has contributed to refreshing the business and bringing the Company back to growth. Chairman s statement p4 From the retiring Chairman Chief Executive Officer s review p10 Execution focus delivers strong volume growth and margin expansion Financial review p51 Improved financial performance reflects disciplined focus on managing costs and risks Market review p6 How we are addressing the trends we are seeing Strategy and KPIs p12 Our vision is to be the undisputed beverage leader in every market in which we operate Business resilience: Managing our risks and opportunities p55 Includes the Viability statement Key highlights for the year Volume (m unit cases) 2, : 2,003 Net sales revenue ( m) 6, : 6,510 FX-neutral net sales revenue per unit case ( ) : 3.08 EBIT ( m) : 361 Comparable EBIT ( m) : 425 Net profit ( m) : 295 Comparable net profit ( m) : 277 Comparable earnings per share ( ) : Volume growth was strong in the year with the Established markets segment growing for the first time in five years, growth in all countries in the Developing segment and Nigeria, Romania and Ukraine supporting growth in the Emerging segment Comparable EPS increased by 13.5% to 0.864, even though reported EPS declined by 4.7% to due to the inclusion of a one-off gain from a disposal in the prior year s profits The Board of Directors proposes a 0.40 dividend per share, an 11.1% uplift on the 2014 dividend 2.6% 13.5% 0.40 Comparable indicators exclude the impact of restructuring, the unrealised impact from the mark-to-market valuation of commodity hedges and specific non-recurring items. For a reconciliation of comparable financial indicators to the respective GAAP financial indicators, please see page 54. 1
4 Coca-Cola HBC at a glance Given our fundamental strengths strong sales and execution capability, market leadership, attractive geographic diversity, global brands and diverse beverage portfolio we are well-positioned to satisfy evolving consumer preferences and create sustainable value over the long term. Our business segments We have the most diversified territory in the Coca-Cola System. No single country dominates our portfolio. We manage and report on our business using three segments: Established, Developing and Emerging markets. Business segment volume breakdown See more about our markets on pages Established markets High net sales revenue per case Return to volume growth after several years of decline Opportunity to increase per capita consumption of sparkling drinks, particularly in Italy and Greece Production and logistics optimisation mostly completed Net sales revenue 2,486m See how we are refreshing our business in our Established markets region on pages Developing markets Improving profitability Relatively low consumption of sparkling drinks per capita Changing retail landscape Production and logistics optimisation mostly completed Net sales revenue 1,092m See how we are refreshing our business in our Developing markets region on pages Established markets: 30% Developing markets: 19% Emerging markets: 51% Emerging markets Low consumption of sparkling drinks per capita Excellent demographic dynamics, with young and growing populations Low GDP per capita, leading to affordability concerns Opportunity for further optimisation of production and logistics Net sales revenue 2,769m See how we are refreshing our business in our Emerging markets region on pages
5 Strategic Report Corporate Governance Financial Statements Supplementary Info & Swiss Statutory Reporting Our investment case A leading bottler We are a leading bottler of the brands of The Coca-Cola Company with sales of more than 2 billion unit cases, or 50 billion servings, annually. We have operations in 28 countries spanning three continents, reaching 594 million people. We manage our business responsibly, sustainably, and with a passion for creating value for our customers, our shareholders and the consumers and communities we serve. The opportunity we see is superior business growth, particularly through our presence in fast-growing emerging markets, coupled with expanding margins to those achieved in the years before the global financial crisis. Continents 3 Leading brands and a diverse portfolio of beverages We produce, sell and distribute the world s most recognised beverage brands. Coca-Cola, Coke Zero, Coca-Cola Light, Sprite and Fanta are some of the world s best-selling non-alcoholic ready-to-drink beverages. Our overall sparkling volume share in our markets is 40%. The strength of our portfolio of sparkling drinks is complemented by a still drinks portfolio which has grown to 31% of our volume. This combination is quite unique in the bottling landscape. Xxxxxx xx Countries 28 Population reached 594m 1. Sparkling beverages: 62% 2. Low- and no-calorie sparkling beverages: 7% 3. Water: 19% 4. Juice: 7% 5. RTD tea: 4% 6. Energy drinks: 1% See more about consumer and industry trends on page 6. Capability to execute in the market Building and maintaining a successful partnership with our customers is critical to our success. By working with our customers to satisfy consumer needs and maximise demand for our products, we help grow their business and ours. We start by segmenting the market and determining the most efficient and effective way to service each and every outlet. With each customer, we seek to generate joint value in every aspect of our business, ranging from logistics and delivery to marketplace execution and sustainability programmes. In-store execution is critical; having the right product placement and display at the point of sale is the focus of every market developer every day. See more about how this adds value on page 46. A sustainable business We recognise that creating shared value for shareholders, employees, consumers, customers and communities is critical to our long-term success. Over the last decade, we have integrated corporate responsibility and sustainability into all aspects of business management, making long-term investments that aim to build value over time. More recently, we established a business resilience programme that enhances our approach to risk management and our contingency response programmes. Our efforts have been recognised by the Dow Jones Sustainability and FTSE4Good Indices since 2008 and 2001, respectively. For the second consecutive year, our Company was named the industry leader amongst beverage companies in the Dow Jones World and Europe Sustainability Indices (DJSI). See more about our sustainability initiatives on pages Relationship with The Coca-Cola Company We combine the insights, resources and experience of The Coca-Cola Company with our own expertise in bottling, distribution and sales capabilities. Creates demand The Coca-Cola Company Owners of trademarks Concentrate supply Brand development Consumer marketing Partners in growth for 60 yrs Delivers demand Coca-Cola HBC Bottling Sales and distribution Customer management In-outlet execution Investment in production and facilities See how this relationship works on page 8. Lean manufacturing footprint We operate in a vast territory stretching from County Kerry, Ireland, to Russia s Pacific coast, and from the Arctic Circle to the tropics of Nigeria. While providing us with opportunity, this footprint also challenges us to constantly optimise our operational infrastructure. In recent years, we have consolidated our production infrastructure, particularly in Established and Developing markets. We have reduced the number of plants in these countries by 39% since We believe there is ample room to achieve further efficiencies, particularly in Emerging markets. Plants 59 Warehouses and distribution centres 292 Filling lines 289 3

6 Chairman s statement Operationally and strategically well-placed to deliver continued growth George A. David Retiring Chairman Key highlights Company delivered the highest operating margins since the beginning of the crisis We stepped up our sustainability efforts, adopting ambitious long-term targets After 35 years, I am retiring from the Board; our former Vice-Chairman, Anastassis G. David has been appointed as Chairman The Board focused on the execution of our strategy, alignment with The Coca- Cola Company, talent development, effectiveness of the Board and risk management We appointed two new members to the Board The Board is proposing a full-year dividend of 0.40 Euros per share 4
7 Strategic Report Corporate Governance Financial Statements Supplementary Info & Swiss Statutory Reporting Dear Stakeholder Reporting on the year in an integrated manner has never been more appropriate than it is for Our operational and financial management, sustainability initiatives and governance practices all worked dynamically together. I genuinely believe that it is this holistic approach that gave us the energy and power we needed to make 2015 a successful year despite the challenges we faced throughout highlights On the operational front, we started the year with the determination to see the business grow. This was a challenge in a year where one of our key growth markets, Russia, was experiencing significant economic contraction and a weak currency. The targeted initiatives we implemented in all of our markets delivered well, resulting in strong volume performance. Our discipline, combined with the systems we have put in place to control costs and reduce working capital over recent years, is a great asset, one that continued to deliver results in Improved volumes, effective cost control and mitigation of significant currency headwinds allowed us to achieve our highest operating margins since the beginning of the global financial crisis. Sustainability Earning and maintaining the trust of consumers and the communities we operate in is at the heart of all of our activities. As consumers have become increasingly focused on healthy, active lifestyles, we have significantly broadened our product portfolio, offering consumers a wider range of products and more information to make informed choices. We have also continued to promote health and wellness, spending 4.0 million in 2015 on programmes to support active lifestyles. Minimising our environmental impact, particularly water usage, has always been a priority. The progress we have achieved in managing our environmental impact gave us the impetus to step up our efforts in 2015, adopting ambitious long-term targets. Our efforts in the area of sustainability are being recognised internationally and I am particularly proud of Coca-Cola HBC being named industry leader amongst beverage companies in the Dow Jones World and Europe Sustainability Indices (DJSI) for the second consecutive year in I encourage you to read about our efforts to be a more responsible, sustainable business throughout this report. Governance During the year, the Board focused on the execution of our strategy, our strategic alignment with The Coca-Cola Company, the development of our talent but also on our Board s own effectiveness and the management of risk including the risks arising from currency volatility, geopolitical instability and weak economic activity. A Board effectiveness evaluation was conducted in the second half of the year, and the results underline that our Board is wellbalanced and diverse, with the right mix of international business skills, experience and independence. Reflecting on the changes to the Board this year, I want to wholeheartedly thank Susan Kilsby and Christos Ioannou, who stepped down in June, for their commitment and their valuable contribution during their time on the Board. A warm welcome also to our new Board members, Sola David-Borha and Alexandra Papalexopoulou, who joined the Board during the year. They bring extensive knowledge of two of our important markets, Nigeria and Greece, and first-hand experience of running international businesses. Their appointment adds to the diversity of our Board and we welcome their contributions and expertise. Having been deeply involved in the development of the Company and its predecessors for what have been 35 incredible years, I decided in January 2016 to step down as Chairman of the Board, making way for a new generation of leaders. Leaving the Board at the close of the June 2016 AGM, I am proud of all we have achieved as a Company over these years, from our commitment to excellence and sustainable growth, to contributing to the lives of communities wherever we operate and our ethics and values that ensure we are welcome in every home in our territory. The Board has appointed the Company s former Vice-Chairman, Anastassis G. David, as Chairman for the period until the 2016 AGM, at which time Anastassis will be proposed for election by shareholders. This follows a thorough review process for the appointment, overseen by the Nomination Committee, resulting in a unanimous recommendation to appoint Anastassis G. David. The appointment was approved by the Board of Directors on 27 January 2016, when I stood down as Chairman. The Board of Directors has striven to ensure that this change in the leadership of the Company be effected in a manner that emphasises continuity and balance. We were mindful of the corporate governance and independence implications of Anastassis s appointment as Chairman, having originally been nominated to the Board by Kar-Tess Holding, a significant shareholder of the Company. We have explained our rationale for the appointment in the Corporate Governance section of this Integrated Annual Report and we consulted with major shareholders before proceeding. The Board of Directors firmly believes that Anastassis embodies the Company s spirit our core values, heritage and culture and that these attributes, combined with his strong identification with the Company and its shareholders interests as well as with his profound knowledge, understanding and experience of the Coca-Cola System, will enable him to continue to promote appropriately balanced leadership of the Company. Closing On behalf of the Board, I would like to thank our employees for their hard work and resilience in the face of recent challenges. Their talents, skills and dedication have helped us succeed despite volatile market conditions. We have a proven track record of steering the business through some very rough waters, and I am confident that we are operationally and strategically well-placed to deliver continued growth over the medium term. In light of our Company s 2015 performance and our confidence in management s ability to continue to grow the business, the Board is proposing a full-year dividend of 0.40 Euros per share. This represents an 11% increase compared to the dividend paid out from 2014 profits. I look forward to seeing you at the Annual General Meeting. George A. David Retiring Chairman 5

8 Market review By navigating economic challenges, evolving consumer preferences and shifting market conditions, we demonstrate our customer and consumer focus as well as our business agility. What we are seeing The post-crisis economic environment impacts consumer habits and the competitive landscape. Economies adapting to a post-crisis new normal The global financial crisis seems to have led most countries to adjust to a rate of growth lower than pre-crisis levels, albeit with uneven trends. Established and Developing markets are facing relatively high unemployment and deflation while Emerging markets are impacted by lower oil and commodity prices and high currency-related inflation. Disposable income and corresponding household expenditure continue to be lacklustre. The outlook for 2016 is positive, with expectations for growth exceeding 2015 levels and improvements anticipated in terms of both inflation and disposable income. Small basket expansion Economic conditions and evolving market dynamics have impacted consumer behaviour, leading to a shift to top up urgently needed items, rather than stock up. Real GDP evolution (%) How the consumer shops (avg) (avg) World High income countries Euro area countries Developing countries e 2015f 2016f 2017f Source: Global Economic Prospects, January 2014 & June 2015 and World Bank Development Prospects Group updates, World Bank % 79% Source: GFK-Europanel, AFB 12m MAT Q3 2015, CSE and organised trade growth Channel dynamics in many countries are shifting towards organised trade, such as discounters and supermarkets. Sales in these outlets are growing faster than in traditional trade, such as convenience stores. At the same time the organised trade channel is experiencing further consolidation. Increasing focus on healthy choices Health and wellness trends have been gaining ground as well as focus from governments. Improving health through calorie reduction and better food choices is increasing in importance for individual well-being and as a means to reduce public expenditure on medical care. 6


9 Strategic Report Corporate Governance Financial Statements Supplementary Info & Swiss Statutory Reporting How we are addressing changing conditions We are adapting our business model and offering to grow value jointly with our customers and consumers, capitalising on opportunities. Winning with our customers and consumers We have adapted our product pricing architecture to allow for a focus on affordability where needed. We are improving the value we get by focusing on the right brand, price, pack and channel for the right occasion. We refer to this as OBPPC. We are executing our strategy with excellence, improving our key service metrics in close co-operation with our customers. Share of single-serve packs in total volume (%) +1.4pp Growing value ahead of volume We are focusing on smaller-sized packages, while at the same time increasing the number of transactions. We are targeting specific occasions such as Coke with Food within the framework of increasing household penetration. Our aim is to provide our consumers with a 24/7 offering, a product for each part of the day, every day. jointly with our customers We are focusing on joint value creation with our customers, ensuring profitable growth for both parties. We are adjusting our route-to-market in order to better adapt to the evolving market dynamics, while also optimising our production and logistics footprint so as to capture the most from potential cost efficiencies Offering choice We have one of the most diverse product portfolios amongst Coke bottlers, and we have consistently increased sales of lowand no-calorie sparkling beverages. We have also expanded our product portfolio to include water and juice brands to offer consumers options to support active, healthy lifestyles. Still drinks have increased from 10% of our volume in 2001 to 31% of our volume in We also support programmes that foster active, healthy lifestyles (see the Community Trust section on page 39 for more information). 7
10 Business model Our business model is at the heart of everything we do. It defines the activities we engage in, the relationships we depend on and the outputs and outcomes we aim to achieve in order to create value for all of our stakeholders in the short, medium and long term. Capitals Value added by Financial We seek to efficiently use funds obtained through financing or generated from operations or investments. See our financial review starting on page 51. Manufactured We carefully manage the stock of manufactured capital, including equipment and buildings, available to produce and distribute our products. See our operating performance indicators on page 14. Human We continually work to develop the competencies, capabilities and talent of our people, a critically important asset. Working with partners and suppliers Our partnership with The Coca-Cola Company gives us exclusive rights to manufacture and sell their branded products in our territory. The Coca-Cola Company develops and owns brands which account for 97% of our volume sold. They also produce and supply our Company with the concentrate, or syrup, that is the main ingredient for our beverages. We rely on our supply chain for many types of inputs to our business, including equipment and machinery and consultancy services and software. Partnering with responsible, dependable, efficient suppliers allows our Company to focus on what we do best producing and distributing beverages that bring smiles to consumers. See our corporate values on page 12 and Our People on page 36. Natural Water, energy, and other natural resources are important inputs to our value creation processes, and we seek to use them efficiently. See our key performance indicators on page 50. Intellectual Our knowledge-based assets include our brands and brands we license, as well as proprietary technology, standards, licences and processes. See the section on our brands on page 43. Producing cost-efficiently Using concentrate from The Coca-Cola Company, and other ingredients, we produce, package and distribute products. We produce nearly all of the products we sell at production facilities that also have distribution centres and warehouses. Utilising these facilities wisely helps us produce products responsibly and is key to our profitability. Social and relationship Social and relationship capital includes our reputation and our ability to earn and maintain the trust of key stakeholders. See our key performance indicators on page 39. 8

11 Strategic Report Corporate Governance Financial Statements Supplementary Info & Swiss Statutory Reporting Serving consumers and communities We offer a range of beverages to satisfy evolving consumer preferences and active, healthy lifestyles. By providing products that meet consumer needs and operating a responsible, sustainable business, we create value for the communities where we operate. Serving customers effectively We manage customer relationships as well as promotions and displays at the point of sale. Our customers rely on us to have a full range of quality products on the shelves every day, so that they can satisfy consumers refreshment needs. In order to give our customers the best possible service, we segment each market and serve each customer based on size and need, taking into account prevalent market conditions. Value created We create value for our stakeholders and our business by carefully managing the use of and return on all capitals, or inputs. Net profit 280m Reduction in plants 11% Direct employment 33,311 Reduction in water consumption 5.5% Water replenishment rate of 164% Total taxes 271m Volunteer hours 6,000 Spend on community programmes 8.2m Value shared with By running a profitable, sustainable, responsible business, we create value which is subsequently retained by our business, making it stronger, and shared with all of our stakeholders. Shareholders Through the process of managing all inputs to our business well, we create profits which benefit shareholders through dividend payments and share value. Suppliers As we create value, we support businesses throughout our value chain, and support job creation beyond our business. Employees Developing, recognising and rewarding our people secures a skilled and motivated workforce. Customers Our efforts to produce products efficiently and responsibly builds value for our customers businesses. Communities When our business is profitable, sustainable and responsible, the communities where we operate benefit through job creation, tax payments to governments, useful products and services, and minimisation of environmental impact. We also consistently invest 2% to 2.5% of our pre-tax profits in programmes to support communities in our territory. Find out more about how we share value with our stakeholders in the following pages 9

12 Chief Executive Officer s review Execution focus drives strong volume growth and margin expansion Dear Stakeholder We achieved strong volume growth in 2015 for the first time in several years, as well as improvement in nearly all of our key performance indicators. Our comparable net profit was 314 million, up from 277 million the prior year, and our comparable earnings per share rose 13.5% to Euros. Our performance for the year is the culmination of our long-term effort to refresh our business by expanding our product portfolio to increase the choices we offer consumers, continually improving our ability to serve customers well, attracting and retaining talented people, and dramatically improving the efficiency of our operations. All of these initiatives align with our Play to Win strategic framework, and are underpinned by our commitment to manage our business responsibly and sustainably. All of our business segments achieved volume growth for the year, despite currency depreciation and economic weakness in some of our largest markets, including Russia and Nigeria. We reversed a five-year-long decline in volume sold in our Established markets and increased the momentum of growth in our Developing markets. Volume growth in the majority of countries in our Emerging markets segment more than offset weak sales in Russia. Overall, sales volume for the Group increased by 2.6% compared with the prior year. On the other hand, deflation in our Established and Developing markets and affordability concerns in specific markets limited our pricing flexibility. These factors, combined with exchange rate headwinds, led to a 2.5% decline in net sales revenue. Continuing our efforts to improve margins, we reduced our operating expenses by nearly 50 million and our infrastructure optimisation programmes delivered excellent operational leverage. We benefited from declines in the cost of raw materials we use, particularly sugar and PET resin for plastic bottles, although these cost reductions were more than offset by the 174 million adverse impact exchange rates had on our profits. The 100 basis point improvement we achieved in our comparable operating margins is an important step toward recapturing the superior margins our Company delivered before the global financial crisis. Dimitris Lois Chief Executive Officer 10
13 Strategic Report Corporate Governance Financial Statements Supplementary Info & Swiss Statutory Reporting Targeted approaches delivered success Strong business plans tailored to suit the trading conditions in each country, along with our continued focus on superior execution at the point-of-sale, set the stage for success across our diverse territory. Aided partly by warm summer weather, we achieved improvement in our sales volumes for sparkling drinks. Notably, the number of consumer transactions and the share of single-serve packs in our volumes also improved, reinforcing our leading positions in sparkling drinks, our biggest category. We gained share from local sparkling drink brands during the year and expanded our volume share in 17 out of 24 measured markets. In the still beverage categories including juice, water and ready-todrink tea, we increased volumes sold significantly. Water sales were particularly strong during the warm summer months. Having broadened our juice offering in Russia with the addition of the Moya Semya brand, we now have a leading provider of juice in the country. The 4.0% volume growth in our non-sparkling beverage portfolio helped us improve our market position in 9 of the 22 measured non-alcoholic ready-to-drink beverage markets where we compete. We have aligned with The Coca-Cola Company on the approach to support revenue growth. We are working with our customers to find and offer the right package, size and price point for each distribution channel, ensuring that we satisfy consumers refreshment needs in all circumstances while defending the value of each case. In some of our Emerging markets, we also increased our prices to keep up with price inflation. However, the deflationary environment in our Established and Developing markets, affordability concerns, particularly in Greece and Nigeria, and the shift in demand towards water in the summer all served to offset the benefit of our revenue growth initiatives. The net result was a very slight improvement in currency-neutral net sales revenue per case, a slowdown when compared to our track record over the last few years. Working smarter Our restructuring efforts to improve efficiency continued in We consolidated seven bottling plants, optimising our production at a total of 59 plants as of the year end. We also continued to improve our logistics network. We closed 11 distribution centres and warehouses and made investments in state-of-the-art warehouse equipment to improve our efficiency and reduce costs. We continued to migrate back office processes to our Shared Services Centre in Sofia, Bulgaria, embarking upon service migration for one of our biggest markets, Nigeria. In parallel, we set up a Shared Services Centre in Nizhny Novgorod, Russia, to consolidate and standardise back office services across our vast Russian territory. These initiatives, combined with the SAP platform that is now used in all of our markets, reduce operating expenses. In 2015, operating expenses were nearly 50 million less than in the prior year. On a lower net sales revenue base, and with increased direct marketing and currency management expenses in the year, this translated into stable operating expenses as a percentage of net sales revenue. As a result of discipline and best practice sharing, we also further reduced working capital. At the end of 2015, our balance sheet working capital position was at triple-digit negative level (in million Euros), earlier than anticipated. You will find more information on our progress in the Cost Leadership section of this report, on page 47. Engaged people I am pleased to report that, in support of our long-term value creation efforts, employee survey results reflected a notable improvement in engagement during the year. Our engagement index was 87%, up from 82% in Improvement in the engagement of our people is particularly noteworthy given market volatility which required agility, ingenuity and resolve. In Russia, our people delivered results by mitigating unfavourable circumstances. In Hungary, they captured the opportunity presented by the improving economy. We believe our long-term investments in our people contributed to our strong performance for the year. In 2015, we continued our efforts to engage our people, to develop their capabilities, rewarding a high-performance mindset and attracting and retaining the best talent. Improvements in our talent pipeline reflect our investments in and commitment to training. Our key people held 79% of our key positions in 2015, up from 78% in To continue to improve our talent pipeline, we involved 2,084 people in leadership development centres, where participation increased by 78% during the year. For more about our engagement and talent development initiatives, please see the People section of this report on page 36. Creating shared value As a signatory to the United Nations (UN) Global Compact since 2005, we have continuously worked to implement and promote its 10 global principles in support of human and labour rights, corporate governance and anti-corruption, as well as environmental protection. Further, through these four key focus areas, we contribute to the UN s recently articulated 17 Sustainable Development Goals, supporting common action and endeavouring to balance the three key dimensions of sustainable development economic growth, environmental sustainability and social inclusion by We believe that our business has an important role to play in achieving the Sustainable Development Goals, and to that end we have worked consistently to integrate sustainability and corporate responsibility into every aspect of our operations, throughout our entire value chain. As signatories to the UN Global Compact CEO Water Mandate and Caring for Climate Business Forum, we are deepening our focus on water stewardship and operational eco-efficiency programmes, while taking steps to further refine our climate strategy through initiatives such as Accounting for Sustainability and water pricing, among others. 11
14 Chief Executive Officer s review continued Play to Win strategic framework Looking ahead The outlook for 2016 is characterised by increased volatility. In the Euro area, growth prospects are revised upwards, reflecting the expected benefits from the oil and commodity price developments and the accommodating monetary conditions. However, in contrast, growth estimates are revised downwards in the countries exporting these commodities. In our territory, we face mixed prospects. On the one hand, we expect a reversal from deflation to inflation, and improvements in unemployment levels and private consumption in many of our markets benefiting from the low oil prices. On the other hand, oil exporting countries such as Russia and Nigeria continue to face ongoing challenges in an otherwise buoyant emerging markets landscape. The commercial initiatives that we put in place in 2015 proved to be effective, leading to good volume growth in all three segments. We are determined to build on this success and maintain volume growth in all three market segments. Two key areas of focus in 2016 are revenue growth management and gaining further efficiencies in our cost base. We expect substantial improvement in currency-neutral net sales revenue per case in the full year for all three segments as well as a significant reduction in operating expenses as a percentage of net sales revenue. The two challenges we face are currencies in emerging markets such as Russia and Nigeria and rising input costs, particularly sugar. Overall, our focus for 2016 is to build on this year s good performance with a year of volume and revenue growth along with margin expansion. We have strong plans and our track record gives us confidence that we can take appropriate action in countries where we face challenging market conditions. Our efficiency programmes have, over several years, created a strong platform. As many of our European markets slowly improve, we expect to capitalise on this platform. Finally, I wholeheartedly thank all of our people for their passion, dedication and hard work. Our success this year would not have been possible without their contributions. I also thank our shareholders for their support. We will endeavour to maintain your trust, working to create sustainable, long-term business growth and shared value for all of our stakeholders. Dimitris Lois Chief Executive Officer Key areas of focus in 2016 are revenue growth management and gaining further efficiencies in our cost base while investing in our people. Our vision is to be the undisputed beverage leader in every market in which we compete. In collaboration with The Coca-Cola Company, we have evolved our portfolio to create a balance of sparkling and still beverages, giving us a powerful commercial platform and enabling us to be a strong partner for our customers. We want to be the partner of choice for our customers, working with them to grow their business and ours. Business efficiency is an ongoing priority and it is vital that we continue to optimise our manufacturing cost base and logistics footprint with ongoing careful management of operating expenses. In doing all of this we will continue to strive for leadership and build on our reputation as a responsible business focused on minimising our environmental impact in water use, energy and packaging. We live by our values: authenticity, excellence, learning, caring for our people, performing as one and winning with customers. We think these values make for a culture where people have a strong sense of ownership and make decisions with purpose, confidence and speed. A values approach to business also makes good commercial sense as it creates a company customers want to work with. Strategic pillars: How we report We focus on our four strategic pillars Community Trust, Consumer Relevance, Customer Preference and Cost Leadership that encompass the key areas of our business. Strategic targets: How we measure our performance We have four strategic targets that we work towards: Win in the marketplace, Grow value ahead of volume, Focus on cost and Generate free cash flow. Enablers: What ensures the success of our business We have two enablers that support our business and ensure its success in the long term: our people and our culture. Please see the table on the next page to learn about the initiatives that we put in place for each of the strategic pillars in order to achieve our strategic targets. 12
15 Strategic Report Corporate Governance Financial Statements Supplementary Info & Swiss Statutory Reporting Strategic targets: How we measure our performance Win in the marketplace Grow value ahead of volume Focus on cost Generate free cash flow Act responsibly Strategic pillars: How we report Community trust Consumer relevance Engage with our communities and earn their trust through initiatives that help them thrive Promote active, healthy living Drive the water and juice categories with innovation supported by acquisitions of locally relevant brands Focus on the right brand, price, pack and channel for the right occasion (OBPPC), thereby improving the value we get from every case we sell Offer choice and focus on smaller sizes Develop the meals and socialising occasions and the 24/7 approach in all of our categories and in all consumption channels Maintain the highest level of commitment to quality Customer preference Achieve right execution of product placement and display at the point of sale every day Create joint value with customers through innovative collaboration and efficiency Segment each market and expand coverage with relevant route-to-market for customers based on market dynamics Cost leadership Optimise and integrate manufacturing and logistics footprint Manage capital expenditure decisions in an integrated manner Reduce environmental footprint and cost to Company Standardise and simplify business practices to achieve efficiencies, particularly in back office functions Utilise shared services centres and focus on discipline to minimise working capital Our people Our most important enablers are our people: unparalleled talent and a high-performance mindset are what we strive for. Our people make our Company what it is and create value by growing our business responsibly and sustainably. Strengthening the capabilities of our people as well as engaging them and rewarding them appropriately are priorities at every level of our Company, enabling us to continue to attract and retain the best talent. Enablers: What ensures the success of our business 13
16 Our strategy and KPIs Our strategic objectives Strategic targets Win in the marketplace Grow value ahead of volume How we measure our performance (KPI) Volume is measured in million cases sold, where one unit case represents litres. Category share is calculated by dividing our volume or revenue by the total volume or revenue of the respective beverage category. We report the number of countries where we maintain or improve our sparkling beverages volume share. Net sales revenue (NSR) comprises revenues from Coca-Cola HBC s primary activities. Net sales revenue generated per case sold is calculated on an FX-neutral basis. What happened in the year We achieved volume growth in all segments. While the Emerging markets segment slowed down due to the challenges in Russia, a return to growth in our Established markets supported this outcome. As a result, we improved our sparkling volume share in 17 out of 24 measured markets. Despite volume growth, net sales revenue declined due to adverse currency movements. FX-neutral net sales revenue per case increased for the fifth consecutive year but at merely 0.3%, constrained by the deflationary environment and affordability measures in a number of our markets. KPIs The way in which our KPIs relate to remuneration is set out on pages Volume (million unit cases) Net sales revenue ( m) FX neutral NSR/case improvement (%) ,061 2,003 2, ,874 6,510 6, Our plans for 2016 We have plans to build on the growth achieved in 2015 in all segments. This view is supported by signs of recovery in certain European markets and our marketing programmes coupled with Euro Revenue growth management initiatives are integral to our commercial strategy and a significant focal point in our plans. We expect to increase prices in countries with currency depreciation as well as continue our initiatives to improve package, channel and category mix to get more value out of every case we sell. Underpinned by our enablers and values Enablers and values How we measure our performance (KPI) What happened in the year KPIs Nurture unparalleled talent and a high performance mindset We track the percentage of employees responding to a Group-wide engagement survey positively. We record the number of key people in key positions and the number of women in our Company. Based on survey results, employee engagement index was 87% in % of our key people were in key positions up from 78% in % of our total workforce, 33% of our managers, 34% of our senior leaders and 15% of our Board of Directors are women. Key people in key positions (%) Women in management (%) Comparable indicators exclude the impact of restructuring, the unrealised impact from the mark-to-market valuation of commodity hedges and specific non-recurring items. For a reconciliation of comparable financial indicators to the respective GAAP financial indicators, please see page


17 Strategic Report Corporate Governance Financial Statements Supplementary Info & Swiss Statutory Reporting Focus on cost Generate free cash flow OpEx (Operating expenses) as percentage of net sales revenue is calculated by dividing comparable operating expenses by total net sales revenue. Comparable EBIT refers to profit before tax excluding finance income or cost and share of results of equity method investments, adjusted for certain non-recurring items. Our actions resulted in an absolute reduction in OpEx, although as a percentage of net sales revenue, the ratio was stable. Input costs were favourable, although these were more than offset by adverse currency movements. The strong improvement in comparable EBIT margin was effectively the result of the volume growth and the operational leverage it brings. Free cash flow is defined as the cash generated by operating activities after payments for/ proceeds from and purchases/sales of property, plant and equipment, and principal repayments of finance lease obligations. ROIC is net operating profit after tax divided by capital employed in the business. We generated excellent free cash flow in the year. The benefit from additional reductions in working capital, which reached triple-digit negative level (in million Euros) at year end, coupled with higher profitability contributed to this outcome. These factors also supported the growth in ROIC. OpEx as percentage of NSR (%) Comparable EBIT ( m) Free cash flow ( m) ROIC (%) Focus on cost and efficiency is a firm discipline in our business and we expect to be able to further improve operating expenses as a percentage of net sales revenue. We expect our profitability to also benefit from operational leverage as volumes grow, and our focus on pricing of our products in Going forward, while the benefit we can expect from working capital reductions is diminishing, further improvements in our profitability and disciplined capital expenditure management should ensure good free cash flow generation. Act responsibly We measure direct and indirect greenhouse gas emissions from our operations (scopes 1, 2 and 3 as defined by the Greenhouse Gas protocol). Our operational carbon emissions (from production and transport) amounted to 634,910 tonnes in 2015, an 11.7% decrease vs The global carbon footprint of our products, including indirect emissions in the supply chain and for cooling, amounted to million tonnes of CO 2, a reduction of 3.6% in the year. Greenhouse gas emissions 000 tonnes (scopes 1 and 2)* Greenhouse gas emissions 000 tonnes (scopes 1, 2 and 3)* ,000 4,000 4,698 4,332 4,175 3,000 2,000 1, * Scope 2 number in 2015 is calculated by using the market-based approach. All previous years numbers have been used as a proxy since a true market-based result cannot be calculated. 15
18 Managing our material issues We prioritise material issues on the basis of their relative importance to value creation. We use the strategic pillars of our Play to Win strategic framework as a lens for determining how various issues are material to our business. We continuously update the list of issues that have or may have an effect on our ability to create value over time. The identification of relevant and, then, material issues helps us to better understand how our stakeholders perceive our business model. The results of the identification and assessment processes also inform us about how to structure our integrated report in the interest of more relevance and greater transparency. Annually, we go through a process of identifying the issues we believe are most important in terms of the growth and success of our business and our ability to continue to create value for all of our stakeholders. We then prioritise these issues based on their relative importance and impact. Finally, our prioritised list of material issues is used in ongoing evaluations of our long-term objectives and strategic priorities, in internal resource allocation decisions, and in determining what issues are most material to include in our external reporting, including our Integrated Annual Report. Identifying material issues Our process is shaped by our definition of material issues, which are those that we believe are likely to influence our ability to create value for our shareholders, customers, consumers, suppliers, employees and the communities in which we operate. Material issues may have direct impacts, such as economic conditions, or indirect impacts, such as issues that affect our reputation or stakeholder trust. The materiality assessment conducted in 2015 included input from stakeholders received online and at the Annual Stakeholder Engagement Forum (for more information on this please go to our website at and input from employee surveys and from the Business Resilience Function, which weighs in on business risks. We also gather market intelligence, continually scanning our external environment for trends that may affect the success of our strategy implementation and our efforts to grow our business sustainably and improve our margins. Finally, we conduct ongoing trend analysis, research and monitoring of broader economic, socio-economic and development issues that may affect how we create value over time. Prioritising material issues We prioritise material issues on the basis of their relative importance to value creation. We use the strategic pillars of our Play to Win strategic framework as a lens for determining how various issues are material to our business. In our most recent process of assessing material issues, we streamlined the number of issues we prioritised, making them easier to work with and understand. Coca-Cola HBC connectivity matrix Community trust Consumer relevance Customer preference Cost leadership Economic dimension Corporate governance, business ethics and anti-corruption x x Direct and indirect economic impacts x x x x Health and nutrition x x x Responsible marketing x x x Product quality and integrity x x x Environmental dimension Carbon and energy x x x Sustainable packaging recycling and waste management x x x Sustainable sourcing x x Water stewardship x x x Social dimension Community investment and engagement x Employee well-being and engagement x x x x Human rights and diversity x x 16
19 Strategic Report Corporate Governance Financial Statements Supplementary Info & Swiss Statutory Reporting Using material issues to manage and report Our prioritised list of material issues is linked to the pillars of our strategic framework and helps guide decisions regarding the execution of our business strategy. An indicative example is our progress in Accounting for Sustainability reporting. As of 2015, all of our business units have to include water conservation and carbon reduction initiatives in their business plan submissions, linking a key material issue to our strategy planning and execution. To support this effort we have introduced a fundamental change in our financial project valuation, putting an internal price on carbon and water. In this sense, we now include the actual cost of water, apply water scarcity multipliers (per river basin level) and an internal carbon price in the evaluation of our capital expenditure, alongside our financial indicators. Our responsible marketing and product quality processes and guidelines play an integral role in the way we approach consumers and customers and are invariably linked to our commercial and business practices. Our packaging recycling and waste management efforts are closely linked to our cost leadership initiatives: for example, our progress in packaging light-weighting has had a notable positive impact on our cost-to-supply in 2015, and in turn our operating margins. Our material issues are also discussed in the Group Risk Forum, and included in the Group and country risk universe as appropriate. In response to feedback about our 2014 reporting, we have included descriptions about each of our material issues in the table below and GRI aspects that they relate to. Why this is material How it relates to stakeholder concerns How we are addressing the issue Economic dimension Corporate governance, business ethics and anticorruption Conducting all business activities with integrity and with respect for society is of primary importance for Coca-Cola HBC. Being a good corporate citizen means having a strong foundation in business ethics and maintaining well-established processes and systems for managing financial and non-financial dimensions of performance, which in turn builds the trust and reputation of Coca-Cola HBC. Investors and other stakeholders realise that managing non-financial performance, including environmental and social impacts, is integral to maintaining good financial performance over the long term. For companies to operate successfully and sustain growth, boards must incorporate all aspects of performance management into core decisionmaking processes. We address corporate governance holistically, maintaining a zero tolerance culture related to breaches of our Code of Business Conduct and anti-bribery policies, while making sure all of our people are trained on these policies every two years. Our Board and its committees assume responsibility at the highest level for environmental, social and governance issues related to the business. GRI aspects: Compliance with environmental, product responsibility and societal aspects; anti-competitive behaviour; anti-corruption; public policy Direct and indirect economic impacts As a business operating in 28 countries in Europe, Africa and Asia we contribute to local economies in our countries of operation through our core business activities. These activities generate income for employees, revenue for suppliers and contractors, improve our customers profitability and support public well-being and infrastructure through tax payments, dues and fees. We also contribute to the public good by investing in community programmes to address environmental and social issues. Many of our stakeholders are direct or indirect beneficiaries of our business activity. They therefore have an interest in the value added by our business. We employ more than 33,000 employees. Within the European Union, the Coca-Cola System supports more than 600,000 direct and indirect jobs in our value chain. We source ingredients, raw materials, equipment and services from approximately 43,000 suppliers. In 2015, our direct procurement spend was 1.3 billion. Further, in 2015 we paid 271 million in taxes across our territory. GRI aspects: Economic performance; market presence; indirect economic impacts 17
20 Managing our material issues continued Why this is material How it relates to stakeholder concerns How we are addressing the issue Economic dimension continued Health and nutrition We recognise the rising incidence of obesity as a serious and complex global health challenge linked to sedentary lifestyles which involves energy imbalance too many calories consumed and too few expended. Ensuring that our products can be part of a balanced diet combined with an active, healthy lifestyle and regular physical activity is of key importance for the long-term success of our business and the overall Coca-Cola system. GRI aspects: Product responsibility Health and well-being is of increasing importance to consumers and, through their impact on overall healthcare costs, to governments. The Coca-Cola Company is responsible for product innovation, development, labelling and consumer marketing for the majority of brands we produce and sell. The Coca-Cola Company announced a series of commitments that our global business system will seek to achieve by We will: Offer low or no-calorie beverage options in every market Provide transparent nutrition information, featuring calories on the front of all packages Help get people moving by supporting physical activity programmes in every country where we do business Market responsibly, including no marketing to children under 12 anywhere in the world. For more information about the global commitments of The Coca-Cola Company to help fight obesity, please go to com/press-center/press-releases/ coca-cola-announces-globalcommitments-to-help-fight-obesity/. Responsible marketing Our advertising and promotions reach millions of our consumers and this is a responsibility we take very seriously. Our approach to responsible marketing, the way we engage in direct commercial activity and the way we advertise and promote impact our corporate reputation. GRI aspects: product responsibility Stakeholders expect us to provide clear information about the ingredients and benefits of our products and to help raise awareness about the importance of energy balance, which is calories in versus calories out. We comply with The Coca-Cola Company s Global Responsible Marketing policy and together with other members of our industry we are also signatories of the European Soft Drinks Industry Association (UNESDA) commitments, which include: encouraging active, healthy lifestyles and investing into mass sports, committed to move 6.7 million people by 2020 offering choice from mineral waters, through sparkling soft drinks to 100% juices, and offering no- and low-calorie beverages in all of our markets providing GDA nutrition information on our labels wherever possible encouraging portion control by marketing of smaller pack sizes not engaging in direct commercial activity in primary schools and not advertising to children Product quality and integrity Our products are designed to refresh our consumers and satisfy customer needs. We strive to ensure that our consumers have the utmost confidence in our products by ensuring consistent product safety and quality. We depend on product quality and integrity for market leadership, sales volumes and revenues. This is also the basis of the reputation and trust we strive to earn in our communities. GRI aspects: product responsibility Over the past years, the food supply has changed significantly in most countries. Stakeholders are interested in how food safety and quality is ensured throughout supply chains. Products with high quality and integrity help us to be competitive beyond performance and price, making us a partner of choice for our customers. Product integrity to the Group means offering the highest quality beverages that satisfy consumers and customers expectations in every aspect. Part of our response to more demanding food and safety standards is to raise the bar by applying end-to-end food and safety standards, on top of maintaining strong focus on developing a world class mind-set on food and safety throughout the value chain. In addition to product functionality, quality, safety, taste and design, integrity also includes intangibles such as brand equity of the best known beverage brands in the world. 18
21 Strategic Report Corporate Governance Financial Statements Supplementary Info & Swiss Statutory Reporting Why this is material How it relates to stakeholder concerns How we are addressing the issue Environmental dimension Carbon and energy Energy is an input to our production and logistics processes. Climate change is a material issue for our business also because consumption of cold, single serve beverages can be impacted by weather. This issue also affects our suppliers, customers and the communities which we serve. GRI aspects: energy; emissions; transport; products and services (environmental); environmental investments Affordable, clean energy and taking climate action are two of the 17 Sustainable Development Goals adopted by the United Nations, and member nations, in September Failure to adapt to climate change is listed as a principal risk in the World Economic Forum 2015 Global Risk Report. We make investments in energy efficiency and low-carbon technologies to reduce our exposure to climate change risks and improve our cost leadership and production efficiency. To this end, we have introduced internal water and carbon prices, while we have clear targets for carbon emissions and water use reduction by As a result, we are one of the first 12 companies in the world with science-based carbon reduction targets for both direct operations and our value chain. These targets were created with and have been approved by the World Resources Institute. Sustainable packaging, recycling and waste management Coca-Cola HBC sells more than 2 billion unit cases of products annually, and packaging plays a vital role in keeping our products fresh and safe. Sustainable packaging and waste management are important to our business, given the amount of packaging we use and the need to recover and recycle post-consumer packaging. A significant part of our sales comes from Developing and Emerging markets, where waste management infrastructure still needs to develop to avoid landfilling. Through extended producer responsibility policies, producers such as Coca-Cola HBC can be held responsible for financing waste management schemes. Achieving a circular economy, one that is restorative and regenerative, is high on the political and media agenda. Sustainable sourcing of packaging materials and post-consumer waste management pose environmental challenges, particularly in Emerging markets. In response to environmental concerns, some governments seek to tighten regulation or impose taxes to finance waste management schemes. Our ultimate goal is to close the recycling loop, converting used packaging into new. We minimise the environmental impacts of the packaging we use at every stage of the lifecycle, working on designing packaging that is lighter and minimises waste. We support 19 packaging waste management schemes that recover and recycle post-consumer packaging, and recovered and recycled 69% of packaging material in We work with governments, other industry members, community organisations, consumers and others to fulfil our commitments related to sustainable packaging. Through recovery organisations, we also invest in consumer education regarding recovery of packaging waste. GRI aspects: materials; effluents and waste; products and services (environmental); environmental investments Sustainable sourcing The beverage industry is a substantial purchaser of agricultural raw materials. The sourcing of our raw materials accounts for a large portion of our economic, operational and environmental footprint. The performance of our suppliers directly affects our performance in a wide range of economic, environmental and social issues. GRI aspects: procurement practices; supplier engagement and assessment; human rights; child and forced labour There is increasing pressure on natural resources, and climate change, poverty and social inequality are affecting crops and water supply globally. To protect food and water supplies, crops must be grown and sourced in a sustainable manner. We are committed to working with The Coca-Cola Company and our suppliers to ensure that we sustainably source our key agricultural ingredients. We work with our suppliers to ensure compliance with the Sustainable Agriculture Guiding Principles by 2020, and we have a clear roadmap in place to achieve this goal. All our suppliers are required to adhere to our Supplier Guiding Principles, and we are members of SEDEX (Supplier Ethical Data Exchange), a not for profit membership organisation dedicated to driving improvements in ethical and responsible business practices in global supply chains. 19
22 Managing our material issues continued Why this is material How it relates to stakeholder concerns How we are addressing the issue Environmental dimension continued Water stewardship Water is the primary ingredient of our products and is central to our manufacturing processes and necessary to grow the agricultural ingredients for our products. Water is also vital to the communities in which we operate, so responsible water management throughout our processes and in our supply chain is a material issue for our business. GRI aspects: water; biodiversity; products and services (environmental); environmental investments Sufficient amounts of accessible, safe, good quality water and sanitation are essential to the health of people and ecosystems. Two of the UN s Sustainable Development Goals relate to water and sanitation issues. These concerns are also high on media and political agendas, especially in Emerging markets. We are committed to reducing our water intensity (l/l beverage produced) by 30% between 2010 and 2020 by: leveraging Accounting for Sustainability principles in our business planning and applying the full cost of water in our return on investment calculations reducing our water use ratio to reach 1.61 l/l of beverage produced by 2020 consistently focusing on and investing in water saving initiatives partnering with suppliers to minimise our water footprint across the entire value chain committing to certify 100% of our plants according to the European Water Stewardship (EWS) or Alliance for Water Stewardship (AWS) standards. At year-end, 13 of our plants had received Gold certifications in EWS investing in community water conservation projects to replenish the water we use in our beverages and increase bio-diversity in river basins and wetlands For detailed progress on water related targets to date, please see the Cost leadership section of this report. Social dimension Community investment and engagement The success of our business depends on the strength and well-being of the communities in which we operate. Having a clear direction and focus for guiding community investment and engagement in our countries of operation enables our communities and our business to grow. GRI aspects: Local communities Good health and well-being, quality education and decent work are global Sustainable Development Goals, and businesses are expected to contribute to addressing these challenges. Publicly reporting on efforts, and results, related to these challenges is a stakeholder expectation. Our three priority areas for community programmes are: active, healthy living, environmental and water stewardship and youth development. In 2015 we have partnered with more than 230 NGOs and invested 8.2 million or 2.3% of our reported pre-tax profit, in communities across the 28 countries where we operate. Cash contributions accounted for 86% of the total investment, complemented by in-kind giving and volunteerism. For more information please see the Community trust section of this report. Employee well-being and engagement The success of our business depends on our ability to attract and retain talented, healthy, happy and engaged people. Training, developing, motivating and engaging employees and providing access to employee well-being programmes and a safe working environment are at the core of our corporate culture. GRI aspects: Labour practices and decent work There is growing recognition of the importance of individual well-being inside and outside the workplace. Improvement in well-being results in improved workplace performance including financial performance, labour productivity and the quality of outputs. Sustainable engagement scores are strongly and positively linked with workplace performance. Our sustainable engagement score across the Company in 2015 was 87%, which is higher than other companies in the Willis Towers Watson benchmarking pool of high performing companies. To achieve this, we focus on winning together, enjoying ownership of our work and removing organisational barriers to success. Our employee well-being strategy is based on four pillars: physical, emotional, social and financial well-being. In 2015, we achieved a lost-time accident rate of 0.43, a 12% improvement on 2014, and the seventh consecutive year of double-digit improvement. We provide various programmes in all countries including regular health checks, training related to work and non-work related stress, access to sports and physical activity, child/elderly care support, return to work support for parents and flexible work arrangements where appropriate. 20
23 Strategic Report Corporate Governance Financial Statements Supplementary Info & Swiss Statutory Reporting Why this is material How it relates to stakeholder concerns How we are addressing the issue Social dimension continued Human rights and diversity Our people are key to the success of our business. We seek to create a working environment that fosters diversity and inclusion, making sure that human rights are fully recognised and respected across the value chain. GRI aspects: Human rights; diversity and equal opportunity; labour practices The increased globalisation of business has greatly expanded the opportunities for employees from different cultures and customs to work together. Gender equality is high on the agenda of the UN and many governments. Managing diversity well can also be indicative of management quality and innovativeness. Diversity statistics and policies are therefore of interest to many stakeholders. Our human rights policy is guided by international human rights principles encompassed in the Universal Declaration of Human Rights, the International Labour Organization s Declaration on Fundamental Principles and Rights at Work, the United Nations Global Compact and the United Nations Guiding Principles on Business and Human Rights. The percentage of women in our workforce was 23% in 2015, with women in management making up 33% of all managers. 44% of management trainees hired in 2015 were women. Material issues matrix 10 IMPORTANCE TO STAKEHOLDERS Sustainable sourcing Human rights & diversity Community investment & engagement Water stewardship Packaging recycling & waste management Carbon & energy Responsible marketing Direct & indirect economic impacts Health & nutrition Corporate governance, business ethics & anti-corruption Employee well-being & engagement Product quality and integrity POTENTIAL ECONOMIC, SOCIAL AND ENVIRONMENTAL IMPACT ON OUR BUSINESS By combining the importance of material issues for external stakeholders, with their potential impact on our business, we derive Coca-Cola HBC s material issues matrix. Value creation and our material issues By effectively managing the financial, operating, social, environmental and governance issues, which are most material for our business, we ensure that we meet our obligations to shareholders while also continuing to create value for a wide range of other important stakeholders. As we explain in our business model on pages 8-9, through the process of producing and distributing beverages that offer consumers refreshment and joy, we create value for all of our stakeholders. Engaging our stakeholders Proactively engaging with our key stakeholders is an important part of identifying our material issues. For this, we rely on stakeholder input, and we collaborate and partner with stakeholders to fully understand their perspective. We define stakeholders as people or entities that are directly or indirectly impacted by our operations, and who in turn also affect our ability to grow our business sustainably. Our stakeholders include our employees, shareholders and analysts, customers, consumers, suppliers, governments and regulatory bodies and communities in the 28 countries where we do business. We also engage with other organisations, such as NGOs, who represent the interests of our stakeholders. Once a year, we invite a group of stakeholders to a forum to discuss material issues in depth. The outcome of these fora are summarised and made available on our website ( ) every year. In 2015, we held our first joint Annual Stakeholder Engagement Forum with The Coca-Cola Company at the Coca-Cola Pavilion at EXPO Milan. The material issues focused on at that event included water stewardship, sustainable packaging, and direct and indirect economic impacts. Through regular interactions with our stakeholders we continuously learn and gain a more dynamic understanding of the issues that are most relevant to our value creation processes, and how we may improve our management of them. Along the way, we also hope to demonstrate transparency and accountability, earning our stakeholders trust. For more information about our approach to ongoing stakeholder engagement see page 166 (GRI Index section) and go online, 21

24 Hydration is essential for a healthy life. We offer a diverse beverage portfolio appropriate for different occasions and different tastes, giving people options to remain refreshed and hydrated. Our Established markets are characterised by relatively high consumption per capita of sparkling beverages, and we seek to offer consumers in these markets the range of choices they desire. To achieve this, we focus our efforts on low- and no-calorie drinks, smaller sizes, and packaging that is right for every occasion, every day. 22

25 Strategic Report Corporate Governance Financial Statements Supplementary Info & Swiss Statutory Reporting Relevance Our consumers decide what is relevant; our job is to satisfy their beverage needs. In 2015, our revenue growth outperformed the market in key beverage categories, demonstrating our success in offering products that match consumer preferences. 23

26 Established markets We are focused on innovation, retaining adult consumers and developing our still beverage portfolio Sotiris Yannopoulos Region Director Q&A You are responsible for several of the countries in the Established markets segment. Looking at the current health and wellness trends, should one expect volumes in this segment to decline in the medium term? For the most part, our consumers are prosperous in our Established markets. This, combined with increasing health concerns, leads our consumers to seek choice in hydration. In these markets, we focus on innovation, such as Coke Zero and Coke Life, initiatives to retain adults as well as further development of our still beverages portfolio. In addition, our consumers in Italy and Greece have reduced their consumption of sparkling drinks considerably because of lower disposable income in recent years. We believe we will recover a large part of this volume loss as the economies in these markets recover. For more information In addition to an improvement in consumer spending, what are the levers you can pull to increase volumes in Italy, your second biggest market by volume? Let me start by reminding you that volumes in Italy are down 20% from their peak, so there is a lot to go for. In the sparkling beverages category, we have several initiatives. Coke with Food continues to drive the occasions of meals at home and on the go. The glass contour bottle and mixing with premium spirits support the socialising occasion in the immediate consumption channel. Furthermore, we are increasing spending on better and more relevant marketing, which will be driven by the new Taste the feeling campaign. In the water category, we are focusing on two brands, Lilia and Sveva, which is proving to be very effective. Benefiting from a return to growth Macroeconomic conditions and consumer spending improved slightly in our Established markets segment, and this supported product sales growth. For the full year in 2015, overall unit case volume in our Established markets improved by 1.0%, following five consecutive years of decline. Growth in the water category, combined with volume increases in Italy and Greece, more than offset volume declines in Ireland. Net sales revenue grew by 1.5% in the year, compared with a decline of 3.6% in the prior year. Increased sales volume and the positive impact of exchange rates, mainly from the Swiss Franc, more than offset negative category and channel mix. Deflation persisted despite a return to tepid economic growth, and this contributed to price mix deterioration. Currency-neutral revenue per case declined by 2.4% in the year. Comparable operating profit for the segment improved by 35.5% to 199 million in the year. Our efforts to win in the marketplace by addressing affordability, offering premium quality products at promotional prices, hindered profitability in the segment. This was more than offset by favourable input costs, benefits from our optimisation and restructuring initiatives, lower operating expenses, favourable movements in currencies, mainly the Swiss Franc, and growth in sales volumes. Italy Our sales volume in Italy returned to growth after five years of decline, increasing by 2%. There were signs of improvement in disposable income, although unemployment remained high. In these conditions, we achieved growth in most key categories by focusing on executing our commercial strategy, offering the right product and package size at the right price for every occasion. Sales of our sparkling beverages grew by 2%, driven by Trademark Coke, with Fanta and Sprite also registering positive performances. The still beverage category also grew, led by water, which posted a 4% increase. Single-serve package sales increased in the year, driven by our initiatives related to the sparkling beverages category in the immediate consumption channel. 24
27 Strategic Report Corporate Governance Financial Statements Supplementary Info & Swiss Statutory Reporting Highlights for the year % change Volume (million unit cases) % Net sales revenue () 2,486 2, % Comparable EBIT () % Total taxes 1 () % Population (million) GDP per capita 2 (US$) 35,282 40,354-13% Bottling plants (number) % Employees (number) 6,642 6,944-4% Water footprint (billion litres) Carbon emissions (tonnes) 125, ,572-19% Safety rate (lost time accidents >1 day per 100 employees) % 1. Total taxes include corporate income tax, withholding tax, deferred tax as well as social security costs and other taxes that are reflected as operating expenses; as per IFRS accounts. 2. The US$ appreciated in 2015 with the average US$/Euro rate moving from 1.33 in 2014 to 1.11 in Source: The World Economic Outlook Database, International Monetary Fund, October Northern Ireland data: NISRA (Northern Ireland Statistics and Research Agency), PWC economics consulting, Office for National Statistics, United Kingdom. Italian data: Sicilian population excluded based on data from ISTAT (Italian National Institute of Statistics). Percentage changes are calculated on precise numbers. Established markets volume breakdown Italy: 43% Greece: 16% Austria: 14% Switzerland: 12% Republic of Ireland and Northern Ireland: 12% Cyprus: 3% Greece We are particularly pleased with our performance in Greece, where our volume grew for the second consecutive year, with a 1% increase. Performance was driven by strong sales in the water and juice categories. Coke Zero sales increased 7% in Greece, while our energy category continued to build its base, growing by 24%. The trading environment remains challenging, with economic growth slowing again late in Ireland With the exception of water and energy drinks, sales volume declined in all key categories in Ireland, creating a 2% reduction in overall volume. Sparkling beverages declined in a very competitive market, despite 6% sales growth for Coke Zero. Our package mix improved during the year by 1.8 percentage points, with good performance in single-serve packs of sparkling beverages. Switzerland Overall, our sales volume was stable in Switzerland for Our water category grew by 6%, helped by increased distribution. This, combined with Trademark Coke s positive performance, offset declines in other categories. Celebrating the iconic contour bottle in Italy As we celebrated 100 years of the iconic Coca-Cola contour bottle, our challenge was to promote contour bottle sales while maintaining sales of other single-serve packs. In Italy, we promoted contour glass bottles with promotions showing celebrities being kissed by the Coca Cola bottle, an experience shared across generations for the last 100 years. The promotions showed the perfect way to serve a bottle, with a glass with ice. Through strong trade support to wholesale and retailers and perfect point-of-sale servings in retail outlets, we achieved a 70% increase in contour glass bottle sales while increasing sales of other single-serve packs by 1.2%. Overall, we achieved 4% growth in single-serve packs in one of our most established markets. Packaging optimisation cuts plastic use In Italy, we have used both plastic film and paper trays in secondary packaging for 500 ml cans. In 2015, we introduced new packaging without plastic film. As a result of this change, we save 10 tonnes of plastic material and 26,000 KWh of energy for every 1 million unit cases produced. 26,000 KWh energy saved 25

28 Trading conditions remained difficult overall in Europe, and adverse foreign exchange movements had a significant impact on our profits. We know that we have little control over these drivers. Therefore, our focus remained on the areas that we can influence: optimisation of our production and logistics base, our operating costs and cash conversion. Our Developing markets volumes increased by 5.7% in 2015 after several years of decline or lacklustre growth. This led to an increase in the comparable operating profits of the segment from 58 million to 99 million a 350 basis point expansion in operating margin. This outcome is a testament to the operating leverage the business has after several years of optimisation and careful control of costs at the production and operating cost levels. 26

29 Strategic Report Corporate Governance Financial Statements Supplementary Info & Swiss Statutory Reporting Efficiency Effective cost management is an essential part of our long-term strategy for market leadership and sustainable growth. Our aim is to make the business more efficient and leaner. 27

30 Developing markets We are seeing these economies recover and the consumer become more confident Keith Sanders Region Director Q&A Operating margins have improved from 3.8% to 9.0% in the last two years. To what do you attribute the turnaround in the segment? There are three important contributors. Firstly, we have made significant changes to optimise our production footprint in this segment, which is helping our profitability. Secondly, we rationalised our offering, mainly in the organised trade, eliminating sales that didn t meet the required return. This took place throughout Finally, although our markets in the Developing segment were not in the Eurozone crisis, their economies were impacted nevertheless. We are seeing these economies recover and the consumer become more confident. Tell us about the dynamics in the retail landscape in Poland and how that is impacting your business. Poland, one of the countries in the region I am responsible for, has seen a very fast-paced development in the discounters channel in the last six years or so. The discounters currently account for 25% of retail value and this is expected to grow further, albeit at a slower pace. This led to a shift in our volumes towards large packs for future consumption at the expense of the smaller packs that are typically sold in the fragmented trade. As large packs, or multi-serves, are typically sold at lower price per litre, this shift impacted our business negatively. It ultimately led to the rationalisation I mentioned in my answer to your previous question. For more information Achieving sustainable growth by improving sales volumes and profitability Macroeconomic growth improved, particularly in Poland and the Czech Republic, supporting improvements in sales volumes and revenues. Overall, unit case volume grew by 5.7% in our Developing market segment in All of our countries experienced growth and the sparkling beverages category was the main growth driver. Net sales revenue, up 3.6% in the period, benefited from improved volume and category mix and positive currency impact. These factors more than offset unfavourable channel and price mix in the segment. On a currency-neutral basis, net sales revenue per unit case declined by 2.4% in the year. Comparable operating profits for the segment increased by 70.3% to 99 million in the year. Profitability was helped by lower input costs and higher sales volumes, which more than offset the impact of adverse channel mix and higher marketing and promotional costs. Comparable operating margin for the segment also improved, increasing by 350 basis points. Poland In Poland, our sales volume increased by 7% in 2015, following a decline of the same magnitude in Growth was driven by increases in sparkling beverage sales, with particularly good results in the organised trade. Our still beverage category sales volume increased, largely due to healthy growth in both plain and flavoured water. The strong performance of sparkling multi-serve packages in the discounters channel led to a slight deterioration in package mix. 28
31 Strategic Report Corporate Governance Financial Statements Supplementary Info & Swiss Statutory Reporting Highlights for the year % change Volume (million unit cases) % Net sales revenue () 1,092 1, % Comparable EBIT () % Total taxes 1 () % Population (million) GDP per capita 2 (US$) 13,782 15,558-11% Bottling plants (number) 9 9 Employees (number) 5,315 5,543-4% Water footprint (billion litres) % Carbon emissions (tonnes) 108, ,909-17% Safety rate (lost time accidents >1 day per 100 employees) % 1. Total taxes include corporate income tax, withholding tax, deferred tax as well as social security costs and other taxes that are reflected as operating expenses; as per IFRS accounts. 2. The US$ appreciated in 2015 against the local currencies in most of these markets. Source: The World Economic Outlook Database, International Monetary Fund, October Percentage changes are calculated on precise numbers. Developing markets volume breakdown Poland: 44% Hungary: 22% Czech Republic: 13% Baltics: 7% Croatia: 6% Slovakia: 6% Slovenia: 2% Hungary Our sales volume in Hungary increased by 8% during the year, with growth in all key product categories. Volumes for sparkling beverages increased by 8%, with positive performance across the board and a notable 30% increase in sales of Coca-Cola Zero. Marketing activations in the fragmented trade supported strong growth in the water category, and our sales in the energy category increased by more than a third as a result of new product and flavour launches. Juice volumes increased modestly compared with Our focus on increasing single-serve package sales delivered results, with package mix improving by 1.7 percentage points. A first in water stewardship In 2015 our plant in Prague was the first in the Czech Republic to achieve the Gold certification in European Water Stewardship Standard. The standard recognises excellence at every stage of water management, from the protection of water sources to the quality of wastewater released into the environment, while requiring engagement with all water users and stakeholders in the community. Our Prague plant also reduced its water usage ratio by 13% compared to the prior year. Czech Republic In the Czech Republic, our sales volume grew 4% as a result of our focus on value-accretive volume and healthy growth. Still beverages were the main driver of sales growth, with juice sales up 14% compared with Sparkling beverage sales increased by 2%, helped by the strong performance of Fanta in the organised trade. Good growth of single-serve packages in the sparkling category led to a slight improvement in our package mix. 29
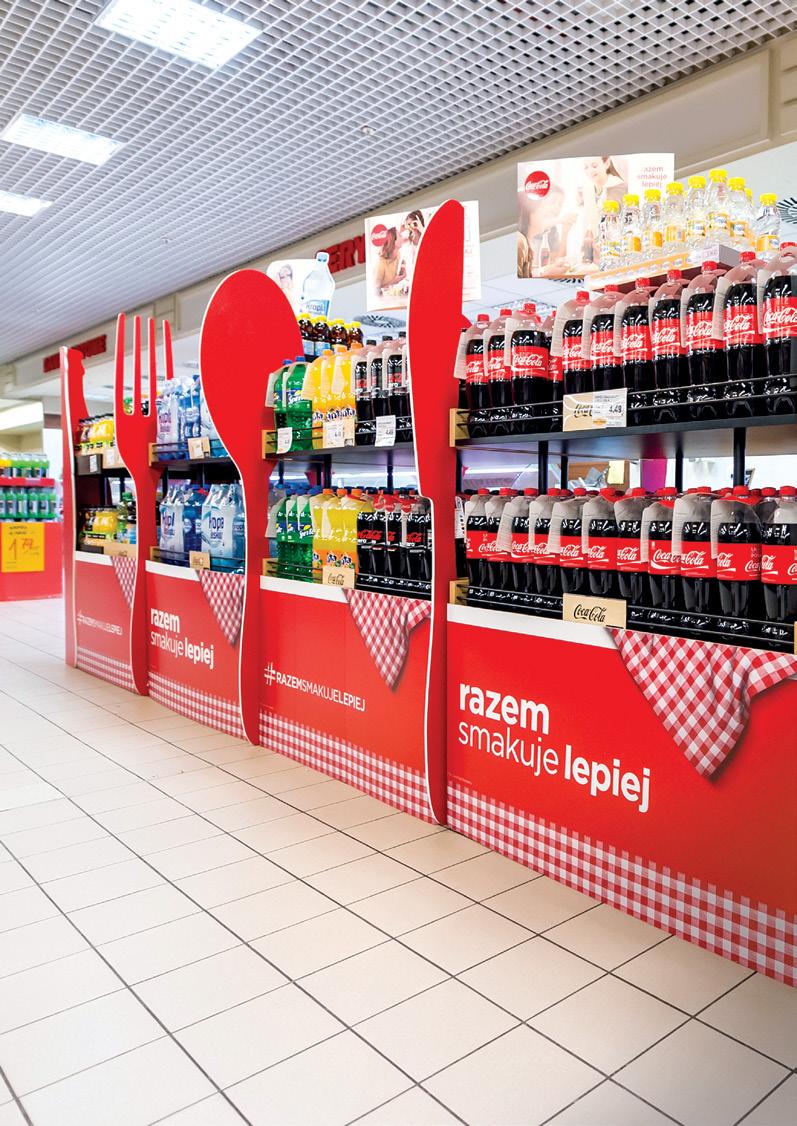
32 30

33 Strategic Report Corporate Governance Financial Statements Supplementary Info & Swiss Statutory Reporting Our brands, systems, knowledge and capabilities form a powerful commercial platform, making us a strong partner for our customers. Our ambition is always to be our customers partner of choice. We achieve this by consistently meeting or exceeding customer expectations and engaging in joint value creation initiatives to grow their businesses and ours. Our Emerging markets are diverse, with many different retail landscapes. While in some countries, such as Russia, modern retail channels are quite developed, in Nigeria, this channel accounts for less than 5% of our non-alcoholic ready-to-drink sales. We customise the route-to-market for each country, and adjust it as economic and retail conditions change. One thing that is consistent across markets is our focus on execution for our customers. Preference As the retail landscape evolves in many of our markets, we strive to be the partner of choice for our customers with flawless execution and joint value creation initiatives. 31

34 Emerging markets We need to be flexible and agile in these markets Zoran Bogdanovic Region Director Q&A Emerging markets can have very volatile currencies. How do you ensure profitability in such an environment? I will start by saying that we have been operating in Nigeria since 1951 and in other emerging markets for decades. This gives us the experience and systems to be effective in such volatile environments. We need to be flexible and agile in these markets, and how we cope with volatile currencies depends on the situation, but the following are the common elements. We have a rolling hedging policy in order to limit the transactional impact of the differences between our local currency revenues and hard currency costs, which incidentally account for up to 40% of our cost of goods sold. We also look for ways to mitigate the adverse impact with price increases and cost savings. For more information Tell us about the opportunity you see in production optimisation in the Emerging markets. Our optimisation efforts have largely been focused on the Established and Developing market segments. In those two segments, we consolidated the number of plants from 38 to 23, while increasing the number of filling lines per plant from 3.5 to 5.0 since In the last year or two, we started work on the Emerging markets segment, where I am responsible for a number of countries. Here we still have 36 plants as well as 215 distribution centres and warehouses. We believe there is considerable scope to consolidate this production and logistics network to achieve cost efficiencies, while improving service to our customers. Building our business while navigating volatility and adversity We achieved robust volume growth for the segment in 2015 despite significant ongoing challenges in a number of markets, particularly exchange rate headwinds. Strong performance across all key categories in Nigeria, Romania and Ukraine more than offset weakness in Russia during As a result, our unit case volume grew by 2.5% in our Emerging markets segment despite challenging macroeconomic conditions. While volume increased, net sales revenue declined by 7.9%. The benefits of positive pricing initiatives and improvements in volume and category mix only partly compensated for the substantial negative impact of exchange rates and channel mix deterioration. Currency-neutral net sales revenue per case grew 4.0% as we implemented pricing initiatives in countries facing currency headwinds. For the full year, our Emerging markets segment posted a 20.1% decline in comparable operating profit to million, leading to a 90 basis point deterioration in the segment s comparable operating margin to 6.4%. Significant currency headwinds and higher operating and overhead costs outweighed the positive effects of currencydriven pricing, revenue growth management initiatives, improved sales volumes and favourable input costs. Russia As anticipated, unit case volume in Russia declined by 6%. Within the context of a double-digit decline in the market, our launch of Coke Zero and increased promotional activity in the organised trade held the decline of Trademark Coca-Cola products to 2%. Juice grew by 14%, partly supported by the inclusion of the Moya Semya brand in our portfolio. This was insufficient to offset declines in the flavoured brands of our sparkling beverage portfolio and, to a lesser extent, the water category. 32
 2,769 3,007-7.9% Comparable EBIT () 176 220-20.")
35 Strategic Report Corporate Governance Financial Statements Supplementary Info & Swiss Statutory Reporting Highlights for the year % change Volume (million unit cases) 1,055 1, % Net sales revenue () 2,769 3, % Comparable EBIT () % Total taxes 1 () % Population (million) % GDP per capita 2 (US$) 5,143 7,643-28% Bottling plants (number) % Employees (number) 21,354 23,875-11% Water footprint (billion litres) % Carbon emissions (tonnes) 400, ,251-7% Safety rate (lost time accidents >1 day per 100 employees) % 1. Total taxes include corporate income tax, withholding tax, deferred tax as well as social security costs and other taxes that are reflected as operating expenses; as per IFRS accounts. 2. The US$ appreciated in 2015 against the local currencies in most of these markets. Source: The World Economic Outlook Database, International Monetary Fund, October Kosovo data: World bank Data from database: World Development Indicators. Percentage changes are calculated on precise numbers. Emerging markets volume breakdown Russian Federation: 35% Nigeria: 22% Romania: 14% Serbia and Montenegro: 8% Ukraine: 8% Bulgaria: 5% Belarus: 4% Bosnia and Herzegovina: 2% Armenia: 1% Moldova: 1% Nigeria With good performance across all product categories, our sales volume in Nigeria grew by 10% following modest growth in the prior year. Growth was supported by successful trade activation initiatives such as the Share a Coke campaign, additional production capacity and the use of SAP capabilities to improve product availability. Our juice category grew by 19% in Nigeria during the year, demonstrating the success of our pulpy juice innovation in the country. Romania Our unit case volume in Romania increased by 11% in 2015, following a 6% decline in Good performance in the sparkling category was driven by Trademark Coca-Cola and Fanta, and supported by our new 1.25 L sparkling pack for the organised trade. Water sales increased by 7% following the completion of the package rationalisation process for water products, and the Cappy Pulpy brand continued to drive good results in juice. Our package mix also improved in Romania, a result of healthy growth in single-serve packages of both sparkling and water products. Ukraine We achieved 14% growth in sales volume in Ukraine, compared with a modest decline during The trading environment remains volatile, with currency fluctuations and high inflation impacting disposable income and consumer confidence. Against this backdrop, we have maintained our focus on expanding our promotional initiatives in the organised trade channel with campaigns such as Coke with Food. This enabled us to achieve double-digit growth in nearly all key categories. Reducing our environmental impact in Emerging markets We invested more than 2.5 million in expansion and process optimisation at our mineral water bottling plant in Bankia, Bulgaria in This investment, alongside other initiatives, has helped us achieve reductions in water and energy use ratios of 12.7% and 5.7%, respectively. We have also upgraded six of our own wastewater treatment facilities in Russia during the past two years. By investing 7 million in improvements, we achieved a significant impact on the quality of the water (organic load) entering municipal wastewater treatment plants. Developing new customers in Nigeria Our Nigerian operation has committed to help entrepreneurs substantially develop their own businesses by We are supporting 40 entrepreneurs, investing in a small-drop distribution system that helps us support these new businesses efficiently. One of the entrepreneurs we support, Mrs. Alhaja Lawal began her business as a road-side outlet in 1995, selling only five cases per week. Now her business, Oregun Distribution Centre, sells over 21,000 cases per month to 685 active customers. As part of our partnership with Mrs. Lawal, we have provided funding and training, along with 346 coolers. 33
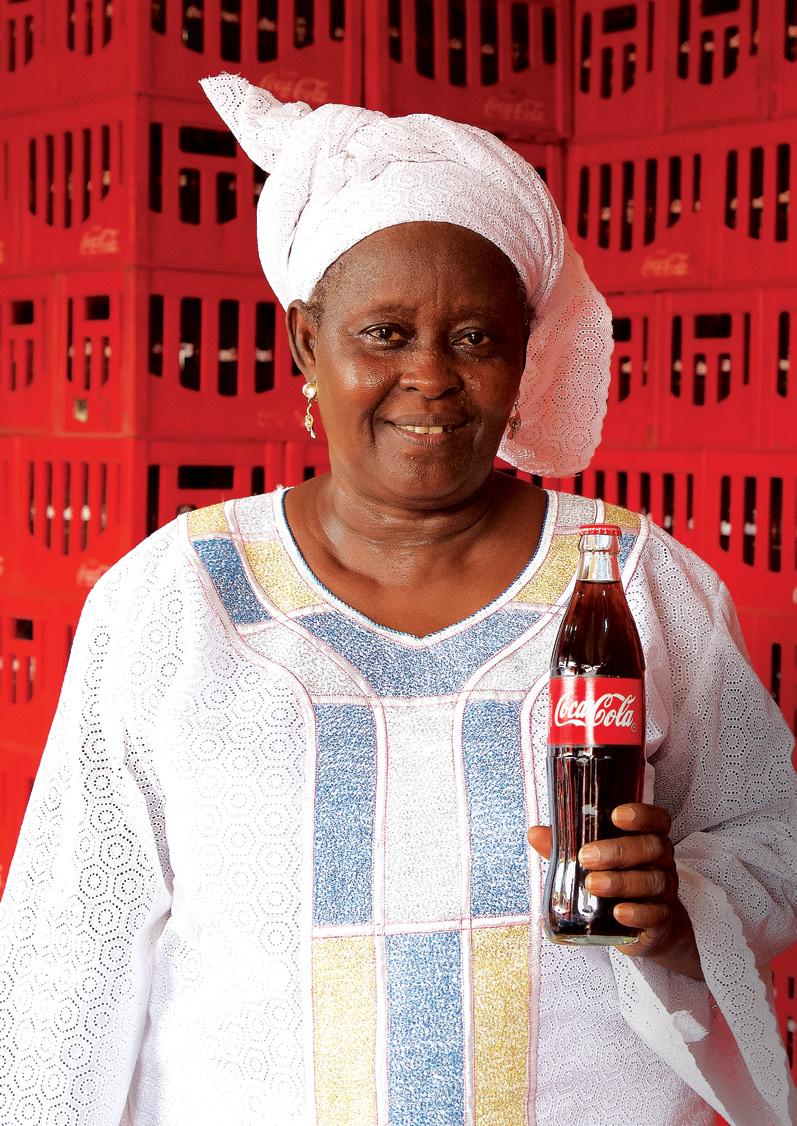
36 34


37 Strategic Report Corporate Governance Financial Statements Supplementary Info & Swiss Statutory Reporting Our business can only be as healthy and strong as the communities in which we operate. In the long run, healthy, sustainable businesses require thriving communities. To address a key societal issue in many of our markets, and also help support our talent pipeline, we expanded our focus on developing the skills and employability of youth. We invested 2 million in support of youth development in To support consumers who want to pursue active, healthy lifestyles, we have continually adjusted our product offerings, expanding our beverage portfolio. During 2015, 1.4 million people took part in sports and fitness programmes we sponsored, and we have set a goal to support 6.7 million people to be physically active by Trust Our operations build trust through responsible, sustainable business practices. We seek to meet or exceed stakeholders expectations regarding key issues for our business and our communities, including consumer health and wellness and development of youth employment opportunities. 35


38 People Our people are fundamental to our Company s growth and long-term value creation. We seek to offer a workplace where people are inspired to be the best that they can be. Key highlights At 87%, our 2015 engagement score is higher than that of High Performing Companies 1 We are strengthening critical capabilities such as revenue growth management and key account management We renewed our performance standards and replaced our stock option plan with a new performance share plan Three key areas supporting growth Ensuring engaged talent Strengthening capabilities Fostering high-performance mindset Every leader at our Company is accountable for attracting, developing, retaining and engaging talented people and also enabling them to execute our strategy. By doing so we are able to connect with communities, provide excellent customer service and bring smiles to the faces of consumers. The three key areas that contribute the most to our growth are: Ensuring engaged talent. We believe that our ability to develop leaders internally is an important competitive advantage. We therefore seek to build a strong bench of inspirational leaders across all leadership levels to ensure continuity and long-term growth for our business. We will continue creating opportunities for faster development, building the correct knowledge, skills and experience, whilst embedding our values. Strengthening capabilities. To execute our strategy, we seek to build our internal capabilities in the crucial areas of revenue growth management, key account management, wholesaler partnership and front line execution. Fostering a high-performance mindset. We believe our Company will thrive if we all strive for best-in-class performance. To achieve this, we focus on winning together, enjoying ownership of our work and removing organisational barriers to success. Employee engagement: outperforming peer companies (%) CCH Sustainable Engagement Index CCH Index 82 CCH Index 80 FTSE 100 Index 81 FMCG Norm 84 Coke System Index 85 Coke Bottlers Index 86 High Performing Norm Data for FTSE 100 companies and High Performing Companies represents those companies participating in WillisTowers Watson benchmarking. 36

39 Strategic Report Corporate Governance Financial Statements Supplementary Info & Swiss Statutory Reporting Ensuring engaged talent To measure our progress, we conduct an employee engagement survey annually. In 2014, we took our engagement measurement to the next level by measuring sustainable engagement, and joining the sustainable engagement survey and benchmarking pool of consultancy Willis Towers Watson. Our Sustainable Engagement Index score was 87% in 2015, up from 82% in the prior year. Nearly all of our people 99% participated in our 2015 engagement survey. Our engagement results for 2015 are higher than other companies in the Willis Towers Watson benchmarking pool of High Performing Companies. They are also higher than average results for FTSE 100 companies participating in this pool and other companies in the Coca-Cola System. Not all positions have the same impact on the Company s performance. We have identified the key positions across all levels, that have a disproportionately high impact on the Company s performance e.g. key customer manager, business developer. We also have a thorough process to identify key people in our Company. We measure how well they are performing and whether they are being considered for more senior positions. This thorough process helps us to identify our key people. As of the end of 2015, 79% of our key positions are occupied by key people, compared with 78% at the end of We regularly assess the performance and potential of all our leaders in addition to our people in key positions. These annual assessments consider established standards relating to our strategy, core beliefs and research-based segmentation of leadership roles. Leadership acceleration centres have been established to help our talented people understand their strengths and the areas of opportunity for their development in their current and future roles. Participation in these has been scaled up, jumping from 1,167 employees in 2014 to 2,084 in To accelerate the development of our key people, we offer controlled challenges to help build new skills through our Fast Forward Programmes, which reached 770 employees during the year. With the establishment of Talent Centre of Expertise, we are working to accelerate the development of our people in order to support the Company s growth agenda. Direct employment 33, : 36,362 Key people in key positions 79% 2014: 78% Strengthening capabilities We have identified and prioritised the organisational capabilities that are the most important for us globally and for each of our markets locally to execute their strategies. We are building these prioritised capabilities, e.g. revenue growth management, key account management, under a systematic methodology improving not just the skills of our people but also our processes, structures and measurement system. Embracing diversity Our broad geographic footprint means that our business serves a diverse spectrum of communities. We believe that fostering a workforce that reflects that diversity is essential to remaining the strategic partner of choice for all of our customers. Diversity and inclusion helps stimulate different ways of thinking, which supports innovation and leads to new opportunities. At the end of 2015, 33% of managerial roles in our Company were held by women, up from 32% for the prior year. To build a diverse talent pipeline, 44% of the 245 management trainees we hired in 2015 were women. To increase understanding and engagement, we encourage cross-cultural and cross-country exchanges within our talent pool. We have a formal Inclusion and Diversity policy, and we always appoint the best person for each position. In 2015, in Northern Ireland, we ran a programme for high-potential women focused on developing their business knowledge, confidence and leadership skills. The programme, called Elevating Women in Management, provides personal development planning and coaching support and has been given positive reviews by participating women associates. 37
40 People continued Well-being and safety We spread joy, happiness and refreshment with every bottle we put in the marketplace. When our people are happy, this naturally spreads to our consumers, customers and partners. Because we believe that having healthy, happy, engaged people will support our business, we have developed a well-being framework with various initiatives to help support our employees physical, emotional, social and financial health. To support our people in their efforts to live healthy and active lives, for example, we subsidise gym memberships, offer medical check-ups and encourage participation in Company and community sporting events and healthy living programmes. To foster understanding of healthy living and energy balance across our Group, we host an annual Move Week. Each country plans activities to increase awareness about diet and physical activity and have fun being active. While we are focused on improving the overall well-being of our people, we know this begins with providing a safe workplace. In order to further improve fleet safety, particularly targeting road traffic accidents, we continue to strengthen our vehicle safety programmes. We provide defensive driver training for all employees who drive on Company business. We have also continued installing collision avoidance technology in all new light fleet vehicles. To reinforce how seriously we view vehicle safety, we institute strict consequences for drivers who ignore normally accepted standards of driver behaviour. We believe that these measures helped contribute to the 8% drop in fleet accidents per million kilometres travelled. Since 2011, we have held an annual Health and Safety Week to raise awareness of safety issues relevant to the workplace and in our employees private lives. In 2015, Health and Safety Week focused on life saving first aid. Presentations included practical exercises and information on first aid techniques including CPR and defibrillators. In many countries, the exercises were presented with external partners such as The Red Cross. Cultivating environmental responsibility Last year, we introduced the Near Loss leading indicator to drive environmental behaviour change in our organisation. As a result, the reported near losses from our sites in 2015 were 7,304, out of which 85% were closed in the year, driving progressive mindset change and ultimately performance. For example, two plants in Bulgaria and Italy piloted Behavioural Energy Efficiency projects focusing on day-to-day behaviour influence, which supported continuous improvement in energy efficiency, energy waste avoidance and finding further opportunities in energy reduction. We also developed customised Environmental Training sessions, focusing on water minimisation and energy efficiency. More than 220 people from 23 countries from Production, Engineering, Sustainability, Quality and Maintenance were trained centrally. To reward our best sites and individuals for their efforts to minimise environmental impact, we introduced The Best Near Loss Individual Award, to select and reward the best idea for environmental improvement. Fostering a high-performance mindset To ensure that our people balance short- and long-term objectives, we measure management, innovation, partnerships with key customers and The Coca-Cola Company, and people leadership and development along with short-term financial metrics. In 2015, we reviewed our performance standards for each level of our leadership, improving the alignment of the standards with our growth agenda and highlighting the importance of sustainability in the key results we expect from our people. We believe that the new performance standards will shape the work of all of our people and support our long-term success. As part of our efforts to achieve a high-performance mind-set, we aim to leverage our employee incentive programmes to drive sustainable growth. In 2015 we replaced our stock option plan with a new performance share plan. The number of shares that vest will be determined based on achievement of three-year stretch targets for comparable earnings per share and return on invested capital. Shares vest only at the end of the three-year period, ensuring long-term focus and promoting sustainable growth. Lost time accidents Fleet accidents per million kilometres travelled Absenteeism days per full-time employee % reduction vs % reduction vs % reduction vs

41 Strategic Report Corporate Governance Financial Statements Supplementary Info & Swiss Statutory Reporting Community trust We believe that our business can only be as healthy and strong as the communities in which we operate. In the long run, healthy, sustainable businesses require thriving communities. Key highlights 8.2 million invested in priority strategic areas: youth development, water stewardship and environmental protection, and promoting active, healthy living 1.4 million people participated in physical activity programmes More than 35,600 trees planted, 18,000 tonnes of waste from rivers and oceans collected, and more than 2,000 kilometres of riverbanks and beaches cleaned 6,000 hours of volunteering during work hours 21,500 volunteer hours by employees on own time Investment in community programmes 2.3% of our pre-tax profit Material issues Corporate governance, business ethics and anti-corruption. Direct and indirect economic impacts Health and nutrition Responsible marketing Product quality and integrity Carbon and energy Packaging recycling and waste management Sustainable sourcing Water stewardship Community investment and engagement Employee wellness and engagement Human Rights and diversity Investment in youth development 2m Trust is the foundation of our relationships with shareholders, customers, consumers, employees, institutions and business partners, and we build trust through responsible, sustainable management of our business. For more than a decade, we have worked to embed sustainability into all of our business processes and decisions. We identified the issues that are material to our business, consulted with key stakeholders and developed robust strategies and commitments to create value for all. Creating shared value We contribute to the communities in which we operate by providing products and services that are valued by our customers and consumers, and generate income for employees, payments to suppliers and tax revenue for governments. Within the EU, the Coca-Cola System also supports almost 600,000 direct and indirect jobs in our value chain. 39

42 Community trust continued Beyond the impact of core business operations, our efforts to build trust involve a strategic approach. Over the years, our community giving has evolved from philanthropic contributions to long-term programmes to create shared value and measurable, positive impact. To ensure the success of our long-term, strategic efforts, we provide substantial funding, work through partnerships, encourage, and support employee volunteering. For the past three years, we have invested 2.0 to 2.5% of our pre-tax profits in community programmes. We continually seek to enhance the impact and efficiency of our community programmes through partnerships with non-governmental organisations (NGOs) and governments. In 2015, we partnered with more than 230 NGOs in 28 countries. Our people are enthusiastic contributors to our efforts to create shared value initiatives locally. During 2015, 5% of our employees volunteered time during work hours, for a total of more than 6,000 hours dedicated to volunteering. In addition, more than 7,600 of our employees volunteered in their free time, supporting community initiatives with 21,500 hours of volunteer work. Promotion with Autogrill funds youth sports activities For a third consecutive year, we partnered with Italian customer Autogrill during Christmas to support an Italian Red Cross project that funds youth sports activities. As a result of our joint promotion, more than 250 young people received grants from the Italian Red Cross to practise sports for free for six months. Our customer Autogrill sold more than 315,000 Christmas menus through the joint promotion, including more than 150,000 unit cases of our beverages. To promote the initiative and generate support, our Italian team developed numerous activations, including a mobile application that allowed consumers to send free Coca-Cola Christmas wishes. The team also promoted the initiative in national and digital media, and fostered engagement through dedicated web pages and a social media campaign on Twitter and Facebook. Many of our Italian employees volunteered to support the initiative. Our community strategy To maximise our impact, we work to apply a consistent, focused approach in areas which are strategic to our business and important to our stakeholders and the communities in which we operate. Our primary focus areas are youth development environmental protection and water stewardship and promoting active, healthy lifestyles. For more information on how these issues are strategic to our business and our stakeholders, see the Risk Management and Materiality sections on pages 55 and 16. In addition, we are active in emergency relief efforts throughout our territory. We strive to be among the first to support communities facing disasters, providing relief directly or through stakeholder partnerships. Investment in community programmes and initiatives Water and environment protection: 11% Sports and physical activity: 49% Youth development: 23% Emergency relief: 5% Other: 12% 40


43 Strategic Report Corporate Governance Financial Statements Supplementary Info & Swiss Statutory Reporting Youth development Youth unemployment is a global problem and is a key societal issue in many of our markets. As an employer, we recognise the complex nature of youth unemployment and the need for innovative approaches co-ordinated between the public and private sectors. We invested almost 2 million in support of youth development in our territory in 2015, reaching young people through diverse educational and developmental activities. Our focus to support youth in securing meaningful employment is backed by initiatives to help them acquire necessary skills that will make them more employable, addressing the mismatch between skills needed by employers and current approaches to education. We partner with NGOs and educational institutions, including many universities that offer support, developing skills needed by private enterprises. We also offer youth employment opportunities in our graduate programmes and internships throughout our operations. In many of our markets, we support entrepreneurship initiatives, aiming to encourage youth by helping them develop skills necessary to start their own businesses. In Nigeria, for example, we provide training and access to funding to help young women become entrepreneurs. Part of The Coca-Cola Company s 5by20 platform, this work helps women entrepreneurs become part of our value chain. Educational platform with Junior Achievement and Teach for Bulgaria In Bulgaria, our youth development platforms reached more than 100 young people interested in being teachers and close to 700 students in 11 university mentorship classes, enhancing their employability and entrepreneurship skills, during the year. These programmes were conducted in partnership with Teach for Bulgaria, part of the global NGO Teach for All, and Junior Achievement Bulgaria. Almost one third of the students participating in the Teach for Bulgaria programme demonstrated improved performance in school. Of the students participating in the entrepreneurship and employability skills development classes in the initiative with Junior Achievement Bulgaria, 43 young people found meaningful employment while they were still part of the programme. A full Water stewardship and environmental protection The global commitment of the Coca-Cola System to replenish all the water used in the final beverages includes a large number of water initiatives in our territories. Through partnerships with the World Wildlife Fund, the Global Water Partnership and Global Water Partnership-Mediterranean, as well as the Let s Save Yelnya Bog Together initiative of our Belarusian operations, we replenished 164% of the water we used in our final beverages in In addition, we continuously seek to preserve and protect important watersheds, such as the Danube and other rivers, and we contribute towards preserving wetland habitats and biodiversity. We have water stewardship initiatives in all of our countries where this is relevant. In 2015 we implemented 24 community environmental protection and water stewardship initiatives, investing 0.9 million. We support a range of programmes to raise awareness and increase understanding of environmental issues of global relevance and local importance. Our long-term, cross-country initiative Green Danube, conducted through a partnership with the International Commission for the Protection of the Danube River (ICPDR), hosts an annual Danube day event to raise awareness. Other Green Danube events held during the year in our countries, including Austria, Bosnia & Herzegovina, Bulgaria, Croatia, Hungary, Serbia, and Ukraine, increased awareness of the immense importance of the river and its habitats. Together with governments and NGOs, we have planted more than 35,600 trees during 2015 alone in more areas in need of reforestation. With the enthusiastic support of our people, we have also collected 18,000 tonnes of waste from rivers and oceans, cleaning more than 2,000 kilometres of riverbanks and beaches. We have advanced our internal Source Water Protection Programme and have committed to certify all of our sites to either the European Water Stewardship or Alliance for Water Stewardship standards by These standards recognise excellence at every stage of water management from the protection of water sources, through efficient use of water, to the quality of wastewater released into the environment while requiring engagement with all water users and stakeholders in the community. By the end of 2015, we had already achieved 13 Gold EWS Certifications at our sites in Austria, the Czech Republic, Hungary, Italy, Poland, Romania, Serbia, and Switzerland. 80% reported success in developing a new business concept. Sustainability week in Serbia During our first Sustainability Week in Serbia in 2015, more than 150 volunteers and their family members participated in 15 different activities which ranged from planting trees and making furniture from recycled materials, to education on recycling, Health & Safety workshops, physical activities and emphasising the importance of a balanced diet. The launch of our second local sustainability report in Serbia during the week attracted over 50 guests from the media, government institutions and non-governmental organisations. In our continuing efforts to build relationships, we also held a stakeholder panel with key customers, partners and representatives of the corporate sector. 41


44 Community trust continued Promoting active, healthy living We offer a diverse portfolio of beverages to meet the needs of consumers who wish to pursue active, healthy lifestyles, and we support initiatives that encourage people to be more physically active. As we persist with our efforts to achieve global objectives for the Coca-Cola System,1.4 million people took part in sports and fitness programmes supported by our Company in We believe that we can do even more. By 2020, we want to support 6.7 million people to engage in physical activity. To help us achieve our goals in this area, we have implemented a strategic framework for our active lifestyle programmes, together with The Coca-Cola Company, to increase our impact. One of the programmes we have decided to scale up is our award-winning Wake Your Body programme in Hungary. Wake Your Body incorporates a series of movement events, sports and physical activity opportunities over the course of a year that are designed to encourage the broad participation of men, women and children across all age groups and various fitness and ability levels. We have a responsibility to support the well-being of the people whose lives we touch, including our own people. To inspire our people to be healthy and active, Move Week has been instituted across our Company. The annual, week-long event provides opportunities for fun and togetherness while supporting active lifestyle habits. Under our broader employee well-being strategy, we organise family activity days, and we provide gym memberships, medical check-ups and encourage participation in Company and community sport and active lifestyle programmes. As part of our efforts to create a culture of movement throughout our Company, we launched a programme called ToolFit, which features a framework for holistic, active lifestyles. ToolFit includes ideas, tips and case studies to support the integration of active lifestyles in the work environment throughout our Company. Emergency relief Our emergency relief programmes are carried out in partnership with national Red Cross and Red Crescent societies. This partnership, built on an agreement between the International Federation of Red Cross and Red Crescent Societies, The Coca-Cola Company, Coca-Cola HBC and other bottlers, ensures a rapid response to people in need. In 2015, thirteen of our countries were affected by the global refugee and migrant crisis. We proactively provided assistance, including more than 400,000 litres of bottled water to those in need, with 300,000 litres provided during the months of August, September and October alone. In addition, we supported local NGOs efforts monetarily and our people volunteered their time to help the people and families in need. Our work with national Red Cross and Red Crescent societies also includes ongoing community health care initiatives, health training and fundraising efforts. Looking ahead In 2015, after a thorough research and benchmarking process, engaging internal and external stakeholders, we decided to further focus our community investment on youth development, selecting this as an area for our emerging flagship community programme. Our aim is to streamline our efforts and create value for the communities and our business through a consistent approach across all 28 countries in our territory. We look forward to launching our holistic youth development programme in 2016, pioneering it in a few of our markets and then applying lessons learned in a group-wide roll-out during Contributions Type of contribution Wake Your Body Wake Your Body, our multidisciplinary active lifestyle programme, was held in Hungary for the 11th year during Six additional countries followed the lead of our Hungarian operations, organising Wake Your Body movement events and sports and physical activity opportunities. This signature programme was recognised in 2015 by the European Commissioner for Education and Sport, Mr. Tibor Navracsics, at the World Leisure Sports Association Congress (TAFISA) in Budapest. Cash contributions: 86% In-kind contributions: 13% Time contributions: 1% Charitable contribution: 8% Community investment: 68% Commercial initiative: 24% 42

45 Strategic Report Corporate Governance Financial Statements Supplementary Info & Swiss Statutory Reporting Consumer relevance Consumer preferences continued to shift in 2015, with even greater demand for low- and no-calorie drinks. Our diverse beverage portfolio helped us to satisfy changing consumer preferences in the year. Key highlights Low- and no-calorie sparkling drinks, which account for 7% of our portfolio, contributed 25% of additional cases sold 8% growth in juice 3.6% volume growth in packages under 1 litre Acquisition of Neptunas, a Lithuanian water brand Direct and indirect economic impacts Health and nutrition Responsible marketing Product quality and integrity Water stewardship Employee wellness and engagement No 1 No 2 10% branded supplier in sparkling drinks and RTD tea branded supplier in juice and juice drinks Material issues reduction in complaints vs For Coca-Cola HBC, consumer relevance means meeting consumers needs by offering the right products, in the right packs, through the right channels for the right occasion. These products must be consistently fresh, in premium condition, and presented cold when that is appropriate. Sparkling soft drinks and energy In 2015, total sparkling drinks volume grew 2.0%. While sales of low- and no-calorie versions of Coca-Cola grew the most, Coca-Cola with the original taste grew by 2.1%, resulting in brand Coca-Cola achieving 3.3% growth. This growth was supported by our Coke with Food message. Single-serve sales benefited from this association between Coke and meals, further supported by promotions celebrating 100 years of the Coca-Cola contour bottle. Contour glass bottle sales increased, particularly in strategically important channels such as restaurants, bars and cafes. The consumer occasions we primarily focus on are Coke with Food and socialising with family and friends. We build the connection between Coke and meals through advertising dedicated to meals and support for in-store promotions where consumers can buy meals with Coke. For socialising occasions, we work to ensure that when consumers order a Coca-Cola, they get one that is perfectly served, preferably in a Coca-Cola contour glass bottle, linking happiness and refreshment. Our energy brands grew by 6.6%. Sales of Fanta grew by 4% in the markets we serve during 2015, with focus on the core orange flavour. Sales grew with the introduction of new flavours and special packaging for key periods like Halloween. Consistent with our strategy, we also successfully connected our sparkling beverage brands with premium spirits products. Premium spirits is now a 180 million business for us. This association supports 43

46 Consumer relevance continued Juice The juice part of our beverage portfolio provides consumers with a nutritional and delicious refreshment proposition, which contributes to our revenue growth. While juice sales were flat overall for the industry in 2015, sales in our juice portfolio increased 7.9%. With a series of great brands we are now the second largest juice company in our territory. Our success in juice has been supported by our focus on consumers breakfast occasion, harmonising our portfolio and brand approaches, and developing the scale and profitability of Cappy Pulpy, which has now been launched in 14 European countries and in Russia and Nigeria. sales of our core brands, promoting mixed combinations such as Jack & Coke. This also supports increasing sales of mixer brands such as Schweppes and Kinley, which grew by 5% and 4%, respectively. We have 40% share in the sparkling category in our territory and we improved volume share in 17 out of 24 measured markets in this core category in Water Our water business experienced a significant turnaround in 2015, growing in volume by 4.7%, partly owing to a very warm summer in parts of Europe. By the end of 2015, we had become the third-largest water business in our territory. The role of water in our portfolio is to offer a pure hydration proposition to all our consumers, through an increasingly efficient infrastructure, a lean route-to-market and contributive SKUs. This is driving our market share in the nonalcoholic ready-to-drink category. In 2015, we strengthened brand equity by introducing a master brand approach under a powerful marketing platform across Central and Southern Europe. We also relaunched our key premium brands in Austria and Switzerland while securing improvements in availability and affordability across our countries. In line with our strategy to expand in the still drinks category, we acquired Neptunas, a sought-after water brand with 20% share in Lithuania. The right pack, price and channel We use several tools and employ specific management techniques to ensure we offer consumers the right product, in the right pack, at the right price to suit each occasion. This allows us to meet consumer needs while improving or maintaining revenue growth from every case we sell. Our development of smaller packs (less than 1.25 litres in size) across key markets in 2015 has been a major driver of improved household penetration, and volume and revenue growth. Perfectly presented We have 1.7 million coolers throughout the markets we serve. All of the coolers we buy use environmentally-friendly gases, and we have worked with suppliers on innovative solutions to ensure future cooler purchases will be 30% more energy efficient. Committed to quality A brand is a promise and supplying consumers with products of the highest quality is our never-ending commitment. Products are continually delivered to customers and consumers from our 59 plants, and cross-functional accountability keeps our entire organisation focused on ensuring consumers receive the highest quality products. Our efforts in this area are recognised by The Coca-Cola Company as a model to be replicated globally. As a result of our systems, freshness of our product increased by 11.5% in 2015 and the number of complaints declined by 10% to 19 complaints per 100 million bottles sold. Key categories contribution (2015, %) Volume Volume growth Sparkling (excluding no and low calorie) No and low calorie sparkling Water Juice Share of single-serve packs in volume (%) Sparkling Total pp +1.4pp Complaints per 100m containers
47 Strategic Report Corporate Governance Financial Statements Supplementary Info & Swiss Statutory Reporting Customer preference The retail landscape continues to evolve, with the number of small, retail outlets declining and large, organised key accounts growing. In addition, consumers are trading shopping trolleys for smaller baskets, with fewer items. Key accounts sell more private label products than smaller retail outlets. We have successfully adapted to these market changes, increasing our position in supplier rankings and customer satisfaction scores. Key highlights 89% engagement level for commercial department employees 97.6% of all orders delivered in full, on time and accurately invoiced Consumer satisfaction is 82% for key accounts and 66% for traditional outlets 97.6% delivery in full and on time and accurately invoiced (DIFOTAI) Material issues Corporate governance, business ethics and anti-corruption Direct and indirect economic impacts Health and nutrition Responsible marketing Product quality and integrity Carbon and energy Employee wellness and engagement Human rights and diversity 58.4% of our customers say we exceed their expectations Building relationships with our customers is fundamental to our success. We work hard to ensure our people are constantly focused on customer needs and satisfaction. We aim to exceed expectations in terms of delivery and execution to be the best supplier, and work as partners in creating value to achieve the best relationship. Exceeding delivery expectations To meet and exceed customer expectations, we must execute their basic requirements flawlessly. We use a standard measure to ensure we deliver in full, on time and accurately invoiced (DIFOTAI). Our ability to meet customer needs as measured by DIFOTAI is best in class and we continue to improve. For 2014, our score was 97.0%, up from 96.6% in It improved again in 2015, to 97.6%. Of the customers surveyed by Growth for Knowledge (GfK), a market research company, 93% said we met their expectations and 58.4% said we exceeded their expectations; these indicators grew in the year by 3.6 and 6.8 percentage points, respectively. Exceeding execution expectations To measure and improve our execution quality, we use a standardised system called RED (Right Execution Daily). This survey measures against an index (called RED Benchmark) marked between 0 and 100, where 100 indicates full compliance against the picture of success. Our business developers use a handheld device to evaluate actual outlet activation, in every channel, in every market against the picture of success. During the last three years, we have consistently improved our execution quality. In 2014 we made increases of 5 percentage points and in 2015 we recorded a 9.1 percentage point increase. Our consistent improvement in execution is particularly notable given the number of outlets surveyed. The number of outlets that we survey in the Central and Southern Europe business unit covers 75% of the volume. This is the highest percentage of RED coverage anywhere in the world. Our common execution platform is supported by a network of execution leaders and experts that share best practices, leveraging our accumulated experience from working in 28 different countries. In addition, every country in our territory has their execution processes validated through a routine RED certification process. While our coverage improved during the year, our costs related to servicing accounts improved as well. 45

48 Customer preference continued Collaboration with customers We aim to exceed delivery and execution expectations to be the best beverage supplier. We also want to be best in terms of relationships. This is achieved with a mixture of capability and knowledge. We invest in capability training and knowledge to achieve joint value creation. These initiatives include: joint consumer research, collaborative planning and forecasting, common performance reviews, optimal stock levels, truck utilisation, improve service and develop ideal menu boards. Developing capabilities We work with GfK to track the satisfaction levels of our customers. Using their report, we develop customer management-related competencies. In 2015, we implemented a programme to develop leaders of key accounts and rolled out tailored Customer Acceleration Centres for 18 Key Account Managers in 11 countries. The Group commercial team provided 3,300 managers with capability training through more than 300 programmes. These are in addition to the locally developed training programmes held in each of our countries. Customer satisfaction In 2015 GfK surveyed 14,216 individual outlets for the Outlet survey and 868 managers in 470 key accounts to establish the key account survey. Like many companies, we measure the percentage of customers who rate us as good and excellent to measure satisfaction. Unlike many companies, we have the expectation that our countries must aim to be the non-alcoholic ready-to-drink beverage supplier with the best relationship was a very good year. In the outlet survey of non-alcoholic ready-to-drink suppliers, 15 of our 27 surveyed countries achieved the position of number one supplier with the number one relationship; this is three countries more than the prior year. In a separate survey for key accounts, GfK reports in 22 countries. In 13 countries we are the number one supplier with the number one relationship. This is five more than in the prior year. Developing knowledge We have advanced knowledge sharing systems and, during 2015, we established a dedicated SharePoint platform to further support best practice sharing, strategic initiatives and capability building. Joint business plans developed with our customers allow us to create sustainable value and we have multi-functional teams involved. This includes implant managers in many countries who work inside our customers premises to optimise service levels and manage inventories. Engaged people in commercial execution (%) GfK independent survey of customer satisfaction (% good and excellent) DIFOTAI improvement (%) FTSE 100 Index 81 FMCG Norm 84 Coke System Index Data for FTSE 100 companies and High Performing Companies represents those companies participating in WillisTowers Watson benchmarking. 85 Coke Bottlers Index 87 CCH Index 89 CCH Commercial dept HQ of key accounts Traditional outlets DIFOTAI is a measure of delivery in full, on time and accurately invoiced. 46


49 Strategic Report Corporate Governance Financial Statements Supplementary Info & Swiss Statutory Reporting Cost leadership Our focus on cost efficiency initiatives remained firmly on track in 2015, making a sustainable contribution to our profitability. Discipline in working capital management and integrated capital expenditure decisions helped to convert these profits into cash. Key highlights Expanded our shared services model to Nigeria and Russia Reduced year-end working capital position to triple-digit negative level (in million Euros) Reset our targets for minimising water and energy consumption and reducing carbon footprint Material issues Direct and indirect economic impacts Carbon and energy Packaging recycling and waste management Sustainable sourcing Water stewardship Employee wellness and engagement Infrastructure optimisation Number of plants -26% since 2008 or -39% in the Established and Developing markets Operational cost control OpEx reduction -160 basis points as % of NSR, since

50 Cost leadership continued Our comparable gross margin improved by 100 basis points in 2015, and our comparable operating margin expanded by the same amount. While lower input costs and adverse foreign exchange movements had the biggest impact on our profits, these moved in opposite directions, largely offsetting each other. We know we have little control over these drivers. Therefore, our focus remained on the areas that we can influence: optimisation of our production and logistics base, our operating costs and cash conversion. Maintaining cost leadership involves carefully managing all inputs to our business, including natural resources. In 2015, we developed a new methodology to improve our assessment of capital expenditures to reduce water and energy consumption. We invested a total of 10 million in water and energy saving initiatives during the year, and we estimate that these investments will be recouped through lower energy and water costs by Infrastructure optimisation Our manufacturing footprint spans 23 of the 28 countries in our operating region, and the efficiency and effectiveness of this network is critical to our business. We have a continuous drive to optimise our infrastructure, transforming existing plants into cost-efficient mega-plants that can effectively serve a country or an entire region. Plant optimisation takes into consideration the Group supply chain as a whole, in an integrated manner, from the number of plants and the number and nature of filling lines to the number of distribution centres and warehouses. Since 2008, we have gone from having 80 plants to 59, a 26% decrease. During the same period, we have also reduced our warehouses and distribution centres by 20%. In the process, we increased the average number of filling lines per plant from 3.6 to 4.9 lines. This means that we are creating bigger, more efficient and flexible facilities rather than reducing capacity. In the earlier stages of optimisation, these initiatives were mostly focused in Established and Developing markets. Currently, we are also ramping up our efforts in Emerging markets. Over the years, we have significantly diversified our product portfolio, leveraging our scale in sparkling beverages and offering a full non-alcoholic ready-to-drink portfolio to our customers and consumers. As our product offerings evolve, reflecting the changing needs and preferences of consumers in our markets, we are leveraging technology to offer innovative products. One good example is our first hot-fill line in Nigeria for producing juice in plastic (PET) bottles. The line, installed during 2015, also has the capability to produce juice with pulp. With regard to our logistics network, we continued with our efforts to move from a fixed-cost model to one with greater flexibility and continued to invest in new warehousing technology. The electric, laser-guided, automated forklifts we now use in Belfast operate without drivers. Business standardisation In all 28 countries we operate in, we use a common SAP integrated data management platform. The SAP platform brings greater business process standardisation and automation, resulting in better customer service, as well as providing effective tools to measure our performance in critical business functions such as sales, procurement, manufacturing, planning and human resources and finance. Business process standardisation has helped us achieve positive benefits in working capital and operating expenses in recent years, and we continue to seek further integration using the SAP platform. In 2015 we further enhanced our SAP platform with functionality to support our strategy in the area of Integrated Competitive Supply Chain. Now the system supports our supply chain services by enabling cross-country execution of planning, procurement, manufacturing and logistics. Energy efficiency in Nigeria We invested 2 million in building Combined Heat and Power (CHP) plants at our Ikeja and Owerri manufacturing sites in Nigeria during This investment is expected to reduce carbon emissions by 3,000 tonnes annually. The Owerri plant was not connected to a natural gas network. To overcome this, the plant uses compressed natural gas that is trucked to the site. We now have a total of three CHP plants in Nigeria. 3,000 tonnes reduction in carbon emissions 48
51 Strategic Report Corporate Governance Financial Statements Supplementary Info & Swiss Statutory Reporting The SAP platform allowed us to launch a shared Business Services Organisation (BSO) in 2011, to centralise and standardise the management of general accounting, procurement and invoicing, data analysis and human resource processes. The centre provides support services to 17,000 employees in 23 countries including five corporate offices, and also supports 43,000 suppliers and 2.1 million active customers. Annually, the centre processes more than 500,000 purchasing invoices, 5,500 balance sheet reconciliations and as many as two million changes to customer, sales or employee data was another year of continuous growth and improvement for the BSO. Customer satisfaction increased to 77% from 73% in Other achievements include a reduction in the number of days to close period-end accounts and a 7 percentage point reduction in the error rate for country level data. We began the transfer of four more processes from country operations to the shared service centre: cash collection, dispute management, purchasing administration and payment-related data management. Moving these transactional activities to the centre not only improves efficiencies, but also allows our country teams to focus on our core business as a sales and execution organisation. As we complete the migration of our back office services for our largest markets, including Nigeria, to the centre, we took the decision that in Russia, it would be more effective to set up a stand-alone shared services facility. Due to the country s sheer size as well as its largely Russian-speaking business practices, we established a Shared Services Centre in Nizhny Novgorod, Russia, which opened in late In 2015, the BSO also established itself as a talent pool for the Group, with over 90 employees promoted to country operations and corporate service centre roles. In this dynamic environment, the BSO expanded to 430 employees and achieved an employee engagement score of 82%. Cash generation Since 2008, we have reduced our year-end working capital balance by 600 million. Our initial efforts focused on changing the culture and implementing discipline in all parts of the business. Once the BSO was established, our efforts gathered momentum. The efficient, standardised systems we put in place, and sharing of best practice, helped reduce inventory and receivables. Recently, we have also been working with our suppliers to further improve payment days. Since we reached a negative working capital year-end balance in 2013, reductions have continued, but at a diminishing rate. Despite slowing improvement, for 2015 our working capital year-end balance reached triple-digit negative level (in million Euros), earlier than anticipated. We have a medium-term target for capital expenditure which ranges from 5.5% to 6.5% of net sales revenue. The majority of this is invested in revenue-generating assets such as state-of-the-art filling lines and cold drink equipment. Our expenditure this year amounted to 328 million, in line with depreciation and equivalent to 5.2% of net sales revenue. Given our integrated capital expenditure decisions, and our disciplined approach to capital expenditure, we continue to believe our medium-term target range is appropriate for nurturing our future growth. Given adverse currency movements in 2014, we revised our free cash flow target range to billion. Despite the continued weakness in currencies, we generated 412 million in free cash flow in 2015, reaching our three-year target despite extremely volatile conditions during the period. Integrating sustainability in business processes We began requiring all of our markets to include water conservation and carbon reduction initiatives in their business plans in To support this effort, we made fundamental changes in our financial evaluations of capital projects, using the true cost of water, water scarcity multipliers (per river basin level) and internal carbon prices. We track water conservation and carbon reduction initiatives in our markets on a quarterly basis, and progress is reported to the Social Responsibility Committee of the Board. To assess our impact on society and the environment in our evaluation of capital expenditures, we developed a new assessment process. The Accounting for Sustainability methodology includes quantitative assessments of the direct impact of water and carbon use, and qualitative assessments of indirect impacts including: jobs created, taxes paid, health and safety outcomes, capability building, environmental externalities, cultural heritage and stakeholder perception. Reducing water and energy use We invested more than 4.8 million in water reduction initiatives in our plants during 2015, reducing water consumption by 1 million cubic metres and improving our water use ratio by 5.5% compared with the prior year. Important water initiatives included: optimising cleaning processes and equipment use in Armenia, Bulgaria, Czech Republic, Greece, Northern Ireland, Poland and Russia; reusing backwash water in Bosnia & Herzegovina, Italy, Nigeria and Romania; upgrading waste water plants in Russia; and optimising bottle washing in Hungary and Nigeria. We also invested 5.3 million which helped us to reduce energy consumption by 375 million MJ. As a result, our energy use ratio improved by 7.2% compared with We continued to require implementation of our Top 10 Water and Top 18 Energy saving initiatives at all sites, which contributed to improvements in resource consumption. Implementation of mandatory water initiatives has been completed at 68.2% of sites, and we have achieved a 59.4% implementation rate for energy initiatives. 49
52 Cost leadership continued Packaging recycling and waste management In 2015 we continued with our initiatives to reduce packaging and make our PET bottles lighter. As a result, we avoided 1,597 tonnes of PET material (incremental volume) which led to 4,000 tonnes of CO 2 avoidance. At the same time, our total usage of recycled PET material was increased by 19.4% vs which saved 31,200 tonnes of CO 2. The Plantbottle quantity (recyclable packaging partially made from plants) was increased by 254% and now we use it in 10 of our countries. Currently four of our production sites (Vals and Dietlikon (Switzerland), Knockmore Hill (Northern Ireland) and Edelstal (Austria)) send 0 waste to landfill. New commitments Prior to the United Nations Climate Change Conference meeting in Paris in late 2015, we joined We Mean Business, a coalition of organisations that believe that transitioning to a low carbon economy is the only way to secure sustainable economic growth and prosperity for all. Along with other coalition members, we committed to: adopt a science-based emissions reduction target for our carbon footprint; put a price on carbon; engage responsibly to advance climate policy; and report climate change information in our corporate reporting as a fiduciary duty. In 2015, we reset our targets for minimising water and energy consumption and reducing carbon footprint. Having reached 30% water use ratio reduction vs. our baseline year of 2004, we set a new commitment to further reduce water use ratio by 2020 vs by 30%. In energy use, we reached our 2020 energy reduction goal of 40% reduction of energy use ratio vs. our baseline year of 2004 and we set a new commitment to further reduce energy use ratio by 47% by 2020 vs We overachieved our 2020 CO 2 ratio goal from operations, reaching 43.6% reduction vs. our baseline year of This is 3.6pp higher than the initial commitment. We have now set a new commitment to further reduce the carbon ratio from direct operations by 50% by 2020 vs We also are working for new commitments in renewable energy and landfill waste. Water use ratio in plants (litre/litre of produced beverage) Target -30% vs New goal Operational water footprint (billion litres) Target -75% vs Goal Energy use ratio in plants (MJ/litre of produced beverage) Target -47% vs New goal CO 2 ratio (scopes 1 and 2) (gco 2 /litre of produced beverage) % vs CO 2 ratio (scopes 1, 2 and 3) (gco 2 /litre of produced beverage) % vs Landfill waste ratio (g/litre of produced beverage) % vs Target 2020 New goal Target 2020 Goal Target Goal Scope 2 number in 2015 is calculated by using the market-based approach. All previous years numbers have been used as a proxy since a true market-based result cannot be calculated. 50

53 Strategic Report Corporate Governance Financial Statements Supplementary Info & Swiss Statutory Reporting Financial review Our restructuring efforts in recent years and tight cost management enabled us to capture the year s volume leverage, which in turn, helped to secure a 100 basis point comparable operating margin expansion, our biggest increase in seven years. While lower input costs and adverse foreign exchange movements had significant impact on our profits during 2015, these moved in opposite directions, largely offsetting each other. Ultimately, it was our production optimisation programmes, along with other restructuring and efficiency measures, that leveraged margins as volume growth picked up. This has encouraged us to continue controlling all the drivers we can influence in our business to further improve our financial performance. Overall, we achieved strong performance for 2015 by focusing on winning in the marketplace, continually improving efficiency, and managing cash and risk prudently. This is evidenced by: Achievement of volume growth in all three segments; Improvement in currency-neutral revenue per case for the fifth consecutive year; An 11.4% increase in comparable operating profit with 100 basis point margin expansion; A 13.5% increase in comparable EPS compared to prior year; and Growth in free cash flow as a result of improvements in working capital, operating profit and capital expenditure. Improved financial performance reflects disciplined focus on managing costs and risks Michalis Imellos Chief Financial Officer Volume growth +2.6% Comparable operating profit 473m Free cash flow 412m 51
54 Financial review continued Key financial information Key financial information % change Volume (million unit cases) 2,055 2, % Net sales revenue () 6,346 6, % Net sales revenue per unit case ( ) % FX-neutral net sales revenue per unit case ( ) % Operating profit (EBIT) () % Comparable EBIT () % EBIT margin (%) bps Comparable EBIT margin (%) bps Net profit () % Comparable net profit () % Comparable basic earnings per share ( ) % Figures are rounded. Income statement We achieved a 2.6% increase in volume during the year, following a 2.8% decline in the prior year. Volume growth was evident in all market segments and all categories, with the exception of ready-to-drink tea. Due to the effect of currency headwinds, net sales revenue decreased by 2.5% in 2015, compared to the prior year. The decrease was in spite of strong volume performance in all three segments and the positive result from our revenue growth management initiatives. On a reported basis, net sales revenue per unit case declined by 4.9%. In contrast, on a currency-neutral basis, net sales revenue per unit case improved by 0.3%. Cost of goods sold decreased by 4.1% and comparable cost of goods sold decreased by 4.0% for 2015 compared to the prior year. Input costs, particularly prices for EU sugar and PET resin for plastic bottles, continued to be favourable. We achieved an increase in gross profit of 0.4%, with profits increasing slightly from 2,318 million in 2014 to 2,327 million in Comparable gross profit margin increased from 35.7% in 2014 to 36.7% in 2015, mainly due to favourable input costs and operating leverage on our fixed production base. Operating expenses decreased by 2.4% in 2015 compared to Our restructuring efforts in recent years and tight cost management have optimised our cost base, better positioning the business for operating leverage. Stable performance in operating expenses as a percentage of net sales revenue was the result of higher currency management costs in a very volatile year, coupled with the sharply adverse currency impact on revenue, offsetting the improvements from our cost management initiatives. Comparable operating profit (EBIT) was 473 million, leading to a 100 basis point expansion in comparable EBIT margin to 7.5%. Favourable input costs, increased volume and the benefits from our revenue growth management initiatives more than offset the adverse impact of foreign exchange rates. On a reported basis, we delivered 418 million of EBIT in This was a 57 million improvement compared to Total net finance costs decreased by 5 million in 2015 compared to 2014, mainly due to the cessation of the need for hyperinflation accounting in Belarus and lower net foreign exchange losses. Total reported income tax charge was 76.4 million, up from 57.8 million in The corresponding effective tax rate, worldwide corporate tax charge shown as a percentage of the worldwide profit before tax, increased to 21.4% compared to 16.4% in Year-on-year movement was mainly affected by the net gain resulting from the sale of an investment in 2014 which was treated as a non-recurring item when calculating comparable financial indicators. On a comparable basis, effective tax rate increased from 23.3% in 2014 to 23.9% in 2015 mainly as a result of the mix of taxable profits by country, the non-deductibility of certain expenses as well as non-taxable income and one-off items realised across our territory. On a comparable basis, profit after tax attributed to owners of the parent increased by 13.3% in 2015 compared to 2014, mainly driven by higher operating profitability. However, reported profit after tax attributable to owners of the parent decreased by 4.9%. This decrease primarily reflects the 60 million gain in 2014 from the sale of our interest in the Bulgarian brewery Zagorka A.D. Comparable net profit of 314 million and comparable earnings per share of increased by 13.3% and 13.5%, respectively, compared with the prior year. Reported net profit and reported basic earnings per share were 280 million and 0.771, respectively, in the year. Dividend In line with the Group s progressive dividend policy and the Board s assessment of progress against the Group s strategy, the Board of Directors has proposed a dividend of 0.40 Euros per share. This is an 11.1% increase from 0.36 Euros per share for The dividend payment will be subject to shareholder approval at the 2016 Annual General Meeting. Balance sheet Total non-current assets decreased this year by 152 million due to the impact of foreign currency translation. Net current assets decreased by 489 million due to the use of own funds for the repayment of the US$400 million bond which matured in September 2015 and the improved working capital position. The Group s total non-current liabilities also decreased, by 674 million, largely as a result of the reclassification of the outstanding bonds of 600 million maturing in November 2016 from non-current to current liabilities Assets Total non-current assets 4,665 4,817 Total current assets 1,868 2,062 Total assets 6,533 6,879 Liabilities Total current liabilities 2,491 2,196 Total non-current liabilities 1,218 1,892 Total liabilities 3,709 4,088 Equity Owners of the parent 2,820 2,787 Non controlling interests 4 4 Total equity 2,824 2,791 Total equity and liabilities 6,533 6,879 52
55 Strategic Report Corporate Governance Financial Statements Supplementary Info & Swiss Statutory Reporting Cash flow As a result of increased operating profitability and improvement in working capital, we achieved a 7.7% increase in net cash from operating activities in 2015 compared to Capital expenditures, net of receipts from the disposal of assets and including principal repayments of finance lease obligations, decreased by 7.4% in the year. In 2015, our total capital expenditures were 328 million, of which 55% was investments in production equipment and facilities and 24% was for the acquisition of marketing equipment. This compares to capital expenditures of 354 million in 2014, of which 51% was investments in production equipment and facilities and 25% was for the acquisition of marketing equipment. Free cash flow grew by 79 million to 412 million in 2015, reflecting increased cash from operating activities, primarily operating profits, reduction in working capital and lower capital expenditure. Both the balance sheet working capital position and the working capital days improved in the year Cash flow from operating activities Payments for purchases of property, plant and equipment (332) (363) Proceeds from sales of property, plant and equipment Principal repayments of finance lease obligations (14) (14) Free cash flow Figures are rounded. Financial risk management Our Group activities create exposure to a variety of financial risks. These include currency risk, interest rate risk, commodity risk, counterparty risk and liquidity risk. Given the recent volatility in currency and commodity markets, proactively managing these risks has never been more critical. Our overall risk management programme focuses on the unpredictability of financial markets and seeks to minimise potential adverse effects on our financial performance. While we regularly use derivative products like forwards, options and futures, these are solely used for the purpose of hedging underlying exposures to foreign currency exchange rate risk, interest rate risk and commodities pricing volatility. None of these financial instruments are leveraged, used for trading purposes or taken as speculative positions. Given the Group s operating activities, we are exposed to a significant amount of foreign currency risk. Our foreign currency exposures arise from adverse changes in exchange rates between the Euro, the US Dollar and the currencies of our non-euro countries. Transaction exposures arise mainly from raw materials purchased in currencies such as the US Dollar or Euro, which can lead to higher cost of sales in local currencies throughout our territory. Translation exposures arise as many of our operations use currencies other than the Euro, and any change in these currencies against the Euro impacts our consolidated income statement and balance sheet when results are translated into Euros. Our treasury policy requires the hedging of rolling 12-month forecasted transaction exposures within defined minimum and maximum coverage levels, a range of 25% to 80%, and 100% of balance sheet exposures in each major foreign currency with an active market for hedging and without significant currency control. Where available, we use derivative financial instruments to reduce our net exposure to currency fluctuations. The Group is exposed to market risk arising from changing interest rates, primarily in the Euro zone. We periodically evaluate the desired mixture of fixed and floating rate liabilities and modify the interest payments based on the desired mixture of debt. We also use interest rate swaps to manage interest rate costs. Fluctuations in the prices of key raw materials expose the Group to market risk. For a number of raw materials, where there are available tools to actively manage price risks, the relevant provisions are included in our treasury policy. Our treasury and procurement departments are jointly responsible for applying the relevant policies. In accordance with our treasury policy, commodity hedging activities are conducted for a 36-rolling-month period. The policy dictates minimum and maximum coverage levels per time period, with a layered approach applied to gradually lower hedge percentages. Different minimum and maximum hedge levels are applicable for each underlying commodity. Hedging activities are conducted through financial derivatives where available, or through relevant provisions in supply contracts. Our counterparty risk is managed by establishing approved counterparty limits, and detailing the maximum exposure that we are prepared to accept with respect to individual counterparties. The limits are reviewed and monitored on a regular basis. Our general policy is to retain a minimum amount of liquidity reserves in the form of cash on our balance sheet while maintaining the balance of our liquidity reserves in the form of unused committed facilities. This helps us ensure that we have cost-effective access to sufficient financial resources to meet our funding requirements. These include the day-to-day funding of our operations as well as the financing of our capital expenditure programme. In order to mitigate the possibility of liquidity constraints, we endeavour to maintain a minimum of 250 million of financial headroom 1. Borrowings Our strategy is to maintain a ratio of net debt to comparable EBITDA in the range of 1.5 to 2.0. We achieved this in 2015, ending the year with a ratio of 1.5. Given the extreme volatility in our markets in the near term, we believe it is prudent to maintain this ratio. The Group s funding strategy in the debt capital markets involves raising financing through our wholly-owned Dutch financing subsidiary, Coca-Cola HBC Finance B.V., except in the case of subsidiaries with joint control, or countries where certain legal or tax restrictions apply. In such cases, financing at lower levels in the organisation may be considered. We use our 3 billion European Medium Term Note programme and our 1 billion Global Commercial Paper programme as the main basis for our financing. We endeavour to maintain our presence and profile in the international capital markets and, where possible, to broaden our investor base. We also seek to maintain a well-balanced redemption profile. Since the year end, we successfully issued a 600 million bond, repayable in November 2024, at a fixed rate of 1.875%, to be utilised in the refinancing of the 600 million bonds maturing in November Borrowing structure () Bonds issued: 1,395 Commercial paper: 174 Finance leases: 105 Other: Financial headroom refers to the sum of committed but unused financing available, cash and cash equivalents less outstanding commercial paper and current portion of long-term debt, after considering cash flows from operating activities, dividends, interest expense, tax expense, and capital expenditure requirements. 53
56 Financial review continued Looking ahead In 2016, our business faces two considerable challenges. Significant foreign currency headwinds will remain, and input costs, which were favourable in 2015, are expected to rise in It is critical that we continue pursuing volume growth and cost efficiencies in 2016, as well as continue improving the value we get from every case we sell through revenue growth management initiatives including pricing. The ongoing instability in Ukraine and Russia has adversely impacted the economies of these countries, and among other things, resulted in increased volatility in their currencies. The macroeconomic and financial environment in Greece remains fragile and may further impact consumers disposable incomes. Furthermore, in Nigeria, the depressed oil price, tight capital controls and the risk of a Nigerian Naira devaluation add to the challenges. Management continuously monitors and assesses the conditions in these markets in order to ensure that timely actions and initiatives are undertaken to minimise potential adverse impact on our performance. Our success in mitigating the impact of similar challenges in 2015, and the recovery we are witnessing in our Established and Developing markets segments, gives us confidence in our ability to continue to achieve profitable growth. As always, our priorities are controlling what we are able to manage, maintaining our strength and positioning our Company for top and bottom line growth. Reconciliation of comparable to reported financial results 2015 Group financial results COGS 1 Gross profit 2 EBIT 3 EBITDA 4 Tax 5 Net profit 6 EPS 7 ( ) Adjusted Reported (4,019) 2, (76) Restructuring costs (12) Commodity hedging Other tax items 10 (10) (10) (0.028) Comparable (4,018) 2, (99) Group financial results COGS 1 Gross profit 2 EBIT 3 EBITDA 4 Tax 5 Net profit 6 EPS 7 ( ) Adjusted Reported (4,193) 2, (58) Restructuring costs (11) Commodity hedging (3) Other tax items 10 (13) (13) (0.037) Non-recurring items 11 (60) (0.164) Comparable (4,184) 2, (85) Figures are rounded. 1. Reported COGS refers to cost of goods sold. 2. Reported Gross Profit refers to gross profit. 3. Reported EBIT refers to operating profit. 4. Adjusted EBITDA refers to operating profit before deductions for depreciation and impairment of property, plant and equipment (included both in cost of goods sold and in operating expenses), amortisation and impairment of intangible assets, employee share options and performance shares and other non-cash items, if any. 5. Reported Tax refers to tax. 6. Reported Net profit refers to profit after tax attributable to owners of the parent. 7. Reported EPS refers to basic earnings per share. 8. Restructuring costs comprise costs arising from significant changes in the way we conduct business, such as significant supply chain infrastructure changes and centralisation of processes, which are included within the income statement line restructuring costs. However, they are excluded from the comparable results in order for the user to obtain a proper understanding of the Group s financial performance. Net profit for 2015 includes 1 million from restructuring within joint ventures (2014: 7 million). 9. The Group has entered into certain commodity derivative transactions in order to mitigate its exposure to commodity price risk. Although these transactions are economic hedging activities that aim to manage our exposure to sugar, aluminium and gas oil price volatility, they do not qualify for hedge accounting. In addition, the Group recognises certain derivatives embedded within commodity purchase contracts that have been accounted for as standalone derivatives and which do not qualify for hedge accounting. The fair value gains and losses on the derivatives and embedded derivatives are immediately recognised in the income statement in the cost of goods sold line item. The Group s comparable results exclude the unrealised gains or losses resulting from the mark-to-market valuation of this hedging activity. These gains or losses will be reflected in the comparable results in the period when the underlying transactions will occur, to match the profit or loss impact of the underlying transactions. 10. Other tax items represent the tax impact of both changes in income tax rates affecting the opening balance of deferred tax and other one-off items arising during the year. 11. Non-recurring items refer to the gain included within our share of results of equity method investments from the sale in 2014 of Zagorka by Brewmasters Holdings Ltd, subsidiary of Brewinvest S.A. joint venture with Heineken. 54

57 Strategic Report Corporate Governance Financial Statements Supplementary Info & Swiss Statutory Reporting Risk management Business Resilience: Managing our risks and opportunities Adopting an all-encompassing business resilience approach supports growth while protecting our business. As we continue to operate in an environment that is shaped by uncertainty, ambiguity, complexity and volatility, we have adopted a combination of proactive and responsive strategies to address these challenges. These are managed through our Business Resilience function, which is headed by our Group Chief Risk Officer (CRO). The function draws together our Group-wide enterprise risk management, insurance, security, fraud control, crisis management and business continuity programmes. The Business Resilience team determines the strategy and then standardises and simplifies processes and structures across the programmes to ensure that all elements add value for our business. In the area of risk management, the function collaborates with business units to identify, review and propose actions and mitigation plans to address risks arising from business activities. The greater visibility of this work, coupled with the wide spectrum of activities it covers, has strengthened our ability to manage risk, making us a more resilient business. Business resilience Enterprise Risk Management Support Growth and Protect the Business Security and Fraud Control Insurance Crisis Management Strategise Standardise Simplify Business Continuity Enterprise risk management We rolled out a new Board-endorsed Risk Management policy in 2015, which stipulates the scope, context, objectives and management accountabilities within our enterprise risk management programme. Our enterprise-wide risk management process was likewise refreshed and enhanced to improve our understanding of our risks and opportunities and adapt our business response based on experience and changing circumstances. Our teams utilise internal and external risk radar to detect changes in our operating environment, which allows us to work proactively to minimise exposures and leverage opportunities. This also gives us the ability to respond rapidly and decisively to an emerging crisis. During 2015, we continued to roll-out our extensive enterprise risk management culture change programme, embedding risk management throughout the Company. The programme places an equal emphasis on having the right processes and tools in place, building our people s risk management capabilities, and executing a strong change and communication plan. This provides us with a competitive advantage in the market and is a key to driving business growth in what continues to be a complex operating environment. Our alignment with the changes to the risk elements of the UK Corporate Governance Code was further enhanced during the year, including redefining the Group s risk appetite. As will be clear from the description of how we manage our material issues (see pages 16-21) we see effective risk management as a way of leveraging opportunities as well as mitigating risks. The CRO worked closely with the Audit and Risk Committee and the Board on the important element of risks and opportunities as an integral part of our risk strategy. We have thoroughly reviewed the Code, refining and aligning our processes to ensure full compliance. The Operating Committee and the Board receive regular updates on our progress toward alignment. Our focus is on risk management processes, principal risks and risk appetite, risk culture and risk assurance, risk profile and risk mitigation, monitoring and review activities, and risk communication and reporting. We continue to enhance our enterprise risk management framework, ensuring that our risks and opportunities are visible and are managed within a consistent and standardised process. The framework provides both bottom-up and top-down risk identification, evaluation and management, ensuring that risks and opportunities are subject to continuous review at the business unit and corporate support function levels. The operational processes are supported by the work of the Group Risk Forum, which places a strategic lens on the aggregated risks from the operations. This information forms the basis of the data that links to our principal risks. Enterprise risk management is as much about recognising and leveraging opportunities as about mitigating risks. 55
58 Risk management continued Risk Management Framework Board and Committees (Audit and Risk Committee) Operating Committee Sponsor: General Counsel Group Risk Forum Chair: Group Chief Risk Officer Countries, Regions, Functions, Projects Stakeholder Roles Country Level Management identifies and evaluates risks and mitigation plan. Monthly monitoring routine as part of management meeting. Quarterly submission to Business Resilience Function for review. Risks evaluated and aligned to strategy as part of the Business Plan process. Region Level Quarterly submissions are aggregated bi-annually by Region, reviewed by the Regional Directors, Regional CFOs, Regional Supply Chain Directors & CRO. Ensures independent assessment of country risks and mitigation plans. Note: Function Heads and major project Leaders also review their risks bi-annually. Group Risk Forum Convenes bi-annually as an independent review forum and strategic think tank. Reviews the aggregated risks against broader Group objectives and ensures effective risk mitigation strategies are in place. Bi-annual strategic risk/ opportunity summary is prepared for the Operating Committee and the Audit & Risk Committee, and formulates principal risks. Operating Committee Operating Committee has the overall responsibility for Enterprise Risk Management. Assigns risks against our strategic pillars. Assigns accountable risk owners against the Company s Risk Universe. Board Establishes our risk appetite. Oversees risk management systems, strategies and culture to ensure principal risks and opportunities are identified and managed. Audit & Risk Committee receives quarterly updates on strategic and emergent risks and reviews the Enterprise Risk Management framework on an on-going basis. A robust framework Within our ongoing management programme, the aggregated risks and opportunities are reviewed by the Group Risk Forum, the Operating Committee and, ultimately, the Board, with feedback provided to the business units and support functions. The Group Risk Forum plays a pivotal role in the process, serving as an independent review mechanism and our internal think tank on strategic risk. Chaired by the CRO, the Forum includes senior business leaders from all functions and draws on their experience and insight to provide additional evaluation of the Group s risks and opportunities. In particular, they examine the risks within the context of our strategic priorities of customer preference, consumer relevance, cost leadership and community trust. They also provide guidance and input on the principal risks, which are subsequently reviewed by the Operating Committee and the Board. The Group Risk Forum, the Operating Committee and the Board also view risks in the context of our assessment of the most material issues for our Company. (See page 16 for more on how we assess materiality.) By considering business risks in the context of materiality, we fine-tune our prioritisation and ensure that we take into account the perspectives of key stakeholders. Our enterprise risk management programme solidifies our competitive advantage. 56
59 Strategic Report Corporate Governance Financial Statements Supplementary Info & Swiss Statutory Reporting A process-oriented approach to risk management The Board is ultimately responsible for the Group s risk management and internal control systems, and for reviewing their effectiveness. The Board defines the Group s risk appetite and monitors risk exposure to ensure that the nature and extent of the principal risks facing the Company are managed in alignment with our goals and objectives. While responsibilities for overseeing these important ongoing processes rest with the Audit and Risk Committee, the Board as a whole is informed of the outcomes and all significant issues and evaluates the risks on a quarterly basis. The detailed process of risk identification, review and escalation includes the following steps: Regular risk assessments are conducted within markets and corporate office support functions to assess progress with risk mitigation. Significant operational risks and associated management actions are escalated to the Region Directors and the Business Resilience Function. The Company s Group Risk Forum reviews the identified risks and presents issues relating to critical exposure to the Operating Committee. The Operating Committee reviews critical risk exposures and subsequently reports material changes and mitigating actions to the Audit and Risk Committee. Functional collaboration is central to the success of the programme and strong partnerships have been established with the Sustainability, Health and Safety, and Internal Audit functions. Continuous process improvement occurs by sharing best practice throughout our Company and across the Coca-Cola System through regular meetings. Key features of our enterprise-wide risk management system are: Group statements on strategic direction, ethics and values. Clear business objectives and business principles. A formalised risk management policy. Clearly defined risk universe aligned to our strategic priorities: Community Trust, Consumer Relevance, Customer Preference and Cost Leadership. Risk management integration into Business Planning processes. A continuous process for the identification and evaluation of significant risks to the achievement of business objectives. Implementation of management processes to mitigate significant risks to an acceptable level. Implementation of a cultural change programme to embed risk management into the fabric of the business. Focus on enhancing risk management capabilities of all line managers across all operations and functions. Adoption of risk management software, which streamlines both information collection and risk aggregation. Continual monitoring of our internal and external environment for factors that may change our risk profile. Annual evaluation of both the type and amount of external insurance purchased, with reference to the availability of cover and cost, measured against the likelihood and magnitude of the identified risks. Defining our principal risks Our strategic priorities provide the context for guiding us in the management of the risks faced by our business. The most important risk categories are macroeconomic and operational. Macroeconomic risks relate to the external environment and the markets in which we operate. We have less control over these risks than we do over operational risks, such as product quality. The overview of our most important risks does not include all the risks that may ultimately affect our Company. Some risks not yet known to us, or currently believed to be immaterial, could ultimately have an impact on our business or financial performance. We remain constantly vigilant to changes to our economic and regulatory operating environments, to ensure we proactively identify and evaluate new risks. Our enhanced ability to aggregate and analyse risk, together with the enhanced role of the Group Risk Forum which now functions as a strategic think-tank, coupled with detailed discussions with the Operating Committee and the Board, led us to identify four existing business risks, for elevation to principal risks in These build on our 2014 principal risks and in summary they address the areas of sustainability, cyber security, business transformation and legal and regulatory compliance. 57
60 Our principal risks Key Increased No change New: business risk elevated in 2015 to a principal risk via robust evaluation process Principal Risks Risk Impact Key Mitigations Risk Universe Strategy Risk Status Breach of laws or regulations Inadvertent non-compliance with the wide-ranging local laws and Damage to our corporate reputation Significant Annual tone from the top messaging Code of business conduct training and awareness Legal and Regulatory Community Trust New regulations that exist financial Anti-bribery policy and across our diverse penalties compliance training mix of markets. Management Internal control assurance time diverted to resolving legal issues programme with local management accountability Risk-based internal control framework (2015) Speak Up hotline implemented (2015) Legal function in constant dialogue with regulators Change management Failure to effectively execute major business transformations, or performance issues with third-party providers that we deploy as part of our business transformation. Under-delivery of expected transformation results Disengaged employees Reduction in profitability Market confidence in our ability to deliver on strategy is weakened Corporate reputation is adversely affected Project plans and change management strategies in place Board and Operating Committee conduct regular tracking of actual performance against the business case Business Transformation Customer Preference New Climate, carbon and water Failure to meet our stakeholders expectations in making a positive contribution to the sustainability agenda, particularly relating to climate change, carbon emissions and water usage. Long-term damage to our corporate reputation Less influence in shaping the citizenship and sustainability agenda Water stewardship programmes that are reducing our water consumption Carbon and energy management programmes Packaging waste management programmes Partnering with NGOs and INGOs on common issues such as nature conservation Partnering with local communities to minimise environmental impact Focus on sustainable procurement Sustainability Community Trust New Cyber attacks and system availability Dependence on IT systems and infrastructure in our interaction with our customers, suppliers and consumers together with the protection of the data we have created, or that has been provided to us. Financial loss Operational disruption Damage to corporate reputation Noncompliance with statutory data protection legislation Monitoring, identification and addressing cyber threats and suspicious internal computer activity Training on information management and the protection of information Disaster recovery testing and building resilience into our cyber risk programme Cyber Security Customer Preference New 58
61 Strategic Report Corporate Governance Financial Statements Supplementary Info & Swiss Statutory Reporting Principal Risks Risk Impact Key Mitigations Risk Universe Strategy Risk Status Channel mix A continued increase in the concentration of retailers and independent wholesalers on whom we depend to distribute our products. The immediate consumption channel remains under pressure as consumers switch to at-home consumption. Reduced profitability Continued to increase our presence in the discounter channel during 2015 Collaboration with customers to identify opportunities for joint value creation Right Execution Daily (RED) strategy continues to support our commitment to operational excellence Commercial and Competition Customer Preference Consumer health Failure to adapt to changing consumer health trends and addressing the misconceptions on the health impact of soft drinks. Failure to achieve our growth plans Damage to our brand and corporate reputation Loss of consumer base Focus on product innovation Expand our range of low- and no-calorie beverages Reduce the calorie content of products in the portfolio Clearer labelling on packaging Promote active lifestyles through consumer engagement programmes focused on health and wellness Beverage Category Acceptability Consumer Relevance Declining consumer demand Challenging and volatile macroeconomic conditions can affect consumer demand. This includes political and security instability in Russia, Ukraine and Nigeria. Eroded consumer confidence affecting spending Inflationary pressures Social unrest Safety of people Asset security Seek to offer the right brand, at the right price, in the right package, through the right channel Robust security practices and procedures to protect people and assets Crisis response and business continuity strategies Political & Security Stability Customer Preference Foreign exchange Foreign exchange exposure arising from changes in exchange rates between the Euro, US Dollar, and other currencies in the markets we serve. Negative EBIT impact Treasury policy requires hedging of 25% to 80% of rolling 12 month forecasted transactional exposure Hedging beyond 12 months if forecast transactions are highly probable Derivative financial instruments are used, where available and/or appropriate, to reduce net exposure to currency fluctuations Tax & Treasury Cost Leadership 59
62 Our principal risks continued Key Increased No change New: business risk elevated in 2015 to a principal risk via robust evaluation process Principal Risks Risk Impact Key Mitigations Risk Universe Strategy Risk Status People and talent Inability to attract and retain sufficient numbers of qualified and experienced Failure to achieve our growth plans Focus on developing leadership talent Right people in the right positions across the business Employee Engagement & Retention Community Trust employees in Focus on employee engagement competitive talent ensuring support for our values markets and inability Promote operational excellence to ensure their ongoing engagement Create shared value with the and commitment. communities in which we work to ensure we are seen as an attractive employer Quality The occurrence of quality issues, or the contamination of our products. Reduction in volume and net sales revenue Damage to brand and corporate reputation Loss of consumer trust Stringent quality processes in place to minimise the occurrence of quality issues Early warning systems (consumer information centres and social media monitoring) that enable issue identification Robust response processes and systems to address quality issues, ensuring customers and consumers retain confidence in our products Product Quality & Food Safety Consumer Relevance Strategic stakeholder relationships We rely on our strategic relationships and agreements with The Coca-Cola Company, Monster Energy and our premium spirits partners. Termination of agreements, or less favourable renewal terms than currently experienced, could adversely affect profitability Management focus on effective day-to-day interaction with our strategic partners Working together as effective partners for growth Engagement in joint projects and business planning with a focus on strategic issues Participation in Top to Top senior management forums Stakeholder Relationships Community Trust Taxation Regulations on consumer health and the risk of the targeting of our products for discriminatory tax and packaging waste recovery. Reduction in profitability Proactively work with governments and regulatory authorities to ensure that the facts are clearly understood and that our products are not singled out unfairly Shape sustainability agenda relating to packaging and waste recovery Engage with stakeholders, including NGOs and the communities in which we operate, on strategies to protect the environment Legal and Regulatory Community Trust 60
63 Strategic Report Corporate Governance Financial Statements Supplementary Info & Swiss Statutory Reporting Viability statement 1. Assessment of prospects Our business model and strategy, as outlined on pages 8 and 12 of this report, are key underlying factors for understanding and assessing our prospects. Our strong sales and execution capabilities, attractive geographic diversity, market leadership, global brands, and diverse beverage portfolio are the fundamentals of the Group s business model and have been in place for several years. Our strategy has been adapted over time in order to sustainably create value for our shareholders, suppliers, employees, customers and communities we serve. The Group s business model has proven to be strong and defensive even in challenging market conditions and our Board has historically applied a conservative approach to the Group s decisions relating to major projects and investments. From 2010 to 2015, we generated free cash flow of at least 333m per annum with an average of 412m. The Board considers that our diverse geographic footprint including exposure to emerging markets with low per capita consumption, and our proven strategy in combination with our leading market position offer significant potential for growth. In making this statement the Audit and Risk Committee and the Board as a whole, carried out a robust assessment of the principal risks facing the Group, including those that would threaten our business model, future performance, solvency or liquidity. The assessment process and key assumptions Qualitative and quantitative assessments formed the central pillars of the assessment process. The qualitative assessment analysed the internal processes of Enterprise Risk Management; Business Planning (both short and long term); and Liquidity Management to ensure that the risks to viability are understood and managed. This process aligns with, and draws on, the analysis and evaluation of the Group s principal risks as disclosed on pages The Board has concluded that the Company s processes provide a comprehensive framework that effectively supports the operational and strategic objectives of the Group and provides a robust basis for assessment and confirmation of the Company s ability to continue in operation and meet its obligations as they fall due over the period of assessment. 2. Assessment of viability While the five-year long-term plan, approved by the Operating Committee, reflects the Directors best estimate of the future prospects of the business, the potential impact of the principal risks on the Group have also been tested. The Board has drawn on these robust assessments of the principal risks, including events that could threaten the business model, future performance, solvency and liquidity of the Group in combination with the qualitative assessment and the stress testing. The period of viability has also been considered in terms of the Group s debt profile where the majority of the long-term borrowings have a minimum five-year maturity upon issuance together with our impairment review process, where goodwill and indefinitely-lived intangible assets are tested based on five-year forecasts (plus perpetuity considerations). Stress testing was performed on a number of scenarios including different estimates for sales volume and revenues, foreign currency rates and raw material costs, in addition to the sensitivity analysis inherently incorporated in our planning process. Our stress testing showed that due to the stable cash generation of our business, the Group would be able to withstand the impact of these scenarios occurring over the period of the financial forecasts by making adjustments, if required, to its operating plans within the normal course of business. From the undertaking of these processes the Board has concluded that the Group is well positioned to effectively manage its financial, operational and strategic risks. 3. Viability Statement Based on our assessment of prospects and viability as outlined above, the Directors confirm that they have a reasonable expectation that the Group will be able to continue operating and meet its liabilities as they fall due over the five-year period ending 31 December Supporting the qualitative assessment is the quantitative analysis that includes both sensitivity and stress testing. The quantitative assessment is performed through financial modelling evaluating the financial performance of the Group over a rolling five-year period, including but not limited to our ability to generate cash, as well as determining the financial headroom available at the end of each financial period. The model combines financial data from both the short and the long-term planning processes. In terms of the assumptions used we have taken into consideration, among others, the Group s expectations on key microeconomic data in the territories in which we operate such as gross domestic product, inflation and unemployment rate (factors impacting our consumers disposable income and consequently our sales volume and revenues), key raw material costs (including concentrate, sugar, PET and aluminium), foreign currency rates, the level of spending for production overheads and operating expenses, working capital levels and capital expenditure. 61

64 Board of Directors Refreshing business with our experienced team 62

65 Strategic Report Corporate Governance Financial Statements Supplementary Info & Swiss Statutory Reporting 63
66 Board of Directors continued 1. Anastassis G. David Non-Executive Chairman Mr. Anastassis David was appointed Chairman of the Board of Directors of Coca-Cola HBC on 27 January He joined the Board of Coca-Cola HBC as a non-executive director in 2006 and was appointed Vice Chairman in Mr. David brings to his role more than 20 years experience as an investor and non-executive director in the beverage industry. Mr. David is active in the international community and serves on the International Board of Advisors of Tufts University and on the Advisory Board of the Fares Center at Fletcher School. He serves as a member on the board of directors of Aegean Airlines S.A. and AXA Insurance S.A. He is a member of the Board of Trustees of College Year in Athens and is a member of the Executive Committee of the Cyprus Union of Shipowners. Mr. David is also a former Chairman of Navios Corporation. He holds a BA in History from Tufts University. 2. Dimitris Lois Chief Executive Officer Mr. Dimitris Lois began his career in 1988 at Grecian Magnesite S.A., where he held various managerial positions including that of business development manager. He joined Frigoglass S.A.I.C. in 1997 and after serving in various international positions, he was appointed managing director in August Mr. Lois joined the Group as Region Director in He was appointed Chief Operating Officer in 2009 and Chief Executive Officer in He holds a Master of Science in Chemical Engineering from Northeastern University and a Bachelor of Science in Chemical Engineering from Illinois Institute of Technology. 3. Antonio D Amato Independent non-executive Director Mr. Antonio D Amato began his business career in 1979 with Cartoprint in Milan, part of the Seda International Packaging Group SpA (formerly the Finseda Group), a leading European company in the production of food packaging materials. He was employed in various capacities and became president of Seda International Packaging Group SpA in Mr. D Amato was previously president and a member of the board of directors of Confindustria, the Confederation of Italian Industry. In August 2000, Mr. D Amato was appointed vice-president of the Union of Industrial and Employers Confederations of Europe (UNICE). From 2000 to 2012, Mr. D Amato was a member of the Italian National Council for Economy and Labor (CNEL). In July 2001, he became president of the LUISS University in Rome, a leading private Italian university. Mr. D Amato is a member of the Company s Nomination and Remuneration Committees. 4. George A. David, OBE, MFR Non-Executive Director Mr. George A. David, served as Chairman of the Company s Board of Directors from 1981 to 27 January He graduated from the University of Edinburgh in He began his career that same year with a group of companies controlled by his uncle A.G. Leventis in Nigeria. He serves on the boards of Petros Petropoulos S.A. and Kar-Tess Holding. He is a member of the board of the A.G. Leventis Foundation, chairman of the Centre for Asia Minor Studies, vice chairman of the Council of the University of Cyprus, Regent of the University of Edinburgh and a member of the Honorary board of the Hellenic Foundation for European and Foreign Policy. Mr. David is a member of the Company s Social Responsibility Committee. 5. Olusola (Sola) David-Borha Independent non-executive Director Mrs. Olusola (Sola) David-Borha is the Chief Executive of Stanbic IBTC Holdings plc, a full service financial services group with subsidiaries in Commercial Banking, Investment Banking, Pension and Non-Pension Asset Management and Stockbroking. Stanbic IBTC Holdings is listed on the Nigerian Stock Exchange. Prior to this appointment, Mrs. David-Borha served as Chief Executive of Stanbic IBTC Bank from May 2011 to November She also served as Deputy Chief Executive of the Bank and Head of Investment Banking Coverage Africa (excluding South Africa). Stanbic IBTC Holdings is a member of the Standard Bank group which in 2007 acquired a leading Investment Bank in Nigeria, IBTC Chartered Bank plc, where Mrs. David-Borha worked as an Executive Director prior to the merger. Between 1984 and 1989, Mrs. David-Borha worked in the Credit and Marketing department of NAL Merchant Bank PLC. Mrs. David-Borha holds a first degree in Economics, and obtained an MBA degree from Manchester Business School, United Kingdom. Her executive education experience includes the Advanced Management Programme of the Harvard Business School. She is an Honorary Fellow of the Chartered Institute of Bankers of Nigeria (CIBN), and serves as non-executive director on the Board of CR Services Credit Bureau plc and the University of Ibadan Business School, amongst others. She is also the Vice Chairman of the board of the Nigerian Economic Summit Group. Mrs. David-Borha is a member of the Company s Audit and Risk Committee. 6. Irial Finan Non-Executive Director Mr. Irial Finan is executive vice-president of The Coca-Cola Company and president of Bottling Investments Group ( BIG ), a multi-billion dollar internal bottling business, which has operations in five continents (North and South America, Europe, Africa and Asia), with revenues of more than $20 billion and more than 100,000 employees. Additionally, he is responsible for stewarding The Coca-Cola Company s equity investments and leading the concentrate product supply organisation. Mr. Finan currently serves on the Board of Directors for Coca-Cola FEMSA, Coca-Cola East Japan, the Coca-Cola Foundation, the supervisory board for CCE AG (Germany), G2G trading, Smurfit Kappa group and The American-Ireland Fund. He is non-executive director for Co-operation Ireland and NUI Galway Foundation. Mr. Finan has over 32 years experience in the Coca-Cola System. From 2001 to 2003, he served as Chief Executive Officer of the Group. Mr. Finan joined The Coca-Cola Company in 2004 as president of bottling investments and supply chain and was named executive vice-president in October He is a recipient of the Leslie C. Quick Jr. Leadership Award in recognition of his professional and personal commitment to Ireland. He is also a Stars of the South Honoree. 7. Anastasios I. Leventis Non-Executive Director Mr. Anastasios Leventis serves as a director of the Leventis Group, a diversified international business group, and as a trustee of the Leventis Foundation. In addition, Mr. Leventis is a director of Alpheus Group Limited, a private asset management company managing assets of private clients and charitable foundations. Mr. Leventis is vice president of the Council of the University of Cyprus, a member of the board of overseers of the Gennadius Library in Athens and a member of the board of the WWF in Greece. Mr. Leventis holds a B.A. in Classics from the University of Exeter and an MBA from New York University s Leonard Stern School of Business. 64

67 Strategic Report Corporate Governance Financial Statements Supplementary Info & Swiss Statutory Reporting 8. Christo Leventis Non-Executive Director Mr. Christo Leventis worked as an Investment Analyst with Credit Suisse Asset Management from 1994 to In 2001, he joined J.P. Morgan Securities as an Equity Research Analyst focusing on European beverage companies. In 2003, Mr. Leventis started the private equity investment arm of Alpheus, a private asset management company, and also serves as a member of its investment advisory committee. From 2003 until March 2014, Mr. Leventis was a member of the board of directors of Frigoglass S.A.I.C., a leading global manufacturer of commercial refrigeration products for the beverage industry. Mr. Leventis holds a B.A. in Classics from University College London and an MBA from the Kellogg School of Management in Chicago. 9. Sir Michael Llewellyn-Smith, KCVO, CMG Senior independent non-executive Director Sir Michael Llewellyn-Smith had a distinguished career in the British diplomatic service including postings to Moscow, Paris and Athens, culminating in positions as British Ambassador to Poland ( ) and British Ambassador to Greece ( ). He is currently vice-president of the British School at Athens, Honorary Fellow of St. Antony s College, Oxford, visiting Professor at King s College London and member of the council of the Anglo-Hellenic League. He is also a historian and author of a number of books about Greece. Sir Michael is senior independent director and chairman of the Company s Nomination, Remuneration and Social Responsibility Committees. 10. Nigel Macdonald Independent non-executive Director Mr. Nigel Macdonald was formerly a senior partner in Ernst & Young s UK practice, having been a partner for 27 years, during which he served as vice-chairman of the Accounting and Auditing Committees of its worldwide practice. Mr. Macdonald is a member of the Institute of Chartered Accountants of Scotland, of which he was the president between 1993 and He is chairman of the Royal Museums Greenwich Foundation; formerly he was the senior trustee of the United Kingdom s National Maritime Museum and chairman of both its remuneration committee and audit committee. Mr. Macdonald was a member of the UK s Cadbury Committee which developed a set of guidelines for effective Corporate Governance in the UK that has served as a model for several international corporate governance codes. Mr. Macdonald is chairman of the Company s Audit and Risk Committee. 12. José Octavio Reyes Non-Executive Director Mr. José Octavio Reyes is the former Vice Chairman of The Coca-Cola Export Corporation, a position in which he served from January 2013 until his retirement in March He was president of the Latin America Group of The Coca-Cola Company from December 2002 to December Following various managerial positions in Mexico, Brazil and in The Coca-Cola Company headquarters in Atlanta, Mr. Reyes was named President of the North Latin America Division of Coca-Cola in Prior to joining Coca-Cola, Mr. Reyes spent five years with Grupo IRSA, a Monsanto Company joint venture. Mr. Reyes has been a member of the board of directors of MasterCard WorldWide since January 2008 and is a member of the board of directors of Papalote Children s Museum in Mexico City and Fundación UNAM. Mr. Reyes holds a BS in Chemical Engineering from the Universidad Nacional Autónoma de México and an MBA from the Instituto Tecnológico de Estudios Superiores de Monterrey. Mr Reyes is a member of the Company s Social Responsibility Committee. 13. John P. Sechi Independent non-executive Director Mr. Sechi started his career as a financial analyst and audit manager. In 1985, he joined The Coca-Cola Company as an internal auditor. In 1987, Mr. Sechi became the Finance Director for Coca-Cola Great Britain Limited based in London. The following year, he was appointed General Manager of the European Supply Point Group and in 1990 he moved to Madrid to join the Iberian Division as Chief Financial Officer. In 1993, Mr. Sechi was promoted to President of the Central Mediterranean Division of The Coca-Cola Company, based in Milan, where he was responsible for operations in Greece, Cyprus, Malta, Bulgaria, Former Yugoslavia (Croatia, Serbia, Bosnia, Montenegro, Kosovo and FYROM), Albania and Italy. In 1998, he was promoted to President of the German Division, based in Dusseldorf. Mr. Sechi was Chairman of Globalpraxis, a commercial consulting firm, from 2001 to From 2007 until 2013, he was the President, Greater Europe of The Campbell Soup Company, and from 2006 to 2011, a non-executive Board member and Chairman of the Audit Committee of Coca-Cola Içecek. Mr. Sechi has a BA in Business Management from Ryerson University in Toronto and is a Chartered Accountant (Canada). Mr. Sechi is a member of the Company s Audit and Risk Committee. 11. Alexandra Papalexopoulou Independent non-executive Director Mrs. Papalexopoulou serves as an executive director of the Titan Cement Company S.A., and is currently responsible for the group s strategic planning. Titan Cement Company S.A. is a company established in Greece, listed on the Athens Exchange and engaged in the worldwide production and distribution of a range of construction materials. Previously, she worked for the OECD and the consultancy firm Booz, Allen & Hamilton, in Paris. Mrs. Papalexopoulou is treasurer and a member of the board of directors of the Paul and Alexandra Canellopoulos Foundation and a member of the board of directors of National Bank of Greece and the ALBA College of Business Administration Association. From 2003 until February 2015 she served as a member of the board of directors of Frigoglass S.A.I.C., and from 2007 to 2009 she served as a member of the board of directors of Emporiki Bank. Mrs. Papalexopoulou studied Economics at the Swarthmore College, USA, and Business Administration (MBA) at INSEAD, Fontainebleau, France. Mrs. Papalexopoulou is a member of the Company s Remuneration and Nomination Committees

68 Corporate governance report Dear Shareholder, On behalf of the Board, I am pleased to introduce the corporate governance report for the year ended 31 December Importance of corporate governance for the Company The Board is committed to meeting the highest standards of corporate governance. Operating in widely differing countries, in three continents, in various economic and regulatory environments, we have long recognised that strong governance and effective leadership are of critical importance to the Group in order to achieve our strategic goals. Our commitment to best practices in corporate governance plays a key role in managing our risks and opportunities and maintaining the trust of our stakeholders. Recognising the value of effective corporate governance, we have regularly monitored and adopted best practices since the Group was formed. The principal corporate governance rules applying to the Company (a Swiss corporation listed on the London Stock Exchange (LSE) with a secondary listing on the Athens Exchange) for the year ended 31 December 2015, and our compliance with such rules, are described in detail in the section below entitled Application of Corporate Governance Codes and the UK City code on takeovers and mergers. Key focus areas of the Board for 2015 The Board s principal focus during the year continued to be on the execution of our strategy, our strategic alignment with The Coca Cola Company, the development of our talent, the composition and effectiveness of the Board and the management of risks related to the external environment in our markets. This includes risks associated with currency volatility, geopolitical instability and negative macroeconomic indicators. We have a comprehensive process for the identification and management of risks, and our strategic priorities are clear and have been communicated to all levels within the Group. knowledge. Under Swiss law and our Articles of Association, the Company s Board of Directors is subject to re-election by our shareholders on an annual basis, with members being proposed by the Board s Nomination Committee, which since June 2015 has been composed of independent Directors. We understand the importance of the Board s role in establishing the tone from the top of the Company in terms of its culture and values, and our Directors lead by example as ambassadors of our values in order to cascade good behaviour throughout the organisation. Diversity The Board is committed to recruiting Directors from different backgrounds with diverse skills, personalities and experience. We have made progress in terms of gender diversity at Board level with the appointments of Sola David-Borha and Alexandra Papalexopoulou. We also continue to make good progress in improving the diversity of the Company s senior management. I remain confident that our performance on gender diversity will continue its upward trajectory and that selection processes will scrupulously adhere to our nomination policies on diversity while evaluating credentials necessary for the continued growth of our operations within a highly competitive and specialised industry. Further details of our approach to governance and our key achievements this year are described within our corporate governance report below. Anastassis G. David Chairman of the Board Board composition In 2015, we appointed Mrs. Olusola (Sola) David-Borha and Mrs. Alexandra Papalexopoulou as new independent non Executive Directors following the retirement from the Board of Mrs. Susan Kilsby and Mr. Christos Ioannou. Between them, Sola and Alexandra bring a wealth of relevant financial, operational and international experience to the Board. They also significantly enhance the diversity of the Board. The Board has concluded that Sola and Alexandra are independent in character and judgement and that they meet the independence criteria for purposes of the UK Corporate Governance Code. Board evaluation In line with our commitment to adhere to best corporate governance practices, a Board effectiveness evaluation was conducted during the second half of We have also organised an external Board evaluation for Further details are set out in the Nomination Committee report on page 82. We will continue to keep the composition and size of the Board under review. We believe that our Board is well balanced and diverse, with the right mix of international skills, experience, independence and 66
69 Strategic Report Corporate Governance Financial Statements Supplementary Info & Swiss Statutory Reporting Leadership and effectiveness Board and committee attendance in 2015 The following table shows the membership of the Board committees and includes the Directors attendance at Board and committee meetings during the period between 1 January and 31 December Board 1 Audit and Risk 2 Remuneration Nomination Social Responsibility Director Independent Attended Total meetings Attended Total meetings Attended Total meetings Attended Total meetings Attended Total meetings Anastassis G. David 3 No Dimitris Lois No George A. David No Irial Finan No 7 7 Antonio D Amato 4 Yes Christos Ioannou 5 Yes Sir Michael Llewellyn-Smith Yes Nigel Macdonald Yes Susan Kilsby 6 Yes Anastasios I. Leventis No 7 7 Christo Leventis 4 No 6 7 José Octavio Reyes No John P. Sechi Yes Alexandra Papalexopoulou 7 Yes Olusola (Sola) David-Borha 8 Yes Includes three conference calls. 2. Includes four conference calls. 3. Mr. Anastassis G. David stepped down as a member of the Nomination Committee in June 2015 and was only eligible for two meetings. 4. Messrs D Amato and Christo Leventis were not able to attend one Board meeting due to long-standing prior commitments. 5. Mr. Christos Ioannou retired from the Board and the Audit and Risk Committee on 24 June He was eligible to attend four of the seven meetings of the Board and four of the nine meetings of the Audit and Risk Committee. Mr. Ioannou was not able to attend one Audit and Risk Committee meeting due to long-standing prior commitments. 6. Mrs. Susan Kilsby retired from the Board, the Remuneration Committee and the Nomination Committee on 24 June She was eligible to attend four of the seven meetings of the Board, two of the four meetings of the Remuneration Committee and two of the four meetings of the Nomination Committee. 7. Mrs. Alexandra Papalexopoulou was appointed to the Board and the Nomination and Remuneration Committees on 24 June She was eligible to attend three of the seven meetings of the Board and two of the four meetings of the Nomination and Remuneration Committees. 8. Mrs. Olusola (Sola) David-Borha was appointed to the Board and the Audit and Risk Committee on 24 June She was eligible to attend three of the seven meetings of the Board and five of the nine meetings of the Audit and Risk Committee. Mrs. David-Borha was not able to attend one Board meeting due to long-standing prior commitments. General qualifications required of all Directors Coca-Cola HBC s Board Recruitment Policy requires that each Director is recognised as a person of the highest integrity and standing, both personally and professionally, in senior business, academic and government circles. Each Director must have a proven record of success in his or her field and must be ready to devote the time necessary to fulfill his or her responsibilities to the Company. In addition, each Director must demonstrate familiarity with and respect for good corporate governance practices, sustainability and the responsible dealing with social issues. The Board should remain a diverse body with diversity reflecting gender, ethnic background, age, nationality and professional experience. Qualification, skills and experience Business characteristics Directors Experience in finance, investments and accounting Our business is extensive and involves complex financial 11 transactions in the various jurisdictions where we operate. Broad international exposure and emerging and developing markets experience Our business is truly international with operations in 28 countries, with different stages of development, on three continents. 13 Extensive knowledge of our business and the fast moving consumer goods industry Manufacturing, route-to-market and customer relationship experience Risk oversight and management expertise Expertise in sustainability Community engagement experience Our business involves the manufacturing, sales and distribution of the world s leading non-alcoholic beverage brands. Our Board s responsibilities include the understanding and oversight of the key risks we are facing, establishing our risk appetite and ensuring that appropriate policies and procedures are in place to effectively manage and mitigate risks. Building community trust through the responsible and sustainable management of our business is an indispensable part of our culture Expertise in corporate governance and/or government relations Our business involves compliance with many different regulatory and corporate governance requirements across a number of countries as well as relationships with governmental and local authorities. 6 67
70 Corporate governance report continued Operation of the Board Board governance in the Company The governance process of the Board is set out in our Articles of Association and the Organisational Regulations. These regulations define the role of the Board and its committees, their respective responsibilities and authority, processes and relationship with management. The Articles and the Organisational Regulations can be found at investorrelations/corporategovernance. Role of the Board Our Board has ultimate responsibility for our long-term success and for delivering sustainable shareholder value. There is a clear division of responsibilities between the running of the Board and the executive responsibility for the running of our business. Key tasks of the Board include: Providing entrepreneurial leadership within the Company s control and risk management framework; Determining the long-term business strategy and objectives of the Group and monitoring the implementation of the strategy and the achievement of those objectives; Reviewing and approving the annual business plan; Setting appropriate risk parameters and monitoring to ensure that effective risk management and internal control processes are in place; Assessing the principal risks facing the Company s business model, future performance, solvency and liquidity; Assessing the longer-term viability of the Company; Reviewing and approving periodic financial reports; Performing Board and senior management succession planning; Setting the Company s values and standards and ensuring that its obligations to shareholders are understood and met; Monitoring the Group s compliance programmes to ensure effective corporate governance; and Supervising management. In addition, the Swiss Ordinance against Excessive Compensation in Listed Companies imposes certain obligations on the Board, including a requirement to prepare a remuneration report pursuant to Swiss law. The remuneration report must be made available for inspection, together with the Swiss business report and audit report, no later than 20 days prior to the ordinary shareholders meeting at the offices of the Company. Any shareholder may request a copy of these reports when available. Board of directors* Our Board has delegated specific tasks to its committees as set out in the Organisational Regulations and reports from these committees are set out in this Corporate Governance Report. Membership of the Board and Board Committees On 31 December 2015, our Board comprised 13 Directors: the Chairman, the Vice-Chairman, one Executive Director and 10 non- Executive Directors. The biographies of the Chairman, the Senior Independent Director, the chairmen of the Board Committees and the other members of the Board, the Audit and Risk Committee, the Nomination Committee, the Remuneration Committee and the Social Responsibility Committee are set out on pages Mr. George A. David stepped down as Chairman of the Board on 27 January 2016 and will retire as a Director with effect from the AGM in June There is a clear separation of the roles of the Chairman and the Chief Executive Officer. The Chairman is responsible for the operation of the Board and ensuring that all Directors are properly informed and consulted on all relevant matters. The Chairman is also actively involved in the work of the Nomination Committee concerning succession planning and the selection of key people. The Chief Executive Officer, Mr. Dimitris Lois, is responsible for the day-today management and performance of the Company and for the implementation of the strategy approved by the Board. The Operating Committee as further described on page 74 supports Mr. Lois in his role. The non-executive Directors, of whom six are determined by the Board to be independent, are experienced individuals from a range of backgrounds, countries and industries. The composition of our Board complies with the UK Corporate Governance Code recommendation that at least half of the Board, excluding the Chairman, comprise independent directors. Board activity Our Board concentrated on the following main areas during 2015: Strategy The review of initiatives related to our strategic priorities: winning in the marketplace, growing value ahead of volume, reducing cost and generating cash. Another important focus area was the implementation of our Integrated Competitive Supply Chain programme, aimed at improving supply chain efficiencies across the Group. The Board also discussed and reviewed specific revenue growth management initiatives. Performance Throughout the year, the Board reviewed the performance of our business and held in-depth reviews of our largest operations, including those in Russia, Italy and Nigeria. The Board reviewed and approved our 2016 Business Plan and discussed our people plans and employee engagement and values indices. At every Board meeting in 2015, the Board reviewed our performance against our targets and key business indicators, including sustainability and community trust targets, ensuring that all relevant performance aspects are regularly monitored by the Board. Independent directors 6 Non-independent directors 6 * Total number of Board members excluding the Chairman. 68
71 Strategic Report Corporate Governance Financial Statements Supplementary Info & Swiss Statutory Reporting Succession planning and diversity The Board discussed the succession planning for senior roles within the Group and successfully handled the retirement and succession of the Chairman and two additional Board members in In addition, the Board discussed gender diversity and our initiatives to proactively develop female managers in order to improve diversity at senior levels. Risk management, corporate governance and internal controls Throughout the year, the Board reviewed our risk management programmes and controls. Particular focus was devoted to risks relating to the external environment, including risks associated with currency volatility, geopolitical instability and negative macroeconomic indicators. The Audit and Risk Committee also oversaw both the redesign of our Internal Control framework following the delisting from the New York Stock Exchange and enhancements made to the internal Audit function throughout the year. As part of the preparation of the Annual Report, the Board has carried out a review of the operation of our internal control framework concluding that all material, financial, operational and compliance controls were effective. Finally the Board assessed our ongoing viability in accordance with the requirements of the UK Corporate Governance Code as more fully described on page 61 of the strategic report. Key roles and responsibilities The roles and responsibilities of our Chairman, Chief Executive Officer, Senior Independent Director and Company Secretary are set out in detail in our Organisational Regulations which can be found at corporategovernance. Their key responsibilities are the following: The Chairman Leads the Board, presides over its meetings and ensures its effectiveness; Sets the agenda for Board meetings, ensures that adequate time is available for discussion and makes sure that Board members get timely, accurate and clear information; Promotes a culture of openness and debate; Ensures the highest standards of corporate governance; Is the main point of contact between the Board and management; Co-ordinates the work of the Board committees with committee chairs; and Ensures effective communication with shareholders. Chief Executive Officer Leads the development and execution of our long-term strategy with a clear view to creating shareholder value; Is responsible for day-to-day management and implementation of the Board s direction and policies; Acts as a liaison between the Board and management and communicates with the Board on behalf of management; and Communicates on behalf of the Group with shareholders, employees, Government authorities, other stakeholders and the public. Senior Independent Director Acts as a sounding board for the Chairman; Leads the independent non-executive Directors on matters that benefit from an independent review; and Is available to shareholders if they have concerns which have not been resolved through the normal channels of communication. Company Secretary Ensures good information flows within the Board and its committees; Facilitates induction and assists with the Board s professional development requirements; Assists the Board and the Chairman to co-ordinate and fulfil their duties and assignments; and Advises the Board on governance matters. Non-Executive Directors The main responsibilities of the non-executive Directors are set out in the UK Corporate Governance Code and include: Scrutinising the performance of management in meeting agreed goals and objectives; Challenging constructively and helping develop the Group s strategy; Ensuring the integrity of financial information; Ensuring that executive remuneration is at appropriate levels; and Overseeing succession planning, including the appointment of Executive Directors The appointment of the non-executive Directors is for the period from the date of their election until the next Annual General Meeting. The non-executive Directors are required to stand for re-election on an annual basis. Upon appointment, non-executive Directors confirm they are able to allocate sufficient time to meet the requirements of the role. Outside appointments The Articles of Association of the Company (article 36) set out limits on the maximum number of external appointments that members of our Board and executive management may hold. In addition, if a Board member wishes to take up an external appointment he or she must ask our Chairman s permission to do so (and the Chairman must consult the chairman of the Nomination Committee). The Chairman will assess all requests on a case-by-case basis, including whether the appointment in question could negatively impact the Company or the performance of the Director s duties to the Group. The nature of the appointment and the expected time commitment are also assessed to ensure that the effectiveness of the Board would not be compromised. Details of the external appointments of our non-executive Directors are contained in their respective biographies set out on pages
72 Corporate governance report continued Our Chairman holds positions on the Boards of Aegean Airlines S.A. and AXA Insurance S.A. He is a member of the Advisory Board of the Fares Centre at Tufts University, the International Board of Advisors at Tufts University and the Advisory Board of the Fares Center at Fletcher School. He is a member of the Board of Trustees of College Year in Athens. Our Chief Executive Officer does not currently hold any external appointments. Having considered the scope of the external appointments of the Directors referred to above, our Board is satisfied that they do not compromise the effectiveness of the Board. Independence Our Board has concluded that Mr. Christos Ioannou, Mrs. Susan Kilsby, both of whom retired from the Board on 24 June 2015, Mr. Antonio D Amato, Sir Michael Llewellyn-Smith, Mr. Nigel Macdonald, Mr. John P. Sechi, Mrs. Olusola (Sola) David-Borha and Mrs. Alexandra Papalexopoulou, who were both appointed to the Board on 24 June 2015, are independent in accordance with the criteria set out in the UK Corporate Governance Code. Mr. Antonio D Amato, Sir Michael Llewellyn-Smith and Mr. Nigel Macdonald have served on the Board for more than nine years from the date of their first election. The Board has specifically considered whether their length of service has compromised their independence and has concluded that there are no relationships or circumstances which are likely to affect, or could appear to affect, their judgement, and that the independence of character and judgement of each Director concerned is not affected or impaired by their length of service. Moreover, the Board has considered the performance of Mr. Antonio D Amato, Sir Michael Llewellyn-Smith and Mr. Nigel Macdonald and concluded that they each bring unique skills, experience and knowledge to the Board and its committees. The Board is therefore satisfied with the performance and continued independence of all three Directors and considers it important that our business continues to benefit from their experience and knowledge. The other non-executive Directors, Mr. Anastassis G. David (Chairman and son of Mr. George A. David), Mr. George A. David, Mr. Irial Finan, Mr. Anastasios I. Leventis, Mr. Christo Leventis, and Mr. José Octavio Reyes, were appointed at the request of shareholders of the Company: Kar-Tess Holding and The Coca-Cola Company. They are therefore not considered to be independent as defined by the UK Corporate Governance Code. Mr. Anastassis G. David was appointed as Chairman on 27 January Mr. Anastassis G. David was not considered independent at the time of his appointment as recommended by the UK Corporate Governance Code. The Board has followed a thorough process for the appointment which was overseen by the Nomination Committee, as described in detail in the Nomination Committee report, and involved a broad consultation with shareholders. The Board specifically considered the question of Mr. Anastassis David s independence. Notwithstanding that Mr. Anastassis David was originally nominated to the Board by Kar-Tess Holding, the Board is satisfied that Mr. Anastassis David s appointment will promote continuity, balance and effective leadership. The Board also firmly believes that Mr. Anastassis David embodies the Company s core values, heritage and culture and that these attributes, together with his strong identification with the Company and its shareholder interests, and his deep knowledge and experience of the Coca-Cola System, will ensure an effective and appropriately balanced leadership of the Board and the Company. Shareholders nominees As described in the section entitled Major Shareholders on page 196, since the main listing of the Company on the Official List of the London Stock Exchange in 2013, Kar-Tess Holding, The Coca-Cola Company and their respective affiliates have no special rights in relation to the appointment or re-election of nominee Directors, and those Directors of the Company who were nominated at the request of The Coca-Cola Company or Kar-Tess Holding will be required to stand for re-election on an annual basis in the same way as the other Directors. The Nomination Committee is responsible for identifying and recommending persons for subsequent nomination by the Board for election as Directors by the shareholders on an annual basis. As our Board currently comprises 13 Directors, neither Kar-Tess Holding nor The Coca-Cola Company is in a position to control (positively or negatively) decisions of the Board that are subject to simple majority approval. However, decisions of the Board that are subject to the special quorum provisions and supermajority requirements contained in the Articles of Association, in practice, require the support of Directors nominated at the request of at least one of either The Coca-Cola Company or Kar-Tess Holding in order to be approved. In addition, based on their current shareholdings, neither Kar-Tess Holding nor The Coca-Cola Company are in a position to control a decision of the shareholders (positively or negatively), except to block a resolution to wind up or dissolve the Company or to amend the supermajority voting requirements. The latter requires the approval of 80% of shareholders where all shareholders are represented and voting. Depending on the attendance levels at general meetings of the shareholders, Kar-Tess or The Coca-Cola Company may also be in a position to control other matters requiring supermajority shareholder approval. Mr. George A. David, Mr. Anastassis G. David, Mr. Anastasios I. Leventis and Mr. Christo Leventis were all originally appointed at the request of Kar-Tess Holding, a shareholder of the Company. Mr. Irial Finan was originally nominated to the Board prior to the listing on the Official List by certain existing shareholders of the Company that were affiliates of The Coca-Cola Company. Mr. José-Octavio Reyes has been appointed at the request of The Coca-Cola Company. Conflicts of interest In accordance with the Organisational Regulations, Directors are required to arrange their personal and business affairs so as to avoid a conflict of interest with the Group. Each Director must disclose to the Chairman the nature and extent of any conflict of interest arising generally or in relation to any matter to be discussed at a Board meeting, as soon as the Director becomes aware of its existence. In the event that the Chairman becomes aware of a Director s conflict of interest, the Chairman is required to contact the respective Director promptly and discuss with him or her the nature and extent of such a conflict of interest. Subject to exceptional circumstances in which the best interests of the Company dictates otherwise, the Director affected by a conflict of interest is not permitted to participate in discussions and decision making involving the interest at stake. 70
73 Strategic Report Corporate Governance Financial Statements Supplementary Info & Swiss Statutory Reporting Board effectiveness Information and training The practices and procedures adopted by our Board ensure that the Directors are supplied on a timely basis with comprehensive information on the business development and financial position of the Company, the form and content of which is expected to enable the Directors to discharge their duties and carry out their responsibilities. All Directors have access to our General Counsel, as well as independent professional advice at the expense of the Company. All Directors have full access to the Chief Executive Officer and the senior management, as well as the external auditors and internal audit team. The Board has in place an induction programme for new Directors, which was followed this past year by Mrs. Olusola (Sola) David-Borha and Mrs. Alexandra Papalexopoulou. They met individually with the former Chairman, Mr. George David, Operating Committee members, and other senior executives and received orientation training from the relevant senior executives in relation to the Group and corporate governance practices. The induction programme also includes meetings with representatives of our sales force and customers, and visits to our production plants. Both new Directors were appropriately briefed on strategy, financials, operations, risks and procedures in order to achieve the necessary insight into our activities. All Directors are given the opportunity to attend training to ensure that they are kept up to date on relevant legal, accounting and corporate governance developments. The Directors individually attend seminars, forums, conferences and working groups on relevant topics. The Nomination Committee reviews our Director training activities regularly. Finally, as part of the continuing development of the Directors, the Company Secretary ensures that our Board is kept up to date with key corporate governance developments. The Board elects the Company Secretary who acts as secretary to the Board. Board, committee and Director performance evaluation At least annually, on the basis of an assessment conducted by the Nomination Committee, our Board reviews its own performance as well as the performance of each of the Board committees. This review seeks to determine whether the Board and its committees function effectively and efficiently. During the year, the Chairman meets with the Directors to receive feedback on the functioning of the Board and its committees, the boardroom dynamics, and our strategy. Particular focus is given to areas where a Director believes the performance of the Board and its committees could be improved. A report is prepared for the Board on its effectiveness and that of its committees. The independent Directors meet separately on a regular basis to discuss a variety of issues, including the effectiveness of the Board. An evaluation of each Director (other than that of the Chairman) is conducted by the Chairman and the Senior Independent Director. The Senior Independent Director leads the evaluation of the Chairman in conjunction with the non-executive Directors (taking into account the views of the Chief Executive Officer), and as a matter of practice, meets with the other independent non-executive Directors when each Board meeting is held to discuss issues together, without the Chief Executive Officer or other non-executive Directors present. During 2015, the Board reviewed its own performance led by the Nomination Committee. The assessment covered a number of areas including the size of the Board, number of meetings and active contribution and discussions, organisation of the Board s committees, diversity, succession planning, risk management and internal control as well as initiatives on social and environmental topics. The results of the evaluation were presented at the December 2015 Board meeting and the Board concluded that, overall, the Board operates effectively. In addition, our Board committees structure, together with the careful and orderly changes in the Board composition during the last couple of years, enhanced the gender diversity and ensured an appropriate level of expertise of skills and experience to support the Board s role. The Board intends to arrange for its performance evaluation to be externally facilitated at least once every three years. The Board has also planned its next evaluation which will be facilitated externally to take place in the second half of Succession planning Our Board has in place plans to ensure the progressive renewal of the Board and appropriate succession planning. Pursuant to our Articles of Association, the Board consists of a minimum of seven and a maximum of 15 members and the Directors are elected annually for a term of one year by the Company s shareholders. Accordingly, all Directors are subject to annual re-election by shareholders in accordance with the UK Corporate Governance Code. In case of resignation or death of any member of the Board, the Board may elect a permanent guest, whom the Board will propose for election by the shareholders at the next general meeting. During 2015, Mr. Christos Ioannou and Mrs. Susan Kilsby resigned as Directors with effect from 24 June Mrs. Olusola (Sola) David-Borha and Mrs. Alexandra Papalexopoulou were appointed to the Board with effect from the same date. On 24 June 2015, Mr. Anastassis G. David, Mr. José Octavio Reyes and Mrs. Susan Kilsby resigned as members of the Nomination Committee and Mr. Christos Ioannou resigned from the Audit and Risk Committee. On 24 June 2015, Mrs. Alexandra Papalexopoulou was appointed a member of the Nomination Committee and Mrs. Olusola (Sola) David-Borha was appointed a member of the Audit and Risk Committee. The Board considers Mrs. Olusola (Sola) David-Borha and Mrs. Alexandra Papalexopoulou to be valuable additions to the Board. There were no other changes to the Board or committee membership during In accordance with the Organisational Regulations, the Board proposes for election at the shareholders meeting new Directors who have been recommended by the Nomination Committee after consultation with the Chairman. In making such recommendations, the Nomination Committee and the Board must consider criteria including the overall balance of skills, experience, independence and knowledge of the Board member, as well as diversity considerations including gender. See the Nomination Committee report (on page 82) for further information on the role and work of the Nomination Committee. Through this process, the Board is satisfied that the Board and its committees have the appropriate balance of experience, diversity, independence and knowledge of the Company to enable them to discharge their duties and responsibilities effectively. 71
74 Corporate governance report continued Key investor relations activities in 2015 February Investor roadshow, London and Edinburgh, UK March CAGE annual conference, London, UK April Investor roadshow, Boston and New York, USA May J.P. Morgan Global Consumer and Retail Conference, London, UK Société Générale Consumer Conference, Nice, France Greek institutional roundtable discussion, Athens, Greece June 12th Annual Deutsche Bank Global Consumer Conference, Paris, France Nomura Socially Responsible Investor Conference, London Annual general shareholders meeting September Barclays Global Consumer Staples Conference, Boston, USA Bank of America Merrill Lynch Global Consumer & Retail conference, London, UK November Investor roadshow, Boston and New York, USA Investor roadshow, London and Edinburgh, UK Shareholder engagement The Chairman, the Senior Independent Director as well as the Chairmen of the Audit and Risk, Remuneration and Nomination Committees will be available at the Annual General Meeting of the Company to answer questions from shareholders. The Board encourages shareholders to attend as it provides an opportunity to engage with the Board. Pursuant to Swiss law and the Articles of Association, shareholders annually elect an independent proxy and we have adopted an electronic proxy voting system for our Annual General Meetings. The Company has a dedicated investor relations function which reports to the Chief Financial Officer. Through its investor relations team, the Company and our Board maintain a dialogue with institutional investors and financial analysts on operational financial performance and strategic direction items. To reflect our commitment to our strong shareholder base, members of our management and the investor relations team held numerous meetings with investors and shareholders during 2015, and attended eight investor events including a conference for socially responsible investors. The feedback from shareholders has been considered by the Board and appropriate action to further engage with shareholders was decided. Application of UK and Swiss Corporate Governance Codes and the UK City Code on Takeovers and Mergers UK Corporate Governance Code Our aim is to ensure the highest level of corporate governance, accountability and risk management. Our internal policies and procedures, which have been consistently effective, are properly documented and communicated against the framework applicable to premium listed companies in the UK. The UK Corporate Governance Code sets out the principles of good practice in relation to board leadership and effectiveness, remuneration, accountability and relationship with shareholders. As a premium listed company, we are required to comply with the provisions of the UK Corporate Governance Code or explain any instances of non-compliance to shareholders. Our Board believes that, except as set out in the paragraphs below, the Company is in compliance with the provisions of the UK Corporate Governance Code and complied with such provisions throughout Pursuant to our obligations under the Listing Rules, we intend to continually comply with the provisions of the UK Corporate Governance Code or to explain any instances of non-compliance in our Annual Report. The UK Corporate Governance Code is available online at UK-Corporate-Governance-Code-2014.pdf. 72
75 Strategic Report Corporate Governance Financial Statements Supplementary Info & Swiss Statutory Reporting Certain differences between the Company s corporate governance practices and the UK Corporate Governance Code The Remuneration Committee does not have sole authority to determine the compensation of the Chief Executive Officer and the Chairman as recommended by the UK Corporate Governance Code. Rather, the terms of the compensation of the Chief Executive Officer are determined by the entire Board upon the recommendation of the Remuneration Committee. The Company considers that requiring the Board as a whole to determine compensation (excluding the participation of the CEO whose compensation is the subject of determination) allows a full and rigorous analysis and debate, involving a wider number of Directors, setting a higher standard in corporate governance. The Swiss Ordinance against Excessive Compensation in Listed Companies, which has been, subject to certain transitional rules, in effect since 1 January 2014, further limits the authority of the Remuneration Committee and the Board to determine compensation. The effective limitations include requiring that the general meeting of shareholders approve the maximum total compensation of each of the Board and the Operating Committee, requiring that certain compensation elements be authorised in the Articles of Association and prohibiting certain forms of compensation, such as severance payments and financial/monetary incentives for the acquisition or disposal of firms. We are in compliance with the requirements of the Swiss Ordinance against Excessive Compensation in Listed Companies and have amended our Articles of Association to that effect. Mr. George A. David was originally appointed at the request of Kar-Tess Holding, a significant shareholder of the Group, and was not, at the time of his original appointment to the Board, independent within the meaning of the UK Corporate Governance Code. Mr. Anastassis G. David who succeeded Mr. George A. David as Chairman at the recommendation of the Board, was also originally appointed at the request of Kar-Tess Holding and was not, at the time of his appointment as Chairman, independent within the meaning of the UK Corporate Governance Code. Mr. George A. David has also been a Director of the Group in excess of nine years. At no time during his tenure as Chairman has Mr. George A. David held responsibilities as Chief Executive Officer or any other executive role within the Group. The Board considers that, in view of Mr. George A. David s history with the Group and his importance to it, it had been in the best interests of the Group and its shareholders for him to remain Chairman. Similarly, in view of Mr. Anastassis G. David s strong identification with the Company and its shareholder interests, combined with his deep knowledge and experience of the Coca-Cola System, it is in the best interests of the Group and its shareholders for him to be appointed as Chairman to succeed Mr. George A. David, to continue to promote an effective and appropriately balanced leadership of the Group. In accordance with the established policy of appointing all Directors for one year at a time, the Board intends to continue to keep all positions under regular review and subject to annual election by shareholders at the Annual General Meeting. Other corporate governance codes As part of our commitment to best practices in corporate governance, we have implemented a number of measures to enhance internal controls and risk management. To ensure that our corporate governance systems remain in line with international best practices, our corporate governance standards and procedures are continuously reviewed in light of current developments and rulemaking processes in the UK, Switzerland and elsewhere in the EU. There is no mandatory corporate governance code under Swiss law applicable to us. The main source of law for Swiss governance rules is the company law contained in articles 620 ff. of the Swiss Code of Obligations, as well as the Ordinance against Excessive Compensation in Listed Companies, which has been, subject to certain transitional rules, in effect since 1 January In addition, the UK s City Code on Takeovers and Mergers (the City Code ) does not apply to the Company by operation of law, as the Company is not incorporated under English law. The Articles of Association include specific provisions designed to prevent any person acquiring shares carrying 30% or more of the voting rights (taken together with any interest in shares held or acquired by the acquirer or persons acting in concert with the acquirer) except if (subject to certain exceptions) such acquisition would not have been prohibited by the City Code or if such acquisition is made through an offer conducted in accordance with the City Code. For further details please refer to the Company s Articles of Association which are available on our website. 73


76 Corporate governance report continued Operating Committee The Operating Committee represents the executive leadership of the Company
77 Strategic Report Corporate Governance Financial Statements Supplementary Info & Swiss Statutory Reporting 1. Dimitris Lois, (55) Chief Executive Officer Mr. Lois is the Group s Chief Executive Officer and Chairman of the Operating Committee. Mr. Lois biography appears on page Michalis Imellos, (47) Chief Financial Officer Senior management tenure: Appointed April 2012 (3 years) Previous Group roles: Region finance director responsible for Nigeria, Romania, Moldova, Bulgaria, Greece, Cyprus and Serbia and Montenegro; General manager, Romania and Moldova. Outside interests: No external appointments Previous relevant experience: Mr. Imellos held a number of finance positions in the UK-based European headquarters of Xerox, including those of European Mergers & Acquisitions Director and Finance Director of the Office Europe Division. He managed the financial, tax and legal aspects of Xerox s sponsorship of the Athens 2004 Olympic Games as well as the finance function of the company s operations in Greece. He is a Fellow of the Institute of Chartered Accountants in England and Wales, and started his career at Ernst & Young. Nationality: Greek 3. John Brady, (58) Group Chief Customer and Commercial Officer Senior management tenure: Appointed March 2006 (9 years) Previous Group roles: Region director roles in various regions, responsible for operations in Armenia, Austria, Belarus, Bosnia and Herzegovina, Croatia, Cyprus, Czech Republic and Slovakia, FYROM, Greece, Hungary, Italy, Nigeria, Republic of Ireland and Northern Ireland, Russia, Serbia and Montenegro, Switzerland, and Ukraine (2001 to 2013). Outside interests: No external appointments Previous relevant experience: Mr. Brady joined The Coca-Cola Company in 1982 and held various positions with Coca-Cola USA and Coca-Cola International until 1992, when he became general manager and operations director for Coca-Cola Indonesia. From 1994 to 1998, Mr. Brady was regional manager for The Coca-Cola Company and Coca-Cola Amatil in Indonesia. In 1998, Mr. Brady was appointed regional director for Coca-Cola Beverages plc with responsibility for the Czech Republic, Hungary, Poland and Slovakia. From 2003 to 2004, Mr. Brady was regional vice-president for the Northeast region for Coca-Cola North America and, in 2004, was appointed president and CEO of Coca-Cola Bottlers Sales and Services Company. Nationality: American 4. Alain Brouhard, (53) Water and Juice Business Director Senior management tenure: Appointed June 2010 (5 years) Previous Group roles: Region director responsible for Nigeria, Romania, Moldova, Bulgaria and Serbia and Montenegro (2010 to 2013). Outside interests: No external appointments Previous relevant experience: Mr. Brouhard began his career with Procter & Gamble, where he worked in four different countries and in a variety of commercial and management roles leading up to global customer team leader in 2000, when he oversaw the global account management of Delhaize and the European management of new channels, including discounters (such as Aldi, Lidl and Dia) and convenience retailing (such as petrol stations). From 2002 to 2010, Mr. Brouhard held positions at Adidas including managing director, Italy and Southeast Europe, from 2007 until he joined the Group in Prior to that, he was vice-president for commercial operations, EMEA, from 2002 to 2005, and, from 2005, took the role of managing director, Iberia, based in Spain, with responsibility for Spain and Portugal. Nationality: French 5. Keith Sanders, (55) Region Director: Armenia, Belarus, Estonia, Latvia, Lithuania, Poland, Russian Federation, Ukraine and Moldova Senior management tenure: Appointed August 2009 (6 years) Previous Group roles: General manager of the Company s operations in Russia (2004). Outside interests: No external appointments Previous relevant experience: Prior to joining the Group, Mr. Sanders spent 11 years within the Coca-Cola System. He started his career with The Coca-Cola Company in a regional marketing role within the Gulf Region. In 1993, he was appointed human resources and training manager for the Gulf Region. In 1994, he assumed his first bottling general manager role in Bahrain, and then moved through a series of larger country general management roles until 2001, when he was appointed director for bottling operations in the Eurasia & Middle East Division with responsibility for Saudi Arabia, Pakistan, UAE, Oman, Bahrain and Qatar. Prior to joining the Coca-Cola System, Mr. Sanders spent six years with Procter & Gamble in the United States in a variety of sales and marketing roles. Nationality: American Full biographical details are available at 75
78 Corporate governance report continued 6. Sotiris Yannopoulos, (48) Region Director: Austria, Czech Republic, Hungary, Slovakia, Italy and Switzerland Senior management tenure: Appointed July 2014 (1 year) Previous Group roles: Mr. Yannopoulos was general manager in Serbia and Montenegro from 2009 to 2012 and country general manager in Italy from 2012 to Outside interests: No external appointments Previous relevant experience: Prior to joining the Group, Mr. Yannopoulos spent 12 years working at PepsiCo in various roles. He also spent five years with Star Foods, where he was the East Balkans BU manager, and seven years with Tasty Foods in Greece, where his roles included: business development director, marketing and trade marketing director, marketing manager and group brand manager. He started his career as an assistant product manager (USA/South Africa) with Colgate-Palmolive. Nationality: Greek 7. Zoran Bogdanovic, (44) Region Director: Bosnia and Herzegovina, Bulgaria, Croatia, Cyprus, FYROM, Greece, Northern Ireland and Republic of Ireland, Nigeria, Romania and Serbia (including the Republic of Kosovo), Slovenia and Montenegro Senior management tenure: Appointed June 2013 (2 years) Previous Group roles: Mr. Bogdanovic s previous roles include: member of the Finance team of Coca-Cola HBC Croatia from 1996 to 1998; CFO and then general manager of the Croatian operations from 1998 to 2004; Country general manager of Coca-Cola HBC Croatia from 2004 to 2008; Country general manager for Coca-Cola HBC Switzerland from 2008 to 2011; and Country general manager for Coca-Cola HBC Greece from 2011 to Outside interests: No external appointments Previous relevant experience: Mr. Bogdanovic started his career as an auditor with Arthur Andersen before joining Coca-Cola HBC Croatia in Nationality: Croatian 8. Marcel Martin, (57) Group Supply Chain Director 9. Jan Gustavsson, (50) General Counsel, Company Secretary and Director of Strategic Development Senior management tenure: Appointed August 2001 (15 years) Previous Group roles: Mr. Gustavsson served as Deputy General Counsel for Coca-Cola Beverages plc from Outside interests: No external appointments Previous relevant experience: Mr. Gustavsson started his career in 1993 with the law firm of White & Case in Stockholm, Sweden. In 1995, he joined The Coca-Cola Company as Assistant Division Counsel in the Nordic and Northern Eurasia Division. From 1997 to 1999 Mr. Gustavsson was Senior Associate in White & Case s New York office, practicing securities law and M&A. Nationality: Swedish 10. Sanda Parezanovic, (51) Group Human Resources Director Senior management tenure: Appointed June 2015 (less than 1 year) Previous Group roles: Ms Parezanovic s previous roles in the Group include: Public Affairs & Communications Manager, Serbia and Montenegro from 2003 to 2006; Country Human Resources and PA&C Manager, Serbia and Montenegro from 2006 to 2010; and Region Human Resources Director Bosnia & Herzegovina, Bulgaria, Croatia, Cyprus, FYROM, Greece, Northern Ireland, the Republic of Ireland, Moldova, Montenegro, Nigeria, Romania, Serbia, and Slovenia from 2010 to Outside interests: No external appointments Previous relevant experience: Ms. Parezanovic started in 1989 as Market Researcher and later Strategic Planner working for various local research and marketing agencies in SFR Yugoslavia. Sanda joined Saatchi & Saatchi Balkans in 1994, holding various senior management positions in several Balkan countries, including Managing Director of two start-up agencies, first in FYROM and later in Serbia. In 1999 she was relocated to London, where she worked for Saatchi & Saatchi and Marketing Drive on a number of pan-european and Business Development projects, before she joined our Group in Nationality: Serbian Senior management tenure: Appointed January 2015 (1 year) Outside interests: No external appointments Previous Group roles: Mr. Martin joined the Group in 1993, holding positions with increasing responsibility in the Supply Chain and Commercial functions. Since 1995, Mr. Martin held general management assignments in several of our markets, including as General Manager for Eastern Romania, Regional Manager Russia, Country General Manager Ukraine and General Manager Nigeria. Mr. Martin became General Manager of our Irish operations in 2010 and is now our Group Supply Chain Director. Nationality: Romanian 76
79 Strategic Report Corporate Governance Financial Statements Supplementary Info & Swiss Statutory Reporting Key activities and decisions in 2015 Long-term direction setting Defining Group strategic priorities and performance parameters Reviewing and adjusting our revenue growth management framework Establishing the Group s sustainability priorities and commitments for the next five-year period Business planning Evaluating and updating the Group s long range business plan Reviewing and approving annual business plans for 2016 for all operations Approving Group and country talent, capability and successions plans Risk, safety, business resilience Evaluating the Group s business resilience strategies Reviewing the Group s health & safety policies and material incidents Business case reviews and approvals The strategic transformation of our Human Resources Department The establishment of a blue-print structure for the commercial departments in our operations The optimisation of our manufacturing infrastructure The evolvement of our shared services organisation and its expansion to Nigeria and Russia Policy formulation, reviews Commercial policy Trade age management policy Priority projects Integrated competitive supply chain project Route-to-market project Operating Committee functions The Operating Committee, led by the Chief Executive Officer, meets 12 times each year and is responsible for: The day-to-day executive management of the Group and its businesses including all matters not reserved for or delegated to the Board or other bodies; The development of the Group strategies and implementation of the strategies approved by the Board; Providing adequate head-office support for each of the Group s countries; The setting of annual targets and approving annual business plans including a comprehensive programme of strategies and targets agreed between the Country General Managers and the Region Directors. These annual business plans form the basis of the Group s performance management; Working closely with the Country General Managers as anticipated by the Group s operating framework in order to capture benefits of scale, ensuring appropriate governance and compliance and managing the performance of the Group; and Leading the Group s talent and capability development programmes. A majority of members of the Operating Committee is required to be present at a meeting for there to be a quorum. The resolutions of the Operating Committee are taken by the majority of its members being present. In case of a tie, the Chief Executive Officer has, in addition to his normal vote, a casting vote. The Chief Executive Officer also has the power to overrule any Operating Committee resolution. 77

80 Corporate governance report continued Audit and Risk Committee Report Key elements of the Audit and Risk Committee s Dear Shareholder The Audit and Risk Committee focused its work during 2015 on enhancing and strengthening the Group s existing financial controls, risk management and compliance systems, which the Board recognised as essential components of effective corporate governance. A significant amount of time was invested in the external audit tender which the Group undertook in the second half of the year. This tender process required a detailed mapping of our current routines and procedures for working with the incumbent auditor, an overview of audit requirements and the Group s future profile, as well as a thorough review of the proposals received from the firms participating in the tender. During 2015, the Audit and Risk Committee also worked closely with the internal audit department in launching and implementing the new Internal Control Framework following the delisting of Coca-Cola HBC from the New York Stock Exchange. It also monitored closely the work of the Business Resilience function, headed by the Group Chief Risk Officer, which is described more fully on pages The report describes in more detail the work and the achievements of the Audit and Risk Committee during 2015 and we are proud to report that the Committee addressed the challenges the business faced during the year and ensured that we have a well-defined framework for financial controls and risk management that meets best practice standards. Nigel Macdonald Committee Chair Role of the Audit and Risk Committee The Audit and Risk Committee monitors the effectiveness of our financial reporting, internal control and risk management systems and processes. The role of the Audit and Risk Committee is set out in the charter for the committees of the Board of Directors in Annex C to the Organisational Regulations. This is available at governance. role include: Providing advice to the Board on whether the annual report and accounts, taken as a whole, is fair, balanced and understandable and provides the information necessary for shareholders to assess our position and performance; Monitoring the quality, fairness and integrity of the financial statements of the Group and reviewing significant financial reporting issues and judgements contained in them; Reviewing the Group s internal financial control and anti-fraud systems as well as the Group s broader enterprise risk management and legal and ethical compliance programmes (including computerised information system controls and security) with the input of the external auditors and the internal audit department; Reviewing and evaluating the Group s major areas of financial risk and the steps taken to monitor and control such risk, as well as guidelines and policies governing risk assessment; and Monitoring and reviewing the external auditors independence, quality, adequacy and effectiveness, taking into consideration the requirements of all applicable laws in Switzerland and the UK, the listing requirements of the London Stock Exchange and the Athens Stock Exchange and applicable professional standards. Members Members Membership status Mr. Nigel Macdonald Member since 2005, (Chairman) Chairman since 2013 Mr. John P. Sechi Member since 2014 Mrs. Olusola (Sola) David-Borha Member since 2015 The Audit and Risk Committee comprises three independent non-executive Directors, Mr. Nigel Macdonald (chairman), Mrs. Olusola (Sola) David-Borha and Mr. John P. Sechi, who were appointed by the Board for a one-year term on 24 June Mr. Christos Ioannou resigned as a member of the Board and the Audit and Risk Committee on 24 June The Board considers that Messrs. Nigel Macdonald and John Sechi possess recent and relevant financial experience as outlined in the UK Corporate Governance Code. As described on page 65, Mr. Macdonald was formerly vice-chairman of the Accounting and Audit Committees of Ernst & Young s worldwide practice and a senior partner of Ernst & Young s UK practice and Mr. Sechi has held various audit and financial positions. The Chief Financial Officer, as well as the General Counsel, external auditors, the Director of Internal Audit, and the Group Chief Accountant, normally attend all meetings of the Audit and Risk Committee. Other officers and employees are invited to attend meetings when appropriate. The Director of Internal Audit, and, separately, the external auditors, meet regularly with the Audit and Risk Committee without the presence of management to discuss the adequacy of internal controls over financial reporting and any other matters deemed relevant for the Audit and Risk Committee. 78
81 Strategic Report Corporate Governance Financial Statements Supplementary Info & Swiss Statutory Reporting Work and activities The Audit and Risk Committee met nine times during 2015 and discharged the responsibilities defined under Annex C of the Organisational Regulations. The work of the Audit and Risk Committee during the accounting year included consideration of: The annual financial statements and the annual financial report for the year ended 31 December 2014 prior to their submission to the Board for approval, including consideration of the Group on a going concern basis, and compliance with Group policies; The interim financial statements and interim results announcement for the six-month period ending 3 July 2015, prior to their submission to the Board for approval; The trading updates for the three-month period ended 3 April 2015 and the nine-month period ended 2 October 2015; Areas of significance in the preparation of the financial statements, including: Critical accounting judgements and estimates that affect the reported amounts of assets, liabilities, revenues and expenses, and the disclosure of contingent assets and liabilities in the consolidated financial statements (detailed in notes 1 and 29 to the consolidated financial statements); Contingencies, legal proceedings, competition law and regulatory procedures, including cases involving the national competition authorities of Greece and Swizerland and litigation matters in Nigeria, Russia, Italy and Greece, and the impact of these on the consolidated financial statements and accompanying notes; The impairment testing of goodwill and indefinite lived intangible assets with a particular emphasis on the key assumptions used in the value in use calculation and the sensitivity analysis performed for the material operations with reduced financial headroom. These assumptions, and a discussion of how they are established as well as the sensitivity analysis, are described in note 4 to the consolidated financial statements; and Reports from the external auditors on the annual and interim financial statements, approval of the external audit plan and pre-approval of audit fees for 2015; The internal control environment, principal risks and risk management systems and the Group s statement on the effectiveness of its internal controls prior to endorsement by the Board; Review and approval of the internal audit plan, quarterly reports on the results of internal audit work and a quality assessment of the internal audit function, including the following: Reassessment of overall financial risk management of the Group s operations and review of internal financial control procedures; Review of regulatory changes and developments and impact on risk management processes; and Review and approval of changes to the corporate audit department, including training and development programmes; Matters arising under the Group s Code of Business Conduct and the actions taken to address any identified issues; Revisions to and compliance with treasury policies, including risk limits, hedging programmes and counterparty limits; The geopolitical developments in Greece, Russia, Ukraine and Nigeria, and their implications for the Group s operations; Regular reports on quality assurance, health and safety, environmental protection, asset protection, treasury and financial risks, security and security enterprise risk management processes; The external auditor tender process; and The results of the Audit and Risk Committee self-assessment process. External auditors PricewaterhouseCoopers AG, Birchstrasse 160, CH 8050 Zurich, Switzerland (PwC AG) has been elected by the shareholders as the statutory auditor for the Group s consolidated financial statements and statutory financial statements. The Board of Directors has retained PricewaterhouseCoopers S.A., 268 Kifissias Avenue Halandri, Greece (PwC S.A.), an affiliate of PwC AG, to act as the Group s independent registered public accounting firm for the purposes of reporting under the UK rules for the year ended 31 December The appointment of PwC has been approved by the shareholders until the next Annual General Meeting by way of advisory vote. PwC refers to PwC AG or PwC S.A., as applicable, in this Annual Report. During the accounting period, the members of the Audit and Risk Committee met separately with PwC on a regular basis and the Audit and Risk Committee took an active role in reviewing the scope of the audit, the independence, objectivity and effectiveness of PwC and the negotiations relating to audit fees. The Audit and Risk Committee also met with the management team, which led the discussions with PwC, including the Director of Internal Audit, to discuss the performance of PwC without PwC being present. Following this review process, the Audit and Risk Committee has recommended to the Board that a proposal to reappoint PwC be put to a shareholders vote at the next Annual General Meeting. PwC has acted as the Group s sole external auditor since The Audit and Risk Committee has concluded that the best interests of the Group and its shareholders would be served by retaining PwC. This follows the completion of a robust and competitive tender process for the appointment of external auditors, overseen by the Audit and Risk Committee, resulting in a recommendation which was approved by the Board on 10 December PwC were re-appointed as the Group s external auditor with effect from 11 December Currently, the Audit and Risk Committee anticipates that the audit contract will be put out to tender again in There are no contractual or other obligations restricting the Group s choice of external auditor. Non-audit services by the external auditors The Audit and Risk Committee considers the independence, in both fact and appearance, of the external auditors as critical and has long had an auditor independence policy providing definitions of the services that the external auditors may and may not provide. The policy requires the Audit and Risk Committee s pre-approval of all audit and permissible non-audit services provided by the external auditors. Such services include audit, work directly related to audit, and certain tax and other services as further explained below. In practice, the Audit and Risk Committee applies the policy restrictively and approval for work other than audit and audit-related services is rarely granted. 79
82 Corporate governance report continued Under the policy, pre-approval may be provided for work associated with: statutory or other financial audit work under IFRS or according to local statutory requirements; attestation services not required by statute or regulation; accounting and financial reporting consultation and research work necessary to comply with generally accepted accounting and auditing standards; internal control reviews and assistance with internal control reporting requirements; review of information systems security and controls; tax compliance and related tax services, excluding any tax services prohibited by regulatory or other oversight authorities; expatriates and other individual tax services; and assistance and consultation on questions raised by regulatory agencies. For each proposed service, the external auditor is required to provide detailed back up documentation at the time of approval to permit the Audit and Risk Committee to make a determination whether the provision of such services would impair the external auditor s independence. PwC has complied with the policy for the financial year ended on 31 December 2015 and there have been no changes to the policy during the year. Audit fees and all other fees Audit fees The total fees for audit services paid to PwC and affiliates were approximately 5.0 million for the year ended 31 December 2015, compared to approximately 5.7 million for the year ended 31 December The total fees for 2015 include fees associated with the annual integrated audit and reviews of the Group s half year reports, prepared in accordance with IFRS and local statutory audits. Audit related fees Fees for audit related services paid to PwC and affiliates for the year ended 31 December 2015 were 0.5 million compared to 0.4 million for the year ended 31 December Tax fees Fees for tax services to PWC and affiliates for the year ended 31 December 2015 were 0.1 million while no such fees were paid for the year ended 31 December All other fees There were no fees for non-audit services to PwC or affiliates for the year ended 31 December 2015, compared to 0.1 million paid for the year ended 31 December 2014, representing 1.6% of the total amount of audit fees paid to PwC and affiliates for the year ended 31 December Risk management During 2015, the Company continued to revise and strengthen our approach to risk management as described in detail on page 55. The primary aim of this framework is to minimise our exposure and ensure that the nature and significance of all risks we are facing are properly identified, reviewed, managed and where necessary escalated. A quarterly risk assessment is undertaken by the countries and corporate office support functions, significant risks are then reported to the Region Directors and the Chief Risk Officer. The Company s Group Risk Forum reviews the identified risks bi-annually and presents issues of critical exposure to the Operating Committee. The latter, after careful review, reports to the Audit and Risk Committee material risks and mitigating actions. This process is both top down and bottom up and is designed to ensure that risks arising from business activities are appropriately managed. Finally, we have in place third-party insurance to cover residual insurable risk exposure such as property damage, business interruption and liability protection, including directors and officers insurance for its Directors and officers as well as for the officers and directors of certain subsidiaries. Internal control The Board has ultimate responsibility for ensuring that the Company has adequate systems of financial control. Systems of financial control can provide only reasonable and not absolute assurance against material misstatements or loss. In certain of the countries in which we operate, our businesses are exposed to a heightened risk of loss due to fraud and criminal activity. We review our systems of financial control regularly in order to minimise such losses. The Board has adopted a chart of authority defining financial and other authorisation limits and setting procedures for approving capital and investment expenditure. The Board also approves detailed annual budgets. It subsequently reviews quarterly performance against targets set forth in these plans and budgets. A key focus of the financial management strategy is the protection of our earnings stream and management of our cash flow. The Board and its committees have conducted an annual review of the effectiveness of our risk management system and internal control systems in accordance with the UK Corporate Governance Code. Part of this review involves regular review of our financial, operational and compliance controls by the Audit and Risk Committee, which then reports back to the Board on its work and findings as described above. The Board confirms that it has concluded that our risk management and internal control systems are effective. Internal audit Our internal audit department reports directly to the Audit and Risk Committee, which reviews and approves the internal audit plan for each year. The internal audit department consists of 40 full-time internal staff based in Athens, Budapest, Sofia, Moscow and Lagos, covering a range of disciplines and business expertise. One of the responsibilities of the internal audit department is to maintain and confirm to the Board the effective operation of our internal control framework. For this purpose, the Director of Internal Audit makes quarterly presentations to the Audit and Risk Committee and meets regularly with the Audit and Risk Committee without the presence of our management. In addition, the internal audit function reviews the internal financial, operational, and compliance control systems across all the jurisdictions in which we operate and reports their findings to management and the Audit and Risk Committee on a regular basis. The internal audit function focuses its work on the areas of greatest risk to us, as determined by a risk-based approach to audit planning. As part of our commitment to maintaining and strengthening best practice in corporate governance matters, we consistently seek to enhance our internal control environment and risk management capability. The internal audit function prepares audit reports and recommendations following each audit and appropriate measures are then taken to implement such recommendations. Status reports on our management s action plans to internal audit findings are provided to the Audit and Risk Committee and copied to the Board 80
83 Strategic Report Corporate Governance Financial Statements Supplementary Info & Swiss Statutory Reporting on a biannual basis. Urgent issues, if any, are raised at once. There were no such issues in The Chief Executive Officer, the Chief Financial Officer, the General Counsel, the Group Chief Accountant and the region and country managers each receive a copy of these updates. Whistleblowing measures We operate a hotline to receive, retain, investigate and act on employee complaints or concerns regarding accounting, internal accounting controls and auditing matters. This includes any matters regarding the circumvention or attempted circumvention of internal controls or that would constitute a violation of our Code of Business Conduct or matters involving fraudulent behaviour by officers or employees of the Group that may affect our accounts. All such allegations, complaints or concerns may be communicated, on an anonymous basis, to our Director of Internal Audit. Communications received by the Director of Internal Audit, or directly through the hotline, are kept confidential. The Director of Internal Audit liaises with the General Counsel and communicates all significant allegations to the Chairman of the Audit and Risk Committee. Disclosure Committee A Disclosure Committee has been established and disclosure controls and procedures have been adopted to ensure the accuracy and completeness of our public disclosures. The Disclosure Committee is composed of the Chief Financial Officer, the General Counsel, the Director of Investor Relations and the Group Chief Accountant. Performance reporting Reports on our annual performance and prospects are presented in the Annual Report following approval by the Audit and Risk Committee. We also prepare a half-yearly financial report on our performance during the first six months of the financial year. In 2015, the Group discontinued the practice of quarterly reporting. In-line with UK practice, we have adopted half-year and full-year reports, and Q1 and Q3 trading updates effective from Q Internally, our financial results and key performance indicators are circulated and reviewed by the Operating Committee on a monthly basis. This information includes comparisons against business plans, forecasts and prior year performance. The Board of Directors receives updates on performance at each Board of Directors meeting, as well as a monthly report on our business and financial performance. 81
84 Corporate governance report continued Nomination Committee Report Role and responsibilities The function of the Nomination Committee is to support the Board in fulfilling its duty to conduct a Board self-assessment, to establish and maintain a process for appointing new Board members and to manage, in consultation with the Chairman, the succession of the Chief Executive Officer. The formal role of the Nomination Committee is set out in the charter for committees of the Board of Directors in Annex C of the Organisational Regulations. This is available online at www. coca-colahellenic.com/investorrelations/corporategovernance/. Dear Shareholder During the year, the work of the Nomination Committee focused on the composition of the Board and succession planning, in light of the retirement of two independent non-executive Directors. The Committee oversaw the process of identifying and recommending to the Board two new independent Board members to fill the vacancies thus created. It also planned and agreed on the process for the identification and succession of a new Chairman in the event of the retirement of Mr. George A. David as Chairman of the Board. We also oversaw the performance evaluation of the Board and its committees. Various management changes that took place in the Company during 2015 were reviewed with the Committee before the appointments were made. In addition, the Committee also focused on gender diversity and the Company s talent framework, ensuring that a proper strategy and plans are in place to foster employee engagement and diversity across the Group. In 2016, the Committee will continue to review the balance of skills, experience and diversity of the Board and will also focus on the Group s talent development, employee engagement and gender diversity initiatives throughout the organisation. The Committee will also oversee an externally facilitated self-assessment process. Sir Michael Llewellyn-Smith Committee Chair Key elements of the Nomination Committee s role include: Reviewing the size and composition of the Board; Identifying and nominating new members to the Board; Planning and managing, in consultation with the Chairman, a Board membership succession plan; Ensuring, together with the Chairman, the operation of a satisfactory induction programme for new members of the Board and a satisfactory ongoing training and education programme for existing members of the Board and its committees; Setting the criteria for, and overseeing, the annual assessment of the performance and effectiveness of each member of the Board and each Board committee; Conducting an annual assessment of the performance and effectiveness of the Board and reporting conclusions and recommendations based on the assessment to the Board; and Ensuring that each committee of the Board is carrying out a self-assessment of its performance and reporting its conclusions and recommendations for change to the Board. Members Members Membership status Sir Michael Llewellyn-Smith (Chairman) Member since 2013, Chairman since 2013 Mr. Antonio D Amato Member since 2013 Mrs. Alexandra Papalexopoulou Member since 2015 The members of the Nomination Committee are Sir Michael Llewellyn-Smith, Mr. Antonio D Amato and Mrs. Alexandra Papalexopoulou, who were appointed by the Board on 24 June All members of the Nomination Committee are independent non-executive Directors and the Nomination Committee is chaired by Sir Michael Llewellyn-Smith, the Senior Independent Director. 82
85 Strategic Report Corporate Governance Financial Statements Supplementary Info & Swiss Statutory Reporting Work and activities The Nomination Committee met four times during 2015 and discharged the responsibilities defined under Annex C of the Organisational Regulations. The Chief Executive Officer and the Group Human Resources Director regularly attend meetings of the Nomination Committee. In addition, the Chairman is actively involved in the work of the Nomination Committee concerning succession planning and the selection of key people, including the Chairman. In 2015, the General Counsel also met with the Nomination Committee on several occasions. During 2015, the work of the Nomination Committee included consideration of: Succession planning and development of plans for recruitment of new Board members; Composition of the Board, including the appropriate balance of skills, knowledge and experience; Agreeing the process for the recruitment and nomination of new Board members; Agreeing the process for nomination of the new Chairman; Review of the talent management framework; Compilation of list of potential candidates to fill roles on the Board; Recommendation to the Board of proposed candidates for appointment to the Board; The performance evaluation and annual assessments of the committees and the Board; Review of the Director induction process and training programmes; and Review of the Group s diversity policy. Performance evaluation of the Board The Nomination Committee also led the assessment of the Board s performance during the year. The key areas included in the selfassessment covered the Board structure and diversity, timeliness and quality of information, board discussions, committees and their operation, succession planning, risk appetite and risk management, and remuneration and performance. The scores were high in most areas and the results of the evaluation were presented at the December 2015 Board meeting. The Nomination Committee brought to the Board for discussion certain areas such as diversity and succession planning where improvements could be made. Diversity All Board appointments are made based on merit, against objective criteria established by the Nomination Committee and approved by the Board, and with due regard to the benefits of diversity on the Board, including gender diversity, as well as expertise in the field of social and environmental topics. The Group is deeply committed to policies promoting diversity, equal opportunity and talent development at every level throughout the Group. The Group is constantly seeking to attract and recruit highly-qualified candidates for all positions in its business, regardless of gender, nationality, ethnicity and religious belief. The Group offers training opportunities to all employees depending on their individual needs and development requirements in order to improve their skills, and encourages all employees to gain relevant experience and knowledge applicable to their position and role. As at 31 December 2015, 15% of the Board, 18% of the executive leaders, 34% of senior leaders and 33% of all managers were women. The Nomination Committee, in conjunction with the Operating Committee, will monitor the proportion of women at all levels of the Group and ensure that all appointments are made with a view to having a high level of diversity within the workplace and in leadership positions, including gender diversity. Succession planning Following earlier intimation by Mr. George A. David of his intention to step down from the position of Chairman, the Nomination Committee oversaw a thorough succession planning process, involving the Zygos Partnership, an external executives search advisers firm which is independent of the Company, and a broad consultation with our shareholders. The succession planning process undertaken by the Nomination Committee included an in-depth analysis of the role of the Chairman and the experience and capabilities required for that role. The Nomination Committee oversaw a mapping exercise of potential candidates and assessed the capabilities of Mr. Anastassis G. David as the successor to Mr. George A. David in consultation with our external advisers. Given the importance of the relationship between the Group and its key stakeholder, The Coca-Cola Company, the Nomination Committee and the Board believe that it is extremely important to have a Chairman with a deep understanding of the Coca-Cola System and, at the same time, with the appropriate stature and independence to represent the interests of the Company and its shareholders effectively in its dealings with The Coca-Cola Company. It was concluded that Mr. Anastassis G. David best met these criteria. In making this decision, the Nomination Committee and the Board were fully aware of the governance implications of a departure from the UK Corporate Governance Code, which states that the chairman should on appointment be deemed to be independent. However, the Nomination Committee and the Board were satisfied that Mr. Anastassis G. David s appointment will promote continuity and balance and that Mr. Anastassis G. David embodies the Company s core values, heritage and culture. The Nomination Committee concluded and recommended to the Board that these attributes, together with Mr. Anastassis G. David s strong identification with the Company and its shareholders interests, combined with his deep knowledge and experience of the Coca-Cola System, will enable him to continue to promote an effective and appropriately balanced leadership of the Company. The Nomination Committee and the Board were aware of the need to hold discussions with key investors and also conducted a broad consultation with the Company s shareholders before proceeding with the appointment of Mr. Anastassis G. David. Mr George A. David, although kept informed, was not actively involved in the succession planning. The final decision was announced to the market on 28 January

86 Corporate governance report continued Social Responsibility Committee Report Role and responsibilities The Social Responsibility Committee is responsible for the development and supervision of procedures and systems to ensure the pursuit of the Group s social and environmental goals. The formal role of the Social Responsibility Committee is set out in the charter for committees of the Board of Directors in Annex C of the Organisational Regulations. This is available online at www. coca-colahellenic.com/investorrelations/corporategovernance/. Dear Shareholder During 2015, the Committee focused on the Group s introduction of science-based carbon and water intensity reduction targets. As a result of this we became one of the first twelve companies across all industries worldwide to adopt science-based carbon reduction targets approved by the World Resource Institute. The Committee also oversaw and co-ordinated the Group s successful transition to reporting in accordance with the Global Reporting Initiative (GRI) G4 sustainability reporting standards. We were particularly proud that Cola-Cola HBC was ranked as the beverage industry leader on both the World and Europe Dow Jones Sustainability Indices for the second consecutive year. The Committee will continue to ensure that Sustainability and Corporate Responsibility are integrated into all aspects of our business, guiding our decisions and long-term investments and enhancing our corporate reputation as a leader in the field. Sir Michael Llewellyn-Smith Committee Chair Key elements of the Social Responsibility Committee s role include: Establishing the principles governing the Group s policies on social responsibility and the environment to guide management s decisions and actions; Overseeing the development and supervision of procedures and systems to ensure the achievement of the Group s social responsibility and environmental goals; Establishing and operating a council responsible for developing and implementing policies and strategies to achieve the Company s social responsibility and environmental goals and ensure Group-wide capabilities to execute such policies and strategies; Ensuring the necessary and appropriate transparency and openness in the Group s business conduct in pursuit of its social responsibility and environmental goals; Ensuring and overseeing the Group s interactions with stakeholders of its social responsibility and environmental policies, goals and achievements, including the level of compliance with internationally accepted standards; and Reviewing Group policies on environmental issues, human rights, and other topics as they relate to the social responsibility topic. Members Members Membership status Sir Michael Llewellyn-Smith Member since 2013, Chairman since 2013 Mr. George A. David Member since 2013 Mr. José Octavio Reyes Member since
87 Strategic Report Corporate Governance Financial Statements Supplementary Info & Swiss Statutory Reporting Work and activities The Social Responsibility Committee met four times during 2015 and discharged its responsibilities as defined under Annex C of the Organisational Regulations. The Chief Executive Officer, the Director of Public Affairs and Communication and the Operational Sustainability Director regularly attend the meetings of the Social Responsibility Committee. During 2015 the Social Responsibility Committee reviewed and provided guidance and insights to advance the Group s sustainability strategies including environmental and social aspects in the following areas: The assessment of the Group s progress regarding the level of disclosure and reporting across all three dimensions of sustainability (economic, environmental and social) with particular focus on the Dow Jones Sustainability Indices and GRI G4 reporting requirements; Further discussions during the year focused on specific operational sustainability key performance indicators (KPIs), with particular emphasis on operational eco-efficiency initiatives, as well as health and safety in the context of both social and business risk; and Discussions on ways to expand the scope and breadth of the Group s sustainability commitments, particularly in the area of carbon and water intensity reduction, packaging, recycling and waste management, incorporating these in our business planning and investment decision making processes. The Social Responsibility Committee reviewed, and endorsed, the process for the annual assessment of material issues, which combined input from both business leaders and internal stakeholders, in accordance with the framework of the International Integrated Reporting Council (IIRC), the GRI G4 guidelines for comprehensive reporting, and the guidance of the Sustainability Accounting Standards Board for the beverage industry. 85

88 Directors Remuneration Report Letter from the Chairman of the Remuneration Committee Dear Shareholder, Here are some of our notable achievements in 2015: I am happy to present the Directors remuneration report Volume grew by 2.6% for the year ended 31 December My aim has been to make our remuneration policy and the annual report Comparable operating profit grew by 11.4% on remuneration clear, understandable and informative. Our comparable net profit was 314 million If they fail to meet these three tests, please let me know! (compared with 277 million in 2014) In compiling this report, we have been guided by the UK Further information on the Group s performance in 2015 Corporate Governance Code, by our obligations under will be found in the Financial review section on pages Swiss regulations, by feedback from our shareholders, and by considerations of best practice. We shall voluntarily propose our remuneration policy for a vote at Coca-Cola HBC s 2016 AGM in June. There is no obligation under the law and regulations applicable to us to do so, but we consider it best practice. The Group s remuneration philosophy and policies are designed to attract, motivate and retain the talented people we need to meet the company s strategic objectives, and to give them due recognition. To this end the Committee has worked to ensure that the policy remains fair, transparent and competitive by comparison with our peers, and that remuneration is linked to business strategy and drives performance. Business performance for 2015 The company achieved good results in Volume grew and there was a significant improvement in margins, resulting in the highest operating margins since the years before the financial crisis. Our people have shown themselves to be resilient and adaptable in difficult markets, and have delivered strong performance in all our operations. They achieved these results despite currency depreciation and economic weakness in some of our larger markets. All employees of Coca-Cola HBC have contributed to these results and to bringing the company back to growth. The result has been an improvement in almost all our key performance indicators. Remuneration in 2015 After careful thought, the Committee decided to recommend increasing the Chief Executive Officer s annual base salary from 732,000 to 878,400. The level of the increase reflected our judgement that the Chief Executive Officer s performance has been pivotal in meeting key strategic measures, despite foreign exchange headwinds, political instability in key markets, and challenging macroeconomic and trading conditions, and that his remuneration lagged that of his peers in the FTSE by a considerable amount since Coca-Cola HBC obtained its premium listing on the London Stock Exchange in The Chief Executive Officer s continued focus on talent development and on the engagement of our employees is crucial to the future growth of the company. The company s excellent ranking in the Dow Jones Sustainability Indices reflects the priority attached to sustainability that the Chief Executive Officer has instilled. In 2016, we expect the Chief Executive Officer s salary increase to be comparable with that of other employees in the company. Strong business performance, exceeding the business plan for 2015, will be reflected in the payout of the 2015 Management Incentive Plan (MIP). The payout for the Chief Executive Officer is expected to be 98% of his base salary, which is equivalent to 75% of the maximum MIP opportunity. We have committed ourselves to disclosing retrospectively the Management Incentive Plan targets, and you will find the 2015 targets and payouts reported on page 97 of the annual report on remuneration. The Chief Executive Officer s benefits remained the same versus prior year. The cost of the benefits increased in 2015 versus 2014, mainly driven by relocation benefits such as tax equalisation, cost of living adjustment and exchange rate protection. Detailed amounts can be found in the single figure table. In December 2015, the Chief Executive Officer received the first grant under the new performance share plan which has replaced the former stock option plan. Details of the performance conditions for the three year plan can be found on page

89 Strategic Report Corporate Governance Financial Statements Supplementary Info & Swiss Statutory Reporting Changes in 2015 Following consultations with the investment community, the Board decided, as foreshadowed in my 2015 letter to shareholders, to make some important changes to remuneration policies and programmes. The 2015 AGM approved the following: Introduction of a performance share award plan, closely aligned with the Company s long-term business strategy; Introduction of a share buy-back programme to address share dilution from our equity compensation plans; Adoption of guidelines on minimum shareholding requirements for the Chief Executive Officer and senior managers (200% of annual base salary for the Chief Executive Officer and 100% for members of the Operating Committee); and Introduction of clawback and malus provisions in our incentive plans, for the recovery of bonus awards in the event of misconduct, in line with the requirements of the 2014 UK Corporate Governance Code. We also reviewed and adjusted all remuneration arrangements for Operating Committee members, to align with the requirements of the Swiss ordinance on excessive compensation in listed companies. The effect of these measures is to align the remuneration of senior managers more closely with Coca-Cola HBC s business objectives, with the growth of the company, and with shareholders interests. Looking ahead Your committee will continue to keep policies under review so as to ensure that remuneration plans and programmes support our business strategy and are closely linked to shareholders interests. We value the dialogue with our shareholders and welcome views on this report. We were pleased with the positive vote for Coca-Cola HBC s remuneration policy and the annual report on remuneration at the 2015 AGM, and trust we shall have your support again this year. Sir Michael Llewellyn-Smith Chairman of the Remuneration Committee Remuneration Committee Role and responsibilities The main tasks of the Remuneration Committee are to establish the remuneration strategy for the Group and to approve or make recommendations to the Board with regards to compensation packages for Directors and senior management. The Remuneration Committee operates under the Charter for the Committees of the Board of Directors of Coca-Cola HBC set forth in Annex C to the Organisational Regulations and available on the Group s website at : corporategovernance/. Key elements of the Remuneration Committee s role include: Establishment of the remuneration strategy for the Group, determining and agreeing with the Board the framework and broad policy for the remuneration of the executives of the Group; Approving: the total individual and aggregate remuneration for non-executive Directors; the rewards for the executives of the Group (except for the Chief Executive Officer); Company-wide remuneration and benefit plans; all non-cash obligations greater than 15,000 which are reportable by employees as income (except personal use of company cars, group life or health benefits); and general policies governing the early termination of the executives of the Group; Providing recommendations to the Board on: the implementation or modification of employee coverage for any benefit plan resulting in an increased annual cost of 5 million or more; the base salary and increase levels, annual incentive plan awards, performance share awards and other forms of remuneration for the Chief Executive Officer; and the remuneration of the Chief Executive Officer and any other members of the Board on early termination (including pension contributions and all other elements). Members Members Membership status Sir Michael Llewellyn-Smith (Chairman) Member since 2013, Chairman since 2013 Mr. Antonio D Amato Member since 2013 Mrs. Alexandra Papalexopoulou Appointed June 2015 In accordance with the UK Corporate Governance Code, the Remuneration Committee consists of three independent non- Executive Directors: Sir Michael Llewellyn-Smith (Chairman), Mr. Antonio D Amato and Mrs. Alexandra Papalexopoulou, who were each elected by the shareholders for a one-year term on 24 June The Remuneration Committee met four times in 2015: March, June, September and December. Please refer to the Board and committee attendance in 2015 section of the Corporate Governance report on page 67 for details on the Remuneration Committee meetings. The Chairman of the Board, the Chief Executive Officer, the Group Human Resources Director, the Group Rewards Director and the General Counsel regularly attend the meetings of the Remuneration Committee. 87
90 Directors Remuneration report continued Remuneration Committee Work in 2015 During the financial year the Committee s work has included the following activities: Benchmarking, review and recommendation of the Chief Executive Officer s salary, taking into account pay and employment conditions in the Group and the market; Benchmarking, review and approval of the Operating Committee members salaries, taking into account pay and employment conditions in the Group and the market; Recommending the MIP payout for the Chief Executive Officer; Approval of Operating Committee members and General Managers MIP payout; Review and approval of General Managers job grades; Approval of General Managers salary levels, taking into account pay and employment conditions in the Group and the market; Approval of the new performance share plan; Recommendation for Board approval of the performance share award for the Chief Executive Officer and the performance share grant for 2015 for all other eligible participants; Review of the Group s pension arrangements; Introduction of clawback and malus provisions in the Management Incentive Plan (MIP), Long-term Incentive Plan (LTIP), Employee Stock Purchase Plan (ESPP), Employee Stock Option Plan (ESOP) and Performance Share Plan (PSP) for recovery in the case of misconduct; Introduction of a recruitment policy for non-executive Directors and the Chief Executive Officer; Introduction of shareholding guidelines; Review of all remuneration arrangements of the Operating Committee members in order to address the requirements of the Swiss Ordinance against Excessive Remuneration in Listed Companies; and Introduction of a share buy-back programme and share dilution limits to address share dilution resulting from the Company s equity remuneration plans. Remuneration Committee Activities for 2016 The Committee has decided to implement the following actions during 2016: Review of the Chief Executive Officer s, Operating Committee members and General Managers annual salaries; Review payout levels for the 2015 MIP; Approve the MIP payout for the Operating Committee members and general managers and recommend to the Board the Chief Executive Officer s payout; Recommend the PSP grant; Review the cash LTIP (a plan for managers below top executive level) ; and Review pension arrangements across the Group. The Group Reward Strategy For Coca-Cola HBC to be the undisputed leader in every market in which we compete, we need to foster excellence. Attracting the people we want and need Retaining Motivating A competitive winning team by continuing to attract the best talent to achieve financial, business and non-financial targets Recognising Adopting or embodying behaviours that produce exceptional performance 88
91 Strategic Report Corporate Governance Financial Statements Supplementary Info & Swiss Statutory Reporting Remuneration policy Introduction The remuneration policy for the non-executive Directors and the Executive Director will apply, subject to shareholder approval, from the date of our Annual General Meeting in June As a Swissincorporated company, we are not required to put our policy to a shareholder vote but we are doing so voluntarily. We have made every effort to ensure that our remuneration programmes and practices comply fully with UK regulations, except where these conflict with Swiss law which is binding to us. Reward strategy and objective The objective of the Group s remuneration philosophy is to attract, retain and motivate employees and incentivise the right behaviours, to see that employees are fairly and equitably rewarded, and thus ensure that their individual contributions are directly linked to the success of our Company. Variable pay is an important element of our reward philosophy. A significant proportion of remuneration for Top Managers (including the Chief Executive Officer and the members of the Operating Committee) is tied to the achievement of our business objectives. These achievements are defined by key business metrics that are consistent with our strategy and will deliver long-term shareholder value, increasing or decreasing the variable pay element based on the business performance. Through equity-related long-term compensation, we seek to ensure that the financial interests of the Chief Executive Officer, the members of the Operating Committee and the Top Management are aligned with those of shareholders. All of our remuneration plans, both fixed and variable, are designed to be cost effective, taking into account market practice, business performance and individual performance and experience where relevant. We pay close attention to our shareholders views in reviewing our remuneration policy and programmes. Policy eligibility Our remuneration policy is designed to cover all of our employees, offering programmes that are appropriate for their position, taking into account such factors as; level of responsibility, performance, experience, and using relevant market comparisons. The Chief Executive Officer, the members of the Operating Committee and other members of management are eligible for the following reward elements. Group Reward Element/ Employee Category Annual Base Salary MIP PSP LTIP ESPP ESOP 5 Benefits (Retirement and Other Benefits) Chief Executive Officer Eligible Eligible Eligible Eligible Eligible Eligible Operating Committee members 1 Eligible Eligible Eligible Eligible Eligible Eligible Top Management 2 Eligible Eligible Eligible Eligible Eligible (depends on country practice) Eligible Eligible (depends on country practice) Senior and Middle Management 3 Eligible Eligible Eligible Eligible (depends on country practice) Management 4 Eligible Eligible Eligible (depends on country practice) Eligible (depends on country practice) Eligible (depends on country practice) 1. For the definition and description of the Operating Committee, please refer to the Corporate Governance section on pages 74 onwards. 2. Top Management includes the role of General Manager as well as most Group sub-function heads. Members of Top Management are referred to as Top Managers throughout the Remuneration Report. 3. Senior and Middle Management generally refers to the majority of people reporting to General Managers and to those reporting to Group sub-function heads. 4. Management includes those with responsibility for managing people or substantial technical know-how on operational matters. 5. The last ESOP grant took place on 10 December This plan was replaced by the PSP with effect from June No further grants will take place from the ESOP although past grants continue to vest. The employee categories are relevant only for this remuneration report and not to any other section in the 2015 Integrated Annual Report. 89
92 Directors Remuneration report continued Policy table Our remuneration is composed of fixed and variable elements. The policy table includes details of each reward component, including its purpose and link to strategy, mechanisms and relevant performance metrics applicable to the Chief Executive Officer. Base salary Purpose and link to strategy: To provide a fixed level of compensation appropriate to the requirements of the role and to support the attraction and retention of the talent able to deliver the Group s strategy. Operation Salaries are reviewed annually, with salary changes normally effective on 1 May each year. The Remuneration Committee considers the following parameters when reviewing base salary levels: The individual s performance, skills and responsibilities; Economic conditions and performance trends; Experience of the individual; Pay increases for other employees across the Group; and External comparisons based on factors such as: the industry of the business, revenue, market capitalisation, headcount, geographical footprint, stock exchange listing (FTSE) and other European companies. Maximum opportunity The Chief Executive Officer will normally receive a salary increase broadly in line with the increase awarded to the general workforce. The salary increase of the Chief Executive Officer may exceed the average salary increase to reflect business and individual performance, material changes to the business, internal promotions, accrual of experience, changes to the role, or other material factors. Performance metrics Individual and business performance. MIP (Management Incentive Plan) Purpose and link to strategy: To support profitable growth and reward participants annually for their contribution to business performance. The plan promotes the drive for high performance with stretched individual and business targets linked to our key strategies. Operation Stretched targets for business performance are set annually based on the business plan of the Group and are approved by the Board of Directors. The key business metrics used to measure performance in the plan are reviewed regularly to ensure relevance to our business strategy. The individual objectives of the Chief Executive Officer are approved by the Chairman of the Remuneration Committee and the Chairman of the Board. Performance versus these objectives is assessed by the Committee, in consultation with the Chairman of the Board. The Remuneration Committee has discretion to adjust the payout level where it considers the overall performance of the Company or the individual s contribution warrants a higher or lower outcome. Any such adjustments will be disclosed in the annual remuneration report. Malus and clawback provisions apply. Further details may be found in the additional notes to the Policy Table on page 94. Deferral of MIP After careful consideration of the Chief Executive Officer s pay mix, it was decided that since long-term incentives make up a significant proportion of remuneration and significant share ownership requirements have been introduced this year, the Committee judged that the Chief Executive Officer was appropriately aligned with shareholders and therefore would not introduce MIP deferral. However the Committee will keep this point under consideration. Maximum opportunity Maximum MIP payout for the Chief Executive Officer is 130% of his annual base salary (10% accounting for individual performance and 120% based on business performance). No bonus is paid out if the Chief Executive Officer has achieved below 50% of his individual objectives. Target MIP percentage for the Chief Executive Officer is 70% of his annual base salary (10% accounting for individual performance and 60% for on-target business performance). For threshold performance, the Chief Executive Officer may receive 5% of his annual base salary based on achievement of his individual objectives assuming that 50% of individual objective targets have been met and business objectives have not been met. Performance metrics The MIP awards are based on business metrics linked to our business strategy, which may include, but are not limited to measures of volume, revenue, profit, cash and operating efficiencies. Details related to the key performance indicators and individual objectives can be found in the annual report on remuneration on page
93 Strategic Report Corporate Governance Financial Statements Supplementary Info & Swiss Statutory Reporting PSP (Performance Share Plan) Purpose and link to strategy: A long-term incentive plan which aligns the Chief Executive Officer s interests with the interests of shareholders and increases the ability of the Group to attract and reward individuals with exceptional skills. Operation Award type The performance share plan makes conditional awards of shares that vest after three years, subject to the achievement of performance conditions and continued service. Grants under the PSP take place annually, normally every March. Dividends will be paid on vested shares where the performance conditions are achieved at the end of the three-year period. The Remuneration Committee sets stretched targets and thresholds for the plan, based on a range of reference points, including actual performance, business plans and strategies. Key business metrics used to define performance conditions are reviewed regularly to ensure that they support the long-term strategies and objectives of the Group and are aligned with shareholders interests. Adjustments In the event of an equity restructuring, the Remuneration Committee may make an equitable adjustment to the terms of the performance share award by adjusting the number and kind of shares which have been granted or may be granted and/or making provision for payment of cash in respect of any outstanding performance share award. Change in control In the event of change of control, unvested performance share awards held by participants vest immediately on a pro-rated basis if the Remuneration Committee determines that the performance condition(s) have been satisfied or would have been likely to be satisfied at the end of the performance period, unless the Remuneration Committee determines that substitute performance share awards may be used in place of the previous awards. Malus and clawback Malus and clawback provisions apply. Further details may be found in the additional notes to the Policy Table on page 94. Maximum opportunity The normal maximum award has a face value of 330% of base salary, however the Committee has discretion to make a maximum award of 450% of base salary in performance share equivalents in exceptional circumstances. Performance metrics Vesting of awards is subject to the three-year Group performance conditions based on two equally weighted measures: Comparable earnings per share (Comparable EPS) Calculated by dividing the comparable net profit attributable to the owners of the parent by the weighted average number of outstanding shares during the period. Return on invested capital (ROIC) We define ROIC as the percentage of net operating profit after tax divided by the capital employed. Capital employed is calculated as the average of net borrowings and shareholders equity through the year. Prior to the grant date, the Remuneration Committee shall determine the threshold and stretched performance targets. Following the end of the three-year period, the Committee shall determine the extent to which performance conditions have been met, impacting how many performance shares will vest. Performance share awards will lapse if the Remuneration Committee determines that the performance criteria have not been met. If, at the end of the vesting period, the performance conditions have been satisfied, participants become entitled to receive shares or a cash equivalent. Vesting levels Achieving threshold performance results in the vest of 25% of the award granted. Performance conditions are additive, therefore if only one performance condition meets threshold performance, 12.5% of the total award will vest. Maximum performance assumes that both performance conditions are met, thereby resulting in 100% vesting of the award that was granted. Holding Period The Remuneration Committee judged that the Chief Executive Officer s remuneration was appropriately aligned with the long-term shareholders interests through the change in an extended vesting period and the introduction of minimum shareholding guidelines. No additional holding period will be introduced, however the Remuneration Committee will keep this point under consideration. 91
94 Directors Remuneration report continued Retirement Benefits Purpose and link to strategy: To provide competitive, cost-effective post-retirement benefits. Operation The Chief Executive Officer participates in a defined benefit pension plan under Swiss law. Employer contributions are 15% of the annual base salary. There is no obligation for employee contributions. Normal retirement age for the Chief Executive Officer s plan is 65 years. In case of early retirement, which is possible from the age of 58, the Chief Executive Officer is entitled to receive the amount accrued under the plan as a lump sum. Maximum opportunity The contributions to the pension plan are calculated as a percentage of the Chief Executive Officer s annual base salary (excluding any incentive payments or other allowance/benefits provided) based on age brackets as defined by Federal Swiss legislation. This percentage is currently 15%. Performance metrics None. Other Benefits Purpose and link to strategy: To provide benefits which are consistent with market practices. Operation The Chief Executive Officer receives medical insurance. The Chief Executive Officer is eligible for benefits related to his relocation such as housing allowance, car, a cost of living adjustment, trip allowance, partner allowance, exchange rate protection, tax equalisation and tax filing support and advice. The Remuneration Committee has the discretion to recommend the introduction of additional benefits where appropriate. Maximum opportunity There is no defined maximum as the cost to the Company of providing such benefits will vary from year to year in accordance with costs. Performance metrics None. ESPP (Employee Share Purchase Plan) Purpose and link to strategy: ESPP is an employee share purchase plan, encouraging broader share ownership, and is intended to align the interests of employees with those of the shareholders. Operation This is a voluntary share purchase scheme across many of the Group s countries. Scheme participants have the opportunity to invest from 1% to 15% of their salary and / or MIP payout to purchase the Company s shares by contributing to the plan on a monthly basis. The Company matches employee contributions on a one-toone basis up to 3% of the employee s salary and /or MIP payout. The contributions are used to purchase matching shares on a monthly basis in the open market. Matching shares vest one year after the purchase. Employees contribute to the plan through payroll deductions. Dividends received in respect of shares held under the ESPP are used to purchase additional shares and are immediately vested. Maximum opportunity The maximum Company contribution for the Chief Executive Officer is 3% of annual base salary and his MIP payout, assuming the Chief Executive Officer contributes at least 3%. The maximum amount the Chief Executive Officer can contribute is 15% of annual base salary and MIP. Performance metrics The value is directly affected by the share price performance. It is not affected by individual performance criteria. Performance metrics are not applicable. 92
95 Strategic Report Corporate Governance Financial Statements Supplementary Info & Swiss Statutory Reporting ESOP (Employee Stock Option Plan) Purpose and link to strategy: A long-term incentive which aligns the senior managers interests with the interests of shareholders. The plan was replaced by the PSP in 2015, however prior ESOP grants continue to vest. Operation Until 2014, awards were granted every year reflecting each year s performance. Options were granted with an exercise price equal to the closing price of the Company s shares trading on the London Stock Exchange on the day of the grant. The last grant under ESOP took place on 10 December For past grants, the stock option award for the Chief Executive Officer was approved by the Board of Directors based on the recommendation of the Remuneration Committee. Options vest in one-third increments each year for three years and can be exercised for up to 10 years from the date of award. Maximum opportunity In 2014, caps were implemented on the maximum number of options to be granted to the Chief Executive Officer and Operating Committee members. The maximum set for the Chief Executive Officer was 1.5 million stock options, however in practice no more than 360,000 options were granted at any one time. Performance metrics The value of the ESOP awards is contingent upon the performance of the Group s shares on the London Stock Exchange. Additional Notes to the Policy Table (a) Remuneration policy and principles for other employees The remuneration approach for the Chief Executive Officer is consistent with the reward package for the members of the Operating Committee and senior management. The Chief Executive Officer s total remuneration has a much higher proportion of variable pay in comparison to the rest of our employees. The Chief Executive Officer s remuneration will increase or decrease in line with business performance, aligning with shareholders interests. The structure of the reward package for the wider employee population takes into account local market practice and is based on the principle that it should attract and retain the right talent, be competitive, remunerate employees for their contribution and be linked to the Group s performance. (b) Recruitment policy In 2015 we adopted the following policy: I. Base salary guidelines: In accordance with the remuneration policy, annual base salary arrangements for the appointment of a new Executive Director will be set considering market relevance, skills, experience, internal comparisons and cost. The Remuneration Committee may recommend an appropriate initial annual base salary below relevant market levels. In such situations, the Remuneration Committee may make a recommendation to realign the level of base salary in the forthcoming years. As highlighted above, annual base salary gaps may result in exceptional rates of salary increase in the short term subject to an individual s performance. The discretion is retained to offer an annual base salary necessary to meet the individual circumstances of the recruited Executive Director and to enable the hiring of an individual with the necessary skills and expertise. II. Variable and equity pay guidelines: The maximum level of variable pay that may be offered will follow the rules of the MIP and is capped at 130% of annual base salary. The maximum level of equity share pay that may be offered will follow the ESOP and the PSP rules and is capped at 450% of annual base salary. Different performance measures may be set initially for the annual bonus taking into consideration the point in the financial year that the new Executive Director joined. The above limits do not include the value of any buyout arrangements (as discussed in section IV). III. Benefits guidelines: Benefits will be provided in line with those offered according to the Group s policy for other employees. If a Director is required to relocate, benefits may be provided as per the Group s international transfer policy which may include transfer allowance, tax equalisation, tax advice and support, housing, cost of living, schooling, travel and relocation costs. IV. Incentives award buyout principles: The Remuneration Committee may consider recommending the buying out of incentive awards that an individual would forfeit by accepting the appointment up to an equivalent value in shares or in cash. In case of shares replacement, the Remuneration Committee will recommend a grant of shares via the PSP. When deciding on a potential incentive award buyout, the Remuneration Committee will be informed of the timing, performance targets and expected value associated with any forfeited award. (c) Policy on termination payments The Swiss Ordinance against Excessive Compensation in Listed Companies, limits the authority of the Remuneration Committee and the Board of Directors to determine compensation. Limitations include a requirement that the general meeting of shareholders approve the maximum total compensation of the Board of Directors and the Operating Committee, a requirement that certain compensation elements be included in the Articles of Association, and a prohibition on certain types of compensation (such as severance, advance payments and bonuses for the acquisition or disposal of businesses). Our governance framework guarantees that the Group uses the right channels to support reward decisions. In the case of early termination, the non-executive Directors would be entitled to their fees accrued as of the date of termination, but are otherwise not entitled to any additional compensation. Severance provisions have been removed from the Chief Executive Officer s and members of the Operating Committee s employment contracts in
96 Directors Remuneration report continued In case of future terminations, payments will be made in accordance with the remuneration policy. For the Chief Executive Officer, the policy on termination is described below. Regarding the MIP, pay-outs are as follows: Retirement: A prorated payout as of the date of retirement will be applied. Death in service: A prorated payout will be applied and will be paid immediately to heirs based on the latest rolling estimate. Resignation or other reasons for leaving: A prorated payout will apply in accordance with Swiss legislation. For the ESPP, unvested shares are forfeited, except in case of retirement, injury, disability, redundancy or death. For the ESOP and PSP: In the event of termination due to injury, disability or death, all unvested options and performance share awards immediately vest to the extent that the Remuneration Committee determines that any applicable performance condition has been satisfied or would have been likely to have been satisfied at the end of the performance period. Any options which vest are, together with options which have vested before, exercisable within 12 months from the date of termination of the employment agreement or the relevant contractual relationship; In the event of termination due to retirement of a participant having had at least ten years service with the Group and being at least 55 years old, all unvested and vested options and all unvested performance share awards remain fully subject to the conditions and terms as set forth in the ESOP/PSP; Upon termination by the Company for cause, all unvested options and performance share awards immediately lapse without any compensation and all vested options must be exercised within thirty days from the date of termination; Upon termination of employment as a result of any other reasons, including but not being limited to dismissal by the Company other than for cause, termination by the participant and expiration of term of employment or contract, all unvested options and performance share awards immediately lapse without compensation and all vested options are exercisable within six months as from the date of termination of the employment agreement or the relevant contractual relationship. Notice periods are set for up to six months and non-compete clauses are 12 months, effective in The notice period anticipates that up to six months paid garden leave may be provided. Similarly, up to 12 months may be paid out in relation to the non-compete period. (d) Malus and clawback provision for variable pay plans During 2015 the Remuneration Committee approved changes in the MIP, LTIP, PSP, ESOP and ESPP plans introducing malus adjustments so that an award may lapse wholly or partly in event of material misstatement of financial results and/or misconduct. The Remuneration Committee has been authorised to amend the terms and conditions of the variable incentive plans, in order to apply malus and clawback mechanisms to the Chief Executive Officer and members of the Operating Committee. Clawback can potentially be applied to payments or vesting for up to a two-year period following the payment or vesting. (e) Executive shareholding guidelines In order to strengthen the link with shareholders interests, a policy on executive shareholding has been introduced for the first time in 2015 requiring the Chief Executive Officer to hold company shares equal to 200% of his annual base salary and the Operating Committee members 100% of their annual base salary. The required shareholdings are to be achieved within a five-year period from the date of the first PSP grant (10 December 2015). All vested shares under the PSP and the ESPP are included in meeting the shareholding requirement. (f) Share buy-back programme and dilution limit To address shareholder dilution, the Company implemented a share buy-back programme in In addition, the overall dilution limit related to shares or options granted under the PSP/ESOP/ESPP may not exceed 10% of shares in issue over a ten-year rolling period. Chief Executive Officer s remuneration policy illustration The Chief Executive Officer s remuneration follows the principles of the table under Policy Eligibility on page 89. The charts below show the maximum possible remuneration for the Chief Executive Officer for The numbers represent annualised amounts as of 31 December CEO remuneration ( 000s EUR) Maximum Target Threshold Minimum 878 1, Base pay Cash and non-cash benefits Pension 1, , Total 1, , ,044 Total 2,054 1,142 2,899 MIP PSP Total 4,263 Maximum Reflects fixed remuneration and a MIP payout at 130% of base salary and 100% of the 2015 PSP award vesting. Target Reflects fixed remuneration and includes a MIP payout of 70% of base salary and 55% of the 2015 PSP award vesting. Threshold Reflects fixed remuneration and includes a MIP payout of 5% of base salary and 12.5% of the 2015 PSP award vesting. Total 6,095 Minimum Reflects only fixed remuneration which is not at risk i.e. base salary, pension and cash and non-cash benefits which comprise cost of living adjustment, exchange rate adjustment, family allowance, housing allowance, trip allowance, employer contributions to the ESPP, private medical insurance, tax filing support and advice, tax equalisation and employer social security contributions. 94
97 Strategic Report Corporate Governance Financial Statements Supplementary Info & Swiss Statutory Reporting Chief Executive Officer service contract Mr. Dimitris Lois, the Chief Executive Officer, has an employment contract with Coca-Cola HBC. The Swiss Ordinance against Excessive Compensation in Listed Companies (the Swiss Ordinance ) prohibits any severance payments not mandated by law. As a consequence, the Chief Executive Officer s employment contract was amended in 2015 with an effective date of 1 January As set out above, the Chief Executive Officer s employment contract does not include any termination benefits, other than as mandated by Swiss law. The Swiss Code of Obligations requires employers to pay severance when an employment relationship with an employee of at least 50 years of age comes to an end after 20 years or more of service. The Chief Executive Officer is also entitled to reimbursement of all reasonable expenses incurred in the interests of Coca-Cola HBC. In accordance with the Swiss Ordinance, there are no sign-on policies/ provisions for the appointment of the Chief Executive Officer. The terms of the employment contract of the Chief Executive Officer of Coca-Cola HBC, are summarised below: Name Position Date of contract Notice period Dimitris Lois Chief Executive 26 November months Officer Non-Executive Directors policy and fees Compensation for non-executive Directors is consistent with market practice and sufficient to attract and retain high-quality non-executive Directors with the right talent, values and skills necessary to provide oversight and support of management to grow the business, support Coca-Cola HBC s strategic framework and maximise shareholder value. Non-executive Directors pay is set at a level that will not call into question the objectivity of the Board. The following table sets out the fees and other benefits paid to the non-executive Directors, including additional fees for the specified roles below. Non-executive Chairman s fee Non-executive Vice-Chairman s fee Basic non-executive Director s fee 1 65,000 Senior Independent Director s fee 10,000 There is no sign-on bonus, or other types of compensation. The Group typically reviews the compensation of non-executive Directors every two to three years. A review was completed in Fees may be increased in 2016 following the AGM in June Such increase would be put to a vote. The peer group used for comparison consisted of companies in the FTSE index with similar positioning as Coca-Cola HBC, other Swiss companies with similar market caps and/or revenues, and other relevant European listed companies. The Group s policy targets the median of the comparable group of companies. Taking into consideration current business conditions, the non-executive Directors remuneration in 2015 remained unchanged compared to Messrs. George A. David, Anastasios I. Leventis and Christo Leventis have waived any fee for their services. The Chairman of the Social Responsibility Committee, Sir Michael Llewelyn-Smith, has waived any fee for this role. The Group s compensation of non-executive Directors includes an annual fixed fee plus additional fees for membership in the Board committees when applicable. The basic fee paid to each non-executive Director is the same, and an additional fee is paid to each member for committee membership and chairmanship, according to the levels set for that committee. Coca-Cola HBC does not compensate new non-executive Directors for any forfeited share awards in previous employment. Non-Executive Directors do not receive any form of variable compensation nor any other benefits in cash or in kind. They are not entitled to severance payments in the event of the termination of their appointment. They are entitled to reimbursement of all reasonable expenses incurred in the interests of the Group. Non-Executive Directors appointed during the policy period receive the same basic fee and, as appropriate, committee fee or fees as existing non-executive Directors. Audit and Risk Remuneration Nomination Social Responsibility Committee chairman fee (additional) 25,000 10,000 10,000 Committee member fee (additional) 12,500 5,000 5,000 5, Mr. George A. David, Mr. Anastasios I. Leventis and Mr. Christo Leventis have waived any annual fee in respect of their membership of the Board or any Board Committee. 95
98 Directors Remuneration report continued Annual Report on Remuneration 2015 Remuneration Single total figure of remuneration for the Chief Executive Officer The Chief Executive Officer is the only Executive Director of the Group. The table below sets out the Chief Executive Officer s total remuneration for the year ended 31 December 2015 and 31 December Base pay s Cash and non-cash benefits s Annual bonus s Long-term incentives s Retirement benefits 000 s Total Single Figure 000 s , ,012 1,918 Figures are rounded 1. Base pay includes the monthly instalments linked with the base salary for A salary increase was applied to the base salary, effective from 1 May. Business and individual performance were considered when determining the increase. Increases going forward will be comparable to general employee increases. For an explanation of the rationale for the increase which was made to the salary level of the Chief Executive Officer, please see the Committee Chairman s letter on pages Under Cash and non-cash benefits we include the value of all benefits. Dimitris Lois benefits include the following: cost of living and foreign exchange rate adjustment ( 236,853), private medical insurance ( 16,728), company car allowance ( 7,811), family allowance ( 9,653), housing allowance ( 123,408), trip allowance ( 7,840), tax assistance and filing support ( 23,093), company matching contribution related to ESPP ( 37,844), tax equalisation ( 423,439), and the value of social security contributions ( 156,992) for The overall increase versus the prior year is related to several factors. Tax equalisation increased versus prior year driven by the change in residency from Greece to Switzerland. This change impacted 2015 fully; whereas, 2014 was only partially impacted, The cost of living and exchange rate adjustment benefits were affected by significant changes in the CHF foreign exchange rate versus the EUR. 3. The Annual bonus for 2015 includes the MIP payout, receivable early in 2016 for the 2015 fiscal year. The annual bonus for 2014 includes the MIP payout that Dimitris Lois received in 2015 corresponding to the 2014 fiscal year. Details on the target and actual performance for the year 2015 are presented in the below section Management Incentive Plan Company performance versus MIP targets in the year ended 31 December The increased bonus payout reflects improved business performance. 4. In accordance with UK regulations, we have reflected the value of stock option awards that vested during 2014 and 2015, respectively, being the number of options x (market price at vest exercise price at grant). Performances shares were awarded for the first time in 2015 and are therefore not reflected herein. Management incentive Plan (Company performance versus MIP targets in the year ended 31 December 2015) The following key performance indicators impact the performance of the MIP. Namely: Annual Sales Volume. Incentivises sustainable growth. Achievements in annual sales volume will be rewarded only if TWCD ( Total Working Capital Days ) key business metric is above threshold. Net Sales Revenue (NSR). As of 1 January 2015, the NSR key business metric replaced the TWCD key business metric in order to incentivise the Group s long-term growth objectives. Comparable Earnings Before Interest and Tax (Comparable EBIT). Defined as comparable operating profit, this key performance indicator incentivises profitable growth. Operating Expenditures (OpEx) excluding DME as a percentage of NSR. This key performance indicator, which excludes direct marketing expenses (DME), incentivises effective cost management. Total Working Capital Days (TWCD) is a qualifier for volume payout. Measuring TWCD is intended to incentivise effective cash flow. Defined as the total of receivable days, inventory days and payables days. Payout on the basis of business performance will only be made if individual performance is above threshold. Please refer below to the mechanism of MIP payout for the Chief Executive Officer. MIP Payout Total MIP payout Achievement against individual objectives Achievement against business objectives Target up to 10% of Annual Base Salary Target 60% of Annual Base Salary 96
99 Strategic Report Corporate Governance Financial Statements Supplementary Info & Swiss Statutory Reporting The following table illustrates how the outcomes for the different bonus measures contribute to the business component bonus payout and compare this to the target and maximum potential outcome for the performance period 1 January 2015 to 31 December Measures 1 Purpose Weight Threshold Target Maximum Actual results achieved Actual result as pay-out % Volume (m unit cases) Growth 25% 1,819 2,022 2,123 2, % NSR ( m) Growth 25% 5,485 6,095 6,399 6, % Comparable EBIT ( m) Growth 25% % Opex % of NSR Efficiency 25% 28.9% 26.3% 25.6% 27.1% 17.5% TWCD Efficiency Qualifier Achieved Total 100% 146% 1. All measures calculated at budgeted exchange rates for the year ended 31 December Volume (m unit cases) NSR ( m) Comparable EBIT ( m) Opex 1 (% of NSR) 2,200 6, ,000 2,022 2,123 2,055 6,400 6,000 6,095 6,399 6, ,800 1,819 5,600 5,200 5, ,600 4, OPEX excluding DME Threshold Target Maximum Actual Results Achieved The outcome for the bonus for the Chief Executive Officer was 100% related to the achievement of individual objectives and 146% related to the achievement of business objectives, meaning that the overall payout was 75% of the total maximum MIP opportunity. The Chief Executive Officer s individual performance assessment is based on achievement of individual objectives set by the Chairman of the Board. The Chairman of the Board of Directors and the Chairman of the Remuneration Committee assessed the Chief Executive Officer s performance against specific objectives, and this assessment was approved in March The Chief Executive Officer s individual objectives for 2015 were based on improvement in the number of countries in which we gained or sustained market share, an increase in EBIT margin versus prior year, an increase in sustainable engagement versus prior year and maintaining the Beverage Industry Leadership in the World and Europe on the Dow Jones Sustainability Index. The overall level of performance achieved resulted in an MIP award equating to 97.6 % of base salary for the Chief Executive Officer (100% achievement of individual performance objectives of 10%, and achievement of 146% of business objectives, multiplied by 60% of base salary). The actual awards received by the Chief Executive Officer are shown in the table Single total figure of remuneration for the Chief Executive Officer. 97
100 Directors Remuneration report continued Performance Share Plan (Performance share award during the financial year for the Chief Executive Officer) Performance share plan awards are normally granted on an annual basis. The Chief Executive Officer is the only Director who participates in the Group s share incentive plan, with performance shares being awarded under the PSP. On 10 December 2015, the Chief Executive Officer was awarded 138,476 performance shares under the PSP. These shares will vest in March 2019 provided that performance conditions are met at the end of the three-year period. The following table sets out the details of the award made to the Chief Executive Officer under the PSP for 2015: Type of award made 138,476 performance shares have been awarded under the PSP. Shares vest after three years in March 2019, subject to the achievement of performance conditions. The above award includes one grant in Share price Euros (14.70 GBP) Date of grant 10 December 2015 Performance period 1 January 2016 to 31 December 2018 Face value of the award 2,898,720 Euros (The maximum number of shares that would vest if all performance measures and targets are met, multiplied by the share price at the date of grant ) Face value of the award as a % of Annual Base Salary 330% Percentage that would be distributed if threshold performance was achieved in 25% of maximum award both PSP key performance indicators Percentage that would be distributed if threshold performance was achieved only 12.5% of maximum award in one PSP key performance indicator Notes: The table above specifies the number of shares awarded under the PSP. The proportion of the awards that will vest is dependent upon the achievement of performance conditions and the actual value distributed may be nil. The vesting outcomes will be disclosed in the 2018 report. Performance share plan performance targets Targets have been reviewed and approved by the Remuneration Committee to reward long-term sustainable performance in-line with the Group s business strategy and to create alignment with the delivery of value for shareholders. The PSP is associated with the following key performance indicators: Comparable EPS: Calculated by dividing the comparable net profit attributable to the owners of the parent by the weighted average number of outstanding shares during the period. Return on invested capital: ROIC is the percentage return that a company makes over its invested capital. More specifically we define ROIC as the percentage of net operating profit after tax divided by the capital employed. Capital employed is calculated as the average of net borrowings and shareholders equity through the year. The threshold, target and maximum for PSP key performance indicators are approved by the Remuneration Committee. Grants will normally take place each year in March. The PSP was approved by the Annual General Meeting in June In order to ensure that plan participants would not be negatively impacted by the transition from the ESOP to the PSP, the grant took place in December The next grant will take place in March The threshold, base target and maximum performance conditions for the 2015 December PSP grant, as well for the 2016 March PSP grant, will be the same, as PSP key performance indicators will be measured over the same performance period, which is from 1 January 2016 to 31 December The table below outlines the targets and the vesting profile for these awards. Comparable EPS Measures by December 2018 (Weighting 50%) Return on Invested Capital by December 2018 (Weighting 50%) Vesting Profile Threshold % 25% Maximum % 100% The vesting schedule for PSP performance conditions is not straight line between the threshold and maximum performance levels. The Committee considers that it is appropriate to place greater emphasis on achieving the Target performance level than outperformance of this level. The Committee has judged that the Target level of performance is commercially sensitive and so it will not be disclosed on a forwardlooking basis. It will be disclosed on a retrospective basis in our 2018 report. 98
101 Strategic Report Corporate Governance Financial Statements Supplementary Info & Swiss Statutory Reporting Change in Chief Executive Officer remuneration The following table sets out the percentage change in the Chief Executive Officer s overall remuneration over the last year as opposed to the percentage change in the average remuneration of other Swiss-based employees of the Group. We have chosen to make a comparison against employees in Switzerland as this is the market in which our Chief Executive Officer is based. The design of the Chief Executive Officer s package is consciously more focused on variable pay based on group business results and therefore will vary more from year to year. MIP payout related to the Swiss workforce is mainly driven by the Swiss business unit results. Annual Base Salary 1 in Euros Benefits 1 in Euros Annual Bonus 1 in Euros Chief Executive Officer % change from 2014 to 2015 Change 20% Change 116% Change 99% Average employee % change for the Swiss workforce from 2014 to Change 1.3% Change 1.4% Change 10% 1. In accordance with UK regulation, the Chief Executive Officer s total remuneration reflects base pay, cash and non-cash benefits and annual bonus. 2. Applicable foreign exchange rate from CHF to Euro was during the period. Performance review The following chart sets out the Group s total shareholder return (TSR) performance benchmarked against the TSR performance of the FTSE 100. As the Group is part of FTSE 100, the comparison is made versus that index. Coca-Cola HBC vs. FTSE 100 TSR (rebased to 100) Jan 09 Jan 10 Jan 11 Jan 12 Jan 13 Jan 14 Dec 15 FTSE 100 CCHBC Chief Executive Officer remuneration for period of TSR The following table sets out the total remuneration paid to the Group s Chief Executive Officer over the last seven years, including MIP and stock options: Doros Constantinou Doros Constantinou Doros Constantinou Dimitris Lois Dimitris Lois Dimitris Lois Dimitris Lois Dimitris Lois Total remuneration ( 000 s) 3,012 1,918 1,928 1, ,708 3,752 2,887 % of maximum awards received under MIP 75% 45% 49% 68% 24% 9% 65% 63% On 4 July 2011, the former Chief Executive Officer of the Group retired from service, and Mr. Lois succeeded him. The amounts for 2011 include the remuneration of the former Chief Executive Officer up to the retirement date and the remuneration of Mr. Lois for the remainder of the year. For 2011, the remuneration of the former Chief Executive Officer includes termination benefits due to retirement. As Coca-Cola HBC listed on the London Stock Exchange in April 2013, the amounts included in respect of the period before that date relate to the remuneration the Chief Executive Officer received in his capacity as Chief Executive Officer of Coca-Cola Hellenic Bottling Company S.A. 99
102 Directors Remuneration report continued Investor and employee perspective Shareholder views have been taken into account in formulating the remuneration policy. The Committee, under the scope of reviewing the remuneration policy and practices, considers shareholder views as well as what is right for the Group to achieve its overall business strategies. In reviewing and determining remuneration the Committee took into account the following: The business strategies and needs of the company; The views of shareholders on group policies and programmes of remuneration; Market comparisons and the positioning of the Group s remuneration relative to other comparable companies; Input from employees regarding our remuneration programmes; The need to design similar, performance-related principles for the determination of executive remuneration and the remuneration of other employees; and Ensuring that Board members, the Chief Executive Officer and Operating Committee members play no part in determining their own remuneration. The Chairman of the Committee and the Chief Executive Officer are not present when the Remuneration Committee and the Board discuss matters that pertain to their remuneration. This ensures that the same performance-setting principles are applied for executive remuneration and for other employees in the organisation. Directors service contracts and terms of appointment Appointment dates of each Director and unexpired terms of their service contract or appointment as a non-executive Director are set out below. Name Title Date originally appointed to the Board of the Company Date appointed to the Board of the Company Unexpired term of service contract or appointment as non-executive Director Anastassis G. David Chairman and non-executive Director 27 July June 2015 One year Dimitris Lois Chief Executive Officer 4 July June 2015 Indefinite, terminable on 6 months notice George A. David 1 Non-Executive Director 2 January June 2015 One year Anastasios I. Leventis Non-Executive Director 25 June June 2015 One year Christo Leventis Non-Executive Director 25 June June 2015 One year Irial Finan Non-Executive Director 23 October June 2015 One year José Octavio Reyes Non-Executive Director 25 June June 2015 One year Antonio D Amato Non-Executive Director 1 January June 2015 One year Christos Ioannou 2 Non-Executive Director 19 March 2010 Sir Michael Llewellyn-Smith Senior Independent non-executive Director 6 September June 2015 One year Nigel Macdonald Non-Executive Director 17 June June 2015 One year Susan Kilsby 3 Non-Executive Director 25 April 2013 John P. Sechi Non-Executive Director 25 June June 2015 One year Alexandra Papalexopoulou 4 Non-Executive Director 24 June June 2015 One year Olusola (Sola) David-Bohra 5 Non-Executive Director 24 June June 2015 One year 1. On 2 January 1981, Mr. George A. David was appointed to the Board of Hellenic Bottling Company S.A, which acquired Coca-Cola Beverages plc on 9 August 2000 and formed Coca-Cola Hellenic Bottling Company S.A. 2. Mr. Christos Ioannou retired from the Board and the Audit and Risk Committee on 24 June Mrs. Susan Kilsby retired from the Board, the Remuneration Committee and the Nomination Committee on 24 June Mrs. Alexandra Papalexopoulou was appointed to the Board and the Nomination Committee on 24 June Mrs. Olusola (Sola) David-Bohra was appointed to the Board and the Audit and Risk Committee on 24 June
103 Strategic Report Corporate Governance Financial Statements Supplementary Info & Swiss Statutory Reporting The Chief Executive Officer s service contract and the terms and conditions of appointment of the non-executive Directors are open for inspection by the public at the registered office of the Group. Non-Executive Directors remuneration for the year ended 31 December 2015 Senior Independent ( ) Remuneration Committee fees Social Responsibility ( ) Non-Executive Director Base fees ( ) Audit ( ) Remuneration ( ) Nomination ( ) Anastassis G. David 1 65,000 2,500 67,500 70,000 George A. David Christo Leventis Anastasios I. Leventis Irial Finan 65,000 65,000 65,000 Antonio D Amato 65,000 5,000 5,000 75, Christos Ioannou 2 32,500 6,250 38,750 77,500 Sir Michael Llewellyn- Smith 65,000 10,000 10,000 10,000 95,000 90,000 Nigel Macdonald 65,000 25,000 90,000 90,000 Susan Kilsby 3 32,500 2,500 2,500 37,500 75,000 José Octavio Reyes 4 65,000 2,500 5,000 72,500 37,500 John P. Sechi 65,000 12,500 77,500 38,750 Alexandra Papalexopoulou 5 32,500 2,500 2,500 37,500 Olusola (Sola) David-Bohra 6 32,500 6,250 38, With effect from 24 June 2015, Mr. Anastassis David retired from the Company s Nomination Committee. The Group has applied a half-year period fee of 2,500 for Nomination Committee membership. 2. Mr. Christos Ioannou retired from the Board and the Audit and Risk Committee on 24 June The Group has applied a half-year period fee of 6,250 for Audit and Risk Committee membership. 3. Mrs. Susan Kilsby retired from the Board, the Remuneration Committee and the Nomination Committee on 24 June The Group has applied a half year period fee of for the Nomination and Remuneration Committee memberships. 4. With effect from 24 June 2015, Mr. Reyes retired from the Company s Nomination Committee. The Group has applied a half-year period fee of 2,500 for Nomination Committee membership. In relation to Mr. Reyes, on top of the basic fees of 72,500, the Group paid as required by the Swiss legislation, social security contribution of 5, Mrs. Alexandra Papalexopoulou was appointed to the Board and the Nomination Committee on 24 June The Group has applied a half-year period fee of 2,500 for Nomination and Remuneration Committee memberships. 6. Mrs. Olusola (Sola) David-Bohra was appointed to the Board and the Audit and Risk Committee on 24 June The Group has applied a half-year period fee of 6,250 for Audit and Risk Committee membership. For Mrs. David-Bohra, on top of the basic fees of 38,750, the Group paid 3,058 in social security contribution as required by legislation. Non-Executive Directors do not participate in any of the Group s incentive plans, nor do they receive any retirement or other taxable benefits. Directors shareholdings and share interests (ESOP, PSP and ESPP) The following table sets out the information regarding the stock options and shares in respect of Coca-Cola HBC held by the Chief Executive Officer under the ESOP, the PSP and the ESPP. ESOP PSP ESPP Name Number of stock options outstanding Fully vested Vesting at the end of 2016 Vesting at the end of 2017 Performance shares granted Unvested and subject to performance conditions Vested but unexercised Number of Outstanding shares held 1 as at 31 December 2015 Dimitris Lois 1,700,000 1,250, , , , ,476 35,993 Notes: 1. The number of shares held by Mr. Lois includes the amount of purchased and vested shares held under the ESPP on 31 December 2015 and 1,000 shares held by Mr. Lois s spouse. Out of the 35,993 shares that the Chief Executive Officer held as of 31 December 2015, 2,035 shares have not yet vested. Dimitris Lois did not exercise any options during Total ( ) 2014 Total ( ) 101
104 Directors Remuneration report continued The following table sets out each non-executive Director s holding of shares and other interests in shares (including share options and share awards under the Group s incentive plans): Number of share options and share awards held as at 31 December 2015 Director Number of shares held as at 31 December 2015 Without performance conditions With performance conditions Vested share options Anastassis G. David 1 N/A N/A N/A George A. David N/A N/A N/A Irial Finan N/A N/A N/A Christo Leventis 2 N/A N/A N/A Antonio D Amato N/A N/A N/A Sir Michael Llewellyn-Smith 545 N/A N/A N/A Nigel Macdonald 1,700 N/A N/A N/A Anastasios I. Leventis 3 N/A N/A N/A José Octavio Reyes N/A N/A N/A John P. Sechi N/A N/A N/A Alexandra Papalexopoulou N/A N/A N/A Olusola (Sola) David-Bohra N/A N/A N/A 1. The infant child of Mr. Anastassis David being a beneficiary of a private discretionary trust for the primary benefit of present and future members of the family of the late Anastasios George Leventis, of which Truad Verwaltungs AG is the Trustee, has an indirect interest with respect to the 85,355,019 shares held by Kar-Tess Holding S.A.. The infant child of Mr. Anastassis David being a beneficiary of a further private discretionary trust for the primary benefit of present and future members of the family of the late Anastasios George Leventis, of which Selene Treuhand AG is the Trustee, has a further indirect interest in respect of 823,008 shares held by New Argen Holdings Ltd.. Mr. Anastassis David is connected with his infant child for the purposes of rule 3 of the Disclosure and Transparency Rules of the UK Financial Conduct Authority. 2. The infant children of Mr. Christo Leventis being beneficiaries of a private discretionary trust for the primary benefit of present and future members of the family of the late Anastasios George Leventis, of which Truad Verwaltungs AG is the Trustee, have indirect interests with respect to the 85,355,019 shares held by Kar-Tess Holding S.A.. The infant children of Mr. Christo Leventis being beneficiaries of a further private discretionary trust for the primary benefit of present and future members of the family of the late Anastasios George Leventis, of which Selene Treuhand AG is the Trustee, have further indirect interests in respect of 1,234,513 shares held by New Argen Holdings Ltd.. Mr. Christo Leventis is connected with his infant children for the purposes of rule 3 of the Disclosure and Transparency Rules of the UK Financial Conduct Authority. By virtue of himself being a beneficiary of a private discretionary trust for the primary benefit of present and future members of the family of the late Christodoulos Papaneokleus Leventis, of which Mervail Company (PTC) Limited is the trustee, Mr. Christo Leventis has an indirect interest with respect to the 757,307 shares held by Carlcan Holding Limited. 3. The infant child of Mr. Anastasios I. Leventis, being a beneficiary of a private discretionary trust for the primary benefit of present and future members of the family of the late Anastasios George Leventis, of which Truad Verwaltungs AG is the Trustee, has an indirect interest in respect of the 85,355,019 shares held by Kar-Tess Holding S.A.. The infant child of Mr. Anastasios I. Leventis, being a beneficiary of a further private discretionary trust for the primary benefit of present and future members of the family of the late Anastasios George Leventis, of which Selene Treuhand AG is the Trustee, has a further indirect interest in respect of 823,008 shares held by New Argen Holdings Ltd.. Mr. Anastasios I. Leventis is connected with his infant child for the purposes of rule 3 of the Disclosure and Transparency Rules of the UK Financial Conduct Authority. By virtue of himself being a beneficiary of a private discretionary trust for the primary benefit of present and future members of the family of the late Christodoulos Papaneokleus Leventis, of which Mervail Company (PTC) Limited is the trustee, Mr. Anastasios I. Leventis has an indirect interest with respect to 623,664 shares held by Carlcan Holding Limited. Shareholding guidelines implementation for the Chief Executive Officer In 2015, the Remuneration Committee reviewed and approved a policy on minimum shareholding guidelines for the Chief Executive Officer. The Chief Executive Officer is expected to build his shareholding at the level of 200% of annual base salary to be achieved in a five-year period from the date of the first PSP Grant (10 December 2015). Vested shares from the ESPP and PSP may be counted to fulfil the shareholding guidelines. The table below sets out information on shareholding guidelines for the Chief Executive Officer: ESPP PSP Number of vested shares held 1 Vested unexercised shares Shareholding Current shareholding versus minimum Guideline Starting date of Name as at 31 December 2015 held 1 as at 31 December 2015 guideline guidelines 3 met shareholding guideline Dimitris Lois 33, % of annual base salary 2 76% out of 200% No 10 December The number of vested shares held by Mr. Lois includes the amount of purchased and vested shares held under the ESPP on 31 December 2015 and 1,000 shares held by Mr. Lois s spouse. 2. The applicable foreign exchange rate from GBP to Euro was set at The share price used was GBP as of 31 December Payments to past Directors In the year ended 31 December 2015, no payments were made to past Directors. Payments for loss of office In the year ended 31 December 2015, no payments were made for loss of office. Termination payments During 2015, no amount was paid or accrued for terminations. Remuneration Committee advisers While the Remuneration Committee does not have external advisers, in 2015 it authorised management to work with external consultancy firm Willis Towers Watson, to assist in the design of the performance share plan and to obtain benchmark information on the individual performance share grants and performance targets for the Chief Executive Officer, Operating Committee members and other eligible plan members. We paid 54,302 in connection with the work related to the design of the performance share plan. This consultancy firm was not connected in any way with Coca-Cola HBC apart from providing remuneration information services to senior management. These services are considered to have been independent and relevant to the market. 102
105 Strategic Report Corporate Governance Financial Statements Supplementary Info & Swiss Statutory Reporting Relative importance of spend on pay The following graph shows the expenditure of the Group on remuneration paid to all employees and distributions made to shareholders (by way of dividend share buy back and/or capital return) and any other significant distributions in 2015 compared with the prior year. Relative importance of spend on pay ( m) , Total , ,236 Total Directors and Operating Committee members remuneration The total remuneration paid to or accrued for Directors, the Operating Committee and the Chief Executive Officer for 2015 amounted to 18.2 million, compared with 18.7 million for Salaries and other short-term benefits amounted to 12.3 million, compared to 10.7 million for Out of the total remuneration, the amount accrued for stock option grants during 2015 was 5.1 million, compared to 7.4 million during Pension and postemployment benefits for Directors and the Operating Committee and the Chief Executive Officer during 2015 amounted to 0.8 million, compared to 0.6 million during Credits and loans granted to governing bodies In 2015, no credits or loans were granted to active or former members of the Company s Board of Directors, members of the Operating Committee or to any related persons. Total staff costs Distribution to shareholders Note: Total staff costs include all remuneration elements. The distribution to shareholders reflects the dividends paid out to shareholders during the relevant year. In 2015 total staff costs have been reduced by 3.1%, while dividends paid out to shareholders have been increased by 1.7% Statement of shareholder voting at last year s AGM The table below sets out the result of the vote on the remuneration-related resolution at the Annual General Meeting held in June 2015: Resolution Votes for Votes against Abstentions cast Total votes cast Voting rights represented Advisory vote on the UK Remuneration Report (including the 213,911,712 46,089,032 8,587, ,588, % remuneration policy) and the Swiss Remuneration Report 79.64% 17.16% 3.20% Approval of the maximum aggregate amount of the remuneration 268,362,579 1, , ,588, % for the Board of Directors until the next Annual General Meeting 99.92% 0.00% 0.08% Approval of the maximum aggregate amount of the remuneration 267,386,311 60,629 1,141, ,588, % for the Operating Committee for the next financial year 99.56% 0.02% 0.42% Following the feedback we received from our shareholders, we implemented several changes to our remuneration policy. We have enhanced our disclosures relating to the MIP and PSP plans, implemented malus and clawback clauses in our reward programmes, adapted our Directors recruitment policy, introduced an overall dilution limit for our reward plans and minimum shareholding guidelines for our senior management. We shall put forward the policy and the report for a vote at the Annual General Meeting in June Implementation of remuneration policy in 2016 The remuneration practice will be in line with the policy described in the policy section. The Committee intends to implement the remuneration policy in 2016 as follows: Base salaries and fees The Committee intends to review the salary of the Chief Executive Officer in March The base salary increase for the Chief Executive Officer is anticipated to be in line with the increase for other employees, and will be effective as of 1 May Fees for non-executive Directors will be reviewed in Any increase to such fees will be tabled for approval by shareholders at the 2016 AGM. MIP The MIP will continue to be in line with the policy for The key performance indicators that were described in the annual report on remuneration will apply in 2016 with the same weighting. We have not disclosed full details of all the MIP objectives or financial targets for 2016 in this report, as we consider them to be commercially sensitive. Targets are not disclosed on a forwardlooking basis but will be disclosed on a retrospective basis in next year s annual report on remuneration. PSP The PSP will continue to be in line with the policy for The key performance indicators that were described in the policy section will apply in 2016 with the same weighting. The Remuneration Committee intends to recommend to the Board to award 330% of base salary to the Chief Executive Officer under the performance share plan in March The same performance conditions will apply as in the 2015 December grant, as both grants will be measured under the same performance period, i.e. 1 January 2016 to 31 December Pensions and benefits Pensions arrangements will be reviewed during There are no plans for any changes to the stated policy. 103
106 Statement of Directors Responsibilities The Directors, whose names and functions are set out on pages 64 to 65 confirm to the best of their knowledge that: (a) The Annual Report, taken as a whole, is fair, balanced and understandable, and provides the information necessary for shareholders to assess the Group s position and performance, business model and strategy. (b) The consolidated financial statements, which have been prepared in accordance with International Financial Reporting Standards, as issued by the IASB, give a true and fair view of the assets, liabilities, financial position and profit or loss of the Company and the undertakings included in the consolidation of the Group taken as a whole. (c) The Annual Report includes a fair review of the development and performance of the business and the position of the Company and the undertakings included in the consolidated Coca-Cola HBC Group taken as a whole, together with a description of the principal risks and uncertainties that they face. (d) The Directors are responsible for preparing the Annual Report, including the consolidated financial statements, and the Corporate Governance Report including the Remuneration Report and the Strategic Report, in accordance with applicable law and regulations. (e) The activities of the Group, together with the factors likely to affect its future development, performance, the financial position of the Group, its cash flows, liquidity position and borrowing facilities are described in the Strategic Report (pages 1 to 61). In addition, notes 7 Financial instruments, 14 Borrowings, 17 Share capital, share premium and Group reorganisation reserve and 28 Financial risk management to the financial statements include the Company s objectives, policies and processes for managing its capital; its financial risk management objectives; details of its financial instruments and hedging activities; and its exposures to credit risk and liquidity risk. The Group has considerable financial resources together with long-term contracts with a number of customers and suppliers across different countries. The Directors have also assessed the principal risks and the other matters discussed in connection with the viability statement on page 61. The Directors considered it appropriate to adopt the going concern basis of accounting in preparing the annual financial statements and have not identified any material uncertainties to the Group s ability to continue to do so over a period of at least 12 months from the date of approval of these financial statements. By order of the Board Dimitris Lois Chief Executive Officer 17 March 2016 Disclosure of information required under Listing Rule 9.8.4R For the purposes of Listing Rule 9.8.4C, the information required to be disclosed by Listing Rule 9.8.4R can be located as set out below: Listing Rule Information to be included Reference in Report 9.8.4(1) Interest capitalised by the Group and an indication of the amount and Note 20 to the financial statements treatment of any associated tax relief 9.8.4(2) Details of any unaudited financial information required by LR Not applicable 9.8.4(4) Details of any long-term incentive scheme described in LR Not applicable 9.8.4(5) Details of any arrangement under which a director has waived any Page 95 emoluments 9.8.4(6) Details of any arrangement under which a director has agreed to waive Not applicable future emoluments 9.8.4(7) Details of any allotments of shares by the Company for cash not previously Not applicable authorised by shareholders 9.8.4(8) Details of any allotments of shares for cash by a major subsidiary of the Company Not applicable 9.8.4(9) Details of the participation by the Company in any placing made by its parent Not applicable company 9.8.4(10) Details of any contracts of significance involving a director Not applicable 9.8.4(11) Details of any contract for the provision of services to the Company by a Not applicable controlling shareholder 9.8.4(12) Details of any arrangement under which a shareholder has waived or agreed Not applicable to waive any dividends 9.8.4(13) Details of any arrangement under which a shareholder has agreed to waive Not applicable future dividends 9.8.4(14) Agreements with a controlling shareholder Not applicable 104
107 Strategic Report Corporate Governance Financial Statements Supplementary Info & Swiss Statutory Reporting Independent Auditor s report Introduction We have audited the consolidated financial statements of Coca-Cola HBC AG, ( the Company ), for the year ended 31 December 2015, which comprise the Consolidated Balance Sheet, the Consolidated Income Statement, the Consolidated Statement of Comprehensive Income, the Consolidated Statement of Changes in Equity, the Consolidated Statement of Cash Flows and a summary of significant accounting policies and other explanatory information. The financial reporting framework that has been applied in their preparation is applicable law and International Financial Reporting Standards ( IFRSs ) as issued by the International Accounting Standards Board ( IASB ). Directors responsibility for the financial statements As explained more fully in the Statement of Directors Responsibilities set out in the Company s 2015 Integrated Annual Report, the Directors are responsible for the preparation of the consolidated financial statements and for being satisfied that they give a true and fair view, and for such internal control as the Directors determine is necessary to enable the preparation of consolidated financial statements that are free from material misstatement, whether due to fraud or error. Auditor s responsibility Our responsibility is to express an opinion on the consolidated financial statements based on our audit. We conducted our audit in accordance with International Standards on Auditing ( ISA ). Those Standards require that we comply with ethical requirements and plan and perform the audit to obtain reasonable assurance about whether the consolidated financial statements are free from material misstatement. An audit involves performing procedures to obtain evidence about the amounts and disclosures in the consolidated financial statements. The procedures selected depend on the auditor s judgement, including the assessment of the risks of material misstatement of the consolidated financial statements, whether due to fraud or error. In making those risk assessments, the auditor considers internal control relevant to the Company s preparation of financial statements that give a true and fair view in order to design audit procedures that are appropriate in the circumstances, but not for the purpose of expressing an opinion on the effectiveness of the entity s internal control. An audit also includes evaluating the appropriateness of accounting policies used and the reasonableness of accounting estimates made by the Directors, as well as evaluating the overall presentation of the consolidated financial statements. Opinion on financial statements In our opinion the consolidated financial statements: give a true and fair view of the state of the Company s affairs as at 31 December 2015 and of its profit and cash flows for the year then ended; and have been properly prepared in accordance with IFRSs as issued by the IASB. Matters on which we are required to report by exception Under the Listing Rules we are required to review the part of the Corporate Governance section relating to the Company s compliance with eleven provisions of the UK Corporate Governance Code (the Code ). We have nothing to report having performed our review. Other matters We have reviewed the statement on going concern, included in the Statement of Directors Responsibilities, in the Company s 2015 Integrated Annual Report, as if the Company were a UK incorporated premium listed entity. We have nothing to report having performed our review. As noted in the Statement of Directors Responsibilities, the Directors have concluded that it is appropriate to prepare the financial statements using the going concern basis of accounting. The going concern basis presumes that the Company has adequate resources to remain in operation, and that the Directors intend it to do so, for at least one year from the date the financial statements are signed. As part of our audit we have concluded that the Directors use of the going concern basis is appropriate. However, because not all future events or conditions can be predicted, these statements are not a guarantee as to the Company s ability to continue as a going concern. We have also reviewed the Directors statement in relation to the longer-term viability of the Company, set out on page 61. Our review was substantially less in scope than an audit and only consisted of making inquiries and considering the Directors process supporting their statement; checking that the statement is in alignment with the relevant provisions of the Code; and considering whether the statement is consistent with the knowledge acquired by us in the course of performing our audit. We have nothing to report having performed our review. We believe that the audit evidence we have obtained is sufficient and appropriate to provide a basis for our audit opinion. This report, including the opinion, has been prepared for and only for the Company for the purpose of the Disclosure and Transparency Rules and the Listing Rules of the Financial Conduct Authority and for no other purpose. We do not, in giving this opinion, accept or assume responsibility for any other purpose or to any other person to whom this report is shown or into whose hands it may come save where expressly agreed by our prior consent in writing. Marios Psaltis the Certified Auditor, Reg. No for and on behalf of PricewaterhouseCoopers S.A. Certified Auditors, Reg. No. 113 Athens, Greece 17 March 2016 Notes: (a) The maintenance and integrity of the Coca-Cola HBC AG website is the responsibility of the directors; the work carried out by the auditors does not involve consideration of these matters and, accordingly, the auditors accept no responsibility for any changes that may have occurred to the consolidated financial statements since they were initially presented on the website. (b) Legislation in UK and Switzerland governing the preparation and dissemination of consolidated financial statements may differ from legislation in other jurisdictions. 105
108 Financial statements Consolidated Balance Sheet Note As at 31 December Assets Intangible assets 4 1, ,884.8 Property, plant and equipment 5 2, ,624.1 Equity method investments Derivative financial instruments Deferred tax assets Other non-current assets Total non-current assets 4, ,816.9 Inventories Trade, other receivables and assets Derivative financial instruments Current tax assets Cash and cash equivalents , ,061.1 Assets classified as held for sale Total current assets 1, ,062.1 Total assets 6, ,879.0 Liabilities Borrowings Derivative financial instruments Trade and other payables 15 1, ,473.7 Provisions and employee benefits Current tax liabilities Total current liabilities 2, ,195.9 Borrowings ,556.3 Derivative financial instruments Deferred tax liabilities Provisions and employee benefits Other non-current liabilities Total non-current liabilities 1, ,892.0 Total liabilities 3, ,087.9 Equity Share capital 17 2, ,998.1 Share premium 17 5, ,157.6 Group reorganisation reserve 17 (6,472.1) (6,472.1) Treasury shares 18 (132.0) (70.7) Exchange equalisation reserve 18 (681.4) (615.3) Other reserves Retained earnings 2, ,529.7 Equity attributable to owners of the parent 2, ,787.0 Non-controlling interests Total equity 2, ,791.1 Total equity and liabilities 6, ,879.0 The accompanying notes form an integral part of these consolidated financial statements. 106
109 Strategic Report Corporate Governance Financial Statements Supplementary Info & Swiss Statutory Reporting Consolidated Income Statement Note Year ended 31 December Net sales revenue 3 6, ,510.2 Cost of goods sold (4,018.7) (4,192.5) Gross profit 2, ,317.7 Operating expenses 19 (1,855.2) (1,901.4) Restructuring costs 19 (54.0) (55.2) Operating profit Finance income Finance costs (77.7) (80.5) Loss on net monetary position 20 (2.4) Total finance costs, net 20 (68.2) (72.9) Share of results of equity method investments Profit before tax Tax 3,21 (76.4) (57.8) Profit after tax Attributable to: Owners of the parent Non-controlling interests 0.4 (0.6) Basic and diluted earnings per share ( ) The accompanying notes form an integral part of these consolidated financial statements. 107
110 Financial statements continued Consolidated Statement of Comprehensive Income Year ended 31 December Profit after tax Other comprehensive income: Items that may be subsequently reclassified to income statement: Available-for-sale financial assets: Valuation gains/(losses) during the year 0.1 (0.6) Cash flow hedges: Amounts of (losses)/gains during the year (5.2) 5.4 Amounts of losses reclassified to profit and loss for the year Transfers to inventory for the year (19.7) (20.3) (6.4) 6.4 Foreign currency translation (65.8) (322.0) Share of other comprehensive income of equity method investments (0.2) Income tax relating to items that may be subsequently reclassified to income statement (refer to Note 23) 5.5 (6.6) (80.7) (322.8) Items that will not be subsequently reclassified to income statement: Actuarial gains/(losses) 11.1 (38.7) Income tax relating to items that will not be subsequently reclassified to income statement (refer to Note 23) (2.9) (32.1) Other comprehensive income for the year, net of tax (refer to Note 23) (72.5) (354.9) Total comprehensive income for the year (60.7) Total comprehensive income attributable to: Owners of the parent (60.1) Non-controlling interests 0.4 (0.6) (60.7) The accompanying notes form an integral part of these consolidated financial statements. 108
111 Strategic Report Corporate Governance Financial Statements Supplementary Info & Swiss Statutory Reporting Consolidated Statement of Changes in Equity Share capital Share premium Group reorganisation reserve Attributable to owners of the parent Treasury shares Exchange equalisation reserve Other reserves Retained earnings Total Noncontrolling interests Total equity Balance as at 1 January , ,287.1 (6,472.1) (70.7) (293.3) , , ,967.3 Shares issued to employees exercising stock options Share-based compensation: Options Movement in shares held for equity compensation plan (2.3) (2.3) (2.3) Share of other changes in equity of equity method investments (0.5) (0.5) (0.5) Appropriation of reserves (138.0) Hyperinflation impact Dividends (130.2) 1.2 (129.0) (0.4) (129.4) 1, ,157.6 (6,472.1) (70.7) (293.3) , , ,851.8 Profit for the year net of tax (0.6) Other comprehensive income for the year, net of tax (322.0) (0.8) (32.1) (354.9) (354.9) Total comprehensive income for the year, net of tax 1 (322.0) (0.8) (60.1) (0.6) (60.7) Balance as at 31 December , ,157.6 (6,472.1) (70.7) (615.3) , , , The amount included in the exchange equalisation reserve of 322.0m loss for 2014 represents the exchange loss attributable to the owners of the parent. The amount included in other reserves of 0.8m loss for 2014 consists of loss on valuation of available-for-sale financial assets of 0.6m, cash flow hedges gain of 6.4m (of which 5.4m represents revaluation gain for the year, 7.4m represents revaluation losses reclassified to profit and loss for the year, and 6.4m represents revaluation gain reclassified to inventory for the year) and the deferred tax expense thereof amounting to 6.6m. The amount of 262.7m profit comprises profit for the year of 294.8m, plus actuarial loss of 38.7m, less a deferred tax income of 6.6m. The amount of 0.6m loss included in non-controlling interests for 2014 represents the share of non-controlling interests in retained earnings. The accompanying notes form an integral part of these consolidated financial statements. 109
112 Financial statements continued Consolidated Statement of Changes in Equity continued Share capital Share premium Group reorganisation reserve Attributable to owners of the parent Treasury shares Exchange equalisation reserve Other reserves Retained earnings Total Noncontrolling interests Total equity Balance as at 1 January , ,157.6 (6,472.1) (70.7) (615.3) , , ,791.1 Shares issued to employees exercising stock options Share-based compensation: Options and performance shares Movement in shares held for equity compensation plan (0.6) Acquisition of treasury shares (58.5) (58.5) (58.5) Appropriation of reserves (2.2) 5.2 (3.0) Dividends (132.4) 1.3 (131.1) (0.2) (131.3) 2, ,028.3 (6,472.1) (132.0) (615.3) , , ,615.9 Profit for the year net of tax Other comprehensive income for the year, net of tax (66.1) (14.6) 8.2 (72.5) (72.5) Total comprehensive income for the year, net of tax 2 (66.1) (14.6) Balance as at 31 December , ,028.3 (6,472.1) (132.0) (681.4) , , , The amount included in the exchange equalisation reserve of 66.1m loss for 2015 represents the exchange loss attributable to the owners of the parent. The amount included in other reserves of 14.6m loss for 2015 consists of gain on valuation of available-for-sale financial assets of 0.1m, cash flow hedges losses of 20.3m (of which 5.2m represents revaluation loss for the year, 4.6m represents revaluation loss reclassified to profit and loss for the year, and 19.7m represents revaluation gain reclassified to inventory for the year), 0.1m gain relating to share of other comprehensive income of equity method investments and the deferred tax income thereof amounting to 5.5m. The amount of 288.5m profit comprises profit for the year of 280.3m, plus actuarial gains of 11.1m, less a deferred tax expense of 2.9m. The amount of 0.4m gain included in non-controlling interests for 2015 represents the share of non-controlling interests in retained earnings. For further details, please refer to: Note 17 Share capital, share premium and Group reorganisation reserve; Note 18 Reserves; Note 24 Shares held for equity compensation plan; Note 25; Stock option and performance shares compensation plans; and Note 27; Dividends. The accompanying notes form an integral part of these consolidated financial statements. 110
113 Strategic Report Corporate Governance Financial Statements Supplementary Info & Swiss Statutory Reporting Consolidated Cash Flow Statement Note Year ended 31 December Operating activities Profit after tax Total finance costs, net Share of results of equity method investments 6 (7.1) (63.8) Tax charged to the income statement 3, Depreciation of property, plant and equipment Impairment of property, plant and equipment Employee stock options and performance shares Amortisation of intangible assets 3, Other items (1.3) (0.3) Loss/(gain) on disposals of non-current assets 1.8 (1.8) Increase in inventories (37.1) (38.0) Increase in trade and other receivables (13.8) (53.9) Increase in trade and other payables Tax paid (72.7) (69.0) Net cash from operating activities Investing activities Payments for purchases of property, plant and equipment (331.5) (362.6) Payments for purchases of intangible assets 4,32 (14.1) Proceeds from sales of property, plant and equipment Net receipts from investments 6, Loans to related parties (2.7) Interest received Net cash used in investing activities (186.0) (337.1) Financing activities Share buy-back payments 18 (58.5) (Payments)/proceeds for shares held by non-controlling interests 26 (1.2) 2.6 Proceeds from shares issued to employees exercising stock options Dividends paid to owners of the parent 27 (131.1) (129.0) Dividends paid to non-controlling interests 27 (0.2) (0.4) Proceeds from borrowings ,137.9 Repayments of borrowings (1,162.7) (1,347.2) Principal repayments of finance lease obligations (13.8) (14.0) Interest paid (69.5) (91.3) Net cash used in financing activities (689.2) (440.0) Net decrease in cash and cash equivalents (135.9) (90.8) Movement in cash and cash equivalents Cash and cash equivalents at 1 January Net decrease in cash and cash equivalents (135.9) (90.8) Effect of changes in exchange rates (13.0) (11.4) Hyperinflation impact on cash 1.0 Cash and cash equivalents at 31 December The accompanying notes form an integral part of these consolidated financial statements. 111
114 Notes to the Consolidated Financial Statements 1. Basis of preparation and accounting policies Description of business Coca-Cola HBC AG and its subsidiaries (the Group or Coca-Cola HBC or the Company ) are principally engaged in the production, sales and distribution of non-alcoholic ready-to-drink beverages, under franchise from The Coca-Cola Company. The Company distributes its products in 27 countries in Europe and Nigeria. Information on the Company s operations by segment is included in Note 3. On 11 October 2012, Coca-Cola HBC, a Swiss stock corporation (Aktiengesellschaft/Société Anonyme) incorporated by Kar-Tess Holding (a related party of the Group, see Note 32), announced a voluntary share exchange offer to acquire all outstanding ordinary registered shares and all American depositary shares of Coca-Cola Hellenic Bottling Company S.A. As a result of the successful completion of this offer, on 25 April 2013 Coca-Cola HBC acquired 96.85% of the issued Coca-Cola Hellenic Bottling Company S.A. shares, including shares represented by American depositary shares, and became the new parent company of the Group. On 17 June 2013, Coca-Cola HBC completed its statutory buy-out of the remaining shares of Coca-Cola Hellenic Bottling Company S.A. that it did not acquire upon completion of its voluntary share exchange offer. Consequently, Coca-Cola HBC acquired 100% of Coca-Cola Hellenic Bottling Company S.A. which was eventually delisted from the Athens Exchange, from the London Stock Exchange where it had a secondary listing and from the New York Stock Exchange where American depositary shares were listed. These transactions were treated as a reorganisation of an existing entity that has not changed the substance of the reporting entity. The consolidated financial statements of Coca-Cola HBC are presented using the values from the consolidated financial statements of Coca-Cola Hellenic Bottling Company S.A. On the date that Coca-Cola HBC became the new parent of the Group, 25 April 2013, the statutory amounts of share capital, share premium and treasury shares of the Company were recognised through an adjustment in the Statement of Changes in Equity. The resulting difference has been recognised as a component of equity under the heading Group reorganisation reserve. The shares of Coca-Cola HBC started trading in the premium segment of the London Stock Exchange (Ticker symbol: CCH), on the Athens Exchange (Ticker symbol: EEE) and regular way trading in Coca-Cola HBC ADS commenced on the New York Stock Exchange (Ticker symbol: CCH) on 29 April On 24 July 2014 the Group proceeded to the delisting of its American Depository Receipts from the New York Stock Exchange and terminated its reporting obligations under the US Securities Exchange Act of The deregistration of Coca-Cola HBC shares under the US Securities Exchange Act of 1934 and the termination of its reporting obligations became effective on 3 November These consolidated financial statements were approved for issue by the Board of Directors on 16 March 2016 and are expected to be verified at the Annual General Meeting to be held on 21 June Basis of preparation The consolidated financial statements included in this document are prepared in accordance with International Financial Reporting Standards ( IFRS ) as issued by the International Accounting Standards Board ( IASB ). The consolidated financial statements are prepared on a going concern basis under the historical cost convention, as modified by the revaluation of available-for-sale financial assets and derivative financial instruments and the financial statements of certain subsidiaries operating in a hyperinflationary economy which are restated and expressed in terms of the measuring unit currency at the balance sheet date and translated to Euro at the exchange rate of the balance sheet date. Basis of consolidation Subsidiary undertakings are those companies over which the Group, directly or indirectly, has control. The Group controls an entity when the Group is exposed to, or has rights to, variable returns from its involvement with the entity and has the ability to affect those returns through power over the entity. Subsidiary undertakings are consolidated from the date on which effective control is transferred to the Group and cease to be consolidated from the date on which effective control is transferred out of the Group. The acquisition method of accounting is used to account for business combinations. The consideration transferred is the fair value of any asset transferred, shares issued and liabilities assumed. The consideration transferred includes the fair value of any asset or liability resulting from a contingent consideration arrangement. Identifiable assets acquired and liabilities and contingent liabilities assumed are measured initially at their fair values at the acquisition date. The excess of the consideration transferred and the fair value of non-controlling interest over the net assets acquired and liabilities assumed is recorded as goodwill. All acquisition-related costs are expensed as incurred. For each business combination, the Group elects whether it measures the non-controlling interest in the acquiree either at fair value or at the proportionate share of the acquiree s identifiable net assets. Transactions with non-controlling interests that do not result in loss of control are accounted for as equity transactions that is, as transactions with the owners in their capacity as owners. The difference between fair value of any consideration paid and the relevant share acquired of the carrying value of net assets of the subsidiary is recorded in equity. Inter-company transactions and balances between Group companies are eliminated. The subsidiaries accounting policies are consistent with policies adopted by the Group. When the Group ceases to have control, any retained interest in the entity is remeasured to its fair value at the date when such control is lost, with the change in carrying amount recognised in profit or loss. The fair value is the initial carrying amount for the purposes of subsequently accounting for the retained interest as an associate, joint venture or financial asset. In addition, any amounts previously recognised in other comprehensive income in respect of that entity are accounted for as if the Group had directly disposed of the related assets or liabilities. This may mean that amounts previously recognised in other comprehensive income are reclassified to profit or loss. 112
115 Strategic Report Corporate Governance Financial Statements Supplementary Info & Swiss Statutory Reporting Critical accounting judgements and estimates In conformity with IFRS, the preparation of the consolidated financial statements for Coca-Cola HBC requires management to make estimates and assumptions that affect the reported amounts of assets, liabilities, revenues and expenses, and the disclosure of contingent assets and liabilities in the consolidated financial statements and accompanying notes. Although these estimates are based on management s knowledge of current events and actions that may be undertaken in the future, actual results may ultimately differ from estimates. Income taxes The Group is subject to income taxes in numerous jurisdictions. There are many transactions and calculations for which the ultimate tax determination cannot be assessed with certainty in the ordinary course of business. The Group recognises a provision for potential cases that might arise in the foreseeable future based on assessment of the probabilities as to whether additional taxes will be due. Where the final tax outcome on these matters is different from the amounts that were initially recorded, such differences will impact the income tax provision in the period in which such determination is made. The Group anticipates that were the final tax outcome, on the judgement areas, to differ from management s estimates by up to 10%, the Group s consolidated tax expense would increase (or decrease) by approximately 5.5m. Impairment of goodwill and indefinite lived intangible assets Determining whether goodwill or indefinite-lived intangible assets are impaired requires an estimation of the value-in-use of the cash-generating units to which they have been allocated in order to determine the recoverable amount of the cash-generating units. The value in use calculation requires the Group to estimate the future cash flows expected to arise from the cash-generating unit and a suitable discount rate in order to calculate present value. These assumptions and a discussion on how they are established are described in Note 4. Employee benefits defined benefit pension plans The Group provides defined benefit pension plans as an employee benefit in certain territories. Determining the value of these plans requires several actuarial assumptions and estimates about discount rates, future salary increases and future pension increases. Due to the long-term nature of these plans, such estimates are subject to significant uncertainty. Details of assumptions used, including a sensitivity analysis, are given in Note 16. Joint arrangements The Group participates in several joint arrangements. Judgement is required in order to determine their classification as a joint venture where the Group has rights to the net assets of the arrangement, or a joint operation where the Group has rights to the assets and obligations for the liabilities of the arrangement. In making this judgement, consideration is given to the legal form of the arrangement, and the contractual terms and conditions, as well as other facts and circumstances (including the economic rationale of the arrangement and the impact of the legal framework). The Group s joint arrangements are further discussed in Note 6. Revenue recognition Revenues are recognised when all of the following conditions are met: when the amount of revenue can be reliably measured; when it is probable that future economic benefits will flow to the Group; and when the significant risks and rewards of ownership of the products have passed to the buyer, usually on delivery of the goods. Revenue is measured at the fair value of the consideration received or receivable and is stated net of sales discounts, value-added taxes and sales taxes as applicable, listing fees and marketing and promotional incentives provided to customers. Listing fees are incentives provided to customers for carrying the Company s products in their stores. Listing fees that are subject to contractbased term arrangements are capitalised and amortised over the term of the contract as a reduction to revenue. All other listing fees as well as marketing and promotional incentives are a reduction of revenue as incurred. The amount of listing fees capitalised at 31 December 2015 was 10.6m (31 December 2014: 13.2m). Of this balance, 9.2m (31 December 2014: 10.1m) was classified as current prepayments and the remainder as non-current prepayments. Listing fees recognised as a reduction to revenue for the year ended 31 December 2015 amounted to 516.8m (year ended 31 December 2014: 486.2m). Marketing and promotional incentives provided to customers during the year ended 31 December 2015 amounted to 174.9m (year ended 31 December 2014: 218.0m). Coca-Cola HBC receives contributions from The Coca-Cola Company in order to promote sales of their brands. Contributions for price support, marketing and promotional campaigns in respect of specific customers are recognised as an offset to promotional incentives provided to those customers to which the contributions contractually relate. These contributions are accrued and matched to the expenditure to which they relate. In the year ended 31 December 2015, such contributions totalled 46.2m (year ended 31 December 2014: 44.1m). Earnings per share Basic earnings per share is calculated by dividing the net profit attributable to the owners of the parent by the weighted average number of ordinary shares outstanding during the year. The weighted average number of ordinary shares outstanding during the year is the number of ordinary shares outstanding at the beginning of the year, adjusted by the number of ordinary shares bought back or issued during the year multiplied by a time-weighting factor. Diluted earnings per share incorporates stock options for which the average share price for the year is in excess of the exercise price of the stock option and there is a dilutive effect. Intangible assets Intangible assets consist mainly of goodwill, trademarks, franchise agreements and water rights. Goodwill is the excess of the consideration transferred over the fair value of the share of net assets acquired. Goodwill and other indefinite-lived intangible assets are not amortised but rather tested for impairment annually and whenever there is an indication of impairment. Goodwill and other indefinite-lived intangible assets are carried at cost less accumulated impairment losses. 113
116 Notes to the Consolidated Financial Statements continued 1. Basis of preparation and accounting policies continued For the purpose of impairment testing, goodwill is allocated to each of the Group s cash-generating units expected to benefit from the business combination in which the goodwill arose. Other indefinite-lived intangible assets are also allocated to the Group s cash-generating units expected to benefit from those intangibles. The cash-generating units to which goodwill and other indefinite-lived intangible assets have been allocated are tested for impairment annually, or more frequently when there is an indication that the unit may be impaired. If the recoverable amount (i.e. the higher of the value in use and fair value less costs to sell) of the cash-generating unit is less than the carrying amount of the unit, the impairment loss is allocated first to reduce the carrying amount of any goodwill allocated to the unit and then pro-rata to the other assets of the unit on the basis of the carrying amount of each asset in the unit. Impairment losses recognised against goodwill are not reversed in subsequent periods. Intangible assets with finite lives consist mainly of trademarks and water rights and are amortised over their useful economic lives. The useful life of trademarks is determined after considering potential limitations that could impact the life of the trademark, such as technological and market limitations and the intent of management. The majority of the Group s trademarks have been assigned an indefinite useful life as they have an established sales history in the applicable region, it is the intention of the Group to receive a benefit from them indefinitely and there is no indication that this will not be the case. The useful life of franchise agreements is usually based on the term of the respective franchise agreements. The Coca-Cola Company does not grant perpetual franchise rights outside the United States. However, the Group believes its franchise agreements, consistent with past experience, will continue to be renewed at each expiration date and have therefore been assigned indefinite useful lives. The useful lives, both finite and indefinite, assigned to intangible assets are evaluated on an annual basis. Goodwill and fair value adjustments arising on the acquisition of subsidiaries are treated as the assets and liabilities of those subsidiaries. These balances are denominated in the functional currency of the subsidiary and are translated to Euro on a basis consistent with the other assets and liabilities of the subsidiary. Property, plant and equipment All property, plant and equipment is initially recorded at cost and subsequently measured at cost less accumulated depreciation and impairment losses. Subsequent expenditure is added to the carrying value of the asset when it is probable that future economic benefits, in excess of the original assessed standard of performance of the existing asset, will flow to the operation. All other subsequent expenditure is expensed in the period in which it is incurred. Assets under construction are recorded as part of property, plant and equipment and depreciation on these assets commences when the assets are available for use. Depreciation is calculated on a straight-line basis to allocate the depreciable amount over the estimated useful life of the assets as follows: Freehold buildings Leasehold buildings and improvements Production equipment Vehicles Computer hardware and software Marketing equipment Fixtures and fittings Returnable containers 40 years Over the lease term, up to 40 years 4 to 20 years 5 to 8 years 3 to 10 years 3 to 10 years 8 years 3 to 12 years Freehold land is not depreciated as it is considered to have an indefinite life. Deposits received for returnable containers by customers are accounted for as deposit liabilities. Residual values and useful lives of assets are reviewed and adjusted if appropriate at each balance sheet date. Impairment of non-financial assets Goodwill and other indefinite-lived assets are not amortised but rather tested for impairment annually and whenever there is an indication of impairment. Property, plant and equipment and other non-financial assets that are subject to amortisation are reviewed for impairment whenever events or changes in circumstances indicate that the carrying amount may not be recoverable. An impairment loss is recognised for the amount by which the carrying amount of the asset exceeds its recoverable amount, which is the higher of the asset s fair value less cost to sell and its value-in-use. For the purposes of assessing impairment, assets are grouped at the lowest level of separately identifiable cash flows. Borrowing costs Borrowing costs directly attributable to the acquisition, construction or production of qualifying assets, which are assets that necessarily take a substantial period of time to be prepared for their intended use or sale, are added to the cost of those assets, until such time as the assets are substantially ready for their intended use or sale. Investment income earned on the temporary investment of specific borrowings pending their use for qualifying assets is deducted from the borrowing costs eligible for capitalisation. All other borrowing costs are expensed as part of finance costs in the period in which they are incurred. Investments in associates Investments in associated undertakings are accounted for by the equity method of accounting. Associated undertakings are all entities over which the Group has significant influence but not control, generally accompanying a shareholding of between 20% to 50% of the voting rights. The equity method of accounting involves recognising the Group s share of the associates post-acquisition profit or loss for the period in the income statement and its share of the post-acquisition movement in other comprehensive income is recognised in other 114
117 Strategic Report Corporate Governance Financial Statements Supplementary Info & Swiss Statutory Reporting comprehensive income. Unrealised gains and losses resulting from transactions between the Group and the associate are eliminated to the extent of the interest in the associate. The Group s interest in each associate is carried in the balance sheet at an amount that reflects its share of the net assets of the associate and includes goodwill on acquisition. When the Group s share of losses in an associate equals or exceeds its interest in the associate, the Group does not recognise further losses, unless the Group has incurred obligations or made payments on behalf of the associate. Investment in joint arrangements Joint arrangements are arrangements in which the Group has contractually agreed sharing of control, which exists only when decisions about the relevant activities require unanimous consent. Joint arrangements are classified as joint operations or joint ventures depending upon the rights and obligations arising from the joint arrangement and are accounted for as follows: The Group classifies a joint arrangement as a joint operation when the Group has the rights to the assets, and obligations for the liabilities, of the arrangement and accounts for each of its assets, liabilities, revenues and expenses, including its share of those held or incurred jointly, in relation to the joint operation. The Group classifies a joint arrangement as a joint venture when the Group has rights to the net assets of the arrangement. The Group accounts for its interests in joint ventures using the equity method of accounting as described in Investments in associates above. If facts and circumstances change, the Group reassesses whether it still has joint control and whether the type of joint arrangement in which it is involved has changed. Financial assets The Group classifies its investments in debt and equity securities into the following categories: financial assets at fair value through profit or loss ( FVTPL ), held-to-maturity and available-for-sale. The classification depends on the purpose for which the investment was acquired. FVTPL and available-for-sale financial assets are carried at fair value. Investments that are acquired principally for the purpose of generating a profit from short-term fluctuations in price are classified as FVTPL investments and included in current assets. Investments with a fixed maturity that management has the intent and ability to hold to maturity are classified as held-to-maturity and are included in non-current assets, except for those with maturities within twelve months from the balance sheet date, which are classified as current assets. Investments intended to be held for an indefinite period of time, which may be sold in response to needs for liquidity or changes in interest rates, are classified as available-for-sale and are classified as non-current assets, unless they are expected to be realised within twelve months of the balance sheet date. Regular purchases and sales of investments are recognised on the trade date, which is the day the Group commits to purchase or sell. The investments are recognised initially at fair value plus transaction costs, except in the case of FVTPL. For investments traded in active markets, fair value is determined by reference to stock exchange quoted bid prices. For other investments, fair value is estimated by reference to the current market value of similar instruments or by reference to the discounted cash flows of the underlying net assets. The Group derecognises a financial asset when the contractual rights to the cash flows from the asset expire, or it transfers the rights to receive the contractual cash flows in a transaction in which substantially all of the risks and rewards of ownership of the financial asset are transferred, or it neither transfers nor retains substantially all of the risks and rewards of ownership and does not retain control over the transferred asset. When the Group has neither transferred nor retained substantially all the risks and rewards of the asset, nor transferred control of the asset, the Group continues to recognise the transferred asset to the extent of the Group s continuing involvement. In that case, the Group also recognises an associated liability. The transferred asset and the associated liability are measured on a basis that reflects the rights and obligations that the Group has retained. Gains and losses on investments classified as FVTPL are recognised in the income statement in the period in which they arise. Unrealised gains and losses on available-for-sale financial assets are recognised in other comprehensive income, except for impairment losses and foreign exchange gains and losses on monetary financial assets that are recognised in the income statement, until the financial assets are derecognised, at which time the cumulative gains or losses previously recognised in equity are reclassified to the income statement. Held-to-maturity investments are carried at amortised cost using the effective interest rate method. Gains and losses on held-tomaturity investments are recognised in the income statement, when the investments are derecognised or impaired. Non-current assets held for sale Non-current assets and disposal groups are classified as held for sale if it is considered highly probable that their carrying amount will be principally recovered through a sale transaction rather than through continuing use. This condition is regarded as met only when the sale is highly probable and the asset (or disposal group) is available for immediate sale in its present condition. In order for a sale to be considered highly probable, management must be committed to the sale, an active programme to locate a buyer and complete the plan has been initiated, and the sale is expected to be completed within one year from the date of classification. Non-current assets and disposal groups classified as held for sale are measured at the lower of the individual assets previous carrying amount and their fair value less costs to sell. Inventories Inventories are stated at the lower of cost and net realisable value. Cost for raw materials and consumables is determined on a weighted average basis. Cost for work in progress and finished goods is comprised of the cost of direct materials and labour plus attributable overhead costs. Cost includes all costs incurred to bring the product to its present location and condition. Net realisable value is the estimated selling price in the ordinary course of business, less the estimated costs necessary to complete and sell the inventory. 115
118 Notes to the Consolidated Financial Statements continued 1. Basis of preparation and accounting policies continued Trade receivables Trade receivables are initially recognised at fair value and subsequently measured at amortised cost. A provision for doubtful debts is established when there is objective evidence that the Group will not be able to collect all amounts due, according to the original terms of the trade receivable. Significant financial difficulties of the debtor, probability that the debtor will enter into bankruptcy or financial reorganisation and default or delinquency in payments are considered indicators that the trade receivable could be uncollectible. The amount of the provision is the difference between the receivable s carrying amount and the present value of its estimated future cash flows, discounted at the original effective interest rate. The carrying amount of the receivable is reduced by the amount of the provision, which is recognised as part of operating expenses. If a trade receivable ultimately becomes uncollectible, it is written off initially against any provision made in respect of that receivable with any excess recognised as part of operating expenses. Subsequent recoveries of amounts previously written off or provisions no longer required are credited against operating expenses. Trade payables Trade payables are recognised initially at fair value and subsequently measured at amortised cost using the effective interest rate method. Foreign currency and translation The individual financial statements of each Group entity are presented in the currency of the primary economic environment in which the entity operates (its functional currency). For the purpose of the consolidated financial statements, the results and financial position of each entity are expressed in Euro, which is the presentation currency for the consolidated financial statements. The assets and liabilities of foreign subsidiaries are translated into Euro at the exchange rate ruling at the balance sheet date. The results of foreign subsidiaries are translated into Euro using the average monthly exchange rate (being a reasonable approximation of the rates prevailing on the transaction dates), except for foreign subsidiaries operating in a hyperinflationary environment, whose results are translated at the closing rate. The exchange differences arising on translation are recognised in other comprehensive income. On disposal of a foreign entity, accumulated exchange differences are recognised as a component of the gain or loss on disposal. Transactions in foreign currencies are recorded at the rate ruling at the date of transaction. Monetary assets and liabilities denominated in foreign currencies are remeasured at the rate of exchange ruling at the balance sheet date. All gains and losses arising on remeasurement are included in the income statement, except for exchange differences arising on assets and liabilities classified as cash flow hedges, which are deferred in equity until the occurrence of the hedged transaction, at which time they are recognised in the income statement. Share capital denominated in a currency other than the functional currency is initially stated at spot rate of the date of issue but is not retranslated. Entities operating in hyperinflationary economies prepare financial statements that are recorded in accordance with IAS 29 Financial Reporting in Hyperinflationary Economies. The gain or loss on net monetary position is recorded in finance costs. The application of hyperinflation accounting includes: adjustment of the historical cost of non-monetary assets and liabilities and the various items of equity from their date of acquisition or inclusion in the balance sheet to the end of the year for the changes in purchasing power of the currency caused by inflation; the various components in the income statement and statement of cash flows have been adjusted for the inflation index since their generation; the subsidiary s financial statements are translated at the closing exchange rate. Since 1 January 2015 hyperinflation accounting in Belarus was discontinued as it no longer met the criteria of a hyperinflationary economy. No other subsidiary of the Group is operating in a hyperinflationary economy. Cash and cash equivalents Cash and cash equivalents comprise cash balances and highly liquid investments with an original maturity of three months or less. Bank overdrafts are classified as short-term borrowings in the balance sheet and for the purpose of the cash flow statement. Borrowings All loans and borrowings are initially recognised at the fair value net of transaction costs incurred. After initial recognition, all interest-bearing loans and borrowings are subsequently measured at amortised cost. Amortised cost is calculated using the effective interest rate method whereby any discount, premium or transaction costs associated with a loan or borrowing is amortised to the income statement over the borrowing period. Derivative financial instruments The Group uses derivative financial instruments, including interest rate, currency and commodity derivatives, to manage interest, currency and commodity price risk associated with the Group s underlying business activities. The Group does not enter into derivative financial instruments for trading activity purposes. All derivative financial instruments are initially recognised on the balance sheet at fair value and are subsequently remeasured at their fair value. Changes in the fair value of derivative financial instruments are recognised at each reporting date either in the income statement or in equity, depending on whether the derivative financial instrument qualifies for hedge accounting, and if so, whether it qualifies as a fair value hedge or a cash flow hedge. Derivatives embedded in host contracts are accounted for as separate derivatives and recorded at fair value if a) their economic characteristics and risks are not closely related to those of the host contracts; b) the host contracts are not designated as at fair value through profit or loss and c) a separate instrument with the same terms as the embedded derivative meets the definition of a derivative. These embedded derivatives are measured at fair value with changes in fair value recognised in profit or loss. Reassessment only occurs if there is either a change in the terms of the contract that significantly modifies the cash flows that would otherwise be required or a reclassification of a financial asset out of the fair value through profit or loss. 116
119 Strategic Report Corporate Governance Financial Statements Supplementary Info & Swiss Statutory Reporting All derivative financial instruments that are not part of an effective hedging relationship (undesignated hedges) are classified as assets or liabilities at FVTPL. At the inception of a hedge transaction the Group documents the relationship between the hedging instrument and the hedged item, as well as its risk management objective and strategy for undertaking the hedge transaction. This process includes linking the derivative financial instrument designated as a hedging instrument to the specific asset, liability, firm commitment or forecast transaction. Both at the hedge inception and on an ongoing basis, the Group assesses and documents whether the derivative financial instrument used in the hedging transaction is highly effective in offsetting changes in fair value or cash flow of the hedged item. Changes in the fair values of derivative financial instruments that are designated and qualify as fair value hedges and are effective, are recorded in the income statement, together with the changes in the fair values of the hedged items that relate to the hedged risks. Changes in the fair value of derivative financial instruments that are designated and effective as hedges of future cash flows are recognised directly in other comprehensive income and the ineffective portion is recognised immediately in the income statement. Amounts accumulated in equity are recycled to the income statement as the related asset acquired or liability assumed affects the income statement. Changes in the fair values of derivative financial instruments that do not qualify for hedge accounting are recognised in the income statement as they arise. Hedge accounting is discontinued when the hedging instrument expires or is sold, terminated, or exercised, or no longer qualifies for hedge accounting. At that time, any cumulative gain or loss on the hedging instrument recognised in equity is retained in equity until the forecast transaction occurs. If a hedged transaction is no longer expected to occur, the net cumulative gain or loss recognised in equity is transferred to the income statement. Leases Leases of property, plant and equipment, where the Group has substantially all the risks and rewards of ownership, are classified as finance leases. Other leases are classified as operating leases. Rentals paid under operating leases are charged to the income statement on a straight-line basis over the lease term. Finance leases are capitalised at the inception of the lease at the lower of the fair value of the leased assets and the present value of the minimum lease payments. Each lease payment is allocated between liability and finance charges to achieve a constant rate on the finance balance outstanding. The corresponding lease obligations, net of finance charges, are included in long-term borrowings. The interest element of the finance cost is charged to the income statement over the lease period, so as to produce a constant periodic rate of interest on the remaining balance of the liability for each period. Property, plant and equipment acquired under finance lease is depreciated over the shorter of the useful life of the asset and the lease term. The useful life for leased assets corresponds with the Group policy for the depreciable life of property, plant and equipment. Provisions Provisions are recognised: when the Group has a present obligation (legal or constructive) as a result of a past event; when it is probable that an outflow of resources embodying economic benefits will be required to settle the obligation; and when a reliable estimate can be made of the amount of the obligation. Where the Group expects a provision to be reimbursed, for example under an insurance contract, the reimbursement is recognised as a separate asset only when such reimbursement is virtually certain. If the effect of the time value of money is material, provisions are determined by discounting the expected future cash flows at a pre-tax rate that reflects current market assessments of the time value of money and the risks specific to the liability. Where discounting is used, the increase in the provision due to the passage of time is recognised as an interest expense. Offsetting financial instruments The Group offsets financial assets and financial liabilities to the net amount reported in the balance sheet when it currently has a legally enforceable right to offset the recognised amounts and it intends to settle on a net basis or to realise the asset and settle the liability simultaneously. The legally enforceable right must not be contingent on future events and must be enforceable in the normal course of business and in the event of default, insolvency or bankruptcy of the company or the counterparty. Employee benefits The Group operates a number of defined benefit and defined contribution pension plans in its territories. The defined benefit plans are made up of both funded and unfunded pension plans and employee leaving indemnities. The assets of funded plans are generally held in separate trustee-administered funds and are financed by payments from employees and/or the relevant Group companies. The liability recognised in the balance sheet in respect of defined benefit plans is the present value of the defined benefit obligation at the balance sheet date less the fair value of the plan assets. For defined benefit pension plans, pension costs are assessed using the projected unit credit method. Actuarial gains and losses arising from experience adjustments and changes in actuarial assumptions are charged or credited to equity in other comprehensive income in the period in which they arise. Such actuarial gains and losses are not reclassified to the income statement in subsequent periods. The defined benefit obligations are measured at the present value of the estimated future cash outflows using interest rates of corporate or government bonds, depending on whether or not there is a deep market for corporate bonds in the relevant country, which have terms to maturity approximating the terms of the related liability. Past service cost is recognised immediately in the income statement. A number of the Group s operations have other long-service benefits in the form of jubilee plans. These plans are measured at the present value of the estimated future cash outflows with immediate recognition of actuarial gains and losses. The Group s contributions to the defined contribution pension plans are charged to the income statement in the period to which the contributions relate. 117
120 Notes to the Consolidated Financial Statements continued 1. Basis of preparation and accounting policies continued Share-based payments Coca-Cola HBC issues equity-settled share-based payments to its senior managers in the form of an employee stock option plan and a performance share plan. The employee stock option plan is measured at fair value at the date of grant. Fair value reflects the parameters of the compensation plan, the risk-free interest rate, the expected volatility, the dividend yield and the early exercise experience of the Group s plans. Expected volatility is determined by calculating the historical volatility of Coca-Cola HBC s share price over previous years. The fair value determined at the grant date is expensed on a straight-line basis over the vesting period. The performance share plan offers a specified number of performance share awards that vest three years after the grant. The fair value is determined at the grant date and reflects the parameters of the compensation plan, the dividend yield and the weighted average share price. The fair value determined at the grant date is expensed on a straight-line basis over the vesting period. At the end of each reporting period the Group revises its estimates of the number of shares that are expected to vest based on non-market conditions, and recognises the impact of the revision to original estimates, if any, in the income statement with a corresponding adjustment to equity. In addition, the Group operates an employee stock purchase plan, an equity compensation plan in which eligible employees can participate. The Group makes contributions to the plan for participating employees and recognises expenses over the vesting period of the contributed shares. Any unvested contributions to the plan are recorded on the balance sheet as prepayments. Termination benefits Termination benefits are payable whenever an employee s employment is terminated before the normal retirement date or whenever an employee accepts voluntary redundancy in exchange for these benefits. The Group recognises termination benefits at the earlier of the following dates: a) when the Group can no longer withdraw the offer of those benefits and b) when the Group recognises costs for a restructuring that is within the scope of IAS 37 Provisions, Contingent Liabilities and Contingent Assets and involves the payment of termination benefits. In the case of an offer made to encourage voluntary redundancy, the termination benefits are measured based on the number of employees expected to accept the offer. Taxes The current income tax charge is calculated on the basis of the tax laws enacted or substantively enacted at the balance sheet date in the countries where the Group operates and generates taxable income. Management periodically evaluates positions taken in tax returns with respect to situations in which applicable tax regulations are subject to interpretation and establishes provisions, where appropriate, on the basis of amounts expected to be paid to the tax authorities. Deferred tax is provided using the liability method for all temporary differences arising between the tax bases of assets and liabilities and their carrying values for financial reporting purposes. However, the deferred tax liabilities are not recognised if they arise from the initial recognition of goodwill; deferred tax is not accounted for if it arises from initial recognition of an asset or liability in a transaction other than a business combination that at the time of the transaction affects neither accounting nor taxable profit or loss. Tax rates enacted or substantively enacted at the balance sheet date are those that are expected to apply when the deferred tax asset is realised or deferred tax liability is settled. Deferred tax assets are recognised to the extent that it is probable that future taxable profit will be available against which the temporary differences can be utilised. Deferred tax is provided on temporary differences arising on investments in subsidiaries, associates and joint ventures, except where the timing of the reversal of the temporary difference can be controlled by the Group, and it is probable that the temporary difference will not reverse in the foreseeable future. Tax is recognised in the income statement, except to the extent that it relates to items recognised in other comprehensive income or in equity. In this case, the tax is recognised in other comprehensive income or directly in equity. Deferred tax assets and deferred tax liabilities are offset if a legally enforceable right exists to set off current tax assets against current income tax liabilities and the deferred taxes relate to the same taxation authority on either the same taxable entity or different taxable entities where there is an intention to settle the balances on a net basis. Franchise incentive arrangements The Coca-Cola Company, at its sole discretion, provides the Group with various incentives, including contributions towards the purchase of cold drink equipment. Payments are made on placement of coolers and are based on franchise incentive arrangements. The terms and conditions of these arrangements require reimbursement if certain conditions stipulated in the agreements are not met, including minimum volume through-put requirements. Support payments received from The Coca-Cola Company for the placement of cold drink equipment are deducted from the cost of the related asset. Share capital Coca-Cola HBC has only one class of shares, ordinary shares. When new shares are issued, they are recorded in share capital at their par value. The excess of the issue price over the par value is recorded to the share premium reserve. Incremental external costs directly attributable to the issue of new shares or to the process of returning capital to shareholders are recorded in equity as a deduction, net of tax, in the share premium reserve. Dividends Dividends are recorded in the Group s consolidated financial statements in the period in which they are approved by the Group s shareholders. Comparative figures Comparative figures have been reclassified on the balance sheet where necessary to conform with changes in presentation in the current year. More specifically, an amount of 1.0m referring to assets held for sale, was reclassified from Trade, other receivables and assets to Assets classified as held for sale. Further, an amount of 62.9m was reclassified from Other payables to Provisions and employee benefits. 118
121 Strategic Report Corporate Governance Financial Statements Supplementary Info & Swiss Statutory Reporting Accounting pronouncements adopted in 2015 In the current period, the Group has adopted the following standards and amendments which were issued by the IASB, that are relevant to its operations and effective for accounting periods beginning on 1 January 2015: Annual Improvements to IFRSs: Cycle; Defined Benefit Plans: Employee Contributions: Amendments to IAS 19. The adoption of the improvements made in the Cycle has required additional disclosures in the Group s segment note. Other than that, the adoption of these amendments did not have any impact on the current period or any prior period and is not likely to affect future periods. Accounting pronouncements not yet adopted At the date of approval of these consolidated financial statements, the following standards and interpretations relevant to the Company s operations were issued but not yet effective and not early adopted. The Group is currently evaluating the impact the amendments or standards will have on its consolidated financial statements. In May 2014, the IASB issued IFRS 15 Revenue from Contracts with Customers. The objective of the standard is to provide a single, comprehensive revenue recognition model for all contracts with customers to improve comparability within industries, across industries, and across capital markets. It contains principles that an entity will apply to determine the measurement of revenue and the timing of when it is recognised. The underlying principle is that an entity will recognise revenue to depict the transfer of goods or services to customers at an amount that the entity expects to 2. Exchange rates be entitled to in exchange for those goods or services. IFRS 15 is effective for annual periods beginning on or after 1 January 2018, with early adoption permitted. In July 2014, the IASB issued IFRS 9 Financial Instruments which reflects all phases of the financial instruments project and replaces IAS 39 Financial Instruments: Recognition and Measurement. The standard introduces new requirements for classification and measurement, impairment, and hedge accounting. IFRS 9 is effective for annual periods beginning on or after 1 January 2018, with early adoption permitted. In January 2016, the IASB issued IFRS 16 Leases. The new standard supersedes IAS 17 and its objective is to ensure that lessees and lessors provide relevant information in a manner that faithfully represents those transactions. IFRS 16 introduces a single lessee accounting model and requires a lessee to recognise assets and liabilities for all leases with a term of more than 12 months, unless the underlying asset is of low value. IFRS 16 substantially carries forward the lessor accounting requirements in IAS 17. Accordingly, a lessor continues to classify its leases as operating leases or finance leases, and to account for those two types of leases differently. IFRS 16 is effective for annual periods beginning on or after 1 January 2019, with early adoption permitted. In addition the below amendments have been issued by the IASB and are not yet effective: Annual Improvements to IFRSs: Cycle Amendments to IFRS 10 and IAS 28: Sale or contribution of assets between an investor and its associate or joint venture Amendments to IAS 1: Disclosure initiatives Amendments to IFRS 11: Accounting for acquisitions of interests in joint operations. The Group s reporting currency is the Euro ( ). Coca-Cola HBC translates the income statements of subsidiary operations to the Euro at average exchange rates and the balance sheets at the closing exchange rates at 31 December. The principal exchange rates used for transaction and translation purposes in respect of one Euro are: Average 2015 Average 2014 Closing 2015 US dollar UK sterling Polish zloty Nigerian naira Hungarian forint Swiss franc Russian rouble Romanian leu Ukrainian hryvnia Czech koruna Serbian dinar Closing
122 Notes to the Consolidated Financial Statements continued 3. Segmental analysis The Group has one business, being the production, sale and distribution of ready-to-drink, primarily non-alcoholic, beverages. The Group operates in 28 countries and its financial results are reported in the following three reportable segments: Established markets: Developing markets: Emerging markets: Austria, Cyprus, Greece, Italy, Northern Ireland, the Republic of Ireland and Switzerland. Croatia, Czech Republic, Estonia, Hungary, Latvia, Lithuania, Poland, Slovakia and Slovenia. Armenia, Belarus, Bosnia and Herzegovina, Bulgaria, FYROM, Moldova, Montenegro, Nigeria, Romania, the Russian Federation, Serbia (including the Republic of Kosovo) and Ukraine. The Group s operations in each of the three reportable segments have been aggregated on the basis of their similar economic characteristics, assessed by reference to their net sales revenue per unit case as well as disposable income per capita, exposure to political and economic volatility, regulatory environments, customers and distribution infrastructures. The accounting policies of the Group s reportable segments are the same as those described in Note 1. The Group s chief operating decision maker is its Operating Committee, which evaluates performance and allocates resources based on volume, net sales revenue and operating profit. There are no material amounts of sales or transfers between the Group s segments. In addition there are no customers who represent more than 5% of the total balance of trade receivables for the Group or more than 10% of net sales revenue for the Group. Year ended 31 December Note Volume in unit cases 2 Established Developing Emerging 1, ,029.4 Total volume in unit cases 2, ,002.9 Net sales revenue Established 2, ,448.9 Developing 1, ,054.1 Emerging 2, ,007.2 Total net sales revenue 6, ,510.2 Operating profit Established Developing Emerging Total operating profit Interest expense and finance charges Established (30.5) (60.9) Developing (2.0) (1.3) Emerging (16.0) (33.9) Corporate 3 (131.8) (137.7) Inter segment interest expense Total interest expense and finance charges 20 (70.2) (72.0) Finance income Established (0.1) 15.8 Developing Emerging Corporate Inter segment finance income (110.1) (161.8) Total finance income Income tax expense Established (25.3) (15.3) Developing (19.3) (13.0) Emerging (24.8) (18.6) Corporate 3 (7.0) (10.9) Total income tax expense 21 (76.4) (57.8) 1. Excluding volume which is reported in unit cases. 2. One unit case corresponds to approximately litres or 24 servings, being a typically used measure of volume. Volume data is derived from unaudited operational data. 3. Corporate refers to holding, finance and other non-operating subsidiaries of the Group. 120
123 Strategic Report Corporate Governance Financial Statements Supplementary Info & Swiss Statutory Reporting Year ended 31 December Note Reconciling items Net foreign exchange translation losses 20 (7.5) (10.9) Share of results of equity method investments Profit after tax Expenditure on non-current assets 4 Established Developing Emerging Total expenditure on non-current assets Total additions of property, plant and equipment for the year ended 31 December 2015 were 367.4m (2014: 366.7m). Total additions of intangible assets for the year ended 31 December 2015 were nil (2014: 14.1m). Depreciation and impairment of property, plant and equipment and amortisation of intangible assets included in the measure of operating profit, is as follows: Note Depreciation and impairment of property, plant and equipment Established (106.2) (107.7) Developing (57.9) (64.8) Emerging (176.1) (196.3) Total depreciation and impairment of property, plant and equipment 5 (340.2) (368.8) Amortisation of intangible assets Emerging (0.4) (0.4) Total amortisation of intangible assets 4 (0.4) (0.4) Net sales revenue from external customers and the balance of non-current assets attributed to Switzerland (the Group s country of domicile), Russia, Italy and Nigeria were as follows for the years ended 31 December: Year ended 31 December Net sales revenue from external customers Switzerland Russia 1, ,335.6 Italy Nigeria All countries other than Switzerland, Russia, Italy and Nigeria 3, ,275.8 Total net sales revenue from external customers 6, , Non-current assets 5 Switzerland Russia Italy 1, ,028.1 Nigeria All countries other than Switzerland, Russia, Italy and Nigeria 1, ,912.6 Total non-current assets 4, , Excluding derivative financial instruments, held-to-maturity and available-for-sale investments, equity method investments and deferred tax assets. 121
124 Notes to the Consolidated Financial Statements continued 3. Segmental analysis continued In addition to non-alcoholic beverages, the Group sells and distributes premium spirits. An analysis of volume and net sales revenue per product type is presented below: Year ended 31 December Volume in unit cases 2 NARTD* 2, ,000.3 Premium spirits Total volume in unit cases 2, ,002.9 Net sales revenue NARTD 6, ,311.3 Premium spirits Total net sales revenue 6, , Excluding volume, which is reported in unit cases. 2. One unit case corresponds to approximately litres or 24 servings, being a typically used measure of volume. Volume data is derived from unaudited operational data. For premium spirits volume, one unit case corresponds to litres. * NARTD: non-alcoholic, ready-to-drink beverages. 4. Intangible assets Goodwill Franchise agreements Trademarks Other intangible assets Total Cost As at 1 January , ,130.3 Additions Foreign currency translation (26.5) 0.9 (24.3) (0.3) (50.2) As at 31 December , ,094.2 Amortisation As at 1 January Charge for the year As at 31 December Net book value as at 1 January , ,921.3 Net book value as at 31 December , ,884.8 Cost As at 1 January , ,094.2 Foreign currency translation 34.8 (1.1) (6.4) (0.1) 27.2 As at 31 December , ,121.4 Amortisation As at 1 January Charge for the year As at 31 December Net book value as at 1 January , ,884.8 Net book value as at 31 December , ,911.6 Goodwill is allocated to each of the Group s cash-generating units expected to benefit from the business combination in which the goodwill arose. Other indefinite-lived intangible assets are also allocated to the Group s cash-generating units expected to benefit from those intangibles. 122
125 Strategic Report Corporate Governance Financial Statements Supplementary Info & Swiss Statutory Reporting The following table sets forth the carrying value of intangible assets subject to and not subject to amortisation: Intangible assets not subject to amortisation Goodwill 1, ,665.4 Franchise agreements Trademarks , ,876.5 Intangible assets subject to amortisation Trademarks Water rights Total intangible assets 1, ,884.8 The following table sets forth the carrying value of goodwill and other indefinite lived intangible assets for those cash-generating units that are considered significant in comparison with the Group s total carrying value of goodwill and other indefinite-lived intangible assets, as at 31 December Goodwill Franchise agreements Total Italy Switzerland The Republic of Ireland and Northern Ireland Total 1, ,465.8 The Group conducts a test for impairment of goodwill and indefinite-lived intangible assets in accordance with IAS 36 Impairment of Assets annually and whenever there is an indication of impairment. No impairment was indicated from the impairment tests of 2015 and The recoverable amount of each cash-generating unit was determined through a value-in-use calculation. That calculation uses cash flow projections based on financial budgets approved by the Board of Directors covering a one-year period and cash projections for four additional years. Cash flow projections for years two to five were projected by management based on operation and market specific high-level assumptions including growth rates, discount rates and forecasted selling prices and direct costs. Management determined gross margins based on past performance, expectations for the development of the market and expectations about raw material costs. The growth rates used in perpetuity reflect the forecasts in line with management beliefs. These forecasts exceeded, in some cases, those expected for the industry in general, due to the strength of our brand portfolio. Management estimates discount rates using rates that reflect current market assessments of the time value of money and risks specific to the countries of operation. For those cash-generating units that are considered significant in comparison with the Group s total carrying value of goodwill and other indefinite-lived intangible assets, as at 31 December 2015, cash flows beyond the five-year period (the period in perpetuity) have been extrapolated using the following estimated growth and discount rates: Growth rate in perpetuity (%) Discount rate (%) Italy Switzerland The Republic of Ireland and Northern Ireland Sensitivity analysis In the cash-generating units of the Multon ZAO group of companies and Nigeria, possible changes in certain key assumptions would remove the remaining headroom. In the joint operation of the Multon ZAO group of companies, which has 40.5m of goodwill, the recoverable amount calculated based on value in use exceeded carrying value by 184.6m. Any one of a reduction in the average gross profit margin of 3.9%, a fall in the revenue growth rate in perpetuity of 5.6%, or a rise in the weighted average discount rate of 3.8% would remove the remaining headroom. Further, in Nigeria which has 39.8m of goodwill and franchise agreements, the recoverable amount calculated based on value in use exceeded carrying value by 53.8m. Any one of a reduction in the average gross profit margin of 0.6%, a fall in the revenue growth rate in perpetuity of 0.3%, or a rise in the weighted average discount rate of 0.3% would remove the remaining headroom. 123
126 Notes to the Consolidated Financial Statements continued 5. Property, plant and equipment Land and buildings Plant and equipment Returnable containers Assets under construction Total Cost As at 1 January , , ,913.6 Additions Disposals (12.7) (164.6) (4.5) (181.8) Classified to assets held for sale (refer to Note 12) (0.1) (0.9) (1.0) Reclassifications (148.0) Foreign currency translation (130.8) (369.3) 9.0 (7.2) (498.3) Effect of hyperinflation As at 31 December , , ,603.3 Depreciation and impairment As at 1 January , ,011.7 Charge for the year Impairment Disposals (3.4) (159.5) (0.5) (163.4) Foreign currency translation (32.3) (212.5) 4.1 (240.7) Effect of hyperinflation As at 31 December , ,979.2 Net book value as at 1 January , , ,901.9 Net book value as at 31 December , , ,624.1 Cost As at 1 January , , ,603.3 Additions Disposals (5.7) (130.9) (28.1) (164.7) Reclassified from assets held for sale (refer to Note 12) Classified to assets held for sale (refer to Note 12) (11.2) (12.6) (23.8) Reclassifications (226.4) Foreign currency translation (28.3) (114.9) (6.5) (6.1) (155.8) As at 31 December , , ,627.3 Depreciation and impairment As at 1 January , ,979.2 Charge for the year Impairment Disposals (5.6) (128.3) (15.8) (149.7) Classified to assets held for sale (refer to Note 12) (6.6) (11.8) (18.4) Foreign currency translation (6.3) (61.6) (1.6) (69.5) As at 31 December , ,081.8 Net book value as at 1 January , , ,624.1 Net book value as at 31 December , , ,545.5 In 2014 the Group recorded an impairment loss of 10.0m, 6.9m and 18.5m and recorded reversals of impairment of 2.4m, 0.2m and 0.4m relating to property, plant and equipment in the established, developing and the emerging segments respectively. This resulted in a net impairment loss of 7.6m, 6.7m and 18.1m in the established, developing and emerging segments respectively. Impairment recorded mainly relates to restructuring initiatives; refer also to Note 19 (b). The impaired assets, being mainly production equipment, were written off based on value-in-use calculations; while assets with a recoverable amount of 2.7m were valued at fair value less cost to sell, which is considered a Level 3 measurement. In 2015 the Group recorded an impairment loss of 12.8m, 5.0m and 17.0m and recorded reversals of impairment of 1.0m, 0.5m and 1.2m relating to property, plant and equipment in the established, developing and emerging segments respectively. This resulted in a net impairment loss of 11.8m, 4.5m and 15.8m in the established, developing and emerging segments respectively. Impairment recorded mainly relates to restructuring initiatives; refer also to Note 19(b). The impaired assets, being mainly land and buildings and production equipment, were written off based on value-in-use calculations; while assets with a recoverable amount of 36.3m were valued at fair value less cost to sell, which is considered a Level 3 measurement. 124
127 Strategic Report Corporate Governance Financial Statements Supplementary Info & Swiss Statutory Reporting Assets under construction as at 31 December 2015 include advances for equipment purchases of 16.2m (2014: 19.6m). Depreciation charge for the year included in operating expenses amounted to 133.2m (2014: 155.6m). Depreciation charge for the year included in cost of goods sold amounted to 174.9m (2014: 180.8m). Assets held under finance leases have been pledged as security in relation to the liabilities under the finance leases. The net book value of land and buildings held under finance leases as at 31 December 2015 was 38.0m (2014: 40.2m). The net book value of plant and equipment held under finance leases as at 31 December 2015 was 78.6m (2014: 85.8m). Included in property, plant and equipment are assets held under finance leases, where the Group is the lessee, as follows: Leasehold equipment Cost Accumulated depreciation (85.6) (81.2) Net book amount Equity method investments and joint operations (a) Investments in associates Summarised financial information of our investments in associates is as follows: Share of profit Share of other comprehensive income (1.0) 0.8 Share of total comprehensive income Included in investment in associates is the Group s investment in Frigoglass Industries Limited and Frigoglass West Africa Ltd. Nigerian Bottling Company Ltd holds an interest in Frigoglass Industries Limited of 23.9% (2014: 23.9%). During 2015 Nigeria Bottling Company Ltd acquired an investment of 23.9% in Frigoglass West Africa Ltd for a consideration of 0.5m. The Group has a 100% (2014:100%) interest in Nigeria Bottling Company Ltd, therefore the Group has an effective interest of 23.9% in both Frigoglass Industries Limited and Frigoglass West Africa Ltd (2014: 23.9% in Frigoglass Industries Limited). There are restrictive controls in the movement of funds out of Nigeria. Changes in the carrying amounts of investments in associates are as follows: As at 1 January Acquisitions 0.5 Share of results of equity method investments Return of capital from associates (0.7) Dividends (1.5) (0.9) Foreign currency translation (1.0) 0.8 As at 31 December (b) Investments in joint ventures The Group has a material joint venture with Heineken that is conducted through a number of legal entities. The BrewTech B.V. group of companies is engaged in the bottling and distribution of soft drinks and beer in FYROM. BrewTech B.V. is incorporated in the Netherlands and the Group owns 50% of its share capital. In addition, the Group has another joint venture with Heineken that is conducted through a number of legal entities, being the Brewinvest S.A. group of companies. Brewinvest S.A., parent company of Brewinvest S.A. group of companies, is incorporated in Greece and the Group owns 50% (2014: 50%) of its share capital. The structure of both joint ventures provides the Group with rights to their net assets. On 27 October 2014, Brewmasters Holdings Ltd, subsidiary of Brewinvest S.A. group of companies, sold its participation in Zagorka A.D. to Heineken. Zagorka A.D. was engaged in the bottling and distribution of beer in Bulgaria. Following the sale of Zagorka A.D. the joint venture s operating activity is conducted via the BrewTech B.V. group. The Group s share of the consideration amounted to 76.5m. The transaction resulted in a gain for the Group of 59.9m, net of tax. The revenue and profit after tax of Zagorka A.D. up to the date of disposal amounted to 59.3m and 10.8m respectively. 125
128 Notes to the Consolidated Financial Statements continued 6. Equity method investments and joint operations continued Summarised financial information of the Group s material joint venture is as follows (the information below reflects the amount presented in the IFRS financial statements of the joint venture, and not the Group s share in those amounts): Summarised balance sheet: Cash and cash equivalents Other current assets Total current assets Short-term borrowings (0.3) Other current liabilities (including trade payables) (10.5) (28.4) Total current liabilities (10.8) (28.4) Non-current assets Non-current other liabilities (0.4) (0.6) Net assets Summarised statement of comprehensive income: Revenue Depreciation and amortisation (5.9) (7.0) Interest income Interest expense (0.2) Profit before tax from continuing operations Income tax expense (1.4) (1.8) Profit after tax from continuing operations Profit after tax from discontinued operations Other comprehensive income (0.1) Total comprehensive income Dividends received Reconciliation of net assets to carrying amount Closing net assets Interest in joint venture at 50% Goodwill Non-controlling interest (1.7) (1.7) Carrying value Summarised financial information of the Group s investment in other joint ventures is as follows: Carrying amount Share of loss (2.7) (10.1) Share of other comprehensive income 0.8 (0.8) Share of total comprehensive income (1.9) (10.9) The Group s share of loss in other joint ventures includes restructuring initiatives within the joint ventures of 1.2m (2014: 6.2m). Changes in the carrying amounts of investments in joint ventures are as follows: As at 1 January Share of results of equity method investments Return of capital from joint ventures (4.0) Dividends (119.6) (1.0) Share of other comprehensive income of equity method investments 0.1 (0.5) Foreign currency translation 0.7 (0.8) As at 31 December
129 Strategic Report Corporate Governance Financial Statements Supplementary Info & Swiss Statutory Reporting At 31 December 2015, the Group s share of its joint ventures capital commitments and long-term commitments to purchase raw materials and receive services amounted to 4.9m and nil respectively (2014: nil and 0.1m respectively). (c) Investments in joint operations The Group has a 50% interest in the Multon Z.A.O. group of companies ( Multon ). Multon is engaged in the production and distribution of juices in Russia and is classified as a joint operation as the arrangement gives the Group right to the assets and obligations for the liabilities relating to the joint arrangement. Other joint operations of the Group comprise mainly a 50% interest in each of several water businesses including Romerquelle, Fonti del Vulture, Dorna, Multivita, Valser and Vlasinka, which are engaged in the production and distribution of water in Austria, Italy, Romania, Poland, Switzerland and Serbia respectively. 7. Financial instruments Categories of financial instruments as at 31 December were as follows: 2015 Assets Loans and receivables Assets at FVTPL Derivatives designated as hedging instruments Held-tomaturity Availablefor-sale Total Investments Derivative financial instruments Trade and other receivables excluding prepayments Cash and cash equivalents Total 1, ,373.1 Liabilities Liabilities held at amortised cost Liabilities at FVTPL Derivatives designated as hedging instruments Total Trade and other payables excluding provisions 1, ,509.6 Borrowings 1, ,704.5 Derivative financial instruments Total 3, , Assets Loans and receivables Assets at FVTPL Derivatives designated as hedging instruments Held-tomaturity Availablefor-sale Total Investments Derivative financial instruments Trade and other receivables excluding prepayments Cash and cash equivalents Total 1, ,589.5 Liabilities Liabilities held at amortised cost Liabilities at FVTPL Derivatives designated as hedging instruments Total Trade and other payables excluding provisions 1, ,487.6 Borrowings 2, ,104.9 Derivative financial instruments Total 3, ,
130 Notes to the Consolidated Financial Statements continued 7. Financial instruments continued The derivative financial instruments are included in the Group s balance sheet as follows: At 31 December 2015 Assets Liabilities Current Foreign currency forward contracts 7.3 (2.0) Foreign currency option contracts 8.6 Commodity swap contracts 1.0 (14.3) Forward starting swap contracts (24.6) Total current 16.9 (40.9) Non-current Commodity swap contracts 0.4 (14.5) Embedded derivatives 6.2 Total non-current 6.6 (14.5) At 31 December 2014 Current Foreign currency forward contracts 15.6 (4.4) Foreign currency option contracts 25.5 Cross-currency swap contracts (34.3) Commodity swap contracts 1.3 (13.4) Interest rate swap contracts 10.6 Total current 53.0 (52.1) Non-current Forward starting swap contracts (24.7) Commodity swap contracts 0.9 (9.5) Total non-current 0.9 (34.2) As at 31 December 2015, other receivables which served as collateral for net open position of interest rate and cross-currency swap derivative financial instruments was nil (2014: 3.5m) as the respective financial instruments matured on 17 September Net fair values of derivative financial instruments (a) Cash flow hedges The fair values of derivative financial instruments as at 31 December designated as cash flow hedges were: Contracts with positive fair values Foreign currency forward contracts Foreign currency option contracts Commodity swap contracts 0.4 Total contracts with positive fair values Contracts with negative fair values Foreign currency forward contracts (0.5) (0.6) Commodity swap contracts (0.8) (1.3) Forward starting swap contracts (24.6) (24.7) Total contracts with negative fair values (25.9) (26.6) Cash flows from the Group s cash flow hedges at 31 December 2015 are expected to occur and, accordingly, affect profit or loss in 2016, except for the commodity swap contracts, for which cash flows are expected to occur and affect profit or loss between 2016 and 2018; and the forward starting swap contracts, which were settled on issuance of the forecasted fixed rate debt in March 2016 (refer to Note 34) and will impact profit or loss over the term of the debt issued. 128
131 Strategic Report Corporate Governance Financial Statements Supplementary Info & Swiss Statutory Reporting (b) Fair value hedges The fair values of derivative financial instruments as at 31 December designated as fair value hedges were: Contracts with positive fair values Foreign currency forward contracts Foreign currency option contracts Total contracts with positive fair values (c) Undesignated hedges The fair values of derivative financial instruments as at 31 December which economically hedge Group s risks and for which hedge accounting has not been applied, were: Contracts with positive fair values Foreign currency forward contracts Foreign currency option contracts Interest rate swap contracts 10.6 Embedded derivatives 6.2 Commodity swap contracts Total contracts with positive fair values Contracts with negative fair values Foreign currency forward contracts (1.5) (3.8) Cross-currency swap contracts (34.3) Commodity swap contracts (28.0) (21.6) Total contracts with negative fair values (29.5) (59.7) Foreign currency forward contracts and foreign currency option contracts The Company uses a combination of foreign currency forward and option contracts to hedge foreign exchange transaction exposures. The net notional principal amounts of the outstanding foreign currency forward contracts at 31 December 2015 totalled 284.2m (2014: 175.8m). The net notional principal amounts of the outstanding foreign currency option contracts at 31 December 2015 totalled 132.2m (2014: 106.0m). Commodity swap contracts The Group purchases sugar, aluminium cans and gas oil on an ongoing basis to meet its operational needs. The Group uses commodity swap contracts to hedge commodity price exposure deriving from the increased volatility in commodity prices. These contracts, which economically hedge sugar, aluminium and gas oil purchases, are expected to reduce volatility of cash flows attributable to the fluctuation of the respective commodity price for a period up to 36 months, in accordance with the Group s risk management policy (see Note 28). The notional principal amounts of the outstanding commodity swap contracts at 31 December 2015 totalled 163.7m (2014: 165.1m). 129
132 Notes to the Consolidated Financial Statements continued 7. Financial instruments continued Interest rate swap contracts The interest rate swap contracts with a notional value of $400.0m, which related to the $400.0m US dollar fixed rate debt, matured on 17 September The Group entered into forward starting swap contracts of 500.0m in 2014 and an additional 100.0m in August 2015 to hedge the interest rate risk related to its Euro-denominated forecasted issuance of fixed rate debt in March 2016 (refer to Note 34). The notional principal amounts of the outstanding forward starting swap contracts at 31 December 2015 total 600.0m and are formally designated as cash flow hedges. The forward starting swap contracts outstanding at 31 December 2015 can be summarised as follows: Currency Amount million Start date Maturity date Pay fixed rate Receive floating rate EUR March March % Euribor EUR March March % Euribor EUR March March % Euribor EUR March March % Euribor Repricing date of the fixed payments for all Euro-denominated forward starting swap contracts is 9 March whereas repricing dates of the floating receipts are 9 March and 9 September until maturity. Cross-currency swap contracts The cross-currency swap contracts with a notional value of US$400m ( 357.1m) as at 31 December 2014, which related to the $400m US dollar denominated debt, matured on 17 September Cash flow hedges The net amount reclassified from other comprehensive income to profit and loss for the period amounted to a 4.6m loss (2014: 7.4m loss), all of which was recorded in interest expense (2014: 7.4m loss). The ineffectiveness recognised in interest expense for the interest rate and cross-currency swap contracts used for cash flow hedging was nil in 2015 (2014: 4.6m loss). Fair value hedges The fair value net gain of the foreign currency forward and option contracts used as fair value hedging instruments was 4.1m in 2015 (2014: 5.5m net gain), which had been recognised in operating expenses and offset with a similar loss on the hedged item attributable to foreign currency risk. Undesignated hedges The net losses on foreign currency and commodity derivative contracts at fair value through profit and loss (which economically hedged the Group's risks but for which hedge accounting was not applied) amounted to a 24.9m loss (2014: 38.3m loss) of which a 19.7m loss was recorded in cost of goods sold (2014: 18.3m loss) and a 5.2m loss in operating expenses (2014: 20.0m loss). Embedded derivatives During 2015 the Group recognised embedded derivatives whose risks and economic characteristics were not considered to be closely related to the commodity contract in which they were embedded. The fair value of the embedded derivatives as at 31 December 2015 amounted to a financial asset of 6.2m. 130
133 Strategic Report Corporate Governance Financial Statements Supplementary Info & Swiss Statutory Reporting 8. Deferred tax Deferred tax assets and liabilities are offset when there is a legally enforceable right to offset current tax assets against current tax liabilities, when the deferred taxes are levied by the same fiscal authority on either the taxable entity or different taxable entities, and there is an intention to settle the balances on a net basis. The following amounts, after offsetting balances within the same tax jurisdiction where applicable, are shown in the consolidated balance sheet as at 31 December: Deferred tax assets Deferred tax liabilities (132.0) (137.4) Net deferred tax (75.7) (97.4) The gross amounts of deferred tax assets and liabilities are as follows: Deferred tax assets To be recovered after more than 12 months To be recovered within 12 months Deferred tax liabilities To be recovered after more than 12 months (197.6) (236.6) To be recovered within 12 months (17.0) (12.0) (214.6) (248.6) Deferred tax liabilities (net) (75.7) (97.4) The movements in deferred tax assets and liabilities during the year, after offsetting balances within the same tax jurisdiction where applicable, are as follows: As at 1 January (97.4) (136.2) Taken to the income statement (refer to Note 21) Taken to other comprehensive income 2.6 Foreign currency translation As at 31 December (75.7) (97.4) 131
134 Notes to the Consolidated Financial Statements continued 8. Deferred tax continued The movements in deferred tax assets and liabilities during the year, without taking into consideration the offsetting of balances within the same tax jurisdiction where applicable, are as follows: Deferred tax liabilities Tax in excess of book depreciation Derivative instruments Other deferred tax liabilities Total As at 1 January 2014 (270.2) (2.1) (6.8) (279.1) Taken to the income statement 4.9 (1.0) Taken to other comprehensive income (1.6) (1.3) (2.9) Transfers between assets/liabilities (1.7) 0.9 Foreign currency translation 26.3 (0.2) 26.1 As at 31 December 2014 (238.2) (3.1) (7.3) (248.6) Taken to the income statement 26.1 (2.1) 24.0 Taken to other comprehensive income 3.3 (0.8) 2.5 Transfers between assets/liabilities (0.5) (0.5) Foreign currency translation 8.3 (0.3) 8.0 As at 31 December 2015 (203.8) (1.9) (8.9) (214.6) Deferred tax assets Book in excess of tax depreciation Provisions Tax losses carry-forward Leasing Pensions and benefit plans Other deferred tax assets Total As at 1 January Taken to the income statement (0.7) (2.0) 16.3 Taken to other comprehensive income 7.2 (4.3) 2.9 Transfers between assets/liabilities 1.5 (0.8) 0.1 (1.7) (0.9) Foreign currency translation (6.8) (1.6) (1.6) 0.6 (0.6) (10.0) As at 31 December Taken to the income statement 0.3 (0.2) (9.0) (0.6) (7.2) Taken to other comprehensive income (2.3) Transfers between assets/liabilities (3.1) 0.5 Foreign currency translation (2.4) (1.4) (0.7) (1.2) (5.7) As at 31 December Deferred tax assets are recognised for tax losses carry-forward to the extent that realisation of the related tax benefit through the reduction of future taxes is probable. In particular, following the relevant local rules applying in our jurisdictions, 15.6m of the recognised deferred tax asset is attributable to tax losses that expire between 2016 and 2020, 5.0m is attributable to tax losses that will expire after 2020 and 3.8m is attributable to tax losses that can be carried forward indefinitely. The Group has unrecognised deferred tax assets attributable to tax losses that are available to carry forward against future taxable income of 15.6m (2014: 12.6m). 12.1m of this unrecognised deferred tax asset is attributable to tax losses that expire between 2016 and 2020 and 3.5m is attributable to tax losses that expire after Deferred tax is recognised in full on temporary differences arising from investment in subsidiaries, associates and joint ventures, except where the timing of the reversal of the temporary difference is controlled by the Group and it is probable that the temporary difference will not reverse in the foreseeable future. This includes taxation in respect of the retained earnings of overseas subsidiaries only to the extent that, at the balance sheet date, dividends have been accrued as receivable or a binding agreement to distribute past earnings in future periods has been entered into by the subsidiary. The aggregate amount of distributable reserves arising from the realised earnings of the Group s operations was 1,616.4m (2014: 1,689.4m). No deferred tax liabilities have been recognised on such reserves given that their distribution is controlled by the Group or, in the event of plans to remit overseas earnings of subsidiaries, such distribution would not give rise to a tax liability. 132
135 Strategic Report Corporate Governance Financial Statements Supplementary Info & Swiss Statutory Reporting 9. Other non-current assets Other non-current assets consisted of the following at 31 December: Non-current prepayments Non-current receivables from sale of property, plant and equipment 8.5 Loans to and receivables from related parties (refer to Note 32) 0.2 Non-current income tax receivable Non-current receivables from customers Loans to non-related parties Held-to-maturity investments Pension plan assets (refer to Note 16) 2.2 Available-for-sale financial assets Total other non-current assets Non-current receivables from customers relate to re-negotiated trade receivables, which are expected to be settled within the new contractual due date. Movements in available-for-sale financial assets are as follows: As at 1 January Purchases 0.1 Impairment (0.4) Unrealised gains / (losses) on available-for-sale financial assets 0.1 (0.6) As at 31 December Available-for-sale financial assets relate to listed equities of 1.2m (2014: 1.1m) and other unlisted equities of 0.5m (2014: 0.9m). The fair values of available-for-sale financial assets are based on quoted market prices, where available, or cost or discounted cash flow projections where quoted market prices are unavailable. 10. Inventories Inventories consisted of the following at 31 December: Finished goods Raw materials and work in progress Consumables Total inventories The amount of inventories recognised as an expense during 2015 was 3,035.4m (2014: 3,157.2m). During 2015 provision of obsolete inventories recognised as an expense amounted to 11.7m (2014: 12.3m), whereas provision reversed in the period amounted to 0.1m (2014: 3.1m). 133
136 Notes to the Consolidated Financial Statements continued 11. Trade, other receivables and assets Trade receivables consisted of the following at 31 December: Trade receivables Less: Provision for doubtful debts (78.9) (79.2) Total trade receivables The credit period given to customers ranges from 7 days to 90 days depending on the country and customer type. In most territories, interest is not charged for late payment. The Group provides for all significant receivables that are considered non-collectible after considering the following indicators: delinquency in payment (over 90 days), significant financial difficulties, and high risk profile of the debtor. For all other receivables, the Group collectively assesses whether there are indicators for impairment based on delinquency in payments. Before accepting any new credit customers, the Group investigates the potential customer s credit quality (usually through external agents) and defines credit limits for each customer. Customers are reviewed on an ongoing basis and credit limits adjusted accordingly. There are no customers who represent more than 5% of the total balance of trade receivables for the Group. The Group s exposure to credit risk is managed by established policies and procedures regarding financial risk management, as described in Note 28. The trade receivables are as follows: Within due date Less: Provision for doubtful debts within due date (4.4) Past due Less: Provision for doubtful debts past due (74.5) (79.2) Total trade receivables As at 31 December 2015, the Group held collateral, in the form of mortgages, bank guarantees, bills of exchange and credit insurance, as security against trade receivables with a nominal amount of 33.4m (2014: 32.4m). As at 31 December 2015, trade receivables of 88.9m (2014: 111.4m) were past due but not impaired. The ageing analysis of these trade receivables is as follows: Up to 3 months to 6 months to 9 months More than 9 months Total As at 31 December 2015, trade receivables of 74.5m (2014: 79.2m) were past due and impaired. The ageing analysis of these receivables is as follows: Up to 3 months (1.0) (4.4) 3 to 6 months (9.5) (8.0) 6 to 9 months (2.2) (4.4) More than 9 months (61.8) (62.4) Total (74.5) (79.2) 134
137 Strategic Report Corporate Governance Financial Statements Supplementary Info & Swiss Statutory Reporting The movement in the provision for doubtful debts during the year is as follows: As at 1 January (79.2) (79.0) Amounts written off during the year Amounts recovered during the year Increase in allowance recognised in profit or loss (11.8) (13.5) Foreign currency translation As at 31 December (78.9) (79.2) Other receivables and assets consisted of the following at 31 December: Prepayments Receivables from related parties (refer to Note 32) Loans to related parties (refer to Note 32) Collateral for interest rate swap contracts (refer to Note 7) 3.5 VAT and other taxes receivable Loans and advances to employees Receivables from sale of property, plant and equipment Other receivables Total other receivables and assets The related party receivables, net of the provision for doubtful debts, are as follows: Within due date Past due Less: Provision for doubtful debts Total related party receivables As at 31 December 2015, related party receivables of 6.5m (2014: 24.2m) were past due but not impaired. The ageing analysis of these receivables is as follows: Up to 3 months to 6 months to 9 months More than 9 months Total
138 Notes to the Consolidated Financial Statements continued 12. Assets classified as held for sale During 2014, non-current assets with a net book value of 1.0m were reclassified from property, plant and equipment to assets held for sale. The 1.0m assets held for sale comprise the net book value of property, plant and equipment in our established markets segment of 0.9m and buildings in our emerging markets segment of 0.1m, which have been written down to fair value less cost to sell. This is a non-recurring fair value measurement and within Level 3 of the fair value hierarchy. The fair value of held for sale assets is determined through the use of a sales comparison approach. During 2015, non-current assets with a net book value of 0.9m were reclassified to property, plant and equipment, because the criteria for continued classification as held for sale were no longer met and the depreciation charge for the year was adjusted for the depreciation that would have been recognised had the assets not been classified as held for sale. Furthermore, non-current assets in our established markets with a net book value of 5.4m were reclassified from property, plant and equipment to assets held for sale. The 5.5m assets held for sale comprise the net book value of property, plant and equipment in our established and emerging markets, that have been written down to fair value less cost to sell. This is a non-recurring fair value measurement and within Level 3 of the fair value hierarchy. The fair value of held-forsale assets is determined through the use of a sales comparison approach. 13. Cash and cash equivalents Cash and cash equivalents as at 31 December comprise the following: Cash at bank, in transit and in hand Short-term deposits Total cash and cash equivalents Cash and cash equivalents are held in the following currencies: Euro Nigerian naira Romania leu Russian rouble Swiss franc Polish zloty US dollar Belarusian rouble Ukrainian hryvnia Serbian dinar Other Total cash and cash equivalents m equivalent in Nigerian naira relates to the outstanding balance of the bank account held for the repayment of the former minority shareholders of the Company s subsidiary Nigerian Bottling Company plc (refer to Note 26). The amount of dividends payable to the Company by its operating subsidiaries is subject to, among other restrictions, general limitations imposed by the corporate laws and exchange control restrictions of the respective jurisdictions where those subsidiaries are organised and operate. Also, there are fund transfer restrictions in certain countries in which we operate, in particular Belarus, Greece, Nigeria, Serbia and Ukraine. These restrictions do not have a material impact on the Group s liquidity, as the amounts of cash and cash equivalents held in such countries are generally retained for capital expenditure and working capital purposes. Intra group dividends paid by certain of our subsidiaries are also subject to withholding taxes. 136
139 Strategic Report Corporate Governance Financial Statements Supplementary Info & Swiss Statutory Reporting 14. Borrowings The Group held the following borrowings as at 31 December: Bank overdrafts Current portion of long-term bonds, bills and unsecured notes Commercial paper Loan payable to related parties (refer to Note 32) Other borrowings Obligations under finance leases falling due within one year Total borrowings falling due within one year Borrowings falling due within one to two years Bonds, bills and unsecured notes Loan payable to related parties (refer to Note 32) Borrowings falling due within two to five years Bonds, bills and unsecured notes Loan payable to related parties (refer to Note 32) Borrowings falling due in more than five years Bonds, bills and unsecured notes ,457.6 Obligations under finance leases falling due in more than one year Total borrowings falling due after one year ,556.3 Total borrowings 1, ,104.9 Commercial paper programme and committed credit facilities In March 2002, the Group established a 1.0bn global commercial paper programme (the old CP programme ) to further diversify its short-term funding sources. In October 2013, a new 1.0bn Euro-commercial paper programme (the new CP programme and, together with the old CP programme, the CP programmes ) was established in place of the old CP programme. The Euro-commercial paper notes may be issued either as non-interest-bearing notes sold at a discount or as interest-bearing notes at a fixed or floating rate. All commercial paper issued under the CP programmes must be repaid within 7 to 364 days. The new CP programme has been granted the STEP label and is fully, unconditionally and irrevocably guaranteed by Coca-Cola HBC AG and Coca-Cola HBC Holdings B.V. The outstanding amount under the CP programmes was 173.5m as at 31 December 2015 (2014: 100.0m). In June 2015, the Group replaced its then-existing 500.0m syndicated revolving credit facility with a new 500.0m syndicated loan facility, provided by various financial institutions, expiring on 24 June 2020, with the option to be extended for one more year. This facility can be used for general corporate purposes and carries a floating interest rate over EURIBOR and LIBOR. No amounts have been drawn under the syndicated loan facility since inception. The syndicated loan facility is fully, unconditionally and irrevocably guaranteed by Coca-Cola HBC AG and Coca-Cola HBC Holdings B.V. and is not subject to any financial covenants. Euro medium-term note programmes In 2001, the Group established a 2.0bn Euro medium-term note programme (the Old EMTN programme ), which was increased to 3.0bn in April In June 2013, a new 3.0bn Euro medium-term note programme (the New EMTN programme and, together with the Old EMTN programme, the EMTN programmes ) was established in place of the Old EMTN programme. Notes are issued under the New EMTN programme through Coca-Cola HBC s 100%-owned subsidiary Coca-Cola HBC Finance B.V. and are fully, unconditionally and irrevocably guaranteed by Coca-Cola HBC AG and Coca-Cola HBC Holdings B.V. In December 2008, Coca-Cola HBC Finance B.V. issued 500.0m of five-year Euro-denominated fixed rate notes carrying 7.875% per annum coupon which was fully repaid in January In March 2011, Coca-Cola HBC Finance B.V. completed the successful offering of 300.0m of 4.25% fixed rate Euro-denominated notes under the Old EMTN programme to be consolidated and form a single series with the existing 300.0m 4.25% fixed rate notes due 16 November 2016 issued in November The issue of these notes brought the total outstanding amount of the series to 600.0m. 137
140 Notes to the Consolidated Financial Statements continued 14. Borrowings continued In June 2013, Coca-Cola HBC Finance B.V. completed the issue of 800.0m 2.375% seven-year fixed rate Euro-denominated notes under the New EMTN programme. The net proceeds of the new issue were used to repay the US$500.0m notes due in September 2013 and partially repay 183.0m of the 7.875% five-year fixed rate notes due in January As at 31 December 2015, a total of 1.4bn in notes issued under the EMTN programme were outstanding and a further amount of 2.2bn was available for issuance under the new EMTN programme. Notes issued in the US market On 17 September 2003, the Coca-Cola HBC Group successfully completed, through its 100%-owned finance subsidiary Coca-Cola HBC Finance B.V., a US$900.0m global offering of privately placed notes with registration rights. The first tranche consisted of an aggregate principal amount of US$500.0m due in September 2013 and the second tranche consisted of an aggregate principal amount of US$400.0m due in September The net proceeds of the offering were used to refinance certain outstanding debt, the leveraged re-capitalisation of the Group and the acquisition of Römerquelle GmbH. In December 2003, an exchange offer was made by Coca-Cola Hellenic Bottling Company S.A. in order to effect the exchange of the privately placed notes for similar notes registered with the US Securities and Exchange Commission (SEC). Acceptances under the offer, which was finalised in February 2004, were US$898.1m. Both tranches of notes were de-registered in connection with Coca-Cola HBC s voluntary share exchange offer by filing a Form 15F with the SEC in August 2013 and the 2013 US notes were fully repaid upon maturity. The 2015 US notes were fully, unconditionally and irrevocably guaranteed by Coca-Cola HBC AG and Coca-Cola HBC Holdings B.V. and were not subject to any financial covenants. The tranche of US$400.0m was fully repaid upon maturity using the available cash balance. Summary of bonds and notes outstanding as at 31 December 2015 Start date Maturity date Fixed coupon 300m notes 16 November November % 300m notes 2 March November % 800m notes 18 June June % The fair value of bonds and notes payable, including the current portion, is 1,465.8m (2014: 1,831.6m) compared to their book value, including the current portion, of 1,394.7m (2014: 1,727.6m). The fair values are within Level 1 of the fair value hierarchy. The present value of finance lease liabilities as at 31 December was as follows: Less than one year Later than one year but less than two years Later than two years but less than three years Later than three years but less than four years Later than four years but less than five years Later than five years Present value of finance lease liabilities The minimum lease payments of finance lease liabilities as at 31 December were as follows: Less than one year Later than one year but less than two years Later than two years but less than three years Later than three years but less than four years Later than four years but less than five years Later than five years Future finance charges on finance leases (56.6) (51.9) Present value of finance lease liabilities Finance leases are mainly for land and buildings as well as plant and equipment. The finance leases do not contain contingent rent payments or escalation clauses. 138
141 Strategic Report Corporate Governance Financial Statements Supplementary Info & Swiss Statutory Reporting The borrowings, including loans payable to related parties at 31 December, were held in the following currencies: Current 2015 Non-current 2015 Current 2014 Non-current 2014 Euro ,494.4 US dollar UK sterling Polish zloty Croatian kuna 8.6 Other Total borrowings ,556.3 The carrying amounts of the borrowings, including loans payable to related parties held at fixed and floating interest rate as at 31 December 2015, as well as the weighted average interest rates and maturities of fixed rate borrowings, were as follows: Fixed interest rate Floating interest rate Total Euro 1, ,629.6 US dollar UK sterling Polish zloty Other Total borrowings 1, ,704.5 Financial liabilities represent fixed and floating rate borrowings held by the Group. The Group s policy is to hedge exposures to changes in the fair value of debt and interest rates by using a combination of cross-currency swap contracts, fixed-to-floating-rate interest rate swap contracts and interest rate option contracts. The weighted average interest rate of the fixed rate Euro liabilities is 2.8% and the weighted average maturity for which the interest rate is fixed is 2.6 years. The transactions with related parties bear floating interest based on the following benchmark rates: Euro USD 6-12 month EURIBOR (European inter-bank offer rate) 3 month LIBOR (London inter-bank offer rate) 15. Trade and other payables Trade and other payables consisted of the following at 31 December: Trade payables Accrued liabilities Payables to related parties (refer to Note 32) Deposit liabilities Other tax and social security liabilities Salaries and employee-related payables Deferred income Other payables Total trade and other payables 1, ,473.7 The amount due to pension funds as at 31 December 2015 was 1.1m (2014: 1.9m). 139
142 Notes to the Consolidated Financial Statements continued 16. Provisions and employee benefits Provisions consisted of the following at 31 December: Current Employee benefits Restructuring and other Total current provisions Non-current Employee benefits Restructuring and other Total non-current provisions Total provisions The movements in restructuring and other provisions comprise: As at 1 January Arising during the year Utilised during the year (28.4) (50.8) Unused amount reversed (3.0) (0.4) Foreign currency translation (0.4) As at 31 December Restructuring and other provisions comprise outstanding balances relating to restructuring of 15.8m (2014: 7.9m) of which 15.7m is expected to be completed in 2016 and 0.1m in 2017 and 2018 (see Note 19(b)), a provision for employee litigation of 3.8m (2014: 3.3m) and other items of 6.3m (2014: 2.0m). Employee benefits Employee benefits consisted of the following at 31 December: Defined benefit plans Employee leaving indemnities Pension plans Long service benefits jubilee plans Total defined benefit plans Other employee benefits Annual leave Other employee benefits Total other employee benefits Total employee benefits obligations Other employee benefits is primarily comprised of employee bonuses including a management incentive plan which is a cash variable plan that operates over a three-year period. Employees of Coca-Cola HBC s subsidiaries in Austria, Bulgaria, Croatia, Greece, Italy, Montenegro, Nigeria, Poland, Romania, Serbia and Slovenia are entitled to employee leaving indemnities, generally based on each employee s length of service, employment category and remuneration. These are unfunded plans where the Company meets the payment obligation as it falls due. Coca-Cola HBC s subsidiaries in Austria, Greece, Northern Ireland, the Republic of Ireland and Switzerland sponsor defined benefit pension plans. Of the three plans in the Republic of Ireland, two have plan assets, as do the two plans in Northern Ireland, one plan in Greece and two plans in Switzerland. The Austrian plans do not have plan assets and the Company meets the payment obligation as it falls due. The defined benefit plans in Austria, Greece, Republic of Ireland and Northern Ireland are closed to new members. Coca-Cola HBC provides long-service benefits in the form of jubilee plans to its employees in Austria, Croatia, Nigeria, Poland, Slovenia and Switzerland. 140
143 Strategic Report Corporate Governance Financial Statements Supplementary Info & Swiss Statutory Reporting Defined benefit obligation by segment is as follows: Established Emerging Developing Defined benefit obligation The average duration of the defined benefit plans is 19 years and the total employer contributions expected to be paid in 2016 are 20.1m. Asset liability matching: Plan assets allocated to growth assets are monitored regularly to ensure they remain appropriate and in line with the Group s long-term strategy to manage the plans. As the plans mature the level of investment risk will be reduced by investing more in assets such as bonds that better match the liabilities. Pension plan assets are invested in different asset classes in order to maintain a balance between risk and return. Investments are well diversified to limit the financial effect of the failure of any individual investment. Through its defined benefit plans the Group is exposed to a number of risks as outlined below: Asset volatility: The liabilities are calculated using a discount rate set with reference to corporate bond yields; if assets underperform this yield, this will create a deficit. The Northern Ireland, the Republic of Ireland and Swiss plans hold a significant proportion of growth assets (equities) which are expected to outperform corporate bonds in the long term while providing volatility and risk in the short term. Changes in bond yields: A decrease in corporate bond yields will increase the plan liabilities, although this decrease will be partially offset by an increase in the value of the plans bond holdings. Inflation: The Northern Ireland, the Republic of Ireland and Swiss plans benefit obligations are linked to inflation, and higher inflation will lead to higher liabilities (although, in most cases, caps on the level of inflationary increases are in place to protect against extreme inflation). The majority of the assets are either unaffected by or loosely correlated with inflation, meaning that an increase in inflation will also increase the deficit. Life expectancy: The majority of the pension plans obligations are to provide benefits for the life of the member, so increases in life expectancy will result in an increase in the liabilities. The sensitivity analysis presented below is based on a change in assumption while all other assumptions remain constant. Impact on defined benefit obligation as at 31 December 2015 Change in assumptions Increase in assumption Decrease in assumption Discount rate 0.50% decrease 8.47% increase 9.72% Rate of compensation increase 0.50% increase 2.23% decrease 2.08% Rate of pension increase 0.50% increase 4.33% decrease 1.96% Life expectancy 1 year increase 1.61% decrease 1.60% Reconciliation of defined benefit obligation: Present value of defined benefit obligation at 1 January Current service cost Interest cost Plan participants contributions Past service cost (5.8) (3.9) Curtailment/settlement (5.5) 3.2 Benefits paid (26.4) (29.2) Gains from change in demographic assumptions (0.7) (3.7) (Gain)/loss from change in financial assumptions (2.8) 67.4 Experience adjustments (1.8) 0.9 Foreign currency translation Present value of defined benefit obligation at 31 December
144 Notes to the Consolidated Financial Statements continued 16. Provisions and employee benefits continued Reconciliation of plan assets: Fair value of plan assets at 1 January Interest income on plan assets Return on plan assets excluding interest income Actual employer s contributions Actual participants contributions Actual benefits paid Settlement Admin expenses (12.4) (14.2) (7.3) (0.3) (0.2) Foreign currency translation Fair value of plan assets at 31 December The present value and funded status of defined benefit obligations were as follows at 31 December: Present value of funded obligations Fair value of plan assets (380.7) (341.7) Present value of unfunded obligations Defined benefit obligations Plus: amounts recognised within non-current assets (refer to Note 9) 2.2 Total defined benefit obligations Funding levels are monitored in conjunction with the agreed contribution rate. The funding level of the funded plans as at 31 December 2015 was 96% (2014: 90%). Two of the plans have a funded status surplus of 2.2m as at 31 December 2015 (31 December 2014: nil) that is recognised as an asset on the basis that the Group has an unconditional right to future economic benefits either via a refund or a reduction in future contributions. The movement in the defined benefit obligation recognised on the balance sheet was as follows: Defined benefit obligation as at 1 January Expense recognised in the income statement Remeasurements recognised in OCI (11.1) 38.7 Employer contributions (16.1) (13.6) Benefits paid (14.0) (15.0) Foreign currency translation (0.2) 2.7 Defined benefit obligation as at 31 December Plus: amounts recognised within non-current assets (refer to Note 9) 2.2 Total defined benefit obligation as at 31 December
145 Strategic Report Corporate Governance Financial Statements Supplementary Info & Swiss Statutory Reporting The assumptions (weighted average for the Group) used in computing the defined benefit obligation comprised the following for the years ended 31 December: Discount rate Rate of compensation increase Pension increases % 2014 % Life expectancy for pensioners at the age of 65 in years: Male Female The expense recognised in the income statement comprised the following for the years ended 31 December: Service cost Net interest cost on defined benefit liability/(asset) Actuarial gain (0.2) (0.1) Administrative expenses Total Defined benefit plan expenditure is included in staff costs and presented in cost of goods sold and operating expenses. Plan assets are invested as follows: 2015 % 2014 % Asset category Equity securities Eurozone 4 3 Equity securities non-eurozone Government bonds non-eurozone 9 Government bonds Eurozone 18 9 Corporate bonds Eurozone 1 2 Corporate bonds non-eurozone Real estate 10 8 Cash 2 2 Other 17 6 Total The assets of funded plans are generally held in separately administered trusts, either as specific assets or as a proportion of a general fund, or are insurance contracts. Plan assets held in trust are governed by local regulations and practice in each country. The category other mainly includes investments in funds holding a portfolio of assets. Plan assets relate predominately to quoted financial instruments. Equity securities were not invested in ordinary shares of the Company as at 31 December 2015 or 31 December Defined contribution plans The expense recognised in the income statement in 2015 for the defined contribution plan is 22.2m (2014: 25.2m). This is included in staff costs and recorded in cost of goods sold and operating expenses. 143
146 Notes to the Consolidated Financial Statements continued 17. Share capital, share premium and Group reorganisation reserve Number of shares (authorised and issued) Share capital Share premium Group reorganisation reserve Total Balance as at 1 January ,690,225 1, ,287.1 (6,472.1) Shares issued to employees exercising stock options 129, Dividends (130.2) (130.2) Balance as at 31 December ,819,247 1, ,157.6 (6,472.1) Shares issued to employees exercising stock options 322, Dividends (132.4) (132.4) Balance as at 31 December ,141,297 2, ,028.3 (6,472.1) In 2014, the share capital of the Group increased by the issue of 129,022 new ordinary shares following the exercise of stock options pursuant to the Group s employee stock option plan. Total proceeds from the issuance of the shares under the stock option plan amounted to 1.4m. On 25 June 2014, Coca-Cola HBC s extraordinary general meeting of shareholders approved the distribution of a dividend per share. The effect to Coca-Cola HBC s share premium amounted to 130.2m (refer also to Note 27). In 2015, the share capital of the Group increased by the issue of 322,050 new ordinary shares following the exercise of stock options pursuant to the Group s employee stock option plan. Total proceeds from the issuance of the shares under the stock option plan amounted to 5.1m. On 23 June 2015, Coca-Cola HBC s Annual General Meeting of shareholders approved the distribution of 0.36 dividend per share. The effect of Coca-Cola HBC s premium amounted to 132.4m (refer also to Note 27). After the above changes, the share capital as at 31 December 2015 amounted to 2,000.1m and is comprised of 368,141,297 shares with a nominal value of CHF 6.70 each. 18. Reserves The reserves of the Group at 31 December were as follows: Treasury shares (132.0) (70.7) Exchange equalisation reserve (681.4) (615.3) Other reserves Hedging reserve, net (25.1) (10.4) Tax-free reserve Statutory reserves Stock option reserve Available-for-sale financial assets valuation reserve, net Other Total other reserves Total reserves (553.0) (426.3) Treasury shares Treasury shares held by the Group represent shares acquired following approval of share buy-back programmes, forfeited shares under the equity compensation plan operated by the Group, and shares representing the initial ordinary shares of Coca-Cola HBC acquired from Kar-Tess Holding. On 23 June 2015, the Annual General Meeting adopted a proposal for a share buy-back programme of up to three million (3,000,000) ordinary shares of Coca-Cola HBC for the purpose of neutralising the dilution resulting from past and future issuances of shares under the Group s equity compensation plans. The programme was completed in full during 2015 for a consideration of 58.5m. Exchange equalisation reserve The exchange equalisation reserve comprises all foreign exchange differences arising from the translation of the financial statements of entities with functional currencies other than the Euro. The majority of the movement of 2015 is related to the Russian rouble and the Swiss franc, while the majority of the movement of 2014 related to the Russian rouble. 144
147 Strategic Report Corporate Governance Financial Statements Supplementary Info & Swiss Statutory Reporting Other reserves Hedging reserve The hedging reserve reflects changes in the fair values of derivatives accounted for as cash flow hedges, net of the deferred tax related to such balances. The movement for 2015 relates to the movement in cash flow hedges of 14.7m loss, net of deferred tax income of 5.6m (2014: 0.4m loss, net of deferred tax expense of 6.8m). Tax-free and statutory reserves The tax-free reserve includes investment amounts exempt from tax according to incentive legislation, and other tax-free income or income taxed at source. During 2015 there was no movement in tax-free reserves, while in 2014 tax-free reserves of 4.0m were offset against tax losses carried forward and 74.0m was allocated to retained earnings as a result of the transformation of 3E (Cyprus) Limited Greek Branch into a Greek single-member limited company, named Coca-Cola HBC Service MEPE. Statutory reserves are particular to the various countries in which the Group operates. The amount of statutory reserves of the parent entity, Coca-Cola HBC, is nil. During 2015, an amount of 3.0m (2014: 0.3m increase) was reclassified to statutory reserves relating to the establishment of additional reserves. Additionally, in 2014 an amount of 60.3m was allocated from statutory reserves to retained earnings, due to cancellation of the statutory reserve in Czech Republic ( 4.7m) and the transformation of 3E (Cyprus) Limited Greek Branch described above ( 55.6m). Other reserves Other reserves are particular to the various countries in which the Group operates and include shares held for the Group s employee stock purchase plan, which is an equity compensation plan in which eligible employees may participate. Stock option reserve The stock option reserve represents the cumulative charge to the income statement for employee stock option and performance share awards. The movement for the stock option reserve for 2015 was a 8.8m increase (2014: 12.1m increase). Available-for-sale financial assets valuation reserve The available-for-sale financial assets valuation reserve reflects changes in the fair values of available-for-sale financial assets. Amounts in this reserve are reclassified to profit or loss upon sale or impairment of the related investments. The movement for the available-for-sale financial assets valuation reserve for 2015 was a 0.1m gain, net of deferred tax expense of 0.1m including 0.1m share of other comprehensive income from equity method investments (2014: 0.4m loss, net of deferred tax income of 0.2m) and relates to the revaluation impact of listed and unlisted equities held. 19. Total operating costs Total operating costs for the years ended 31 December comprised: Operating expenses 1, ,901.4 Restructuring costs Total operating costs 1, ,956.6 (a) Operating expenses Selling expenses Delivery expenses Administrative expenses Stock option and performance shares expense (refer to Note 25) Operating expenses 1, ,901.4 In 2015, operating expenses included net losses on disposal of property, plant and equipment of 1.8m (2014: 1.8m net gains). 145
148 Notes to the Consolidated Financial Statements continued 19. Total operating costs continued (b) Restructuring costs As part of the effort to optimise its cost base and sustain competitiveness in the marketplace, the Company undertook restructuring initiatives in 2015 which amounted to 54.0m (2014: 55.2m) before tax. During 2015, the Company recorded 23.9m (2014: 25.6m), 9.0m (2014: 7.3m) and 21.1m (2014: 22.3m) of restructuring charges in its established, developing and emerging markets respectively. The restructuring concerns mainly employees costs (see Note 16) and impairment of property, plant and equipment (see Note 5). (c) Staff costs Staff costs included in the income statement in operating expenses, restructuring costs and in cost of goods sold are analysed as follows: Wages and salaries Social security costs Pension and other employee benefits Termination benefits Total staff costs 1, ,103.9 Staff costs included in operating expenses and restructuring costs amounted to 814.1m in 2015 (2014: 844.5m). Staff costs included in cost of goods sold amounted to 255.7m in 2015 (2014: 259.4m). The average number of full-time equivalent employees in 2015 was 33,311 (2014: 36,362). (d) Fees and other services of the statutory auditor Audit and other fees charged in the income statement concerning the statutory auditor of the consolidated financial statements, PricewaterhouseCoopers S.A. and affiliates, were as follows, for the years ended 31 December: Audit fees Audit related fees Other fees Total audit and all other fees Finance costs Net finance costs for the years ended 31 December comprised: Interest income Interest expense (59.4) (59.3) Other finance costs (1.9) (1.9) Net foreign exchange remeasurement losses (7.5) (10.9) Finance charges paid with respect to finance leases (8.9) (8.4) Finance costs (77.7) (80.5) Loss on net monetary position (2.4) Total finance costs (77.7) (82.9) Total finance costs, net (68.2) (72.9) Other finance costs include commitment fees on loan facilities, and not drawn down and other similar fees. Belarus was considered to be a hyperinflationary economy from the fourth quarter of 2011 up to 31 December During this period hyperinflation accounting was applied in accordance with IAS 29. The restatement was based on conversion factors derived from the Belarusian Consumer Price Index (CPI), as compiled by the National Statistical Committee of the Republic of Belarus. The conversion factor used for December 2014 was which resulted in a net monetary loss for 2014 of 2.4m. However, since 1 January 2015 hyperinflation accounting has been discontinued, as Belarus ceased to meet the criteria of a hyperinflationary economy. All amounts expressed in the measuring unit as at 31 December 2014 were treated as the basis for the carrying amounts as at 1 January Capitalised borrowing costs in 2015 amounted to 0.4m (2014: 0.5m). The average interest rate used to capitalise borrowing costs of the Group for 2015 was 3.01% (2014: 3.08%). 146
149 Strategic Report Corporate Governance Financial Statements Supplementary Info & Swiss Statutory Reporting 21. Tax The tax on the Group s profit before tax differs from the theoretical amount that would arise using the weighted average tax rate applicable to profits of the consolidated entities as follows: Profit before tax Tax calculated at domestic tax rates applicable to profits in the respective countries Additional local taxes in foreign jurisdictions Tax holidays in foreign jurisdictions (1.5) (1.1) Expenses non-deductible for tax purposes Income not subject to tax Changes in tax laws and rates (28.3) (31.5) (10.1) 1.4 Current year tax losses not recognised Recognition of previously unrecognised post-acquisition tax losses (2.6) (0.7) Other 0.8 (1.2) Income tax charge per the income statement Non-deductible expenses for tax purposes include marketing and advertising expenses, service fees, bad debt provisions, entertainment expenses, certain employee benefits and stock options expenses and other items that, partially or in full, are not deductible for tax purposes in certain of our jurisdictions. The income tax charge for the years ended 31 December is as follows: Current tax charge Deferred tax charge (refer to Note 8) (16.8) (22.7) Total income tax charge Earnings per share The calculation of the basic and diluted earnings per share attributable to the owners of the parent entity is based on the following data: Net profit attributable to the owners of the parent () Weighted average number of ordinary shares for the purposes of basic earnings per share (million) Effect of dilutive stock options (million) Weighted average number of ordinary shares for the purposes of diluted earnings per share (million) Basic and diluted earnings per share ( ) Outstanding stock options that have an anti-dilutive effect and are therefore excluded from diluted earnings per share in 2015 were 4.5m (2014: 5.8m). 23. Components of other comprehensive income The components of other comprehensive income for the years ended 31 December comprise: Before-tax Tax (expense)/ income Net-of-tax Before-tax Tax (expense)/ income Net-of-tax Available-for-sale financial assets 0.1 (0.1) (0.6) 0.2 (0.4) Cash flow hedges (20.3) 5.6 (14.7) 6.4 (6.8) (0.4) Foreign currency translation (65.8) (65.8) (322.0) (322.0) Actuarial gains/(losses) 11.1 (2.9) 8.2 (38.7) 6.6 (32.1) Share of other comprehensive income of equity method investments (0.2) (0.2) Other comprehensive income (75.1) 2.6 (72.5) (354.9) (354.9) 147
150 Notes to the Consolidated Financial Statements continued 24. Shares held for equity compensation plan The Group operates a stock purchase plan, the Employee Stock Purchase Plan, which is an equity compensation plan, administered by a Plan Administrator, in which eligible employees may participate. Under the terms of this plan, employees have the opportunity to invest 1% to 15% of their salary in ordinary Coca-Cola HBC shares by contributing to the plan monthly. Coca-Cola HBC will match up to a maximum of 3% of the employee s salary by way of contribution. Employer contributions are used to purchase matching shares on a monthly basis on the open market, which is the London Stock Exchange. Matching shares vest one year after the purchase. Forfeited shares may be used to meet Plan expenses or for any other purposes relevant to the Plan. Dividends received in respect of shares under the Plan are used to purchase additional shares and are immediately vested to the employees. Shares are held under the Plan Administrator. In order to adapt the plan to the Greek legal framework Coca-Cola HBC matches the contribution of employees resident in Greece with an annual employer contribution, made in December, of up to 5% of the employee s salary, and matching shares purchased in December vest immediately. During 2015, 266,261 shares were purchased by Coca-Cola HBC (2014: 287,214) as matching shares to employee investments. The charge to the income statement totalled 4.8m (2014: 4.3m). The cost of unvested matching shares held by the trust at the end of December 2015 was 4.6m (2014: 3.8m). The total number of shares held under the plan as at 31 December 2015 was 2,417,413 (2014: 2,472,937). The total contributions made by employees to the plan during 2015 were 5.5m (2014: 5.3m). No provision is made for any increase or decrease in value of these shares, as they will vest to employees, and the risks and rewards of fluctuations of the share price are borne by those employees. 25. Stock option and performance share compensation plans The Group operates an employee stock option plan as an equity compensation plan, under which senior managers are granted awards of stock options, based on performance, potentiality and level of responsibility. Options are granted at an exercise price equal to the closing price of the Company s shares trading on the London Stock Exchange on the day of the grant. Options vest in one-third increments each year for three years and can be exercised for up to ten years from the date of award. When the options are exercised, the proceeds received, net of any transaction costs, are credited to share capital (at the nominal value) and share premium. The Group has not issued any new stock options in The following table summarises information regarding outstanding stock options exercisable at 31 December 2015: Exercise price (EUR) Exercise price (GBP) Vesting status as at 31 Dec 2015 Vesting dates for further increments End of option period Number of stock options outstanding 2005 December grant fully vested , March grant fully vested , December grant fully vested , December grant fully vested ,202, December grant fully vested , December grant fully vested ,412, December grant fully vested ,633, March grant fully vested , December grant fully vested ,261, June grant two-thirds ,475, December grant two-thirds ,609, December grant one-third ,610,332 Total 12,337, Relates to stock options granted under the previous stock option plan which expire at the end of December
151 Strategic Report Corporate Governance Financial Statements Supplementary Info & Swiss Statutory Reporting A summary of stock option activity in 2015 under all plans is as follows: Number of stock options 2015 Weighted* average exercise price 2015 (EUR) Weighted average exercise price 2015 (GBP) Outstanding at January 1 12,925, Exercised (322,050) Expired (35,062) Forfeited (231,177) Outstanding at December 31 12,337, Exercisable at December 31 10,276, A summary of stock option activity in 2014 under all plans is as follows: Number of stock options 2014 Weighted* average exercise price 2014 (EUR) Weighted average exercise price 2014 (GBP) Outstanding at January 1 11,580, Granted 1,720, Exercised (129,022) Expired (155,567) Forfeited (91,000) Outstanding at December 31 12,925, Exercisable at December 31 9,047, * For convenience purposes, the prices are translated at the closing exchange rate. The related weighted average share price during the period of exercise was (2014 : 14.17). The total charge to the income statement for employee stock option awards for 2015 amounted to 8.7m (2014: 12.1m). Equity-settled share-based payments are measured at fair value at the date of grant using a Monte Carlo simulation stock option valuation model. For the year of 2014, inputs into the model are as follows: 2014 Weighted average share price Weighted average fair value of options granted 3.50 Risk-free interest rates 1.80% Expected volatility 30.00% Dividend yield 2.10% Expected life 7.6 years The weighted average remaining contractual life of share options outstanding under the stock option compensation plans at 31 December 2015 was 5.3 years (2014: 6.3 years). During 2015 the Group adopted a performance share plan, under which senior managers are granted performance share awards, which have a three-year vesting period and are linked with Group-specific key performance indicators. Performance share awards are granted at a price equal to the closing price of the Company s shares trading on the London Stock Exchange on the day of the grant. The number of performance shares granted in 2015 and outstanding as at 31 December 2015 was 652,159. The fair value for the 2015 performance shares plan is 13.84m. Relevant inputs into the valuation are as follows: 2015 Weighted average share price Dividend yield 2.0% Weighted average vesting period 3.3 years The total charge to the income statement for employee performance shares awards for 2015 amounted to 0.1m (2014: nil). 149
152 Notes to the Consolidated Financial Statements continued 26. Business combinations and acquisition of non-controlling interests Acquisitions of non-controlling interests On 8 June 2011, the Board of Directors of the Company s subsidiary Nigerian Bottling Company plc ( NBC ) resolved to propose a scheme of arrangement between NBC and its minority shareholders involving the cancellation of part of the share capital of NBC. The transaction was approved by the Board of Directors and General Assembly of NBC on 8 June 2011 and 22 July 2011 respectively and resulted in the acquisition of the remaining 33.6% of the voting shares of NBC by Coca-Cola Hellenic Bottling Company S.A., bringing the Group s interest in NBC to 100%. The transaction was completed in September 2011 and NBC was de-listed from the Nigerian Stock Exchange. The consideration for the acquisition of non-controlling interests was 100.2m, including transaction costs of 1.8m, out of which 73.8m was paid as of 31 December 2015 (31 December 2014: 72.6m). The remaining amount of 26.4m has yet to be paid in respect of shares acquired as the sellers have yet to claim the cash consideration. This amount is currently held in a separate bank account in Nigeria awaiting claim (see Note 13). 27. Dividends The Board of Directors of Coca-Cola HBC AG has proposed a 0.40 dividend per share in respect of If approved by the shareholders of Coca-Cola HBC AG, this dividend will be paid in The shareholders of Coca-Cola HBC AG approved the dividend distribution of 0.36 per share at the Annual General Meeting held on 23 June The total dividend amounted to 132.4m and was paid on 28 July Of this an amount of 1.3m related to shares held by the Group. Dividends paid by the Group in 2015 to non-controlling interests in the emerging markets amounted to 0.2m. The shareholders of Coca-Cola HBC AG approved the dividend distribution of per share at the Annual General Meeting held on 25 June The total dividend amounted to 130.2m and was paid on 29 July Of this an amount of 1.2m related to shares held by the Group. Dividends paid by the Group in 2014 to non-controlling interests in the emerging markets amounted to 0.4m. 28. Financial risk management Financial risk factors The Group s activities expose it to a variety of financial risks: market risk (including foreign currency risk, interest rate risk, commodity price risk), credit risk, liquidity risk and capital risk. The Group s overall risk management programme focuses on the volatility of financial markets and seeks to minimise potential adverse effects on the Group s cash flows. The Group uses derivative financial instruments to hedge certain risk exposures. Risk management is carried out by Group Treasury in a controlled manner, consistent with the Board of Directors approved policies. Group Treasury identifies, evaluates and hedges financial risks in close cooperation with the Group s subsidiaries. The Board of Directors has approved the Treasury Policy and Chart of Authority, which together provide the control framework for all treasury and treasury-related transactions. Market risk Foreign currency risk The Group is exposed to the effect of foreign currency risk on future commercial transactions, recognised monetary assets and liabilities that are denominated in currencies other than the local entity s functional currency, as well as net investments in foreign operations. Foreign currency forward and option contracts are used to hedge a portion of the Group s foreign currency risk. The majority of the foreign currency forward and option contracts have maturities of less than one year after the balance sheet date. The foreign currency risk arising from the investment in foreign operations is not hedged. Management has set up a policy that requires Group companies to manage their foreign exchange risk against their functional currency. To manage their foreign exchange risk arising from future commercial transactions and recognised monetary assets and liabilities, entities in the Group use foreign currency forward and option contracts transacted by Group Treasury. Group Treasury s risk management policy is to hedge, on an average coverage ratio basis, between 25% and 80% of anticipated cash flows and 100% of balance sheet exposures in each major foreign currency without significant currency control for the next twelve months by using a layer strategy. Each subsidiary designates contracts with Group Treasury as fair value hedges or cash flow hedges, as appropriate. External foreign exchange contracts are designated at Group level as hedges of foreign exchange risk on specific monetary assets, monetary liabilities or future transactions on a gross basis. 150
153 Strategic Report Corporate Governance Financial Statements Supplementary Info & Swiss Statutory Reporting The following tables present details of the Group s sensitivity to reasonably possible increases and decreases in the Euro and US dollar against the relevant foreign currencies. In determining reasonable possible changes, the historical volatility over a twelve-month period of the respective foreign currencies in relation to the Euro and the US dollar has been considered. The sensitivity analysis determines the potential gains and losses in the income statement or equity arising from the Group s foreign exchange positions as a result of the corresponding percentage increases and decreases in the Group s main foreign currencies relative to the Euro and the US dollar. The sensitivity analysis includes outstanding foreign currency denominated monetary items, external loans, and loans between operations within the Group where the denomination of the loan is in a currency other than the functional currency of the local entity. The sensitivity analysis for exchange risk for 2015 and 2014 was as follows: 2015 exchange risk sensitivity analysis % of historical volatility over a 12-month period Euro strengthens against local currency Loss/(gain) in income statement (Gain)/loss in equity Euro weakens against local currency (Gain)/loss in income statement Loss/(gain) in equity Armenian dram 12.70% (0.1) 0.1 Belarusian rouble 27.69% (1.6) 2.9 Bulgarian lev 0.54% (0.1) 0.1 Croatian kuna 2.11% (0.1) (0.4) Czech koruna 3.41% (0.3) Hungarian forint 7.43% 0.1 (0.5) (0.1) 0.4 Moldovan leu 28.23% (2.2) (3.2) Nigerian naira 15.66% 2.8 (3.9) Polish zloty 7.13% 0.2 (1.8) Romanian leu 3.63% 0.2 (1.0) (0.2) 1.1 Russian rouble 28.12% 3.5 (11.5) (1.6) 1.2 Serbian dinar 3.41% 0.2 (0.2) Swiss franc 22.61% (0.8) (3.7) UK sterling 9.82% 0.7 (0.9) Ukrainian hryvnia 38.74% 5.7 (13.0) US dollar 12.26% (0.9) (2.3) 10.3 (14.9) (15.3) 3.9 % of historical volatility over a 12-month period US dollar strengthens against local currency Loss/(gain) in income statement (Gain)/loss in equity US dollar weakens against local currency (Gain)/loss in income statement Loss/(gain) in equity Euro 12.26% (0.5) 0.6 Nigerian naira 9.11% 1.2 (1.4) Romanian leu 12.43% 0.3 (0.4) Russian rouble 26.30% 5.4 (18.1) (0.6) 5.5 Serbian dinar 12.63% (0.1) 0.2 Ukrainian hryvnia 35.51% 0.6 (1.3) 6.9 (18.1) (2.9)
154 Notes to the Consolidated Financial Statements continued 28. Financial risk management continued 2014 exchange risk sensitivity analysis % of historical volatility over a 12-month period Euro strengthens against local currency Loss/(gain) in income statement (Gain)/loss in equity Euro weakens against local currency (Gain)/loss in income statement Loss/(gain) in equity Armenian dram 20.41% 0.6 (0.9) Belarusian rouble 11.03% (0.9) 1.2 Bulgarian lev 0.81% (0.1) 0.1 Croatian kuna 0.97% (0.1) 0.1 Czech koruna 2.37% 0.1 (0.3) (0.1) 0.4 Hungarian forint 6.50% (0.4) 0.4 Moldovan leu 8.16% (0.4) (0.7) Nigerian naira 11.68% 0.9 (1.1) Polish zloty 4.85% (0.1) (2.5) Romanian leu 3.18% 0.1 (1.1) (0.1) 1.2 Russian rouble 31.25% 1.3 (15.6) Serbian dinar 3.68% 0.2 (0.2) Swiss franc 1.93% (0.1) (0.9) UK sterling 5.85% (0.3) (3.4) Ukrainian hryvnia 32.32% 4.6 (8.9) US dollar 5.91% (1.4) (2.8) 5.2 (14.8) (5.5) 8.2 % of historical volatility over a 12-month period US dollar strengthens against local currency Loss/(gain) in income statement (Gain)/loss in equity US dollar weakens against local currency (Gain)/loss in income statement Loss/(gain) in equity Euro 5.91% (0.2) 0.2 Nigerian naira 9.71% 2.7 (3.3) Russian rouble 29.72% 6.3 (20.3) (5.0) 21.5 Ukrainian hryvnia 28.27% 2.6 (4.7) 11.4 (20.3) (12.8) 21.5 Commodity price risk The Group is affected by the volatility of certain commodity prices (being mainly sugar, aluminium, PET and gas oil) in relation to certain raw materials necessary for the production of the Group s products. Due to the significantly increased volatility of commodity prices, the Group s Board of Directors has developed and enacted a risk management strategy regarding commodity price risk and its mitigation. Although the Group continues to contract prices with suppliers in advance, to reduce its exposure to the effect of short-term changes in the price of sugar, aluminium and gas oil, the Group hedges the purchase price of sugar, aluminium and gas oil using commodity swap contracts based on a rolling 36 month forecast. The Group Treasury s Risk management policy is to hedge a minimum of 50% and a maximum of 80% of commodity exposure for the next twelve months. 152
155 Strategic Report Corporate Governance Financial Statements Supplementary Info & Swiss Statutory Reporting The following table presents details of the Group s income statement and equity sensitivity to increases and decreases in sugar, aluminium and gas oil prices. The table does not show the sensitivity to the Group s total underlying commodity exposure or the impact of changes in volumes that may arise from increase or decrease in the respective commodity prices. The sensitivity analysis determines the potential effect on profit or loss and equity arising from the Group s commodity swap contract positions as a result of the reasonably possible increases or decreases of the respective commodity price. The sensitivity analysis for sugar, aluminium and gas oil price risk was as follows: 31 December 2015 % of historical volatility over a 12-month period per contract maturity Commodity price increases with all other variables held constant (Gain)/loss in income statement (Gain)/loss in equity Commodity price decreases with all other variables held constant Loss/(gain in income statement Loss/(gain) in equity Sugar 19.9% (10.8) 10.8 Aluminium 18.3% (10.5) (1.3) Gas oil 33.4% (5.5) 5.5 (26.8) (1.3) December 2014 % of historical volatility over a 12-month period per contract maturity Commodity price increases with all other variables held constant (Gain)/loss in income statement (Gain)/loss in equity Commodity price decreases with all other variables held constant Loss/(gain in income statement Loss/(gain) in equity Sugar 12.2% (6.3) 6.3 Aluminium 18.4% (9.9) (3.6) Gas oil 17.1% (3.3) 3.3 (19.5) (3.6) Interest rate risk The sensitivity analysis in the following paragraph has been determined based on exposure to interest rates of both derivative and nonderivative instruments existing at the balance sheet date and assuming constant foreign exchange rates. For floating rate liabilities, the analysis is prepared assuming the amount of liability outstanding at the balance sheet date was outstanding for the whole year. A 100 basis point increase or decrease represents management s assessment of a reasonably possible change in interest rates. If interest rates had been 100 basis points higher and all other variables were held constant, the Group s profit or loss and equity for the year ended 31 December 2015 would have been affected by a 0.1m loss (2014: 0.2m loss) and by a 53.7m gain (2014: 45.4m gain) respectively. If interest rates had been 100 basis points lower and all other variables were held constant, the Group s profit and loss and equity for the year ended 31 December 2015 would have been affected by a 0.1m gain (2014: 0.2m gain) and by a 58.4m loss (2014: 49.5m loss) respectively. The limited impact to the Group s profit and loss is mainly attributable to the Group s minor exposure to interest rate fluctuations as the majority of outstanding debt is in the form of fixed rate bonds. The impact in the Group s equity is attributable to the changes in the fair value of the forward starting swaps entered into 2014 and used as cash flow hedging instruments, assuming 100% hedge effectiveness. Credit risk The Group has limited concentration of credit risk across trade and financial counterparties. Policies are in place to ensure that sales of products and services on credit are made to customers with an appropriate credit history. The Group has policies that limit the amount of credit exposure to any single financial institution. The Group s maximum exposure to credit risk in the event that counterparties fail to perform their obligations at 31 December 2015 in relation to each class of recognised financial asset is the carrying amount of those assets as indicated on the balance sheet. If credit is granted to customers, their credit quality is normally assessed using external agencies and historic experience. Credit limits are set accordingly. Further information regarding credit risk exposure is described in Note 11. With respect to derivative financial instruments, credit risk arises from the potential failure of counterparties to meet their obligations under the contract or arrangement. The Group s maximum credit risk exposure for each derivative instrument is the carrying amount of the derivative (refer to Note 7). In addition, the Group regularly makes use of money market funds and time deposits to invest temporarily excess cash balances and to diversify its counterparty risk. The money market funds have a minimum AAA rating and strict investment limits are set, per fund, depending on the size of the fund. As at 31 December 2015, the temporarily excess cash balance is invested in time deposits. 153
156 Notes to the Consolidated Financial Statements continued 28. Financial risk management continued The Group only undertakes investment and derivative transactions with banks and financial institutions that have a minimum credit rating of BBB- from Standard & Poor s and Baa3 from Moody s. The Group also uses Credit Default Swaps of a counterparty in order to measure in a more timely way the creditworthiness of a counterparty and set up its counterparties in tiers in order to assign maximum exposure and tenor per tier. If the Credit Default Swaps of certain counterparty exceed 400 basis points the Group will stop trading derivatives with that counterparty and will try to cancel any deposits on a best-effort basis. Liquidity risk The Group actively manages liquidity risk to ensure there are sufficient funds available for any short-term and long-term commitments. Bank overdrafts and bank facilities, both committed and uncommitted, are used to manage this risk. Ultimate responsibility for liquidity risk management rests with the Board of Directors, which has built an appropriate liquidity risk management framework for the management of the Group s short-, medium- and long-term funding and liquidity requirements. The Group manages liquidity risk by maintaining adequate cash reserves and committed banking facilities, access to the debt and equity capital markets, and by continuously monitoring forecasted and actual cash flows. In Note 14, the undrawn facilities that the Group has at its disposal to manage liquidity risk are discussed under the headings Commercial paper programme and committed credit facilities and Euro medium-term note programme. The following tables detail the Group s remaining contractual maturities for its financial liabilities. The tables include both interest and principal undiscounted cash flows, assuming that interest rates remain constant from 31 December up to 1 year 1-2 years 2-5 years over 5 years Borrowings Derivative liabilities Trade and other payables 1, As at 31 December , Borrowings Derivative liabilities Trade and other payables 1, As at 31 December , The Group hedges exposures to changes in the fair value of debt, as well as in the foreign exchange cash flows of debt, by using a combination of interest rate and cross currency swap contracts (refer to Notes 7 and 14). The impact of these instruments has been included in the aggregate interest and principal undiscounted cash flows related to the underlying borrowings presented above. Capital risk The Group s objectives when managing capital are to safeguard the Group s ability to continue as a going concern and to maintain an optimal capital structure to reduce the cost of capital. In order to maintain or adjust the capital structure, the Group may increase or decrease debt, issue or buy back shares, adjust the amount of dividends paid to shareholders, or return capital to shareholders. The Group s goal is to maintain a conservative financial profile. This is evidenced by the credit ratings maintained with Standard & Poor s and Moody s. In May 2015, Standard & Poor s changed the outlook from negative to stable and affirmed Coca-Cola HBC s BBB+ long-term, A2 short-term corporate credit ratings. In November 2015, Moody s changed the outlook from negative to stable and affirmed Coca-Cola HBC s Baa1 long-term, P2 short-term corporate credit ratings. The Group monitors its financial capacity and credit ratings by reference to a number of key financial ratios including net debt to comparable adjusted EBITDA, which provides a framework within which the Group's capital base is managed. This ratio is calculated as net debt divided by comparable adjusted EBITDA. The Group s current effort is to maintain the net debt to comparable adjusted EBITDA ratio within a 1.5 to 2.0 range. The ratios at 31 December 2015 and 2014 were as follows: Total borrowings (refer to Note 14) 1, ,104.9 Less: Cash and cash equivalents (refer to Note 13) (487.4) (636.3) Net debt 1, ,468.6 Operating profit before deductions for depreciation and impairment of property, plant and equipment, amortisation and impairment of intangible assets, employee share options and other non-cash items Restructuring costs Unrealised commodity derivatives Total comparable adjusted EBITDA Net debt/comparable adjusted EBITDA ratio
157 Strategic Report Corporate Governance Financial Statements Supplementary Info & Swiss Statutory Reporting Fair values of financial assets and liabilities For financial instruments such as cash, deposits, debtors and creditors, investments, loans payable to related parties, short-term borrowings (excluding the current portion of bonds and notes payable) and other financial liabilities (other than bonds and notes payable), carrying values are a reasonable approximation of their fair values. According to the fair value hierarchy, the financial instruments measured at fair value are classified as follows: Level 1 The fair value of available-for-sale listed equity securities is based on quoted market prices at 31 December The fair value of bonds is based on quoted market prices at 31 December Level 2 The fair value of foreign currency forward and option contracts, commodity swap contracts, interest rate swap contracts, forward starting swap contracts, embedded foreign currency derivatives and cross currency swap contracts is determined by using valuation techniques. These valuation techniques maximise the use of observable market data. The fair value of the foreign currency forward and option contracts, commodity swap contracts, embedded foreign currency derivatives and cross currency swap contracts is calculated by reference to quoted forward exchange, deposit rates and forward rate curve of the underlying commodity at 31 December 2015 for contracts with similar maturity dates. The fair value of interest rate option contracts is calculated by reference to the Black and Scholes valuation model and implied volatilities. The fair value of interest rate swap contracts is determined as the difference in the present value of the future interest cash inflows and outflows, based on observable yield curves. Level 3 The fair value of available-for-sale unlisted investments is determined through the use of estimated discounted cash flows. The following table provides the fair value hierarchy in which fair value measurements are categorised for assets and liabilities measured at fair value as at 31 December 2015: Level 1 Level 2 Level 3 Total Financial assets at FVTPL Foreign currency forward contracts Foreign currency option contracts Embedded derivatives Commodity swap contracts Derivative financial assets used for hedging Fair value hedges Foreign currency forward contracts Foreign currency option contracts Cash flow hedges Foreign currency forward contracts Foreign currency option contracts Available-for-sale financial assets Equity securities Total financial assets Financial liabilities at FVTPL Foreign currency forward contracts (1.5) (1.5) Commodity swap contracts (28.0) (28.0) Derivative financial liabilities used for hedging Cash flow hedges Foreign currency forward contracts (0.5) (0.5) Forward starting swap contracts (24.6) (24.6) Commodity swap contracts (0.8) (0.8) Total financial liabilities (55.4) (55.4) There were no material changes in fair value measurements for Level 3 items for the year ended 31 December There have been no transfers between Level 1 and Level 2 in the period. 155
158 Notes to the Consolidated Financial Statements continued 28. Financial risk management continued The following table provides the fair value hierarchy in which fair value measurements are categorised for assets and liabilities measured at fair value as at 31 December 2014: Level 1 Level 2 Level 3 Total Financial assets at FVTPL Foreign currency forward contracts Foreign currency option contracts Interest rate swap contracts Commodity swap contracts Derivative financial assets used for hedging Fair value hedges Foreign currency forward contracts Foreign currency option contracts Cash flow hedges Foreign currency forward contracts Foreign currency option contracts Commodity swap contracts Available-for-sale financial assets Equity securities Total financial assets Financial liabilities at FVTPL Foreign currency forward contracts (3.8) (3.8) Cross-currency swap contracts (34.3) (34.3) Commodity swap contracts (21.6) (21.6) Derivative financial liabilities used for hedging Cash flow hedges Foreign currency forward contracts (0.6) (0.6) Forward starting swap contracts (24.7) (24.7) Commodity swap contracts (1.3) (1.3) Total financial liabilities (86.3) (86.3) There were no material changes in fair value measurements for Level 3 items for the year ended 31 December There have been no transfers between Level 1 and Level 2 in the period. 156
159 Strategic Report Corporate Governance Financial Statements Supplementary Info & Swiss Statutory Reporting Offsetting financial assets and financial liabilities (a) Financial assets The following financial assets are subject to offsetting, enforceable master netting or similar agreements. As at 31 December 2015 Gross amounts of recognised financial assets Gross amounts of recognised financial liabilities set off in the balance sheet Net amounts of financial assets presented in the balance sheet Related amounts not set off in the balance sheet Financial instruments Cash collateral received Net amount Derivative financial assets (5.0) 18.5 Cash and cash equivalents Other current assets (54.9) Total 1,229.8 (54.9) 1,174.9 (5.0) 1,169.9 As at 31 December 2014 Gross amounts of recognised financial assets Gross amounts of recognised financial liabilities set off in the balance sheet Net amounts of financial assets presented in the balance sheet Related amounts not set off in the balance sheet Financial instruments Cash collateral received Net amount Derivative financial assets (17.3) 36.6 Cash and cash equivalents Other current assets (62.8) Total 1,437.5 (62.8) 1,374.7 (17.3) 1,357.4 (b) Financial liabilities The following financial liabilities are subject to offsetting, enforceable master netting or similar agreements. As at 31 December 2015 Gross amounts of recognised financial assets Gross amounts of recognised financial liabilities set off in the balance sheet Net amounts of financial assets presented in the balance sheet Related amounts not set off in the balance sheet Financial instruments Cash collateral pledged Net amount Derivative financial liabilities (5.0) 50.4 Other current liabilities (54.9) Total (54.9) (5.0) As at 31 December 2014 Gross amounts of recognised financial assets Gross amounts of recognised financial liabilities set off in the balance sheet Net amounts of financial assets presented in the balance sheet Related amounts not set off in the balance sheet Financial instruments Cash collateral pledged Net amount Derivative financial liabilities (17.3) (3.5) 65.5 Bank overdrafts Other current liabilities (62.8) Total (62.8) (17.3) (3.5) The Group enters into derivative transactions under International Swaps and Derivatives Association (ISDA) master netting agreements or other similar agreements. In general, under such agreements the counterparties can elect to settle into one single net amount the aggregated amounts owed by each counterparty on a single day in respect of all outstanding transactions of the same currency and the same type of derivative. In the event of default or early termination all outstanding transactions under the agreement are terminated and subject to any set-off. These agreements do not meet all of the IAS 32 criteria for offsetting in the statement of financial position, as the Group does not have any current legally enforceable right to offset amounts since the right can be applied if elected by both counterparties. 157
160 Notes to the Consolidated Financial Statements continued 29. Contingencies The Greek Competition Authority issued a decision on 25 January 2002, imposing a fine on Coca-Cola Hellenic Bottling Company S.A. (following the mergers now Coca-Cola HBC Holdings B.V.) of approximately 2.9m for certain discount and rebate practices and required changes to the Coca-Cola Hellenic Bottling Company S.A. s commercial practices with respect to placing coolers in certain locations and lending them free of charge. On 16 June 2004, the fine was reduced on appeal to 1.8m. On 29 June 2005, the Greek Competition Authority requested that Coca-Cola Hellenic Bottling Company S.A. provide information on its commercial practices as a result of a complaint by certain third parties regarding Coca-Cola Hellenic Bottling Company S.A s compliance with the decision of 25 January On 7 October 2005, Coca-Cola Hellenic Bottling Company S.A. was served with notice to appear before the Greek Competition Authority. On 14 June 2006, the Greek Competition Authority issued a decision imposing a daily penalty of 5,869 for each day that Coca-Cola Hellenic Bottling Company S.A. allegedly failed to comply with the decision of 25 January On 31 August 2006, Coca-Cola Hellenic Bottling Company S.A. deposited an amount of 8.9m, reflecting the amount of the fine and applicable tax, with the Greek authorities. As a result of this deposit, Coca-Cola Hellenic Bottling Company S.A. increased the charge to its 2006 financial statements in connection to this case. On 23 November 2007, the Court of Appeals partly reversed and partly upheld the decision of the Greek Competition Authority reducing the amount of the fine to 5.9 million. The reduction of the fine by 2.8m was recognised in Coca-Cola Hellenic Bottling Company S.A. s 2007 income statement. Coca-Cola Hellenic Bottling Company S.A. (following the mergers now Coca-Cola HBC Holdings B.V.) appealed the decision of the Court of Appeals to the extent it upheld the fine, to the Supreme Administrative Court of Greece. The Greek Competition Authority and one of Coca-Cola Hellenic Bottling Company S.A. s competitors also appealed the decision of the Court of Appeals to the extent that it reduced the fine. On 7 July 2015, the Supreme Administrative Court of Greece rejected our appeal against the decision of the Court of Appeals, as well as the counter-appeals which had been filed by the Greek Competition Authority and one of our competitors. Following this development, the case is closed. In relation to the Greek Competition Authority s decision of 25 January 2002, one of Coca-Cola Hellenic Bottling Company S.A. s competitors has filed a lawsuit against Coca-Cola Hellenic Bottling Company S.A. claiming damages in an amount of 7.7m. The court of first instance heard the case on 21 January 2009 and subsequently rejected the lawsuit. The plaintiff has appealed the judgement and on 9 December 2013 the Athens Court of Appeals rejected the plaintiff s appeal. The plaintiff has the right to file a petition for cessation against the Athens Court of Appeal s decision before the Supreme Court. Following the spin off, Coca-Cola HBC Greece S.A.I.C. substituted Coca-Cola Hellenic Bottling Company S.A. as defendant in this lawsuit. Coca-Cola HBC Greece S.A.I.C. has not provided for any losses related to this case. On 19 April 2014, the same plaintiff filed a new lawsuit against Coca-Cola Hellenic Bottling Company S.A. (following the spin-off Coca-Cola HBC Greece S.A.I.C.) claiming payment of 7.5m as compensation for losses and moral damages for alleged anti-competitive commercial practices of Coca-Cola Hellenic Bottling Company S.A. between 1994 and The two lawsuits partially overlap in the time period for which damages are sought by the plaintiff and therefore, it is assumed that the plaintiff will not file a petition for cessation before the Supreme Court against the Athens Court of Appeal decision issued in relation to the initial lawsuit. The hearing of the new lawsuit is scheduled for 18 December Coca-Cola HBC Greece S.A.I.C. has not provided for any losses related to this case. On 1 February 2012, the Greek Competition Commission conducted an inspection of Coca-Cola Hellenic Bottling Company S.A. s (following the spin-off Coca-Cola HBC Greece S.A.I.C.) operations as part of an investigation to our commercial practices in recent years into the sparkling, juice and water categories. Coca-Cola HBC Greece S.A.I.C., by which the production, bottling and distribution division of Coca-Cola Hellenic Bottling Company S.A. was absorbed, has a policy of strict compliance with Greek and EU competition law and it is cooperating fully with the Greek Competition Commission. In 1992, our subsidiary Nigerian Bottling Company ( NBC ) acquired a manufacturing facility in Nigeria from Vacunak, a Nigerian Company. In 1994, Vacunak filed a lawsuit against NBC, alleging that a representative of NBC had orally agreed to rescind the sale agreement and instead enter into a lease agreement with Vacunak. As part of its lawsuit Vacunak sought compensation for rent and loss of business opportunities. NBC discontinued all use of the facility in On 19 August 2013, NBC received the written judgement of the Nigerian court of first instance issued on 28 June 2012 providing for damages of approximately 38.5m. NBC has filed an appeal against the judgement. Based on advice from NBC s outside legal counsel, we believe that it is unlikely that NBC will suffer material financial losses from this case. We have consequently not provided for any losses in relation to this case. The tax filings of the Group and its subsidiaries are routinely subjected to audit by tax authorities in most of the jurisdictions in which the Group conducts business. These audits may result in assessments of additional taxes. The Group provides additional tax in relation to the outcome of such tax assessments, to the extent that a liability is probable and estimable. The Group is also involved in various other legal proceedings. Management believes that any liability to the Group that may arise as a result of these pending legal proceedings will not have a material adverse effect on the results of operations, cash flows, or the financial position of the Group taken as a whole. 158
161 Strategic Report Corporate Governance Financial Statements Supplementary Info & Swiss Statutory Reporting 30. Commitments (a) Operating leases The total of future minimum lease payments under non-cancellable operating leases at 31 December was as follows: Less than one year Later than one year but less than five years Later than five years Future minimum lease payments The total operating lease charges included within operating expenses for the years ended 31 December were as follows: Plant and equipment Property Total operating lease charges (b) Capital commitments At 31 December 2015 the Group had capital commitments amounting to 70.5m (2014: 81.0m). Of this, nil related to the Company s share of the commitments arising from joint operations (2014: 5.5m). (c) Long-term commitments At 31 December 2015 the Group had commitments to purchase raw materials and receive services amounting to 542.8m (2014: 434.6m). 31. Directors and senior management remuneration The total remuneration paid to or accrued for Directors and the senior management team for 2015 amounted to 18.2m (2014: 18.7 million). Salaries and other short-term benefits amounted to 12.3m (2014: 10.7m). Out of the total remuneration, the amount accrued for stock option and performance shares grants during 2015 was 5.1m (2014: 7.4m). Pension and post-employment benefits for Directors and senior management during 2015 amounted to 0.8m (2014: 0.6m). 159
162 Notes to the Consolidated Financial Statements continued 32. Related party transactions (a) The Coca-Cola Company As at 31 December 2015, The Coca-Cola Company indirectly owned 23.1% (2014: 23.1%) of the issued share capital of Coca-Cola HBC. The Coca-Cola Company considers Coca-Cola HBC to be a key bottler and has entered into bottlers agreements with Coca-Cola HBC in respect of each of the Group s territories. All the bottlers agreements entered into by The Coca-Cola Company and Coca-Cola HBC are Standard International Bottlers ( SIB ) agreements. The terms of the bottlers agreements grant Coca-Cola HBC the right to produce and the exclusive right to sell and distribute the beverages of The Coca-Cola Company in each of the countries in which the Group operates. Consequently, Coca-Cola HBC is obliged to purchase all concentrate for The Coca-Cola Company s beverages from The Coca-Cola Company, or its designee, in the ordinary course of business. On 10 October 2012, The Coca-Cola Company agreed to extend the term of the bottlers agreements for a further ten years until On 29 December 2008, Kar-Tess Holding and The Coca-Cola Company agreed to extend their existing shareholders agreement, whereby the combined shareholdings of Kar-Tess Holding and The Coca-Cola Company in Coca-Cola Hellenic Bottling Company S.A. will not fall below 44% for the period up to January 2014 and not below 40% for the period thereafter until 31 December However, on 22 February 2013, Coca-Cola HBC announced that the shareholders agreement of Kar-Tess Holding and The Coca-Cola Company would be terminated upon settlement of the voluntary share exchange offer and will not be renewed in relation to Coca-Cola HBC. The Coca-Cola Company owns or has applied for the trademarks that identify its beverages in each of the countries in which the Group operates. The Coca-Cola Company has authorised Coca-Cola HBC and certain of its subsidiaries to use the trademark Coca-Cola in their corporate names. Total purchases of concentrate, finished products and other materials from The Coca-Cola Company and its subsidiaries during 2015 amounted to 1,355.0m (2014: 1,381.1m). The Coca-Cola Company makes discretionary marketing contributions to Coca-Cola HBC s operating subsidiaries. The participation in shared marketing agreements is at The Coca-Cola Company s discretion and, where cooperative arrangements are entered into, marketing expenses are shared. Such arrangements include the development of marketing programmes to promote The Coca-Cola Company s beverages. Total net contributions received from The Coca-Cola Company for marketing and promotional incentives during the year amounted to 89.5m (2014: 78.7m). Contributions for price support and marketing and promotional campaigns in respect of specific customers are recorded in net sales revenue as an offset to promotional incentives paid to customers. In 2015, such contributions totalled 46.2m (2014: 44.1m). Contributions for general marketing programmes are recorded as an offset to selling expenses. In 2015, such contributions made by The Coca-Cola Company to Coca-Cola HBC totalled 43.4m (2014: 36.3m) and the contributions of Coca-Cola HBC to The Coca-Cola Company totalled 0.1m (2014: 1.7m). The Coca-Cola Company has also customarily made additional payments for marketing and advertising directly to suppliers as part of the shared marketing arrangements. The proportion of direct and indirect payments, made at The Coca-Cola Company s discretion, will not necessarily be the same from year to year. In addition, there were support payments received from The Coca-Cola Company for the placement of cold drinks equipment for the year ended 31 December 2015 of 0.5m (2014: 0.3m). During the year, the Group sold 9.1m of finished goods and raw materials to The Coca-Cola Company (2014: 28.1m). Other income primarily comprises rent, facility and other items of 6.6m (2014: 4.0m) and a toll-filling relationship in Poland of nil (2014: 14.2m). Other expenses related to facility costs charged by The Coca-Cola Company and shared costs included in operating expenses amounted to 4.1m (2014: 3.2m). Coca-Cola HBC agreed on 4 April 2014 to assume control through ZAO Multon ( Multon ), of the Moya Semya brands from The Coca-Cola Company in the Russian Federation and Belarus. The Coca-Cola Company holds 23.1% of the issued share capital of the Company and a 50% economic interest in Multon. The Moya Semya brands are managed through the Multon Juice business in Russia. The Company paid US$19.0m ( 14.1m) to The Coca-Cola Company as consideration to acquire an effective 50% economic interest in the Moya Semya brands. As at 31 December 2015, the Group had a total amount due from The Coca-Cola Company of 72.4m (2014: 88.2m), and a total amount due to The Coca-Cola Company of 216.8m including loans payable of 13.5m (2014: total payables 222.3m with loans payable 7.3m). (b) Frigoglass S.A. ( Frigoglass ), Kar-Tess Holding and A.G Leventis (Nigeria) Plc Truad Verwaltungs AG, currently indirectly owns 44.4% of Frigoglass and 50.8% of AG Leventis (Nigeria) PLC and also indirectly controls Kar-Tess Holding, which holds approximately 23.2% (2014: 23.2%) of Coca-Cola HBC s total issued capital. Frigoglass, a company listed on the Athens Exchange, is a manufacturer of coolers, cooler parts, glass bottles, crowns and plastics. Frigoglass has a controlling interest in Frigoglass Industries Limited, a company in which the Group has a 23.9% effective interest, through its investment in Nigerian Bottling Company Ltd (refer to Note 6). Furthermore during 2015 the Group acquired through its investment in Nigerian Bottling Company Ltd a 23.9% effective interest in Frigoglass West Africa Ltd., a company in which Frigoglass has a controlling interest (refer to Note 6). 160
163 Strategic Report Corporate Governance Financial Statements Supplementary Info & Swiss Statutory Reporting The Group entered into a supply agreement with Frigoglass for the purchase of cooling equipment in The supply agreement was extended in 2004, 2008 and most recently, in 2013, on substantially similar terms. Coca-Cola HBC has the status of most favoured customer of Frigoglass, on a non-exclusive basis, provided that it obtains at least 60% (at prices which are negotiated on an annual basis and which must be competitive) of its annual requirements for cooling equipment from Frigoglass. The current agreement expires on 31 December During 2015, the Group made purchases of 101.7m (2014: 91.4m) of coolers, cooler parts, glass bottles, crowns and raw and plastics from Frigoglass and its subsidiaries and incurred maintenance and other expenses of 14.8m (2014: 14.1m). In addition, the Group recorded other income of 0.8m (2014: 0.1m). As at 31 December 2015, Coca-Cola HBC owed 23.6m (2014: 12.1m) to, and was owed 0.6m (2014: 0.4m) by, Frigoglass. During 2015, the Group purchased 18.8m (2014: 7.3m) of finished goods and other materials from AG Leventis (Nigeria) PLC. Furthermore, the Group incurred rental expenses of 1.7m (2014: 0.9m) and other expenses of 2.8m (2014: 1.1m) from AG Leventis (Nigeria) PLC. As at 31 December 2015, the Group owed 1.2m (2014: 3.8m) to, and was owed 1.9m (2014: 0.7m) by, AG Leventis (Nigeria) PLC. (c) Directors Mr. George A. David, Mr. Anastassis G. David, Mr. Anastasios I. Leventis and Mr. Christo Leventis have all been nominated by Kar-Tess Holding to the Board of Coca-Cola HBC. Mr Irial Finan and Mr José Octavio Reyes were originally nominated by TCCC to the Board of Coca-Cola HBC. There have been no transactions between Coca-Cola HBC and the Directors except for remuneration (refer to Note 31). (d) Other Beverage Partners Worldwide ( BPW ) BPW is a 50/50 joint venture between The Coca-Cola Company and Nestlé. During 2015, the Group purchased inventory from BPW amounting to 82.9m (2014: 79.0m). As at 31 December 2015, Coca-Cola HBC owed 5.8m (2014: 3.6m) to and was owed 5.4m (2014: 0.9m) by, BPW. Leventis Overseas Leventis Overseas was related to Coca-Cola HBC by way of common directors up until 25 June 2014, as a result of which significant influence was considered to exist up until that date. From 1 January 2014, up until 25 June 2014, the Group purchased 1.6m of finished goods and other materials from Leventis Overseas. Other related parties During 2015, the Group recorded sales of finished goods of 0.3m to other related parties (2014: 0.3m) and purchased 3.8m (2014: 10.8m) of raw materials and finished goods from other related parties. In addition, during 2015, the Group incurred expenses of 24.5m (2014: 29.2m) mainly related to maintenance services for cold drinks of equipment and installations of coolers, fountains, vending and merchandising equipment from other related parties. Furthermore, during 2015, the Group acquired 2.3m in tangible fixed assets from other related parties (2014: 1.4m). In addition, during 2015, the Group recorded income of 0.4m (2014: 0.5m) while 0.7m was received as reimbursements for direct marketing expenses (2014: 0.2m). At 31 December 2015, the Group owed 0.5m (2014: 5.1m) to and was owed 0.4m including loans receivables of 0.1m (2014: 1.6m including loans receivables of 0.2m) by, other related parties. (e) Joint ventures The Group purchased 49.0m of finished goods (2014: 56.5m) and recorded sales of finished goods and raw materials of 11.9m (2014: 0.7m) from joint ventures. In addition, the Group received reimbursement for direct marketing expenses incurred of 0.6m for the year (2014: 0.3m). Furthermore, the Group incurred other expenses of 0.6m (2014: 0.9m) and recorded other income of 2.5m (2014: 2.7m) from joint ventures. In addition, the Group acquired 1.2m in tangible fixed assets from joint ventures in 2015 (2014: nil). As at 31 December 2015, the Group owed 42.2m including loans payable of 17.4m (2014: 163.7m including loans payable 150.2m) to and was owed 13.0m including loans receivable of 7.9m (2014: 17.4m including loans receivable of 5.1m) by joint ventures. During 2015 the Group received dividends of 119.6m from Brewinvest S.A. group of companies. There are no significant transactions with other related parties for the year ended 31 December
164 Notes to the Consolidated Financial Statements continued 33. List of principal Group companies The following are the principal Group companies as at 31 December: % of voting rights % ownership Country of registration AS Coca-Cola HBC Eesti Estonia 100.0% 100.0% 100.0% Brewinvest S.A. Group 1,2 Greece 50.0% 50.0% 50.0% BrewTech B.V. Group 1 The Netherlands 50.0% 50.0% 50.0% CC Beverages Holdings II B.V. The Netherlands 100.0% 100.0% 100.0% CCB Management Services GmbH Austria 100.0% 100.0% 100.0% CCHBC Armenia CJSC Armenia 90.0% 90.0% 90.0% CCHBC Bulgaria AD Bulgaria 99.4% 99.4% 99.4% CCHBC Insurance (Guernsey) Limited Guernsey 100.0% 100.0% 100.0% CCHBC IT Services Limited Bulgaria 100.0% 100.0% 100.0% Coca-Cola Beverages Austria GmbH Austria 100.0% 100.0% 100.0% Coca-Cola Beverages Belorussiya Unitary Enterprise Belarus 100.0% 100.0% 100.0% Coca-Cola HBC Ceska republika, s.r.o. Czech Republic 100.0% 100.0% 100.0% Coca-Cola Beverages Ukraine Ltd Ukraine 100.0% 100.0% 100.0% Coca-Cola Bottlers Chisinau S.R.L. Moldova 100.0% 100.0% 100.0% Coca-Cola Bottlers lasi Srl Romania 99.2% 99.2% 99.2% Coca-Cola Bottling Company (Dublin) Limited 3 Republic of Ireland 100.0% Coca-Cola HBC-Srbija d.o.o. Serbia 100.0% 100.0% 100.0% Coca-Cola HBC B-H d.o.o. Sarajevo Bosnia and Herzegovina 100.0% 100.0% 100.0% Coca-Cola HBC Finance B.V. The Netherlands 100.0% 100.0% 100.0% Coca-Cola HBC Finance plc England and Wales 100.0% 100.0% 100.0% Coca-Cola HBC Greece S.A.I.C. Greece 100.0% 100.0% 100.0% Coca-Cola HBC Holdings B.V. The Netherlands 100.0% 100.0% 100.0% Coca-Cola HBC Hrvatska d.o.o. Croatia 100.0% 100.0% 100.0% Coca-Cola HBC Hungary Ltd Hungary 100.0% 100.0% 100.0% Coca-Cola HBC Ireland Limited Republic of Ireland 100.0% 100.0% 100.0% Coca-Cola HBC Italia S.r.l. Italy 100.0% 100.0% 100.0% Coca-Cola HBC Kosovo L.L.C. Kosovo 100.0% 100.0% 100.0% Coca-Cola HBC Northern Ireland Limited Northern Ireland 100.0% 100.0% 100.0% Coca-Cola HBC Polska sp. z.o.o. Poland 100.0% 100.0% 100.0% Coca-Cola HBC Romania Ltd Romania 100.0% 100.0% 100.0% Coca-Cola HBC Slovenija d.o.o. Slovenia 100.0% 100.0% 100.0% Coca-Cola HBC Slovenska republika s.r.o. Slovakia 100.0% 100.0% 100.0% Coca-Cola HBC Switzerland Ltd Switzerland 99.9% 99.9% 99.9% Coca-Cola Hellenic Bottling Company-Crna Gora d.o.o., Podgorica Montenegro 100.0% 100.0% 100.0% Coca-Cola Hellenic Business Service Organisation Bulgaria 100.0% 100.0% 100.0% Coca-Cola Hellenic Procurement GmbH Austria 100.0% 100.0% 100.0% Deepwaters Investments Ltd Cyprus 50.0% 50.0% 50.0% Lanitis Bros Ltd Cyprus 100.0% 100.0% 100.0% 162
165 Strategic Report Corporate Governance Financial Statements Supplementary Info & Swiss Statutory Reporting % of voting rights % ownership Country of registration LLC Coca-Cola HBC Eurasia Russia 100.0% 100.0% 100.0% MTV West Kishinev Bottling Company S.A. 4 Moldova 100.0% Multon Z.A.O. Group 5 Russia 50.0% 50.0% 50.0% Nigerian Bottling Company Ltd Nigeria 100.0% 100.0% 100.0% SIA Coca-Cola HBC Latvia Latvia 100.0% 100.0% 100.0% Star Bottling Limited Cyprus 100.0% 100.0% 100.0% Star Bottling Services Corp. British Virgin Islands 100.0% 100.0% 100.0% Tsakiris S.A. Greece 100.0% 100.0% 100.0% UAB Coca-Cola HBC Lietuva Lithuania 100.0% 100.0% 100.0% Valser Services AG Switzerland 99.9% 99.9% 99.9% Yoppi Hungary Kft. Hungary 100.0% 100.0% 100.0% 1. Joint venture. 2. On 27 October 2014, Brewmasters Holdings Ltd., a subsidiary of Brewinvest S.A., and joint venture with Heineken, sold its participation in Zagorka A.D. to Heineken. 3. On 3 October 2015, Coca-Cola Bottling Company (Dublin) Limited was dissolved. 4. On 6 November 2015, MTV West Kishinev Bottling Company S.A. merged with Coca-Cola Bottlers Chisinau S.R.L. 5. Joint operation. 34. Post-balance sheet events In December 2015, the Group signed an agreement for the acquisition of Neptūno Vandenys, UAB, the leading bottled water company in Lithuania. The acquisition is subject to customary closing conditions, including relevant regulatory approvals, and is expected to be completed towards the end of the first quarter of During the first months of 2016 the Group incurred 2.3m of restructuring costs before tax, 0.8m in its established, 0.6m in its developing and 0.9m in its emerging markets. On 3 March 2016, Coca-Cola HBC AG s subsidiary Coca-Cola HBC Finance B.V. issued a fixed rate bond of 600m due 11 November 2024, under the Group s 3.0bn Euro medium-term note programme. The coupon rate of the new bond is 1.875% which, including the amortisation of the loss on the forward starting swap contracts (see Note 7) over the term of the fixed rate bond, results in an effective interest rate of 2.99%. The new bond is guaranteed by Coca-Cola HBC AG and Coca-Cola HBC Holdings B.V. The proceeds from the bond issue will be mainly used for the repayment of existing bonds. On the same date, Coca-Cola HBC Finance B.V announced a tender offer for its bonds maturing in November 2016, resulting in a reduction in their nominal value by approximately 214.6m. On 16 March 2016 the Board of Directors granted 716,270 performance share plan awards under the performance share plan, which have a three-year vesting period. The ongoing tensions and market changes in Ukraine and the Russian Federation have adversely impacted the economies of these countries, and among other things, have resulted in increased volatility in currency markets, causing the Russian rouble and the Ukrainian hryvnia to depreciate significantly against some major currencies. Management continuously monitors and assesses the situation in order to ensure that timely actions and initiatives are undertaken to minimise potential adverse impact on the Company s performance. The macroeconomic and financial environment in Greece remains fragile. The recent developments relating to the instability of the Greek banking sector and the resulting imposition of capital controls restricting the movement of funds out of Greece are anticipated to further impact consumers disposable income which may adversely affect the Group s operations in Greece for Our 2015 revenues for Greece amounted to 6% of consolidated net sales revenues and our 2015 non-current assets for the territory amounted to 3% of the consolidated non-current assets. We are continuously monitoring developments in Greece. As at 31 December 2015, cash and cash equivalents of 7.2 million were subject to capital controls. Furthermore, in Nigeria, the introduction of tight capital controls and the pegging of the naira to the USD at a rate that may not be reflecting the supply and demand rate for the currency may result in volatility in the local currency. We are continuously monitoring and assessing the situation and we are taking timely actions to secure the smooth operation of our business in this challenging environment and to minimise any adverse impact of a potential currency devaluation on the Group s performance. 163
166 Sustainability assurance statement Independent Assurance Statement on the 2015 Integrated Annual Report To the management and stakeholders of Coca-Cola Hellenic Bottling Company AG: denkstatt GmbH was commissioned by Coca-Cola Hellenic Bottling Company AG (hereinafter referred to as the Company ) to provide independent third-party assurance, in accordance with the AA1000 Assurance Standard (AA1000AS), for the printed and downloadable pdf versions of the Company s 2015 Integrated Annual Report (hereinafter referred to as the Report ). We have reviewed all sustainability-related content and data included in the Report. Financial data were not reviewed as part of this process. The assurance engagement covered the nature and extent of the Company s incorporation of the principles of inclusivity, materiality and responsiveness for stakeholder dialogue contained in the AA1000 Series. The extent of application of the Global Reporting Initiative (GRI G4), the GRI G4 Food Processing Sector Supplement and the CDSB Climate Change Reporting Framework have been verified. Management responsibilities The Company s management is responsible for preparing the Report and related website content, and the information and statements within it. They are responsible for identifying stakeholders and material issues, defining commitments with respect to sustainability-related performance, and for establishing and maintaining appropriate performance management and internal control systems from which reported information is derived. The Company s management is also responsible for establishing data collection and internal control systems to ensure reliable reporting, specifying acceptable reporting criteria and selecting data to be collected for the purposes of the Report. Management responsibilities also extend to preparing the Report in accordance with the GRI G4 Sustainability Reporting Guidelines. Assurance provider s responsibilities Our responsibilities are to: express our conclusions and make recommendations on the nature and extent of the Company s adherence to the AA1000 Accountability Principles Standard (AA1000APS); express our conclusions on the reliability of the information in the Report, and whether it is in accordance with the criteria in the GRI G4 guidelines; and express our conclusions and make recommendations on the nature and extent of the Company s adherence to the CDSB Climate Change Reporting Framework. Our team of experts has extensive professional experience of assurance engagements related to non-financial information and sustainability management, meaning it is qualified to conduct this independent assurance engagement. During 2015 we did not perform any tasks or services for the Company or other clients which would lead to a conflict of interest, nor were we responsible for the preparation of any part of the Report. Scope, standards and criteria used We have fulfilled our responsibilities to provide appropriate assurance that the information in the Report is free of material misstatements. We planned and carried out our work based on the GRI G4 guidelines, the AA1000 Series and the CDSB Climate Change Reporting Framework. We used the criteria in AA1000APS to perform a Type 2 engagement and to provide high assurance regarding the nature and extent of the Company s adherence to the principles of inclusivity, materiality and responsiveness. Methodology, approach, limitations and scope of work We planned and carried out our work in order to obtain all the evidence, information and explanations that we considered necessary in relation to the above responsibilities. Our work included the following procedures, which involved a range of evidence-gathering activities: Gathering information and conducting interviews with members of the Executive Management, staff from the Sustainability, Human Resources, Procurement, Product Quality and Safety, and Public Affairs and Communication departments, as well as various Group-level functional managers, regarding the Company s adherence to the principles of inclusivity, materiality and responsiveness. This includes the commitment of the Company s management to the principles, the existence of systems and procedures to support adherence to the principles, and the embedding of the principles at country level. Key topics of the interviews conducted at Group level included: employee engagement, diversity management, the environment, supplier engagement, business ethics and anti-corruption, community trust and the materiality assessment process, and healthy and safe products. Conducting further interviews at national headquarters in Austria, Bosnia and Herzegovina, Hungary, Italy, Northern Ireland, Nigeria, Russia, Serbia and Ukraine, in order to guarantee the completeness of the information required for the audit. Site visits to eleven bottling plants, with a focus on emerging markets: Established markets: Nogara (Italy), Edelstal (Austria), Knockmore Hill (Northern Ireland) Developing markets: Dunaharaszti (Hungary) Emerging markets: Benin and Owerri (Nigeria), Samara and Vladivostok (Russia), Kiev (Ukraine), Sarajevo (Bosnia and Herzegovina) and Belgrade (Serbia) Making enquiries and conducting spot checks to assess implementation of the Company s policies (at plant, country and corporate level). Making enquiries and conducting spot checks with regard to selected documentation required to assess the current data collection systems and the procedures implemented to ensure reliable and consistent reporting by the plants to the corporate level. Conducting additional interviews with seven representatives of the following external stakeholder groups: customers, suppliers, academia and non-governmental organisations. The interviews were conducted as part of The Coca-Cola Company s Joint Stakeholder Forum during the EXPO in Milan. Verifying all three inventory scopes (scopes 1, 2 and 3) as defined by the GHG Protocol, including progress against emission reduction targets, reported changes in emissions compared with the base year (2010) and emissions intensity figures for Verifying the GRI index in the Report to ensure consistency with the requirements of GRI G4 (comprehensive). The scope of the assurance covered all of the information relevant to sustainability in the Report and focused on Company systems and activities during the reporting period. The following chapters were not covered in the sustainability assurance process: Corporate Governance, Financial Statements, Supplementary Information and Swiss Statutory Reporting. 164
167 Strategic Report Corporate Governance Financial Statements Supplementary Info & Swiss Statutory Reporting Positive developments Business ethics and anti-corruption: new organisational measures have been introduced, such as national ethics and compliance committees, the Approval Portal, the Speak Up whistleblowing hotline and the Compliance Week. Furthermore, targeted training approaches have been developed for both high-risk and low-risk employees. Risk management: sustainability-related criteria have been integrated into risk management tools used at country and plant level, forming a structured and coherent approach to deal with various risks within the 4C strategic framework. The Company has committed to adopt its environmental targets for minimising water and energy consumption and reducing packaging waste. For the carbon footprint, science-based emission reduction targets (Sectoral Decarbonisation Approach, SDA) have been applied. True costing/accounting for Sustainability approach: the Company has developed a new method for the financial evaluation of capital projects including the true cost of water, water scarcity and internal carbon pricing. This methodology, known as Accounting for Sustainability (A4S), also includes social criteria such as job creation, health and safety and cultural heritage. Employee engagement survey: the survey methodology is solid and transparent. Group-wide results were very positive overall and an improvement was observed in the three major indices (engagement/value/ambassador). Various responsive measures (action plans, workshops, etc.) have been identified across all operations to address the challenges identified by the survey. Health and safety: the strategic importance of health and safety is reflected in the positive development of various indicators, such as the number of fatalities or lost time of over one day due to accidents. Findings and conclusions concerning adherence to the AA1000 principles of inclusivity, materiality and responsiveness, and specific performance-related information Inclusivity Group level: the Company maintains a comprehensive and efficient Group-level stakeholder engagement process. Its cornerstones are the annual internal and external stakeholder survey and the Annual Stakeholder Forum (held in Milan in 2015). In 2015 external stakeholders were interviewed for the first time as part of the assurance audit. Country and plant level: various stakeholder management tools are used at country (e.g. stakeholder mapping tool) and plant level (e.g. stakeholder map and engagement plan). These give decision-makers a concise overview of key social actors and their demands, and help them define tailored engagement strategies. Materiality Group level: there is a highly developed materiality assessment process which efficiently monitors and integrates stakeholder expectations, and also integrates factors from the Group risk universe. The result of this process is described in the Report, in the chapter entitled Managing Our Material Issues. Country and plant level: there is generally a clear understanding of the sustainability issues that are, or might become, material for the different operations. However, in most locations, these are not identified as part of a systematic materiality assessment process, but rather pragmatically in the course of day-to-day business. Implementation of materiality assessment processes at country level is therefore recommended. Responsiveness Country level: clearly explained stakeholder engagement plans exist at country level and, in a few cases, at plant level as well. However, these mostly target selected stakeholder groups that are the most powerful and/or of the greatest interest for the Company. In this respect, a more holistic approach is recommended: regular stakeholder forums should be organised where all stakeholders have the chance to meet, discuss key sustainabilityrelated challenges and collaborate in an effort to identify solutions. There are a variety of excellent community engagement projects, both at country and plant level. They take specific local circumstances into account and are also clearly aligned with the Group s community development focus areas. Excellent examples of environmental and social impact assessments have been identified in the course of the audit (e.g. Austria, Bosnia and Herzegovina, Italy and Russia). Additional conclusions and recommendations Traceability is partially lacking in connection with some community investment key performance indicators. As a result, data reporting systems need to be adapted so that these data become fully traceable and reliable. The quality of human resources data especially for employee training and education varies from country to country, often due to different interpretations of certain indicators. Consequently, there is a need to ensure a clear and uniform understanding of indicators across all operations. The updated white book on HR indicators should support this process. Supplier engagement is currently in the process of becoming more standardised in terms of sustainability-related criteria. The Company needs to ensure that staff in all operations are familiar with and use recently developed tools (e.g. the ESG pre-assessment template). Awareness of the new Speak Up whistleblowing hotline needs to be raised throughout the Group. The Company should ensure that all employees know when and how to make use of this mechanism. Typical risks related to the Code of Business Conduct and the Anti-Bribery Policy vary widely from region to region. In order to address these risks as efficiently as possible, specific local conditions have to be taken into account in the development of policies, training approaches and reporting mechanisms. There is a need for increased awareness of how the Health and Wellness Policy, particularly the chapter on responsible sales and marketing, are considered in the implementation of community involvement projects. The Company needs to assess whether all initiatives are aligned with these policies, as well as with UNESDA membership. Providing consumers with a choice of healthy products is one of the key goals of CCHBC. To further strengthen its position as a sustainability leader in the sector, the Company needs to focus more closely on this topic in the future. Vienna, 12 March 2016 denkstatt GmbH Consultancy for Sustainable Development Willibald Kaltenbrunner Lead Auditor Managing Partner, denkstatt 165
168 Coca-Cola HBC 2015 GRI Indicators List This section forms part of the Coca-Cola HBC 2015 Integrated Annual Report and provides more detail to internal and external stakeholders on the Company s sustainability-related policies, programmes and performance. It follows the guidance of the Global Reporting Initiative (GRI) and more specifically the G4 sustainability reporting guidelines. As part of the Integrated Annual Report, this report also serves as our Communication on Progress (COP) to the United Nations Global Compact. Materiality and stakeholder engagement Understanding, considering and addressing the insights of our stakeholders related to economic, environmental and social issues is key to ensuring sustainable growth for Coca-Cola HBC. For this, we rely on direct inputs from our internal and external stakeholders, through proactive engagement, collaboration and partnership on business strategies and processes. We also conduct ongoing trend analysis, research and monitoring of broader national and international socio-economic and sustainable developments that, over time, may affect how we create value. We survey both our internal and external stakeholders annually, asking them to prioritise our material issues on a scale of 1-10, ranging from not important to highly important. Close to 300 internal business leaders in 28 countries and the central functions were asked to rank the issues based on their significance and potential to impact our business. Over 500 external stakeholders were identified in diverse groups in each of our countries and the Group, and asked to rank the same issues based on how important each issue is to their decision-making. In the surveys we also provide opportunity for all stakeholders to propose additional issues and comment on our stakeholder engagement approach and methods. The materiality matrix on page 21 of this report has been compiled based on the outcome of these surveys, showing the importance of the issues to external stakeholders decision-making on the vertical, and the potential impact of the issues on our business on the horizontal axis. The materiality assessment process also includes input from the Group Business Resilience function, and the matrix has been validated by the Sustainability Steering Committee, key internal business leaders and the Social Responsibility Committee of the Board of Directors, which oversees our materiality process from a governance perspective. During 2015, we continued our series of issue brief publications, which are meant to provide our stakeholders with an in-depth understanding of each of our material issues. Each year, the briefs cover three material issues, our approach to managing these, progress to date and selected case studies as examples. Starting with health and nutrition, carbon and energy and stakeholder/community engagement in 2014, we continued with water stewardship, sustainable packaging and direct and indirect economic impacts in The idea is to continue these deep-dives on three issues each year in a four-year cycle; then, closing the cycle, to start again from the beginning, assuming there will be substantial development to warrant a fresh look. The six issue briefs published so far are available for review on our website ( Proactive engagement with our stakeholders is a continuous, well-defined approach both for the Group and our countries, managed in diverse ways ranging from daily interactions with our customers and suppliers to ongoing engagement as part of business planning and risk assessment. We actively participate in forums, industry platforms and collaborative programmes in all of our markets, indirectly engaging with a broad range of stakeholders as members of national industry associations. The table that follows shows the ways in which we engage various stakeholders. Stakeholders Shareholders and analysts How we engage Annual General Meetings, quarterly roadshows and results briefings, webcasts with shareholder and analyst participation, ongoing dialogue with analysts and investors. Employees Engagement and values surveys; management by objectives along seven key result areas including corporate social responsibility, ambassadorship, health, safety and sustainability communications programme; community and active lifestyle projects; quarterly CEO business updates; annual Leadership Conference; Employee Works Council; whistleblower hotline; and materiality survey. Customers Joint value creation initiatives, trade marketing activities, cooperation on health and sustainability-related initiatives, regular meetings, dedicated account teams, joint business planning, customer care centres, satisfaction surveys, Annual Stakeholder Forum and materiality survey. Consumers Consumer hotlines, local websites, plant tours, research, surveys, focus groups, segmented and customised integrated communications via innovative channels including social media. Suppliers Joint value creation initiatives, supplier award event, industry associations, workshops on sustainable supply, Annual Stakeholder Forum, materiality survey, SEDEX (platform for ethical and sustainable supply chains). Governments and regulatory authorities Non-governmental and intergovernmental organisations (NGOs and IGOs) Participation in consultations (e.g. European Commission communication on Circular Economy; the EU Platform for Action on Diet, Physical Activity and Health); discussions and dialogue with food safety and environment agencies, foreign investment advisory councils, embassies, etc; Annual Stakeholder Forum; and materiality survey. Conferences, consultations, discussions, partnering on common issues (e.g. nature conservation, health and nutrition and community investment programme); memberships of business and industry associations; Annual Stakeholder Forum; and materiality survey. Communities Plant visits; community stewardship programme; partnerships on common issues such as youth development, empowerment of women and other, locally relevant social issues; corporate contributions, offering management capabilities and time pro bono; lectures at universities; volunteerism; conservation of nature and biodiversity; protection of the environment; decreasing our footprint. In 2015, we continued building and maintaining relationships critical to our operations. Through longer-term initiatives such as the development of supplier capabilities and joint value creation initiatives with them and our customers, we proactively integrate sustainability into these relationships across the value chain. Our partnership with The Coca-Cola Company provides us with additional insights and information about key sustainability and business issues. 166
169 Strategic Report Corporate Governance Financial Statements Supplementary Info & Swiss Statutory Reporting GRI INDICATORS GRI standard and specific disclosures 4.0 Below, we report against the full GRI 4.0 standard and specific disclosures, as well as the disclosure required by the Food Processing Sector Supplement (FPSS). Some data is provided directly in the table, while for other indicators we indicate where the data and a more full discussion of the topic can be found in this Integrated Annual Report (IAR). Unless stated otherwise, the period covered is calendar year 2015 and the status described is as at 31 December GENERAL STANDARD DISCLOSURES Reference to page number in the IAR Omissions External assurance Strategy and analysis 1-5, 10-15, 51, None Yes Organisational profile 1-3, 8, 24-36, 187 None Yes Identified material aspects and boundaries 16-23, None Yes Stakeholder engagement 16-23, 39-46, , 166 None Yes Report profile None Yes Governance , 188 None Only for sustainability-related content Ethics and integrity 189, 190, 191 None Yes 167
170 Coca-Cola HBC 2015 GRI Indicators List continued ECONOMIC Performance indicator and DMA Description Economic performance EC1 Direct economic value generated and distributed on an accrual basis, including revenues, operating costs, employee compensation, donations and other community investments, retained earnings, and payments to capital providers and governments FPSS and EC1 Specify the amount spent on the programmes and practices to which the food processing sector is uniquely suited for contributing EC2 Financial implications and other risks and opportunities for the organisation s activities due to climate change Reference to page numbers in the IAR 3, 8-9, 20, 35-42, 117, , 35-42, 59, 168, 191, 193 EC3 Coverage of defined benefit plan obligations 113, 117, , 168 Content or reference Please see the respective sections of the Integrated Annual Report including full financial disclosures and the section on Community trust. We invested 8.2 million in community programmes related to youth development, water stewardship, active lifestyles and other activities, corresponding to 2.3% of our 2015 reported pre-tax profit. We are also working with our suppliers to ensure sustainable sourcing practices are implemented. 19, 50, CCHBC has adopted a comprehensive top-down, bottom-up approach to enterprise risk management to ensure that all business risks and opportunities, including those relating to climate change, are identified and managed appropriately. Specific programme details are available in the Material issues and Risk management sections of this report. 12,841 of our total number of employees employed on average in 2015 are eligible for benefit plans. Of these, 8,049 are covered by defined contribution pension plans and 4,792 are covered by defined benefit pension plans. EC4 Significant financial assistance received from government None FPSS and EC4 Governmental support for agriculture, biofuels and food production has important consequences across the global food value chain Does not apply: we do not produce agricultural or biofuel products, nor receive any subsidies for them. Market presence EC5 EC6 Range of ratios of standard entry-level wage by gender compared to local minimum wage at significant locations of operation Proportion of senior management hired from the local community at significant locations of operation Indirect economic impacts EC7 Development and impact (current or expected) on local communities and economies of infrastructure investments and services supported 146, 168 In every country the lowest paid employee categories (junior line operators and entry-level merchandisers) earn at least the minimum wage. On average, junior line operators and merchandisers earn approximately 1.5 times the local minimum wage in our established markets, approximately 1.7 times in our developing markets and approximately two times the local minimum wage in our emerging markets. The range of ratios is similar for both male and female workers. 37, 168 Employees are systematically hired from the local workforce. 96% of employees are local nationals. 80% of managers are local nationals. In our established markets, 86% of total employees and 55% of managers are local nationals. In developing markets, 98% of total employees and 96% of managers are local nationals. Finally, in our emerging markets, 99% of total employees and 93% of managers are local nationals. As senior management, we consider our top 300 business leaders, which include country function heads, Group sub-function heads and the Group s Operating Committee, including the CEO. As local hire, we consider employees of the same nationality as the operation they work for , 168 Covered in detail in this report in the Community trust section. In 2015, we have provided 46,202 m 3 of clean water to communities next to our plants in Aseire, Enugu and Benin, Nigeria. 168
171 Strategic Report Corporate Governance Financial Statements Supplementary Info & Swiss Statutory Reporting Performance indicator and DMA EC8 Description Understanding and describing significant indirect economic impacts, including the extent of impacts Procurement practices EC9 Proportion of spending on local suppliers at significant locations of operation Reference to page numbers in the IAR 16, 17, 39-42, 45-46, 169 Content or reference As a business, our primary contribution to the communities we serve is through our core business activities, which generate income for employees, pay our suppliers and contribute to the public good through e.g. the payment of state taxes. Within the European Union, the Coca-Cola System supports approximately 600,000 direct and indirect jobs throughout our value chain. 169 Our practice is to source locally, provided that goods and services are available to meet our requirements and quality standards in an economically viable way. As of 2015, over 90% of our spending is local in our countries of operation or from within the European Union, which is considered local for EU countries. ENVIRONMENTAL Performance indicator and DMA Description Materials Reference to page numbers in the IAR Content or reference EN1 Materials used by weight or volume See Environmental Data Table FPSS and EN1 Commentary added to specify wild-caught and Does not apply: we do not catch or farm any fish. farmed seafood EN2 Percentage of materials used that are recycled See Environmental Data Table input materials Energy EN3 Energy consumption within the organisation See Environmental Data Table EN4 Energy consumption outside the organisation See Environmental Data Table EN5 Energy intensity See Environmental Data Table EN6 Reduction of energy consumption as a direct result of conservation and efficiency initiatives 169, In 2015 we invested 5.3 million in different energy efficiency initiatives in our plants which saved million MJ of energy. Our energy use ratio improved by 7.2% in 2015 vs Further, we continued to require the implementation of our Top 18 Energy Savers Initiatives, which are mandatory at each of our production sites. EN7 Reductions in energy requirements of products sold and services achieved 169, In addition to our 10 existing combined heat and power plants, we built two new plants in Nigeria during We invested 75.4 million in new energy-efficient and HFC-free cold drink equipment in 2015: this helped our customers to save million kwh of electricity. Water EN8 Total water withdrawal by source 169, Total water withdrawal amounted to 23.6 billion litres in From municipalities: 7.3 billion litres; from wells: 15.6 billion litres; from surface waters: 0.7 billion litres. EN9 Water sources significantly affected by withdrawal of water 169, None every bottling plant undertakes a Source Vulnerability Assessment (done in collaboration with independent experts and consultants) to ensure the sustainability of water supply, and has an established Source Water Protection Programme to ensure future sustainability of water use. Moreover, we have committed to have all of our sites certified by European Water Stewardship (EWS) or Alliance for Water Stewardship (AWS) by As of end of 2015 we have 13 sites with a Gold certification in EWS. EN10 Percentage and total volume of water recycled 169, Total volume recycled and reused internally: 1.37 billion litres and reused Biodiversity EN11 Location and size of land owned, leased, managed in, or adjacent to, protected areas and areas of high biodiversity value outside protected areas 169 Two sites (Zalaszentgrot in Hungary and Tylicz in Poland) are adjacent to Natura 2000 areas. Biodiversity-related topics are covered in the certification process for the European Water Stewardship standard and reported accordingly. 169
172 Coca-Cola HBC 2015 GRI Indicators List continued ENVIRONMENTAL CONTINUED Performance indicator and DMA Description Reference to page numbers in the IAR Content or reference FPSS and EN11 Commentary added to include waters 20, 170, 190 There is no negative impact from our operations on Natura 2000 areas as certified by the Gold certification in the European Water Stewardship standard of both sites. We support water stewardship projects and implement environmental protection initiatives in 24 countries. In nine countries, together with The Coca-Cola Company we have water replenishment projects, which contribute to the full replenishment of the total volume of water we use in our final beverages. EN12 Description of significant impacts of activities, products, None and services on biodiversity in protected areas and areas of high biodiversity value outside protected areas EN13 Habitats protected or restored 170 In 24 countries of operation, we conduct community water projects with NGOs, a number of which include wetland habitat protection programmes. In 2015, major programmes included our partnership with WWF, the Global Water Program, the GDP Mediterranean programme in eight of our countries and the Yelnya Bog initiative in Belarus. We also conduct clean-up activities on riversides and coasts in several of the countries we operate in. EN14 Number of IUCN Red List species and national conservation list species with habitats in areas affected by operations, by level of extinction risk None Emissions, effluents and waste EN15 Direct Greenhouse Gas (GHG) emissions (Scope 1) See Environmental Data Table EN16 Energy indirect Greenhouse Gas (GHG) emissions (Scope 2) See Environmental Data Table EN17 Other indirect Greenhouse Gas (GHG) emissions (Scope 3) See Environmental Data Table EN18 Greenhouse Gas emissions intensity See Environmental Data Table EN19 Reduction of Greenhouse Gas (GHG) emissions See Environmental Data Table EN20 Emissions of ozone-depleting substances by weight See Environmental Data Table EN21 NOx, SOx, and other significant air emissions by type See Environmental Data Table and weight EN22 Total water discharge by quality and destination 17, Total waste water discharged: 10.4 billion litres; volume discharged to municipal treatment systems: 2.8 billion litres; volume treated on-site and discharged to natural bodies of water: 7.6 billion litres EN23 Total weight of waste by type and disposal method See Environmental Data Table EN24 Total number and volume of significant spills See Environmental Data Table EN25 Weight of transported, imported, exported, or treated waste deemed hazardous under the terms of the Basel Convention Annex I, II, III, and VIII, and percentage of transported waste shipped internationally See Environmental Data Table EN26 Identity, size, protected status, and biodiversity value of water bodies and related habitats significantly affected by discharges of water and runoff 170, Since the completion of our wastewater treatment programme in 2011 with 44 on-site wastewater treatment plants no natural habitat is significantly affected by wastewater discharge, as 100% of our waste water is treated to levels supporting aquatic life. 170
173 Strategic Report Corporate Governance Financial Statements Supplementary Info & Swiss Statutory Reporting Products and services Sustainable packaging and recycling Sustainable packaging is central to our sustainability approach. We continue to minimise the environmental impacts of our packaging following our 3 Rs principle: reduce, recover and re-use. Since adopting this approach, we have significantly improved our primary packaging material use and environmental impact. We continue to raise the bar, identifying and capturing incremental opportunities for packaging optimisation, driving innovation, minimising our environmental impact and ultimately driving cost reduction. Plastic packaging Polyethylene terephtalate (PET) plastic bottles represent our largest primary packaging type, with the highest number of servings sold. We continue our focus on package innovation and quality, which has helped us achieve an average package weight reduction of over 16% since Together with the light-weighting of bottles, we also introduced a new shorter bottle neck type, which allows us to reduce the weight of the plastic closures used on these bottles by up to 15%. Plastic bottle recycling/sustainable PET sourcing PET bottle recycling and preserving resources remain a focus area for us. In 2005, together with industry partners, Coca-Cola HBC co-funded a pioneering PET bottle-to-bottle recycling facility located in Austria. In 2011, the decision was taken to expand the production with the addition of a second production line using state-of-the-art recycling technology. The facility produces recycled PET material (rpet) from post-consumer bottles. The rpet can then be added to the manufacturing process to produce new bottles. Over recent years, we have expanded the use of rpet, increasing consumption from 4000 to 15,800 tonnes, delivering bottles with a recycled content of up to 50%. Metal cans We have launched our lightest beverage can, the B-can, which is an ultra-light can with 4.5% less material than the standard 33cl can, through our partnership with Ball Packaging Europe. In 2015, we became the first Coca-Cola bottler to pilot the B-can in Serbia and Hungary. The new 330ml can weighs only 9.45g compared to its 10g predecessor. Migrating our total can volume to this ultra-lightweight benchmark would reduce our use of aluminium by approximately 850 metric tonnes per year, representing about 2.5% of our annual use. Glass Although returnable and one-way glass bottles comprise a smaller part of our portfolio, also here we have continued to drive innovation with our suppliers and partners without compromising safety or beverage quality. Our initiatives are delivering results, as we have successfully reduced the weight of our glass bottles for many of our key beverage categories, in some cases by as much as 30%. For new package or size launches, we leverage the technical innovations to ensure we introduce optimised light-weight packages from day one. Package highlights The Twist bottle is a new, light-weight PET bottle development for bottled water, which is on average 22% lighter than its predecessor, supporting CO 2 emission reductions. In addition, the design of the bottle makes it easier to collapse for recycling purposes. This design was successfully pioneered in Greece, praised for its innovation and environmental benefit, contributing towards Greece being recognised with a Gold award in 2014 for its sustainable packaging. Additional launches of the Twist bottle have been completed in Hungary and Bulgaria, with further rollout planned in PlantPET is a PET material partially (30%) made of plants, a renewable resource that is fully recyclable. This material was first introduced in Serbia and received great recognition and feedback from consumers. We have expanded the use of PlantPET to other countries and continue to explore new opportunities going forward. Performance indicator and DMA EN27 EN28 Compliance EN29 Description Initiatives to mitigate environmental impacts of products and services and extent of impact mitigation Percentage of products sold and their packaging materials that are reclaimed by category Monetary value of significant fines and total number of non-monetary sanctions for non-compliance with environmental laws and regulations Reference to page numbers in the IAR Content or reference 171, Packaging and recovery organisations for post-consumer packaging waste are established in 19 countries; energy-efficient and HFC-free coolers are provided to our customers; rpet (recycled PET) accounts for 6.3% of our total PET material; PlantBottle TM is introduced in 10 countries (Bulgaria, Greece, Hungary, Italy, Poland, Romania, Russia, Serbia, Slovakia, Switzerland). 171, % of packaging is recovered and collected in the countries where we have contributed to set up recovery organisations. 171, No significant fines; five Notices of Violation, four of them with no monetary fines and one with a fine of
174 Coca-Cola HBC 2015 GRI Indicators List continued Transport Most products are delivered by road, and our own fleet in 2015 comprised 15,609 cars, vans and trucks, an 11% reduction vs The transportation of our products accounts for only 7% of our carbon footprint. We have not yet developed a specific target for CO 2 in transportation, but we have undertaken specific initiatives based on our publicly communicated science-based carbon reduction target which calls for a 25% reduction in CO 2 ratio across the entire value chain by 2020 vs We have a clear focus on improving our performance in this area, making our distribution network as efficient as possible. Compared to 2014, in 2015 we improved carbon emissions from our own fleet by 11.5%. Emissions from outsourced fleet were flat despite a 3% increase in delivered products during In the latest fleet tender, carbon emissions were part of the overall criteria for the evaluation of participants. Our own drivers are trained in Safe and Eco-Driving and Alert Driving, and fleet performance is monitored monthly (fuel consumption per 100 km, road accidents, kilometres driven per car). Fuel consumption per 100 km is included in the incentive programmes in most of our countries. 90% of our new Company light vehicles are equipped with MobilEye technology (a collision avoidance driver warning technology) and in total 6,109 cars were equipped with MobilEye, which corresponds to 46% of our total light fleet, in Although primarily a safety device, the technology also improved fuel efficiency by 5% in trials. To reinforce how seriously we view vehicle safety, we apply strict consequences for drivers who ignore normally accepted standards of driver behaviour and at the same time we have established a recognition programme for the best drivers. We are seeing positive results with this approach, as fleet accidents per million kilometres travelled declined by 7.6% during 2015, to In addition, we provide defensive driver training for all employees who drive on Company business. In the period , 11,792 Company employees were trained in different modules of defensive training. Only in 2015, the total number of training modules completed stood at 18,981 across our area of operations. At corporate level, alongside the Group Fleet Safety Policy we have introduced internal guidance fleet safety. We use a standard dispatching tool (LEO) which allows us to optimise the routes of trucks and save cost and fuel, and reduce carbon emissions. This tool is also used for the routing of our light fleet job cars (business developers cars) to help save cost and fuel and reduce carbon emissions. In 2015, we have introduced the Transportation Management Excellence initiative, which focuses on optimising usage of our larger trucks, in terms of both range of kilometres driven, and maximum load weight. To do so, we factor in opportunities to utilise cross-country transports and avoid idle reverse logistics. Further, we work with our customers in different Joint Value Creation initiatives in the area of logistics, which save their and our cost and fuel and reduce carbon emissions. One of these initiatives is the use of backhauling arrangements, which means that we are using the return journey of customer trucks to collect products. In a few locations (Switzerland and Russia), we transport products by rail. Air freight is not normally used. We have developed an internal metric called number of touches, which represents how efficient we are in the distribution of our products to our customers (including warehouse handling and transportation). In 2015, we reached an average of 1.69 touches and our 2016 target is to reduce this further to below Moreover, in recent years we have outsourced a large part of our haulage and distribution and optimised our logistics infrastructure, which helps us in providing better service to our customers, decreasing cost and carbon emissions. For outsourced distribution and transportation, we measure the kilometres driven, carbon emissions as per the GHG Protocol tool for mobile combustion, and number of fatalities. Fleet parameters are monitored at least quarterly in each country and at corporate level. In each country, we have a fleet manager or fleet supervisor who is part of our Supply Chain function and at Corporate level there is a fleet manager who is responsible for monitoring. Fuel consumption per 100 km is part of the incentives of fleet-responsible people in most countries. Performance indicator and DMA EN30 Overall EN31 Description Significant environmental impacts of transporting products and other goods and materials used for operations and transporting members of the workforce Total environmental protection expenditures and investments by type Reference to page numbers in the IAR Content or reference 172, The impacts of the transport of goods and people result from the combustion of fuel and resulting air emissions. Number of own vehicles: 15,609. CO 2 emissions from own fleet in 2015: 120,100 tonnes, which is 11.5% less vs CO 2 emissions from outsourced fleet: 186,519 tonnes, which is flat vs. 2014, despite transporting a higher production volume. 172, Investment in energy optimisation initiatives: 5.3 million. Investments in water-saving initiatives: 4.8 million. Investments in packaging optimisation projects: 8.1 million. Investments in energy-efficient and HFC-free cold drink equipment: 75.4 million. 172
175 Strategic Report Corporate Governance Financial Statements Supplementary Info & Swiss Statutory Reporting Supplier environmental assessment Raw material sourcing at Coca-Cola HBC We consider our suppliers as critical partners, contributing to the ongoing and sustainable success of our business and maintaining our reputation with stakeholders. As a critical part of our value chain, the performance of our suppliers directly impacts the sustainability performance and commitments of Coca-Cola HBC. These include a wide range of economic, environmental and social impacts. For example, ingredients contribute to 83% of our water footprint while packaging and Cold Drink Equipment account for 68% of the value chain emissions. We partner with our suppliers to provide new technologies for equipment, packaging and Cold Drink Equipment, and with our logistics providers to minimise our impacts and drive our performance. Given the diversity of countries from which we source raw materials, we consider that the labour practices and ethical business practices of our suppliers reflect on the reputation of our Company. We are committed to high standards of performance for human rights, labour practices, minimising environmental impacts, maintaining health and safety and ethical business practices, while delivering unsurpassed quality. Our supplier partners play a critical role in ensuring that we deliver against these standards. Coca-Cola HBC has made strong commitments to reduce carbon emissions across the value chain by 25% by 2020 against a 2010 baseline. Our sustainable supply joint value creation initiatives and joint ventures with our supply partners play an important role in supporting the Company to achieve this target. In addition, we require all suppliers to adhere to the ethical standards, employment and human rights practices, environmental and work safety requirements prescribed in our Supplier Guiding Principles (SGPs). We aim to achieve 100% of our supply base SGPs by Moreover, we expect our ingredients and primary packaging suppliers to comply with high food safety standards. Finally, we are working towards ensuring that all of our agricultural suppliers meet our Sustainable Agriculture Guiding Principles (available on our website at Under a unified procurement framework, we segment our supply base universe of over 43,000 suppliers (reduced from 59,500 in 2014) into direct and indirect spend suppliers. Direct spend suppliers include ingredients and packaging suppliers. Indirect suppliers include categories such as IT, production equipment, spare parts, maintenance services, logistics providers, fleet vehicles, utilities and temporary labour. We also classify suppliers into three tiers based on their importance to the business and potential opportunities. We assess a large part of our suppliers, mainly direct spend suppliers, based on their financial stability, social and water impacts based on location, energy and carbon impacts based on supply type, quality impacts based on supplier performance and external market factors impacting commodity pricing. We define tier one suppliers as those that fulfil all, or part of the following criteria: high percentage of spend; limited alternatives; and partnership supporting our business strategies. These suppliers are critical to the overall competitiveness and success of Coca-Cola HBC and of the total supply base. Tier two suppliers are those which have strategic importance at a local or regional level. Tier three suppliers represent low-volume, low-spend suppliers where there are many alternative sources available, enabling a flexible supply base. We place significant focus on forming partnerships with multinational suppliers that have supply points located within our countries, while also developing strong local suppliers across our territories. These efforts support our strategy for local sourcing and contributing to socio-economic development in the countries where we conduct business. These suppliers significantly contribute to our business and include key markets such as Russia, Nigeria, Italy, Romania and Poland. For agricultural commodities, we work with multinational suppliers to source ingredients from farms located in Coca-Cola HBC countries. For example, we source juice from farms in Greece, Poland, Serbia, Italy, Russia, Hungary and others; while for sweeteners we source sugar from our EU countries, as well as Switzerland, Serbia, Russia, Belarus, Ukraine and others, and iso-glucose from Hungary. To ensure proper governance and that our suppliers meet our targets, we have implemented policies including our Supplier Guiding Principles, Sustainable Agriculture Guiding Principles and Supplier Code of Business Conduct. In addition, we have developed an environmental, social and governance supplier pre-assessment process which includes criteria for supplier selection. We maintain transparency throughout our supply base through our membership of SEDEX, The Coca-Cola Company Supplier Guiding Principles audits and in Ecovadis from 2016 onwards. We also recognise supplier certifications as per international standards including ISO 9001, 14001, FSSC 2200 and OHSAS For agricultural commodities we are aligning with industry to recognise the Rain Forest Alliance, Fair Trade, Bon Sucro and the Sustainable Agriculture Initiative Platform. The following flow diagram depicts our process for supply base management, including responsibilities in the organisation and where policies, standards and governance processes are applied. 173
176 Coca-Cola HBC 2015 GRI Indicators List continued Supply base management Governance End-to-end sourcing process is governed by both CCHBC 2020 Strategic Framework and Procurement and CSR targets and guidelines Stakeholder Step A Scope Step B Strategy Step C Execution Step D Rollout Step E Change management Step F Process Map, engage and align with stakeholders Define scope and baseline Analyse supply base and develop sourcing strategy Execute sourcing strategy Develop change management plan and execute tender outcome Monitor, measure contract lifetime management Responsibility Responsibility Responsibility Responsibility Responsibility Responsibility Internal customer(s) and procurement Internal customer(s) and procurement Internal customer(s) and procurement and other supporting functions, e.g. legal etc. Internal customer(s) and procurement Internal customer(s) and procurement and other supporting functions, e.g. legal etc. Internal customer(s) and procurement KBIs Depending on the step, applicable KBIs are as follows: supplier prequalification (ESG), number of suppliers, SGP/SAGP compliance, SEDEX/Ecovadis membership, performance KBIs, lifetime cost improvement, service level to customers and value-added deliverables Performance indicator and DMA EN32 Description Percentage of new suppliers that were screened using environmental criteria EN33 Significant actual and potential negative environmental impacts in the supply chain and actions taken Environmental grievance mechanisms EN34 Number of grievances about environmental impacts filed, addressed and resolved through formal grievance mechanisms Reference to page numbers in the IAR Content or reference Our Supplier Guiding Principles (workplace accountability audits) are the principal tool to monitor actual and negative performance of our suppliers in terms of environmental practices. Suppliers contractually confirm adherence to Coca-Cola HBC SGPs. Moreover, these are part of all issued tenders and purchase orders sent to suppliers. As of 2015, all new suppliers have agreed to adhere to the Supplier Guiding Principles. No significant actual or potential environmental impact. 174 None. The formal mechanisms that we use in order to deal with such issues include: our immediate crisis management processes (Incident Management and Crisis Resolution, IMCR), direct customer and consumer lines in all of our 28 countries, our Code of Business Conduct, ISO audits and workplace accountability audits. 174
177 Strategic Report Corporate Governance Financial Statements Supplementary Info & Swiss Statutory Reporting SOCIAL: Labour Practices and Decent Work Performance indicator and DMA Description Employment LA1 Total number and rates of employee hires and employee turnover by age group, gender and market segment Reference to page numbers in the IAR 36-42, 175, 186 Content or reference We employed 33,311 people in 2015, of whom over 96% were permanent employees. In the AIR, we provide breakdowns by market segment. Women accounted for 23% of our workforce, and 33% of management. Total number of hires: 4,223 Total number of new hires under the age of 30: 2,822 Total number of new hires for ages between 30-50: 1,577 Total number of new hires over the age of 50: 63 Number of female hires (entire workforce): 1,515 Number of male hires (entire workforce): 2,708 Established markets number of hires: 600 Developing markets number of hires: 558 Emerging markets number of hires: 3,065 Total turnover rate: 11.8% Turnover under the age of 30: 21.8% Turnover for ages between 30-50: 11.0% Turnover over the age of 50: 9.5% Male employees turnover: 11.9% Female employees turnover: 11.5% LA2 LA3 Benefits provided to full-time employees that are not provided to temporary or part-time employees Return to work and retention rates after parental leave, by gender Established markets total turnover: 7.7% Developing markets total turnover: 9.6% Emerging markets total turnover: 13.5% 36-42, 175 The same basic benefits are provided to full-time and temporary employees, in particular in relation to labour rights and safety , 175, 186 Total return to work rate: 77.3% Female employees return to work rate: 74.4% Male employees return to work rate: 91.6% Total retention rate: 94.1% Female employees retention rate: 95.3% Male employees retention rate: 90.6% Total number of employees that were entitled to parental leave: 11,750 Total number of female employees that were entitled to parental leave: 3,934 Total number of male employees that were entitled to parental leave: 7,816 Total number of employees that took parental leave: 1,915 Total number of female employees that took parental leave: 1,683 Total number of male employees that took parental leave: 232 Total number of employees who returned to work after parental leave ended: 1,048 Total number of female employees who returned to work after parental leave ended: 841 Total number of male employees who returned to work after parental leave ended: 207 Total number of employees retained 12 months after returning to work following a period of parental leave: 1,134 Total number of female employees retained 12 months after returning to work following a period of parental leave: 863 Total number of male employees retained 12 months after returning to work following a period of parental leave:
178 Coca-Cola HBC 2015 GRI Indicators List continued SOCIAL: Labour Practices and Decent Work continued Performance indicator and DMA Description Labour/management relations LA4 Minimum notice period(s) regarding significant operational changes, including whether it is specified in collective agreements FP3 Percentage of working time lost due to industrial disputes, strikes and/or lock-outs, by country Occupational health and safety LA5 Percentage of total workforce represented in formal joint management worker health and safety committees that help monitor and advise on occupational health and safety programmes LA6 Types and rates of injury; occupational diseases; lost days; absenteeism; and number of work-related fatalities by market segment and by gender Reference to page numbers in the IAR Content or reference 176, 186 On average, the minimum notice period is six weeks for employees and five weeks for employee representatives, with variations between countries. In 2015 we held 302 consultations with unions, including meetings on organisational changes. 176 There were two incidents of industrial action during 2015: one short work stoppage involving 26 employees, and a strike of more than one day, involving 91 employees. 176 The number of employees covered by formal Health and Safety Committees is 18,471, which corresponds to approximately 55% of the total number of Coca-Cola HBC full-time equivalent (FTE) employees. 176, 186 In 2015, we achieved a lost-time incident rate of 0.43, a 12% improvement on 2014 and the seventh consecutive year of double-digit percentage improvement. Average sickness days per FTE stood at There were three fatalities, all associated with contractor activities in Nigeria, versus five in The contractor lost-time accidents (LTA) frequency rate stood at We recorded 0.03 occupational ill health incidents in 2015 per 100 FTE employees. This refers to one incident in our established markets, related to a female employee. Data by segment: Lost-time incident rate Established markets: 1.14 Developing markets: 0.54 Emerging markets: 0.19 Average sickness days per FTE employees Established markets: 5.61 Developing markets: 7.81 Emerging markets: 2.56 Fatalities Established markets: 0 Developing markets: 0 Emerging markets: 3 Contractors LTA frequency rate Established markets: 4.96 Developing markets: 0.53 Emerging markets: 1.18 Data by gender: Lost-time incident rate Male: 0.47 Female: 0.30 Average sickness days per FTE Male: 3.52 Female: 5.55 Fatalities Male: 3 Female: 0 Contractors LTAs frequency rate Male: 1.47 Female:
179 Strategic Report Corporate Governance Financial Statements Supplementary Info & Swiss Statutory Reporting Performance indicator and DMA Description Occupational health and safety LA7 Workers with high incidence of high risk of diseases related to their occupation LA8 Health and safety topics covered in formal agreements with trade unions Training and education LA9 Average hours of training per year per full-time equivalent (FTE) employee by gender, and by employee category Reference to page numbers in the IAR Content or reference 177 4,079 FTE employees operate in Nigeria, where the risk of exposure to communicable diseases (such as malaria, HIV etc) is generally higher than the average for our Group employees. Among these, there is a higher exposure risk for the 61 employees who work at our wastewater treatment facilities, where in addition to wastewater from production, communal wastewater is also treated. 177 In 10 countries health and safety topics are part of trade union agreements, covering a total of 8,767 employees. 177 Average training hours per FTE: 21.4 Female average training hours per FTE (excluding Nigeria): 19.3 Male average training hours per FTE (excluding Nigeria): 18.5 LA10 LA11 Programmes for skills management and lifelong learning that support the continued employability of employees and assist them in managing career endings Percentage of employees receiving regular performance and career development reviews by gender and by employee category Training hours/fte for manage-self layer: 21.1 Training hours/fte for manager of others layer: 30.9 Training hours/fte for manager of managers layer: 32.5 Training hours/fte for function head layer: 19.0 Training hours/fte for general managers and above: We provide training and development opportunities for all our employees reflecting one of our corporate values: Learning. In 2015 our training programmes covering leadership, functional training and general business training included 84,815 participations, across all management layers ,067 employees received performance and career feedback as part of our People Development Forums in ,668 employees had formal annual objectives for % of employees who have performance review (total): 47.9% % of employees who have performance review (male): 36.4% % employees who have performance review (female): 11.8% Diversity and equal opportunity LA12 Composition of governance bodies and breakdown of employees per employee category according to gender, age group, minority group membership, and other indicators of diversity By management layer as % of total employees: % of employees who have performance review (manage-self layer): 38.4% % of employees who have performance review (manager of others layer): 6.9% % of employees who have performance review (manager of managers layer): 2.3% % of employees who have performance review (function head layer): 0.4% % of employees who have performance review (general manager and above layer): 0.3% 21, 37, 177 Women accounted for 23% of our workforce and 33% of management. 33% of OPCO members and group function heads were female employees in Under the age of 30: 30.5% of female employees vs total number of employees in this age bracket Between the ages of 30-50: 20.9% of female employees vs total number of employees in this age bracket Over the age of 50: 19.5% of female employees vs total number of employees over 50 Female employees with disabilities vs total: 0.6% Female employees with disabilities as % of total employees with disabilities 24.3% Male employees with disabilities as % of total employees with disabilities 75.7% Total number of nationalities: 71 vs 67 in
180 Coca-Cola HBC 2015 GRI Indicators List continued SOCIAL: Labour Practices and Decent Work continued Performance indicator and DMA Description Equal remuneration for women and men LA13 Ratio of basic salary and remuneration women to men by employee category, and market segment Reference to page numbers in the AIR Content or reference 178 Basic salary ratio (women/men) by market segment and management layer Established markets: Senior leaders: 75% Management positions: 86% Managers of others: 103% Management trainees: 83% Developing markets: Senior leaders: 70% Management positions: 103% Managers of others: 118% Management trainees: 99% Emerging markets: Senior leaders: 88% Management positions: 91% Managers of others: 90% Management trainees: 96% Remuneration ratio (women/men) by market segment and management layer Established: Senior leaders: 74% Management positions: 83% Managers of others: 105% Management trainees: 110% Developing: Senior leaders: 47% Management positions: 87% Managers of others: 96% Management trainees: 83% Supplier assessment for labour practices LA14 Percentage of new suppliers that were screened using labour practices criteria LA15 Significant actual and potential negative impacts for labour practices in the supply chain and actions taken Labour practices grievance mechanisms LA16 Number of grievances about labour practices filed, addressed and resolved through formal grievance mechanisms SOCIAL: Human Rights Investment HR1 Percentage and total number of significant investment agreements and contracts that include clauses incorporating human rights concerns, or that have undergone human rights screening Emerging: Senior leaders: 103% Management positions: 90% Managers of others: 83% Management trainees: 92% 173, 178 Our Supplier Guiding Principles, or SGPs, (workplace accountability audits), are the principal tools to monitor actual and negative performance of our suppliers in terms of labour practices. Suppliers contractually confirm adherence to CCHBC SGPs. Moreover SGPs are part of all issued tenders and purchase orders sent to suppliers. As of 2015, all new suppliers have agreed to adhere to the Supplier Guiding Principles. See also our supplier environmental assessment section in this report. 19, 178 During two supplier audits we encountered issues related to leave days, hours of work and timely payment of pension benefits. Issues were addressed and resolved within There were nine grievances filed about labour practices, four of which were addressed and resolved within 2015 and five of which are still ongoing. 19, 21, 49, 178 Our total CAPEX investment in 2015 was 328 million. Of this, 55% constituted production equipment, cold drink equipment, refillable containers and fleet, all of which were covered by contracts that included supplier guiding principles covering human rights. 178
181 Strategic Report Corporate Governance Financial Statements Supplementary Info & Swiss Statutory Reporting Performance indicator and DMA HR2 Description Total hours of employee training on policies and procedures concerning aspects of human rights that are relevant to operations, including the percentage of employees trained Reference to page numbers in the IAR Content or reference 19, 179 All Directors and employees are trained on the Code of Business Conduct, which includes human rights and other ESG requirements. All employees must gain certification. In 2015, 42,762 training hours were devoted to training on CCH Policies and Guidelines. Non-discrimination HR3 Total number of incidents of discrimination and corrective actions taken None Freedom of association and collective bargaining HR4 Operations and significant suppliers identified in which None the right to exercise freedom of association and collective bargaining may be violated or at significant risk, and actions taken to support these rights Child labour HR5 Operations and significant suppliers identified as having significant risk for incidents of child labour, and measures taken to contribute to the effective abolition of child labour None Forced or compulsory labour HR6 Operations and significant suppliers identified as having significant risk for incidents of forced or compulsory labour, and measures to contribute to the elimination of all forms of forced or compulsory labour None Security practices HR7 Percentage of security personnel trained in the organisation s policies or procedures concerning aspects of human rights that are relevant to operations 179, 186 The Code of Business Conduct emphasises that compliance is our way of doing business with integrity. All new employees, including national security leaders and managers, receive Code of Business Conduct and anti-corruption training, which is refreshed every two years. Most on-site security personnel are employees of contracted partners, who also have to abide by CCHBC s Supplier Guiding Principles and all other applicable Company policies as per their contract, and receive relevant information as part of their induction. Indigenous rights HR8 Total number of incidents of violations involving rights None of indigenous people and actions taken Assessment HR9 Percentage and total number of operations that have been subject to human rights reviews and/or impact assessments Supplier human rights assessment HR10 Percentage of new suppliers that were screened using human rights criteria 179 During (50%) of the bottling plants operating were audited. We have a three-year audit plan with 13 plants scheduled for , 179 Our Supplier Guiding Principles (workplace accountability audits) are the principal tools to monitor actual and negative performance of our suppliers in terms of human rights. Suppliers contractually confirm adherence to CCHBC SGPs. Moreover SGPs are part of all issued tenders and purchase orders sent to suppliers. HR11 Significant actual and potential negative human rights impacts in the supply chain and actions taken Human rights grievance mechanisms HR12 Number of grievances related to human rights filed, addressed and resolved through formal grievance mechanisms As of 2015, all new suppliers have agreed to adhere to the Supplier Guiding Principles. None None 179
182 Coca-Cola HBC 2015 GRI Indicators List continued SOCIAL: Society Performance indicator and DMA Description Local communities SO1 Percentage of operations with implemented local community engagement, impact assessments and development programmes SO2 Operations with significant actual and potential negative impacts on local communities Anti-corruption SO3 Percentage and total number of business units analysed for risks related to corruption SO4 Communication (employees, business partners, governmental bodies) and training (total number and percentage) on anti-corruption policies and procedures Reference to page numbers in the IAR Content or reference 39-42, 180 All our operations implement community engagement and developmental programmes. In 2015, nine of our countries implemented socio-economic impact assessments (SEIAs), while publicly disclosed information with SEIA studies is currently underway in 10 more Coca-Cola HBC countries. 180 During 2015, we continued to consolidate our infrastructure in order to improve efficiency across the organisation. These projects involved the majority of the countries in which we operate and the resulting restructuring initiatives can have an impact on local communities, when they involve the closing or consolidation of facilities. In all such cases, we have taken actions to minimise the impact, for example by providing those people affected with other employment opportunities within the organisation, relocation support, or voluntary exit packages and professional support to facilitate employment elsewhere. 17, 58, 180 We have a zero-tolerance approach to corruption. Bi-annual mandatory training programmes ensure 17, 58, 180 employees understand both applicable anti-bribery and anti-corruption laws and our Anti-Bribery Policy, and act in compliance with these. Programmes are developed by the legal department with in-class training for risk-zone employees to target specific risks faced by each regional function. For further information please see the Anti-Bribery Policy and Compliance Handbook and Code of Business Conduct on our website ( SO5 Confirmed incidents of corruption and actions taken 17, 58, 180 No reported incidents of corruption. Anti-bribery and corruption are specifically categorised as risks within our Enterprise Risk Universe. As part of their quarterly risk review process, operations assess current and emerging risks within this category, and where a risk is identified, implement appropriate mitigation steps. Public policy SO6 Total value of financial and in-kind contributions to political parties, politicians, and related institutions by country None FPSS and SO6 Report context of any lobbying activities related to subsidised or otherwise advantaged production (for example, lobbying by food processing companies to influence agricultural legislation) Anti-competitive behaviour SO7 Total number of legal actions for anti-competitive behaviour, anti-trust, and monopoly practices and their outcomes Compliance SO8 Monetary value of significant fines and total number of non-monetary sanctions for non-compliance with laws and regulations Supplier assessment for impacts on society SO9 Percentage of new suppliers that were screened using criteria for impacts on society Coca-Cola HBC did not engage in any lobbying activity related to subsidised production. None None. We collect reports from countries at Group level on contingencies, including fines, that are over a specific threshold, for the purpose of submitting these to our external financial auditors. 19, 180 Our Supplier Guiding Principles (workplace accountability audits) are the principal tools to monitor actual and negative performance of our suppliers in terms of societal impact. Suppliers contractually confirm adherence to Coca-Cola HBC SGPs. Moreover SGPs are part of all issued tenders and purchase orders sent to suppliers. SO10 Significant actual and potential negative impacts on society in the supply chain and actions taken As of 2015, all new suppliers have agreed to adhere to the Supplier Guiding Principles. None 180
183 Strategic Report Corporate Governance Financial Statements Supplementary Info & Swiss Statutory Reporting SOCIAL: Product Responsibility Performance indicator and DMA Description Grievance mechanisms for impacts on society SO11 Number of grievances about impacts on society filed, addressed and resolved thourgh formal grievance mechanisms Customer health and safety PR1 Percentage of significant product and service categories for which health and safety impacts are assessed for improvement PR2 Total number of incidents of non-compliance with regulations and voluntary codes concerning health and safety impacts of products and services during their life cycle, by type of outcomes FP5 FP6 FP7 Percentage of production volume manufactured in sites certified by an independent third party according to internationally recognised food safety management system standards Percentage of total sales volume of consumer products, by product category, that are lowered in saturated fat, trans fats, sodium and sugars Percentage of total sales volume of consumer products, by product category sold, that contain increased fibre, vitamins, minerals, phytochemicals or functional food additives Product and service labelling PR3 Type of product and service information required by procedures, and percentage of significant products and services subject to such information requirements FPSS and PR3 FP8 PR4 Description of importance of social and environmental product information and its communication to consumers Policies and practices on communication to consumers about ingredients and nutritional information beyond legal requirements Total number of incidents of non-compliance with regulations and voluntary codes concerning product and service information and labelling, by type of outcomes Reference to page numbers in the IAR Content or reference 181 There were two grievances related to societal impact, which are being addressed , 181 There are no safety impacts associated with our products , 181 We had no incidents relating specifically to the health and safety of our products during We are making progress to reduce quality failures, such that in 2015 issues from product spoilage, process and packaging failures resulted in a decreased cost for the Group vs Our consumer complaint rate improved vs with 0.19 complaints per million containers sold against a target of We have therefore improved our target to 0.17 for , 181 During 2015, 66 bottling plants were operational, 65 of which were certified according to ISO 9001 and FSSC standards; this represents 99.4% of produced volume in , 181 Our products do not contain saturated fats or trans fats. Our sports drinks contain salts which constitute part of their desired characteristics to replace salts lost through perspiration. Low-calorie sparkling beverages accounted for 7% of total volume in 2015; water accounted for 19% , 181 We have several products with functional benefits such as Cappy Ice Fruit Multi-vitamin in a number of countries and 5Alive juice drinks in Nigeria which are fortified with vitamins to suit local markets. These products account for a very small percentage of total Group sales. 18, 181 The printed packs and labels of all products sold in 2015 had front-of-pack calorie and sugar information, and back-of-pack Guideline Daily Amounts (GDA) information in the EU. We are working to include this on some glass bottles without print or labels in Nigeria, where relevant product information is included on the closure with limited space. 18, 181 In 2007, we pioneered Guideline Daily Amounts (GDA) labels on the front of package in our EU countries, as a voluntary initiative. Since then, we have rolled out front-of-pack labelling of calorie content in non-eu countries too (excluding returnable glass in Nigeria as described above). 18, 181 In 2007, we pioneered Guideline Daily Amounts (GDA) labels on the front of package in our EU countries, as a voluntary initiative. Since then, we have rolled out front-of-pack labelling of calorie content in non-eu countries too (excluding returnable glass in Nigeria as described above). In 2015, we introduced colour-coded labelling in Ireland, providing consumers with even clearer information about the contents of our beverages. No such incidents related to product information and labelling. 181
184 Coca-Cola HBC 2015 GRI Indicators List continued SOCIAL: Product Responsibility continued Performance indicator and DMA Description PR5 Practices related to customer satisfaction, including results of surveys measuring customer satisfaction Marketing communications PR6 Sale of banned or disputed products Detailed definition a) Report whether the organisation sells products: Banned in certain markets The subject of stakeholder questions or public debate b) Report how the organisation has responded to questions or concerns regarding these products PR7 Total number of incidents of non-compliance with regulations and voluntary codes concerning marketing communications, including advertising, promotion and sponsorship, by type of outcomes Customer Privacy PR8 Total number of substantiated complaints regarding breaches of customer privacy and losses of customer data Compliance PR9 Monetary value of significant fines for non-compliance with laws and regulations concerning the provision and use of products and services Animal husbandry FP9 Percentage and total of animals raised and/or processed, by species and breed type FP10 Policies and practices, by species and breed type, related to physical alterations and the use of anaesthetic FP11 Percentage and total of animals raised and/or processed, by species and breed type, per housing type FP12 Policies and practices on antibiotic, anti-inflammatory, hormone, and/or growth promotion treatments, by species and breed Transportation, handling and slaughter FP13 Total number of incidents of non-compliance with laws and regulations, and adherence to voluntary standards related to transportation, handling, and slaughter practices for live terrestrial and aquatic animals Reference to page numbers in the IAR Content or reference 182, 186 We track the satisfaction of consumers and customers. Our consumer complaint rate was 0.19 per million containers sold. Our customer survey found that in outlet execution, we scored 1st or 2nd in performance and relationship health in 24 of 27 countries. For key accounts, we scored 1st or 2nd in 16 of 22 countries. 18, 182 None of our products are banned in the markets where we operate and we comply with all local legal requirements for the sale and marketing of those products. Wherever there is stakeholder concern expressed relating to beverage industry ingredients, we address those concerns through our industry associations and other alliances. None None None. We collect reports from countries at Group level on contingencies, including fines, that are over a specific threshold, for the purpose of submitting these to our external financial auditors. Does not apply: we do not raise and/or process animals. Does not apply: we do not raise and/or process animals. Does not apply: we do not raise and/or process animals. Does not apply: we do not raise and/or process animals. Does not apply: we do not raise and/or process animals. 182
185 Strategic Report Corporate Governance Financial Statements Supplementary Info & Swiss Statutory Reporting Environmental Data Table Total amount 2015* Relative amount 2015 (defined in each relevant indicator) Total amount 2014 Relative amount 2014 (defined in each relevant indicator) GRI G4 indicator Environmental data and DMA Production Total beverage production (m litres) 12,158 11,474 Materials Materials used EN1 Tonnes g/lpb Tonnes g/lpb Sugar and fructose syrup 920, , Concentrate 57, , Carbon dioxide 112, , Nitrogen 10, , PET (bottles) 249, , Plastic (closures) 23, , Metal (crowns) 7, , PE (labels and stretch/shrink film) 37, , Glass (bottles) 96, , Aluminium (cans) 38, , Paper (labels) 1, , Composite carton (tetra pack, bricks) 46, , Cardboard 44, , Wood (pallets) 63, , EN2 Percentage of materials from recycled sources 6.3% for PET; 18% for glass; 34% for aluminium 5.2% for PET; 13.5% for glass; 33.5% for aluminium Energy million MJ MJ/lpb million MJ MJ/lpb Energy consumption within the organisation EN3 6, , Fuel consumption 2,215 2,363 Light heating oil Heavy heating oil Natural gas 1, , LPG Fuels for own fleet 1,736 1,875 Total electricity consumption 2,877 2,972 Electricity from renewable sources 579 Electricity from non-renewable sources 2,298 Heating consumption Cooling consumption 21 1 Steam consumption 98 0 Electricity sold n/a n/a Energy consumption outside the organisation EN4 16, , Electricity use in cold drink equipment 14,108 14,595 Fuel consumption from corporate flights Energy (fuel) consumption from third-party fleet 2,563 2,519 Energy intensity EN Reduction of energy consumption in bottling plants (vs. baseline 2004) EN6 4,012 3,501 Initiatives to reduce direct energy consumption See the text part in the tables above Reductions in energy requirements of products and services EN7 See the text part in the tables above Energy reduction from cold drink equipment 2,004 1,215 at marketplace (vs. baseline 2010) Water Million Litres l/lpb Million Litres l/lpb Total water withdrawal by source EN8 23, , Water received from municipality 7, , Water received from wells 15, , Water received from surface waters
186 Coca-Cola HBC 2015 GRI Indicators List continued Environmental Data Table continued Total amount 2015* Relative amount 2015 (defined in each relevant indicator) Total amount 2014 Relative amount 2014 (defined in each relevant indicator) GRI G4 indicator Environmental data and DMA Water sources significantly affected EN9 None None by withdrawal of water Percentage and total volume of water EN10 recycled and reused Total recycling and reuse of water 1,370 ml 1,012 ml Percentage recycled/reused in total water withdrawal 5.8% 4.2% Biodiversity Total amount of land owned 668 ha 857 ha Major impacts on biodiversity EN12 None None Programmes to protect and restore habitats EN13 see IAR, website Red List species with habitats affected by operations EN14 None None Emissions, effluents and waste Direct greenhouse gas (GHG) emissions (Scope 1) Tonnes g/lpb Tonnes g/lpb Greenhouse gas emissions from operations EN15 317, , CO 2 from energy used in plants (Scope 1) EN15 123, , CO 2 from fuel used in Company vehicles EN15 120, , EN15 15, , Coolant emissions from Cold Drink Equipment (CO 2 eq) CO 2 for product carbonation (CO 2 losses) EN15 46, , CO 2 from remote properties fuel consumption EN15 12, , Energy indirect GHG emissions (Scope 2) EN16 317, , CO 2 from electricity used in plants EN16 264, , (Scope 2 Market-based) CO 2 from electricity used in plants EN16 289, , (Scope 2 Location-based) CO 2 from supplied heating and cooling (Scope 2) EN16 38, , CO 2 from electricity consumption EN16 14, , in remote properties Market-based CO 2 from electricity consumption EN16 16, , in remote properties Location-based Total emissions (Scope 1 and 2 Market-based) 634, , Total emissions (Scope 1 and 2 Location-based) 662, , Other indirect GHG emissions (Scope 3) EN17 3,539, ,613, CO 2 from electricity use of cold drink equipment EN17 1,586, ,698, CO 2 embedded in packaging (Cradle-to-Gate) EN17 1,246, ,220, CO 2 from sugar EN17 436, , CO 2 from third-party transports EN17 186, , CO 2 from head office flights EN , CO 2 from product carbonation EN17 82, , GHG emissions intensity EN (Scope 1, 2 and 3 Scope 2 Market-based) GHG emissions intensity (Scope 1, 2 and 3 Scope 2 Location-based) EN Programmes to reduce GHG emissions EN19 See the text part in the above table Ozone-depleting substance emissions EN20 Tonnes CFCs and HCFCs Other significant air emissions EN21 Tonnes NOx 5, , SO 2 4, , Particulate matter * As of 2015 reported carbon emissions for Scope 2 are market-based. For the baseline year and years prior to 2015, we have used location-based results as a proxy since a true market-based result could not be calculated. 184
187 Strategic Report Corporate Governance Financial Statements Supplementary Info & Swiss Statutory Reporting Environmental data Effluents GRI G4 indicator and DMA Total amount 2015* Relative amount 2015 (defined in each relevant indicator) Total amount 2014 Relative amount 2014 (defined in each relevant indicator) Total Water Discharge by Quality and Destination EN22 Since 2011 all the wastewater from our plants is treated to levels supporting aquatic life. In 2015 we had a total of 43 plants with their own wastewater treatment facilities (mostly using full aerobic process) and the rest of our plants discharge to municipal wastewater treatment plants. Quantity of wastewater discharged EN22 10,443 ml 0.9 l/lpb 11,284 ml 1.0 l/lpb Total COD (Chemical Oxygen Demand) produced EN22 3,125 t O mg O 2 /lpb 3,574 t O mg O 2 /lpb Total COD reaching the environment EN t O 2 40 mg O 2 /l 490 t O 2 43 mg O 2 /l Water discharged to our own wastewater EN22 7,422 ml 5,040 ml 0.4 treatment plants (WWTP) Water discharged to municipal-owned WWTP EN22 3,021 ml 6,244 ml 0.5 Water habitats affected by water discharges EN Waste Amount of solid waste EN23 Tonnes Tonnes Total amount EN23 103, g/lpb 97, g/lpb Waste recycled EN23 74,184 68,155 Waste reused EN23 6,700 7,750 Waste incinerated without energy recovery EN Waste incinerated with energy recovery EN23 3,422 1,706 Waste composed EN23 7,991 11,182 Waste disposed of in landfills EN23 8,958 8,738 Recycling and energy recovery EN23 92,296 91% 88,792 91% Spills of chemicals, oils, fuels EN24 6 t g/lpb 23 t g/lpb Hazardous waste generated EN25 4, g/lpb 1, g/lpb Recycled hazardous waste EN25 2,034 Non-recycled hazardous waste EN Products and services Significant environmental impacts EN27 CFCs and HCFCs CFCs and HCFCs Percentage reclaimable products EN28 Third-party carriers Third-party carriers Rate of returnable packaging 10.4% 10% Possible rate of packaging recycling See AIR See AIR Achieved rate of packaging recycling See AIR See AIR Compliance Incidents and fines EN29 EUR EUR Monetary value of significant fines 688 1,500 Number of significant fines 0 (we have five Notices of Violation, 2 four of them with no fine and one at 688 EUR) Transport Environmental impacts of transport EN30 3rd party carriers 3rd party carriers Number of vehicles 15,609 17,555 Fuel consumption own and leased fleet (litres) 48,339, ml/lpb 52,122, ml/lpb Energy consumption in own and leased fleet 1, MJ/lpb 1, MJ/lpb fuel consumption (million MJ): Diesel 1,170 Petrol 534 CNG 0 LPG 32 Carbon emissions from fuel consumption 120, g/lpb g/lpb (own and leased fleet: Scope 1) tonnes CO 2 Carbon emissions from fuel consumption 186, g/lpb g/lpb (third-party fleet: Scope 3) tonnes CO 2 Expenditures Total environmental expenditures EN31 See some of the investments in the respective table of the GRI index. Total investment is not disclosed publicly. * As of 2015 reported carbon emissions for Scope 2 are market-based. For the baseline year and years prior to 2015, we have used location-based results as a proxy since a true market-based result could not be calculated. 185
188 Coca-Cola HBC 2015 GRI Indicators List continued Social Data Table Employee development LA1 Average number of employees 33,311 36,362 Permanent employees >96% >95% Employee engagement score 87% 82% Values index score 88% 81% Hires by age group, gender and region See data at GRI index above LA1 Employee turnover 11.8% 14.7% Turnover by age group, gender and market segment See data at GRI index above LA3 Return to work and retention rate after parental leave by gender See data at GRI index above Training and development LA9 Average training hours per employee, by gender and employee category See data at GRI index above Key People in Key Positions 79% 78% Human rights HR4-7 Number of workplace accountability audits HR4-7 Number of human rights violations resulting in litigation 0 0 against the Company Equality and diversity LA13 Women in management 33% 32% HR4 Breaches of equality legislation 0 0 Labour rights LA4 Employees covered by collective bargaining 50% 49% LA4 Employees belonging to independent trade unions 28% 28% Health and safety LA6 Fatalities (including contractors) 3 5 LA6 Accident incidence (accidents with >1 day absence per 100 employees) FLA6 Average sickness days per FTE employees Employee LTA Contractor LTIFR /OIFR FLA6 Data by gender and market segment See data at GRI index above Consumer health Number of plants with OHSAS certification % of production volume covered 65 plants that were operational in 2015 were certified, covering 99.4% of production volume plants that were operational in 2014 were certified, covering 99.5% of production volume Percentage of still beverages (juices, waters, etc.) 30.9% 30.4% Average calorie content (per 100ml) 31kcal 30 kcal PR3 Rollout of GDA labels See data at GRI index for details All sparkling beverages in cans and PET bottles, all other beverages in the EU PR5 Consumer complaints (per million containers sold)
189 Strategic Report Corporate Governance Financial Statements Supplementary Info & Swiss Statutory Reporting Supplier engagement HR2 Number of independent SGP audits EC1 Total supplier spend 2,835 million 2,926 million EC6 Spending within local territories (includes EU) >90% >90% Economic benefits EC1 Income taxes 76.4 million 57.8 million Salaries and benefits 1,070 million 1,104 million EC1 Investment in community projects 8.2 million 8.7 million (2.3% of reported (2.5% of reported pre-tax profit) pre-tax profit) Political contributions 0 0 Organisational profile G4-10 Employment profile by type of contract (permanent, temporary, Type of contract: contractors, self-employed etc), gender and region Permanent: 32,087 Temporary: 1,224 Male: 25,642 Female: 7,669 Remuneration and incentives G4-54 Ratio of the annual total compensation for the organisation s highest-paid individual to the median annual total compensation for all employees, by segment G4-55 Ratio of percentage increase in annual total compensation for the organisation s highest-paid individual to the median percentage increase in annual total compensation for all employees, by segment G4-12 Description of the Group s Supply Chain Established: 6,642 Developing: 5,315 Emerging: 21,354 In addition, during 2015 we employed 4,491 people on a contractor basis, 317 self-employed workers and 388 seasonal workers, who were not on Coca-Cola HBC contracts Ratio calculated in Euros: Established markets: 16.2 Developing markets: 36.9 Emerging markets: 80.4 Rate of increase/ (decrease) calculated based on Euro-based ratios Established markets: -1.3% Developing markets: -14.1% Emerging markets: +2.1% Our Supply Chain organisation plays a central role in our business, ensuring that in all our processes we minimise our environmental impact, and ensure sustainability in our value chain, all the way from sourcing raw materials to manufacturing the end product and distributing it to our customers. In our own business, we are creating a 100% quality culture with zero tolerance for failure to meet standards. This approach extends to our suppliers. Coca-Cola HBC requires Tier 1 suppliers (as defined on page 173 of this report) to gain certification to the following standards: ISO 9001 (quality), ISO (environment) and OHSAS (health and safety). Ingredient and packaging suppliers must also achieve certification to FSSC for food safety and the Global Food Safety Initiative (GFSI). Quality and food safety remain our top priority to ensure that we meet customer and consumer expectations while delivering against our cost leadership commitments. We have stringent processes in place to minimise the occurrence of quality issues. However, when issues arise, we have robust procedures and systems in place that enable us to deal with them quickly and efficiently, thus ensuring that our customers and consumers retain confidence in our products. We operate in a vast territory stretching across 28 countries in three continents. While providing us with opportunity, this footprint also challenges us to constantly optimise our operational infrastructure. Our aim is to build a borderless Supply Chain that will supply our territory at optimum cost and have the capability to embed innovative technologies fast. As we look for opportunities to optimise our infrastructure, we seek to build or transform existing plants into efficient mega-plants, where it makes sense, which can effectively serve a country or an entire region. Such optimisation takes into consideration the Group supply chain as a whole, in an integrated manner, from the number of plants and the number and nature of filling lines to the number of distribution centres and warehouses. 187
190 Coca-Cola HBC 2015 GRI Indicators List continued 2015 Code of Business Conduct violations and allegations received through the Whistleblower hotline In 2015, 105 allegations of violations of the Group s Code of Business Conduct were investigated. Of the 105 allegations investigated, 81 were substantiated as violations of the Code of Business Conduct. Twenty-two of the investigated matters involved an employee in a management position or involved a loss greater than Euro 10,000. As a result of the 81 matters substantiated as violations of the Code of Business Conduct, 71 employees were terminated. An additional 75 employees received discipline in the form of formal/ written warnings, financial penalties (unpaid suspension or loss of bonus) or voluntary resignation from the Company. Violations by Code of Business Conduct sections Whistleblower hotline In September 2015, we introduced our new Whistleblower hotline. The hotline is managed by a third party and is now available across the Group in 23 languages and can be accessed at any time via phone or internet. When our new hotline was launched, we conducted a Group-wide campaign to make all employees aware of the new hotline and remind them of the various avenues available to report concerns and violations of the Code Business of Conduct. Additionally, throughout the year we communicate the importance of reporting potential violations of the Code of Business Conduct and encourage all employees to ask their managers, Code Compliance Officers or the Internal Audit Department questions. In 2015, we received 45 allegations through our whistleblower hotline. Allegations received related to issues not covered under the Code of Business Conduct were routed to the appropriate department for appropriate handling. All allegations involving potential Code of Business Conduct violations were investigated in accordance with the Group Code of Business Conduct Handling Guidelines. Importantly, we make sure that the learnings from both the Code of Business Conduct violations and allegations reported through the whistleblower hotline are drawn and result in relevant decision-making and procedural changes; for example the re-evaluation of our procedures in connection with incidents and the review, adjustment or update of related policies. We also undertake measures to improve our systems and use them to prevent as many of these violations as possible from happening, learning from our experience and that of others. Use of information: 1 Anti-bribery and corruption: 3 Dealing with customers, suppliers and competitors: 3 Workplace health and safety: 5 Fair treatment of employees: 8 Conflicts of interest: 9 Business and financial records: 32 Safeguarding Company assets: 32 Other:
191 UN Global Compact Communicating our Progress Coca-Cola HBC 2015 Integrated Annual Report Strategic Report Corporate Governance Financial Statements Supplementary Info & Swiss Statutory Reporting Coca-Cola HBC has participated in the UN Global Compact since 2005 and is continuously working to implement and promote the 10 Principles in support of human rights, labour rights, the environment and anti-corruption. More specifically, we fulfil our commitments to the UN Global Compact by: Implementing the 10 Principles into Company operations and strategy Supporting the Compact s global platforms, including the CEO Water Mandate and Caring for Climate initiatives Contributing to UN sustainable development goals Working to make our supply chain more sustainable Promoting the development of local networks Reporting transparently in accordance with GRI G4 standards 1.1 GC Advanced Level Our Integrated Annual Report serves as our Communication on Progress (COP) to the Global Compact. To achieve Advanced Level status we must meet the 21 criteria of the COP Differentiation programme. Below is a summary of these criteria and how we meet each one Mainstreaming into corporate functions and business units We have integrated sustainability into the way we run our business. We identified material issues to our business with our stakeholders and developed ambitious strategies, demanding targets, rigorous governance and integrated reporting. We have also implemented internationally recognised management systems. Almost all (99.4%) of our production volume now comes from plants that are certified for quality (ISO 9000), environment (ISO 14001), health and safety (OHSAS 18001) and food safety (ISO and FSSC 22000) Value chain implementation Our supply chain is the biggest contributor to our impacts, particularly from an environmental perspective. To address this, we work with our suppliers, NGOs and other partners to tackle issues such as water use and carbon emissions in our agricultural supply chain. We have also begun collaborative work with customers on joint sustainability initiatives. Together with The Coca-Cola Company, we are setting long-term sustainability targets and public commitments for our business that include our supply chain in a lifecycle approach. Robust Human Rights Management Policies and Procedures Robust commitments, strategies or policies in the area of human rights Relevant policies include: an updated Human Rights Policy, including reference to the UN Framework and Guiding Principles on Business and Human Rights (the Ruggie Framework) and the ILO International Labour Standards; Equal Opportunities Policy; Supplier Guiding Principles; Occupational Health and Safety Policy; and HIV-AIDS Policy. In 2015, in Northern Ireland, we ran a programme for high-potential women focused on developing their business knowledge, confidence and leadership skills. The programme, called Elevating Women in Management, provides personal development planning and coaching support and has been given positive reviews by participating women associates We continue to support the 5by20 programme of The Coca-Cola Company to empower five million women entrepreneurs by Effective management systems to integrate the human rights principles Our commitments are integrated into management systems and training. During 2015, 66 bottling plants were operational, 65 of which were certified to OHSAS % of production volume. High-profile health and safety campaigns and gender diversity initiatives are among the programmes which bring our commitments to life Effective monitoring and evaluation of mechanisms of human rights integration Regular reviews check that we adhere to all applicable laws and regulations, our Code of Business Conduct and internal standards. Certification on a regular basis confirms that we are in legal compliance, processes are well implemented, targets are set and reached and reporting is timely and accurate. Both suppliers and Company-owned operations are subject to independent assessments of workplace conditions. We have a well-publicised whistleblower system, with all contacts investigated. Coca-Cola HBC received no fines for non-compliance with human rights-related laws and regulations in Robust Labour Management Policies and Procedures Robust commitments, strategies or policies in the area of labour Relevant policies include our Human Rights Policy and Supplier Guiding Principles (SGPs), available on our website. Our SGPs (workplace accountability audits) are the principal tools to monitor actual and negative performance of our suppliers in terms of labour. Suppliers contractually confirm adherence to Coca-Cola HBC SGPs. Moreover SGPs are part of all issued tenders and purchase orders sent to suppliers. As of 2015, all new suppliers have accepted adherence to the Supplier Guiding Principles. We also have a commitment to engage in social dialogue in the communities where we live and work. Various community development and investment initiatives that serve the needs of the communities in the countries where we operate are included in this report, in the Community trust section Effective management systems to integrate the labour principles These commitments are integrated into our management systems and training programmes. We have independent unions and/or works councils as well as formal communications protocols in place. For details please see relevant sections of our GRI data table included in this report. Comprehensive people development initiatives endeavour to ensure all employees achieve their potential. Pay for entry-level positions is significantly above local minimum wage, where one exists. For details, please see the GRI data table in this report. We conduct gender diversity programmes in our own operations. We work to improve working conditions in informal packaging collection systems. We participate in industry initiatives, e.g. AIM-Progress, SEDEX (procurement). 189
192 UN Global Compact Communicating our Progress continued Effective monitoring and evaluation mechanisms of labour principles integration Regular reviews check that we adhere to all applicable labour laws and regulations and internal standards. Independent audits are undertaken of both Company and supplier workplaces. We have a well-publicised whistleblower system, with all contacts investigated. Coca-Cola HBC received no significant fines for non-compliance with labour laws and regulations in Robust Environmental Management Policies and Procedures Robust commitments, strategies or policies in the area of environmental stewardship We have publicly available policies on water stewardship, climate change, packaging and recycling. All of our suppliers are required to adhere to our Supplier Guiding Principles. Environmental targets to 2020 and performance against them are publicly reported. Since 2011, 100% of wastewater is treated to a level that supports aquatic life. We develop energy-efficient HFC-free refrigeration with suppliers up to 63% more energy-efficient than 2004 models. Details in the GRI data table in this report. We have built 12 CHP plants to date; these reduce emissions from each bottling plant by at least 40%. In 2015 we committed to four out of six initiatives of the We Mean Business coalition prior to the COP21 meeting in Paris Effective management systems to integrate the environmental principles During 2015, 66 bottling plants were operational, 65 of which had achieved ISO certification, accounting for 99.4% of our production volume. In 2015, we achieved certification in energy management for our plant in Prague (Czech Republic). In the period we achieved 13 Gold certificates by the European Water Stewardship Standard (EWS) and we have committed to certify 100% of our plants by 2020 to the European Water Stewardship Standard (EWS) or Alliance for Water Stewardship (AWS). In each of our countries we have a Carbon and Water champion who works with the Corporate Carbon and Water team to plan, investigate, track and implement carbon and water reduction initiatives. Environmental priorities (Carbon and Water reduction) are part of each country s Business Plan process Effective monitoring and evaluation mechanisms for environmental stewardship Regular reviews check that we adhere to all applicable environmental laws and regulations and internal standards. Environmental management systems and data are audited annually by third parties at all bottling plants. Regular internal audits assure that all plants meet environmental requirements (both legal and our internal ones). Regular performance review meetings are held at plant level, country level and corporate level (at least monthly) for the main environmental KPIs. Regular meetings (via webinars) are held at which people responsible for environmental issues at corporate and country level discuss performance and share best practices. There is an intranet-based system for sharing successful practices from all countries and tracking replication by other countries. Within the successful practices database, there are several environmental categories such as water reduction, energy optimisation, waste management, recycled waste, wastewater treatment etc. Compliance and continuous improvement are integral to our management systems. Annual targets are set and progress is monitored by the Board of Directors (via its Social Responsibility Committee), and reported publicly. Coca-Cola HBC received no significant fines for non-compliance with environmental laws and regulations in For details please see the GRI data table in this report. For two consecutive years the Group has rewarded the country with the best annual environmental performance. Robust Anti-Corruption Management Policies & Procedures Robust commitments, strategies or policies in the area of anti-corruption Coca-Cola HBC s zero-tolerance approach to corruption is clearly defined in our Anti-Corruption Policy and Compliance Handbook, which prohibits bribery both in commercial dealings with our customers and suppliers, and in contacts with government authorities and government officials. Our Code of Business Conduct emphasises that compliance is the Coca-Cola HBC way of doing business with integrity. All new employees receive Code of Business Conduct and anti-corruption training, which is refreshed every two years, underlining our zero-tolerance approach to corruption. We expect our suppliers to adhere to and audit them against our Supplier Guiding Principles that require, among other things, compliance with all applicable anti-corruption laws. We have worked with Global Compact local networks and others to conduct anti-corruption initiatives. We publicly report on Code of Business Conduct violations by type and relevant actions/learnings undertaken as a result Effective management systems to integrate the anti-corruption principles All employees undergo mandatory training and certification in the Code of Business Conduct and the Anti-Bribery Policy and Compliance Handbook. We require employees to obtain prior legal approvals before extending anything of value to government officials or hiring any third party to represent us with government officials. We require employees to accurately record expenses related to dealings with government officials and commercial parties. We routinely conduct third-party due diligence to ensure that third parties interacting on our behalf with government officials are carefully chosen against our anti-corruption criteria and agree to abide by our Anti-Bribery Policy. We offer annual risk tailored in-class workshops on anti-corruption to our risk-zone employees. To foster an integrity culture, we run Group-wide Ethics and Compliance Week setting tone from the top and the middle management, and offering employees engaging business ethics and anti-corruption communication. 190
193 Strategic Report Corporate Governance Financial Statements Supplementary Info & Swiss Statutory Reporting Employees can raise concerns about conduct and compliance in various ways, including our confidential whistleblower hotline and system. We also have an open door policy. We commit to protecting from retaliation those who raise concerns in good faith Effective monitoring and evaluation of mechanisms for the integration of anti-corruption We internally audit our third-party due diligence programme and monitor employee anti-corruption training. All contacts are investigated and any material issues are reported to the Audit and Risk Committee. All violations of our Code result in disciplinary action, even dismissal. Our whistleblower system is independently audited by Denkstatt each year. Independent audits of supplier sites are conducted. In 2015, 49 audits took place. Action in Support of Broader UN Goals and Issues Core business contributions to UN goals and issues Coca-Cola HBC s primary contribution is through core business activities. Direct and indirect employment, salaries, supplier payments, community investments and government taxes are among the ways that we generate local economic benefit. Our business also brings indirect benefits, such as technical expertise or inward investment particularly important in developing or transitional economies. We are helping to develop the Russian sugar beet industry, for example, bringing in technical expertise and funding so as to stop importing foreign cane sugar. As a founding member of the CEO Water Mandate and Caring for Climate initiatives, Coca-Cola HBC has committed to address water conservation and CO 2 emissions in our operations, supply chain and beyond. We also support entrepreneurs in our value chain. In Nigeria, we are helping women micro-distributors as part of the global 5by20 programme of The Coca-Cola Company to empower five million female entrepreneurs by Strategic social investments and philanthropy Our four strategic focus areas are: youth/education, sport/active lifestyles, water/environment protection and emergency relief. Most of our community funding was channelled into these four areas in For more information please see the Community Trust section of this report. We engage with UNDP, UNEP, UNESCO and other agencies to address broader UN goals. Partnerships focus on such issues as: access to sanitation, safe drinking water and watershed conservation; youth development and education; entrepreneurship and job creation; HIV/AIDS and malaria and disaster relief and rehabilitation. In 2015 we channelled more than 8.2 million approximately 2.3% of our reported pre-tax profit into community investment programmes. We submit this data to the London Benchmarking Group (LBG) for verification Advocacy and public policy engagement We work with industry associations to inform public policy on sustainability challenges, sharing our experience and advancing practical solutions. Since 2005, our Green Danube partnership has conducted advocacy in 11 countries. We aim to be transparent about our positions calling for urgent action on climate change, for example. We offer consumers healthy products and choice in all markets and we oppose measures that single out products or industries, such as soft drink taxes. We also challenge proposals that focus more on short-term financial gain than long-term sustainability Partnerships and collective action Multi-stakeholder partnerships are critical to solving many sustainability challenges. We participate in many such initiatives, even setting them up where none exist. We have supported the development of Local Networks and in 2015 were actively involved in nine UN Global Compact networks. Since 2005, our Green Danube partnership with the ICPDR has been active in conservation, awareness-raising, education and advocacy in 11 countries. In total, we conduct community water and environmental protection partnerships in 24 countries. Underpinned by a global agreement between the Coca-Cola System and the International Federation of Red Cross and Red Crescent societies, we work with national Red Cross societies on emergency relief and other locally relevant issues. We have led the set-up of recovery organisations in 19 countries, which collect, recycle or recover beverage packaging. We also supported the establishment in Austria of the first PET-to-PET recycling plant, closing the recycling loop. Active lifestyles and youth development are other key areas where we work with NGOs, government agencies and other technical experts. Corporate Sustainability Governance and Leadership CEO commitment and leadership The CEO and Management of Coca-Cola HBC support the UN Global Compact and oversee our work in the areas of human rights, labour rights, the environment and anti-corruption, and through these also contribute to the UN s recently articulated Sustainable Development Goals, as highlighted in his statement at the beginning of this report. The CEO has incentivised targets related to sustainable development in his performance plan, as do all other OPCO members. The CEO is actively involved in our sustainability agenda and attends quarterly meetings of the Board s Social Responsibility Committee. The CEO also participates in top-to-top meetings with partners such as The Coca-Cola Company and other bottlers to ensure alignment of priorities including sustainability issues, strategies and targets. 191
194 UN Global Compact Communicating our Progress continued Board adoption and oversight The Board of Directors strongly supports the UN Global Compact and our work in the local networks, as seen by the Chairman s letter in the Annual Integrated Report. The Social Responsibility Committee of the Board of Directors meets quarterly to review and guide sustainability performance. The chairman is Sir Michael Llewellyn-Smith, the Senior Independent Director on our Board Stakeholder engagement Proactively engaging with our key stakeholders is an important part of defining the issues that are material to our business. We engage with a wide range of stakeholders on our sustainability pillars including employees, consumers, customers and suppliers, as well as non-governmental organisations (NGOs), regulatory bodies, industry associations and authorities, both local and national, and the communities in which we operate. Our annual Stakeholder Forum brings together academics, government, industry, suppliers and other participants in our value chain. Please see more about this in the GRI Index section of this report. We also participate in multi-stakeholder partnerships to address issues that are material to our business and our communities. Progress against the United Nations Global Compact CEO Water Mandate Coca-Cola HBC is a founder signatory of the UN Global Compact s CEO Water Mandate. An in-depth discussion of our water stewardship strategy and progress can be found our Integrated Annual Report which together with this section serve as our COP-Water. Below is a summary of our progress in the six focus areas of the Water Mandate. CEO Water Mandate 1. Direct Operations Conduct a comprehensive water-use assessment to understand Company s water use in direct production. Set targets for operations for water conservation and wastewater treatment, framed in a corporate cleaner production and consumption strategy. Invest in and use new technologies to achieve these goals. Raise awareness in corporate culture. Include water sustainability in business decision-making. Coca-Cola HBC s progress Awarded new European Water Stewardship Gold Level certification at eight facilities in 2015, and overall since sites have the Gold EWS. 64.3% reduction in direct water footprint since 2004 target is 75% reduction by % improvement in water efficiency since 2004 target is 40% improvement by In 2015 we reset the target: 30% improvement in 2020 vs % of wastewater treated since All bottling plants undertake the following reviews: annual water footprint assessment; bi-annual risk assessments; source vulnerability assessments; and source water protection programmes. All are subject to internal audit. Using the Global Water tool for water stress projection per plant. During 2015, 66 plants were operational, 65 of which were ISO certified, accounting for 99.4% of annual production volume. Working with equipment suppliers to develop and implement water-saving technologies and more water-efficient cleaning methods. Work with UNIDO (United Nations Industrial Development Organization) to introduce a Chemical leasing project (paying not for kilogrammes of chemical used but for cleaning effectiveness which reduces water and chemicals in the plant). Mandatory Top 10 Water Savers initiative which helps plants across our operations identify water-saving opportunities (68.2% implementation rate in 2015) Invested 4.8 million in water reduction initiatives in Voluntary employee participation is encouraged in watershed protection initiatives. Our new Near Loss-leading KPI encourages our employees to report water-saving ideas and opportunities. In 2015 we introduced a true cost of water and water stress multiplier to support decision-making process for investment projects. 192
195 Strategic Report Corporate Governance Financial Statements Supplementary Info & Swiss Statutory Reporting 2. Supply Chain and Watershed Management Encourage suppliers to improve water conservation, quality monitoring, wastewater treatment, recycling. Encourage suppliers to assess their water usage and impacts. Share water sustainability practices established and emerging with suppliers. Encourage major suppliers to regularly report progress against goals. Build capacities to analyse and respond to watershed risk. 3. Collective Action Build ties with civil society organisations, especially regional and local. Work with national, regional and local governments and authorities to address water sustainability issues and policies, as well as with relevant international bodies. Encourage development and use of technologies, including efficient irrigation methods, new plant varieties, drought resistance, water efficiency and salt tolerance. Actively support Country Networks of the UN Global Compact. Support water initiatives and collaborate with UN bodies and IGOs. 4. Public Policy Contribute to government regulation and creation of market mechanisms to drive water sustainability agenda. Advocate water sustainability in global and local policy discussions, presenting role and responsibility of the private sector in supporting integrated water resource management. Partner with government, business, civil society and others to advance knowledge, intelligence and tools. Support policy-oriented bodies and frameworks. 5. Community Engagement Endeavour to understand the water and sanitation challenges in our communities and how we impact those challenges. Be active community members, and encourage/support local government, groups and initiatives advancing water and sanitation. Work with public authorities to support when appropriate development of adequate water infrastructure, including water and sanitation delivery systems. Undertake water-resource education and awareness campaigns with local stakeholders. 6. Transparency Describe actions and investments in relation to the CEO Water Mandate in a COP, referring to performance indicators such as GRI. Publish and share water strategies (targets, results, areas for improvement) in corporate reports, using GRI water indicators. Be transparent in dealings and conversations with governments and other public authorities on water issues. Tier 1 suppliers, as defined on page 173 of this report, are required to achieve ISO certification. Sustainable agriculture programme. Supplier Guiding Principles. Supplier risk assessment for Tier 1 suppliers includes water stress risk and is updated annually. Water footprint measures are used in supply chain. Bi-annual risk assessments study local context for bottling plants. Source vulnerability assessments at all plants. Source water protection programmes at all plants. Commitment to achieve 100% certification of all plants by 2020 by the European Water Stewardship or Alliance for Water Stewardship. Environmental and watershed protection partnerships in 24 countries. Community watershed partnerships involve government agencies, NGOs and communities in 24 countries. Work with UN bodies, IGOs and NGOs on water initiatives, including UNDP, UNICEF, GWP, WWF and many local community NGOs in various countries Through our award-winning Green Danube partnership, we have had active programmes running for the past 10 years with strategic NGOs in our markets in countries of the Danube River basin. These include public education and awareness-raising initiatives each year; engagement in and support of freshwater and wetland habitat restoration activities, which also include benefits such as the preservation of biodiversity in the affected wetlands; and other community benefits such as better quality drinking water and restored community water sporting opportunities. Projects include promoting rainwater harvesting in water-scarce areas in Greece, borehole projects for communities around our Nigerian plants in water-scarce areas to ensure safe drinking water for communities in need, the honouring of World Water Day to raise employee awareness in various markets of operations, Water Ambassadorship projects in Africa, and cleaning of watershed areas and river banks in many countries in Europe. We were active members of Country Networks of the Global Compact in nine countries in Green Danube partnership since 2005 actively engages in public policy. Support development of national policy and regulatory frameworks for integrated water resources management. More on this on our website and at Founding member of the Water Footprint Network. Founder signatory of the CEO Water Mandate. Work in partnerships with local governments, communities and civil society to support safe water access and sanitation initiatives in a number of countries, from Nigeria to Romania. UN World Water Day awareness-raising and celebrations, spreading the word with hashtags on social media for scope. Annual river celebrations such as International Danube Day and raising public awareness about freshwater conservation and understanding of the Danube, Sava, Vistula and Volga rivers, the Black Sea, and various other watersheds and water sources in our markets. Clean-ups of waterways, embankments, oxbows and floodplains, and conservation of wetland habitat in most countries of operation. School education on water sustainability in eight countries using our Danube Box tool-kit. We have also launched three similar initiatives for other rivers and the Black Sea, building on learnings from other country examples, and reaching millions of children in class, online and on social media. Bi-annual risk assessments study on water and sanitation in local communities. GRI reporter since 2003; GRI G4 compliant as of 2015 Report to CDP Water since Use Global Water Tool for identification of production sites which are in the area of river basins with water stress, in order to plan and implement solid water reduction actions. 193
196 UN Global Compact Communicating our Progress continued UNGC Caring for Climate Business Forum progress Coca-Cola HBC is a founder signatory of the UN Global Compact s Caring for Climate initiative. We provide detailed information on our approach and results in our disclosure to the Carbon Disclosure Project (CDP), as well as in our Integrated Annual Report. Both of these serve as our COP-Climate. Below is a summary of our progress against the five commitments in Caring for Climate. Caring for Climate Taking practical actions now to increase the efficiency of energy usage and to reduce the carbon burden of our products, services and processes, to set voluntary targets for doing so, and to report publicly on the achievement of those targets annually in our COP for climate. Building significant capacity within Coca-Cola HBC to understand fully the implications of climate change for our business and to develop a coherent business strategy for minimising risks and identifying opportunities. Engaging fully and positively with our national governments, intergovernmental organisations and civil society organisations to develop policies and measures that provide an enabling framework for the business sector to contribute effectively to building a low-carbon and climate-resilient economy. Coca-Cola HBC s progress Improved energy efficiency (per litre of produced beverage) by 39.6% in 2015 vs Cut total energy usage by 20% despite 36% increase in production volume since 2004 Reduced absolute emissions from operations (Scope 1 & 2, as defined on page 184 of this report) by 23.5% and emissions intensity (Scope 1 & 2 per litre of beverage) by 43.6% since 2004 Committed to reduce direct emissions by 20% by 2020 vs and as we are set to reach this target earlier, in 2015 we set a new commitment: to reduce carbon emissions intensity from our operations by 50% by 2020 vs Committed to reduce carbon intensity across the whole value chain by 25% by 2020 vs The aforementioned commitments are science-based commitments approved by the World Resources Institute (WRI) Constructed 12 on-site Combined Heat and Power plants 2 during 2015 in Nigeria. Each reduces plant emissions by 40%, with food-grade CO 2 recovery further boosting this figure Renewable energy projects include Photo Voltaic panels and heat pumps Programmes include: Top 18 Energy Saves and 10 Most Basic Energy Savers in all plants Energy-saving projects in our plants resulted in savings of 2.1 million during 2015 Developed energy-efficient and HFC-free refrigeration up to 63% more efficient than 2004 models Set up 19 organisations that collect, recycle or recover the equivalent of 69% of our packaging During 2015, 66 plants were operational, 65 of which were ISO certified, accounting for 99.4% of annual production volume One plant is certified to ISO (energy management) Have calculated and reported on total carbon footprint annually since 2006 Describe risks and opportunities to the Carbon Disclosure Project (2015 result: 99B; 2014 result: 96A) media/files/c/cchbc/documents/environment/energy%20and%20 climate%20change/programmeresponseinvestor%20cdp% pdf Risks and opportunities are also in the Integrated Annual Report. Climate change risks are embedded in the overall Enterprise Risk management process Water stewardship is our main mitigation strategy Emergency relief (disaster relief) is part of the Community pillars Carbon and water reduction initiatives fully embedded in each country s business plan Carbon and water Champion in each country and at corporate level The climate change-related information in our Integrated Annual Report is based on CDSB CCRF (the Climate Disclosure Standards Board Climate Change Reporting Framework). Prior to COP21 in Paris, we committed to 4 out of 6 initiatives of the We Mean Business coalition Previously participated actively at COP15; signed Copenhagen, Bali and 2 degrees communiqués Liberty Island, Hungary five-year restoration programme with WWF, supported by EU LIFE+ Nature Conservation Fund The European Commission named our Combined Heat and Power (CHP) programme an Official Partner of the Sustainable Energy Europe campaign 194
197 Strategic Report Corporate Governance Financial Statements Supplementary Info & Swiss Statutory Reporting Working collaboratively with other enterprises nationally and sectorally, and along our value chains, by setting standards and taking joint initiatives aimed at reducing climate risks, assisting with adaptation to climate change and enhancing climate-related opportunities. Becoming an active business champion for rapid and extensive response to climate change with peers, employees, customers, investors and the broader public. Tier 1 suppliers, as defined on page 173 of this report, are required to gain ISO certification Develop with suppliers HFC-free, energy-efficient refrigeration that is up to 63% more efficient than 2004 Work with suppliers to light-weight packaging and increase recycled PET content in 2015 rpet was 15,838 tonnes, 19.4% higher than in 2014 Launched PlantBottle TM, made from up to 30% renewable plant-based sources, in 10 countries Developed with suppliers the lightest can in Europe (B-can) Led set-up of 19 recovery organisations; equivalent of 69% of our packaging is recovered or recycled Sustainable agriculture programme Through the 19 recovery organisations we have helped set up, we provide infrastructure and education to encourage consumers to recycle Provide support to WWF Earth Hour campaign in some of our countries of operation World Water Day campaign in several countries Training programmes for employees: local training; central environmental training for people from production, engineering, quality, sustainability (more than 220 people from 23 countries trained in the last years); training in Super Ambassador programme for Key Account Managers within the commercial function Work with suppliers on development of a range of packaging optimisation and light-weighting initiatives, and on developing eco-friendly coolers 195
198 Shareholder Information We take great pride in being regarded as a transparent and accessible company in all our communications with the investment communities around the world. Coca-Cola HBC engages with key financial audiences, including institutional investors, sell-side analysts and financial journalists, as well as our Company s shareholders. The Investor Relations department manages the interaction with these audiences by attending ad hoc meetings and investor conferences throughout the year, in addition to the regular meetings and presentations held at the time of the results announcements. Analysis by shareholder Listings Coca-Cola HBC AG (LSE: CCH) was admitted to the premium listing segment of the Official List of the UK Listing Authority and to trading on the London Stock Exchange s main market for listed securities on 29 April With effect from 29 April 2013, Coca-Cola HBC AG s shares were also admitted on the Athens Exchange (ATHEX: EEE). Coca Cola HBC AG has been included as a constituent of the FTSE 100 and FTSE All-Share indices from 20 September London Stock Exchange Ticker symbol: CCH ISIN: CH SEDOL: B9895B7 Reuters: CCH.L Bloomberg: CCH LN Athens Exchange Ticker symbol: EEE ISIN: CH Reuters: EEEr.AT Bloomberg: EEE GA 1-10,000: 3% 10, ,000: 3% 100,001-1,000,000: 12% 1,000,001-over: 79% Treasury shares: 3% * Percent has been calculated without major shareholders, Kar-Tess Holding and The Coca-Cola Company Geographic concentration (excludes The Coca-Cola Company and Kar-Tess Holding) UK: 40% Continental Europe: 24% United States: 20% Rest of the world: 13% Retail investors: 3% Credit rating Standard & Poor s: L/T BBB+, S/T A2 BBB, stable outlook Moody s: L/T Baa1, S/T P2, stable outlook Share price performance LSE: CCH In per share Close High Low Market capitalisation (at close, m) 5,237 4,475 6,479 ATHEX: EEE In per share Close High Low Market capitalisation (at close, m) 7,158 5,713 7,721 Source: Bloomberg Share capital In 2015, the share capital of Coca-Cola HBC increased by the issue of 322,050 new ordinary shares following the exercise of stock options pursuant to the Group s employee stock option plan. Total proceeds from the issuance of the shares under the stock option plan amounted to 5.1 million. Following the above changes, and including 6,445,060 ordinary shares held as treasury shares, on 31 December 2015 the share capital of the Group amounted to 2,000.1 million and comprised 368,141,297 shares with a nominal value of CHF 6.70 each. Major shareholders The principal shareholders of the Group are Kar-Tess Holding (a Luxembourg company), which holds approximately 23.2% of the outstanding ordinary shares, and The Coca-Cola Company, which indirectly holds approximately 23.1% of the Group s outstanding ordinary shares. Dividends For 2015, the Board of Directors has proposed a 0.40 Euro dividend per share in line with the Group s progressive dividend policy. This compares to a dividend payment of 0.36 Euro per share for For more information on our dividend policy and dividend history, please visit our website at Financial calendar 13 May 2016 First quarter trading update 21 June 2016 Annual General Meeting 11 August 2016 Half-year financial results 9 November 2016 Third quarter trading update Corporate website Shareholder and analyst information Shareholders and financial analysts can obtain further information by contacting: Investor Relations Tel: investor.relations@cchellenic.com IR website: 196
199 Strategic Report Corporate Governance Financial Statements Supplementary Info & Swiss Statutory Reporting Swiss statutory reporting 198 Report of the statutory auditor on Coca-Cola HBC AG s consolidated financial statements 199 Report of the statutory auditor on Coca-Cola HBC AG s financial statements 200 Coca-Cola HBC AG s financial statements 209 Report of the statutory auditor on the Statutory Remuneration Report 210 Statutory Remuneration Report 197
200 Swiss statutory reporting continued Report of the statutory auditor to the General Meeting of Coca-Cola HBC AG Steinhausen/Zug Report of the statutory auditor on Coca-Cola HBC AG s consolidated financial statements As statutory auditor, we have audited the accompanying consolidated financial statements of Coca-Cola HBC AG, which comprise the Consolidated Balance Sheet, Consolidated Income Statement, Consolidated Statement of Comprehensive Income, Consolidated Statement of Changes in Equity, Consolidated Cash Flows Statements and Notes to the Consolidated Financial Statements (pages 106 to 163), for the year ended 31 December Board of Directors responsibility The Board of Directors is responsible for the preparation and fair presentation of the consolidated financial statements in accordance with the International Financial Reporting Standards (IFRS) and the requirements of Swiss law. This responsibility includes designing, implementing and maintaining an internal control system relevant to the preparation and fair presentation of consolidated financial statements that are free from material misstatement, whether due to fraud or error. The Board of Directors is further responsible for selecting and applying appropriate accounting policies and making accounting estimates that are reasonable in the circumstances. Auditor s responsibility Our responsibility is to express an opinion on these consolidated financial statements based on our audit. We conducted our audit in accordance with Swiss law and Swiss Auditing Standards as well as the International Standards on Auditing. Those standards require that we plan and perform the audit to obtain reasonable assurance whether the consolidated financial statements are free from material misstatement. An audit involves performing procedures to obtain audit evidence about the amounts and disclosures in the consolidated financial statements. The procedures selected depend on the auditor s judgement, including the assessment of the risks of material misstatement of the consolidated financial statements, whether due to fraud or error. In making those risk assessments, the auditor considers the internal control system relevant to the entity s preparation and fair presentation of the consolidated financial statements in order to design audit procedures that are appropriate in the circumstances, but not for the purpose of expressing an opinion on the effectiveness of the entity s internal control system. An audit also includes evaluating the appropriateness of the accounting policies used and the reasonableness of accounting estimates made, as well as evaluating the overall presentation of the consolidated financial statements. We believe that the audit evidence we have obtained is sufficient and appropriate to provide a basis for our audit opinion. Opinion In our opinion, the consolidated financial statements of Coca-Cola HBC AG for the year ended 31 December 2015 give a true and fair view of the financial position, the results of operations and the cash flows in accordance with International Financial Reporting Standards (IFRS) and comply with Swiss law. Report on other legal requirements We confirm that we meet the legal requirements on licensing according to the Auditor Oversight Act (AOA) and independence (article 728 CO and article 11 AOA) and that there are no circumstances incompatible with our independence. In accordance with article 728a paragraph 1 item 3 CO and Swiss Auditing Standard 890, we confirm that an internal control system exists which has been designed for the preparation of consolidated financial statements according to the instructions of the Board of Directors. We recommend that the consolidated financial statements submitted to you be approved. PricewaterhouseCoopers AG Daniel Anliker Audit expert Auditor in charge Philipp Kegele Zürich, 17 March
201 Strategic Report Corporate Governance Financial Statements Supplementary Info & Swiss Statutory Reporting Report of the statutory auditor to the General Meeting of Coca-Cola HBC AG Steinhausen/Zug Report of the statutory auditor on Coca-Cola HBC AG s financial statements As statutory auditor, we have audited the accompanying financial statements of Coca-Cola HBC AG, which comprise the Balance Sheet, Statement of Income and Notes to the Financial Statements (pages 200 to 208), for the year ended 31 December Board of Directors responsibility The Board of Directors is responsible for the preparation of the financial statements in accordance with the requirements of Swiss law and the Company s articles of incorporation. This responsibility includes designing, implementing and maintaining an internal control system relevant to the preparation of financial statements that are free from material misstatement, whether due to fraud or error. The Board of Directors is further responsible for selecting and applying appropriate accounting policies and making accounting estimates that are reasonable in the circumstances. Auditor s responsibility Our responsibility is to express an opinion on these financial statements based on our audit. We conducted our audit in accordance with Swiss law and Swiss Auditing Standards. Those standards require that we plan and perform the audit to obtain reasonable assurance whether the financial statements are free from material misstatement. An audit involves performing procedures to obtain audit evidence about the amounts and disclosures in the financial statements. The procedures selected depend on the auditor s judgement, including the assessment of the risks of material misstatement of the financial statements, whether due to fraud or error. In making those risk assessments, the auditor considers the internal control system relevant to the entity s preparation of the financial statements in order to design audit procedures that are appropriate in the circumstances, but not for the purpose of expressing an opinion on the effectiveness of the entity s internal control system. An audit also includes evaluating the appropriateness of the accounting policies used and the reasonableness of accounting estimates made, as well as evaluating the overall presentation of the financial statements. We believe that the audit evidence we have obtained is sufficient and appropriate to provide a basis for our audit opinion. Opinion In our opinion, the financial statements of Coca-Cola HBC AG for the year ended 31 December 2015 comply with Swiss law and the Company s articles of incorporation. Report on other legal requirements We confirm that we meet the legal requirements on licensing according to the Auditor Oversight Act (AOA) and independence (article 728 CO and article 11 AOA) and that there are no circumstances incompatible with our independence. In accordance with article 728a paragraph 1 item 3 and article 11 AOA and Swiss Auditing Standard 890, we confirm that an internal control system exists which has been designed for the preparation of financial statements according to the instructions of the Board of Directors. We further confirm that the proposed appropriation of available earnings and reserves complies with Swiss law and the Company s articles of incorporation. We recommend that the financial statements submitted to you be approved. PricewaterhouseCoopers AG Daniel Anliker Audit expert Auditor in charge Philipp Kegele Zürich, 17 March
202 Swiss statutory reporting continued Coca-Cola HBC AG s financial statements, Zug Balance Sheet Note As at 31 December 2015 ASSETS Cash and cash equivalents 536,616 Short-term receivables from direct and indirect participations 2.1 6,655,964 Short-term receivables from third parties 829,446 Prepaid expenses and accrued income 217,690 Total current assets 8,239,716 Investment in subsidiary 2.2 8,864,976,905 Property, plant and equipment 1,687,394 Total non-current assets 8,866,664,299 Total assets 8,874,904,015 CHF LIABILITIES AND SHAREHOLDERS EQUITY Trade payables due to third parties 1,201,896 Short-term liabilities to direct and indirect participations 2.3 4,718,144 Accrued expenses ,997,970 Total short-term liabilities 22,918,010 Long-term interest-bearing liabilities to indirect participations ,361,819 Provisions 249,285 Total long-term liabilities 83,611,104 Share capital 2.5 2,466,546,690 Legal capital reserves Reserves from capital contributions 6,137,759,778 Reserves for treasury shares ,298,196 Retained earnings Results carried forward 200,291,137 Loss of the year (55,673,772) Treasury shares 2.6 (65,847,128) Total shareholders equity 2.7 8,768,374,901 Total liabilities and shareholders equity 8,874,904,
203 Strategic Report Corporate Governance Financial Statements Supplementary Info & Swiss Statutory Reporting Statement of Income Note For the year ended 31 December 2015 CHF Dividend income 254,173,995 Other operating income ,396,113 Total operating income 278,570,108 Personnel expenses (16,119,421) Other operating expenses (19,921,664) Write down of investment 2.2 (254,173,996) Depreciation on property, plant and equipment (198,837) Total operating expenses (290,413,918) Operating loss (11,843,810) Finance income 936,859 Finance expenses (7,609,779) Extraordinary, non-recurring or prior period expenses 2.9 (36,844,908) Loss before tax (55,361,638) Direct taxes (312,134) Loss for the year (55,673,772) 201
204 Swiss statutory reporting continued Notes to the Financial Statements of Coca-Cola HBC AG, Zug Introduction Coca-Cola HBC AG ( the Company ) was incorporated on 19 September 2012 by Kar-Tess Holding. On 11 October 2012, the Company announced a voluntary share exchange offer to acquire all outstanding ordinary registered shares and all American depositary shares of Coca-Cola Hellenic Bottling Company S.A., Maroussi (GR) ( CCHBC SA ). As a result of the successful completion of this offer, on 25 April 2013 the Company acquired 96.85% of the issued CCHBC SA shares, including shares represented by American depositary shares, and became the new parent company of the Group (the Company and its direct and indirect subsidiaries). On 17 June 2013, the Company completed its statutory buy-out of the remaining shares of CCHBC SA that it did not acquire upon completion of its voluntary share exchange offer. 1. Principles Accounting principles applied in the preparation of the financial statements These financial statements have been prepared in accordance with the provisions of commercial accounting as set out in the Swiss Code of Obligations (Art. 957 to 963b CO, applicable to the year ended 31 December 2015). Significant accounting and valuation principles are described below: Dividend income Dividend income is recognised when the right to receive payment is established. Other operating income The Company provides management services to its principal subsidiaries and acts as guarantor to its principal subsidiary, Coca-Cola HBC Finance B.V. The income from these services is recognised in the accounting period in which the service is provided. Exchange rate differences The accounting records of the Company are retained in Euro ( ) and translated to Swiss francs (CHF) for presentation purposes. Except for investments in subsidiaries, property, plant and equipment, long-term liabilities and equity, which are translated at historical rates, all other assets and liabilities denominated in foreign currencies are translated into CHF using the closing exchange rate as at 31 December Income and expenses are translated into CHF at the average exchange rate of the reporting year. Net unrealised exchange losses are recorded in the income statement; other than net unrealised gains which are deferred within accrued liabilities. Exchange gains or losses arising from the remeasurement of balance sheet amounts as well as those from business transactions denominated in foreign currencies are recorded in the income statement. Income statement Exchange rates Balance sheet as at 31 December 2015 for the year ended 31 December 2015 EUR USD 0.99 GBP 1.47 Investment in subsidiary Investment in subsidiary is valued at historical cost and tested for impairment if identified triggering events occur. Capitalised organisational costs Based on the new accounting law, organisational costs are expensed. An amount of CHF 36,844,908 has been recorded in extraordinary expenses which corresponds to organisational costs that have been capitalised in the past and were fully amortised as at 1 January Property, plant and equipment Depreciation is calculated on the basis of the following useful lives and in accordance with the following methods: Property, plant and equipment Useful life Method Leasehold improvements (building) 20 years 5% linear Leasehold improvements (office infrastructure) 10 years 10% linear Building infrastructure 12 years 8.33% linear Furniture and fixtures, office equipment and other tangible fixed assets 8 years 12.5% linear Telephony infrastructure 7 years 12.5% linear Communication equipment, computers and PCs 4 years 14.29% linear Tablets 3 years 33.33% linear 202
205 Strategic Report Corporate Governance Financial Statements Supplementary Info & Swiss Statutory Reporting Treasury shares Treasury shares are usually recognised at acquisition cost and deducted from shareholders equity at the time of acquisition. If treasury shares are sold, the gain or loss arising is recognised in the income statement as finance income or finance expense. 2. Information relating to the balance sheet and statement of income 2.1. Short-term receivables from direct and indirect participations Name of participation Interest-bearing As at 31 December 2015 CHF CCB Management Services GmbH, Vienna No 6,030,398 Coca-Cola HBC Finance B.V., Amsterdam No 625,566 6,655, Investments in subsidiaries As at 31 December 2015 Direct subsidiary CHF Coca-Cola HBC Holdings B.V., Amsterdam 1 9,119,150,901 Write down of investment 2 (254,173, 996) Investments in subsidiaries 8,864,976, Coca-Cola HBC Holdings B.V., Amsterdam was incorporated on 26 June The amount of write down is equal to the dividend received on 29 December 2015 from Coca-Cola HBC Holdings B.V. of CHF 254,173,996. In 2015 the Company has adopted a practice to reduce the value of its investment in Coca-Cola HBC Holdings B.V. by an amount equal to the dividend received from that subsidiary. The principal direct and indirect participations of the Company are disclosed in Note 33 to the consolidated financial statements Short-term liabilities to direct and indirect participations and accrued expenses As at 31 December 2015 CHF CCB Management Services GmbH, Vienna 3,088,364 Coca-Cola Hellenic Business Service Organisation, Sofia 3,706 Coca-Cola HBC Ireland Limited, Dublin 66,043 Coca-Cola HBC Finance B.V. Amsterdam 1,560,031 Total short-term liabilities to direct and indirect participations 4,718,144 Direct taxes 294,105 Management incentive plan (MIP) 3,770,492 Personnel-related expenses (social security and insurance, payroll taxes) 1,155,494 Other accrued expenses 2,362,305 Net unrealised gains from foreign currency translation 9,415,574 Total accrued expenses 16,997, Long-term interest-bearing liabilities Long-term interest-bearing liabilities comprise loans from Coca-Cola HBC Finance B.V. On 28 July 2015 and 13 August 2015 the Company entered into interest-bearing long-term loan agreements with Coca-Cola Finance B.V. with a nominal amount of 132,416,396 and 66,000,000 respectively. The loans with Coca-Cola HBC Finance B.V. mature on 31 December The outstanding amount of the loans as at 31 December 2015 was CHF 83,361,
206 Swiss statutory reporting continued 2. Information relating to the balance sheet and statement of income continued 2.5 Share capital Number of shares Nominal value CHF Total CHF Share capital as at 1 January ,819, , ,955 Share issued to employees exercising stock options 322, ,157,735 Share capital as at 31 December ,141, ,466,546, Treasury shares The number of treasury shares held by the Company and its subsidiaries qualifying under article 659b SCO and their movements are as follows: Book value per share Total Treasury shares (held by subsidiaries) Number of shares CHF CHF Total ordinary treasury shares as at 31 December ,430, ,298,196 Treasury shares held by the Company Number of shares Book value per share CHF Total CHF Treasury shares held by the Company as at 31 December , (1,950,100) Shares purchased as part of Buy-back programme in ,000, (63,897,028) Treasury shares held by the Company as at 31 December ,014, (65,847,128) 1. On 23 June 2015, the Annual General Meeting adopted a proposal for share buy-back of up to 3,000,000 ordinary shares. The programme started on 17 August 2015 and finished on 21 December The Company purchased 3,000,000 of its ordinary shares of CHF 6.70 each at an average price of GBP 1, pence per share (minimum price of GBP 1, pence and maximum price of GBP 1, pence). 2.7 Equity Share capital Legal capital reserves Retained earnings Treasury shares Total Reserves from capital Reserves for treasury shares contributions held by subsidiaries CHF CHF CHF CHF CHF CHF Balance as at 1 January ,464,388,955 6,276,922,292 85,298, ,291,137 (1,950,100) 9,024,950,480 Shares issued to employees exercising stock options 2,157,735 3,452,593 5,610,328 Dividends 1 (142,615,107) (142,615,107) Own shares bought back 2015 (63,897,028) (63,897,028) Loss of the year (55,673,772) (55,673,772) Balance as at 31 December ,466,546,690 6,137,759,778 85,298, ,617,365 (65,847,128) 8,768,374, At the Annual General Meeting of the Company held on 23 June 2015, the shareholders approved the distribution of a 0.36 dividend per each ordinary registered share. The dividend was paid on 28 July 2015 and amounted to CHF 142,615, Other operating income 2015 Management fees 22,272,052 Guarantee fee 2,124,061 Total other operating income 24,396,113 Management fees relate to service income earned from services provided to the Company s direct and indirect participations. Guarantee fee is the income the Company receives for the services provided as guarantor to Coca-Cola HBC Finance B.V. 204
207 Strategic Report Corporate Governance Financial Statements Supplementary Info & Swiss Statutory Reporting 2.9. Extraordinary, non-recurring or prior period expenses Extraordinary amortisation of CHF 36,844,908 resulted from capitalised organisational costs that have been fully amortised as at 1 January 2015, according to the new accounting law. 3. Other information 3.1. Net release of hidden reserves No hidden reserves have been released for the year ended 31 December Number of employees In 2015 on an annual average basis, the number of full-time-equivalent employees did not exceed Lease liabilities (not terminable or expiring within 12 months of balance sheet date) 2015 Residual term (years) CHF Office rental, Turmstrasse 26, Zug 1 to 5 years 799,427 Total lease liabilities 799, Pension liabilities As at 31 December 2015 the liability to the pension scheme amounted to CHF 264, Contingent liabilities Euro medium term note programmes In 2001 the Group established a 2.0bn Euro medium term note programme (the Old EMTN programme ) which was increased to 3.0bn in April In June 2013, a new 3.0bn Euro medium term note programme (the New EMTN Programme ) was established to replace the Old EMTN programme. The New EMTN programme was updated in September 2014 and then again in September Notes are issued under the New EMTN programme through the Company s wholly owned subsidiary, Coca-Cola HBC Finance B.V., a private limited liability company established under the laws of the Netherlands, and are guaranteed by the Company and Coca-Cola HBC Holdings B.V. In November 2009 Coca-Cola HBC Finance B.V. issued 300m and in March 2011 issued 300m, in total 600m 4.25% notes due 2016 under the Old EMTN programme, which are guaranteed by Coca-Cola HBC Holdings B.V. as the original guarantor and also the Company which acceded as a guarantor in June 2013 pursuant to a supplemental trust deed. On 18 June 2013 Coca-Cola HBC Finance B.V. issued 800m 2.375% notes due 18 June 2020 under the New EMTN programme, which are guaranteed by the Company and Coca-Cola HBC Holdings B.V. As at 31 December 2015, a total of 1.4bn in notes issued under the EMTN programme were outstanding. A further amount of 2.2bn is available for issuance under the new EMTN programme. Syndicated multi-currency revolving credit facility In June 2015, a new syndicated multi-currency revolving credit facility agreement was signed for 500m. Coca-Cola HBC Finance B.V. is the original borrower, ING Bank N.V., London Branch the facility agent and the Company and Coca-Cola HBC Holdings B.V are the two guarantors. Commercial paper programme In October 2013 the Group established a new 1.0bn Euro commercial paper programme which was updated in September Notes are issued under the Euro commercial paper programme by Coca-Cola HBC Finance B.V. and guaranteed by the Company and Coca-Cola HBC Holdings B.V. The outstanding amount under the commercial paper programmes was 173.5m as at 31 December 2015 (2014: 100.0m). Credit support provider On 18 July 2013 the Company signed as credit support provider to Deutsche Bank-Frankfurt, to J.P. Morgan Securities plc, to Credit Suisse International, to Crēdit Suisse AG, to ING Bank N.V, to Sociētē Gēnērale and to The Royal Bank of Scotland plc in favour of Coca-Cola HBC Finance B.V. for the obligations as defined in the ISDA Master Agreements. 1 On 24 July 2013 the Company signed as credit support provider to the Governor and Company of the Bank of Ireland, Dublin in favour of Coca-Cola HBC Finance B.V. for the obligations as defined in the ISDA Master Agreement The ISDA (International Swap Dealers Association) Master Agreement is a standardised form issued by the International Swap Dealers Association Inc. to be used for credit support transactions. 205
208 Swiss statutory reporting continued 3. Other information continued 3.5. Contingent liabilities continued On 8 August 2013 the Company signed as credit support provider to Citibank N.A. in favour of CCHBC Bulgaria AD for the obligations as defined in the ISDA Master Agreement. 1 On 8 August 2013 the Company signed as credit support provider to Citibank N.A. in favour of Bankya Mineral Waters Bottling Company EOOD (subsequently merged into Coca-Cola HBC Bulgaria AD) for the obligations as defined in the ISDA Master Agreement. 1 On 24 June 2014 the Company signed as credit support provider to Intesa Sanpaolo S.pA. in favour of Coca-Cola HBC Finance B.V. for the obligations as defined in the ISDA Master Agreement. 1 On 5 October 2015 the Company signed as credit support provider to Macquarie Bank International Limited in favour of Coca-Cola HBC Finance B.V. for the obligations as defined in the ISDA Master Agreement. 1 On 24 June 2014 Coca-Cola HBC AG signed as credit support provider to Intesa Sanpaolo S.pA. in favour of Coca-Cola HBC Finance B.V. for the obligations as defined in the ISDA Master Agreement The ISDA (International Swap Dealers Association) Master Agreement is a standardised form issued by the International Swap Dealers Association Inc. to be used for credit support transactions Significant shareholders As at 31 December 2015, there were two shareholders exceeding the threshold of 5% voting rights in the Company s share capital. Percentage of issued share capital 1 Percentage of outstanding share capital 2 Number Date of shares Total Kar-Tess Holding ,355, % 23.6% Total shareholdings related to The Coca-Cola Company ,112, % 23.5% 1. Basis: total issued share capital including treasury shares. Share basis 368,141, Basis: total issued share capital excluding treasury shares. Share basis 361,696, Shareholdings, conversion and option rights The table below sets out a comparison of the interests in the Company s total issued share capital that the members of the Board of Directors ( Directors ) and Operating Committee hold (all of which, unless otherwise stated, are beneficial interests or are interests of a person connected with a Director or a member of the Operating Committee) and the interests in the Company s share capital Percentage of issued share capital 1 Percentage of outstanding share capital 2 Number of shares Directors Dimitris Lois 35, % 0.01% Anastassis G. David 3 George A. David Irial Finan Christo Leventis 4 Antonio D Amato Sir Michael Llewellyn-Smith % 0.00% Nigel Macdonald 1, % 0.00% Anastasios I. Leventis 5 José Octavio Reyes John P. Sechi Alexandra Papalexopoulou Olusola (Sola) David-Bohra 206
209 Strategic Report Corporate Governance Financial Statements Supplementary Info & Swiss Statutory Reporting Number of shares Percentage of issued share capital 1 Percentage of outstanding share capital 2 Operating Committee Alain Brouhard 11, % 0.00% Jan Gustavsson 47, % 0.01% John Brady 10, % 0.00% Keith Sanders 24, % 0.00% Martin Marcel 6 3, % 0.01% Michalis Imellos 11, % 0.00% Sanda Parezanovic % 0.00% Sotiris Yannopoulos 7, % 0.00% Zoran Bogdanovic 13, % 0.00% 1. Basis: total issued share capital including treasury shares. Share basis 368,141,297 as at 31 December Basis: total issued share capital excluding treasury shares. Share basis 361,696,237 as at 31 December The infant child of Mr. Anastassis David being a beneficiary of a private discretionary trust for the primary benefit of present and future members of the family of the late Anastasios George Leventis, of which Truad Verwaltungs AG is the Trustee, has an indirect interest with respect to the 85,355,019 shares held by Kar-Tess Holding S.A.. The infant child of Mr. Anastassis David being a beneficiary of a further private discretionary trust for the primary benefit of present and future members of the family of the late Anastasios George Leventis, of which Selene Treuhand AG is the Trustee, has a further indirect interest in respect of 823,008 shares held by New Argen Holdings Ltd.. Mr. Anastassis David is connected with his infant child for the purposes of rule 3 of the Disclosure and Transparency Rules of the UK Financial Conduct Authority. 4. The infant children of Mr. Christo Leventis being beneficiaries of a private discretionary trust for the primary benefit of present and future members of the family of the late Anastasios George Leventis, of which Truad Verwaltungs AG is the Trustee, have indirect interests with respect to the 85,355,019 shares held by Kar-Tess Holding S.A.. The infant children of Mr. Christo Leventis being beneficiaries of a further private discretionary trust for the primary benefit of present and future members of the family of the late Anastasios George Leventis, of which Selene Treuhand AG is the Trustee, have further indirect interests in respect of 1,234,513 shares held by New Argen Holdings Ltd.. Mr. Christo Leventis is connected with his infant children for the purposes of rule 3 of the Disclosure and Transparency Rules of the UK Financial Conduct Authority. By virtue of himself being a beneficiary of a private discretionary trust for the primary benefit of present and future members of the family of the late Christodoulos Papaneokleus Leventis, of which Mervail Company (PTC) Limited is the trustee, Mr. Christo Leventis has an indirect interest with respect to the 757,307 shares held by Carlcan Holding Limited. 5. The infant child of Mr. Anastasios I. Leventis, being a beneficiary of a private discretionary trust for the primary benefit of present and future members of the family of the late Anastasios George Leventis, of which Truad Verwaltungs AG is the Trustee, has an indirect interest in respect of the 85,355,019 shares held by Kar-Tess Holding S.A.. The infant child of Mr. Anastasios I. Leventis, being a beneficiary of a further private discretionary trust for the primary benefit of present and future members of the family of the late Anastasios George Leventis, of which Selene Treuhand AG is the Trustee, has a further indirect interest in respect of 823,008 shares held by New Argen Holdings Ltd.. Mr. Anastasios I. Leventis is connected with his infant child for the purposes of rule 3 of the Disclosure and Transparency Rules of the UK Financial Conduct Authority. By virtue of himself being a beneficiary of a private discretionary trust for the primary benefit of present and future members of the family of the late Christodoulos Papaneokleus Leventis, of which Mervail Company (PTC) Limited is the trustee, Mr. Anastasios I. Leventis has an indirect interest with respect to 623,664 shares held by Carlcan Holding Limited. 6. Mr. Martin Marcel joined the Operating Committee on 1 January Ms. Sanda Parezanovic joined the Operating Committee on 1 June The following table sets out information regarding the stock options and performance shares held by members of the Operating Committee as at 31 December 2015: Number of stock options Stock options ( ESOP ) Already vested Vesting at the end of 2016 Vesting at the end of 2017 Granted in 2015 Performance shares ( PSP ) Unvested and subject to performance conditions Vested but unexercised Dimitris Lois 1,700,000 1,250, , , , ,476 Alain Brouhard 320, ,332 68,334 23,334 26,484 26,484 Jan Gustavsson 801, ,332 95,001 31,667 29,695 29,695 John Brady 826, ,333 95,001 31,667 29,828 29,828 Keith Sanders 529, ,000 75,000 25,000 28,959 28,959 Martin Marcel 199, ,666 26,334 9,000 24,746 24,746 Michalis Imellos 286, ,499 80,001 30,000 32,771 32,771 Sanda Parezanovic 48,500 29,833 13,667 5,000 19,395 19,395 Sotiris Yannopoulos 150, ,165 32,668 16,667 25,281 25,281 Zoran Bogdanovic 245, ,915 51,001 23,334 27,555 27, Fees paid to the auditor The audit and other fees paid to the auditor are disclosed in Note 19 to the consolidated financial statements. 4. Post balance sheet events On 3 March 2016, the Company s subsidiary Coca-Cola HBC Finance B.V. (the Issuer ) issued a fixed rate bond of 600 million with a coupon of 1.875% due 11 November 2024, under the Issuer s 3bn Euro medium term note programme. The new bond is guaranteed by the Company and Coca-Cola HBC Holdings B.V. The proceeds from the bond issue will be used mainly for the repayment of existing debt. On the same date the Issuer announced a tender offer for its bonds maturing in November 2016, resulting in a reduction of their nominal value by approximately 214.6m. 207
210 Swiss statutory reporting continued Proposed appropriation of retained earnings and reserves 1. Proposed appropriation of retained earnings and reserves Retained earnings and reserves Balance brought forward from previous years 200,291,137 Net loss for the year (55,673,772) Total retained earnings to be carried forward 144,617,365 General capital contribution reserve before distribution 6,137,759,778 Total retained earnings and reserves 6,282,377, Proposed treatment of reserves The Board of Directors proposes a gross dividend of 0.40 for each ordinary registered share to be paid out of the general capital contribution reserve. Own shares held directly by the Company are not entitled to dividends. The total aggregate amount of the dividends shall be capped at an amount of CHF 200,000,000 (the Cap ), and thus will reduce the general capital contribution reserve of CHF 6,137,759,778, as shown in the financial statements as of 31 December 2015, by a maximum of CHF 200,000,000. To the extent that the dividend calculated on 0.40 per share would exceed the Cap on the day of the extraordinary general meeting, due to the exchange rate determined by the Board of Directors in its reasonable opinion, the euro per share amount of the dividend shall be reduced on a pro-rata basis so that the aggregate amount of all dividends paid does not exceed the Cap. Payment of the dividend shall be made at such time and with such record date as shall be determined by the annual shareholders meeting and the Board of Directors. 3. Proposed appropriation of reserves/declaration of dividend Variant 1: Dividend of EUR 0.40 at current exchange rate As of 31 December 2015 CHF Reserves from capital contributions before distribution 6,137,759,778 Proposed dividend of (160,655,604) Reserves from capital contributions after distribution 5,977,104, Illustrative at an exchange rate of CHF 1.10 per EUR. Assumes that the shares entitled to a dividend amount to 365,126,372. Variant 2: Dividend if Cap is triggered As of 31 December 2015 CHF Reserves from capital contributions before distribution 6,137,759,778 (Maximum) dividend if Cap is triggered 2 (200,000,000) (Minimum) Reserves from capital contributions after distribution 5,937,759, Dividend is capped at a total aggregate amount of CHF 200,000,000. CHF 208
211 Strategic Report Corporate Governance Financial Statements Supplementary Info & Swiss Statutory Reporting Report of the statutory auditor to the General Meeting Coca-Cola HBC AG Steinhausen/Zug Report of the statutory auditor on the statutory remuneration report We have audited the accompanying remuneration report (pages 211 to 213) dated 17 March 2016 of Coca-Cola HBC AG for the year ended 31 December Board of Directors responsibility The Board of Directors is responsible for the preparation and overall fair presentation of the remuneration report in accordance with Swiss law and the Ordinance against Excessive Compensation in Stock Exchange Listed Companies (Ordinance). The Board of Directors is also responsible for designing the remuneration system and defining individual remuneration packages. Auditor s responsibility Our responsibility is to express an opinion on the accompanying remuneration report. We conducted our audit in accordance with Swiss Auditing Standards. Those standards require that we comply with ethical requirements and plan and perform the audit to obtain reasonable assurance about whether the remuneration report complies with Swiss law and articles of the Ordinance. An audit involves performing procedures to obtain audit evidence on the disclosures made in the remuneration report with regard to compensation, loans and credits in accordance with articles of the Ordinance. The procedures selected depend on the auditor s judgement, including the assessment of the risks of material misstatements in the remuneration report, whether due to fraud or error. This audit also includes evaluating the reasonableness of the methods applied to value components of remuneration, as well as assessing the overall presentation of the remuneration report. We believe that the audit evidence we have obtained is sufficient and appropriate to provide a basis for our opinion. Opinion In our opinion, the remuneration report of Coca-Cola HBC AG for the year ended 31 December 2015 complies with Swiss law and articles of the Ordinance. PricewaterhouseCoopers AG Daniel Anliker Audit expert Auditor in charge Philipp Kegele Zürich, 17 March
212 Swiss statutory reporting continued Statutory Remuneration Report Additional disclosures regarding the Statutory Remuneration Report The section below is in line with the Ordinance against excessive pay in stock exchange listed companies, which requires disclosure of the elements of compensation paid to the Company s Board of Directors and the Operating Committee. The numbers relate to the calendar years of 2015 and In the information presented below, the exchange rate used for conversion of 2015 remuneration data from Euro to CHF is 1/ and the exchange rate used for conversion of 2014 remuneration data from Euro to CHF is 1/ As the Company is headquartered in Switzerland, it is required for statutory purposes to present compensation data for two consecutive years, 2014 and The applicable methodology used to calculate the value of stock option and performance shares follows Swiss standards. In 2015, the fair value of performance shares from the 2015 grant is calculated based on the performance share awards that are expected to vest, and not the stock options that vested in In 2014, the fair value of stock options is calculated based on the stock options that have been granted during 2014, and not the stock options that vested in Below is the relevant information for Swiss statutory purposes. Compensation for acting members of governing bodies The Company s Directors believe that the level of remuneration offered to Directors and the members of the Operating Committee should reflect their experience and responsibility as determined by, among other factors, a comparison with similar multinational companies and should be sufficient to attract and retain high-calibre Directors who will lead the Group successfully. In line with the Group s commitment to maximise shareholder value, its policy is to link a significant proportion of remuneration for its Operating Committee to the performance of the business through short-and long-term incentives. Therefore the Operating Committee members financial interests are closely aligned with those of the Company s shareholders through the equity-related long-term compensation plan. The total remuneration of the Directors and members of the Operating Committee of the Company, including performance share grants, during 2015 amounted to CHF 18.6 million. Out of this, the amount relating to the expected value of performance shares awards granted in relation to 2015 was CHF 4.7 million. Pension and post-employment benefits for Directors and the Operating Committee of the Company during 2015 amounted to CHF 0.8 million. 210
213 Strategic Report Corporate Governance Financial Statements Supplementary Info & Swiss Statutory Reporting Compensation of the Board of Directors Fees Cash and non-cash benefits CHF Cash Pension and performance post-employment incentives benefits Total fair value of stock options at the date granted Total compensation George A. David 2 Anastasios I. Leventis 2 Christo Leventis 2 Anastassis G. David 3 71,699 71,699 Irial Finan 69,043 69,043 Antonio D Amato 79,665 79,665 Christos Ioannou 4 41,160 41,160 Sir Michael Llewellyn-Smith 100, ,909 Nigel Macdonald 95,598 95,598 Susan Kilsby 5 39,833 39,833 José Octavio Reyes 6 83,086 83,086 John P. Sechi 82,321 82,321 Alexandra Papalexopoulou 7 39,833 39,833 Olusola (Sola) David-Bohra 8 44,409 44,409 Dimitris Lois 9 Total Board of Directors 747, , Allowances consist of cost of living allowance, housing support, Employee Stock Purchase Plan, private medical insurance, relocation expenses, home trip allowance, lump sum expenses and similar allowances. 2. George A. David, Anastasios I. Leventis and Christo Leventis waived any annual fee in respect of their membership on the Board of Directors or any Board Committee. 3. With effect from 24 June 2015 Mr. Anastassis David retired from the Company s Nomination Committee. The Group has applied a half-year period fee of CHF 2,656 for Nomination Committee membership. 4. Mr. Christos Ioannou retired from the Board of Directors and the Audit Committee on 24 June The Group has applied a half-year period fee of CHF 6,639 for Audit Committee membership. 5. Ms. Susan Kilsby retired from the Board, the Remuneration Committee and the Nomination Committee on 24 June The Group has applied a half-year period fee of CHF 2,656 for the Nomination Committee and CHF 2,656 for the Remuneration Committee. 6. With effect from 24 June 2015 Mr. Reyes retired from the Company s Nomination Committee. The Group has applied a half-year period fee of CHF 2,656 for his Nomination Committee membership. The Group paid, as required by Swiss legislation, a social security contribution of CHF 6,077 for Mr. Reyes in addition to his fees of CHF 77, Ms. Alexandra Papalexopoulou was appointed to the Board and the Nomination Committee on 24 June The Group has applied a half-year period fee of CHF 2,656 for the Nomination Committee and CHF 2,656 for the Remuneration Committee. 8. Ms. Olusola (Sola) David-Bohra was appointed to the Board of Directors and the Audit Committee on 24 June The Group has applied a half-year period fee of CHF 6,639 for Audit Committee membership. The Group paid, as required by legislation, a social security contribution of CHF 3,249 for Ms. Olusola (Sola) David-Bohra in addition to fees of CHF 41, Dimitris Lois compensation is based on his role as CEO and member of the Operating Committee, according to his employment contract. Mr. Lois is not entitled to and does not receive additional compensation as a Director. Non-Executive Directors do not participate in any of the Group s incentive plans, nor do they receive any retirement benefits. 211
214 Swiss statutory reporting continued Compensation of the Board of Directors Fees Cash and non-cash benefits 1 Cash performance incentives 2014 CHF Pension and post-employment benefits Total fair value of stock options at the date granted 3 Total compensation George A. David 2 Anastasios P. Leventis 2 Haralambos K. Leventis 2 Anastasios I. Leventis 2,4 Christo Leventis 2,5 Anastassis G. David 6 85,061 85,061 Irial Finan 78,985 78,985 Antonio D Amato 91,137 91,137 Christos Ioannou 94,175 94,175 Sir Michael Llewellyn-Smith 7 109, ,364 Nigel Macdonald 109, ,364 Susan Kilsby 91,137 91,137 José Octavio Reyes 8 49,174 49,174 John P. Sechi 9 47,087 47,087 John Hunter 10 48,103 48,103 Stefan F. Heidenreich 47,087 47,087 Dimitris Lois 11 Total Board of Directors 850, , Allowances consist of cost of living allowance, housing support, Employee Stock Purchase Plan, private medical insurance, relocation expenses, home trip allowance, lump sum expenses and similar allowances. 2. George A. David, Anastasios P. Leventis, Haralambos K. Leventis, Anastasios I. Leventis and Christo Leventis waived any annual fee in respect of their membership on the Board of Directors or any Board Committee. 3. Values under long-term incentives represent the fair value of stock options that were granted during 2014 in order to comply with Swiss reporting guidelines. The CEO was granted 360,000 options with a fair value of CHF 5.33 ( 4.39 initial currency fair value). The Monte Carlo methodology was applied to calculate fair value. 4. Mr. Anastasios I. Leventis replaced Mr. Anastasios P. Leventis, who retired from the Board of Directors on 25 June Mr. Christos Leventis replaced Mr. Haralambos K. Leventis, who retired from the Board of Directors on 25 June Mr. Anastassis G. David has waived his fee as a Vice Chairman of the Board of Directors. 7. An additional annual fee of 10,000 for the Senior Independent Director was introduced in The Group has applied CHF 6,076 for the Senior Independent Director for a half-year period. Note that Sir Michael Llewellyn-Smith has waived his fee as Social Responsibility Committee Chairman. 8. Mr. José Octavio Reyes replaced Mr. John Hunter, who retired from the Board of Directors on 25 June In addition to the half year fees paid to Mr. Reyes, the Company paid a social security contribution of CHF 3, Mr. John P. Sechi replaces Mr. Stefan F. Heidenreich who retired from the Board of Directors on 25 June Therefore, half an annual fee was paid. 10. The Group, for Mr. Hunter on top of the basic fee of CHF 45,568, paid as required by Swiss legislation a social security contribution of CHF 2, Dimitris Lois compensation is based on his role as CEO and member of the Operating Committee, according to his employment contract. Mr. Lois is not entitled to and does not receive additional compensation as a Director. Non-Executive Directors do not participate in any of the Group s incentive plans, nor do they receive any retirement benefits. 212
215 Strategic Report Corporate Governance Financial Statements Supplementary Info & Swiss Statutory Reporting Compensation of the Operating Committee The total remuneration paid to or accrued for the Operating Committee for 2015 amounted to CHF 17.9 million CHF Base salary Cash and non-cash benefits 1 Cash performance incentives 2 Pension and post-employment benefits 3 Total fair value of stock options at the date granted 4 Total compensation Dimitris Lois, Chief Executive Officer (highest compensated member of the Operating Committee) 5 881,201 1,108, , ,097 1,693,461 4,294,082 Other members 6,7,8,9 4,241,711 3,812,714 1,858, ,832 2,992,674 13,588,232 Total Operating Committee 5,122,912 4,921,294 2,317, ,929 4,686,135 17,882, Allowances consist of cost of living allowance, housing, support, schooling, Employee Stock Purchase Plan, private medical insurance, relocation expenses, employer social security contributions, lump sum expenses and similar allowances. 2. The bonus represents the monetary value that was paid under MIP in 2015 reflecting the 2014 business performance. 3. Members of the Operating Committee participate in the pension plan of their employing entity, as appropriate. 4. Values under long-term incentives represent the fair value of performance shares that are expected to vest for the 2015 grant in order to comply with Swiss reporting guidelines. 5. Dimitris Lois compensation is based on his role as CEO and member of the Operating Committee Team, according to his employment contract. Mr. Lois is not entitled to and does not receive the fixed compensation applicable for Executive Directors of the Board of Directors. 6. June Hirst stepped down from the role of Human Resources Director on 31 May Kleon Giavassoglou resigned from the role of Supply Chain Director on 31 December Sanda Parezanovic was appointed to the role of Human Resources Director on 1 June Marcel Martin was appointed to the role of Supply Chain Director on 1 January The total remuneration paid to or accrued for the Operating Committee for 2014 amounted to CHF 18.5 million. Base salary Cash and non-cash benefits 1 Cash performance incentives CHF Pension and post-employment benefits 3 Total fair value of stock options at the date granted 4 Total compensation Dimitris Lois, Chief Executive Officer (highest compensated member of the Operating Committee) 5 840, , , ,048 1,921,894 3,843,555 Other members 6,7 4,639,841 3,587,602 2,088, ,838 3,683,631 14,624,525 Total Operating Committee 5,479,920 4,173,925 2,451, ,886 5,605,525 18,468, Allowances consist of cost of living allowance, housing, support, schooling, Employee Stock Purchase Plan, private medical insurance, relocation expenses, employer social security contributions, lump sum expenses and similar allowances. 2. The bonus represents the monetary value that was paid under MIP in 2014 reflecting the 2013 business performance. 3. Members of the Operating Committee participate in the pension plan of their employing entity, as appropriate. 4. Values under long-term incentives represent the fair value of stock options that were granted during 2014, in order to comply with Swiss reporting guidelines. The fair value that was used for the calculation is CHF 5.33 ( 4.39). Grant date is 10 December Monte Carlo methodology was applied to calculate fair value. 5. Dimitris Lois compensation is based on his role as CEO and member of the Operating Committee Team, according to his employment contract. Mr. Lois is not entitled to and does not receive the fixed compensation applicable for Executive Directors of the Board of Directors. 6. Richard Smyth resigned from the role of Region Director on 30 June Sotiris Yannopoulos was appointed to the role of Region Director on 1 July Credits and loans granted to governing bodies In 2015, there were no credits or loans granted to active or former members of the Company s Board of Directors, members of the Operating Committee or to any related persons. There are no outstanding credits or loans. 213
216 Glossary Brand Coca-Cola products Includes Coca-Cola, Coca-Cola Zero and Coca-Cola Light brands Capital expenditure; CAPEX Gross CAPEX is defined as payments for purchase of property, plant and equipment. Net CAPEX is defined as payments for purchase of property, plant and equipment less receipts from disposals of property, plant and equipment plus principal repayment of finance lease obligations Carbon emissions Emissions of CO 2 and other greenhouse gases from fuel combustion and electricity use in Coca-Cola HBC s own operations (scope 1 and 2, mostly in bottling and distribution), in tonnes Carbon footprint Global emissions of CO 2 and other greenhouse gases from Coca-Cola HBC s wider value chain (raw materials, product cooling, etc.) CHP Combined heat and power plants Coca-Cola HBC Coca-Cola HBC AG, and, as the context may require, its subsidiaries and joint ventures; also, the Group, the Company Coca-Cola System The Coca-Cola Company and its bottling partners Cold drink equipment A generic term encompassing point-of-sale equipment such as coolers (refrigerators), vending machines and post-mix machines Comparable adjusted EBITDA We define adjusted EBITDA as operating profit before deductions for depreciation and impairment of property, plant and equipment (included both in cost of goods sold and in operating expenses), amortisation and impairment of and adjustments to intangible assets, stock option compensation and other non-cash items, if any Comparable net profit Refers to net profit after tax attributable to owners of the parent Comparable operating profit Operating profit (EBIT) refers to profit before tax excluding finance income/(costs) and share of results of equity method investments Consumer Person who drinks Coca-Cola HBC products Customer Retail outlet, restaurant or other operation that sells or serves Coca-Cola HBC products directly to consumers DME Direct marketing expenses Energy use ratio The KPI used by Coca-Cola HBC to measure energy consumption in the bottling plants, expressed in megajoules of energy consumed per litre of produced beverage (MJ/lpb) FMCG Fast moving consumer goods Fragmented trade Kiosks, quick service restaurants (QSR), hotels, restaurants and cafes (HORECA) Future consumption A distribution channel where consumers buy multi-packs and larger packages from supermarkets and discounters which are not consumed on the spot FYROM Former Yugoslav Republic of Macedonia GDP Gross domestic product GfK We work with the company Growth for Knowledge (GfK) to track our customer satisfaction level. GRI Global Reporting Initiative, global standard for sustainability reporting IFRS International Financial Reporting Standards of the International Accounting Standards Board IIRC The International Integrated Reporting Council, a global coalition of regulators, investors, companies, standard setters, the accounting profession and NGOs Immediate consumption A distribution channel where consumers buy chilled beverages in single-serve packages and fountain products for immediate consumption, away from home Inventory days We define inventory days as the average number of days an item remains in inventory before being sold using the following formula: average inventory cost of goods sold x 365 Ireland The Republic of Ireland and Northern Ireland Italy Territory in Italy served by Coca-Cola HBC (excludes Sicily) Joint value creation (JVC) An advanced programme and process to collaborate with customers in order to create shared value 214
217 Strategic Report Corporate Governance Financial Statements Supplementary Info & Swiss Statutory Reporting Litre of produced beverage (lpb): Unit of reference to show environmental performance relative to production volume Market When used in reference to geographic areas, a country in which Coca-Cola HBC does business Modern trade The way of buying is shifting as consumers increase frequency in visits to stores but have smaller basket sizes which can cause higher volume but lower revenue NARTD Non-alcoholic ready-to-drink OBPPC Occasion, Brand, Price, Package, Channel Organised trade Large retailers (e.g. supermarkets, discounters, etc.) PET Polyethylene terepthalate, a form of polyester used in the manufacturing of beverage bottles Ready-to-drink (RTD) Drinks that are pre-mixed and packaged, ready to be consumed immediately with no further preparation Right Execution Daily (RED) Major Group-wide programme to ensure in-outlet excellence Receivable days The average number of days it takes to collect the receivables using the following formula: average accounts receivables x net sales revenue x 365 SAP A powerful software platform that enables us to standardise key business processes and systems Serving 237ml or 8oz of beverage, equivalent to 1/24 of a unit case Shared services Centre to standardise and simplify key finance and human resources processes Sparkling beverages Non-alcoholic carbonated beverages containing flavourings and sweeteners, excluding, among others, waters and flavoured waters, juices and juice drinks, sports and energy drinks, teas and coffee SKU Stock Keeping Unit Still and water beverages Non-alcoholic beverages without carbonation including, but not limited to, waters and flavoured waters, juices and juice drinks, sports and energy drinks, teas and coffee Territory The 28 countries where Coca-Cola HBC operates Unit case Approximately litres or 24 servings, a typical volume measurement unit UN Global Compact (UNGC) The world s largest corporate citizenship initiative provides a framework for businesses to align strategies with its ten principles promoting labour rights, human rights, environmental protection and anti-corruption Volume Amount of physical product produced and sold, measured in unit cases Volume share Share of total unit cases sold Value share Share of total revenue Waste ratio The KPI used by Coca-Cola HBC to measure waste generation in the bottling plant, expressed in grammes of waste generated per litre of produced beverage (g/lpb) Waste recycling The KPI used by Coca-Cola HBC to measure the percentage of production waste at bottling plants that is recycled or recovered Water footprint A measure of the impact of water use, in operations or beyond, as defined by the Water Footprint Network methodology Water use ratio The KPI used by Coca-Cola HBC to measure water use in the bottling plant, expressed in litres of water used per litre of produced beverage (l/lpb) 215
218 Special note regarding forward-looking statements This document contains forward-looking statements that involve risks and uncertainties. These statements may generally, but not always, be identified by the use of words such as believe, outlook, guidance, intend, expect, anticipate, plan, target, seeks, estimates, potential and similar expressions to identify forwardlooking statements. All statements other than statements of historical facts, including, among others, statements regarding the future financial position and results, Coca-Cola HBC s outlook for 2016 and future years, business strategy and the effects of the global economic slowdown, the impact of the sovereign debt crisis, currency volatility, Coca-Cola HBC s recent acquisitions, and restructuring initiatives on Coca-Cola HBC s business and financial condition, Coca-Cola HBC s future dealings with The Coca Cola Company, budgets, projected levels of consumption and production, projected raw material and other costs, estimates of capital expenditure, free cash flow, effective tax rates and plans and objectives of management for future operations, are forward-looking statements. You should not place undue reliance on such forwardlooking statements. By their nature, forward-looking statements involve risk and uncertainty because they reflect the Coca-Cola HBC s current expectations and assumptions as to future events and circumstances that may not prove accurate. Forward looking statements speak only as of the date they are made. Coca-Cola HBC s actual results and events could differ materially from those anticipated in the forward-looking statements for many reasons, including the risks described under the section entitled Risk management. Although Coca-Cola HBC believes that, as of the date of this document, the expectations reflected in the forwardlooking statements are reasonable, Coca-Cola HBC cannot assure that Coca-Cola HBC s future results, level of activity, performance or achievements will meet these expectations. Moreover, neither Coca-Cola HBC, nor its directors, employees, advisors nor any other person assumes responsibility for the accuracy and completeness of any forward-looking statements. After the date of this Integrated Annual Report, unless Coca-Cola HBC is required by law or the rules of the UK Financial Conduct Authority to update these forwardlooking statements, Coca-Cola HBC makes no commitment to update any of these forward-looking statements to conform them either to actual results or to changes in Coca-Cola HBC s expectations. 216

219 Visit us at Guided by our users thoughts and feedback, we have completely refreshed our website. Launching in April, the new Group site will feature all of our latest news and financial data, stories from around our business and communities, a vibrant new design and an improved experience for audiences. Write to us at investor.relations@cchellenic.com We have a dedicated address which you can use to communicate with us. This report has been printed on revive 150gr sappi magnosatin and revive 120gr arcoset fedrigoni uncoated, a paper which is certified by the Forest Stewardship Council. The paper is made in a mill registered to EMAS, the Eco Management Audit Scheme, and with ISO14001 environmental management system accreditation. Printed by Peak advertising without the use of film separations, plates and associated processing chemicals. 99% of all dry waste associated with this production has been recycled. Designed and produced by Black Sun Plc
Results presentation Half-year August 2017
 Results presentation Half-year 2017 10 August 2017 Forward-looking statements Unless otherwise indicated, the condensed consolidated interim financial statements and the financial and operating data or
Results presentation Full-year 2017
 Results presentation Full-year 2017 14 February 2018 UNDERSTAND EVOLVE ENERGISE Forward-looking statements Unless otherwise indicated, the condensed consolidated interim financial statements and the financial
UK- US Roadshow Presentation. February 2013
 UK- US Roadshow Presentation February 2013 1 Disclaimer Disclaimer This document is an advertisement and not a prospectus and investors should not subscribe for or purchase any transferable securities
Forward-looking statements
 Forward-looking statements 2 Unless otherwise indicated, the condensed consolidated financial statements and the financial and operating data or other information included herein relate to Coca-Cola HBC
Full-year results for the year ended 31 December Dimitris Lois CEO Michalis Imellos - CFO
 Full-year results for the year ended 31 December 2012 Dimitris Lois CEO Michalis Imellos - CFO Disclaimer The information contained herein includes forward-looking statements which are based on current
Coca-Cola HBC at a glance
 Disclaimer 2 Unless otherwise indicated, the condensed consolidated financial statements and the financial and operating data or other information included herein relate to Coca-Cola HBC AG and its subsidiaries
Forward-looking statements
 Forward-looking statements 2 Unless otherwise indicated, the condensed consolidated financial statements and the financial and operating data or other information included herein relate to Coca-Cola HBC
CCH 2017 Half-year results Conference call script 10 August 2017
 C O R P O R A T E P A R T I C I P A N T S Dimitris Lois - Coca-Cola HBC AG CEO Michalis Imellos - Coca-Cola HBC AG CFO Basak Kotler - Coca-Cola HBC AG - IR Director Operator Thank you for standing by ladies
CCH 2016 Full-year results Conference call script 16 February 2017
 C O R P O R A T E P A R T I C I P A N T S Dimitris Lois - Coca-Cola HBC AG CEO Michalis Imellos - Coca-Cola HBC AG CFO Basak Kotler - Coca-Cola HBC AG - IR Director Operator Thank you for standing by ladies
Doros Constantinou Chief Executive Officer. 12th Annual Capital Link Forum 2 December 2010, New York
 Doros Constantinou Chief Executive Officer 12th Annual Capital Link Forum 2 December 2010, New York Disclaimer The information contained herein includes forward-looking statements which are based on current
Net Profit and comparable net profit refer to net profit and comparable net profit respectively after tax attributable to owners of the parent.
 Page 1 of 39 EXCELLENT FIRST HALF RESULTS Coca-Cola HBC AG, a leading bottler of The Coca-Cola Company, reports its financial results for the six months ended 30 June 2017. Half-year highlights Revenue
Nine Months. Third Quarter 2013 Nine Months 2013
 RESULTS FOR THE NINE MONTHS ENDED 27 SEPTEMBER 2013 THIRD QUARTER HIGHLIGHTS Q3 Q3 % 2013 2012 (1) Change Volume (m unit cases) 575 594-3% Net Sales Revenue ( m) 1,918 2,021-5% Net Sales Revenue per Unit
Investor Roadshow Presentation. October-November 2012
 Investor Roadshow Presentation October-November 2012 1 Disclaimer Disclaimer This document is an advertisement and not a prospectus and investors should not subscribe for or purchase any transferable securities
CCH Annual General Meeting CEO presentation 11 June 2018
 Zoran Bogdanovic CEO Coca-Cola HBC AG Good morning. Thank you for joining our Annual General Meeting. Before we get started, I would like to remind everyone that this presentation contains various forward
CCH 2018 Half-year financial results Conference call script 9 August 2018
 C O R P O R A T E P A R T I C I P A N T S Zoran Bogdanovic Coca-Cola HBC AG - CEO Michalis Imellos - Coca-Cola HBC AG CFO Basak Kotler - Coca-Cola HBC AG - IR Director Operator Thank you for standing by
IFRS Results for the three months ended 2 April Results Presentation 29 April 2010
 IFRS Results for the three months ended 2 April 2010 Results Presentation 29 April 2010 1 Disclaimer The information contained herein includes forward-looking statements which are based on current expectations
RESULTS FOR THE NINE MONTHS ENDED 26 SEPTEMBER 2008 (IFRS)
") RESULTS FOR THE NINE MONTHS ENDED 26 SEPTEMBER 2008 (IFRS) HIGHLIGHTS FOR THE NINE MONTHS Volume of 1,623 million unit cases, 4% above 2007. Net sales revenue rose to 5,389 million, 8% above 2007. Operating
RESULTS FOR THE NINE MONTHS ENDED 26 SEPTEMBER 2008 (IFRS) HIGHLIGHTS FOR THE NINE MONTHS Volume of 1,623 million unit cases, 4% above 2007. Net sales revenue rose to 5,389 million, 8% above 2007. Operating
IFRS Results for the year ended 31 December Results Presentation 9 February 2011
 IFRS Results for the year ended 31 December 2010 Results Presentation 9 February 2011 1 Disclaimer The information contained herein includes forward-looking statements which are based on current expectations
Fourth Quarter 2013 Full Year 2013
 RESULTS FOR THE YEAR ENDED 31 DECEMBER 2013 FOURTH QUARTER HIGHLIGHTS Q4 Q4 % 2013 2012 Change Volume (m unit cases) 481 477 1% Net Sales Revenue ( m) 1,575 1,605-2% Net Sales Revenue per Unit Case ( )
Deutsche Bank 10 th Annual Global Consumer Goods Conference. Building a Stronger Hellenic. 12 June 2013 Coca-Cola HBC
 Deutsche Bank 10 th Annual Global Consumer Goods Conference Building a Stronger Hellenic 12 June 2013 Coca-Cola HBC 1 Disclaimers NOT FOR RELEASE, PUBLICATION OR DISTRIBUTION, DIRECTLY OR INDIRECTLY, IN
2015 CAGNY. Muhtar Kent, Chairman & CEO Kathy Waller, EVP & Chief Financial Officer FEBRUARY 20, 2015
 2015 CAGNY Muhtar Kent, Chairman & CEO Kathy Waller, EVP & Chief Financial Officer FEBRUARY 20, 2015 Forward-Looking Statements This presentation may contain statements, estimates or projections that constitute
2015 Letter to Our Shareholders
 2015 Letter to Our Shareholders 1 From Our Chairman & CEO Pierre Nanterme DELIVERING IN FISCAL 2015 Accenture s excellent fiscal 2015 financial results reflect the successful execution of our strategy
2016 Integrated Annual Report. Entering the growth era Integrated Annual Report
 Entering the growth era 2015 Integrated Annual Report About our report The ( Annual Report ) consolidates Coca Cola HBC AG s UK and Swiss disclosure requirements while meeting the disclosure requirements
Net Profit and comparable net profit refer to net profit and comparable net profit respectively after tax attributable to owners of the parent.
 Page 1 of 40 STRONG VOLUME GROWTH DELIVERS GOOD RESULTS Coca-Cola HBC AG, a leading bottler of The Coca-Cola Company, reports its financial results for the six months ended 29 June 2018. Half-year highlights
STRONG REVENUE GROWTH DRIVES MARGIN EXPANSION
 Page 1 of 39 STRONG REVENUE GROWTH DRIVES MARGIN EXPANSION Coca-Cola HBC AG, a leading bottler of The Coca-Cola Company, reports its financial results for the full year ended 31 December. Full-year highlights
JOHN F. BROCK / CHAIRMAN & CEO BILL DOUGLAS / EVP & CFO
 JOHN F. BROCK / CHAIRMAN & CEO BILL DOUGLAS / EVP & CFO Forward-Looking Statements INCLUDED IN THIS PRESENTATION ARE FORWARD-LOOKING MANAGEMENT COMMENTS AND OTHER STATEMENTS THAT REFLECT MANAGEMENT S CURRENT
Reasons to Believe IR OVERVIEW 2014
 Reasons to Believe IR OVERVIEW 2014 2 Forward-Looking Statements This presentation may contain statements, estimates or projections that constitute forward-looking statements as defined under U.S. federal
Strategic priorities. Sustainable banking. Inspire and engage our people. A better bank contributing to a better world. Enhance client centricity
 banking business operations Compliance Employee health and safety Workforce diversity and Environmental impact inclusion Clients interests centre stage and sustainable relationships Privacy of clients
FORWARD-LOOKING STATEMENTS
 1 FORWARD-LOOKING STATEMENTS This document may contain statements, estimates or projections that constitute forward-looking statements concerning the financial condition, performance, results, strategy
FINANCIAL EXCELLENCE FINANCIAL MARKETS GIVE IMPLENIA SEAL OF APPROVAL
 128 129 6 FINANCIAL EXCELLENCE FINANCIAL MARKETS GIVE IMPLENIA SEAL OF APPROVAL The company is well placed for long-term growth. 6 FINANCIAL EXCELLENCE Interview with Karen McGrath, Head of Sustainability,
Company Overview 2008
 Company Overview 2008 Safe Harbor Statement During this presentation management may discuss certain forwardlooking statements concerning FEMSA s future performance that should be considered as good faith
ELECTROCOMPONENTS Full-year results for the year ended 31 March 2018
 ELECTROCOMPONENTS Full-year results for the year ended 31 March 2018 24 May 2018 SAFE HARBOUR This presentation contains certain statements, statistics and projections that are or may be forward-looking.
Bernstein Strategic Decisions Conference John Murphy President, Asia Pacific. September 26, 2018
 Bernstein Strategic Decisions Conference John Murphy President, Asia Pacific September 26, 2018 FORWARD-LOOKING STATEMENTS This presentation may contain statements, estimates or projections that constitute
John F. Brock CHAIRMAN & CEO. Bill Douglas EVP & CFO
 John F. Brock CHAIRMAN & CEO Bill Douglas EVP & CFO Forward-Looking Statements INCLUDED IN THIS PRESENTATION ARE FORWARD- LOOKING MANAGEMENT COMMENTS AND OTHER STATEMENTS THAT REFLECT MANAGEMENT S CURRENT
JOHN F. BROCK CHAIRMAN & CEO NIK JHANGIANI SVP & CFO
 JOHN F. BROCK CHAIRMAN & CEO NIK JHANGIANI SVP & CFO Forward-Looking Statements Included in this presentation are forward-looking management comments and other statements that reflect management s current
RESULTS FOR THE SIX MONTHS ENDED 27 JUNE 2008 (IFRS)
") RESULTS FOR THE SIX MONTHS ENDED 27 JUNE 2008 (IFRS) HALF YEAR HIGHLIGHTS Volume of 1,014 million unit cases, 5% above 2007. Net revenue rose to 3,314 million, 7% above 2007. Operating profit (EBIT) of
RESULTS FOR THE SIX MONTHS ENDED 27 JUNE 2008 (IFRS) HALF YEAR HIGHLIGHTS Volume of 1,014 million unit cases, 5% above 2007. Net revenue rose to 3,314 million, 7% above 2007. Operating profit (EBIT) of
BEVERAGES FOR LIFE James Quincey
 BEVERAGES FOR LIFE James Quincey President and Chief Executive Officer FORWARD-LOOKING STATEMENTS This presentation may contain statements, estimates or projections that constitute forward-looking statements
John F. Brock CHAIRMAN & CEO. Nik Jhangiani SVP & CFO
 John F. Brock CHAIRMAN & CEO Nik Jhangiani SVP & CFO Forward-Looking Statements Included in this presentation are forward-looking management comments and other statements that reflect management s current
London Roadshow February Doros Constantinou,, CEO Nik Jhangiani, CFO
 London Roadshow 26-27 February 2008 Doros Constantinou,, CEO Nik Jhangiani, CFO Disclaimer The information contained herein includes forward-looking statements which are based on current expectations and
James Quincey President and Chief Operating Officer CAGNY. Feb 23, Kathy Waller EVP and Chief Financial Officer
 CAGNY Feb 23, 2017 James Quincey President and Chief Operating Officer Kathy Waller EVP and Chief Financial Officer Forward-Looking Statements This presentation may contain statements, estimates or projections
Third Quarter 2015 Earnings Call. October 21, 2015
 Third Quarter 2015 Earnings Call October 21, 2015 Forward-Looking Statements This presentation may contain statements, estimates or projections that constitute forward-looking statements as defined under
Coca-Cola HBC AG. Primary Credit Analyst: Maxime Puget, London (44) ;
 ;") Summary: Coca-Cola HBC AG Primary Credit Analyst: Maxime Puget, London (44) 20-7176-7239; maxime.puget@spglobal.com Secondary Contact: Gerson P Brown, London + 02071763531; gerson.brown@spglobal.com Table
Summary: Coca-Cola HBC AG Primary Credit Analyst: Maxime Puget, London (44) 20-7176-7239; maxime.puget@spglobal.com Secondary Contact: Gerson P Brown, London + 02071763531; gerson.brown@spglobal.com Table
STRENGTHENING OUR SYSTEM FOR ENDURING ADVANTAGE. Brian Smith President, Europe, Middle East & Africa
 STRENGTHENING OUR SYSTEM FOR ENDURING ADVANTAGE Brian Smith President, Europe, Middle East & Africa FORWARD-LOOKING STATEMENTS This presentation may contain statements, estimates or projections that constitute
Financial Review. Volume (case equivalents) 8.4m 8.2m 2% Core revenue 706.7m 663.1m 7% Brand investment expenditure 125.7m 120.
 8.4m 8.2m 2% Core revenue 706.7m 663.1m 7% Brand investment expenditure 125.7m 120.") Financial Review MANAGEMENT KEY PERFORMANCE INDICATORS 2018 2017 % movement Volume (case equivalents) 8.4m 8.2m 2% Presented in constant currency rates: Core revenue 706.7m 663.1m 7% Brand investment expenditure
Financial Review MANAGEMENT KEY PERFORMANCE INDICATORS 2018 2017 % movement Volume (case equivalents) 8.4m 8.2m 2% Presented in constant currency rates: Core revenue 706.7m 663.1m 7% Brand investment expenditure
Forward Looking Statements
 Damian Gammell, CEO Nik Jhangiani, CFO 1 1 Forward Looking Statements This document contains statements, estimates or projections that constitute forward-looking statements concerning the financial condition,
Chief Executive Officer s speech
 April 28, 2015, Basel, Switzerland Annual General Meeting Syngenta AG Chief Executive Officer s speech Mike Mack, CEO Good morning ladies and gentlemen. Against last year s backdrop of political upheaval,
Fourth Quarter 2014 Earnings Call. February 10, 2015
 Fourth Quarter 2014 Earnings Call February 10, 2015 Forward-Looking Statements This presentation may contain statements, estimates or projections that constitute forward-looking statements as defined under
FOR IMMEDIATE RELEASE CONTACT: Media: Ben Deutsch (404) Investors: Ann Taylor (404) THE COCA-COLA COMPANY REPORTS
 Investors: Ann Taylor (404) THE COCA-COLA COMPANY REPORTS") Media Relations Department P.O. Box 1734, Atlanta, GA 30301 Telephone (404) 676-2121 FOR IMMEDIATE RELEASE CONTACT: Media: Ben Deutsch (404) 676-2683 Investors: Ann Taylor (404) 676-5383 THE COCA-COLA
Media Relations Department P.O. Box 1734, Atlanta, GA 30301 Telephone (404) 676-2121 FOR IMMEDIATE RELEASE CONTACT: Media: Ben Deutsch (404) 676-2683 Investors: Ann Taylor (404) 676-5383 THE COCA-COLA
Chairman & CEO SVP & CFO
 Chairman & CEO SVP & CFO 1 Included in this presentation are forward-looking management comments and other statements that reflect management s current outlook for future periods. As always, these expectations
Emilio Botín: We are prepared to make the most of all the opportunities for growth within our reach
 Press Release Banco Santander s Annual General Meeting Emilio Botín: We are prepared to make the most of all the opportunities for growth within our reach Last year s results once more demonstrate Banco
Investor Relations Presentation
 Investor Relations Presentation Delivering solutions, shaping the future. Beauty + Home Food + Beverage Pharma Forward Looking Statements & Non-GAAP Financial Measures This presentation includes forward-looking
CAGNY Conference. February 22, 2018
 CAGNY Conference February 22, 2018 Disclaimer This presentation has been prepared and issued by Nomad Foods Limited (the "Company"). This Presentation has been provided solely for information and background.
DELIGHTING CUSTOMERS AND CONSUMERS. Coca Cola European Partners plc Annual Report and Form 20-F 2017
 DELIGHTING CUSTOMERS AND CONSUMERS Coca Cola European Partners plc Annual Report and Form 20-F 2017 Coca-Cola European Partners plc Annual Report and Form 20-F 2017 Contents Introduction 1 At a Glance
2020 STRATEGIC AND FINANCIAL PLAN TRANSFORM TO GROW
 2020 STRATEGIC AND FINANCIAL PLAN TRANSFORM TO GROW Paris, 27 November 2017 Societe Generale will present tomorrow its 2020 Strategic and Financial Plan at an Investor Day in Paris. Commenting on the plan,
NET INCOME INCREASED 15% WITH EBITDA MARGIN GROWTH OF 70BPS IN 3Q13
 NET INCOME INCREASED 15% WITH EBITDA MARGIN GROWTH OF 70BPS IN 3Q13 Monterrey, Mexico, October 28, 2013 Arca Continental, S.A.B. de C.V. (BMV: AC*), the second-largest Coca-Cola bottler in Latin America
REVENUE GREW 46.4% WITH NET INCOME UP 44.9% IN 2017
 REVENUE GREW 46.4% WITH NET INCOME UP 44.9% IN 2017 Monterrey, Mexico, February 23, 2018 Arca Continental, S.A.B. de C.V. (BMV: AC*) ( Arca Continental or AC ), the second-largest Coca-Cola bottler in
Eric Foss Chairman & CEO. Al Drewes SVP & CFO
 Eric Foss Chairman & CEO Al Drewes SVP & CFO Cautionary Statement Statements made in this presentation that relate to future performance or financial results of PBG are forward-looking statements, which
Principal risks and uncertainties
 Principal risks and uncertainties A key challenge for any business is to identify the principal risks it faces and to develop and monitor appropriate controls. A successful risk management process balances
Results for the Fourth Quarter ended 31 December 2017
 Results for the Fourth Quarter ended 31 December 2017 Athens, Greece, 25 April 2018 Frigoglass SAIC ( Frigoglass or we or the Group ) announces results for the quarter and full year ended 31 December 2017
Forward-Looking Statements
 1 Forward-Looking Statements This document may contain statements, estimates or projections that constitute forward-looking statements. Generally, the words believe, expect, intend, estimate, anticipate,
Six months Financial Report of the Coca-Cola Hellenic Bottling Company S.A.
 Six months Financial Report of the Coca-Cola Hellenic Bottling Company S.A. 27 June 2008 Index 1. Statement pursuant to article 5 of Law 3556/2007 2. Board of Directors Report for the period ended 27 June
ARCA CONTINENTAL REPORTS EBITDA GROWTH OF 5.3% WITH NET INCOME UP 23.3% OR 140 BPS IN 4Q14
 ARCA CONTINENTAL REPORTS EBITDA GROWTH OF 5.3% WITH NET INCOME UP 23.3% OR 140 BPS IN 4Q14 Monterrey, Mexico, February 18, 2015 Arca Continental, S.A.B. de C.V. (BMV: AC*) ( Arca Continental or AC ), the
dbaccess GLOBAL CONSUMER CONFERENCE 2018 Damian Gammell CEO, Nik Jhangiani CFO GLOBAL CONSUMER CONFERENCE 2018
 dbaccess Damian Gammell CEO, Nik Jhangiani CFO 1 FORWARD-LOOKING STATEMENTS This document may contain statements, estimates or projections that constitute forward-looking statements concerning the financial
INSTITUTIONAL PRESENTATION. May 2018
 INSTITUTIONAL PRESENTATION May 2018 Statements contained in this presentation may contain information that is forward-looking and reflects management's current view and estimates of future economic circumstances,
ARCA CONTINENTAL REPORTS REVENUE GROWTH OF 22.5% WITH EBITDA UP 20.3% IN 2016
 ARCA CONTINENTAL REPORTS REVENUE GROWTH OF 22.5% WITH EBITDA UP 20.3% IN 2016 Monterrey, Mexico, February 24, 2017 Arca Continental, S.A.B. de C.V. (BMV: AC*) ( Arca Continental or AC ), the second-largest
INNOVATING IN THE NEW
 2018 LETTER TO SHAREHOLDERS INNOVATING IN THE NEW NEW APPLIED NOW DELIVERING IN FISCAL 2018 Accenture delivered outstanding financial results in fiscal 2018, reflecting excellent demand for our differentiated
Praxair, Inc. Steve Angel Chairman, President and Chief Executive Officer. Credit Suisse Basic Materials Conference September 17, 2014
 Praxair, Inc. Steve Angel Chairman, President and Chief Executive Officer Credit Suisse Basic Materials Conference September 17, 2014 Forward Looking Statement This document contains forward-looking statements
Royal Philips Electronics Creating long-term value with sustainability
 Royal Philips Electronics Creating long-term value with sustainability ING Benelux SRI Conference Amsterdam March 25 th, 2010 Important information Forward-looking statements This document and the related
EBITDA GREW 6% TO REACH A 24% MARGIN IN 2Q14
 EBITDA GREW 6% TO REACH A 24% MARGIN IN 2Q14 Monterrey, Mexico, July 17, 2014 Arca Continental, S.A.B. de C.V. (BMV: AC*) ( Arca Continental or AC ), the second-largest Coca-Cola bottler in Latin America
Principal risks and uncertainties
 Principal risks and uncertainties Strategic report Principal risks are a risk or a combination of risks that, given the Group s current position, could seriously affect the performance, future prospects
Assess record for 'Disclosure of Non-Financial Information by Companies'
 Page 1 of 6 Assess record for 'Disclosure of Non-Financial Information by Companies' Meta Informations Creation date 28-01-2011 Last update date User name null Case Number 396996348061702811 Invitation
Responsible Investment: A Matter of Principles
 Responsible Investment: A Matter of Principles IMAS LunchTime Talk 18 November 2016 1 What is Stewardship? Responsible wealth creation How can a business thrive and sustain growth while enhancing the wealth
Alternative Investment Strategies
 Alternative Investment Strategies Bringing together opportunities across the alternative investments spectrum to meet investor goals August 2018 For professional investors only. Switzerland: For Qualified
Good morning and welcome to AIA s 2018 interim results presentation. I am Lance Burbidge, Chief Investor Relations Officer.
 AIA Group Limited 2018 Interim Results Analyst Briefing Presentation Transcript 24 August 2018 Lance Burbidge, Chief Investor Relations Officer: Good morning and welcome to AIA s 2018 interim results presentation.
Royal Bank of Canada. Annual Report
 Royal Bank of Canada 2010 Annual Report Vision Values Strategic goals Always earning the right to be our clients first choice Excellent service to clients and each other Working together to succeed Personal
Credit Suisse 6 th Annual Industrials Conference November 2018
 Credit Suisse 6 th Annual Industrials Conference November 2018 Safe Harbor This presentation includes forward-looking statements which are statements that are not historical facts, including statements
Investor Deck December 2018
 Investor Deck December 2018 Safe Harbor This presentation includes forward-looking statements which are statements that are not historical facts, including statements that relate to the mix of and demand
2017 Full Year. Results Presentation. 21 February 2018
 2017 Full Year Results Presentation 21 February 2018 CAUTIONARY STATEMENT 2017 Full Year Results Slide 2 Full Year Highlights 2017 Full Year Results Presentation 8TH YEAR OF DOUBLE-DIGIT GROWTH 2017 FINANCIAL
Results for the First Quarter ended 31 March 2018
 Results for the First Quarter ended 31 March 2018 Athens, Greece, 11 June 2018 Frigoglass SAIC ( Frigoglass or we or the Group ) announces unaudited results for the quarter ended 31 March 2018 First Quarter
Unilever Investor Event 2018 Graeme Pitkethly 4 th December 2018
 Unilever Investor Event 2018 Graeme Pitkethly 4 th December 2018 SAFE HARBOUR STATEMENT This announcement may contain forward-looking statements, including forward-looking statements within the meaning
Clarion Housing Group Value for Money Statement 2017
 Clarion Housing Group Value for Money Statement 2017 Value for Money Highlights Value for Money Highlights Clarion Housing Group is a business for social purpose. First and foremost we are a social landlord
Britvic plc Interim Results 2018
 Britvic plc Interim Results 2018 CEO SIMON LITHERLAND DELIVERING ON OUR STRATEGIC PRIORITIES AND VISION 2 OUR STRATEGY IS DELIVERING CONSISTENT RETURNS FOR SHAREHOLDERS GENERATE PROFITABLE GROWTH IN OUR
ESG AND RESPONSIBLE INVESTMENT PHILOSOPHY
 ESG AND RESPONSIBLE INVESTMENT PHILOSOPHY February 2017 AMP CAPITAL ESG AND RESPONSIBLE INVESTMENT PHILOSOPHY 1 AMP Capital is one of Asia Pacific s largest investment managers. We have a single goal in
THE COCA-COLA COMPANY REPORTS 2010 THIRD QUARTER AND YEAR-TO-DATE RESULTS
 Global Public Affairs & Communications Department P.O. Box 1734, Atlanta, GA 30301 Telephone +1 (404) 676-2683 CONTACTS: Investors: Jackson Kelly +1 (404) 676-7563 THE COCA-COLA COMPANY REPORTS Media:
Investor Presentation First Half 2011 Financial Results 6 th Annual Greek Roadshow September 8&9, London
 www.frigoglass.com Investor Presentation First Half 2011 Financial Results 6 th Annual Greek Roadshow September 8&9, London www.frigoglass.com 2 What we do Ice-Cold Merchandisers First Half 2011: Sales
COCA-COLA EUROPEAN PARTNERS. S E P T E M B E R N i k J h a n g i a n i, C F O
 COCA-COLA EUROPEAN PARTNERS S E P T E M B E R 2 0 1 8 N i k J h a n g i a n i, C F O 1 FORWARD LOOKING STATEMENTS This document may contain statements, estimates or projections that constitute forward-looking
Integrated Annual Report
 Integrated Annual Report Summary Key data 217 We connect people A European project Sustained growth New sites 217-223 +8, Investment committed in 217 2 Bn Purchase + Construction 4Mn 2,839 sites and DAS
Introduction. What is ESG?
 Contents Introduction 2 Purpose of this Guide 6 Why reporting on ESG is important 10 Best Practice Recommendations 14 Appendix: Sustainability Reporting Initiatives 20 01 Introduction Environmental, social
Investor Presentation. April 2018
 Investor Presentation April 2018 Disclaimer This presentation has been prepared and issued by Nomad Foods Limited (the "Company"). This Presentation has been provided solely for information and background.
STRATEGY NORGES BANK INVESTMENT MANAGEMENT
 STRATEGY 2017 2019 NORGES BANK INVESTMENT MANAGEMENT Our mission is to safeguard and build financial wealth for future generations. Contents Strategy 2017 2019 We are a large global investor and a long-term
Henkel Our strategic priorities for the future. Hans Van Bylen / Carsten Knobel Press Conference, November 17, 2016
 Henkel 2020 + Our strategic priorities for the future Hans Van Bylen / Carsten Knobel Press Conference, November 17, 2016 Disclaimer This information contains forward-looking statements which are based
THE GLOBAL IT INTEGRATOR FOR TRADING
 THE GLOBAL IT INTEGRATOR FOR TRADING EQUIPPED TO MEET YOUR FUTURE TRADING CHALLENGES WE GRASP HOW TRADING IS CHANGING Our deep understanding of the trading landscape and its regulation ensures you can
THE COCA-COLA COMPANY REPORTS 2009 FOURTH QUARTER AND FULL YEAR RESULTS
 Global Public Affairs & Communications P.O. Box 1734, Atlanta, GA 30301 Telephone (404) 676-2683 CONTACT: Investors: Jackson Kelly (404) 676-7563 Media: Dana Bolden (404) 676-2683 pressinquiries@na.ko.com
ENEL STRATEGIC PLAN: FULL SPEED AHEAD ON DIGITALISATION AND CUSTOMERS
 Media Relations Investor Relations T +39 06 8305 5699 T +39 06 8305 7975 F +39 06 8305 3771 F +39 06 8305 7940 ufficiostampa@enel.com investor.relations@enel.com enel.com enel.com ENEL 2018-2020 STRATEGIC
Results for the Three Months Ended April 1, 2005 (US GAAP)
") Armenia, Austria, Belarus, Bosnia & Herzegovina, Bulgaria, Croatia, Czech Republic, Estonia FYROM, Greece, Hungary, Ireland, Italy, Latvia, Lithuania, Moldova, Nigeria, Northern Ireland, Poland, Romania,
Armenia, Austria, Belarus, Bosnia & Herzegovina, Bulgaria, Croatia, Czech Republic, Estonia FYROM, Greece, Hungary, Ireland, Italy, Latvia, Lithuania, Moldova, Nigeria, Northern Ireland, Poland, Romania,
I m very pleased to be here in Calgary with all of you for CIBC s 148th annual general meeting, and my first as CEO.
 Remarks for Victor G. Dodig, President and Chief Executive Officer CIBC Annual General Meeting Calgary, Alberta April 23, 2015 Check Against Delivery Good morning, ladies and gentlemen. I m very pleased
S&D POSITION PAPER SUMMARY ON EUROPE 2020 STRATEGY A REVIEW FOR SUCCESS
 POSITION PAPER - SUMMARY S&D POSITION PAPER SUMMARY ON EUROPE 2020 STRATEGY A REVIEW FOR SUCCESS OUT OF THE CRISIS - A BETTER ECONOMIC MODEL FOR EUROPE Financing a better Europe Date: 16 March 2016 European
Accelerating towards excellence. Investor relations June 2017
 Accelerating towards excellence Investor relations June 2017 Cautionary Statement FORWARD-LOOKING STATEMENTS This presentation contains forward-looking statements These forward-looking statements relate
International Monetary and Financial Committee
 International Monetary and Financial Committee Thirty-Sixth Meeting October 14, 2017 IMFC Statement by Toomas Tõniste Chairman EU Council of Economic and Finance Ministers Statement by Minister of Finance,
FROM 12 TO 21: OUR WAY FORWARD
 FROM 12 TO 21: OUR WAY FORWARD MESSAGE FROM THE BOARD Weldon Cowan, chair of the board of directors The board of directors shares the corporation s excitement about the next phase of the From 12 to 21