Navigating the Fixed Income Minefield
|
|
|
- Lorin Stanley
- 6 years ago
- Views:
Transcription
1 Navigating the Fixed Income Minefield Jeffrey Sherman, CFA Portfolio Manager DoubleLine Capital February 20, 2014
2 When all the experts and forecasts agree -- something else is going to happen. - Bob Farrell 1
3 Consensus Dramatic on Wall Street Equities vs. Fixed Income 2014 Outlook BAML Barclays Capital BlackRock BNP Paribas CITI Credit Suisse Deutsche Bank Goldman Sachs HSBC Jefferies JP Morgan Morgan Stanley UBS Global Equities Global FI 2014 Equity Market Cross Asset Weights BAML Barclays Capital BlackRock BNP Paribas CITI Credit Suisse Deutsche Bank Goldman Sachs HSBC Jefferies JP Morgan Morgan Stanley UBS US Equity Asia Equity Japan China European Equity UK Emerging Markets Developed Markets OVERWEIGHT (GREEN) NEUTRAL (GREY) UNDERWEIGHT (RED) Source: 2
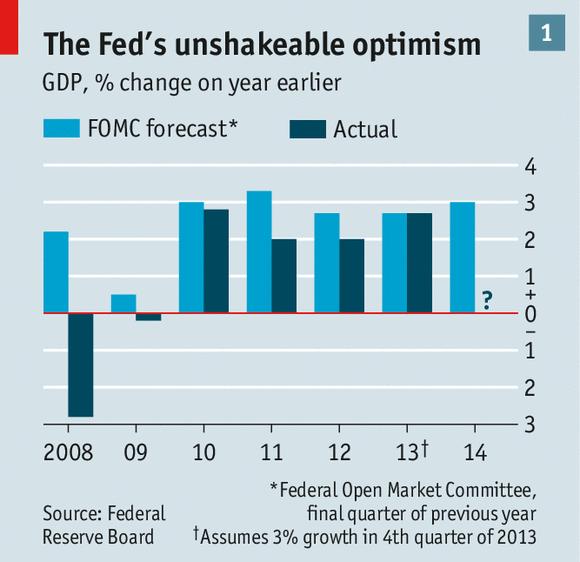
4 Fed s Forecasting Track Record Source: Fed = Federal Reserve 3
5 Fed s Forecasting Track Record Source: Bianco Research, Washington Post Fed = Federal Reserve, GDP = Gross Domestic Product 4
6 Fed Governors Forecasts of Fed Funds Rates Source: Bianco Fed = Federal Reserve 5
7 Average Annual Real GDP Growth by Decade Average Historical Real U.S. GDP Growth by Decade 7% 6.38% 6% 5.59% 6.04% 5% 4.49% 4.24% 5.03% 5.16% 4.52% 4.25% 4% 3% 3.73% 3.26% 3.89% 3.07% 3.73% 2.92% 2.67% 3.56% 3.24% 3.14% 3.25% 2.46% * 2% 1.81% 1.33% 1% 0% * 2010 s : Average of 2010, 2011, 2012 and 2013 Real GDP Growth Data Source: Measuring Worth, DoubleLine Capital GDP = Gross Domestic Product 6
8 Price of Home Purchased with 20% down & $1000 Mortgage Payment Average 30 Year Fixed Mortgage Rate June 30, January 31, 2014 Cost of Home Mortgage Sensitive to Rate Rise $400,000 $350,000 Average 30 Year Fixed U.S. Home Mortgage Rate (bankrate.com) (RHS) Price of Home Purchased with 20% Down and $1000 Mortgage Payment(LHS) 9% 8% $300,000 7% $250,000 $200,000 $150,000 $247,000 $208,000 6% 5% 4% 3% $100, % 6.0% 2% $50,000 1% $0 0% 0.00% 1.00% 2.00% 3.00% 4.00% 5.00% 6.00% 7.00% 8.00% 9.00% 10.00% 11.00% 12.00% 13.00% 14.00% Mortgage Interest Rate Data Source: Bloomberg, US Census Bureau, DoubleLine Capital 7
9 Net Household Wealth (Billions USD) 1Q Q 2013 S&P 500 TR and Case Shiller 10 1Q Q 2013 Total U.S. Household Wealth vs. Major Assets $90, $80, $70, $60,000 $50,000 $40, $30,000 $20,000 $10,000 Total Houshold Wealth (LHS) SP500 Total Return (RHS) Case Shiller 10 (RHS) $0 0 Source: Bloomberg, DoubleLine Capital 8
10 Real Total Household Wealth in (Billions USD) Real Median Household Income in 2011 Dollars U.S. Median Household Income vs. U.S. Total Household Wealth $60,000 $57,000 $56,000 $50,000 $55,000 $40,000 $54,000 $53,000 $30,000 $52,000 $20,000 $10,000 Real Total Houshold Wealth (RHS) Real Median Household Income (LHS) $51,000 $50,000 $49,000 $0 $48,000 Source: Bloomberg, DoubleLine Capital 9
11 Wages & Salary Accrual / Gross Domestic Product Q through Q Wages and Salary as a Percentage of GDP 55% 51.7% Q % 45% 42.7% Q % 42.1% Q Source: Bloomberg, DoubleLine Capital 10

12 Wages and Productivity Growth Source: 11
13 US Employment to Population Ratio (%) December 31, 1990 December 31, 2013 US Unemployment Rate (%) December 31, 1990 December 31, 2013 Unemployment Situation US Employment to Population Ratio (LHS) US Unemployment Rate (RHS) Source: Bloomberg 12
14 Economic Actviity and M2 in Billions USD Velocity of Money (M2) Velocity of Money March 31, 1970 through December 31, 2013 $18, $16,000 $14,000 Economic Activity (M2 * V) M2 ($) Velocity ($) {RHS} $12,000 $10, $8,000 $6, $4, $2, $0 1.5 Source: Bloomberg, DoubleLine Capital 13
15 Index Level YoY Change January 31, 1960 through December 31, 2013 Inflation Measurements at Low Levels Consumer Price Index Personal Consumption Expenditure Index Source: Bloomberg, DoubleLine Capital 14
16 Percent April 26, January 31, 2014 Inflation Expectations Federal Reserve 5 Year Inflation Expectation Five Year Five Years Forward 5 Year Breakevens 10 Year Breakevens Source: Bloomberg 15

17 Historical Impact of Quantitative Easing in Japan Source: St. Louis Fed, 16
18 Federal Reserve Balance Sheet (Millions USD) December 31, January 31, 2014 Federal Reserve Balance Sheet $4,500,000 $4,000,000 $3,500,000 $3,000,000 $2,500,000 $2,000,000 $1,500,000 Special Purpose Credit Facility Treasury Currency Outstanding SDR Gold Other Federal Reserve Assets Central Bank Liquidity Swaps Float Distressed Asset Credit Facility Other Credit Extensions Term Asset Backed Securities Loans Seasonal Credit Secondary Credit Primary Credit Repurchase Agreements MBS Agency MBS Inflation Compensation TIPS Nominal Notes and Bonds Treasury Bills $1,000,000 $500,000 $0 Source: Bloomberg, DoubleLine Capital You cannot invest directly in an Index. 17

19 Taper Path Outlook As of December 31, 2013 Source: GS F cast = Goldman Sachs Forecast 18
20 5.0% 10-Year Treasury Yield during Fed Open Market Committee Action March 18, 2009 through January 31, % -126 bps 4.0% 3.5% -130 bps +122 bps -25 bps 3.0% 2.5% 2.0% +129 bps +59 bps +10 bps +5bps 1.5% 1.0% -24 bps +120 bps No Policy QE1 Expansion QE2 Op Twist Op Twist Extension and QE3 QE3 Expanded Taper Talk No Taper Taper $20B Source: Bloomberg, DoubleLine Capital Past performance is no guarantee of future results. You cannot invest directly in an index. 19
21 Year Treasury Performance during Fed Open Market Committee Action March 18, 2009 through January 31, % % +1% +2% % 520 Cum: +15% +12% % -7% % % No Policy QE1 + EXPANSION QE2 Op Twist Op Twist Extension and QE3 QE3 Expanded Taper Talk No Taper Taper $20B Source: Bloomberg, DoubleLine Capital Past performance is no guarantee of future results. You cannot invest directly in an index. 20
22 6.0% 30-Year Treasury Yield during Fed Open Market Committee Action March 18, 2009 through January 31, % -67 bps 5.0% -138 bps 4.5% +101 bps -31 bps 4.0% 3.5% 3.0% +118 bps +33 bps +21 bps +7bps 2.5% 2.0% -26 bps +102 bps No Policy QE1 Expansion QE2 Op Twist Op Twist Extension and QE3 QE3 Expanded Taper Talk No Taper Taper $20B Source: Bloomberg, DoubleLine Capital Past performance is no guarantee of future results. You cannot invest directly in an index. 21
23 30-Year Treasury Performance during Fed Open Market Committee Action 900 March 18, 2009 through January 31, % % Cum: +17% +13% -1% -1% +6% % % % -3% 400 No Policy QE1 + EXPANSION QE2 Op Twist Op Twist Extension and QE3 QE3 Expanded Taper Talk No Taper Taper $20B Source: Bloomberg, DoubleLine Capital Past performance is no guarantee of future results. You cannot invest directly in an index. 22
24 S&P 500 Performance during Fed Open Market Committee Action March 18, 2009 through January 31, % +8% Cum: +119% -11% +6% % +5% +27% % +16% % No Policy QE1 + EXPANSION QE2 Op Twist Op Twist Extension and QE3 QE3 Expanded Taper Talk No Taper Taper $20B Source: Bloomberg, DoubleLine Capital Past performance is no guarantee of future results. You cannot invest directly in an index. 23
25 1600 U.S. High Yield Performance during Fed Open Market Committee Action March 18, 2009 through January 31, Cum: +131% +10% -3% -1% +3% +1% % +7% % +9% % No Policy QE1 + EXPANSION QE2 Op Twist Op Twist Extension and QE3 QE3 Expanded Taper Talk No Taper Taper $20B Source: Bloomberg, DoubleLine Capital Past performance is no guarantee of future results. You cannot invest directly in an index. 24
26 2600 Bank Loan Performance during Fed Open Market Committee Action March 18, 2009 through January 31, % +0% 2200 Cum: +85% +4% +1% +1% +5% % % +6% % 1200 Mar-09 Jul-09 Nov-09 Mar-10 Jul-10 Nov-10 Mar-11 Jul-11 Nov-11 Mar-12 Jul-12 Nov-12 Mar-13 Jul-13 Nov-13 No Policy QE1 + EXPANSION QE2 Op Twist Op Twist Extension and QE3 QE3 Expanded Taper Talk No Taper Taper $20B Source: Bloomberg, DoubleLine Capital Past performance is no guarantee of future results. You cannot invest directly in an index. 25
27 1200 International - Emerging Markets Performance during Fed Open Market Committee Action March 18, 2009 through January 31, Cum: +68% +13% +1% +11% -8% +2% -1% 900-5% +9% % % 500 No Policy QE1 + EXPANSION QE2 Op Twist Op Twist Extension and QE3 QE3 Expanded Taper Talk No Taper Taper $20B Source: Bloomberg, DoubleLine Capital Past performance is no guarantee of future results. You cannot invest directly in an index. 26
28 Peak to Trough Drawdown December 31, 2012 through January 31, 2014 Drawdown across Fixed Income Sectors 0% -2% -4% -6% -8% -10% -12% -14% -16% -18% -20% 10Y TSY 30Y TSY US Corporates US Cash Pay High Yield International Developed International Emerging Mortgage Backed Securities Bank Loans Source: Bloomberg, DoubleLine Capital Past performance is no guarantee of future results. You cannot invest directly in an index. 27
29 60 Month Correlation Matrix of Fixed Income Returns As of December 31, 2013 US Government Municipal Agency MBS CMBS ABS US IG Credit US HY Credit Bank Loans Convertibles International Sovereign EM Sovereign EM Corporate Inflation Linked T-Bills US Government 1.00 Municipal Average Correlation 0.36 Agency MBS CMBS ABS US IG Credit US HY Credit Bank Loans Convertible International Sovereign EM Sovereign EM Corporate Inflation Linked T-Bills Source: Bloomberg, DoubleLine Capital Past performance is no guarantee of future results. You cannot invest directly in an index. 28
30 Heat Map of Fixed Income Sector Returns International Sovereign 19.99% US HY Credit 27.23% EM Sovereign 11.62% EM Sovereign 10.25% Convertibles 12.75% Inflation Linked 11.61% International Sovereign 14.46% US HY Credit 56.28% CMBS 18.35% Inflation Linked 14.01% EM Sovereign 17.44% Convertibles 25.00% Inflation Linked 16.71% Convertibles 25.80% US HY Credit 10.76% EM Corporate 6.10% US HY Credit 11.64% International Sovereign 10.92% US Government 12.78% Bank Loans 51.62% Convertibles 16.52% Municipal 11.19% US HY Credit 15.44% US HY Credit 7.38% CMBS 14.83% EM Sovereign 13.65% US Government 11.30% EM Sovereign 22.21% EM Corporate 16.22% International Sovereign 16.22% International Sovereign 10.53% EM Corporate 10.27% Convertibles 8.49% Bank Loans 5.06% Municipal 3.94% ABS 3.41% EM Sovereign 9.86% Bank Loans 6.74% EM Corporate 6.53% US Government 8.76% Agency MBS 6.96% EM Sovereign 6.16% Agency MBS 8.30% T-Bills 1.80% Inflation Linked -1.17% Convertibles 47.19% EM Corporate 34.88% EM Sovereign 29.82% US HY Credit 15.24% EM Corporate 13.08% EM Sovereign 12.24% US Government 9.19% International Sovereign 7.83% US IG Credit 7.51% EM Corporate 15.01% Convertibles 14.41% US IG Credit 10.37% Bank Loans 5.29% ABS 0.91% CMBS 0.40% EM Corporate 10.90% Bank Loans 9.97% Inflation Linked 8.40% T-Bills 3.00% ABS 5.43% CMBS 4.98% Municipal -3.95% CMBS 27.85% International Sovereign 10.52% EM Sovereign 7.35% Bank Loans 9.67% T-Bills 0.05% Municipal 10.73% US IG Credit 10.17% US IG Credit 8.31% Inflation Linked 8.26% Municipal 5.45% US IG Credit 5.41% Inflation Linked 2.86% US HY Credit 2.83% Agency MBS 5.32% International Sovereign 5.30% T-Bills 4.74% US IG Credit 4.64% US IG Credit -6.82% EM Sovereign % US IG Credit 19.76% Municipal 14.45% Bank Loans 10.13% US IG Credit 9.52% CMBS 6.20% Agency MBS 6.14% CMBS 9.07% Municipal 7.26% EM Corporate -0.60% Agency MBS -1.39% Agency MBS 9.41% Municipal 6.18% Bank Loans 5.17% US Government 2.66% CMBS 4.98% Convertibles 4.12% EM Corporate % ABS 10.62% Inflation Linked 6.46% US HY Credit 4.50% Inflation Linked 7.18% US IG Credit -1.46% ABS 4.88% CMBS 4.74% Agency MBS 4.74% Agency MBS 2.62% Municipal 4.96% EM Corporate 3.91% CMBS % Inflation Linked 10.12% Agency MBS 5.67% EM Corporate 2.32% ABS 3.03% Municipal -2.89% Bank Loans 1.91% Agency MBS 3.29% CMBS 4.51% US IG Credit 1.97% T-Bills 4.76% Municipal 3.29% ABS % Agency MBS 5.76% US Government 5.61% Bank Loans 1.51% Agency MBS 2.59% US Government -3.21% T-Bills 1.70% US HY Credit -1.14% Convertibles -4.95% US Government 2.36% ABS 2.27% T-Bills 1.07% US Government 3.42% ABS 2.33% T-Bills 1.24% CMBS 1.84% Convertibles -0.34% International Sovereign -9.50% US IG Credit 4.38% US Government 3.48% Inflation Linked 0.40% US HY Credit 2.17% Bank Loans 2.08% ABS -4.02% Source: Bloomberg, DoubleLine Capital Past performance is no guarantee of future results. You cannot invest directly in an index. US HY Credit % Bank Loans % Convertibles % International Sovereign 2.33% T-Bills 0.16% US Government -2.58% ABS 5.02% Municipal 2.25% T-Bills 0.13% ABS 1.43% T-Bills 0.08% Convertibles -3.42% US Government 2.19% T-Bills 0.07% International Sovereign -2.35% EM Sovereign -5.25% International Sovereign -9.00% Inflation Linked -9.37% 29
31 Years Yield to Maturity (%) Yield Per Unit of Duration Percentage (%) of Barclays U.S. Aggregate Current View of the World Aggregate Yield and Duration Bond indexing currently presents challenges in the Index Composition 1 current low-yield environment 100% Since Treasuries are the lowest yielding sector of the 90% US fixed income market and Treasuries make up a 80% 70% larger portion of the index, the yield has diminished 60% significantly 50% 40% Simultaneously, the duration of the index has 30% lengthened more than a year to around 5 years 20% 10% This puts the yield-to-duration ratio at the lowest 0% level since the inception of the Barclays US Aggregate Index Yield and Duration 2 Yield per Unit of Duration 2 Barclays U.S. Aggregate Yield and Duration January 30, 1976 to January 31, 2014 Duration (Mod. Adj.) Sector Composition of Barclays U.S. Aggregate January January 2014 U.S. Government U.S. Credit U.S. Mortgage Backed Securities Asset-Backed Securities CMBS Barclays U.S. Aggregate Yield Per Unit of Duration January 31, 1976 to January 31, January 31, 1973 January 31, 2014; Source Barclays Capital, DoubleLine Capital 2. January 31, January 31, 2014; Source Barclays Capital, DoubleLine Capital You cannot invest directly in an index. 30
32 Current Market Yields in Various Fixed Income Sectors With the developed world continuing down the path of quantitative easing, the traditional sectors of the global fixed income market are providing yields of less than 4%. However, other sectors of the fixed income market still offer relatively attractive yields. Sector Yield U.S. Government Securities 1.45% International Sovereign Debt 1.07% Agency Residental Mortgage-Backed Securities 2.89% Commercial Mortgage-Backed Securities 2.25% U.S. Investment Grade Corporate 3.16% Emerging Markets Sovereign Debt 5.64% Emerging Markets Corporate Debt 5.73% Non-Agency Residential Mortgage-Backed Securities* 5.00% Bank Loans 4.87% Global High Yield Corporate Debt 6.21% Collateralized Loan Obligations* 5.50% Traditional Bond Sectors (Barclays Global Aggregate Index sectors) Non-Traditional Bond Sectors As of January 31, Source: DoubleLine, Bank of America/Merrill Lynch Index Data, S&P/LSTA Leveraged Loan Index Data, JP Morgan Research U.S. Government Securities = G0A0, International Sovereign Debt = N0G0, Agency Residential MBS = M0A0, Commercial MBS = CMBS, U.S. Investment Grade Corporate = C0AO, Emerging Markets Sovereign Debt = IGOVA, Emerging Markets Corporate Debt = JPM CEMBI, *Non-Agency RMBS = Calculated by DoubleLine, Bank Loans = S&P/LSTA, Global High Yield Corporate Debt = J0A0, **Collateralized Loan Obligations = JP Morgan Research Seasoned BBB + BB issued average yield spread. Yields may not be reached based on various factors. You cannot invest directly in an index. Past performance is no guarantee of future results. 31
33 Navigating the Fixed Income Minefield Jeffrey Sherman, CFA Portfolio Manager DoubleLine Capital February 20, 2014
34 Disclaimer Important Information Regarding This Report Issue selection processes and tools illustrated throughout this presentation are samples and may be modified periodically. Such charts are not the only tools used by the investment teams, are extremely sophisticated, may not always produce the intended results and are not intended for use by non-professionals. DoubleLine has no obligation to provide revised assessments in the event of changed circumstances. While we have gathered this information from sources believed to be reliable, DoubleLine cannot guarantee the accuracy of the information provided. Securities discussed are not recommendations and are presented as examples of issue selection or portfolio management processes. They have been picked for comparison or illustration purposes only. No security presented within is either offered for sale or purchase. DoubleLine reserves the right to change its investment perspective and outlook without notice as market conditions dictate or as additional information becomes available. Important Information Regarding Risk Factors Investment strategies may not achieve the desired results due to implementation lag, other timing factors, portfolio management decision-making, economic or market conditions or other unanticipated factors. The views and forecasts expressed in this material are as of the date indicated, are subject to change without notice, may not come to pass and do not represent a recommendation or offer of any particular security, strategy, or investment. Past performance is no guarantee of future results. Important Information Regarding DoubleLine In preparing the client reports (and in managing the portfolios), DoubleLine and its vendors price separate account portfolio securities using various sources, including independent pricing services and fair value processes such as benchmarking. To receive a complimentary copy of DoubleLine s current Form ADV Part (which contains important additional disclosure information), a copy of the DoubleLine s proxy voting policies and procedures, or to obtain additional information on DoubleLine s proxy voting decisions, please contact DoubleLine s Client Services. Important Information Regarding DoubleLine s Investment Style DoubleLine seeks to maximize investment results consistent with our interpretation of client guidelines and investment mandate. While DoubleLine seeks to maximize returns for our clients consistent with guidelines, DoubleLine cannot guarantee that DoubleLine will outperform a client's specified benchmark. Additionally, the nature of portfolio diversification implies that certain holdings and sectors in a client's portfolio may be rising in price while others are falling; or, that some issues and sectors are outperforming while others are underperforming. Such out or underperformance can be the result of many factors, such as but not limited to duration/interest rate exposure, yield curve exposure, bond sector exposure, or news or rumors specific to a single name. DoubleLine is an active manager and will adjust the composition of client s portfolios consistent with our investment team s judgment concerning market conditions and any particular security. The construction of DoubleLine portfolios may differ substantially from the construction of any of a variety of bond market indices. As such, a DoubleLine portfolio has the potential to underperform or outperform a bond market index. Since markets can remain inefficiently priced for long periods, DoubleLine s performance is properly assessed over a full multi-year market cycle. Diversification does not assure a profit or protect against a loss in a declining market. Opinions expressed are subject to change at any time, are not a guarantee and should not be considered investment advice DoubleLine Capital LP 33
Emerging Market Debt Outlook
 Emerging Market Debt Outlook Live Webcast hosted by: Luz Padilla Portfolio Manager Emerging Markets Fixed Income Fund (DBLEX/DLENX) June 15, 2010 Fund Offerings Emerging Markets Fixed Income Fund Retail
Commercial Consumerism. Jeffrey Gundlach Chief Executive Officer Chief Investment Officer
 Commercial Consumerism Jeffrey Gundlach Chief Executive Officer Chief Investment Officer June 23, 2010 Domestic Credit Market Debt as % of Gross Domestic Product 1929-2009 400% 350% Year 1 FDR Year 1 BHO
DoubleLine Funds for a Rising Rate Environment February 2017
 February 2017 333 S. Grand Ave., 18th Floor Los Angeles, CA 90071 (213) 633-8200 Knee jerk reactions to interest rate movements regardless of the macroeconomic environment result in drastic asset allocation
The Potential Advantages of Mortgage Backed Securities in Today s Environment
 The Potential Advantages of Mortgage Backed April 2018 Written by: Chris Stegemann, Product Specialist 333 S. Grand Ave., 18th Floor Los Angeles, CA 90071 (213) 633-8200 Introduction The U.S. Federal Reserve
The Direction of Interest Rates
 December 2018 Ted Hospodar Colin Callahan Jameson Love 333 S. Grand Ave., 18th Floor Los Angeles, CA 90071 (213) 633-8200 Annual Change (domestic currency) The Direction of Interest Rates Markets do not
Tick, Tick, Tick. Jeffrey Gundlach. January 25, Presented By: Chief Executive Officer DoubleLine Capital
 Tick, Tick, Tick Presented By: Jeffrey Gundlach Chief Executive Officer DoubleLine Capital January 25, 2016 TAB I The Fed 1.12.16 Just Markets Webcast 2 Worst Years of Major Asset Classes Source: Bianco
FOR 2018 GLOBAL MARKET OUTLOOK PRESS BRIEFING. PROVIDED TO DESIGNATED MEMBERS OF THE PRESS ONLY, NOT FOR FURTHER DISTRIBUTION.
 2018 Global Market Outlook Press Briefing GLOBAL FIXED INCOME Mark Vaselkiv Portfolio Manager, CIO, Fixed Income November 14, 2017 FOR 2018 GLOBAL MARKET OUTLOOK PRESS BRIEFING. PROVIDED TO DESIGNATED
Quarterly Commentary
 Quarterly Commentary Low Duration Emerging Markets Fixed Income Fund DBLLX/DELNX March 31, 2017 333 S. Grand Ave., 18th Floor Los Angeles, CA 90071 (213) 633-8200 Citi Economic Surprise December 31, 2009
Quarterly Commentary. Global Bond Fund DBLGX/DLGBX
 Quarterly Commentary Global Bond Fund DBLGX/DLGBX September 30, 2016 333 S. Grand Ave., 18th Floor Los Angeles, CA 90071 (213) 633-8200 Quarterly Commentary Overview During the third quarter, investors
Quarterly Commentary. Strategic Commodity Fund DBCMX/DLCMX
 Quarterly Commentary Strategic Commodity Fund DBCMX/DLCMX June 30, 2017 333 S. Grand Ave., 18th Floor Los Angeles, CA 90071 (213) 633-8200 Quarterly Commentary Overview A few main themes dominated headlines
Tick, Tick, Tick. Presented by: Jeffrey Gundlach CEO, DoubleLine Capital
 Tick, Tick, Tick Presented by: Jeffrey Gundlach CEO, DoubleLine Capital TAB I The Fed Pete Carroll Janet Yellen Worst Years of Major Asset Classes Source: Bianco Research S&P 500 Index = Standard & Poor
Emerging Market Debt: Smoke but no fire
 Emerging Market Debt: Smoke but no fire November 2014 Edwin Gutierrez, Head of Emerging Market Sovereign Debt Aberdeen Asset Management For Professional Investors only Not for public distribution Smoke
Insurance Company Investment Trends A Client Survey
 Insurance Company Investment Trends A Client Survey Marco Bravo, CFA Principal, Senior Portfolio Manager AAM - Insurance Investment Management Summary of Survey Respondents Company Type Portfolio Size
Building a Resilient Fixed Income Portfolio for all Stages of the Economic Cycle
 Building a Resilient Fixed Income Portfolio for all Stages of the Economic Cycle Matthew J. Eagan, CFA, Vice President and Portfolio Manager, Fixed Income, Loomis, Sayles & Company Kevin P. Kearns, Vice
The case for lower rated corporate bonds
 The case for lower rated corporate bonds Marcus Pakenham Fixed income product specialist December 3 Introduction Where should fixed income investors be positioned over the medium term? We expect that government
Quarterly Commentary
 Quarterly Commentary Emerging Markets Fixed Income Fund DBLEX/DLENX June 30, 2017 333 S. Grand Ave., 18th Floor Los Angeles, CA 90071 (213) 633-8200 Quarterly Commentary Overview A few main themes dominated
City of San Juan Capistrano
 City of San Juan Capistrano Fourth Quarter 2013 Portfolio and Market Review Sarah Meacham, Director PFM Asset Management LLC Federal Reserve Taper Talk Drives Interest Rates The Federal Open Market Committee
Fixed income market update
 April 1, 216 Fixed income market update Taplin, Canida & Habacht, LLC BMO Global Asset Management 11 Brickell Bay Drive Suite 21 Miami, Florida 33131 p 35-379-21 f 35-379-4452 tchinc.com Fixed income market
Quarterly Commentary. Global Bond Fund DBLGX/DLGBX
 Quarterly Commentary Global Bond Fund DBLGX/DLGBX March 31, 2017 333 S. Grand Ave., 18th Floor Los Angeles, CA 90071 (213) 633-8200 Citi Economic Surprise December 31, 2009 - March 31, 2017 Speculative
FIXED INCOME STRATEGIES FOR LATE 2017 NAVIGATING UNCHARTERED TERRITORY, RISING RATES, AND YOUR FIXED INCOME PORTFOLIO
 FIXED INCOME STRATEGIES FOR LATE 2017 NAVIGATING UNCHARTERED TERRITORY, RISING RATES, AND YOUR FIXED INCOME PORTFOLIO 1 The information contained herein reflects the views of Galliard Capital Management,
Timing and Strategy. Presented by: Jeffrey Gundlach CEO, DoubleLine Capital
 Timing and Strategy Presented by: Jeffrey Gundlach CEO, DoubleLine Capital 1 Negative Yielding Bonds As of February 9, 2016 2 Negative Yielding Bonds https://www.thestar.com/business/personal_finance/2016/02/03/why-theyre-talking-about-negative-interest-rates-mayers.html,
March Bond Fund Quarterly Review
 March 2018 Bond Fund Quarterly Review William Blair Bond Fund Important Disclosures Please refer to the last page of this Quarterly Review for definitions of the Indices used in this report. Risks: The
Moving On Up Investing in Today s Rate Environment
 Moving On Up Investing in Today s Rate Environment Presented by PFM Asset Management LLC Steve Faber, Managing Director Gray Lepley, Senior Analyst, Portfolio Strategies September 18, 2018 PFM 1 Today
Keynote Address: Jeff Gundlach Presenter Chief Executive Officer & Chief Investment Officer DoubleLine Capital
 Keynote Address: Jeff Gundlach Presenter Chief Executive Officer & Chief Investment Officer DoubleLine Capital This Time It s Different 2 3 Past Fed Tightening Cycles Source: ValueWalk, Taking a Lesson
Live Webcast Hosted By: Smart + Smart. lpha. Jeffrey Sherman, CFA Portfolio Manager. eta. Shiller Enhanced CAPE (DSEEX/DSENX) APE.
 APE.") Live Webcast Hosted By: Jeffrey Sherman, CFA Portfolio Manager Shiller Enhanced CAPE (DSEEX/DSENX) February 9, 2016 Smart + Smart = lpha eta APE Fund Offerings Shiller Enhanced CAPE Retail and Institutional
Live Webcast Hosted By: Jeffrey Sherman, CFA Portfolio Manager Shiller Enhanced CAPE (DSEEX/DSENX) February 9, 2016 Smart + Smart = lpha eta APE Fund Offerings Shiller Enhanced CAPE Retail and Institutional
Trends & Long-Term Outlook for Fixed and Stable Value Funds
 Trends & Long-Term Outlook for Fixed and Stable Value Funds CPPC Conference August 2013 Cathe Tocher CFA, Senior Vice President AGENDA Introduction: Short-term noise pay attention Preparing for the future:
Investment Perspectives. From The Global Investment Committee
 Investment Perspectives From The Global Investment Committee Global Risk Aversion Reached Extreme Levels Morgan Stanley Standardized Global Risk Demand Index As of October 15, 2014 Complacent Extreme Fear
Learning objectives. Investors should leave the presentation with an ability to discuss
 Learning objectives Investors should leave the presentation with an ability to discuss the fundamentals and valuations of emerging markets economies in 2018 the key risks of emerging market debt in 2018
Market & Product Opportunity S E P T E M B E R 3 0,
 BOND DEBENTURE FUND Market & Product Opportunity S E P T E M B E R 3 0, 2 0 1 7 Copyright 2017 by Lord, Abbett & Co. LLC. All rights reserved. Lord Abbett mutual fund shares are distributed by Lord Abbett
Investment Committee Quarterly Activity Report 4. FIXED INCOME
 Investment Committee Quarterly Activity Report 4. FIXED INCOME FIXED INCOME MARKET RISK DASHBOARD As of 6/30/2015 Monetary Policy 3.88% U.S. Unemployment Rate 6.10% 0.25% 0% 9.75% The Fed Funds target
Ashmore Group plc. Results for year ending 30 June September
 Ashmore Group plc Results for year ending 30 June 2016 6 September 2016 www.ashmoregroup.com Overview Weaker and more volatile markets in H1, strong recovery in H2 Consistent investment processes delivering:
Pioneer Compass A Quarterly Update on the Direction of the Markets
 Pioneer Compass A Quarterly Update on the Direction of the Markets Q1 2016 / As of April 2016 The views expressed in this presentation are those of Pioneer, and are subject to change at any time. These
FSM Managed Portfolios Monthly Investment Outlook July 2016
 FSM Managed Portfolios Monthly Investment Outlook July 2016 1 Table of Contents Market Performance Review P.3 Portfolio s Performance Review P.4 Portfolio Holdings Performance P.6 Brexit Commentary P.10
Navigating the storm Investing in ideas to aid diversification
 Navigating the storm Investing in ideas to aid diversification April 2017 Richard Batty Fund Manager, Multi Asset This presentation is for Professional Clients only and is not for consumer use. Please
Investment & Economic Outlook for Public Entity Pools
 Investment & Economic Outlook for Public Entity Pools 1 Presentation Outline I. Overall Economic/Investment Environment II. Portfolio Return Expectations III. Investment Income: Use & Applications IV.
Liquidity is Relevant Again
 Liquidity is Relevant Again April 2019 Not FDIC Insured May Lose Value No Bank Guarantee Not NCUA or NCUSIF insured. May lose value. No credit union guarantee. For institutional use only. l 2019 FMR LLC.
Why invest in floating rate bonds?
 For professional clients / qualified investors only Why invest in floating rate bonds? The current economic environment is shifting. In our view, we are moving towards a scenario in which investors should
ASSET ALLOCATION REPORT
 2018 ASSET ALLOCATION REPORT INTRODUCTION We invite you to review Omnia Family Wealth s 2018 report on expected asset class returns for the next 10 years. While we believe these forecasts reflect a reasonable
Quarterly Investment Briefing February 5, 2014
 Quarterly Investment Briefing February 5, 2014 Clayton T. Bill, CFA Stephen J. Nilles, CFP Agenda Topic Page 2013 Review 3 Corporate Earnings and Profit Margins 5 Equity Market Valuations 7 Bonds and Expected
DoubleLine Core Fixed Income Fund Fourth Quarter 2017
 Income Fund Fourth Quarter 2017 333 S. Grand Ave., 18th Floor Los Angeles, CA 90071 (213) 633-8200 The Income Fund (DBLFX/DLFNX) is DoubleLine s flagship fixed income asset allocation fund. The fund seeks
Performance Review May 17, 2018
 Performance Review May 17, 2018 Cost-Efficiencies Initiative Update Goal: Obtain $100 million of incremental cost-efficiencies for the NCRS investment program, consistent with fiduciary requirements and
ASSET ALLOCATION VIEWPOINTS
 T. Rowe Price ASSET ALLOCATION VIEWPOINTS Q2 2017 Stocks vs. Bonds We increased our underweight to stocks relative to bonds as equity valuations appear extended against a backdrop of continued modest economic
Reasons why: Emerging market (EM) corporate bonds
 corporate bonds") Reasons why: Emerging market (EM) corporate bonds February 2017 Low yield in developed market bonds can pose a significant challenge for fixed-income investors. This has forced many investors to move down
Reasons why: Emerging market (EM) corporate bonds February 2017 Low yield in developed market bonds can pose a significant challenge for fixed-income investors. This has forced many investors to move down
Core Plus Fixed Income Portfolio
 MORGAN STANLEY INSTITUTIONAL FUND TRUST Core Plus Fixed Income Portfolio FIXED INCOME GLOBAL FIXED INCOME TEAM COMMENTARY SEPTEMBER 30, 2017 Market Review and Outlook The biggest macroeconomic event for
2015 MASBO Annual Conference
 10-Year Interest Rates from 1790 2015 MASBO Annual Conference Economic Background, 2015 and Beyond: Where Are We Heading B. Craig Elder Director Senior Fixed Income Analyst Robert W. Baird & Co., Inc.
CLOSER LOOK DOMESTIC FIXED INCOME
 CLOSER LOOK DOMESTIC FIXED INCOME DATA AS OF AUGUST 2016 Presented to: Presented by: Presented on: Pennsylvania Association of Public Employee Retirement Systems Ryan Labs Asset Management (Daniel J. Lucey,
Monthly Commentary Emerging Markets Debt
 HSBC Global Asset Management November 2010 Monthly Commentary Emerging Markets Debt Emerging Markets Debt Core Supplemental information and characteristics for periods ending November 30, 2010 Month Year-to-date
Income Solutions Beyond Investment Grade Bonds
 October 2017 Income Solutions Beyond Investment Grade Bonds Multiple Fixed Income Approaches Direction of interest rates Reduce Duration Limit Duration to Near Zero with: Floating rate notes (FRNs) for
Summit Strategies Group 8182 Maryland Avenue, 6th Floor St. Louis, Missouri Monthly Economic & Capital Market Update
 Summit Strategies Group 8182 Maryland Avenue, 6th Floor St. Louis, Missouri 63105 314.727.7211 Monthly Economic & Capital Market Update November 2015 Yield to Maturity Monthly Change Nov-63 Nov-67 Nov-71
EXPLORING THE FUTURE OF FIXED INCOME IN DC PLANS
 EXPLORING THE FUTURE OF FIXED INCOME IN DC PLANS Lorie Latham, CFA Senior Defined Contribution Strategist Wyatt Lee, CFA Asset Allocation Portfolio Manager Terry Moore, CFA Fixed Income Portfolio Specialist
Liquidity Management: Beyond Quantitative Easing
 Liquidity Management: Beyond Quantitative Easing June 2014 Agenda 1. Assessing Risk: Current Market Conditions a. Global Macroeconomics b. Monetary Policy c. Quantitative Easing (QE) d. Asset Bubbles e.
2016 Fixed Income Asset Class Review September 22-23, Jason Weiner, Director of Fixed Income Germán Gaymer, Fixed Income Investment Analyst
 2016 Fixed Income Asset Class Review September 22-23, 2016 Jason Weiner, Director of Fixed Income Germán Gaymer, Fixed Income Investment Analyst Agenda I. Fixed Income Market Environment & Performance
Opportunities in the US Loan Market Today. Chris D Auria, LCM Dan McMullen, GSO Steven Oh, Pinebridge John Popp, Credit Suisse Asset Management
 Opportunities in the US Loan Market Today Moderator: Panelists: Bram Smith, LSTA Scott Baskind, Invesco Chris D Auria, LCM Dan McMullen, GSO Steven Oh, Pinebridge John Popp, Credit Suisse Asset Management
Ashmore Group plc. Results for year ending 30 June September
 Ashmore Group plc Results for year ending 30 June 2018 7 September 2018 www.ashmoregroup.com Overview Strong operating and financial performance Active investment continues to produce outperformance (94%
Angel Oak Capital Advisors, LLC
 Angel Oak Capital Advisors, LLC Angel Oak Multi-Strategy Income Fund Quarterly Review March 31, 2018 Quarter in Review Risk assets were weaker in the first quarter driven primarily by rising rates, expectations
Ashmore Group plc. Results for six months ending 31 December February
 Ashmore Group plc Results for six months ending 31 December 2017 8 February 2018 www.ashmoregroup.com Overview Accelerating growth and outperformance across Emerging Markets GDP growth driven by exports,
Economic and Market Outlook
 Economic and Market Outlook Fourth Quarter 2018 Investment Products: Not FDIC Insured No Bank Guarantee May Lose Value Past performance is no guarantee of future results. Financial term and index definitions
Investment Perspectives. From the Global Investment Committee
 Investment Perspectives From the Global Investment Committee Introduction Domestic equities continued to race ahead during the fourth quarter of 2014 amid spikes in volatility, dramatic declines in oil
Jacksonville Police & Fire Pension Fund Presentation
 NOT FOR PUBLIC DISTRIBUTION. Jacksonville Police & Fire Pension Fund Presentation Presentation to: William M. Bellamy, CFA Director of Income Strategies Matthew Soule, CFA Client Portfolio Manager January
Introducing BlackRock's Target Allocation ETF Models
 Introducing BlackRock's Target Allocation ETF Models Eve Cout Director, Managed Accounts Business Thomas Wood, CFA Lead Strategist, US Model Portfolios Tuesday January 23 rd, 2018 BENEFIT # 1 Scale and
Emerging Markets Debt Fund
 FIRST QUARTER 2018 Emerging Markets Debt Fund Quarterly Review Quarterly Commentary Market Review Emerging markets struggled in risk-off climate. After a strong January, the backdrop for emerging markets
The First Phase of the U.S. Recovery and Beyond
 The First Phase of the U.S. Recovery and Beyond James Bullard President and CEO Federal Reserve Bank of St. Louis Global Interdependence Center Shanghai, China January 11, 2010 Any opinions expressed here
Investment Review and Economic Outlook for Public Entity Pools Webinar
 Investment Review and Economic Outlook for Public Entity Pools Webinar November 3 rd, 2015 Dan Smereck Managing Director Table of Contents I. Capital Markets Review II. Public Entity Pool Investment Program
Eric C. Elbell, CFA, CAIA Area Senior Vice President. Kyongdo Min, CPA, CFA Area Vice President. April 11, 2018
 Eric C. Elbell, CFA, CAIA Area Senior Vice President Kyongdo Min, CPA, CFA Area Vice President April 11, 2018 Agenda We will address three key topics: Headline events that impacted markets during the quarter
The Market Navigator N a v i g a t i n g t h r o u g h t h e S e a s o f C h a n g e
 April 17, 2018 The Market Navigator N a v i g a t i n g t h r o u g h t h e S e a s o f C h a n g e Systematic tracking of market and macro momentum through highly condensed, objective indicators in the
Seeking Alpha: Opportunities vs. Risk in the US Loan Market Today
 Seeking Alpha: Opportunities vs. Risk in the US Loan Market Today Moderator: Bram Smith. LSTA Speakers: Americo Cascella, Ares Stephen Casey, Neuberger Kevin Petrovcik, Invesco Mark Senkpiel, Babson THE
Global Investment Outlook Russ Koesterich, CFA Managing Director, Global Allocation
 Global Investment Outlook Russ Koesterich, CFA Managing Director, Global Allocation 6 Asset performance YTD Source: Thomson Reuters Datastream, BlackRock Investment Institute. Apr, 6 Note: Total return
Client Conversations GLOBAL INVESTMENT COMMITTEE. Why does the Fed intend to raise interest rates, and what will it mean for my investments?
 Client Conversations Why does the Fed intend to raise interest rates, and what will it mean for my investments? Fed Will Likely Begin Raising Rates Soon As of November 10, 2015 We believe that the Fed
Emerging Market Debt: A Flight to Quality Trade?
 Emerging Market Debt: A Flight to Quality Trade? Live Webcast Hosted By: Luz Padilla Portfolio Manager Emerging Markets Fixed Income Fund (DBLEX/DLENX) October 9th, 2012 Fund Offerings Emerging Markets
Angel Oak Capital Advisors, LLC
 Angel Oak Capital Advisors, LLC Angel Oak Flexible Income Fund Quarterly Review March 31, 2018 Quarter in Review Risk assets were weaker in the first quarter driven primarily by rising rates, expectations
Opportunities in Turbulent Markets:
 Opportunities in Turbulent Markets: Risk and Reward Budgeting in Below-Investment Grade Ty Anderson Global Head of High Yield Strategies When the tide goes out, we get to see who s not wearing a bathing
Investment Opportunities in Global Fixed Income Markets
 Investment Opportunities in Global Fixed Income Markets GSAM Insurance Fixed Income May 217 GSAM Insurance Asset Management Key Themes for 217 Economic Backdrop End of the Distortion Monetary to Fiscal
HSBC Fund Update. HSBC GIF Global Emerging Markets Bond. April Market overview. Portfolio strategy
 HSBC Fund Update April 2016 HSBC GIF Global Emerging Markets Bond Market overview The rally in Emerging Market (EM) assets continued in March given the improvement in global risk sentiment on the back
Risultati Olimpici per gli investimenti obbligazionari. Nicholas Gartside Gestore Investimenti Obbligazionari
 Risultati Olimpici per gli investimenti obbligazionari Nicholas Gartside Gestore Investimenti Obbligazionari Stagflation What does it look like? UK growth and inflation % % 8 25 6 4 2-2 -4 Trend growth
Fixed Income Investing in a Low Yield World: High Yield Bonds Still Part of the Solution. Fall 2012
 Fixed Income Investing in a Low Yield World: High Yield Bonds Still Part of the Solution Fall 2012 U.S. 10-Year Treasury Yields October 5, 2012 16 14 12 10 8 6 4 2 1.74% 0 Jan-82 Feb-86 Mar-90 May-94 Jun-98
2018 Strategic Commodity Webcast Recap
 Growth Rate (January 31, 1991 - January 08, 2018) GDP Year -over-year % Change December 31, 1999 - December 31, 2017 Source: Bloomberg, DoubleLine GDP = gross domestic product, YoY = year-over-year 6 5
Fixed income market update
 March 2, 215 Fixed income market update Taplin, Canida & Habacht, LLC BMO Global Asset Management 11 Brickell Bay Drive Suite 21 Miami, Florida 33131 p 35-379-21 f 35-379-4452 tchinc.com Fixed income market
The Fertile Soil of Corporate Bond Market
 Oct 09 Sep 10 Aug 11 Jul 12 Jun 13 May 14 Oct 09 Apr 10 Oct 10 Apr 11 Oct 11 Apr 12 Oct 12 Apr 13 Oct 13 Apr 14 Basis Points Basis Points PERSPECTIVES The Fertile Soil of Corporate Bond Market May 2014
Economic and Capital Market Update April 2018
 Economic and Capital Market Update April 2018 Apr-70 Apr-74 Apr-78 Apr-82 Apr-86 Apr-90 Apr-94 Apr-98 Apr-02 Apr-06 Apr-10 Apr-14 Apr-18 April 30, 2018 Economic Perspective The strong pace of the global
Moving On Up Today s Economic Environment
 Moving On Up Today s Economic Environment Presented by PFM Asset Management LLC Gray Lepley, Senior Analyst, Portfolio Strategies November 8, 2018 PFM 1 U.S. ECONOMY Today s Agenda MONETARY POLICY GEOPOLITICAL
Fixed income market update. March BMO Fixed Income Brickell Bay Dr. Suite 2100 Miami, Florida bmogam.
 Fixed income market update March 218 BMO Fixed Income 11 Brickell Bay Dr. Suite 21 Miami, Florida 33131 bmogam.com/usfixedincome Fixed income market update For the month ended February 28, 218, the Bloomberg
Corporate bonds resurgent in March
 Corporate bonds resurgent in March Markit iboxx monthly report March 216 After a volatile start to the year, fixed income returns bounced back in spectacular fashion with corporate and emerging market
Ashmore Group plc. Results for six months ending 31 December February
 Ashmore Group plc Results for six months ending 31 December 2018 14 February 2019 www.ashmoregroup.com Overview Business model continues to deliver Strong investment performance 97% AuM outperforming over
Aberdeen Asset Management
 Aberdeen Asset Management Fixed income overview March 2016 David Lloyd-Nolan, Senior Fixed Income Product Specialist Aberdeen Asset Management For professional investors only Not for public distribution
Multi-Manager Emerging Markets Debt Opportunity Fund (NMEDX) 2Q 2018 Performance Review
 2Q 2018 Performance Review") NORTHERN FUNDS Multi-Manager Emerging Markets Debt Opportunity Fund (NMEDX) 2Q 2018 Performance Review June 30, 2018 Must be preceded or accompanied by a current prospectus Fund Facts Fund Objective: Total
NORTHERN FUNDS Multi-Manager Emerging Markets Debt Opportunity Fund (NMEDX) 2Q 2018 Performance Review June 30, 2018 Must be preceded or accompanied by a current prospectus Fund Facts Fund Objective: Total
Pioneer Multi-Asset Ultrashort Income Fund
 Pioneer Multi-Asset Ultrashort Income Fund Performance Analysis & Commentary December 2017 COMMENTARY Fund Ticker Symbol: MAFRX (Class A); MYFRX (Class Y) amundipioneer.com Fourth Quarter Review The Fund
Dated 28 July Issuer: Macquarie Investment Management Limited ABN AFS Licence Number
 MACQUARIE FUNDS GROUP WHOLESALE POOLED FUNDS - CASH AND FIXED income Information memorandum Dated 28 July 2009 Issuer: Macquarie Investment Management Limited ABN 66 002 867 003 AFS Licence Number 237492
Fourth Quarter Market Outlook. Jason Bulinski, CFA Donald A. Powell, CFA Joseph Styrna, CFA
 Fourth Quarter 2018 Market Outlook Jason Bulinski, CFA Donald A. Powell, CFA Joseph Styrna, CFA Economic Outlook Growth: Strong 2018, But Expecting Slowdown in 2019 Growth & Jobs 2018 2017 2016 2015 2014
KDP ASSET MANAGEMENT, INC.
 ASSET MANAGEMENT, INC. High Yield Bond and Senior Secured Bank Loan Outlook June 2017 Asset Management, Inc. 24 Elm Street Montpelier, Vermont 802.223.0440 HighYield@kdpam.com The Case for High Yield Bonds
Semiannual Report December 31, 2017
 PIMCO ETF Trust Semiannual Report December 31, 2017 Index Exchange-Traded Funds PIMCO 1-3 Year U.S. Treasury Index Exchange-Traded Fund PIMCO 25+ Year Zero Coupon U.S. Treasury Index Exchange-Traded Fund
Asset Strategy Consultants. MARKET ENVIRONMENT First Quarter 2017
 MARKET ENVIRONMENT First Quarter 2017 Market Environment: Economy Economies in the U.S. and Europe continued to gain traction. Expectations for lower taxes, reduced regulation, and other pro-growth reforms
The US Institutional Corporate Loan Market and an Overview of Ways to Invest
 The US Institutional Corporate Loan Market and an Overview of Ways to Invest Moderator: Elliot Ganz, LSTA Panelists: Gretchen Bergstresser, CVC David Mechlin, CSAM Dan Norman, Voya Tel Aviv, November 14,
Asset allocation achieving the right mix
 Asset allocation achieving the right mix Learning outcomes The objective of the presentation is to help develop your understanding of: The benefits and drawbacks of a range of asset allocation styles The
Town of Palm Beach, Florida
 Town of Palm Beach, Florida Investment Performance Review Quarter Ended December 31, 2013 Investment Advisors Steven Alexander, CTP, CGFO, Managing Director D. Scott Stitcher, CFA, Senior Managing Consultant
Deficits Don t Matter
 Deficits Don t Matter Debt to Gross Domestic Product (GDP) What s done can t be undone William Shakespeare, Macbeth, Act 5, Scene 1 250 200 % 150 100 50 0 Source: CIA Workd Factbook. Includes public sector
First Trust Intermediate Duration Preferred & Income Fund Update
 1st Quarter 2015 Fund Performance Review & Current Positioning The First Trust Intermediate Duration Preferred & Income Fund (FPF) produced a total return for the first quarter of 2015 of 3.84% based on
Quarterly High Yield Market Summary
 Quarterly High Yield Market Summary As of December 31, 2013 Aside from a brief respite in October, risk free rates trended higher in Q4 2013 (up 42 basis points in the 10 Year and 36 bps in the 5 Year),
Global Investment Committee Themes
 Global Investment Committee Themes The Global Investment Committee (GIC), which meets monthly to review the economic and political environment and asset allocation models for Morgan Stanley Wealth Management
Mortgage and Asset Backed Securities Investment Strategy
 Mortgage and Asset Backed Securities Investment Strategy Traditional fixed income has enjoyed an environment of falling interest rates over the past 30 years. Average of 10 & 30 Year Treasury Yields (1981
Endowment Investment Review as of March 31, 2017
 UNIVERSITY OF CALIFORNIA Office of the Chief Investment Officer Endowment Investment Review as of March 31, 2017 Growing Portfolios Building Partnerships UC Investments Table of Contents GEP Executive