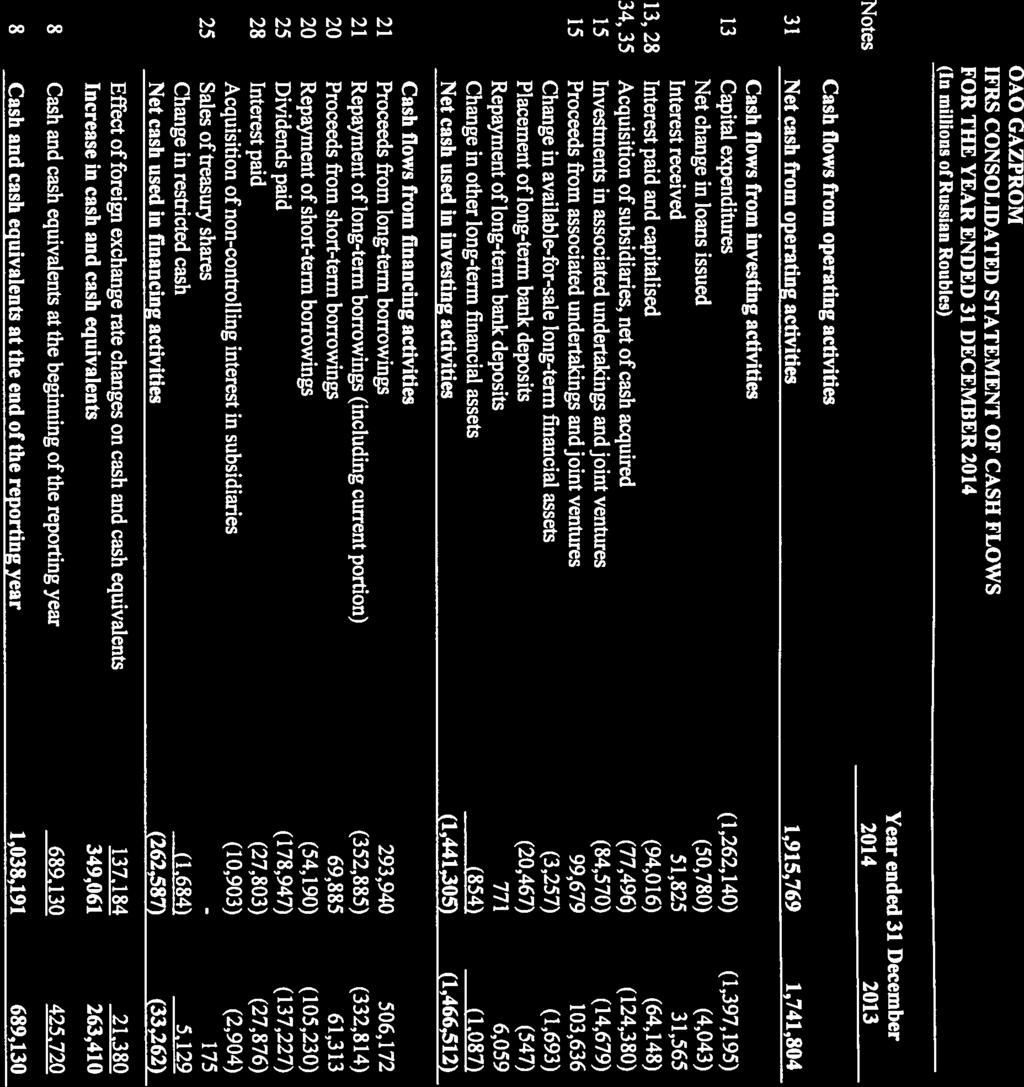
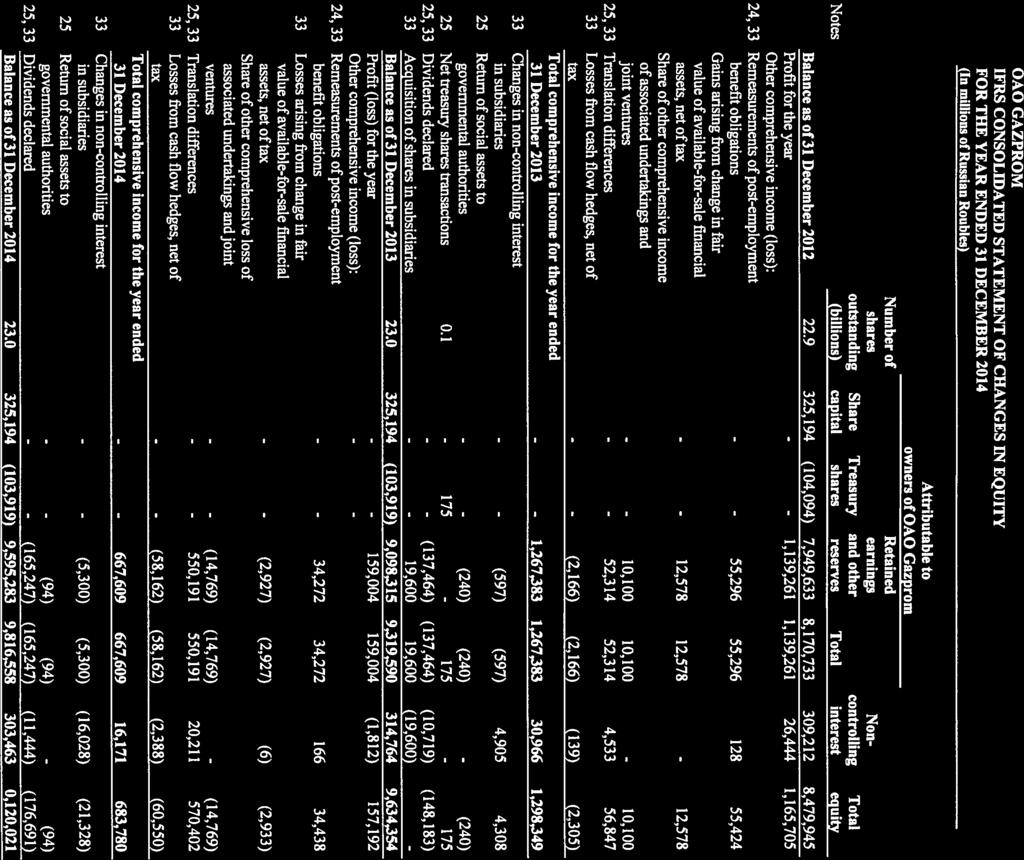
OAO GAZPROM IFRS CONSOLIDATED FINANCIAL STATEMENTS 31 DECEMBER 2014
|
|
|
- Clement Henderson
- 6 years ago
- Views:
Transcription
1 IFRS CONSOLIDATED FINANCIAL STATEMENTS 31 DECEMBER 2014
2


3

4


5

6

7
8 1 NATURE OF OPERATIONS OAO Gazprom and its subsidiaries (the Group ) operate one of the largest gas pipeline systems in the world and are responsible for the major part of gas production and high pressure gas transportation in the Russian Federation. The Group is also a major supplier of gas to European countries. The Group is engaged in oil production, refining activities, electric and heat energy generation. The Government of the Russian Federation is the ultimate controlling party of OAO Gazprom and has a controlling interest (including both direct and indirect ownership) of over 50% in OAO Gazprom. The Group is involved in the following principal activities: Exploration and production of gas; Transportation of gas; Sales of gas within Russian Federation and abroad; Gas storage; Production of crude oil and gas condensate; Processing of oil, gas condensate and other hydrocarbons, and sales of refined products; and Electric and heat energy generation and sales. Other activities primarily include production of other goods, works and services. The weighted average number of employees during 2014 and 2013 was 450 thousand and 429 thousand, respectively. 2 ECONOMIC ENVIRONMENT IN THE RUSSIAN FEDERATION The Russian Federation displays certain characteristics of an emerging market. Tax, currency and customs legislation is subject to varying interpretations and contributes to the challenges faced by companies operating in the Russian Federation (see Note 38). The political and economic instability, the current impact and ongoing situation with sanctions, uncertainty and volatility of the financial and commodities markets and other risks have had and may continue to have effects on the Russian economy. During 2014 the official Russian Rouble to US dollar and Euro foreign exchange rates depreciated and fluctuated between and Russian Roubles and and Russian Roubles per US dollar and Euro, respectively. In addition during 2014 the key interest rate determined by the Central Bank of the Russian Federation increased to 17% and actual inflation increased to 11.4%. The financial markets continue to be volatile and are characterised by frequent significant price movements and increased trading spreads. Subsequent to 31 December 2014 Russia's credit rating was downgraded by Fitch Ratings in January 2015 from BBB to BBB-, whilst Standard & Poor s cut it from BBB- to BB+. At the same time as of date of issuance of these consolidated financial statements the key interest rate determined by the Central Bank of the Russian Federation decreased from 17% to 14% and the official Russian Rouble to US dollar and Euro foreign exchange rates were and 55.87, respectively. The future economic development of the Russian Federation is dependent upon external factors and internal measures undertaken by the government to sustain growth, and to change the tax, legal and regulatory environment. Management believes it is taking all necessary measures to support the sustainability and development of the Group s business in the current business and economic environment. The future economic and regulatory situation and its impact on the Group s operations may differ from management s current expectations. 3 BASIS OF PRESENTATION These consolidated financial statements are prepared in accordance with, and comply with, International Financial Reporting Standards, including International Accounting Standards and Interpretations issued by the International Accounting Standards Board ( IFRS ) and effective in the reporting period. The consolidated financial statements of the Group are prepared under the historical cost convention except for certain financial instruments as described in Note 5. The principal accounting policies applied in the preparation of these consolidated financial statements are set out below. These policies have been consistently applied to all the periods presented, unless otherwise stated. 6
9 4 SCOPE OF CONSOLIDATION As described in Note 5, these consolidated financial statements include consolidated subsidiaries, associated undertakings and joint arrangements of the Group. Significant changes in the Group s structure in 2013 and 2014 are described below. In December 2014 the Group became the owner of 100% of the interest in South Stream Transport B.V., the company responsible for the offshore part of the South Stream project, by acquiring shares of EDF International S.A.S., Wintershall Holding GmbH and ENI International B.V. for Euro 883 million paid in cash. As a result of the acquisition, the Group obtained control over South Stream Transport B.V. (see Note 34). In September 2013 the Group acquired 89.98% interest in the ordinary shares of OAO Moscow Integrated Power Company (OAO MIPC) and heat assets from the Moscow Government for cash consideration of RR 99,866 including VAT in the amount of RR 1,246 related to acquired heat assets. As a result of the acquisition, the Group obtained control over OAO MIPC. Considering treasury shares of OAO MIPC, the Group s effective interest is 98.77% (see Note 35). 5 SUMMARY OF SIGNIFICANT ACCOUNTING POLICIES The principal accounting policies followed by the Group are set out below. 5.1 Group accounting Subsidiary undertakings Subsidiaries are those investees, including structured entities, that the Group controls because the Group (i) has power to direct relevant activities of the investees that significantly affect their returns, (ii) has exposure, or rights, to variable returns from its involvement with the investees, and (iii) has the ability to use its power over the investees to affect the amount of investor s returns. The existence and effect of substantive rights, including substantive potential voting rights, are considered when assessing whether the Group has power over another entity. For a right to be substantive, the holder must have practical ability to exercise that right when decisions about the direction of the relevant activities of the investee need to be made. The Group may have power over an investee even when it holds less than majority of voting power in an investee. In such a case, the Group assesses the size of its voting rights relative to the size and dispersion of holdings of the other vote holders to determine if it has de-facto power over the investee. Protective rights of other investors, such as those that relate to fundamental changes of investee s activities or apply only in exceptional circumstances, do not prevent the Group from controlling an investee. Subsidiaries are consolidated from the date on which control is transferred to the Group (acquisition date) and are deconsolidated from the date on which control ceases. All inter-company transactions, balances and unrealized gains and losses on transactions between group companies have been eliminated. Separate disclosure is made for non-controlling interests. The acquisition method of accounting is used to account for the acquisition of subsidiaries, including those entities and businesses that are under common control. The cost of an acquisition is measured at the fair value of the assets given up, equity instruments issued and liabilities incurred or assumed at the date of exchange. Acquisition-related costs are expensed as incurred. The date of exchange is the acquisition date where a business combination is achieved in a single transaction, and is the date of each share purchase where a business combination is achieved in stages by successive share purchases. An acquirer should recognise at the acquisition date a liability for any contingent purchase consideration. Changes in the value of that liability which relate to measurement period adjustments are adjusted against goodwill. Changes which arise due to events occurring after the acquisition date will be recognised in accordance with other applicable IFRSs, as appropriate, rather than by adjusting goodwill. Goodwill and non-controlling interest The excess of the consideration transferred the amount of any non-controlling interest in the acquiree and the acquisition-date fair value of any previous equity interest in the acquiree over the fair value of the group s share of the identifiable net assets acquired is recorded as goodwill. If this is less than the fair value of the net assets of the subsidiary acquired in the case of a bargain purchase, the difference is recognized directly in the consolidated statement of comprehensive income. Goodwill is tested annually for impairment as well as when there are indications of impairment. For the purpose of impairment testing goodwill is allocated to the cash-generating units or groups of cash-generating units, as appropriate. 7
10 5 SUMMARY OF SIGNIFICANT ACCOUNTING POLICIES (continued) Non-controlling interest represents that portion of the profit or loss and net assets of a subsidiary attributable to equity interests that are not owned, directly or indirectly through subsidiaries, by the parent. The Group treats transactions with non-controlling interests as transactions with equity owners of the group. In accordance with IFRS 3 Business Combinations, the acquirer recognises the acquiree s identifiable assets, liabilities and contingent liabilities that satisfy the recognition criteria at their fair values at the acquisition date, and any noncontrolling interest in the acquiree is stated at the non-controlling interest proportion of the net fair value of those items. Joint arrangements Joint arrangements are classified as either joint operations or joint ventures depending on the contractual rights and obligations of each investor. A joint operation is a joint arrangement whereby the parties that have joint control of the arrangement have rights to the assets, and obligation for the liabilities, relating to the arrangement. Where the Group acts as a joint operator, the Group recognises in relation to its interest in a joint operation: its assets, including its share of any assets held jointly; its liabilities, including its share of any liabilities incurred jointly; its revenue from the sale of its share of the output arising from the joint operation; its share of the revenue from the sale of the output by the joint operation; and its expenses, including its share of any expenses incurred jointly. A joint venture is a joint arrangement whereby the parties that have joint control of the arrangement have rights to the net assets of the arrangement. With regards to joint arrangements, where the Group acts as a joint venture, the Group recognises its interest in a joint venture as an investment and accounts for that investment using the equity method. Associated undertakings Associated undertakings are undertakings over which the Group has significant influence and that are neither a subsidiary nor an interest in a joint venture. Significant influence occurs when the Group has the power to participate in the financial and operating policy decisions of an entity but has no control or joint control over those policies. Associated undertakings are accounted for using the equity method. The group s share of its associates post-acquisition profits or losses is recognised in the consolidated statement of comprehensive income, and its share of post-acquisition movements in other comprehensive income is recognised in other comprehensive income. Unrealised gains on transactions between the Group and its associated undertakings are eliminated to the extent of the Group's interest in the associated undertakings; unrealised losses are also eliminated unless the transaction provides evidence of an impairment of the asset transferred. The Group s interest in each associated undertaking is carried in the consolidated balance sheet at an amount that reflects cost, including the goodwill at acquisition, the Group s share of profit and losses and its share of postacquisition movements in reserves recognized in equity. Provisions are recorded for any impairment in value. Recognition of losses under equity accounting is discontinued when the carrying amount of the investment in an associated undertaking reaches zero, unless the Group has incurred obligations or guaranteed obligations in respect of the associated undertaking. 5.2 Financial instruments Financial instruments carried on the consolidated balance sheet include cash and cash equivalent balances, financial assets, accounts receivable, promissory notes, accounts payable and borrowings. The particular recognition and measurement methods adopted are disclosed in the individual policy statements associated with each item. Accounting for financial guarantee contracts A financial guarantee contract is a contract that requires the issuer to make specified payments to reimburse the holder for a loss it incurs because a specified debtor fails to make payment when due in accordance with the original or modified terms of a debt instrument. Financial guarantee contracts are initially recognised at fair value and are subsequently measured at the higher of (i) the remaining unamortised balance of the amount at initial recognition and (ii) the best estimate of expenditure required to settle the obligation at the balance sheet date. 8
11 5 SUMMARY OF SIGNIFICANT ACCOUNTING POLICIES (continued) Fair value disclosure The fair value of accounts receivable for disclosure purposes is measured by discounting the value of expected cash flows at the market rate of interest for similar borrower at the reporting date. The fair value of financial liabilities and other financial instruments (except if publicly quoted) for disclosure purposes is measured by discounting the future contractual cash flows at the current market interest rate available to the Group for similar financial instruments. The fair value of publicly quoted financial instruments for disclosure purposes are measured based on current market value at the last trading price on the reporting date. 5.3 Derivative financial instruments As part of trading activities the Group is also a party to derivative financial instruments including forward and options contracts for foreign exchange rate, commodities and securities. The Group s policy is to measure these instruments at fair value, with resultant gains or losses being reported within the profit and loss of the consolidated statement of comprehensive income. The fair value of derivative financial instruments is determined using actual market information data and valuation techniques based on prevailing market interest rate for similar instruments as appropriate. The Group routinely enters into sale and purchase transactions for the purchase and sales of gas, oil, oil products and other goods. The majority of these transactions are entered to meet supply requirements to fulfil contract obligations and for own consumption and are not within the scope of IAS 39 Financial instruments: recognition and measurement ( IAS 39 ). Sale and purchase transactions of gas, oil, oil products and other goods, which are not physically settled in accordance with the Group s expected operating activity or can be net settled under the terms of the respective contracts, are accounted for as derivative financial instruments in accordance with IAS 39. These instruments are considered as held for trading and related gains or losses are recorded within the profit and loss section of the consolidated statement of comprehensive income. Derivative contracts embedded into sales and purchase contracts are separated from the host contracts and accounted for separately. Derivatives are carried at fair value with gains and losses arising from changes in the fair values of derivatives included within the profit and loss section of the consolidated statement of comprehensive income in the period in which they arise. 5.4 Hedge accounting The Group applies hedge accounting policy for those derivatives that are designated as a hedging instrument. The Group has designated only cash flow hedges hedges against the exposure to the variability of cash flow currency exchange rates on highly probable forecast transactions. The effective portion of changes in the fair value of derivatives that are designated and qualify as cash flow hedges is recognised in other comprehensive income. Any ineffective portion is ultimately recognised in profit and loss. Changes in the fair value of certain derivative instruments that do not qualify for hedge accounting are recognised immediately in profit and loss. When a hedging instrument expires or is sold, or when a hedge no longer meets the criteria for hedge accounting, any cumulative gain or loss existing in equity at that time remains in equity until the forecast transaction occurs. When a forecast transaction is no longer expected to occur, the cumulative gain or loss on any associated hedging instrument that was reported in equity is immediately transferred to profit and loss. The fair value of the hedge item is determined at the end of each reporting period with reference to the market value, which is typically determined by the credit institutions. 5.5 Non-derivative financial assets The Group classifies its financial assets in the following categories: (a) financial assets at fair value through profit or loss; (b) available-for-sale financial assets; and (c) loans and receivables. The classification depends on the purpose for which the financial assets were acquired. Management determines the classification of its financial assets at initial recognition and re-evaluates this designation, which determines the method for measuring financial assets at subsequent balance sheet date: amortised cost or fair value. 9
12 5 SUMMARY OF SIGNIFICANT ACCOUNTING POLICIES (continued) (a) Financial assets at fair value through profit or loss This category has two sub-categories: financial assets held for trading, and those designated at fair value through profit or loss at inception. A financial asset is classified in this category if acquired principally for the purpose of selling in the short term or if so designated by management. Assets in this category are classified as current assets if they are expected to be realized within 12 months after the balance sheet date. Gains and losses arising from changes in the fair value of the financial assets at fair value through profit or loss category are included within the profit and loss section of the consolidated statement of comprehensive income in the period in which they arise. There were no material financial assets designated at fair value through profit or loss at inception as of 31 December 2014 and (b) Available-for-sale financial assets Available-for-sale financial assets are non-derivatives that are either designated in this category or not classified in any of the other categories. They are included in non-current assets unless management intends to dispose of the investment within 12 months after the balance sheet date. Available-for-sale financial assets are measured at fair value at inception and subsequently. Investments in quoted equity instruments classified as available-for-sale financial assets are measured at quoted market prices as of the reporting date. Investments in equity instruments for which there are no available market quotations are accounted for at fair value. The best evidence of the fair value of a financial instrument at initial recognition is the transaction price unless the fair value of that instrument is evidenced by comparison with the same instrument or based on a valuation technique whose variables include only data from observable markets. The fair value of unquoted debt instruments classified as available-for-sale financial assets is determined using discounted cash flow valuation techniques based on prevailing market interest rate for similar instruments. Gains and losses arising from changes in the fair value of securities classified as available-for-sale are recognized in other comprehensive income and shown net of income tax in the consolidated statement of comprehensive income. When securities classified as available-for-sale are sold, the accumulated fair value adjustments are included in the consolidated statement of comprehensive income as gains (losses) on disposal of available-for-sale financial assets. Interest income on available-for-sale debt instruments, calculated using the effective interest method, is recognized within the profit and loss section of the consolidated statement of comprehensive income. (c) Loans and receivables Loans and receivables are non-derivative financial assets with fixed or determinable payments that are not quoted in an active market. Financial assets classified as loans and receivables are carried at amortized cost using the effective interest method. Gains and losses are recognized within the profit and loss section of the consolidated statement of comprehensive income when the loans and receivables are derecognized or impaired, as well as through the amortization process. Loans and receivables are included in current assets, except for maturities greater than 12 months after the balance sheet date, which are classified as non-current assets. Impairment of financial assets At each balance sheet date the Group assesses whether there is objective evidence that a financial asset or a group of financial assets is impaired. In the case of equity securities classified as available-for-sale, a significant or prolonged decline in the fair value of the security below its cost is considered in determining whether the securities are impaired. If any such evidence exists for available-for-sale financial assets, the cumulative loss measured as the difference between the acquisition cost and the current fair value, less any impairment loss on that financial asset previously recognised in profit or loss is removed from other comprehensive income to profit or loss for the year. The impairment loss is reversed if the reversal can be related objectively to an event occurring after the impairment was recognised. For financial assets measured at amortized cost and availablefor-sale financial assets which represent debt instruments, the reversal is recognised in profit or loss. For available-for-sale financial assets which represent equity instruments, the reversal is recognised directly in other comprehensive income. Impairment losses relating to assets recognised at cost cannot be reversed. The provision for impairment of accounts receivable is established if there is objective evidence that the Group will not be able to collect all amounts due according to the original terms of the receivables. Significant financial difficulties of the debtor, probability that the debtor will enter bankruptcy or financial reorganisation, and default or delinquency in payments (more than 12 months overdue) are considered indicators that the receivable is 10
13 5 SUMMARY OF SIGNIFICANT ACCOUNTING POLICIES (continued) impaired. The amount of the provision is the difference between the carrying amount and the recoverable amount, being the present value of expected cash flows, discounted at the financial asset s original effective interest rate at the date of origination of the receivable. The amount of the provision is recognized in the consolidated statement of comprehensive income within operating expenses. 5.6 Options on purchase or sale of financial assets Options on purchase or sale of financial assets are carried at their fair value. These options are accounted for as assets when their fair value is positive (for call options) and as liabilities when the fair value is negative (for put options). Changes in the fair value of these options instruments are included within the profit and loss section of the consolidated statement of comprehensive income. 5.7 Cash and cash equivalents and restricted cash Cash comprises cash on hand and balances with banks. Cash equivalents comprise short-term financial assets which are readily converted to cash and have an original maturity of three months or less. Restricted cash balances comprise balances of cash and cash equivalents which are restricted as to withdrawal under the terms of certain borrowings or under banking regulations. Restricted cash balances are excluded from cash and cash equivalents in the consolidated statement of cash flows. 5.8 Value added tax In the Russian Federation VAT at a standard rate of 18% is payable on the difference between output VAT on sales of goods and services and recoverable input VAT charged by suppliers. Output VAT is charged on the earliest of the dates: either the date of the shipment of goods (works, services) or the date of advance payment by the buyer. Input VAT could be recovered when purchased goods (works, services) are accounted for and other necessary requirements provided by the tax legislation are met. Export of goods and rendering certain services related to exported goods are subject to 0% VAT rate upon the submission of confirmation documents to the tax authorities. Input VAT related to export sales is recoverable. A limited list of goods, works and services are not subject to VAT. Input VAT related to non-vatable supply of goods, works and services generally is not recoverable and is included in the value of acquired goods, works and services. VAT related to purchases (input VAT) and also VAT prepayments are recognised in the consolidated balance sheet within other current assets, while VAT related to sales (output VAT) is disclosed separately as a current liability. VAT, presented within other non-current assets relates to assets under construction, which is expected to be recovered more than 12 months after the balance sheet date. 5.9 Natural resources production tax Natural resources production tax (NRPT) on hydrocarbons, including natural gas and crude oil, is due on the basis of quantities of natural resources extracted. In the Russian Federation NRPT for natural gas and gas condensate is defined as an amount of volume produced per fixed tax rate: for natural gas RR 700 per mcm from 1 January 2014 to 30 June 2014 and RR 35 per mcm (the tax rate is multiplied by the base amount of hard coal equivalent and by the rate reflecting the complexity of producing gas and/or gas condensate in a raw hydrocarbon deposit, the obtained amount should be summarised with the indicator of expenses for transporting gas) from 1 July 2014 to 31 December 2014 (RR 622 per mcm effective since 1 July 2013, RR 582 per mcm from 1 January 2013 to 30 June 2013); for gas condensate RR 647 per ton from 1 January 2014 to 30 June 2014 and RR 42 per ton (the tax rate is multiplied by the base amount of hard coal equivalent and by the rate reflecting the complexity of producing gas and/or gas condensate in a raw hydrocarbon deposit) from 1 July 2014 to 31 December 2014 (RR 590 per ton in 2013). Significant changes of tax rates are related to enforcement of Russian Federal Law #263-FZ dated 30 September 2013, which stipulate that starting 1 July 2014 a new formula to calculate NRPT for natural gas and gas condensate. In the Russian Federation NRPT for crude oil is defined monthly as an amount of volume produced per fixed tax rate (RR 493 per ton effective since 1 January 2014 and RR 470 per ton in 2013) adjusted for coefficients that take into account volatility of crude oil prices on the global market, relative size of the field and degree of depletion of the specific field. Since 1 September 2013 in accordance with Federal Law No. 213-FZ dated 23 July 2013 NRPT for crude oil shall also take account of coefficients that reduce the tax rate in respect to hard-torecover reserves. Also a 0% tax rate is applied to oil extracted in a number of regions of the Russian Federation shall the specific criteria determined by respective tax legislation be fulfilled. Natural resources production tax is accrued as a tax on production and recorded within operating expenses. 11
14 5 SUMMARY OF SIGNIFICANT ACCOUNTING POLICIES (continued) 5.10 Customs duties The export of hydrocarbons, including natural gas and crude oil, outside of the Customs union, which includes the Russian Federation, Belarus and Kazakhstan, is subject to export customs duties. According to the Decree of the Government of the Russian Federation No.754 dated 30 August 2013 export of natural gas outside the boundaries of the Customs union is subject to a fixed 30% export customs duty rate levied on the customs value of the exported natural gas. According to the Federal Law No.239-FZ dated 3 December 2012, starting from 1 April 2013 under the Resolution of the Russian Government No. 276 dated 29 March 2013 export customs duty calculation methodology for oil and oil products was established based on which the Ministry of Economic Development of the Russian Federation determines export customs duty rates for the following calendar month. Revenues are recognized net of the amount of custom duties Excise tax on oil products Excise tax is applicable to certain transactions with oil products. Currently only gasoline, motor oil and diesel are subject to excise tax. Oil, gas condensate and natural gas are excluded. Within the Group, excise tax is imposed on the transfers of excisable oil products produced at group-owned refineries under a tolling arrangement to the Group company owning the product. The Group considers the excise tax on refining of oil products on a tolling basis as an operating expense. These taxes are not netted from revenue presented in the consolidated statement of comprehensive income Inventories Inventories are valued at the lower of net realisable value and cost. Cost of inventory is determined on the weighted average basis. The cost of finished goods and work in progress comprises raw materials, direct labour, other direct costs and related production overhead but excludes borrowing costs. Net realisable value is the estimated selling price in the ordinary course of business, less selling expenses and completion costs Property, plant and equipment Property, plant and equipment are carried at historical cost of acquisition or construction after deduction of accumulated depreciation and accumulated impairment. Gas and oil exploration and production activities are accounted for in accordance with the successful efforts method. Under the successful efforts method, costs of development and successful exploratory wells are capitalised. Costs of unsuccessful exploratory wells are expensed upon determination that the well does not justify commercial development. Other exploration costs are expensed as incurred. Exploration costs are classified as research and development expenses within operating expenses. Major renewals and improvements are capitalised. Maintenance, repairs and minor renewals are expensed as incurred. Minor renewals include all expenditures that do not result in a technical enhancement of the asset beyond its original capability. Gains and losses arising from the disposal of property, plant and equipment are included within the profit and loss section of the consolidated statement of comprehensive income as incurred. Property, plant and equipment include the initial estimate of the costs of dismantling and removing the item and restoring the site on which it is located. Interest costs on borrowings are capitalised as part of the cost of assets under construction during the period of time that is required to construct and prepare the asset for its intended use. To the extent that funds are borrowed generally and used for the purpose of obtaining a qualifying asset, the amount of borrowing costs eligible for capitalisation is determined by applying a capitalisation rate to the expenditures on that asset. The capitalisation rate is the weighted average of the borrowing costs applicable to the borrowings of the entity that are outstanding during the period, other than borrowings made specifically for the purpose of obtaining a qualifying asset. Exchange differences arising from foreign currency borrowings to the extent that they are regarded as an adjustment to interest costs are included in the borrowing costs eligible for capitalisation. Depletion of acquired production licenses is calculated using the units-of-production method for each field based upon proved reserves. Oil and gas reserves for this purpose are determined in accordance with the guidelines set by Petroleum Resources Management System (PRMS) approved by the Society of Petroleum Engineers, the World Petroleum Congress, American Association of Petroleum Geologists and Society of Petroleum Evaluation Engineers, and were estimated by independent reservoir engineers. 12
15 5 SUMMARY OF SIGNIFICANT ACCOUNTING POLICIES (continued) Depreciation of assets (other than production licenses) is calculated using the straight-line method over their estimated remaining useful lives, as follows: Pipelines Wells 7-40 Machinery and equipment Buildings Roads Social assets Depreciation on wells has been calculated on cost, using the straight line method rather than, as is the more generally accepted international industry practice, on the unit-of-production method. The difference between straight line and units-of-production is not material for these consolidated financial statements. Assets under construction are not depreciated until they are placed in service. The return to a governmental authority of state social assets (such as rest houses, housing, schools and medical facilities) retained by the Group at privatisation is recorded only upon the termination of operating responsibility for the social assets. The Group does not possess ownership rights for the assets, but records them on its consolidated balance sheet up to the return to a governmental authority because the Group controls the benefits which are expected to flow from the use of the assets and bears all associated operational and custody risks. These disposals are considered to be shareholder transactions because they represent a return of assets for the benefit of governmental authorities, as contemplated in the original privatisation arrangements. Consequently, such disposals are accounted for as a reduction directly in equity Impairment of non-current non-financial assets At each balance sheet date, management assesses whether there is any indication that the recoverable value of the Group s assets has declined below the carrying value. When such a decline is identified, the carrying amount is reduced to the estimated recoverable amount which is the higher of fair value less costs to sell and value in use. Individual assets are grouped for impairment assessment purposes into the cash-generating units at the lowest level at which there are identifiable cash inflows that are largely independent of the cash inflows of other groups of assets. Goodwill acquired in a business combination is assessed for the recoverability of its carrying value annually irrespective of whether there is any indication that impairment exists at the balance sheet date. Goodwill acquired through business combinations is allocated to cash-generating units (or groups of cash-generating units) to which goodwill relates. In assessing whether goodwill has been impaired, the carrying amount of the cashgenerating unit (including goodwill) is compared with the recoverable amount of the respective cash-generating unit. The amount of the reduction of the carrying amount of the cash-generating unit to the recoverable value is recorded within the profit and loss section of the consolidated statement of comprehensive income in the period in which the reduction is identified. Impairments, except those relating to goodwill, are reversed as applicable to the extent that the events or circumstances that triggered the original impairment have changed. Impairment losses recognized for goodwill are not reversed in subsequent reporting periods Borrowings Borrowings are recognised initially at their fair value which is determined using the prevailing market rate of interest for a similar instrument, if significantly different from the transaction price, net of transaction costs incurred. In subsequent periods, borrowings are recognised at amortised cost, using the effective interest method; any difference between fair value of the proceeds (net of transaction costs) and the redemption amount is recognised as interest expense over the period of the borrowings Deferred tax Deferred tax assets and liabilities are calculated in respect of temporary differences using the balance sheet liability method. Deferred tax assets and liabilities are recorded for all temporary differences arising between the tax basis of assets and liabilities and their carrying values for financial reporting purposes. A deferred tax asset is recorded only to the extent that it is probable that taxable profit will be available against which the deferred tax asset will be realised or if it can be offset against existing deferred tax liabilities. Deferred tax assets and liabilities are measured at tax rates that are expected to apply to the period when the asset is realized or the liability is settled, based on tax rates that have been enacted or substantively enacted at the balance sheet date. Years 13
16 5 SUMMARY OF SIGNIFICANT ACCOUNTING POLICIES (continued) Deferred income tax is provided on all temporary differences arising on investments in subsidiaries, associated undertakings and joint ventures, except where the timing of the reversal of the temporary difference can be controlled and it is probable that the temporary difference will not reverse in the foreseeable future Foreign currency transactions Items included in the financial statements of each of the Group s entities are measured using the currency of the primary economic environment in which the entity operates ( the functional currency ). The consolidated financial statements are presented in Russian Roubles, which is the Group s presentation currency. Monetary assets and liabilities denominated in foreign currencies are translated into Russian Roubles at the official exchange rates prevailing at the reporting date. Foreign currency transactions are accounted for at the exchange rates prevailing at the date of the transactions. Gains and losses resulting from the settlement of such transactions and from the translation of monetary assets and liabilities denominated in foreign currencies at the reporting date are recognised as exchange gains or losses within the profit and loss section of the consolidated statement of comprehensive income. The balance sheets of foreign subsidiaries, associated undertakings and joint arrangements are translated into Roubles at the official exchange rate prevailing at the reporting date. Statements of comprehensive income of foreign entities are translated at average exchange rates for the year. Exchange differences arising on the translation of the net assets of foreign subsidiaries and associated undertakings are recognised as translation differences and recorded directly in equity. The official US dollar to RR exchange rates, as determined by the Central Bank of the Russian Federation, were and as of 31 December 2014 and 2013, respectively. The official Euro to RR exchange rates, as determined by the Central Bank of the Russian Federation, were and as of 31 December 2014 and 2013, respectively. Exchange restrictions and currency controls exist relating to converting the RR into other currencies. The RR is not freely convertible in most countries outside of the Russian Federation Provisions for liabilities and charges Provisions, including provisions for post-employment benefit obligations and for decommissioning and site restoration costs, are recognised when the Group has a present legal or constructive obligation as a result of past events, and it is probable that an outflow of resources will be required to settle the obligation, and a reliable estimate of the amount of the obligation can be made. As obligations are determined, they are recognised immediately based on the present value of the expected future cash outflows arising from the obligations. Initial estimates (and subsequent revisions to the estimates) of the cost of dismantling and removing the property, plant and equipment are capitalized as property, plant and equipment Equity Treasury shares When the Group companies purchase the equity share capital of OAO Gazprom, the consideration paid including any attributable transaction costs is deducted from total equity as treasury shares until they are re-sold. When such shares are subsequently sold, any consideration received net of income taxes is included in equity. Treasury shares are recorded at weighted average cost. Gains (losses) arising from treasury shares transactions are recognised directly in the consolidated statement of changes in equity, net of associated costs including taxation. Dividends Dividends are recognised as a liability and deducted from equity in the period when it recommended by the Board of Directors and approved at the General Meeting of Shareholders Revenue recognition Revenues are measured at the fair value of the consideration received or receivable. When the fair value of consideration received cannot be measured reliably, the revenue is measured at the fair value of the goods or services given up. Sales, including gas, refined products, crude oil and gas condensate and electric and heat energy, are recognised for financial reporting purposes when products are delivered to customers and title passes and are stated net of VAT and other similar compulsory payments. Gas transportation sales are recognized when transportation services have been provided, as evidenced by delivery of gas in accordance with the contract. 14
17 5 SUMMARY OF SIGNIFICANT ACCOUNTING POLICIES (continued) Natural gas prices and gas transportation tariffs to the final consumers in the Russian Federation are established mainly by the Federal Tariffs Service. Export gas prices for sales to European countries are generally indexed to oil products prices, as stipulated in long-term contracts. Export gas prices for sales to Former Soviet Union countries are determined in various ways including using formulas, similar to those used in contracts with European customers. Trading activity Contracts to buy or sell non-financial items entered into for trading purposes and which do not meet the expected own-use requirements, such as contracts to sell or purchase commodities that can be net settled in cash or settled by entering into another contract, are recognized at fair value and associated gains or losses are recorded as Net gain (loss) from trading activity. These contracts are derivatives in the scope of IAS 39 for both measurement and disclosure. The financial result generated by trading activities is reported as a net figure. Trading activities are mainly managed by Gazprom Marketing and Trading Ltd., a subsidiary of the Group, and relate partly to gas trading and power and emission rights trading activities Interest Interest income and expense are recognised within the profit and loss section of the consolidated statement of comprehensive income for all interest bearing financial instruments on an accrual basis using the effective yield method. Interest income includes nominal interest and accrued discount and premium. When loans become doubtful of collection, they are written down to their recoverable amounts (using the original effective rate) and interest income is thereafter recognised based on the same effective rate of interest Research and development Research expenditure is recognised as an expense as incurred. Development expenditure is recognised as intangible assets (within other non-current assets) to the extent that such expenditure is expected to generate future economic benefits. Other development expenditures are recognised as an expense as incurred. However, development costs previously recognised as an expense are not recognised as an asset in a subsequent period, even if the asset recognition criteria are subsequently met Employee benefits Pension and other post-retirement benefits The Group operates post-employment benefits, which are recorded in the consolidated financial statements under IAS 19 (revised) Employee Benefits ( IAS 19 (revised) ). Defined benefit plan covers the majority employees of the Group. Pension costs are recognised using the projected unit credit method. The cost of providing pensions is accrued and charged to staff expense within operating expenses in the consolidated statement of comprehensive income reflecting the cost of benefits as they are earned over the service lives of employees. The post-employment benefit obligation is measured at the present value of the estimated future cash outflows using interest rates of government securities, which have the terms to maturity approximating the terms of the related liability. Actuarial gains and losses on assets and liabilities arising from experience adjustments and changes in actuarial assumptions are charged or credited to equity in other comprehensive income in the period in which they arise. (see Note 24). Past service costs are recognised immediately though profit or loss when they occur, in the period of a plan amendment. Plan assets are measured at fair value and are subject to certain limitations (see Note 24). Fair value of plan assets is based on market prices. When no market price is available the fair value of plan assets is estimated by different valuation techniques, including discounted expected future cash flow using a discount rate that reflects both the risk associated with the plan assets and maturity or expected disposal date of these assets. In the normal course of business the Group contributes to the Russian Federation State pension plan on behalf of its employees. Mandatory contributions to the State pension plan, which is a defined contribution plan, are expensed when incurred and are included within staff costs in operating expenses. The cost of providing other discretionary post-retirement obligations (including constructive obligations) is charged to the profit and losses of the consolidated statement of comprehensive income as they are earned over the average remaining service lives of employees. 15
18 5 SUMMARY OF SIGNIFICANT ACCOUNTING POLICIES (continued) Social expenses The Group incurs employee costs related to the provision of benefits such as health and social infrastructure and services. These amounts principally represent an implicit cost of employing production workers and, accordingly, are charged to operating expenses in the consolidated statement of comprehensive income Recent accounting pronouncements Application of new IFRS A number of amendments to current IFRS and new IFRIC became effective for the periods beginning on or after 1 January 2014 and have been endorsed for application in the Russian Federation: Amendments to IAS 32 Financial Instruments: Presentation regarding offsetting rules. Amendments to IFRS 10 Consolidated Financial Statements, IFRS 12 Disclosure of Interests in Other entities and IAS 27 Separate Financial Statements in respect of investment entities. Amendments to IAS 36 Impairment of Assets regarding additional disclosure. Amendments to IAS 39 Financial Instruments: Recognition and Measurement ( IAS 39 ) regarding novation of derivatives and hedge accounting. IFRIC 21 Levies, Annual improvements The Group has applied amended standards and new IFRIC while preparing these consolidated financial statements. It has no significant impact on the Group s consolidated financial statements. Standards, Amendments and Interpretations to existing Standards that are not yet effective and have not been early adopted by the Group Certain new standards and amendments have been issued that are mandatory for the annual periods beginning on or after 1 January In particular the Group has not early adopted the following standards and amendments: a) that have been endorsed for application in the Russian Federation: The amendments to IFRS 11 Joint Arrangements (issued in May 2014 and effective for annual periods beginning on or after 1 January 2016) on accounting for acquisitions of interests in joint operations. This amendment adds new guidance on how to account for the acquisition of an interest in a joint operation that constitutes a business. The amendment to IAS 16 Property, Plant and Equipment and IAS 38 Intangible Assets (issued in May 2014 and effective for annual periods beginning on or after 1 January 2016) on clarification of acceptable methods of depreciation and amortization. In this amendment the IASB clarifies that the use of revenue-based methods to calculate the depreciation of an asset is not appropriate because revenue generated by an activity that includes the use of an asset generally reflects factors other than the consumption of the economic benefits embodied in the asset. IFRS 15 Revenue from Contracts with Customers (issued in May 2014 and effective for annual periods beginning on or after 1 January 2017). The new standard introduces the core principle that revenue must be recognized when the goods and services are transferred to the customer, at the transaction price. Any bundled goods and services that are distinct must be separately recognized, and any discounts or rebates on the contract price must generally be allocated to the separate elements. When the consideration varies for any reason, minimum amounts must be recognized if they are not at significant risk of reversal. Costs incurred to secure contracts with customers have to be recognized as an asset and amortized over the period when the benefits of the contract are consumed. b) that have not been endorsed for application in the Russian Federation: Disclosure Initiative Amendments to IAS 1 Presentation of Financial Statements (issued in December 2014 and effective for annual periods beginning on or after 1 January 2016). The standard was amended to clarify the concept of materiality and explains that an entity need not provide a specific disclosure required by an IFRS if the information resulting from that disclosure is not material, even if the IFRS contains a list of specific requirements or describes them as minimum requirements. The standard also provides new guidance on subtotals in financial statements. 16
19 5 SUMMARY OF SIGNIFICANT ACCOUNTING POLICIES (continued) IFRS 9 Financial Instruments ( IFRS 9 ) (issued in July 2014 and effective for annual periods beginning on or after 1 January 2018). IFRS 9 replaces those parts of IAS 39 relating to the classification and measurement of financial assets. Financial assets are required to be classified into two measurement categories: those to be measured subsequently at fair value, and those to be measured subsequently at amortized cost. The decision is to be made at initial recognition. The classification depends on the entity s business model for managing its financial instruments and the contractual cash flow characteristics of the instrument. Hedge accounting requirements were amended to align accounting more closely with risk management. The standard provides entities with an accounting policy choice between applying the hedge accounting requirements of IFRS 9 or continuing to apply IAS 39 to all hedging instruments because the standard currently does not address accounting for macro hedging. The Group is currently assessing the impact of the amendments on its financial position and results of operation. 6 CRITICAL JUDGMENTS AND ESTIMATES IN APPLYING ACCOUNTING POLICIES The preparation of consolidated financial statements requires management to make estimates and assumptions that affect the reported amount of assets and liabilities as well as disclosures. Management also makes certain judgments, apart from those involving estimations, in the process of applying the accounting policies. Estimates and judgments are continually evaluated based on historical experience and other factors, including expectations of future events that are believed to be reasonable under the circumstances. Actual results may differ from our estimates, and our estimates can be revised in the future, either negatively or positively, depending upon the outcome or changes in expectations based on the facts surrounding each estimate. Judgments that have the most significant effect on the amounts recognized in the consolidated financial statements and estimates that can cause a significant adjustment to the carrying amount of assets and liabilities within the next financial year are reported below. 6.1 Consolidation of subsidiaries Management judgment is involved in the assessment of control and the consolidation of subsidiaries in the Group s consolidated financial statements taken into account voting rights and contractual arrangements with other shareholders. 6.2 Tax legislation and uncertain tax positions Russian tax, currency and customs legislation is subject to varying interpretations (see Note 38). The Group's uncertain tax positions (potential tax gains and losses) are reassessed by management at every balance sheet date. Liabilities are recorded for income tax positions that are determined by management based on the interpretation of current tax laws. Liabilities for penalties, interest and taxes other than profit tax are recognised based on management s best estimate of the expenditure required to settle tax obligations at the balance sheet date. 6.3 Assumptions to determine amount of provisions Impairment provision for accounts receivable The impairment provision for accounts receivable is based on the Group s assessment of the collectability and recoverable amount of specific customer accounts, being the present value of expected cash flows. If there is deterioration in a major customer s creditworthiness or actual defaults are higher or lower than the estimates, the actual results could differ from these estimates. The charges (and releases) for impairment of accounts receivable may be material (see Note 10). Impairment of Property, plant and equipment and Goodwill The estimation of forecasted cash flows for the purposes of impairment testing involves the application of a number of significant judgements and estimates to certain variables including volumes of production and extraction, prices on gas, oil, oil products, electrical power, operating costs, capital investment, hydrocarbon reserves estimates, and macroeconomic factors such as inflation and discount rates. In addition, judgement is applied in determining the cash-generating units assessed for impairment. For the purposes of the goodwill impairment test, management considers gas production, transportation and distribution activities as part of one Gas cash-generating unit and monitors associated goodwill at this level. The pipelines that are part of the Gas cash-generating unit are utilized primarily for the Group activities and represent the only transit route for the gas produced. Operationally, the gas produced is transported through the Group s Russian 17
20 6 CRITICAL JUDGMENTS AND ESTIMATES IN APPLYING ACCOUNTING POLICIES (continued) and Belorussian pipelines and distributed to meet demands of customers in Russia and then in the Former Soviet Union and Europe and underground storage facilities. The interrelationship of these activities forming the Gas cash-generating unit provides the basis for capturing the benefits from synergies. The value in use of assets or cash-generating units related to oil and gas operations are based on the cash flows expected from oil and gas production volumes, which include both proved reserves as well as certain volumes of those that are expected to constitute proved and probable reserves in the future. Impairment charges are disclosed in Notes 13, 14 and 27. Accounting for provisions Accounting for impairment includes provisions against capital construction projects, financial assets, other noncurrent assets and inventory obsolescence. Because of the Group s operating cycle, the year end carrying values are assessed in light of forward looking plans finalised on or around year end. Accordingly, the Group typically has larger impairment charges or releases in the fourth quarter of the fiscal year as compared to other quarters. 6.4 Site restoration and environmental costs Site restoration costs that may be incurred by the Group at the end of the operating life of certain Group s facilities and properties are recognized when the Group has a present legal or constructive obligation as a result of past events, and it is probable that an outflow of resources will be required to settle the obligation, and a reliable estimate of the amount of the obligation can be made. The cost is depreciated through the profit and loss of the consolidated statement of comprehensive income on a straight-line basis over the asset s productive life. Changes in the measurement of an existing site restoration obligation that result from changes in the estimated timing or amount of the outflows, or from changes in the discount rate adjust the cost of the related asset in the current period. IFRS prescribes the recording of liabilities for these costs. Estimating the amounts and timing of those obligations that should be recorded requires significant judgment. This judgment is based on cost and engineering studies using currently available technology and is based on current environmental regulations. Liabilities for site restoration are subject to change because of change in laws and regulations, and their interpretation. 6.5 Useful lives of Property, plant and equipment The estimation of the useful life of an item of property, plant and equipment is a matter of management judgment based upon experience with similar assets. In determining the useful life of an asset, management considers the expected usage based on production and reserve estimates, estimated technical obsolescence, physical wear and tear and the physical environment in which the asset is operated. Changes in any of these conditions or estimates may result in adjustments to future depreciation rates. Were the estimated useful lives to differ by 10% from management s estimates, the impact on depreciation for the year ended 31 December 2014 would be an increase by RR 51,940 or a decrease by RR 42,497 (2013: increase by RR 46,462 or decrease by RR 38,014). Based on the terms included in the licenses and past experience, management believes hydrocarbon production licenses will be extended past their current expiration dates at insignificant additional costs. Because of the anticipated license extensions, the assets are depreciated over their useful lives beyond the end of the current license term. 6.6 Fair value estimation for financial instruments The fair values of energy trading contracts, commodity futures and swaps are based on market quotes on measurement date (Level 1 in accordance with the valuation hierarchy). Customary valuation models are used to value financial instruments which are not traded in active markets. The fair values are based on inputs that are observable either directly or indirectly (Level 2 in accordance with the valuation hierarchy). Contracts that are valued based on non-observable market data belong to Level 3 in accordance with the valuation hierarchy. Management s best estimates based on internally developed models are used for the valuation. Where the valuation technique employed incorporates significant unobservable input data such as these long-term price assumptions, contracts have been categorised as Level 3 in accordance with the valuation hierarchy (see Note 40). The assessment of the significance of a particular input to the fair value measurement requires judgment and may affect the placement of assets and liabilities within the levels of the fair value hierarchy. 6.7 Fair value estimation for acquisitions In accounting for business combinations, the purchase price paid to acquire a business is allocated to its assets and liabilities based on the estimated fair values of the assets acquired and liabilities assumed as of the date of 18
21 6 CRITICAL JUDGMENTS AND ESTIMATES IN APPLYING ACCOUNTING POLICIES (continued) acquisition. The excess of the purchase price over the fair value of the net tangible and identifiable intangible assets acquired is recorded as goodwill. A significant amount of judgment is involved in estimating the individual fair values of property, plant and equipment and identifiable intangible assets. The estimates used in determining fair values are based on assumptions believed to be reasonable but which are inherently uncertain. Accordingly, actual results may differ from the projected results used to determine fair value. 6.8 Accounting for plan assets and pension liabilities Pension plan liabilities are estimated using actuarial techniques and assumptions as disclosed in Note 24. Actual results may differ from the estimates, and the Group s estimates can be revised in the future based on changes in economic and financial conditions. In addition, certain plan assets included in NPF Gazfund are estimated using the fair value estimation techniques. Management makes judgments with respect to the selection of valuation model applied, the amount and timing of cash flows forecasts or other assumptions such as discount rates. The recognition of plan assets is limited by the estimated present value of future benefits which are available to the Group in relation to this plan. These benefits are determined using actuarial techniques and assumptions. The impact of the change in the limitation of the plan assets in accordance with IAS 19 (revised) is disclosed in Note 24. The value of plan assets and the limit are subject to revision in the future. 6.9 Joint Arrangements Upon adopting of IFRS 11 the Group applied judgement when assessing whether its joint arrangements represent a joint operation or a joint venture. The Group determined the type of joint arrangement in which it is involved by considering its rights and obligations arising from the arrangement including the assessment of the structure and legal form of the arrangement, the terms agreed by the parties in the contractual arrangement and, when relevant, other facts and circumstances. The Group has assessed the nature of its joint arrangements and determined them to be joint ventures, except for its investments in OAO Tomskneft VNK, Salym Petroleum Development N.V. and Blue Stream Pipeline company B.V., which were determined to be joint operations. 7 SEGMENT INFORMATION The Group operates as a vertically integrated business with substantially all external gas sales generated by the Distribution segment. The Board of Directors and Management Committee of OAO Gazprom (chief operating decision maker (CODM)) provide general management of the Group, an assessment of the operating results and allocate resources using different internal financial information. Based on that the following reportable segments within the Group were determined: Production of gas exploration and production of gas; Transport transportation of gas; Distribution sales of gas within Russian Federation and abroad; Gas storage storage of extracted and purchased gas in underground gas storages; Production of crude oil and gas condensate exploration and production of oil and gas condensate, sales of crude oil and gas condensate; Refining processing of oil, gas condensate and other hydrocarbons, and sales of refined products; and Electric and heat energy generation and sales. Other activities have been included within All other segments column. The inter-segment sales mainly consist of: Production of gas sales of gas to the Distribution and Refining segments; Transport rendering transportation services to the Distribution segment; Distribution sales of gas to the Transport segment for own needs and to the Electric and heat energy generation and sales segment; Gas storage sales of gas storage services to the Distribution segment; Production of crude oil and gas condensate sales of oil and gas condensate to the Refining segment for further processing; and Refining sales of refined hydrocarbon products to other segments. Internal transfer prices, mostly for Production of gas, Transport and Gas storage segments, are established by the management of the Group with the objective of providing specific funding requirements of the individual subsidiaries within each segment. 19
22 7 SEGMENT INFORMATION (continued) The CODM assesses the performance, assets and liabilities of the operating segments based on the internal financial reporting. The effects of certain non-recurring transactions and events, such as business acquisitions, and the effects of some adjustments that may be considered necessary to reconcile the internal financial information to IFRS consolidated financial statements are not included within the operating segments which are reviewed by the CODM on a central basis. Gains and losses on available-for-sale financial assets, and financial income and expenses are also not allocated to the operating segments. Year ended 31 December 2014 Production of gas Transport Distribution Gas storage Production of crude oil and gas condensate Refining Electric and heat energy generation and sales All other segments Total segment revenues 701, ,057 3,203,357 44, ,311 1,629, , ,632 7,886,757 Inter-segment sales 682, , ,040 41, ,077 10, ,260,696 External sales 19, ,842 2,966,317 2, ,234 1,619, , ,632 5,626,061 Segment result 47,193 43, ,604 6,314 75, ,647 (14,752) (18,774) 1,113,279 Depreciation 141, ,004 14,592 18,962 81,905 35,425 37,343 24, ,712 Share of net (loss) income of associated undertakings and joint ventures (22,277) 9,895 10,934 (2,724) 55, (14) (5,761) 46,051 Year ended 31 December 2013 Total segment revenues 662, ,287 3,210,204 37, ,535 1,362, , ,037 7,530,299 Inter-segment sales 653, , ,053 35, ,319 10, ,221,695 External sales 8, ,265 2,963,151 1, ,216 1,351, , ,037 5,308,604 Segment result 62,594 55, ,896 4, , ,994 39,218 12,059 1,351,333 Depreciation 132, ,861 14,241 15,220 75,872 34,696 26,409 19, ,868 Share of net income (loss) of associated undertakings and joint ventures 852 2,446 12, ,271 (937) (9) 13,231 56,670 A reconciliation of total reportable segments results to total profit before profit tax in the consolidated statement of comprehensive income is provided as follows: For the year ended 31 December Notes Segment result for reportable segments 1,132,053 1,339,274 Other segments result (18,774) 12,059 Total segment result 1,113,279 1,351,333 Difference in depreciation* 263, ,849 Expenses associated with pension obligations (3,387) (28,063) 28 Net finance expense (1,048,737) (154,584) Losses on disposal of available-for-sale financial assets (915) (3,212) 15 Share of net income of associated undertakings and joint ventures 46,051 56, Derivatives (losses) gains (7,141) 8,512 14, 27 Impairment of goodwill (47,620) - Other (8,268) (10,422) Profit before profit tax 306,823 1,486,083 *The difference in depreciation relates to adjustments of statutory fixed assets to comply with IFRS, such as reversal of revaluation of fixed assets recorded under Russian statutory accounting or accounting for historical hyperinflation which is not recorded under statutory accounting. A reconciliation of reportable segments external sales to sales in the consolidated statement of comprehensive income is provided as follows: For the year ended 31 December External sales for reportable segments 5,416,429 5,074,567 External sales for other segments 209, ,037 Total external segment sales 5,626,061 5,308,604 Differences in external sales* (36,250) (58,639) Total sales per the consolidated statement of comprehensive income 5,589,811 5,249,965 * The difference in external sales relates to adjustments of statutory sales to comply with IFRS, such as netting of sales of materials to subcontractors recorded under Russian statutory accounting and other adjustments. Total 20
23 7 SEGMENT INFORMATION (continued) Substantially all of the Group s operating assets are located in the Russian Federation. Segment assets consist primarily of property, plant and equipment, accounts receivable and prepayments, investments in associated undertakings and joint ventures, and inventories. Cash and cash equivalents, restricted cash, VAT recoverable, goodwill, financial assets and other current and non-current assets are not considered to be segment assets but rather are managed on a central basis. 31 December 2014 Production of gas Gas storage Production of crude oil and gas condensate Refining Electric and heat energy generation and sales All other segments Segment assets 2,276,369 6,088,335 1,454, ,762 1,896,609 1,378, , ,507 14,836,091 Investments in associated undertakings and joint ventures 13, ,594 54,083 7, ,373 20, , ,216 Capital additions 254, ,433 23,709 15, , ,158 82,019 48,177 1,221, December 2013 Segment assets 2,051,204 5,271,761 1,394, ,198 1,585,429 1,121, , ,682 13,134,468 Investments in associated undertakings and joint ventures 31,032 74,292 73,339 6, ,612 17, , ,684 Capital additions 257, ,547 36,085 23, , ,254 77, ,285 1,213,850 Reportable segments assets are reconciled to total assets in the consolidated balance sheet as follows: 31 December Notes Segment assets for reportable segments 14,174,584 12,464,786 Other segments assets 661, ,682 Total segment assets 14,836,091 13,134,468 Differences in property, plant and equipment, net* (2,070,873) (1,600,509) 13 Loan interest capitalized 467, ,792 Decommissioning costs 47,287 75,886 8 Cash and cash equivalents 1,038, ,130 Restricted cash 2, Short-term financial assets 10,735 24,502 VAT recoverable 289, ,315 Other current assets 403, , Available-for-sale long-term financial assets 201, , Goodwill 104, ,189 Other non-current assets 346, ,352 Inter-segment assets (757,684) (671,612) Other 259, ,846 Total assets per the consolidated balance sheet 15,177,470 13,436,236 * The difference in property, plant and equipment relates to adjustments of statutory fixed assets to comply with IFRS, such as reversal of revaluation of fixed assets recorded under Russian statutory accounting or accounting for historical hyperinflation which is not recorded under statutory accounting. Segment liabilities mainly comprise operating liabilities. Profit tax payable, deferred tax liabilities, provisions for liabilities and charges, short-term and long-term borrowings, including current portion of long-term borrowings, short-term and long-term promissory notes payable and other non-current liabilities are managed on a central basis. Total Segment liabilities Production of gas Transport Distribution Transport Distribution Gas storage Production of crude oil and gas condensate Refining Electric and heat energy generation and sales All other segments 31 December , , ,824 18, , ,737 78, ,044 1,982, December , , ,370 9, , ,677 49, ,339 1,678,106 Total 21
24 7 SEGMENT INFORMATION (continued) Reportable segments liabilities are reconciled to total liabilities in the consolidated balance sheet as follows: 31 December Notes Segment liabilities for reportable segments 1,852,740 1,552,767 Other segments liabilities 130, ,339 Total segments liabilities 1,982,784 1,678,106 Current profit tax payable 8,402 17, Short-term borrowings, promissory notes and current portion of long- term borrowings 464, , Long-term borrowings and promissory notes 2,224,042 1,470, Provisions for liabilities and charges 297, , Deferred tax liabilities 594, ,869 Other non-current liabilities 86,256 50,966 Dividends 4,759 3,791 Inter-segment liabilities (757,684) (671,612) Other 152,904 31,504 Total liabilities per the consolidated balance sheet 5,057,449 3,801,882 8 CASH AND CASH EQUIVALENTS Balances included within cash and cash equivalents in the consolidated balance sheet represent cash on hand and balances with banks and term deposits with original maturity of three months or less. 31 December Cash on hand and bank balances payable on demand 969, ,663 Term deposits with original maturity of three months or less 68, ,467 1,038, ,130 The table below analyses credit quality of banks by external credit ratings at which the Group holds cash and cash equivalents. The ratings are shown under Standard & Poor s classification: 31 December Cash on hand External credit rating of A-3 and above 129, ,621 External credit rating of B 810,478 8,061 No external credit rating 97,231 87,878 Total cash and cash equivalents 1,038, ,130 The sovereign credit ratings of the Russian Federation published by Standard & Poor s are BBB- (negative outlook) and BBB (stable outlook) as of 31 December 2014 and 2013, respectively. 9 SHORT-TERM FINANCIAL ASSETS 31 December Financial assets held for trading: 6,718 22,355 Bonds 6,498 5,681 Equity securities ,674 Available-for-sale financial assets: 4,017 2,147 Equity securities 2,863 - Promissory notes 1,154 2,147 Total short-term financial assets 10,735 24,502 Information about credit quality of short-term financial assets (excluding equity securities) is presented in the table below with reference to external credit ratings of related counterparties or instruments. The ratings are shown under Standard & Poor s classification: 31 December External credit rating of A-3 and above 5,123 4,725 External credit rating of B 1,778 2,296 No external credit rating ,652 7,828 22
25 10 ACCOUNTS RECEIVABLE AND PREPAYMENTS 31 December Financial assets Trade receivables (net of impairment provision of RR 616,919 and RR 315,332 as of 31 December 2014 and 2013, respectively) 683, ,219 Short-term loans (net of impairment provision of RR 1,250 and RR nil as of 31 December 2014 and 2013, respectively) 121,063 79,082 Other receivables (net of impairment provision of RR 26,837 and RR 18,139 as of 31 December 2014 and 2013, respectively) 108,429 95, , ,285 Non-financial assets Advances and prepayments (net of impairment provision of RR 1,116 and RR 670 as of 31 December 2014 and 2013, respectively) 132, ,741 Total accounts receivable and prepayments 1,045,936 1,032,026 The estimated fair value of short-term accounts receivable approximates their carrying value. Other receivables are mainly represented by accounts receivable from Russian customers for various types of goods, works, and services. Accounts receivable due from NAK Naftogaz Ukraine in relation to gas sales are RR nil and RR 90,267 net of impairment provision of RR 123,874 and nil as of 31 December 2014 and 2013, respectively. 31 December Short-term trade accounts receivable neither past due nor impaired 604, ,407 Short-term trade accounts receivable impaired and provided for 647, ,576 Impairment provision at the end of the year (616,919) (315,332) Short-term trade accounts receivable past due but not impaired 49,681 38,568 Total short-term trade accounts receivable 683, ,219 Management s experience indicates customer payment histories in respect of trade accounts receivable neither past due nor impaired vary by geography. The credit quality of these assets can be analysed as follows: 31 December Europe and other countries gas, crude oil, gas condensate and refined products debtors 338, ,093 Domestic gas, crude oil, gas condensate and refined products debtors 129, ,183 Former Soviet Union countries (excluding Russian Federation) gas, crude oil, gas condensate and refined products debtors 30, ,360 Electricity and heat sales debtors 45,943 36,850 Transportation services debtors 3,953 1,687 Other trade debtors 56,310 39,234 Total trade receivables neither past due nor impaired 604, ,407 As of 31 December 2014 and 2013, the individually impaired receivables mainly relate to gas sales to certain Russian regions and Former Soviet Union countries. In management s view the receivables will be ultimately recovered. The ageing analysis of these receivables is as follows: Ageing from the due date Gross book value Provision Net book value 31 December 31 December 31 December Up to 6 months 124,549 53,956 (104,788) (38,077) 19,761 15,879 From 6 to 12 months 123,951 29,322 (121,310) (25,279) 2,641 4,043 From 1 to 3 years 146, ,828 (139,017) (103,687) 7,036 5,141 More than 3 years 252, ,470 (251,804) (148,289) , ,576 (616,919) (315,332) 30,087 25,244 23
26 10 ACCOUNTS RECEIVABLE AND PREPAYMENTS (continued) Movements of the Group s provision for impairment of trade and other receivables are as follows: Trade receivables Other receivables Year ended 31 December Year ended 31 December Impairment provision at the beginning of the year 315, ,334 18,139 16,664 Impairment provision accrued* 287,720 75,263 11,545 6,351 Write-off of receivables during the year** (6,320) (1,302) (755) (4,326) Release of previously created provision* (172,607) (12,547) (2,092) (550) Foreign exchange rate differences 192,794 (2,416) - - Impairment provision at the end of the year 616, ,332 26,837 18,139 * The accrual and release of provision for impaired receivables have been included in Charge for impairment and other provisions in the consolidated statement of comprehensive income. ** If there is no probability of cash receipt for the impaired accounts receivable which were previously provided for, the amount of respective accounts receivable is written-off by means of that provision. Trade accounts receivable past due but not impaired mainly relate to a number of customers for whom there is no recent history of material default. The ageing analysis of these trade receivables is as follows: Ageing from the due date 31 December Up to 6 months 30,324 24,835 From 6 to 12 months 16,266 8,471 From 1 to 3 years 2,868 5,004 More than 3 years ,681 38, INVENTORIES 31 December Gas in pipelines and storage 429, ,537 Materials and supplies (net of an obsolescence provision of RR 5,414 and RR 4,306 as of 31 December 2014 and 2013, respectively) 132, ,323 Goods for resale (net of an obsolescence provision of RR 1,474 and RR 589 as of 31 December 2014 and 2013, respectively) 27,233 24,693 Crude oil and refined products 83,299 84, , , OTHER CURRENT AND NON-CURRENT ASSETS Included within other current assets are prepaid taxes, predominantly VAT in the amount of RR 117,012 and RR 103,805 and profit tax in the amount of RR 92,122 and RR 12,089 as of 31 December 2014 and 2013, respectively. Included within other non-current assets is VAT recoverable related to assets under construction totaling RR 49,543 and RR 74,711 as of 31 December 2014 and 2013, respectively. Other non-current assets include net pension assets in the amount of RR 111,742 and RR 111,160 as of 31 December 2014 and 2013 respectively (see Note 24). 24
27 13 PROPERTY, PLANT AND EQUIPMENT Notes Pipelines Wells As of 31 December 2012 Machinery and equipment Buildings and roads Production licenses Social assets Assets under construction Cost 2,978,567 1,183,507 2,767,829 2,402, ,046 93,181 1,578,379 11,460,206 Accumulated depreciation (1,082,253) (415,780) (1,066,682) (742,849) (171,294) (32,178) - (3,511,036) Net book value as of 31 December ,896, ,727 1,701,147 1,659, ,752 61,003 1,578,379 7,949,170 Depreciation (76,672) (46,717) (183,432) (87,682) (21,037) (2,616) - (418,156) Additions ,611 10,045 3,242 41, ,212,280 1,313,148 Acquisition of subsidiaries ,418 13, , ,073 Translation differences 799 3,595 4,692 5,583 2, ,455 18,716 Transfers 109, , , , ,691 (969,059) - Disposals and other (613) (19,029) (5,275) (7,417) (2,048) (260) (19,175) (53,817) 27 Charge for impairment provision (46) (46) Net book value as of 31 December ,929, ,517 1,990,086 1,946, ,068 61,230 1,822,794 8,940,088 As of 31 December 2013 Cost 3,089,096 1,344,235 3,233,208 2,777, ,399 94,737 1,822,794 12,859,929 Accumulated depreciation (1,159,698) (460,718) (1,243,122) (830,465) (192,331) (33,507) - (3,919,841) Net book value as of 31 December ,929, ,517 1,990,086 1,946, ,068 61,230 1,822,794 8,940,088 Depreciation (79,240) (54,714) (215,927) (99,840) (15,121) (2,620) - (467,462) Additions ,689 32,990 48,328 1,364 1,220,432 1,354,091 Acquisition of subsidiaries - - 1,115 15, , ,475 Translation differences 8,556 64,279 33,578 29,482 24, , ,983 Transfers 307, , , ,858-1,496 (1,053,132) - Disposals and other (383) (72,673) (11,079) (9,955) (2,286) (2,123) (25,003) (123,502) 27 Charge for impairment provision - (18,702) (35,207) (19,167) (2,356) - (1,032) (76,464) Net book value as of 31 December ,166, ,108 2,186,531 2,104, ,453 59,369 2,110,422 9,950,209 As of 31 December 2014 Cost 3,415,966 1,478,790 3,652,413 3,036, ,905 94,965 2,110,422 14,356,134 Accumulated depreciation (1,249,246) (515,682) (1,465,882) (932,067) (207,452) (35,596) - (4,405,925) Net book value as of 31 December ,166, ,108 2,186,531 2,104, ,453 59,369 2,110,422 9,950,209 Operating assets are shown net of provision for impairment of RR 129,479 and RR 54,047 as of 31 December 2014 and 2013, respectively. Assets under construction are presented net of a provision for impairment of RR 43,788 and RR 42,873 as of 31 December 2014 and 2013, respectively. Charges for impairment provision of assets under construction primarily relate to assets for which it is not yet probable that there will be future economic benefit. At the each balance sheet date management assess whether there is any indication that the recoverable value has declined below the carrying value of property, plant and equipment. As of 31 December 2014 the Group determined indicators of impairment. The impairment was primarily triggered by changes in the Russian economy (see Note 2), which unfavorably affected discount rates applied by the Group. The Group conducted impairment tests assessing whether the carrying amount of each cash-generating unit is compared with the recoverable amount of the respective cash-generating unit. The recoverable amount used in the impairment tests has been determined on the basis of the values in use of such assets. The values in use of cash-generating units have been calculated as the present values of projected future cash flows discounted using the rates derived from the weighted average cost of capital of the Group, as adjusted, where applicable, to take into account any specific risks of business operations related to the cash-generating units. The Group used discount rates ranging from 12.5% to 17.5%. Cash flows are projected based on actual operating results, business plans and investment programs. The cash flow projections cover periods commensurate with the production cycles and expected lives of the respective assets. The Group used estimated growth rates to extrapolate cash flows beyond the period, for which the Group usually prepares its budgets and investment programs. Based on the results of the impairment test the Group recognized in 2014 an impairment loss of RR 42,630 for power generating assets and RR 33,752 for oil production assets. The impairments were primarily due to increases in discount rates. Impairment of property, plant and equipment is sensitive to the key valuation inputs used to Total 25
28 13 PROPERTY, PLANT AND EQUIPMENT (continued) calculate the present value of projected future cash flows of cash-generating units. For certain oil production assets the increase in discount rate by 1% could result in an additional impairment of approximately RR 30 billion. For certain refining assets the change in key assumptions (such as increase in discount rate and decrease in EBITDA margin) by 1-2% could result in an additional impairment of approximately RR 30 billion to RR 40 billion. For certain electricity and heat generation assets the change in key assumptions (such as increase in discount rate by 1% and decrease in tariffs by 5%) could result in an additional impairment of approximately RR 20 billion to RR 40 billion. Included in the property, plant and equipment are social assets (such as rest houses, housing, schools and medical facilities) vested to the Group at privatization with a net book value of RR 336 and RR 463 as of 31 December 2014 and 2013, respectively. Included in additions above are capitalized borrowing costs of RR 119,364 and RR 66,357 for the years ended 31 December 2014 and 2013, respectively. Capitalization rates of 6.16% and 6.09% were used representing the weighted average borrowing cost for the years ended 31 December 2014 and 2013, respectively. The information regarding Group s exploration and evaluation assets (included within production licenses and assets under construction) is presented below: Year ended 31 December Balance at the beginning of the year 184, ,290 Additions 115,703 75,718 Translation differences 14,355 3,074 Transfers (17,230) - Disposals (20,350) (5,710) Balance at the end of the year 276, , GOODWILL Movements of the Group s goodwill on subsidiaries are as follows: Note Year ended 31 December Movements in goodwill on subsidiaries Balance at the beginning of the year 151, ,587 Additions 3,735 4, Charge for impairment (47,620) - Disposals (3,083) - Balance at the end of the year 104, ,189 Goodwill acquired through business combinations has been allocated to the related cash-generating units and segments within the following operations: 31 December Gas production, transportation and distribution 70,475 70,638 Refining - 43,469 Production of crude oil and gas condensate 31,299 27,564 Electric and heat energy generation and sales 2,447 9,518 Total goodwill on subsidiaries 104, ,189 In assessing whether goodwill has been impaired, the carrying values of the cash-generating units (including goodwill) were compared with their estimated value in use. Value in use is calculated as the present values of projected future cash flows discounted by the rates reflecting the time value of money as at 31 December 2014 and the risks specific to the particular cash-generated units, for which the future cash flow estimates have not been adjusted. The Group applied discount rates ranging from 12.5% to 17.5%. The estimates of future cash flows are based on the Group s managerial information, including forecast of commodity prices and expected production volumes, and available market information, and cover periods commensurate with the expected lives of the respective assets. The Group applied either steady or declining growth rates to cash flows beyond the explicit period of the forecast for related cash-generating units. Based on the results of the impairment test conducted as at 31 December 2014 the Group recognized an impairment loss in relation to goodwill in refining and electric and heat energy generation and sale segments in the amount of RR 47,
29 15 INVESTMENTS IN ASSOCIATED UNDERTAKINGS AND JOINT VENTURES Carrying value as of 31 December Share of the income (loss) of associated undertakings and joint ventures for the year ended 31 December Notes 36, 37 Sakhalin Energy Investment Company Ltd. Associate 153,418 67,868 58,888 41, OAO NGK Slavneft and its subsidiaries Joint venture 113, ,976 (7,534) (18,949) 36 Gazprombank Group Associate 95, ,612 (6,145) 11, OOO Yamal razvitie and its subsidiaries Joint venture 60,215 24,165 (1,809) (130) 36, 37 Nord Stream AG Joint venture 52,944 43,851 8,888 2, WIGA Transport Beteiligungs-GmbH & Co. KG and its subsidiaries* Associate 39,139-4,876-36,37 SGT EuRoPol GAZ S.A. Associate 27,857 18, (240) 36 TOO KazRosGaz Joint venture 19,215 9,819 6,268 4, Wintershall AG Associate 17,640 11, , ZAO Achimgaz Joint venture 16,844 9,956 6,888 4, AO Latvijas Gaze Associate 7,611 4, AO Gasum Associate 6,915 4, W & G Beteiligungs-GmbH & Co. KG and its subsidiaries* Associate 6,249 40,302 2,320 4, ZAO Nortgaz Joint venture 4,730 2,258 4,322 1,130 Shtokman Development AG** Joint venture - 23,216 (27,888) (248) 34 South Stream Transport B.V. and its subsidiaries*** Joint venture - 7,081 (4,237) - 36 AO Lietuvos dujos**** Associate - 1, AO Amber Grid**** Associate - 1, Other (net of provision for impairment of RR 1,929 as of 31 December 2014 and 2013 ) 54,764 51,211 (534) 3, , ,684 46,051 56,670 * In May 2014 the shares in all gas transportation companies that belonged to W&G Beteiligungs-GmbH & Co. KG were transferred to WIGA Transport Beteiligungs-GmbH & Co. KG. As of 31 December 2014 WIGA Transport Beteiligungs-GmbH & Co. KG forms an independent subgroup of associated undertakings. ** As of 31 December 2014 an impairment provision was created for investment in Shtokman Development AG in the amount of RR 27,378. Respective expense is included in share of net income of associated undertakings and joint ventures in the consolidated statement of comprehensive income for the year ended 31 December *** In December 2014 the Group became the owner of 100% interest in South Stream Transport B.V., the company responsible for the offshore part of the South Stream project, by acquiring shares of EDF International S.A.S., Wintershall Holding GmbH and ENI International B.V. (see Note 34). **** In accordance with the provisions of the Third Energy Package of the European Union regarding the split between the gas transmission and distribution activities in August 2013 AO Lietuvos dujos transferred assets, liabilities and rights related to gas transportation to AО Amber Grid, an associate of the Group. In June 2014 the Group sold its 37% interests in associates, AO Lietuvos dujos and AO Amber Grid, to companies controlled by the Republic of Lithuania for Euro 121 million. The Group's share of income of associated undertakings and joint ventures for the year ended 31 December 2013 includes additional expense of RR 25,961 recognized for OAO NGK Slavneft and its subsidiaries as a result of a one-time adjustment in the first quarter of 2013 to correct the prior understatement of depreciation on the basis difference for property, plant and equipment since the Group s acquisition of interest in OAO NGK Slavneft. Movements in the carrying amount of the Group s investment in associated undertakings and joint ventures are as follows: Year ended 31 December Balance at the beginning of the reporting year 549, ,113 Share of net income of associated undertakings and joint ventures 73,429 56,670 Impairment of investment in Shtokman Development AG (27,378) - Distributions from associated undertakings and joint ventures (86,907) (95,574) Share of other comprehensive (loss) income of associated undertakings and joint ventures (14,769) 10,100 Translation differences 150,871 15,879 Other acquisitions and disposals 32,286 21,496 Balance at the end of the reporting year 677, ,684 27
30 15 INVESTMENTS IN ASSOCIATED UNDERTAKINGS AND JOINT VENTURES (continued) The estimated fair values of investments in associated undertakings and joint ventures for which there are published price quotations were as follows: 31 December AO Latvijas Gaze 8,479 5,702 AO Lietuvos dujos - 3,065 AO Amber Grid - 2,170 Significant associated undertakings and joint ventures Country of primary operations Country of incorporation % of ordinary shares held as of 31 December* Nature of operations Exploration and production of gas and gas condensate ZAO Achimgaz Russia Russia AO Amber Grid Lithuania Lithuania Gas transportation - 37 Bosphorus Gaz Corporation A.S.** Turkey Turkey Gas distribution W & G Beteiligungs-GmbH & Co. KG and its subsidiaries Germany Germany Gas distribution WIGA Transport Beteiligungs- GmbH & Co. KG and its subsidiaries Germany Germany Gas transportation 50 - Production of oil and gas distribution Wintershall AG Libya Germany Wintershall Erdgas Handelshaus GmbH & Co.KG (WIEH) Germany Germany Gas distribution Gaz Project Development Central Asia AG Uzbekistan Switzerland Gas production Gazprombank (Joint-stock Company) Russia Russia Banking АО Gasum Finland Finland Gas distribution SGT EuRoPol GAZ S.A. Poland Poland Transportation and gas distribution Gas processing and sales of gas and refined products TOO KazRosGaz Kazakhstan Kazakhstan АО Latvijas Gaze Latvia Latvia Transportation and gas distribution АО Lietuvos dujos Lithuania Lithuania Gas distribution - 37 АО Moldovagaz Moldova Moldova Transportation and gas distribution Nord Stream AG** Russia, Germany Switzerland Construction, gas transportation Exploration and sales of gas and gas condensate ZAO Nortgaz Russia Russia AO Overgaz Inc. Bulgaria Bulgaria Gas distribution ZAO Panrusgaz Hungary Hungary Gas distribution AO Prometheus Gas Greece Greece Gas distribution, construction RosUkrEnergo AG Ukraine Switzerland Gas distribution Sakhalin Energy Investment Company Ltd. Russia Bermuda Islands Oil production, production of LNG OAO NGK Slavneft Russia Russia Production of oil, sales of oil and refined products АО Turusgaz Turkey Turkey Gas distribution Shtokman Development AG** Russia Switzerland Exploration and production of gas Investment activities, assets management OOO Yamal razvitie*** Russia Russia *Cumulative share of Group companies in charter capital of investees. ** Investments in companies continue to be accounted under the equity method of accounting, as the Group did not obtain control due to its corporate governance structure. *** OOO Yamal razvitie is a holder of 51% share in OOO SeverEnergiya. Artic Russia B.V. owns the remaining 49% interest in OOO SeverEnergiya. In March 2014 OOO Yamal razvitie acquired additional 20% interest in Artic Russia B.V. for USD 980 million. As a result of the transaction, the Group s effective interest in OOO SeverEnergiya increased from 38.46% to 43.15%. In April 2014 the Group provided loans to OOO Yamal razvitie in the amount of USD 980 million to finance this acquisition. The loans will form the Group s contribution in equity of OOO Yamal razvitie upon completion of the restructuring of this joint venture. 28
31 15 INVESTMENTS IN ASSOCIATED UNDERTAKINGS AND JOINT VENTURES (continued) Summarised financial information on the Group s significant associated undertakings and joint ventures is presented in tables below. The values, disclosed in the tables, represent total assets, liabilities, revenues, income (loss) of the Group s significant associated undertakings and joint ventures and not the Group s share. The financial information may be different from information in the financial statements of the associated company or joint venture prepared and presented in accordance with IFRS, due to adjustments required in application of equity method of accounting, such as fair value adjustments on identifiable assets and liabilities at the date of acquisition and adjustments on differences in accounting policies. 29 OAO NGK Slavneft and its subsidiaries Gazprombank Group* Sakhalin Energy Investment Company Ltd. As of and for the year ended 31 December 2014 Cash and cash equivalents 13, ,857 28,115 Other current assets (excluding cash and cash equivalents) 17,568 2,061, ,437 Non-current assets 368,437 1,714, ,798 Total assets 399,714 4,646,759 1,162,350 Current financial liabilities (excluding trade payables) 44,221 2,942, ,283 Other current liabilities (including trade payables) 44, , ,803 Non-current financial liabilities 46,592 1,204, ,108 Other non-current liabilities 44,727 31, ,207 Total liabilities 180,395 4,329, ,401 Net assets (including non-controlling interest) 219, , ,949 Percent of ordinary shares held 50% 37% 50% Carrying value 113,676 95, ,418 Revenue 197, , ,384 Depreciation (35,571) (35,831) (65,012) Interest income 1, , Interest expense (1,530) (173,004) (10,050) Profit tax income (expense) 1,999 (9,906) (84,095) (Loss) profit for the year (15,216) (16,546) 117,776 Other comprehensive income for the year 406 8, Total comprehensive (loss) income for the year (14,810) (8,184) 118,290 Dividends received from associated undertakings and joint ventures (5,901) (2,354) (50,045) As of and for the year ended 31 December 2013 Cash and cash equivalents 28, ,362 2,320 Other current assets (excluding cash and cash equivalents) 18,630 1,642,781 99,143 Non-current assets 340,358 1,325, ,909 Total assets 387,196 3,524, ,372 Current financial liabilities (excluding trade payables) 24,010 2,486,052 94,222 Other current liabilities (including trade payables) 40,365 85,117 83,675 Non-current financial liabilities 33, , ,573 Other non-current liabilities 44,804 26, ,014 Total liabilities 142,450 3,243, ,484 Net assets (including non-controlling interest) 244, , ,888 Percent of ordinary shares held 50% 37% 50% Carrying value 126, ,612 67,868 Revenue 193, , ,294 Depreciation (83,110) (28,823) (52,852) Interest income 1, , Interest expense (1,478) (128,476) (9,852) Profit tax expense (4,731) (10,539) (64,423) (Loss) profit for the year (40,001) 32,062 82,675 Other comprehensive income for the year ,493 Total comprehensive (loss) income for the year (40,001) 32,853 86,168 Dividends received from associated undertakings and joint ventures (3,354) (2,197) (62,236) * Presented revenue of Gazprombank Group includes revenue of media business, machinery business and other non-banking companies.
32 15 INVESTMENTS IN ASSOCIATED UNDERTAKINGS AND JOINT VENTURES (continued) Assets Liabilities Revenues Profit (loss) As of and for the year ended 31 December 2014 Nord Stream AG 489, ,935 54,646 17,567 OOO Yamal razvitie and its subsidiaries 379, ,004 32,110 (4,341) WIGA Transport Beteiligungs-GmbH & Co. KG and its subsidiaries 241, ,894 17,145 3,231 W & G Beteiligungs-GmbH & Co. KG and its subsidiaries 208, , ,725 8,916 AO Gasum 110,791 79,333 55,385 (237) SGT EuRoPol GAZ S.A. 71,910 13,873 14, Wintershall AG 69,833 42,455 10, ZAO Nortgaz 57,564 46,456 28,125 8,643 ZAO Achimgaz 47,850 13,050 20,513 13,773 TOO KazRosGaz 41,268 2,838 37,199 12,536 AO Latvijas Gaze 38,905 9,417 26,108 1,748 AO Lietuvos dujos - - 8,917 1,325 AO Amber Grid - - 1, South Stream Transport B.V. and its subsidiaries (5,581) Shtokman Development AG (680) As of and for the year ended 31 December 2013 Nord Stream AG 347, ,696 36,829 5,080 W & G Beteiligungs-GmbH & Co. KG and its subsidiaries 278, , ,801 19,934 OOO Yamal razvitie and its subsidiaries 228, ,198 15,832 (501) SGT EuRoPol GAZ S.A. 49,122 9,952 11,259 (107) Wintershall AG 45,700 24,533 54,395 3,045 ZAO Nortgaz 42,691 36,527 11,360 2,424 AO Gasum 34,563 16,501 48,240 1,416 Shtokman Development AG 33,773 1,997 - (330) ZAO Achimgaz 31,917 10,891 12,757 8,257 AO Latvijas Gaze 31,087 11,686 24,123 1,382 TOO KazRosGaz 21,361 1,722 29,436 9,318 AO Amber Grid 12,705 7, AO Lietuvos dujos 10,434 4,555 18, LONG-TERM ACCOUNTS RECEIVABLE AND PREPAYMENTS 31 December Long-term accounts receivable and prepayments (net of impairment provision of RR 29,147 and RR 14,083 as of 31 December 2014 and 2013, respectively) 182, ,957 Advances for assets under construction (net of impairment provision of RR 3,868 and RR 587 as of 31 December 2014 and 2013, respectively) 253, , , ,349 As of 31 December 2014 and 2013, long-term accounts receivable and prepayments with carrying value RR 182,817 and RR 160,957 have an estimated fair value RR and RR 146,648, respectively. 31 December Long-term accounts receivable neither past due nor impaired 152, ,834 Long-term accounts receivable impaired and provided for 59,072 54,185 Impairment provision at the end of the year (29,147) (14,083) Long-term accounts receivable past due but not impaired Total long-term accounts receivable and prepayments 182, , December Long-term loans 96,043 66,808 Long-term trade receivables 9,912 8,133 Other long-term receivables* 46,915 45,893 Total long-term accounts receivable neither past due nor impaired 152, ,834 *Long-term accounts receivable and prepayments include prepayments in amount of RR 1,567 and RR 2,450 as of 31 December 2014 and 2013, respectively. 30
33 16 LONG-TERM ACCOUNTS RECEIVABLE AND PREPAYMENTS (continued) Management experience indicates that long-term loans granted mainly for capital construction purposes are of strong credit quality. Movements of the Group s provision for impairment of long-term accounts receivable and prepayments are as follows: Year ended 31 December Impairment provision at the beginning of the year 14,083 12,797 Impairment provision accrued* 15,979 2,833 Release of previously created provision* (915) (1,547) Impairment provision at the end of the year 29,147 14,083 * The accrual and release of provision for impaired receivables have been included in Charge for impairment and other provisions in the consolidated statement of comprehensive income. 17 AVAILABLE-FOR-SALE LONG-TERM FINANCIAL ASSETS 31 December Equity securities* 200, ,985 Debt instruments , ,904 * As of 31 December 2014 and 2013 equity securities include OAO NOVATEK shares in the amount of RR 133,787 and RR 135,910, respectively. Available-for-sale long-term financial assets in total amount of RR 201,824 and RR 168,904 are shown net of provision for impairment of RR 1,797 and RR 1,629 as of 31 December 2014 and 2013, respectively. Debt instruments include mainly governmental bonds, corporate bonds and promissory notes on Group companies balances which are assessed by management as of high credit quality. Movements in long-term available-for-sale financial assets are as follows: Year ended 31 December Balance at the beginning of the year 168, ,704 (Decrease) increase in fair value of long-term available-for-sale financial assets (8,811) 6,991 Purchased long-term available-for-sale financial assets 47,393 10,033 Disposal of long-term available-for-sale financial assets (5,494) (10,254) Impairment (charge) release of long-term available-for-sale financial assets (168) 430 Balance at the end of the year 201, ,904 The maximum exposure to credit risk at the reporting date is the fair value of the debt securities classified as available-for-sale. The impairment of available-for-sale assets has been performed using the quoted market prices. 31
34 18 ACCOUNTS PAYABLE AND ACCRUED CHARGES 31 December Financial liabilities Trade payables 362, ,285 Accounts payable for acquisition of property, plant and equipment 347, ,511 Derivative financial instruments 66,820 10,361 Provision under financial guarantees* 47,407 - Other payables** 239, ,831 1,063, ,988 Non-financial liabilities Advances received 152, ,411 Accruals and deferred income 1,428 2, , ,706 1,217, ,694 * As of 31 December 2014 provision under financial guarantees includes accrual related to financial guarantee contract issued to Gazprombank (Joint-stock Company) for Ostchem Holding Limited (see Notes 27 and 37). ** As of 31 December 2014 and 2013 other payables include RR 58,164 and RR 8,430 of accruals for probable price adjustments related to natural gas deliveries made from 2012 to 2014, respectively (see Note 26). Fair values of these liabilities approximate the carrying values. 19 OTHER TAXES PAYABLE 31 December VAT 63,731 58,411 Natural resources production tax 52,203 49,625 Property tax 21,537 17,724 Excise tax 13,241 8,866 Other taxes 14,910 11, , , SHORT-TERM BORROWINGS, PROMISSORY NOTES AND CURRENT PORTION OF LONG- TERM BORROWINGS 31 December Short-term borrowings and promissory notes: RR-denominated borrowings and promissory notes 14,718 25,742 Foreign currency denominated borrowings 38,202 13,843 52,920 39,585 Current portion of long-term borrowings (see Note 21) 411, , , ,926 The weighted average effective interest rates at the balance sheet date were as follows: 31 December Fixed rate RR-denominated short-term borrowings 14.19% 8.39% Fixed rate foreign currency denominated short-term borrowings 7.78% 4.08% Variable rate RR-denominated short-term borrowings 7.23% 6.01% Variable rate foreign currency denominated short-term borrowings 3.10% 1.58% Fair values of these liabilities approximate the carrying values. 32
35 21 LONG-TERM BORROWINGS AND PROMISSORY NOTES Final 31 December Currency maturity Long-term borrowings and promissory notes payable to: Loan participation notes issued in April US dollar ,793 74,927 Mizuho Bank Ltd. 1 US dollar ,037 - Loan participation notes issued in July Euro ,554 64,849 Loan participation notes issued in October Euro ,790 57,108 Loan participation notes issued in September US dollar ,424 49,697 Loan participation notes issued in November US dollar ,851 49,364 Loan participation notes issued in November US dollar ,460 44,482 Loan participation notes issued in March US dollar ,644 43,425 Loan participation notes issued in August US dollar ,245 42,030 Loan participation notes issued in May Euro ,685 46,511 Loan participation notes issued in March Euro ,164 46,164 Loan participation notes issued in April US dollar ,528 39,868 Loan participation notes issued in April US dollar ,004 36,654 Loan participation notes issued in July Euro ,506 41,129 Loan participation notes issued in July Euro ,372 41,041 Loan participation notes issued in July US dollar ,512 33,458 Loan participation notes issued in November US dollar ,552 32,900 Loan participation notes issued in November US dollar ,513 32,877 Loan participation notes issued in February Euro ,819 - Loan participation notes issued in April Euro ,277 34,398 Loan participation notes issued in February US dollar ,642 30,044 Loan participation notes issued in February US dollar ,705 26,589 Loan participation notes issued in September GBP ,334 27,198 Loan participation notes issued in November US dollar ,621 - ZAO Mizuho Corporate Bank (Moscow) 1 US dollar ,396 28,606 Commerzbank International S.A. 10 US dollar ,381 23,026 Loan participation notes issued in November Euro ,542 23,387 Loan participation notes issued in March Euro ,340 23,254 Loan participation notes issued in November US dollar ,644 20,155 Loan participation notes issued in March Euro ,477 22,686 Loan participation notes issued in October CHF ,637 18,444 The Royal Bank of Scotland AG 1 US dollar ,939 16,339 Deutsche Bank AG US dollar ,901 13,327 Alfa-Bank (Joint-stock Company) 12 US dollar ,513 - BNP Paribas SA 1 Euro ,352 16,550 Bank of Tokyo-Mitsubishi UFJ Ltd. 1 US dollar ,232 18,528 OAO Sberbank of Russia Rouble ,802 - Sumitomo Mitsui Finance Dublin Limited US dollar ,056 10,504 Banc of America Securities Limited US dollar ,005 9,894 Bank of Tokyo-Mitsubishi UFJ Ltd. US dollar ,970 9,874 Bank of Tokyo-Mitsubishi UFJ Ltd. US dollar ,896 9,830 Credit Agricole CIB Euro ,431 10,813 OAO Sberbank of Russia Euro ,416 10,145 Russian bonds issued in February Rouble ,407 15,404 Russian bonds issued in November Rouble ,134 15,102 Russian bonds issued in November Rouble ,134 15,102 UniCredit Bank AG 1,6 US dollar ,421 11,220 HSBC Bank plc Euro ,108 10,443 Russian bonds issued in October Rouble ,821 - Citibank International plc 1 US dollar ,436 9,020 UniCredit Bank AG 1,6 Euro ,631 11,116 OAO Sberbank of Russia Rouble ,400 7,400 Bank of America Securities Limited Euro ,372 8,143 UniCredit Bank AG US dollar ,253 6,548 Gazprombank (Joint-stock Company) 11 US dollar ,252 - Russian bonds issued in February Rouble ,361 10,358 Russian bonds issued in February Rouble ,345 10,342 Russian bonds issued in February Rouble ,345 10,342 Russian bonds issued in February Rouble ,335 10,332 Russian bonds issued in February Rouble ,273 10,271 Russian bonds issued in April Rouble ,175 10,173 Banc of America Securities Limited US dollar ,132 5,895 33
36 21 LONG-TERM BORROWINGS AND PROMISSORY NOTES (continued) Final 31 December Currency maturity Russian bonds issued in December Rouble ,068 10,065 OAO Rosselkhozbank Rouble ,010 - OAO Sberbank of Russia Rouble ,010 - Gazprombank (Joint-stock Company) 11 Rouble ,000 10,000 Gazprombank (Joint-stock Company) 11 Rouble ,000 10,000 Gazprombank (Joint-stock Company) 11 US dollar ,620 - OAO VTB Bank US dollar ,307 - GK Vnesheconombank Rouble ,979 14,698 OAO Sberbank of Russia US dollar ,449 4,915 BNP Paribas SA 1 Euro ,384 6,536 OAO Sberbank of Russia Rouble ,300 - OAO VTB Bank Rouble ,250 3,750 OAO Sberbank of Russia Rouble ,504 - Russian bonds issued in February Rouble ,136 5,126 Sberbank Serbia a.d. US dollar ,071 - OAO Bank ROSSIYA Rouble ,000 5,000 OAO Bank ROSSIYA Rouble ,000 - Sberbank Serbia a.d. US dollar ,231 - Gazprombank (Joint-stock Company) 11 US dollar ,584 2,085 UniCredit Bank AG 1,6 Rouble ,352 3,145 White Nights Finance B.V. US dollar ,682 Loan participation notes issued in July US dollar ,297 Loan participation notes issued in October Euro ,575 Loan participation notes issued in June Euro ,766 Natixis SA 1 US dollar ,933 OAO VTB Bank US dollar ,974 Deutsche Bank AG US dollar ,899 Deutsche Bank AG US dollar ,566 Russian bonds issued in February Rouble ,138 Russian bonds issued in December Rouble ,038 Russian bonds issued in June Rouble ,013 Eurofert Trading Limited llc 4 Rouble ,600 Deutsche Bank AG US dollar ,346 OAO VTB Bank Rouble Russian bonds issued in July Rouble Other long-term borrowings and promissory notes Various Various 91,352 91,076 Total long-term borrowings and promissory notes 2,635,904 1,762,343 Less: current portion of long-term borrowings (411,862) (292,341) 2,224,042 1,470,002 1 Loans received from syndicate of banks, named lender is the bank-agent. Issuer of these bonds is Gaz Capital S.A. Issuer of these bonds is OAO Gazprom. Issuer of these notes is OAO WGC-2. Issuer of these bonds is OAO Mosenergo. Loans were obtained for development of Yuzhno-Russkoye oil and gas field. Issuer of these bonds is OAO Gazprom neft. Issuer of these bonds is OAO TGC-1. Issuer of these bonds is OOO Gazprom сapital. 10 In October 2014 Commerzbank International S.A. was appointed as successor agent by Commerzbank AG under facilities agreement. 11 In December 2014 OAO Gazprombank was renamed into Gazprombank (Joint-stock Company). 12 In January 2015 OAO Alfa-Bank was renamed into Alfa-Bank (Joint-stock Company). 31 December RR-denominated borrowings and promissory notes (including current portion of RR 26,252 and RR 45,730 as of 31 December 2014 and 2013, respectively) 289, ,463 Foreign currency denominated borrowings and promissory notes (including current portion of RR 385,610 and RR 246,611 as of 31 December 2014 and 2013, respectively) 2,345,920 1,516,880 2,635,904 1,762,343 34
37 21 LONG-TERM BORROWINGS AND PROMISSORY NOTES (continued) 31 December Due for repayment: Between one and two years 404, ,531 Between two and five years 970, ,741 More than five years 849, ,730 2,224,042 1,470,002 Long-term borrowings include fixed rate loans with a carrying value of RR 2,044,351 and RR 1,427,690 and fair value of RR 1,893,394 and RR 1,500,542 as of 31 December 2014 and 2013, respectively. All other long-term borrowings have variable interest rates generally linked to LIBOR and a carrying value of RR 591,553 and fair value of RR 534,708 as of 31 December The difference between carrying value of these liabilities and their fair value as of 31 December 2013 is not significant. In 2014 and 2013 the Group did not have material formal hedging arrangements to mitigate its foreign exchange risk or interest rate risk. The weighted average effective interest rates at the balance sheet date were as follows: 31 December Fixed rate RR-denominated long-term borrowings 9.85% 8.56% Fixed rate foreign currency denominated long-term borrowings 5.65% 5.91% Variable rate RR-denominated long-term borrowings 9.75% 7.30% Variable rate foreign currency denominated long-term borrowings 2.43% 2.54% As of 31 December 2014 and 2013 according to the project facility agreement, signed within the framework of the development project of Yuzhno-Russkoe oil and gas field with the group of international financial institutions with UniCredit Bank AG acting as a facility agent, ordinary shares of OAO Severneftegazprom with the pledge value of RR 16,968 and fixed assets with the pledge value of RR 26,210 were pledged to ING Bank N.V. (London branch) up to the date of full redemption of the liabilities on this agreement. As of 31 December 2014 and 2013 carrying amount of these fixed assets is RR 24,044 and RR 24,614, respectively. Management of the Group does not expect any substantial consequences to occur which relate to respective pledge agreement. Under the terms of the Russian bonds with the nominal value of RR 10,000 issued by OAO Gazprom neft in December 2012 due in 2022 bondholders can execute the right of early redemption in December 2017 at par, including interest accrued. Under the terms of the Russian bonds with the nominal value of RR 10,000 issued by OAO Gazprom neft in February 2012 due in 2022 bondholders executed the right of early redemption in February 2015 at par, including interest accrued. Under the terms of the Russian bonds with the nominal value of RR 10,000 issued by OAO Gazprom neft in February 2011 due in 2021 bondholders can execute the right of early redemption in February 2016 at par, including interest accrued. Under the terms of the Russian bonds with the nominal value of RR 10,000 issued by OAO Gazprom neft in February 2011 due in 2021 bondholders can execute the right of early redemption in February 2018 at par, including interest accrued. Under the terms of the Russian bonds with the nominal value of RR 10,000 issued by OAO Gazprom neft in April 2009 due in 2019 bondholders can execute the right of early redemption in April 2018 at par, including interest accrued. The Group has no subordinated debt and no debt that may be converted into an equity interest of the Group (see Note 25). 35
38 22 PROFIT TAX Profit before profit tax for financial reporting purposes is reconciled to profit tax expense as follows: Year ended 31 December Notes Profit before profit tax 306,823 1,486,083 Theoretical tax charge calculated at applicable tax rates (61,365) (297,217) Tax effect of items which are not deductible or assessable for taxation purposes: Non-deductible expenses, including: Tax losses for which no deferred tax asset was recognised (30,459) (6,312) 27 Provision for accounts receivable (26,645) (12,890) 14, 27 Impairment of goodwill (9,524) - 27 Provision under financial guarantees (9,481) - 24, 27 Provision for post-employment benefit obligations (6,263) (11,563) Other non-deductible expenses (26,952) (21,093) 15 Non-taxable profits of associated undertakings and joint ventures 9,210 11,334 Other non-taxable income 11,848 17,363 Profit tax expense (149,631) (320,378) Differences between the recognition criteria in Russian statutory taxation regulations and IFRS give rise to certain temporary differences between the carrying value of certain assets and liabilities for financial reporting purposes and for profit tax purposes. The tax effect of the movement on these temporary differences is recorded at the applicable statutory rates, including the prevailing rate of 20% in the Russian Federation. Tax effects of taxable and deductible temporary differences: Tax losses Retroactive Financial Inventories carry gas price assets forward adjustments Property, plant and equipment Other deductible temporary differences Total net deferred tax liabilities 31 December 2012 (465,498) (9,993) ,051 8,285 (443,804) Differences recognition and reversals recognised in profit or loss (99,231) (1,447) (5,764) 8,041 (18,339) (1,766) (118,506) Differences recognition and reversals recognised in other comprehensive income - 1, (626) 1,259 Acquisition of subsidiaries (1,254) (118) 9 2,452-1,093 2, December 2013 (565,983) (9,673) (5,612) 10,701 4,712 6,986 (558,869) Differences recognition and reversals recognised in profit or loss (54,771) 7,833 (2,765) 9,420 6,959 5,036 (28,288) Differences recognition and reversals recognised in other comprehensive income - (5,488) (1,453) (6,941) 31 December 2014 (620,754) (7,328) (8,377) 20,121 11,671 10,569 (594,098) Taxable temporary differences recognized for the year ended 31 December 2014 and 2013 include the effect of depreciation premium on certain property, plant and equipment. As a result a deferred tax liability related to property, plant and equipment was recognized in the amount of RR 28,540 and RR 66,812, respectively, with the corresponding offsetting credit to the current profit tax expense and therefore no net impact on the consolidated net profit for the year ended 31 December 2014 and The temporary differences associated with undistributed earnings of subsidiaries and associated undertakings amount to RR 591,795 and RR 725,876 as of 31 December 2014 and 2013, respectively. A deferred tax liability on these temporary differences was not recognized, because management controls the timing of the reversal of the temporary differences and believes that they will not reversed in the foreseeable future. Effective 1 January 2012, 55 major Russian subsidiaries of OAO Gazprom formed a consolidated group of taxpayers (CGT) with OAO Gazprom acting as the responsible tax payer. During 2013, an additional nine Russian subsidiaries of OAO Gazprom joined the CGT. During 2014, four Russian subsidiaries of OAO Gazprom left the CGT. In accordance with the Russian tax legislation, tax deductible losses can be offset against taxable profits among the companies within the CGT to the extent those losses and profits are recognized for tax purposes in the reporting year and, thus, are included into the tax base of the CGT. Tax assets recognized on losses prior to the formation of the CGT are written off. 36
39 23 DERIVATIVE FINANCIAL INSTRUMENTS The Group has outstanding commodity contracts measured at fair value. The fair value of derivatives is based on market quotes on measurement date or calculation using an agreed price formula. Where appropriate, in order to manage currency risk the Group uses foreign currency derivatives. The following table provides an analysis of the Group s position and fair value of derivatives outstanding as of the end of the reporting year. Fair values of derivatives are reflected at their gross value included in other assets and other liabilities in the consolidated balance sheet. Fair value 31 December Assets Commodity contracts 58,099 17,672 Foreign currency derivatives 6,568 1,629 Other derivatives ,258 19,643 Liabilities Commodity contracts 72,186 13,922 Foreign currency derivatives 62,116 3,885 Other derivatives ,439 17,807 Derivative financial instruments are mainly denominated in US dollars, Euros and Pounds sterling. As of 31 December 2014 and 2013 the Group had outstanding foreign currency hedge contracts for a total notional value of USD 1,642 million and USD 1,769 million, respectively. 24 PROVISIONS FOR LIABILITIES AND CHARGES 31 December Provision for post-employment benefit obligations 171, ,202 Provision for decommissioning and site restoration costs 104, ,782 Other 21,663 11, , ,580 Provision for decommissioning and site restoration costs decreased due to increase in discount rate from 8.1% to 13.2% as of 31 December 2013 and 2014, respectively. The Group operates post-employment benefits, which are recorded in the consolidated financial statements under IAS 19 (revised). Defined benefit plan covers the majority employees of the Group. The retirement benefit plan includes benefits of the following types: pension benefits paid to former employees through the non-state pension fund Gazfund (hereinafter referred to as the NPF ), lump sum payment upon retirement, financial aid provided to pensioners, financial aid and compensation to cover funeral expenses in the event of an employee s or pensioner's death. The amount of benefits depends on the period of the employees' service (years of service), salary level at retirement, predetermined fixed amount or a combination of these factors. Principal actuarial assumptions used: 31 December Discount rate (nominal) 12.5% 8.0% Future salary and pension increases (nominal) 8.0% 6.0% Retirement ages females 54, males 58 Turnover ratio p.a. Age-related curve, 3.8% pa on average Weighted-average duration of obligations is around 13 years. The assumptions relating to life expectancy at expected pension age were 19.3 years for a 58 year old man and 29.5 years for a 54 year old woman in 2014 and
40 24 PROVISIONS FOR LIABILITIES AND CHARGES (continued) The amounts associated with post-employment benefit obligations recognized in the consolidated balance sheet are as follows: 31 December December 2013 Unfunded Funded benefits - liabilities - provided through other benefits NPF Gazfund Funded benefits - provided through NPF Gazfund Unfunded liabilities other benefits Present value of benefit obligations (279,485) (171,275) (318,208) (198,202) Fair value of plan assets 391, ,368 - Net balance asset (liability) 111,742 (171,275) 111,160 (198,202) The net pension assets related to benefits provided by the pension plan NPF Gazfund in amount of RR 111,742 and RR 111,160 as of 31 December 2014 and 2013, respectively, are included within other non-current assets. Future economic benefit was determined based on expected contribution reductions allowing for the requirement to fund benefits for new entrants. Changes in the present value of the defined benefit obligations and fair value of plan assets for the years ended 31 December 2014 and 2013 are as follows: Funded benefits - provided through NPF Gazfund Plan asset Net liability (asset) funded benefits Unfunded liabilities other benefits Opening balance at 31 December ,208 (429,368) (111,160) 198,202 Current service cost 12,796-12,796 11,693 Past service cost Net interest expense (income) 25,430 (34,349) (8,919) 15,702 Total expenses included in staff cost 38,260 (34,349) 3,911 27,406 Remeasurements: Actuarial gains arising from changes in financial assumptions (69,125) - (69,125) (43,318) Actuarial gains arising from changes in demographic assumptions (99) Actuarial losses - Experience 3,089-3,089 1,256 Return on assets excluding amounts included in net interest expense - 73,759 73,759 - Total recognized in other comprehensive (income) loss (66,036) 73,759 7,723 (42,161) Benefits paid (10,947) 10,947 - (12,118) Contributions by employer - (12,216) (12,216) - Business combinations (54) Closing balance at 31 December ,485 (391,227) (111,742) 171,275 Opening balance at 31 December ,133 (407,512) (84,379) 198,256 Current service cost 13,973-13,973 12,480 Past service cost 14,365-14,365 8,614 Net interest expense (income) 22,628 (28,520) (5,892) 14,275 Total expenses included in staff cost 50,966 (28,520) 22,446 35,369 Remeasurements: Actuarial gains arising from changes in financial assumptions (35,763) - (35,763) (22,937) Actuarial losses arising from changes in demographic assumptions Actuarial (gains) losses - Experience (10,965) - (10,965) 4,670 Return on assets excluding amounts included in net interest expense - 9,475 9,475 - Total recognized in other comprehensive (income) loss (46,728) 9,475 (37,253) (18,171) Benefits paid (9,163) 9,163 - (17,663) Contributions by employer - (11,974) (11,974) - Business combinations Closing balance at 31 December ,208 (429,368) (111,160) 198,202 38
41 24 PROVISIONS FOR LIABILITIES AND CHARGES (continued) The major categories of plan assets as a fair value and percentage of total plan assets are as follows: 31 December December 2013 Fair value Percentage, % Fair value Percentage, % Quoted plan asset, including 124, % 103, % Mutual funds 40, % 42, % Bonds 27, % 31, % Shares 55, % 28, % Other securities - - 2, % Unquoted plan asset, including 267, % 325, % Shares 186, % 239, % Mutual funds 49, % 52, % Deposits 31, % 28, % Other securities - - 5, % Total plan assets 391, % 429, % The amount of ordinary shares of OAO Gazprom included in the fair value of plan assets comprises RR 21,338 and RR 12,004 as of 31 December 2014 and 2013, respectively. Non-quoted equities within plan assets are mostly represented by Gazprombank (Joint-stock Company) shares which are measured at fair value (Level 2) using market approach valuation techniques based on available market data. For the years ended 31 December 2014 and 2013 actual return on plan assets was a loss of RR 39,410 and income RR 19,045 primarily caused by the change of the fair value of plan assets. The sensitivity of the defined benefit obligation to changes in the principal actuarial assumptions as at 31 December 2014 is presented below: Increase (decrease) of defined benefit obligation Increase (decrease) of defined benefit obligation, % Mortality rates lower by 20% 15, % Mortality rates higher by 20% (13,343) (3.0%) Discount rate lower by 1 pp 40, % Discount rate higher by 1 pp (34,552) (7.7%) Benefit growth lower by 1 pp (36,197) (8.1%) Benefit growth higher by 1 pp 41, % Staff turnover lower by 1 pp for all ages 19, % Staff turnover higher by 1 pp for all ages (17,248) (3.9%) Retirement ages lower by 1 year 23, % Retirement ages higher by 1 year (23,371) (5.2%) The Group expects to contribute RR 24,600 to the defined benefit plans in Retirement benefit plan parameters and related risks As a rule, the above benefits are increase in line with inflation rate or salary growth for benefits that are fixed in monetary terms or depend on salary level respectively, excluding the retirement benefits payable through NPF. Increase in pensions, payable through NPF to current pensioners, depends on amount of investment return on plan assets. All retirement benefit plans of the Group are exposed to inflation risk. In addition to the inflation risk, the Group is exposed to mortality risk under life pension payable through NPF. 39
42 25 EQUITY Share capital Share capital authorised, issued and paid in totals RR 325,194 as of 31 December 2014 and 2013 and consists of 23.7 billion ordinary shares, each with a historical par value of 5 Russian Roubles. Dividends In 2014 OAO Gazprom declared and paid dividends in the nominal amount of 7.20 Russian Roubles per share for the year ended 31 December In 2013 OAO Gazprom declared and paid dividends in the nominal amount of 5.99 Russian Roubles per share for the year ended 31 December Treasury shares As of 31 December 2014 and 2013 subsidiaries of OAO Gazprom held 723 million of the ordinary shares of OAO Gazprom. Shares of the Group held by the subsidiaries represent 3.1% of OAO Gazprom shares as of 31 December 2014 and The Group management controls the voting rights of these shares. Retained earnings and other reserves Included in retained earnings and other reserves are the effects of the cumulative restatement of the consolidated financial statements to the equivalent purchasing power of the Russian Rouble as of 31 December 2002, when Russian economy ceased to be hyperinflationary under IAS 29 Financial Reporting in Hyperinflation Economies. Also, retained earnings and other reserves include translation gains arising on the translation of the net assets of foreign subsidiaries, associated undertakings and joint arrangements in the amount of RR 628,321 and RR 78,130 as of 31 December 2014 and 2013, respectively. Retained earnings and other reserves include a statutory fund for social assets, created in accordance with Russian legislation at the time of privatisation. From time to time, the Group negotiates to return certain of these assets to governmental authorities and this process may continue. Social assets with a net book value of RR 94 and RR 240 have been transferred to governmental authorities during the years ended 31 December 2014 and 2013, respectively. These transactions have been recorded as a reduction of retained earnings and other reserves. The basis of distribution is defined by legislation as the current year net profit of the Group parent company, as calculated in accordance with Russian Accounting Rules. For the year ended 31 December 2014 the statutory profit of the parent company was RR 188,980. However, the legislation and other statutory laws and regulations dealing with profit distribution are open to legal interpretation and accordingly management believes at present it would not be appropriate to disclose an amount for the distributable profits and reserves in these consolidated financial statements. 40
43 26 SALES Year ended 31 December Gas sales gross of custom duties to customers in: Russian Federation 820, ,349 Former Soviet Union (excluding Russian Federation) 486, ,681 Europe and other countries 2,149,976 2,115,748 3,456,622 3,414,778 Customs duties (472,186) (517,348) Retroactive gas price adjustments* ,393 Total sales of gas 2,985,385 2,971,823 Sales of refined products to customers in: Russian Federation 953, ,487 Former Soviet Union (excluding Russian Federation) 79,874 80,557 Europe and other countries 586, ,669 Total sales of refined products 1,619,214 1,351,713 Sales of crude oil and gas condensate to customers in: Russian Federation 51,603 32,094 Former Soviet Union (excluding Russian Federation) 16,013 50,115 Europe and other countries 141, ,007 Total sales of crude oil and gas condensate 209, ,216 Electricity and heat sales: Russian Federation 409, ,415 Former Soviet Union (excluding Russian Federation) 2,481 2,191 Europe and other countries 15,383 10,983 Total electric and heat energy sales 426, ,589 Gas transportation sales: Russian Federation 171, ,825 Former Soviet Union (excluding Russian Federation) 1,687 1,434 Europe and other countries 8 6 Total gas transportation sales 172, ,265 Other revenues: Russian Federation 152, ,529 Former Soviet Union (excluding Russian Federation) 4,757 4,992 Europe and other countries 18,969 27,838 Total other revenues 176, ,359 Total sales 5,589,811 5,249,965 * Retroactive gas price adjustments relate to gas deliveries in for which a discount has been agreed or is in the process of negotiations and where it is probable that a discount will be provided. The effects of gas price adjustments, including corresponding impacts on profit tax, are recorded when they become probable and a reliable estimate of the amounts can be made. The effects of retroactive gas price adjustments on sales for the years ended 31 December 2014 and 2013 was a credit of RR 949 and RR 74,393, respectively, reflecting a decrease in a related accruals following estimates made and agreements reached prior to the issuance of respective consolidated financial statements. 41
44 27 OPERATING EXPENSES Year ended 31 December Note Purchased oil and gas 792, ,829 Taxes other than profit tax 775, ,667 Staff costs 516, ,852 Depreciation 472, ,019 Transit of gas, oil and refined products 399, ,829 Cost of goods for resale including refined products 292, ,776 Materials 267, ,354 Repairs and maintenance 172, ,621 Electricity and heating expenses 87,228 87,242 Social expenses 46,429 34,970 Transportation services 33,431 29,909 Rental expenses 33,292 27,167 Insurance expenses 29,096 25,052 Research and development expenses 19,653 16,738 Processing services 18,121 14,423 Derivatives losses (gains) 7,141 (8,512) Heat transmission 180 5,075 Foreign exchange rate differences on operating items (243,438) (45,050) Other 300, ,795 4,020,368 3,730,756 Changes in inventories of finished goods, work in progress and other effects (76,699) (129,848) Total operating expenses 3,943,669 3,600,908 Gas purchase expenses included within purchased oil and gas amounted to RR 575,639 and RR 538,551 for the years ended 31 December 2014 and 2013, respectively. Staff costs include RR 31,317 and RR 57,815 of expenses associated with post-employment benefit obligations for the years ended 31 December 2014 and 2013, respectively (see Note 24). Significant foreign exchange rate differences for the year ended 31 December 2014 are primarily related to operating items such as accounts receivable and accounts payable. Taxes other than profit tax consist of: Year ended 31 December Natural resources production tax 563, ,885 Excise tax 112, ,568 Property tax 89,010 75,468 Other taxes 10,879 13, , ,667 The amount recognized in the consolidated statement of comprehensive income related to net impairment charges for impairment and other provisions are as follows: Year ended 31 December Notes Charge for provision for accounts receivable 133,225 64, Charge for provision for impairment of property, plant and equipment 76, Charge for impairment of goodwill 47,620-18, 37 Charge for provision under financial guarantees 47,407 - Charge for provision for investments 6,499 2, Charge for provision for inventory obsolescence 1, ,208 67,698 42
45 28 FINANCE INCOME AND EXPENSES Year ended 31 December Foreign exchange gains 322,821 96,125 Interest income 66,983 33,398 Total finance income 389, ,523 Foreign exchange losses 1,393, ,339 Interest expense 44,749 42,768 Total finance expenses 1,438, ,107 Total interest paid amounted to RR 121,819 and RR 92,024 for the years ended 31 December 2014 and 2013, respectively. Significant foreign exchange gains and losses for year ended 31 December 2014 are primarily related to nonoperating items such as foreign denominated borrowings. 29 RECONCILIATION OF (LOSS) PROFIT, DISCLOSED IN CONSOLIDATED STATEMENT OF FINANCIAL RESULTS, PREPARED IN ACCORDANCE WITH RUSSIAN ACCOUNTING RULES (RAR) TO PROFIT DISCLOSED IN IFRS CONSOLIDATED STATEMENT OF COMPREHENSIVE INCOME Year ended 31 December RAR net (loss) profit for the year per consolidated statutory accounts (124,704) 838,878 Effects of IFRS adjustments: Classification of revaluation of available-for-sale financial assets 8,859 (8,949) Difference in share of net income of associated undertakings and joint ventures (15,942) (16,565) Differences in depreciation of property, plant and equipment 287, ,730 Reversal of goodwill amortization 62,218 58,518 Loan interest and foreign exchange losses capitalized 88,581 55,312 Impairment and other provisions, including provision for pension obligations and unused vacations (154,441) (31,311) Accounting for finance leases 10,850 13,087 Write-off of research and development expenses capitalized for RAR purposes (6,509) (4,707) Fair value adjustment on derivatives (7,141) 8,512 Differences in fixed assets disposal 1,920 4,952 Other effects 6,289 (21,752) IFRS profit for the year 157,192 1,165, BASIC AND DILUTED EARNINGS PER SHARE ATTRIBUTABLE TO OWNERS OF OAO GAZPROM Earnings per share have been calculated by dividing the profit, attributable to owners of OAO Gazprom by the weighted average number of shares outstanding during the period, excluding the weighted average number of ordinary shares purchased by the Group and held as treasury shares (see Note 25). There were 23.0 billion and 22.9 billion weighted average shares outstanding for the years ended 31 December 2014 and 2013, respectively. There are no dilutive financial instruments outstanding. 43
46 31 NET CASH PROVIDED BY OPERATING ACTIVITIES Year ended 31 December Notes Profit before profit tax 306,823 1,486,083 Adjustments to profit before profit tax for: 27 Depreciation 472, , Net finance expense 1,048, , Share of net income of associated undertakings and joint ventures (46,051) (56,670) 27 Charge for provisions 344, , Derivatives losses (gains) 7,141 (8,512) Losses on disposal of available-for-sale financial assets 915 3,212 Other 5,147 (24,905) Total effect of adjustments 1,832, ,241 Cash flows from operating activities before working capital changes 2,139,388 2,098,324 (Increase) decrease in non-current assets (4,379) 4,320 Increase (decrease) in non-current liabilities 5,221 (3,372) 2,140,230 2,099,272 Changes in working capital: Increase in accounts receivable and prepayments (84,076) (110,748) Increase in inventories (108,161) (101,823) Decrease (increase) in other current assets 149,672 (47,045) Decrease in accounts payable and accrued charges, excluding interest, dividends and capital construction (3,331) (211,246) Settlements on taxes payable (other than profit tax) 17, ,390 Decrease (increase) in available-for-sale financial assets and financial assets held for trading 16,557 (5,539) Total effect of working capital changes (11,787) (158,011) Profit tax paid (212,674) (199,457) Net cash from operating activities 1,915,769 1,741,804 Total taxes and other similar payments paid in cash for the years 2014 and 2013: Year ended 31 December Customs duties 803, ,933 Natural resources production tax 561, ,229 Profit tax 212, ,457 Excise 147, ,522 VAT 98,250 22,291 Property tax 85,904 72,805 Insurance contributions to non-budget funds 74,686 77,071 Personal income tax 53,050 48,488 Other 25,512 21,776 Total taxes paid 2,062,993 1,820,572 44
47 32 SUBSIDIARY UNDERTAKINGS Significant subsidiaries Country of primary % of share capital as of 31 December* Subsidiary undertaking operation OOO Aviapredpriyatie Gazprom avia Russia ОАО Vostokgazprom Russia GAZPROM Schweiz AG Switzerland ZAO Gazprom Armenia** Armenia OOO Gazprom VNIIGAZ Russia OAO Gazprom gazoraspredelenie Russia OAO Gazprom gazoraspredelenie Sever*** Russia OOO Gazprom geologorazvedka Russia OOO Gazprom georesurs Russia GAZPROM Germania GmbH Germany Gazprom Gerosgaz Holdings B.V. Netherlands Gazprom Global LNG Ltd. United Kingdom OOO Gazprom dobycha Astrakhan Russia OOO Gazprom dobycha Krasnodar Russia OOO Gazprom dobycha Nadym Russia OOO Gazprom dobycha Noyabrsk Russia OOO Gazprom dobycha Orenburg Russia OOO Gazprom dobycha Urengoy Russia OOO Gazprom dobycha shelf Yuzhno-Sakhalinsk (OOO Gazprom dobycha shelf)**** Russia OOO Gazprom dobycha Yamburg Russia OOO Gazprom invest Russia OOO Gazprom invest Vostok Russia OOO Gazprom invest RGK (ZAO Gazprom invest RGK)**** Russia ZAO Gazprom invest Yug Russia OOO Gazprom investholding Russia Gazprom International Germany GmbH Germany OOO Gazprom inform Russia OOO Gazprom komplektatciya Russia Gazprom Marketing and Trading Ltd. United Kingdom OOO Gazprom mezhregiongaz Russia OAO Gazprom neftekhim Salavat Russia OAO Gazprom neft Russia ZAO Gazprom neft Orenburg***** Russia Gazprom Neft Trading GmbH***** Austria OOO Gazprom neft shelf***** Russia ООО Gazprom pererabotka Russia OOO Gazprom podzemremont Orenburg Russia OOO Gazprom podzemremont Urengoy Russia ООО Gazprom PKhG Russia Gazprom Sakhalin Holdings B.V. Netherlands OOO Gazprom torgservis Russia OAO Gazprom transgaz Belarus Belorussia OOO Gazprom transgaz Volgograd Russia OOO Gazprom transgaz Ekaterinburg Russia OOO Gazprom transgaz Kazan Russia OOO Gazprom transgaz Krasnodar Russia OOO Gazprom transgaz Makhachkala Russia OOO Gazprom transgaz Moskva Russia OOO Gazprom transgaz Nizhny Novgorod Russia OOO Gazprom transgaz Samara Russia OOO Gazprom transgaz St. Petersburg Russia OOO Gazprom transgaz Saratov Russia OOO Gazprom transgaz Stavropol Russia OOO Gazprom transgaz Surgut Russia OOO Gazprom transgaz Tomsk Russia
48 32 SUBSIDIARY UNDERTAKINGS (continued) Significant subsidiaries Country of primary % of share capital as of 31 December* Subsidiary undertaking operation OOO Gazprom transgaz Ufa Russia OOO Gazprom transgaz Ukhta Russia OOO Gazprom transgaz Tchaikovsky Russia OOO Gazprom transgaz Yugorsk Russia Gazprom Finance B.V. Netherlands OOO Gazprom tsentrremont Russia OOO Gazprom export Russia OOO Gazprom energo Russia OOO Gazprom energoholding Russia Gazprom EP International B.V. Netherlands ООО Gazpromneft-Vostok***** Russia ZAO Gazpromneft-Kuzbass***** Russia OAO Gazpromneft-MNPZ****** Russia OAO Gazpromneft-Noyabrskneftegaz***** Russia OAO Gazpromneft-Omsk***** Russia OAO Gazpromneft-Omskiy NPZ***** Russia ZAO Gazpromneft-Severo-Zapad***** Russia OOO Gazpromneft-Khantos***** Russia OOO Gazpromneft-Centr***** Russia OOO Gazpromneftfinans***** Russia ООО Gazpromtrans Russia OAO Gazpromtrubinvest Russia OOO Gazprom flot (OOO Gazflot)**** Russia OAO Daltransgaz Russia OOO Zapolyarneft***** Russia ОАО Krasnoyarskgazprom Russia OAO MIPC Russia ОАО Mosenergo Russia Naftna Industrija Srbije a.d.***** Serbia OOO Novourengoysky GCC Russia OAO WGC-2 Russia ZАО Purgaz Russia OAO Regiongazholding Russia ZАО Rosshelf Russia South Stream Transport B.V.******* Russia, Bulgaria OAO Severneftegazprom ******** Russia Sibir Energy Ltd. ***** United Kingdom OOO Sibmetakhim Russia OAO Spetsgazavtotrans Russia OAO TGC-1 Russia OAO Teploset Sankt-Peterburga Russia ОАО Tomskgazprom Russia OOO Faktoring-Finance Russia ОАО Tsentrgaz Russia OAO Tsentrenergogaz Russia OAO Yuzhuralneftegaz***** Russia ZAO Yamalgazinvest Russia * Cumulative share of Group companies in charter capital of investees. ** In January 2014 the Group acquired additional 20% interest in ZAO Gazprom Armenia for the amount of USD 155 million as a settlement of accounts receivable for gas supply. As a result of the transaction, the Group s interest in ZAO Gazprom Armenia increased from 80% to 100%. *** In May 2014 OAO Sibirskie gazovie seti was reorganized in the form of a merger with OAO Gazprom gazoraspredelenie Sever. As a result of the transaction, the Group s interest in OAO Gazprom gazoraspredelenie Sever increased from 91% to 96%. **** The indicated subsidiaries were renamed (former name is put in the brackets). ***** Subsidiaries of OAO Gazprom neft. ****** In August 2014 the Group acquired an additional 4% interest in the ordinary shares of OAO Gazpromneft-MNPZ increasing its interest to 100%. ******* In December 2014 the Group acquired additional 50% interest in South Stream Transport B.V. for cash consideration of EUR 883 million. As a result of the transaction, the Group s interest in South Stream Transport B.V. increased from 50% to 100%. ******** Group s portion of voting shares. 46
49 33 NON-CONTROLLING INTEREST Year ended 31 December Non-controlling interest at the beginning of the year 314, ,212 Non-controlling interest share of net profit of subsidiary undertakings* (1,812) 26,444 Acquisition of the additional interest in OOO Gazprom Resurs Nortgaz (8,110) - Acquisition of the additional interest in ZAO Gazprom Armenia (3,467) - Acquisition of the additional interest in OAO Gazpromneft-MNPZ and its subsidiaries (2,440) (344) Acquisition of additional interest in OAO WGC-2 (2,750) (19,600) Changes in the non-controlling interest as a result of other acquisitions and disposals 739 5,249 Losses from cash flow hedges (2,388) (139) Losses arising from change in fair value of available-for-sale financial assets (6) - Remeasurements of post-employment benefit obligations Dividends (11,444) (10,719) Translation differences 20,211 4,533 Non-controlling interest at the end of the year 303, ,764 * Non-controlling interest share of net profit of subsidiary undertakings includes share in impairment of assets in the amount of RR 18,312 and RR nil for the years ended 31 December 2014 and 2013, respectively. The following table provides information about each subsidiary that has non-controlling interest that is material to the Group: Country of primary operation % of share capital held by non-controlling interest* Profit (loss) attributable to non-controlling interest Accumulated non-controlling interest in the subsidiary Dividends paid to non-controlling interest during the year As of and for the year ended 31 December 2014 Gazprom neft Group** Russia 4% 8,609 92,473 4,578 Naftna Industrija Srbije a.d. Group Serbia 46% 5,081 61,775 2,314 Mosenergo Group Russia 46% (1,817) 77, TGC-1 Group Russia 48% (9,912) 55, WGC-2 Group Russia 19% (690) 29,246 - As of and for the year ended 31 December 2013 Gazprom neft Group** Russia 4% 14,276 72,278 5,973 Naftna Industrija Srbije a.d. Group Serbia 46% 7,734 40,739 2,028 Mosenergo Group Russia 46% 3,471 80, TGC-1 Group Russia 48% 3,505 66, WGC-2 Group Russia 21% ,610 - * Effective share held by non-controlling interest in charter capital of investments. **Including non-controlling interest in Naftna Industrija Srbije a.d. Group. The summarised financial information of these subsidiaries before inter-company eliminations was as follows: Gazprom neft Group Naftna Industrija Srbije a.d. Group Mosenergo Group TGC-1 Group WGC-2 Group As of and for the year ended 31 December 2014 Current assets 463,429 62,066 60,702 20,017 33,171 Non-current assets 1,869, , , , ,013 Current liabilities 216,750 42,726 22,812 16,866 18,675 Non-current liabilities 789,078 62,027 59,318 36,023 60,158 Revenue 1,409, , ,018 69, ,265 Profit (loss) for the year 99,969 11,053 6,179 (23,026) 9,604 Total comprehensive income (loss) for the year 122,310 11,053 6,249 (22,912) 9,997 Net cash from (used in): operating activities 373,055 22,715 13,686 11,775 14,643 investing activities (484,912) (19,314) (22,463) (5,837) (16,576) financing activities 42,361 (2,338) 15,738 (3,948) 9,233 47
50 33 NON-CONTROLLING INTEREST (continued) Gazprom neft Group Naftna Industrija Srbije a.d. Group Mosenergo Group TGC-1 Group WGC-2 Group As of and for the year ended 31 December 2013 Current assets 426,166 47,418 46,728 18,812 31,347 Non-current assets 1,430, , , , ,548 Current liabilities 182,987 42,811 21,154 20,443 9,476 Non-current liabilities 414,815 44,715 33,112 42,478 54,436 Revenue 1,267, , ,730 70, ,175 Profit for the year 158,901 16,733 10,633 8,379 1,929 Total comprehensive income for the year 166,944 16,733 10,633 8,402 2,487 Net cash from (used in): operating activities 207,114 28,632 12,407 11,364 12,530 investing activities (237,772) (24,391) (26,912) (7,218) (19,765) financing activities 39,671 (5,089) 4,513 (4,618) 9,231 The rights of the non-controlling shareholders of the presented subgroups are determined by the respective laws of country of incorporation and the charter documents of the subsidiary undertakings. 34 ACQUISITION OF THE CONTROLLING INTEREST IN SOUTH STREAM TRANSPORT B.V. In December 2014 the Group became the owner of 100% of the interest in South Stream Transport B.V., the company responsible for the offshore part of the South Stream project. Until 29 December 2014, South Stream Transport B.V. was a joint project held by the Group (50%), ENI International B.V. (20%), EDF International S.A.S. (15%) and Wintershall Holding GmbH (15%). On 29 December 2014, the Group acquired the remaining 50% of the shares of South Stream Transport B.V. from the minority shareholders for consideration of Euro 883 million paid in cash. South Stream Transport B.V. was established for the planning, construction, and subsequent operation of the offshore pipeline through the Black Sea and had no notable operating activities up to and as of the purchase date other than the management of construction. Accordingly, this acquisition is outside the definition of business as defined in IFRS 3 Business Combinations and was considered by the Group as an acquisition of assets. The cost of the acquisition has been allocated based on the relative fair values of the assets (largely comprised of pipeline under construction), and liabilities acquired. Assets under construction in the amount of RR 127,778 are included in the line acquisition of subsidiaries as disclosed in Note 13. Capital expenditure commitments for the construction of the pipeline contracted as of 31 December 2014, but not yet incurred amounts to EUR 4.4 billion. On 1 December 2014 a decision was announced that the South Stream project would be cancelled and that an alternative pipeline through the Black Sea to Turkey would be pursued ("Turkish Stream"). On 1 December 2014 the Group and Turkish company Botas Petroleum Pipeline Corporation signed a Memorandum of Understanding on constructing Turkish Stream. Assets under construction related to the South Stream project are expected to be utilised for Turkish Stream. 48
51 35 ACQUISITION OF THE CONTROLLING INTEREST IN OAO MOSCOW INTEGRATED POWER COMPANY (OAO MIPC) In September 2013 the Group acquired 89.98% interest in the ordinary shares of OAO Moscow Integrated Power Company (OAO MIPC) and heat assets from the Moscow Government for cash consideration of RR 99,866 including VAT in the amount of RR 1,246 related to acquired heat assets. As a result of the acquisition, the Group obtained control over OAO MIPC. Considering treasury shares of OAO MIPC, the Group s effective interest is 98.77%. The primary business activity of OAO MIPC is generation, purchase and supply of heat energy in the form of heating and hot water to commercial and residential customers in the City of Moscow. As of 31 December 2014 the title on the assets acquired in the amount of RR 6,746 excluding VAT was not transferred to the Group. In accordance with IFRS 3 Business Combinations, the Group recognized the acquired assets and liabilities based upon their provisional fair values at the date when control of OAO MIPC was obtained. As of 31 December 2014 the Group finalized their assessment of the estimated fair values of assets and liabilities acquired in accordance with IFRS 3 Business Combinations. Final fair values of the assets acquired and liabilities assumed are as follows: Fair value Cash and cash equivalents 3,276 Short-term financial assets 2,762 Accounts receivable and prepayments 18,234 Inventories 2,273 VAT recoverable 102 Other current assets 6,026 Current assets 32,673 Property, plant and equipment 124,993 Long-term accounts receivable and prepayments 4,477 Available-for-sale long-term financial assets 3,117 Other non-current assets 4,175 Non-current assets 136,762 Total assets 169,435 Accounts payable and accrued charges 29,112 Other taxes payable 601 Short-term borrowings, promissory notes and current portion of long-term borrowings 30,235 Current liabilities 59,948 Long-term borrowings and promissory notes 7,400 Deferred tax liability 196 Provisions for liabilities and charges 372 Other non-current liabilities 444 Non-current liabilities 8,412 Total liabilities 68,360 Net assets at acquisition date 101,075 Non-controlling interest at acquisition date measured at the proportionate share of the net assets 1,209 Purchase consideration 99,866 The comparative financial information of consolidated balance sheet as of 31 December 2013 and consolidated statement of comprehensive income for 2013 were not restated due to immaterial difference between provisional and final fair values of assets and liabilities of OAO MIPC. All changes in fair values were recorded in these consolidated financial statements for the year ended 31 December If the acquisition had occurred on 1 January 2013, the Group s sales and the Group s profit for the year ended 31 December 2013 would have been RR 5,291,256 and RR 1,160,092, respectively. 49
52 36 RELATED PARTIES For the purpose of these consolidated financial statements, parties are considered to be related if one party has the ability to control the other party or exercise significant influence over the other party in making financial and operational decisions as defined by IAS 24 Related Party Disclosures. Related parties may enter into transactions which unrelated parties might not, and transactions between related parties may not be effected on the same terms, conditions and amounts as transactions between unrelated parties. Government of the Russian Federation The Government of the Russian Federation is the ultimate controlling party of OAO Gazprom and has a controlling interest (including both direct and indirect ownership) of over 50% in OAO Gazprom. As of 31 December % of OAO Gazprom s issued shares were directly owned by the Government. Another % were owned by Government controlled entities. The Government does not prepare consolidated financial statements. Governmental economic and social policies affect the Group s financial position, results of operations and cash flows. As a condition of privatisation in 1992, the Government imposed an obligation on the Group to provide an uninterrupted supply of gas to customers in the Russian Federation at government controlled prices. Parties under control of the Government In the normal course of business the Group enters into transactions with other entities under Government control. Prices of natural gas sales and electricity tariffs in Russia are regulated by the Federal Tariffs Service ( FTS ). Bank loans are provided on the basis of market rates. Taxes are accrued and settled in accordance with the applicable statutory rules. As of and for the years ended 31 December 2014 and 2013, the Group had the following significant transactions and balances with the Government and parties under control of the Government: Year ended As of 31 December December 2014 Assets Liabilities Revenues Expenses Transactions and balances with the Government Current profit tax 74,744 3, ,613 Insurance contributions to non-budget funds 621 5,649-98,097 VAT recoverable/payable 451,406 57, Customs duties 85, Other taxes 4,788 91, ,972 Transactions and balances with other parties under control of the Government Gas sales ,072 - Electricity and heating sales ,208 - Gas transportation sales ,296 - Other services sales - - 2,780 - Accounts receivable 46, Oil and refined products transportation expenses ,102 Accounts payable - 14, Loans - 140, Interest expense ,768 Short-term financial assets 7, Available-for-sale long-term financial assets 5,
53 36 RELATED PARTIES (continued) Year ended As of 31 December December 2013 Assets Liabilities Revenues Expenses Transactions and balances with the Government Current profit tax 9,884 14, ,723 Insurance contributions to non-budget funds 534 5,354-84,963 VAT recoverable/payable 518,192 51, Customs duties 57, Other taxes 2,698 78, ,187 Transactions and balances with other parties under control of the Government Gas sales ,796 - Electricity and heating sales ,160 - Gas transportation sales ,038 - Other services sales - - 2,850 - Accounts receivable 54, Oil and refined products transportation expenses ,662 Accounts payable - 11, Loans - 111, Interest expense ,781 Short-term financial assets 4, Available-for-sale long-term financial assets 13, Gas sales and respective accounts receivable, oil transportation expenses and respective accounts payable included in the table above are related to major state-controlled companies. In the normal course of business the Group incurs electricity and heating expenses (see Note 27). A part of these expenses relates to purchases from the entities under Government control. Due to specifics of electricity market in the Russian Federation, these purchases cannot be accurately separated from the purchases from private companies. See consolidated statement of changes in equity for returns of social assets to governmental authorities during years ended 31 December 2014 and See Note 13 for net book values as of December 2014 and 2013 of social assets vested to the Group at privatisation. Compensation for key management personnel Key management personnel (the members of the Board of Directors and Management Committee of OAO Gazprom) receive short-term compensation, including salary, bonuses and remuneration for serving on the management bodies of various Group companies, amounted to approximately RR 4,393 and RR 2,992 for the years ended 31 December 2014 and 2013, respectively. Such amounts include personal income tax and insurance contributions to non-budget funds. Government officials, who are directors, do not receive remuneration from the Group. The remuneration for serving on the Boards of Directors of the Group companies is subject to approval by the General Meeting of Shareholders of each Group company. Compensation of key management personnel (other than remuneration for serving as directors of Group companies) is determined by the terms of the employment contracts. Key management personnel also receive certain short-term benefits related to healthcare. According to Russian legislation, the Group makes contributions to the Russian Federation State pension fund for all of its employees including key management personnel. Key management personnel also participate in certain post-retirement benefit programs. The programs include pension benefits provided by the nongovernmental pension fund, NPF Gazfund, and a one-time payment from the Group at their retirement date. The employees of the majority of Group companies are eligible for such benefits after retirement. The Group provided medical insurance and liability insurance for key management personnel. 51
54 36 RELATED PARTIES (continued) Associated undertakings and joint ventures For the years ended 31 December 2014 and 2013 and as of 31 December 2014 and 2013 the Group had the following significant transactions with associated undertakings and joint ventures: Year ended 31 December Revenues Gas sales Wintershall Erdgas Handelshaus GmbH & Co. KG (WIEH) 132, ,070 W & G Beteiligungs-GmbH & Co. KG and its subsidiaries* 130, ,558 ZAO Panrusgaz 56,523 61,392 AO Moldovagaz 32,421 20,502 AO Gazum 29,987 29,030 Bosphorus Gaz Corporation A.S. 23,097 17,730 ZAO Gazprom YRGM Trading** 13,025 12,075 ZAO Gazprom YRGM Development** 9,304 8,625 AO Latvijas Gaze 8,715 9,490 SGT EuRoPol GAZ S.A. 4,684 3,911 AO Lietuvos dujos*** 4,152 7,608 AO Overgaz Inc. 3,932 3,310 Wintershall Erdgas Handelshaus Zug AG (WIEE)**** 3,861 13,586 Russian-Serbian Trading Corporation a.d. - 7,168 Gas transportation sales ZAO Gazprom YRGM Trading** 21,878 21,188 ZAO Gazprom YRGM Development** 15,627 15,135 TOO KazRosGaz 1,682 1,421 Gas condensate, crude oil and refined products sales OAO NGK Slavneft and its subsidiaries 29,263 26,063 ZAO SOVEKS 5,631 5,535 OOO Gazpromneft Aero Sheremetyevo***** 3,022 12,263 Operator services sales ZAO Messoyakhaneftegas 9,960 5,980 Gas refining services sales TOO KazRosGaz 5,712 5,247 Expenses Purchased gas W & G Beteiligungs-GmbH & Co. KG and its subsidiaries* 66,575 73,071 ZAO Gazprom YRGM Trading** 59,151 58,527 ZAO Gazprom YRGM Development** 42,265 41,810 TOO KazRosGaz 28,428 22,724 OOO SeverEnergiya and its subsidiaries 16,486 9,858 Sakhalin Energy Investment Company Ltd. 14,838 5,715 ZAO Nortgaz 8,515 2,222 Purchased transit of gas Nord Stream AG 55,471 37,058 SGT EuRoPol GAZ S.A. 13,143 9,757 WIGA Transport Beteiligungs-GmbH & Co. KG and its subsidiaries* 11,306 - W & G Beteiligungs-GmbH & Co. KG and its subsidiaries* 7,949 13,586 Purchased crude oil OAO NGK Slavneft and its subsidiaries 83,225 84,091 Sakhalin Energy Investment Company Ltd. 19,243 13,396 Purchased services of gas and gas condensate extraction ZAO Achimgaz 20,513 12,757 Purchased processing services OAO NGK Slavneft and its subsidiaries 12,838 11,853 * In May 2014 the shares in all gas transportation companies that belonged to W&G Beteiligungs-GmbH & Co. KG were transferred to WIGA Transport Beteiligungs-GmbH & Co. KG. As of 31 December 2014 WIGA Transport Beteiligungs-GmbH & Co. KG forms an independent subgroup of associated undertakings. ** ZAO Gazprom YRGM Trading and ZAO Gazprom YRGM Development are not associated undertakings and joint ventures. *** In accordance with the provisions of the Third Energy Package of the European Union regarding the split between the gas transmission and distribution activities in August 2013 AO Lietuvos dujos transferred assets, liabilities and rights related to gas transportation to AО Amber Grid, an associate of the Group. In June 2014 the Group sold its 37% interests in associates, AO Lietuvos dujos and AO Amber Grid, to companies controlled by the Republic of Lithuania for Euro 121 million. **** Wintershall Erdgas Handelshaus Zug AG (WIEE) is the subsidiary of Wintershall Erdgas Handelshaus GmbH & Co. KG (WIEH). 52
55 36 RELATED PARTIES (continued) ***** In March 2014 the Group acquired 100% share in OOO Aero TO the only asset of which is 50% share in OOO Gazpromneft Aero Sheremetyevo. As a result the Group s effective share in OOO Gazpromneft Aero Sheremetyevo increased from 47.84% to 95.68% and the Group obtained control over OOO Gazpromneft Aero Sheremetyevo. Gas is sold to and purchased from associated undertakings in the Russian Federation mainly at the rates established by the FTS. Gas is sold and purchased outside the Russian Federation mainly under long-term contracts at prices indexed mainly to world energy product prices. The Group sells to and purchases oil from related parties in the ordinary course of business at prices close to average market prices. As of 31 December Assets Liabilities Assets Liabilities Short-term accounts receivable and prepayments Wintershall Erdgas Handelshaus GmbH & Co.KG (WIEH) 20,739-20,501 - W & G Beteiligungs-GmbH & Co. KG and its subsidiaries 17,448-8,452 - OAO NGK Slavneft and its subsidiaries 10,701-4,512 - AO Overgaz Inc. 9,246-8,011 - AO Gasum 5,353-4,157 - ZAO Panrusgaz 3,523-5,774 - Wintershall AG 2, Gazprombank Group 2,125-8,974 - ZAO Gazprom YRGM Trading 2,082-1,377 - ZAO Nortgaz 1, ZAO Messoyakhaneftegas 1,869-2,944 - ZAO Gazprom YRGM Development 1, Bosphorus Gaz Corporation A.S. 1,349-2,731 - AO Moldovagaz* 1, OOO Yamal razvitie 1, Wintershall Erdgas Handelshaus Zug AG (WIEE) 1,081-1,290 - TOO KazRosGaz Sakhalin Energy Investment Company Ltd AO Latvijas Gaze АО Lietuvos dujos - - 2,000 - Russian-Serbian Trading Corporation a.d Short-term promissory notes Gazprombank Group 857-1,059 - Cash balances Gazprombank Group 637, ,421 - Long-term accounts receivable and prepayments W & G Beteiligungs-GmbH & Co. KG and its subsidiaries 26,161-17,214 - WIGA Transport Beteiligungs-GmbH & Co. KG and its subsidiaries 13, ZAO Messoyakhaneftegas 10,672-2,838 - OOO Yamal razvitie 10,395-2,200 - Etzel Kavernenbetriebsgesellschaft mbh & Co. KG 5,293-3,811 - Gazprombank Group 4, Erdgasspeicher Peissen GmbH 3,745-2,060 - Gas Project Development Central Asia AG 788-1,826 - Long-term promissory notes Gazprombank Group Short-term accounts payable ZAO Gazprom YRGM Trading - 7,988-8,723 W & G Beteiligungs-GmbH & Co. KG and its subsidiaries - 6,464-4,715 Nord Stream AG - 6,098-4,179 ZAO Gazprom YRGM Development - 5,260-5,786 ZAO Achimgaz - 3,188-1,998 TOO KazRosGaz - 2,925-2,992 SGT EuRoPol GAZ S.A. - 2,272-7,702 OAO NGK Slavneft and its subsidiaries - 1,926-2,466 Sakhalin Energy Investment Company Ltd. - 1, ZAO Nortgaz AO Latvijas Gaze Gazprombank Group АО Lietuvos dujos ,188 53
56 36 RELATED PARTIES (continued) As of 31 December Assets Liabilities Assets Liabilities Other non-current liabilities ZAO Gazprom YRGM Trading ZAO Gazprom YRGM Development Short-term borrowings (including current portion of long-term borrowings) Gazprombank Group - 24,397-13,614 Long-term borrowings Gazprombank Group - 36,490-26,195 * Net of impairment provision on accounts receivable in the amount of RR 273,143 and RR 142,592 as of 31 December 2014 and Investments in associated undertakings and joint ventures are disclosed in Note 15. See Note 37 for financial guarantees issued by the Group for the associated undertakings and joint ventures. 37 СOMMITMENTS AND CONTINGENCIES Financial guarantees 31 December Notes Outstanding guarantees issued for: Sakhalin Energy Investment Company Ltd. 136,490 89,825 18, 27 Ostchem Holding Limited 47,407 - Blackrock Capital Investments Limited 7,675 4,804 OOO Production Company VIS 7,016 8,164 EM Interfinance Limited 3,065 3,668 Nord Stream AG - 50,830 Other 75,104 43, , ,043 In 2014 and 2013 counterparties fulfilled their obligations. Included in financial guarantees are amounts denominated in USD of USD 3,814 million and USD 3,404 million as of 31 December 2014 and 2013, respectively, as well as amounts denominated in Euro of Euro 356 million and Euro 1,493 million as of 31 December 2014 and 2013, respectively. In June 2008 the Group issued a guarantee to the Bank of Tokyo-Mitsubishi UFJ Ltd. for Sakhalin Energy Investment Company Ltd. under the credit facility up to the amount of the Group s share (50%) in the obligations of Sakhalin Energy Investment Company Ltd. toward the Bank of Tokyo-Mitsubishi UFJ Ltd. As of 31 December 2014 and 2013 the above guarantee amounted to RR 136,490 (USD 2,426 million) and RR 89,825 (USD 2,744 million), respectively. In December 2014 the Group provided a guarantee to Gazprombank (Joint-stock Company) related to debts from Ostchem Holding Limited under the credit facility for financing of operating activities. As of 31 December 2014 the above guarantee amounted to RR 47,407 (USD 843 million) and was fully provided (see Notes 18 and 27). In 2006 the Group guaranteed Asset Repackaging Trust Five B.V. (registered in Netherlands) bonds issued by five financing entities: Devere Capital International Limited, Blackrock Capital Investments Limited, DSL Assets International Limited, United Energy Investments Limited, EM Interfinance Limited (registered in Ireland) in regard to bonds issued with due dates December 2012, June 2018, December 2009, December 2009 and December 2015, respectively. Bonds were issued for financing of construction of a transit pipeline in Poland by SGT EuRoPol GAZ S.A. In December 2009 loans issued by DSL Assets International Limited and United Energy Investments Limited were redeemed. In December 2012 loans issued by Devere Capital International Limited were redeemed. As a result as of 31 December 2014 and 2013 the guarantees issued for Blackrock Capital Investments Limited and EM Interfinance Limited amounted to RR 10,740 (USD 191 million) and RR 8,472 (USD 259 million), respectively. In July 2012 the Group issued a guarantee to OAO Sberbank of Russia for OOO Production company VIS as a security of credit facility for financing of construction projects for Gazprom Group. As of 31 December 2014 and 2013 the above guarantee amounted to RR 7,016 and RR 8,164, respectively. In March 2011 the Group issued a guarantee to Societe Generale for Nord Stream AG under the credit facility for financing of Nord Stream gas pipeline Phase 2 construction completion. According to guarantee agreements 54
57 37 СOMMITMENTS AND CONTINGENCIES (continued) the Group has to redeem debt up to the amount of the Group s share (51%) in the obligations of Nord Stream AG toward the Societe Generale in the event that Nord Stream AG fails to repay those amounts. As of 31 December 2013 the above guarantee amounted to RR 50,830 (Euro 1,130 million). As of 31 December 2014 the debt liabilities were redeemed. Other The Group has transportation agreements with certain of its associated undertakings and joint ventures (see Note 36). Capital commitments The total investment program related to gas, oil and power assets for 2015 is RR 1,608 billion. Operating lease commitments As of 31 December 2014 the Group does not have significant liabilities related to operating leases. Supply commitments The Group has entered into long-term supply contracts for periods ranging from 5 to 20 years with various companies operating in Europe. The volumes and prices in these contracts are subject to change due to various contractually defined factors. As of 31 December 2014 no loss is expected to result from these long-term commitments. 38 OPERATING RISKS Operating environment The operations and earnings of the Group continue, from time to time and in varying degrees, to be affected by political, legislative, fiscal and regulatory developments, including those related to environmental protection, in the Russian Federation. Due to the capital-intensive nature of the industry, the Group is also subject to physical risks of various kinds. It is impossible to predict the nature and frequency of these developments and events associated with these risks as well as their effect on future operations and earnings of the Group. The future economic direction of the Russian Federation is largely dependent upon the world economic situation, effectiveness of economic, financial and monetary measures undertaken by the Government, together with tax, legal, regulatory, and political developments. Legal proceedings On 16 June 2014, OAO Gazprom submitted a request for arbitration to the Arbitration Institute of the Stockholm Chamber of Commerce, Sweden, against NAK Naftogaz Ukraine to recover more than USD 4,500 million unpaid debt for gas supplies and related interest charged. On 16 June 2014, NAK Naftogaz Ukraine submitted a request for arbitration to the Arbitration Institute of the Stockholm Chamber of Commerce against OAO Gazprom seeking a retroactive revision of the price, compensation of all overpaid amounts starting from 20 May 2011, which according to the claim amounted to not less than USD 6,000 million and cancellation of the contractual prohibition on reexport of natural gas. On 1 July 2014 OAO Gazprom and NAK Naftogaz Ukraine filed its responses to the requests of arbitration. On 21 July 2014, both cases were consolidated; oral hearings will start not earlier than in February-March On 13 October 2014 NAK Naftogaz Ukraine submitted a request for arbitration to the Arbitration Institute of the Stockholm Chamber of Commerce, Sweden, against OAO Gazprom, seeking (1) to acknowledge that rights and obligations of NAK Naftogaz Ukraine under Contract on volumes and terms of gas transportation contract through Ukraine in years should be transferred to PAO Ukrtransgaz; (2) to acknowledge that certain provisions of Contract, that will be subsequently updated, are invalid and/or inoperative and should be supplemented with or substituted by provisions that will be updated in line with the energy and anti- monopoly legislation of Ukraine and EU; (3) to oblige OAO Gazprom to pay a compensation of USD 3,200 million (and related interest) to NAK Naftogaz Ukraine for the failure to provide gas for transit; (4) to acknowledge that the transit tariff stipulated in Сontract should be revised in such a way as provided in further written statements of NAK Naftogaz Ukraine in line with key principles of the Swedish contractual law. The claim amounts to approximately USD 6,200 million. On 28 November 2014 OAO Gazprom filed its response to the request of arbitration. On 11 December 2014 the arbitration panel was formed. On 28 January 2015 the arbitration court made a decision not to combine the case with the above ones. Verbal hearing of the case is expected late September 2016 and decision of the arbitration panel is expected by the end of January
58 38 OPERATING RISKS (continued) The Group is also a party to certain other legal proceedings arising in the ordinary course of business and subject to various environmental laws regarding handling, storage, and disposal of certain products, regulation by various governmental authorities. Management believes, there are no such current legal proceedings or other claims outstanding which could have a material adverse effect on the results of operations or financial position of the Group. Sanctions In September 2014 the U.S., the EU and certain other countries imposed additional sanctions on the Russian energy sector that partially apply to the Group. The U.S. sanctions prohibit any U.S. person, and U.S. incorporated entities (including their foreign branches) or any person or entity in the United States from (1) transacting in, providing financing for, or otherwise dealing in new debt of longer than 90 days maturity for a number of Russian energy companies, including OAO Gazprom Neft, and (2) from providing, exporting, or reexporting, directly or indirectly, goods, services (except for financial services), or technology in support of exploration or production for deep water, Arctic offshore, or shale projects that have the potential to produce oil in the Russian Federation, or in maritime area claimed by the Russian Federation and extending from its territory to Russian companies, including OAO Gazprom and OAO Gazprom neft. These sanctions also apply to any entity if 50% or more of its capital is owned, directly or indirectly, separately or in the aggregate, by sanctioned entities. The EU sanctions prohibit (1) provision of drilling, well testing, logging and completion services and supply of specialized floating vessels necessary for deep water oil exploration and production, Arctic oil exploration and production, or shale oil projects in Russia, and (2) purchasing, selling, providing investment services for or assistance in the issuance of, or other dealings with transferable securities and money-market instruments with a maturity exceeding (a) 90 days issued after 1 August 2014 to 12 September 2014 or (b) 30 days, issued after 12 September 2014 by certain Russian companies such as OAO Gazprom neft (including subsidiaries of OAO Gazprom neft or any legal person, entity or body acting on behalf or at the direction of OAO Gazprom neft). Sanctions imposed by the EU also prohibit EU persons from directly or indirectly making or being part of any arrangement to make new loans or credit with a maturity exceeding 30 days to a number of Russian companies (including OAO Gazprom neft), after 12 September 2014 except for loans or credit that have a specific and documented objective to provide financing for non-prohibited imports or exports of goods and non-financial services between the EU and Russia or for loans that have a specific and documented objective to provide emergency funding to meet solvency and liquidity criteria for legal persons established in the EU, whose proprietary rights are owned for more than 50% by any entity referred to above. The Group continues to assess and monitor the impact of the ongoing sanctions but currently does not believe they have a significant impact on the financial position and results of operations of the Group. Taxation The tax, currency and customs legislation within the Russian Federation is subject to varying interpretations and frequent changes. As of 31 December 2014 interpretation of the relevant legislation is appropriate and all of the Group's tax, currency and customs positions will be sustainable. The Russian Law On Transfer pricing grants the right to a taxpayer to validate compliance with arm's length principle in respect of prices in controlled transactions through preparation of documentation for tax purposes. The management of the Group believes that the Group sets market prices in its transactions and internal controls procedures were introduced to comply with tax legislative requirements on transfer pricing. Currently the new regulation practice has not been established yet, consequences of the trials with tax authorities cannot be estimated reliably, however they can have significant impact on financial results and activities of the Group. The Controlled Foreign Company (CFC) rules introduce Russian taxation of profits of foreign companies and non-corporate structures (including trusts) controlled by Russian tax residents (controlling parties). Starting from 2015, CFC undistributed profits should be subject to a 20% tax rate. The management is aware about new legislation and is analyzing the impact on the Group and required actions. 56
59 38 OPERATING RISKS (continued) Group changes The Group is continuing to be subject to reform initiatives in the Russian Federation and in some of its export markets. The future direction and effects of any reforms are the subject of political considerations. Potential reforms in the structure of the Group, tariff setting policies, and other government initiatives could each have a significant, but undeterminable, effect on enterprises operating in the Group. Environmental matters The enforcement of environmental regulation in the Russian Federation is evolving and the enforcement posture of government authorities is continually being reconsidered. The Group periodically evaluates its obligations under environmental regulations. As obligations are determined, they are recognised immediately. Potential liabilities which might arise as a result of changes in existing regulations, civil litigation or legislation, cannot be reliably estimated, but could be material. In the current enforcement climate under existing legislation, the Group management believes that there are no significant liabilities for environmental damage, other than amounts that have been accrued in the consolidated financial statements. Social commitments The Group significantly contributes to the maintenance and upkeep of the local infrastructure and the welfare of its employees in the areas of its production operations mainly in the northern regions of the Russian Federation, including contributions toward the construction, development and maintenance of housing, hospitals, transport services, recreation and other social needs. 39 FINANCIAL RISK FACTORS The Group s activities expose it to a variety of financial risks: market risk (including currency risk, fair value interest rate risk, cash flow interest rate risk and price risk), credit risk and liquidity risk. The Group s overall risk management focuses on the unpredictability of financial markets and seeks to reduce potential adverse effects on the financial performance of the Group. Risks are managed centrally and to some extent at the level of subsidiaries in accordance with Group policies. Market risk Market risk is a risk that changes in market prices, such as foreign currency exchange rates, interest rates, commodity prices and prices of marketable securities, will affect the Group s financial results or the value of its holdings of financial instruments. 57
60 39 FINANCIAL RISK FACTORS (continued) Notes (a) Foreign exchange risk The Group operates internationally and is exposed to foreign exchange risk arising from various currency exposures primarily with respect to the US dollar and the Euro. Foreign exchange risk arises from assets, liabilities, commercial transactions and financing denominated in foreign currencies. The carrying amounts of the Group s financial instruments are denominated in the following currencies: 31 December 2014 Financial assets Russian Rouble US dollar Euro Other Total Current 8 Cash and cash equivalents 655, ,278 63,910 40,982 1,038,191 9 Short-term financial assets (excluding equity securities) 7, , Trade and other accounts receivable 331, , ,876 88, , Non-current Long-term accounts receivable (excluding prepayments) 170,652 2,914 6, ,250 Available-for-sale long-term financial assets (excluding equity securities) Total financial assets 1,165, , , ,910 2,141,389 Financial liabilities Current Accounts payable and accrued charges (excluding derivative financial instruments) 624, , ,432 48, ,771 Short-term borrowings, promissory notes and current portion of long-term borrowings 40, , , ,782 Non-current 21 Long-term borrowings and promissory notes 263,732 1,279, ,233 28,681 2,224,042 Total financial liabilities 929,592 1,688, ,394 77,386 3,685, December 2013 Financial assets Current 8 Cash and cash equivalents 511, ,980 24,857 10, ,130 9 Short-term financial assets (excluding equity securities) 7, , Trade and other accounts receivable 409, , ,792 65, , Non-current Long-term accounts receivable (excluding prepayments) 135,563 22, ,507 Available-for-sale long-term financial assets (excluding equity securities) Total financial assets 1,065, , ,176 77,079 1,782,669 Financial liabilities Current Accounts payable and accrued charges (excluding derivative financial instruments) 564, ,798 39,167 30, ,627 Short-term borrowings, promissory notes and current portion of long-term borrowings 71, ,812 93,242 1, ,926 Non-current 21 Long-term borrowings and promissory notes 199, , ,479 18,482 1,470,002 Total financial liabilities 835,549 1,038, ,888 50,200 2,551,555 See discussion of derivative financial instruments in Note 23. The Group manages its net exposure to foreign exchange risk by balancing both financial assets and financial liabilities denominated in selected foreign currencies. 58
61 39 FINANCIAL RISK FACTORS (continued) As of 31 December 2014, if the Russian Rouble had weakened by 20% against the US dollar with all other variables held constant, profit before profit tax would have been lower by RR 214,201, mainly as a result of foreign exchange losses on translation of US dollar-denominated borrowings partially offset by foreign exchange gains on translation of US dollar-denominated trade receivables. As of 31 December 2013, if the Russian Rouble had weakened by 10% against the US dollar with all other variables held constant, profit before profit tax would have been lower by RR 53,794, mainly as a result of foreign exchange losses on translation of US dollardenominated borrowings partially offset by foreign exchange gains on translation of US dollar-denominated trade receivables. The effect of related Russian Rouble strengthening against the US dollar would have been approximately the same amount with opposite impact. As of 31 December 2014, if the Russian Rouble had weakened by 20% against the Euro with all other variables held constant, profit before profit tax would have been lower by RR 152,332, mainly as a result of foreign exchange losses on translation of euro-denominated borrowings partially offset by foreign exchange gains on translation of euro-denominated trade receivables. As of 31 December 2013, if the Russian Rouble had weakened by 10% against the Euro with all other variables held constant, profit before profit tax would have been lower by RR 48,771, mainly as a result of foreign exchange losses on translation of euro-denominated borrowings partially offset by foreign exchange gains on translation of euro-denominated trade receivables. The effect of related Russian Rouble strengthening against the Euro would have been approximately the same amount with opposite impact. (b) Cash flow and fair value interest rate risk The Group is exposed to the effects of fluctuations in the prevailing levels of market interest rates on its financial position and cash flows. The Group s interest rate risk primarily arises from long-term borrowings. Borrowings issued at variable rates expose the Group to cash flow interest rate risk. Borrowings issued at fixed rates expose the Group to fair value interest rate risk. The table below summarises the balance between long-term borrowings at fixed and at variable interest rates: Long-term borrowings and promissory notes 31 December At fixed rate 2,044,351 1,427,690 At variable rate 591, ,653 2,635,904 1,762,343 The Group does not have a formal policy of determining how much the Group s exposure should be to fixed or variable rates. However, the Group performs periodic analysis of the current interest rate environment and depending on that analysis at the time of raising new debts management makes decisions whether obtaining financing on fixed-rate or variable-rate basis would be more beneficial to the Group over the expected period until maturity. During years ended 31 December 2014 and 2013 the Group s borrowings at variable rates were mainly denominated in US dollar and Euro. As of 31 December 2014, if benchmark interest rates on US dollar- and Euro-denominated borrowings at these dates had been 5% higher with all other variables held constant, profit before profit tax would have been lower by RR 29,578 for 2014, mainly as a result of higher interest expense on floating rate borrowings. As of 31 December 2013, if benchmark interest rates on US dollar- and Euro-denominated borrowings at these dates had been 2% higher with all other variables held constant, profit before profit tax would have been lower by RR 6,692 for 2013, mainly as a result of higher interest expense on floating rate borrowings. The effect of a corresponding decrease in benchmark interest rates is approximately equal and opposite. (c) Commodity price risk Commodity price risk is the risk or uncertainty arising from possible movements in prices for natural gas, crude oil and related products, and their impact on the Group s future performance and results of the Group s operations. A decline in the prices could result in a decrease in net income and cash flows. An extended period of low prices could precipitate a decrease in development activities and could cause a decrease in the volume of reserves available for transportation and processing through the Group s systems or facilities and ultimately impact the Group s ability to deliver under its contractual obligations. 59
62 39 FINANCIAL RISK FACTORS (continued) The Group s overall strategy in production and sales of natural gas, crude oil and related products is centrally managed. Substantially all the Group s natural gas, gas condensate and other hydrocarbon export sales to Europe and other countries are sold under long-term contracts. Natural gas export prices to Europe and other countries are generally based on a formula linked to oil product prices, which in turn are linked to crude oil prices. The Group s exposure to the commodity price risk is related essentially to the export market. As of 31 December 2014, if the average gas prices related to the export market had decreased by 10% with all other variables held constant, profit before profit tax would have been lower by RR 216,481 for As of 31 December 2013, if the average gas prices related to the export market had decreased by 10% with all other variables held constant, profit before profit tax would have been lower by RR 217,747 for The Russian gas tariffs are regulated by the Federal Tariffs Service and are as such less subject to significant price fluctuations. The Group assesses on regular basis the potential scenarios of future fluctuation in commodity prices and their impacts on operational and investment decisions. However, in the current environment management estimates may materially differ from actual future impact on the Group s financial position. (d) Securities price risk The Group is exposed to movements in the equity securities prices because of financial assets held by the Group and classified on the consolidated balance sheet either as available for sale or at fair value through profit or loss (see Notes 9 and 17). As of 31 December 2014 and 2013, if MICEX equity index, which affects the major part of Group s equity securities, had decreased by 20% with all other variables held constant, assuming the Group s equity instruments moved according to the historically high correlation with the index, Group s total comprehensive income for the year would have been RR 41,970 and RR 44,006 lower, respectively. The Group is also exposed to equity securities prices used to assess the fair value of pension plan assets held by NPF Gazfund (see Note 24). Credit risk Credit risk refers to the risk exposure that a potential financial loss to the Group may occur if a counterparty defaults on its contractual obligations. The maximum exposure to credit risk is the value of the assets which might be lost. Credit risk arises from cash and cash equivalents, derivative financial instruments and deposits with banks and financial institutions, as well as credit exposures to wholesale and retail customers, including outstanding receivables and committed transactions. Financial instruments, which potentially subject the Group to concentrations of credit risk, primarily consist of accounts receivable, including promissory notes. Credit risks related to accounts receivable are systematically monitored, taking into account customer s financial position, past experience and other factors. Management systematically reviews ageing analysis of receivables and uses this information for calculation of impairment provision (see Note 10). Credit risk exposure mainly depends on the individual characteristics of customers, more particularly customers default risk and country risk. Group operates with various customers and substantial part of sales relates to major customers. Although collection of accounts receivable could be influenced by economic factors affecting these customers, management believes there is no significant risk of loss to the Group beyond the provisions already recorded. Cash and cash equivalents are deposited only with banks that are considered by the Group to have a minimal risk of default. The Group s maximum exposure to credit risk is presented in the table below. 31 December Cash and cash equivalents 1,038, ,130 Debt securities 8,489 8,747 Long-term and short-term trade and other accounts receivable 1,096,276 1,087,242 Financial guarantees 276, ,043 Total maximum exposure to credit risk 2,419,713 1,986,162 60
63 39 FINANCIAL RISK FACTORS (continued) Liquidity risk Liquidity risk is the risk that the Group will not be able to meet its financial obligations as they fall due. Liquidity risk management implies maintaining sufficient cash and marketable securities, the availability of funding through an adequate amount of committed credit facilities. The Group liquidity is managed centrally. The management of the Group monitors the planned cash inflow and outflow. Important factor in the Group s liquidity risk management is an access to a wide range of funding through capital markets and banks. Management aims is to maintain flexibility in financing sources by having committed facilities available. The table below analyses the Group s financial liabilities into relevant maturity groupings based on the remaining period at the balance sheet date to the contractual maturity date. The amounts disclosed in the table are the contractual undiscounted cash flows. Balances due within 12 months equal their carrying balances as the impact of discounting is not significant. Less than 6 months Between 6 and 12 months Between 1 and 2 years Between 2 and 5 years Over 5 years As of 31 December 2014 Short-term and long-term loans and borrowings and promissory notes 304, , ,201 1,206,995 1,215,224 Accounts payable and accrued charges (excluding derivative financial instruments and provision under financial guarantees) 861,135 88, Derivative financial instruments: 46,478 20,342 31,589 34,201 1,829 including foreign currency hedge contracts 8,576 1,345 16,751 29,811 1,829 Financial guarantees 60,276 3,886 4,856 51, ,800 As of 31 December 2013 Short-term and long-term loans and borrowings and promissory notes 208, , , , ,962 Accounts payable and accrued charges (excluding derivative financial instruments) 596, , Derivative financial instruments: 7,102 3,259 3,540 3, including foreign currency hedge contracts , Financial guarantees 5,711 9,451 31,349 71,408 83,124 The Group s borrowing facilities do not usually include financial covenants which could trigger accelerated reimbursement of financing facilities. For those borrowing facilities where the Group has financial covenants, the Group is in compliance. Capital risk management The Group considers equity and debt to be the principal elements of capital management. The Group s objectives when managing capital are to safeguard the Group s position as a leading global energy company by further increasing the reliability of natural gas supplies and diversifying activities in the energy sector, both in the domestic and foreign markets. In order to maintain or adjust the capital structure, the Group may revise its investment program, attract new or repay existing loans and borrowings or sell certain non-core assets. The Group considers its target debt to equity ratio at the level of not more than 40%. On the Group level capital is monitored on the basis of the net debt to adjusted EBITDA ratio. This ratio is calculated as net debt divided by adjusted EBITDA. Net debt is calculated as total debt (short-term borrowings and current portion of long-term borrowings, short-term promissory notes payable, long-term borrowings, longterm promissory notes payable) less cash and cash equivalents and balances of cash and cash equivalents restricted as to withdrawal under the terms of certain borrowings and other contractual obligations. Adjusted EBITDA is calculated as operating profit less depreciation and less provision for impairment of assets and other provisions (excluding provisions for accounts receivable and prepayments). 61
64 39 FINANCIAL RISK FACTORS (continued) The net debt to adjusted EBITDA ratios at 31 December 2014 and 2013 were as follows: 31 December Total debt 2,688,824 1,801,928 Less: cash and cash equivalents (1,038,191) (689,130) Net debt 1,650,633 1,112,798 Adjusted EBITDA 1,962,558 2,009,475 Net debt/adjusted EBITDA ratio OAO Gazprom has an investment grade credit rating of BBB- (negative outlook) by Standard & Poor s and BBB (negative outlook) by Fitch Ratings as of 31 December FAIR VALUE MEASUREMENTS Notes The fair value of financial assets and liabilities is determined as follows: a) Financial instruments in Level 1 The fair value of financial instruments traded in active markets is based on quoted market closing prices at the reporting date. b) Financial instruments in Level 2 The fair value of financial instruments that are not traded in an active market is determined by using various valuation techniques, primarily based on market or income approach, such as discounted cash flows valuation method. These valuation techniques maximise the use of observable market data where it is available and rely as little as possible on Group specific estimates. If all significant inputs required to fair value an instrument are observable, the instrument is included in level 2. c) Financial instruments in Level 3 If one or more of the significant inputs in the valuation model used to fair value an instrument is not based on observable market data, the instrument is included in Level 3. Long-term accounts receivables are fair valued at Level 3 (see Note 16), long-term borrowings Level 2 (see Note 21). As of 31 December 2014 and 2013 the Group had the following assets and liabilities that are measured at fair value: Quoted price in an active market (Level 1) Valuation technique with inputs observable in markets (Level 2) 31 December 2014 Valuation technique with significant nonobservable inputs (Level 3) Total 9 Financial assets held for trading: Equity securities Bonds 6, ,498 Available-for-sale financial assets: Equity securities 2, ,863 Promissory notes - 1,154-1,154 Total short-term financial assets 9,581 1,154-10, Available-for-sale financial assets: Equity securities 139,108 55,155 6, ,987 Bonds Promissory notes Total available-for-sale long-term financial assets 139,218 55,882 6, , Derivative financial instruments 7,833 56, ,258 Total assets 156, ,514 7, , Derivative financial instruments 11, , ,439 Total liabilities 11, , ,439 62
65 40 FAIR VALUE MEASUREMENTS (continued) Notes Quoted price in an active market (Level 1) Valuation technique with inputs observable in markets (Level 2) 31 December 2013 Valuation technique with significant nonobservable inputs (Level 3) Total 9 Financial assets held for trading: Equity securities 2,200 14,474-16,674 Bonds 5, ,681 Available-for-sale financial assets: Promissory notes - 2,147-2,147 Total short-term financial assets 7,881 16,621-24, Available-for-sale financial assets: Equity securities 150,632 11,395 5, ,985 Bonds Promissory notes Total available-for-sale long-term financial assets 150,681 12,265 5, , Derivative financial instruments , ,643 Total assets 159,089 47,411 6, , Derivative financial instruments , ,807 Total liabilities , ,807 The derivatives include natural gas contracts and are categorised in levels 1, 2 and 3 of the fair value hierarchy. The contracts in level 1 are valued using active market price of identical assets and liabilities. Due to absence of quoted prices or other observable, market-corroborated data the contracts in level 2 are valued using internally developed models that include inputs such as quoted forward prices, time value, volatility factors, current market prices, contractual prices and expected volumes of the underlying instruments. Where necessary, the price curves are extrapolated to the expiry of the contracts using all available external pricing information, historic and longterm pricing relationships. These valuations are categorised in level 3. Foreign currency hedge contracts are categorised in level 2. The Group uses estimation of fair value of foreign currency hedge contracts prepared by independent financial institutes. Valuation results are regularly reviewed by the Group management. No significant ineffectiveness occurred during the reporting period. There were no transfers between Levels 1, 2 and 3 and changes in valuation techniques during the period. For the year ended 31 December 2014 and 2013 the Group has reclassified available-for-sale investments losses from other comprehensive income into the profit or loss in the amount of RR 4,489 and RR 1,492, respectively. Financial assets held for trading primarily comprise marketable equity and debt securities intended to generate short-term profits through trading. 41 OFFSETTING FINANCIAL ASSETS AND FINANCIAL LIABILITIES In connection with its derivative activities, the Group generally enters into master netting agreements and collateral agreements with its counterparties. These agreements provide the Group with the right to, in the event of a default by the counterparty (such as bankruptcy or a failure to pay or perform), net counterparty s rights and obligations under the agreement and to liquidate and set off collateral against any net amount owed by the counterparty. 63
66 41 OFFSETTING FINANCIAL ASSETS AND FINANCIAL LIABILITIES (continued) The following financial assets and liabilities are subject to offsetting, enforceable master netting agreements and similar agreements: 31 December 2014 Gross amounts before offsetting Amounts offset Net amounts after offsetting in the consolidated balance sheet Amounts subject to netting agreements Financial assets Long-term and short-term trade and other accounts receivable (excluding prepayments) 1,109,964 15,255 1,094,709 40,023 Derivative financial instruments 321, ,310 65,258 49,150 Financial liabilities Accounts payable and accrued charges (excluding derivative financial instruments) 1,012,026 15, ,771 40,023 Derivative financial instruments 390, , ,439 49, December 2013 Financial assets Long-term and short-term trade and other accounts receivable (excluding prepayments) 1,101,062 16,270 1,084,792 - Derivative financial instruments 58,998 39,355 19,643 30,942 Financial liabilities Accounts payable and accrued charges (excluding derivative financial instruments) 765,897 16, ,627 - Derivative financial instruments 57,162 39,355 17,807 30, POST BALANCE SHEET EVENTS Borrowings and loans In January 2015 the Group obtained a long-term loan from Intesa Sanpaolo S.P.A. bank in the amount of EUR 350 million at an interest rate of EURIBOR % due in In January and February 2015 the Group obtained long-term loans from OAO Sberbank of Russia in the amount of RR 10,000 and RR 2,500, respectively, at an interest rate of 13.48% due in In January and March 2015 the Group obtained loans from a consortium of banks in the amount of EUR 230 million and EUR 130 million at interest rates of EURIBOR + 1.3% and EURIBOR %, respectively, due in Deutsche Bank AG was appointed as bank agent. In March 2015 the Group obtained a long-term loan from OAO Sberbank of Russia in the amount of RR 12,500 at an interest rate of 13.58% due in In March 2015 the Group signed an agreement to obtain a long-term loan from PAO Promsvyazbank in the amount of USD 350 million at an interest rate of 5.4% due in In April 2015 the Group obtained a long-term loan from a consortium of banks in the amount of USD 500 million at an interest rate of LIBOR % due in JP Morgan Europe Limited was appointed as bank agent. Investigation of the European Commission In August 2012 the European Commission initiated an investigation into a potential breach of European Union antimonopoly law by OAO Gazprom. In April 2015 the European Commission adopted a Statement of Objections in the course of the ongoing antitrust investigation of OAO Gazprom activity in the European Union. The adoption of the Statement of Objections is just one of the stages of the antitrust investigation and does not imply holding OAO Gazprom liable for any violation of the European Union antitrust legislation. OAO Gazprom considers the claims brought by the European Commission to be unsubstantiated and expects the situation to be resolved in accordance with the agreement reached earlier between the Government of the Russian Federation and the European Commission. 64
67 INVESTORS RELATIONS The Company may be contacted at its registered office: OAO Gazprom Nametkina St., 16 V-420, GSP-7, , Moscow Russia Telephone: (7 495) Facsimile: (7 495) , (in Russian) (in English)


68
OAO GAZPROM IFRS CONSOLIDATED FINANCIAL STATEMENTS 31 DECEMBER 2013
 IFRS CONSOLIDATED FINANCIAL STATEMENTS 31 DECEMBER 2013 Independent Auditor s Report To the Shareholders and Board of Directors of OAO Gazprom We have audited the accompanying consolidated financial statements
OAO GAZPROM IFRS CONSOLIDATED FINANCIAL STATEMENTS 31 DECEMBER 2010
 IFRS CONSOLIDATED FINANCIAL STATEMENTS 31 DECEMBER 2010 1 NATURE OF OPERATIONS OAO Gazprom and its subsidiaries (the Group ) operate one of the largest gas pipeline systems in the world and are responsible
IFRS CONSOLIDATED FINANCIAL STATEMENTS
 IFRS CONSOLIDATED FINANCIAL STATEMENTS Moscow 2016 Contents Auditor s Report... 3 Consolidated balance sheet... 5 Consolidated statement of comprehensive income... 6 Consolidated statement of cash flows...
OAO GAZPROM IFRS CONSOLIDATED FINANCIAL STATEMENTS 31 DECEMBER 2008
 IFRS CONSOLIDATED FINANCIAL STATEMENTS 31 DECEMBER 2008 INDEPENDENT AUDITOR'S REPORT ZAO PricewaterhouseCoopers Audit Kosmodamianskaya Nab. 52, Bld. 5 1 15054 Moscow Russia Telephone +7 (495) 967 6000
IFRS Consolidated Financial Statements with Independent Auditor s Report
 IFRS Consolidated Financial Statements with Independent Auditor s Report 2017 Moscow 2018 Contents Independent Auditor s Report... 3 Consolidated balance sheet... 8 Consolidated statement of comprehensive
OAO GAZPROM IFRS CONSOLIDATED FINANCIAL STATEMENTS 31 DECEMBER 2004
 IFRS CONSOLIDATED FINANCIAL STATEMENTS 31 DECEMBER 2004 ZAO PricewaterhouseCoopers Audit Kosmodamianskaya Nab. 52, Bld. 5 115054 Moscow Russia Telephone +7 (095) 967 6000 Facsimile +7 (095) 967 6001 AUDITORS
OAO SIBUR Holding. International Financial Reporting Standards Consolidated Financial Statements and Independent Auditor s Report.
 OAO SIBUR Holding International Financial Reporting Standards Consolidated Financial Statements and Independent Auditor s Report 31 December 2013 IFRS CONSOLIDATED STATEMENT OF PROFIT OR LOSS (In millions
PAO TMK Consolidated Financial Statements Year ended December 31, 2016
 Consolidated Financial Statements Consolidated Financial Statements Contents Independent auditor s report...3 Consolidated Income Statement...8 Consolidated Statement of Comprehensive Income...9 Consolidated
IFRS CONSOLIDATED FINANCIAL STATEMENTS WITH INDEPENDENT AUDITOR S REPORT
 IFRS CONSOLIDATED FINANCIAL STATEMENTS WITH INDEPENDENT AUDITOR S REPORT 2016 Moscow 2017 Contents Independent Auditor s Report... 3 Consolidated balance sheet... 10 Consolidated statement of comprehensive
9. Share-Based Payments Jointly Controlled Entities Other Operating Income Other Operating Expense 130
 92 Financial Report Detailed contents: Consolidated financial statements Consolidated Income Statement for the year ended 31 December Consolidated Statement of Comprehensive Income for the year ended 31
PAO SIBUR Holding. International Financial Reporting Standards Consolidated Financial Statements and Independent Auditor s Report.
 PAO SIBUR Holding International Financial Reporting Standards Consolidated Financial Statements and Independent Auditor s Report 31 December 2017 Table of Contents Independent Auditor s Report IFRS Consolidated
PAO TMK Consolidated Financial Statements Year ended December 31, 2017
 Consolidated Financial Statements Consolidated Financial Statements Contents Independent auditor s report...3 Consolidated Income Statement...8 Consolidated Statement of Comprehensive Income...9 Consolidated
KuibyshevAzot Group. International Financial Reporting Standards Consolidated financial statements and Independent auditors report
 International Financial Reporting Standards Consolidated financial statements and Independent auditors report 31 December 2011 Consolidated financial statements and auditors report 31 December 2011 Contents
Financial review Refresco Financial review 2017
 Financial review 2017 Financial review 2017 Financial review 2017 1 69 Consolidated income statement For the year ended December 31, 2017 (x 1 million euro) Note December 31, 2017 December 31, 2016 Revenue
AVTOVAZ GROUP INTERNATIONAL FINANCIAL REPORTING STANDARDS CONSOLIDATED FINANCIAL STATEMENTS AND INDEPENDENT AUDITORS REPORT
 INTERNATIONAL FINANCIAL REPORTING STANDARDS CONSOLIDATED FINANCIAL STATEMENTS AND INDEPENDENT AUDITORS REPORT Consolidated Financial Statements and Independent Auditors Report Contents Section page number
International Financial Reporting Standards Consolidated Financial Statements and Auditors Report
 JSC Chelyabinsk Zinc Plant International Financial Reporting Standards Consolidated Financial Statements and Auditors Report For the years ended 31 December 2005, 2004 and 2003 Contents STATEMENT OF MANAGEMENT
INTERNATIONAL FINANCIAL REPORTING STANDARDS INTERIM CONDENSED FINANCIAL INFORMATION (UNAUDITED)
") INTERNATIONAL FINANCIAL REPORTING STANDARDS INTERIM CONDENSED FINANCIAL INFORMATION (UNAUDITED) 30 September 2016 Москва 2016 Contents REPORT ON REVIEW 2 STATEMENT OF FINANCIAL POSITION 4 STATEMENT OF
INTERNATIONAL FINANCIAL REPORTING STANDARDS INTERIM CONDENSED FINANCIAL INFORMATION (UNAUDITED) 30 September 2016 Москва 2016 Contents REPORT ON REVIEW 2 STATEMENT OF FINANCIAL POSITION 4 STATEMENT OF
JOINT STOCK COMPANY ACRON. International Accounting Standard No. 34 Consolidated Condensed Interim Financial Information (six months) 30 June 2012
 30 June 2012") JOINT STOCK COMPANY ACRON International Accounting Standard No. 34 Consolidated Condensed Interim Financial Information (six months) 30 June 2012 Contents Unaudited Consolidated Condensed Interim Statement
JOINT STOCK COMPANY ACRON International Accounting Standard No. 34 Consolidated Condensed Interim Financial Information (six months) 30 June 2012 Contents Unaudited Consolidated Condensed Interim Statement
May & Baker Nig Plc RC. UNAUDITED CONSOLIDATED FINANCIAL STATEMENTS 31 MARCH 2017
 ` May & Baker Nig Plc RC. 558 UNAUDITED CONSOLIDATED FINANCIAL STATEMENTS 31 MARCH 2017 UNAUDITED CONSOLIDATED STATEMENT OF PROFIT OR LOSS AND OTHER COMPREHENSIVE INCOME Note Continuing operations Revenue
SAUDI ARAMCO TOTAL REFINING & PETROCHEMICAL COMPANY (SATORP) (A Saudi Arabian Mixed Limited Liability Company)
 (A Saudi Arabian Mixed Limited Liability Company)") SAUDI ARAMCO TOTAL REFINING & PETROCHEMICAL COMPANY (SATORP) CONSOLIDATED FINANCIAL STATEMENTS FOR THE YEAR ENDED 31 DECEMBER 2017 AND INDEPENDENT AUDITOR S REPORT CONSOLIDATED FINANCIAL STATEMENTS FOR
SAUDI ARAMCO TOTAL REFINING & PETROCHEMICAL COMPANY (SATORP) CONSOLIDATED FINANCIAL STATEMENTS FOR THE YEAR ENDED 31 DECEMBER 2017 AND INDEPENDENT AUDITOR S REPORT CONSOLIDATED FINANCIAL STATEMENTS FOR
BLUESCOPE STEEL LIMITED FINANCIAL REPORT 2011/2012
 BLUESCOPE STEEL LIMITED FINANCIAL REPORT / ABN 16 000 011 058 Annual Financial Report - Page Financial statements Statement of comprehensive income 2 Statement of financial position 3 Statement of changes
TNK-BP INTERNATIONAL LIMITED CONSOLIDATED FINANCIAL STATEMENTS AS OF AND FOR THE YEARS ENDED 31 DECEMBER 2012 AND 31 DECEMBER 2011
 CONSOLIDATED FINANCIAL STATEMENTS AS OF AND FOR THE YEARS ENDED 31 DECEMBER 2012 AND 31 DECEMBER 2011 Consolidated Income Statement and Statement of Comprehensive Income (expressed in millions of USD)
OAO GAZPROM IFRS CONSOLIDATED INTERIM CONDENSED FINANCIAL INFORMATION (UNAUDITED) 31 MARCH 20X0
 31 MARCH 20X0") IFRS CONSOLIDATED INTERIM CONDENSED FINANCIAL INFORMATION (UNAUDITED) 31 MARCH 20X0 PNCB/VAFERHOUSEQOPERS ZAO PricewaterhouseCoopers Audit White Square Office Center 10 Butyrsky Val Moscow, Russia, 125047
IFRS CONSOLIDATED INTERIM CONDENSED FINANCIAL INFORMATION (UNAUDITED) 31 MARCH 20X0 PNCB/VAFERHOUSEQOPERS ZAO PricewaterhouseCoopers Audit White Square Office Center 10 Butyrsky Val Moscow, Russia, 125047
OAO GAZPROM IAS CONSOLIDATED FINANCIAL STATEMENTS 31 DECEMBER 1998
 IAS CONSOLIDATED FINANCIAL STATEMENTS 31 DECEMBER 1998 AUDITORS REPORT To the Shareholders of OAO Gazprom 1. We have audited the accompanying consolidated balance sheet of OAO Gazprom and its subsidiaries
OJSC SEVERNEFTEGAZPROM INTERNATIONAL FINANCIAL REPORTING STANDARDS INTERIM CONDENSED FINANCIAL INFORMATION (UNAUDITED)
") INTERNATIONAL FINANCIAL REPORTING STANDARDS INTERIM CONDENSED FINANCIAL INFORMATION (UNAUDITED) 30 JUNE 2018 Contents INTERIM CONDENSED STATEMENT OF FINANCIAL POSITION... 3 INTERIM CONDENSED STATEMENT
INTERNATIONAL FINANCIAL REPORTING STANDARDS INTERIM CONDENSED FINANCIAL INFORMATION (UNAUDITED) 30 JUNE 2018 Contents INTERIM CONDENSED STATEMENT OF FINANCIAL POSITION... 3 INTERIM CONDENSED STATEMENT
The notes on pages 7 to 59 are an integral part of these consolidated financial statements
 CONSOLIDATED BALANCE SHEET As at 31 December Restated Restated Notes 2013 $'000 $'000 $'000 ASSETS Non-current Assets Investment properties 6 68,000 68,000 - Property, plant and equipment 7 302,970 268,342
(Continued) ~3~ March 31, 2017 December 31, 2016 March 31, 2016 Assets Notes AMOUNT % AMOUNT % AMOUNT % Current assets
 ~3~ March 31, 2017 December 31, 2016 March 31, 2016 Assets Notes AMOUNT % AMOUNT % AMOUNT % Current assets") Current assets DAVICOM SEMICONDUCTOR, INC. AND SUBSIDIARIES CONSOLIDATED BALANCE SHEETS (Expressed in thousands of New Taiwan dollars) (The consolidated balance sheets as of March 31,2017 and 2016 are
Current assets DAVICOM SEMICONDUCTOR, INC. AND SUBSIDIARIES CONSOLIDATED BALANCE SHEETS (Expressed in thousands of New Taiwan dollars) (The consolidated balance sheets as of March 31,2017 and 2016 are
TECO IMAGE SYSTEMS CO., LTD. AND SUBSIDIARIES CONSOLIDATED FINANCIAL STATEMENTS AND REVIEW REPORT OF INDEPENDENT ACCOUNTANTS JUNE 30, 2016 AND 2015
 TECO IMAGE SYSTEMS CO., LTD. AND SUBSIDIARIES CONSOLIDATED FINANCIAL STATEMENTS AND REVIEW REPORT OF INDEPENDENT ACCOUNTANTS JUNE 30, 2016 AND 2015 -----------------------------------------------------------------------------------------------------------------------------
BlueScope Financial Report 2013/14
 BlueScope Financial Report /14 ABN 16 000 011 058 Annual Financial Report - Page Financial statements Statement of comprehensive income 2 Statement of financial position 4 Statement of changes in equity
ZAO Raspadskaya Consolidated Financial Statements. Years ended December 31, 2005, 2004 and 2003 with Report of Independent Auditors
 Consolidated Financial Statements Years ended December 31, 2005, 2004 and 2003 with Report of Independent Auditors Consolidated Financial Statements Years ended December 31, 2005, 2004 and 2003 Contents
Interpretations effective in the year ended 28 February 2009 Standards and interpretations not yet effective
 Accounting Policies Interpretations effective in the year ended 28 February 2009 IFRS 7 Financial instruments: disclosures. This amendment introduces new disclosures relating to financial instruments and
Consolidated Financial Statements and Independent Auditor s Report
 Consolidated Financial Statements and Independent Auditor s Report For the year ended 31 March, 2018 Daiichi Sankyo Company, Limited Contents Page 1) Consolidated Statement of Financial Position 1 2) Consolidated
MOSENERGO GROUP IFRS CONSOLIDATED INTERIM FINANCIAL STATEMENTS (UNAUDITED)
") IFRS CONSOLIDATED INTERIM FINANCIAL STATEMENTS (UNAUDITED) 2017 Moscow 2017 1 Contents Consolidated interim balance sheet...... 3 Consolidated interim statement of comprehensive income...... 4 Consolidated
IFRS CONSOLIDATED INTERIM FINANCIAL STATEMENTS (UNAUDITED) 2017 Moscow 2017 1 Contents Consolidated interim balance sheet...... 3 Consolidated interim statement of comprehensive income...... 4 Consolidated
Consolidated Financial Statements December 31, 2017 and 2016 and report of independent auditor
 Consolidated Financial Statements December 31, 2017 and 2016 and report of independent auditor Contents Consolidated financial statements Consolidated balance sheet... 5 Consolidated statements of income
YIOULA GLASSWORKS S.A. AND SUBSIDIARIES NOTES TO THE CONSOLIDATED FINANCIAL STATEMENTS SEPTEMBER 30, 2012
 1. CORPORATE INFORMATION: Yioula Glassworks S.A., a corporation formed under the laws of the Hellenic Republic (also known as Greece), οn August 5, 1959, by Messrs Kyriacos and Ioannis Voulgarakis is the
GLAXOSMITHKLINE CONSUMER NIGERIA PLC ANNUAL REPORT AND FINANCIAL STATEMENTS FOR THE PERIOD ENDED 30 SEPTEMBER, 2015
 GLAXOSMITHKLINE CONSUMER NIGERIA PLC ANNUAL REPORT AND FINANCIAL STATEMENTS FOR THE PERIOD ENDED 30 SEPTEMBER, Statements of comprehensive income Note N'000 N'000 N'000 N'000 N'000 N'000 Revenue 4 23,040,004
OAO GAZ. Consolidated Financial Statements
 Consolidated Financial Statements for the year ended 31 December 2012 Contents Auditors Report 3 Consolidated Statement of Comprehensive Income 5 Consolidated Statement of Financial Position 7 Consolidated
Investment property ,979 Other non-current assets 9 581, ,316 17,347,934 17,117,859 Total assets 26,282,313 24,971,082 Liabilities
 Separate Statements of Financial Position (in millions of Korean won) Assets Current assets Cash and cash equivalents 4,5,36 913,208 1,298,349 Financial deposits 4,5,36 65,000 65,000 Trade receivables
PJSC LUKOIL CONSOLIDATED FINANCIAL STATEMENTS
 CONSOLIDATED FINANCIAL STATEMENTS 31 December 2017 Consolidated Statement of Financial Position (Millions of Russian rubles) Assets 31 December 31 December Note Current assets Cash and cash equivalents
SMP Bank (OJSC) Consolidated Financial Statements for the year ended 31 December 2011
 Consolidated Financial Statements for the year ended 31 December 2011") Consolidated Financial Statements for the year ended 31 December 2011 Contents Independent Auditors Report... 3 Consolidated statement of comprehensive income... 4 Consolidated statement of financial position...
Consolidated Financial Statements for the year ended 31 December 2011 Contents Independent Auditors Report... 3 Consolidated statement of comprehensive income... 4 Consolidated statement of financial position...
Accounting policies extracted from the 2016 annual consolidated financial statements
 Steinhoff International Holdings N.V. (Steinhoff N.V.) is a Netherlands registered company with tax residency in South Africa. The consolidated annual financial statements of Steinhoff N.V. for the period
Notes to the consolidated financial statements
 Notes to the consolidated financial statements Overview Strategy Performance Sustainable Business Model Corporate governance Financial statements 1. Group organisation Givaudan SA and its subsidiaries
Gazprom Neft Group. Consolidated Financial Statements
 Consolidated Financial Statements Consolidated Financial Statements Contents Consolidated Statement of Financial Position 2 Consolidated Statement of Profit and Loss and Other Comprehensive Income 3 Consolidated
Notes to the financial statements
 1 General information ( the Company ) is incorporated in Hong Kong and its shares are listed on The Stock Exchange of Hong Kong Limited. The address of the Company s registered office and principal place
NASCON ALLIED INDUSTRIES PLC. Unaudited Financial Statements
 Unaudited Financial Statements Unaudited Financial Statements CONTENTS PAGE Statement of Profit or Loss and Other Comprehensive income 2 Statement of Financial Position 3 Statement of Changes in Equity
Consolidated Financial Statements and Independent Auditor s Report
 Consolidated Financial Statements and Independent Auditor s Report For the year ended 31 March, 2017 Daiichi Sankyo Company, Limited Contents Page 1) Consolidated Statement of Financial Position 1 2) Consolidated
Nigerian Breweries Plc RC: 613
 RC: 613 Contents Page Statement of financial position 2 Statement of comprehensive income 4 Statement of changes in equity 5 Statement of cash flows 6 Notes to the financial statements 8 1 Statement of
Notes to the accounts for the year ended 31 December 2012
 1 General information ( the Company ) is incorporated in Hong Kong and its shares are listed on The Stock Exchange of Hong Kong Limited. The address of the Company s registered office and principal place
OAO Scientific Production Corporation Irkut
 Consolidated Financial Statements for the year ended 31 December 2011 Consolidated Financial Statements for the year ended 31 December 2011 Contents Independent Auditors Report 3 Consolidated Income Statement
Urals Energy Public Company Limited. Consolidated Financial Statements As of and for the Year Ended 31 December 2015
 Consolidated Financial Statements As of and for the Year Ended 31 December 2015 Consolidated Financial Statements CONTENTS Independent Auditor s Report 2-3 Consolidated Statement of Financial Position
NASCON ALLIED INDUSTRIES PLC. Financial Statements
 Financial Statements Financial Statements CONTENTS PAGE Statement of profit or loss and other comprehensive income 2 Statement of financial position 3 Statement of changes in equity 4 Statement of cash
NOTES TO THE GROUP ANNUAL FINANCIAL STATEMENTS FOR THE YEAR ENDED 30 SEPTEMBER 2014
 14 NOTES TO THE GROUP ANNUAL FINANCIAL STATEMENTS 1. ACCOUNTING POLICIES The financial statements are presented in South African Rand, unless otherwise stated, rounded to the nearest million, which is
NASCON ALLIED INDUSTRIES PLC. Unaudited Financial Statements
 Unaudited Financial Statements Unaudited Financial Statements CONTENTS PAGE Statement of Profit or Loss and Other Comprehensive Income 2 Statement of Financial Position 3 Statement of Changes in Equity
ACCOUNTING POLICIES 1 PRESENTATION OF FINANCIAL STATEMENTS. for the year ended 30 June BASIS OF PREPARATION 1.2 STATEMENT OF COMPLIANCE
 14 MURRAY & ROBERTS ANNUAL FINANCIAL STATEMENTS 15 ACCOUNTING POLICIES for the year ended 30 June 2015 1 PRESENTATION OF FINANCIAL STATEMENTS 1.1 BASIS OF PREPARATION These consolidated and separate financial
Notes To The Financial Statements For the year ended 31 December 2014
 1. Corporate information Ornapaper Berhad is a public limited liability company, incorporated and domiciled in Malaysia, and is listed on the Main Market of Bursa Malaysia Securities Berhad. The principal
Vitafoam Nigeria Plc. Consolidated and Separate financial statements Year ended 30 September 2014
 . Year ended 30 September 2014 Table of Contents Statement of Directors Responsibilities... i Report of the independent auditors... 1 & Statement of Profit or Loss and other Comprehensive Income... 2 &
Group Income Statement For the year ended 31 March 2015
 Income Statement For the year ended 31 March Note Pre exceptionals Restated Exceptionals (note 11) Pre exceptionals Exceptionals (note 11) Continuing operations Revenue 5 10,606,080 10,606,080 11,044,763
OAO Silvinit. Consolidated Financial Statements for the year ended 31 December 2010
 Consolidated Financial Statements for the year ended 31 December 2010 Contents Independent Auditors Report 3 Consolidated Statement of Comprehensive Income 4 Consolidated Statement of Financial Position
Suntory Holdings Limited and its Subsidiaries
 Suntory Holdings Limited and its Subsidiaries Consolidated Financial Statements for the Year Ended December 31, 2017, and Independent Auditor's Report Consolidated statement of financial position Suntory
AVTOVAZ GROUP INTERNATIONAL FINANCIAL REPORTING STANDARDS CONSOLIDATED FINANCIAL STATEMENTS AND INDEPENDENT AUDITORS REPORT
 INTERNATIONAL FINANCIAL REPORTING STANDARDS CONSOLIDATED FINANCIAL STATEMENTS AND INDEPENDENT AUDITORS REPORT Consolidated Financial Statements and Independent Auditors Report Contents Section page number
JAMAICAN TEAS LIMITED CONSOLIDATED FINANCIAL STATEMENTS 30 SEPTEMBER 2017
 CONSOLIDATED FINANCIAL STATEMENTS CONSOLIDATED FINANCIAL STATEMENTS I N D E X PAGE Independent Auditors' Report to the Members 1-4 FINANCIAL STATEMENTS Consolidated Statement of Profit or Loss and Other
GASUM CONSOLIDATED (IFRS) FINANCIAL STATEMENTS 2013
 FINANCIAL STATEMENTS 2013") GASUM CONSOLIDATED (IFRS) FINANCIAL STATEMENTS 2013 Cleanly with natural energy gases USE TRANSMISSION AND DISTRIBUTION LNG PRODUCTION, SOURCING AND SALES CONTENTS CONTENTS... 2 CONSOLIDATED STATEMENT
GASUM CONSOLIDATED (IFRS) FINANCIAL STATEMENTS 2013 Cleanly with natural energy gases USE TRANSMISSION AND DISTRIBUTION LNG PRODUCTION, SOURCING AND SALES CONTENTS CONTENTS... 2 CONSOLIDATED STATEMENT
TECO IMAGE SYSTEMS CO., LTD. AND SUBSIDIARIES CONSOLIDATED FINANCIAL STATEMENTS AND REVIEW REPORT OF INDEPENDENT ACCOUNTANTS JUNE 30, 2017 AND 2016
 TECO IMAGE SYSTEMS CO., LTD. AND SUBSIDIARIES CONSOLIDATED FINANCIAL STATEMENTS AND REVIEW REPORT OF INDEPENDENT ACCOUNTANTS JUNE 30, 2017 AND 2016 -----------------------------------------------------------------------------------------------------------------------------
These financial statements are presented in US dollars since that is the currency in which the majority of the group s transactions are denominated.
 ACCOUNTING POLICIES 51 General information Premier Oil plc is a limited company incorporated in Scotland and listed on the London Stock Exchange. The address of the registered office is Premier Oil plc,
Consolidated Financial Statements Summary and Notes
 Consolidated Financial Statements Summary and Notes Contents Consolidated Financial Statements Summary Consolidated Statement of Total Comprehensive Income 57 Consolidated Statement of Financial Position
 - CONSOLIDATED STATEMENT OF PROFIT OR LOSS AND OTHER COMPREHENSIVE INCOME Note 2015 2014 US$ 000s US$ 000s (Restated) Continuing operations Lease revenue 56,932 48,691 Other income 9 3,202 3,435 60,134
BANCA INTESA (CLOSED JOINT-STOCK COMPANY) Consolidated financial statements. Year ended 31 December 2013 Together with Auditors report
 Consolidated financial statements. Year ended 31 December 2013 Together with Auditors report") BANCA INTESA (CLOSED JOINT-STOCK COMPANY) Consolidated financial statements Year ended 31 December 2013 Together with Auditors report BANCA INTESA (CLOSED JOINT-STOCK COMPANY) 2013 Consolidated financial
BANCA INTESA (CLOSED JOINT-STOCK COMPANY) Consolidated financial statements Year ended 31 December 2013 Together with Auditors report BANCA INTESA (CLOSED JOINT-STOCK COMPANY) 2013 Consolidated financial
Accounting policies. 1. Introduction. 2. Basis of presentation. 3. Consolidation
 2 202 FirstRand Group annual financial statements Accounting policies 1. Introduction FirstRand Limited ( the Group ) is an integrated financial services company consisting of banking, insurance and asset
CREDIT BANK OF MOSCOW. Consolidated Financial Statements for the year ended 31 December 2009
 Consolidated Financial Statements Contents Independent Auditors Report... 3 Consolidated Statement of Comprehensive Income... 4 Consolidated Statement of Financial Position... 5 Consolidated Statement
Unaudited consolidated interim financial statements and independent auditor s review report BORETS INTERNATIONAL LIMITED 30 June 2015
 Unaudited consolidated interim financial statements and independent auditor s review report BORETS INTERNATIONAL LIMITED 30 June 2015 Contents Independent Auditor s Review Report Unaudited Consolidated
NOTES TO THE FINANCIAL STATEMENTS for the financial year ended 31 December 2009
 32 KLW HOLDINGS LIMITED ANNUAL REPORT 2009 1 GENERAL INFORMATION The financial statements of the Group and of the Company were authorised for issue in accordance with a resolution of the directors on the
TABLE OF CONTENTS. Financial Review 71
 TABLE OF CONTENTS Financial Review 71 Consolidated Financial Statements 74 Consolidated Income Statement for the Year Ended 31 December 74 Consolidated Statement of Comprehensive Income for the Year Ended
Principal Accounting Policies
 1. Basis of Preparation The accounts have been prepared in accordance with Hong Kong Financial Reporting Standards ( HKFRS ). The accounts have been prepared under the historical cost convention as modified
ACERINOX, S.A. AND SUBSIDIARIES. 31 December 2015
 ACERINOX, S.A. AND SUBSIDIARIES Annual Accounts of the Consolidated Group 31 December 2015 (Free translation from the original in Spanish. In the event of discrepancy, the Spanishlanguage version prevails.)
Joint Stock Company Nordea Bank. International Financial Reporting Standards Consolidated Financial Statements and Independent Auditors Report
 Joint Stock Company Nordea Bank International Financial Reporting Standards Consolidated Financial Statements and Independent Auditors Report 31 December 2015 CONTENTS AUDITORS REPORT CONSOLIDATED FINANCIAL
2.4 SUMMARY OF SIGNIFICANT ACCOUNTING POLICIES
 Franshion Properties (China) Limited Annual Report 2013 175 2.4 SUMMARY OF SIGNIFICANT ACCOUNTING POLICIES Subsidiaries A subsidiary is an entity (including a structured entity), directly or indirectly,
KUWAIT FINANCE HOUSE K.S.C.P. AND SUBSIDIARIES
 KUWAIT FINANCE HOUSE K.S.C.P. AND SUBSIDIARIES CONSOLIDATED FINANCIAL STATEMENTS 31 DECEMBER 2015 CONSOLIDATED STATEMENT OF INCOME Year ended 31 December 2015 Notes INCOME Financing income 663,423 645,801
CENTER-INVEST BANK GROUP
 CENTER-INVEST BANK GROUP International Financial Reporting Standards Consolidated Financial Statements and Independent Auditor's Report 31 December 2013 CONTENTS INDEPENDENT AUDITOR S REPORT CONSOLIDATED
 11 Consolidated Statement of Profit or Loss and Other Comprehensive Income Year ended Notes 2017 2016 $ 000 $ 000 Revenue 19 16,513,084 15,780,756 Earnings before interest, depreciation, amortisation,
MAY & BAKER NIGERIA PLC CONSOLIDATED FINANCIAL STATEMENTS 31 DECEMBER 2013
 ` MAY & BAKER NIGERIA PLC CONSOLIDATED FINANCIAL STATEMENTS 31 DECEMBER 2013 REPORT OF THE INDEPENDENT AUDITORS TO THE MEMBERS OF MAY & BAKER NIGERIA PLC ` We have audited the accompanying consolidated
CENTER-INVEST BANK GROUP
 CENTER-INVEST BANK GROUP International Financial Reporting Standards Consolidated Financial Statements and Independent Auditor s Report 31 December 2014 CONTENTS INDEPENDENT AUDITOR S REPORT CONSOLIDATED
Financial statements. The University of Newcastle. newcastle.edu.au F1. 52 The University of Newcastle, Australia
 Financial statements The University of Newcastle 52 The University of Newcastle, Australia newcastle.edu.au F1 Contents Income statement................. 54 Statement of comprehensive income..... 55 Statement
OIL AND GAS DEVELOPMENT COMPANY LIMITED BALANCE SHEET AS AT 30 JUNE 2013
 BALANCE SHEET AS AT 30 JUNE 2013 Note Note SHARE CAPITAL AND RESERVES NON CURRENT ASSETS Fixed assets Share capital 4 43,009,284 43,009,284 Property, plant and equipment 12 52,605,226 40,966,441 Development
ACCOUNTING POLICIES. for the year ended 30 June MURRAY & ROBERTS ANNUAL FINANCIAL STATEMENTS 13
 12 MURRAY & ROBERTS ANNUAL FINANCIAL STATEMENTS 13 ACCOUNTING POLICIES for the year ended 30 June 2013 1 PRESENTATION OF FINANCIAL STATEMENTS These accounting policies are consistent with the previous
Západoslovenská energetika, a.s.
 Západoslovenská energetika, a.s. Independent Auditor s Report and Consolidated Financial Statements for the year ended 31 December 2015 prepared in accordance with International Financial Reporting Standards
Consolidated Financial Statements
 Consolidated Financial Statements Years ended March 31, 2018 and 2017 Consolidated Statement of Financial Position Sumitomo Chemical Company, Limited and Consolidated Subsidiaries March 31, 2018, 2017
STATEMENT OF COMPREHENSIVE INCOME
 FINANCIAL REPORT STATEMENT OF COMPREHENSIVE INCOME for the year ended 30 June 2014 Notes $ 000 $ 000 Revenue Sale of goods 2 697,319 639,644 Services 2 134,776 130,182 Other 5 1,500 1,216 833,595 771,042
Consolidated income statement For the year ended 31 December 2014
 Petrofac Annual report and accounts Consolidated income statement For the year ended 31 December Notes *Business performance Exceptional items and certain re-measurements Revenue 4a 6,241 6,241 6,329 Cost
Firm Transgarant LLC. Consolidated Financial Statements for the year ended 31 December 2012
 Consolidated Financial Statements for the year ended 31 December 2012 Contents Auditors Report 3 Consolidated Statement of Financial Position 5 Consolidated Statement of Comprehensive Income 6 Consolidated
Group accounting policies
 81 Group accounting policies BASIS OF ACCOUNTING AND REPORTING The consolidated financial statements as set out on pages 92 to 151 have been prepared on the historical cost basis except for certain financial
Commercial Bank J.P. Morgan Bank International (Limited Liability Company) International Financial Reporting Standards Financial Statements and
 International Financial Reporting Standards Financial Statements and") Commercial Bank J.P. Morgan Bank International (Limited Liability Company) International Financial Reporting Standards Financial Statements and Independent Auditor s Report 31 December 2014 CONTENTS INDEPENDENT
Commercial Bank J.P. Morgan Bank International (Limited Liability Company) International Financial Reporting Standards Financial Statements and Independent Auditor s Report 31 December 2014 CONTENTS INDEPENDENT
PJSC Enel Russia Consolidated financial statements. For the year ended 31 December 2016 with independent auditor s report
 Consolidated financial statements 31 December 2016 with independent auditor s report Consolidated financial statements 31 December 2016 Contents Independent auditor s report... 3 Consolidated statement
Linamar Corporation December 31, 2012 and December 31, 2011 (in thousands of dollars)
") CONSOLIDATED FINANCIAL STATEMENTS Linamar Corporation, and, (in thousands of dollars) 1 MANAGEMENT S RESPONSIBILITY FOR THE CONSOLIDATED FINANCIAL STATEMENTS The management of Linamar Corporation is responsible
CONSOLIDATED FINANCIAL STATEMENTS Linamar Corporation, and, (in thousands of dollars) 1 MANAGEMENT S RESPONSIBILITY FOR THE CONSOLIDATED FINANCIAL STATEMENTS The management of Linamar Corporation is responsible
PJSC PIK Group Consolidated Financial Statements for 2015 and Auditors Report
 Consolidated Financial Statements for 2015 and Auditors Report Contents Consolidated Statement of Financial Position 3 Consolidated Statement of Profit or Loss and Other Comprehensive Income 4 Consolidated
22/F, CITIC Tower 1TimMeiAvenue Central, Hong Kong. 16 December The Directors Kingbo Strike Limited. Grand Vinco Capital Limited.
 The following is the text of a report on Kingbo Strike Limited, prepared for the purpose of incorporation in this prospectus received from the reporting accountants of the Company, Ernst & Young, Certified
FInAnCIAl StAteMentS
 Financial STATEMENTS The University of Newcastle ABN 157 365 767 35 Contents 106 Income statement 107 Statement of comprehensive income 108 Statement of financial position 109 Statement of changes in equity
Financial statements 08: Notes to the consolidated. financial statements. Norsk Hydro ASA Notes to the financial statements
 FINANCIAL STATEMENTS Index F1 08: Financial statements Financial statements Consolidated financial statements Consolidated income statements Consolidated statements of comprehensive income Consolidated
INTELLIEPI INC. (CAYMAN) AND SUBSIDIARIES CONSOLIDATED FINANCIAL STATEMENTS AND REPORT OF INDEPENDENT ACCOUNTANTS DECEMBER 31, 2016 AND 2015
 AND SUBSIDIARIES CONSOLIDATED FINANCIAL STATEMENTS AND REPORT OF INDEPENDENT ACCOUNTANTS DECEMBER 31, 2016 AND 2015") INTELLIEPI INC. (CAYMAN) AND SUBSIDIARIES CONSOLIDATED FINANCIAL STATEMENTS AND REPORT OF INDEPENDENT ACCOUNTANTS DECEMBER 31, 2016 AND 2015 ---------------------------------------------------------------------------------------------------------
INTELLIEPI INC. (CAYMAN) AND SUBSIDIARIES CONSOLIDATED FINANCIAL STATEMENTS AND REPORT OF INDEPENDENT ACCOUNTANTS DECEMBER 31, 2016 AND 2015 ---------------------------------------------------------------------------------------------------------
Financial statements. The University of Newcastle newcastle.edu.au F1
 Financial statements The University of Newcastle newcastle.edu.au F1 Income statement For the year ended 31 December Consolidated Parent Revenue from continuing operations Australian Government financial
SENAO NETWORKS, INC. AND SUBSIDIARIES
 SENAO NETWORKS, INC. AND SUBSIDIARIES CONSOLIDATED FINANCIAL STATEMENTS AND REVIEW REPORT OF INDEPENDENT ACCOUNTANTS SEPTEMBER 30, 2015 AND 2014 ------------------------------------------------------------------------------------------------------------------------------------