OLED Investor Presentation
|
|
|
- Kerry Morris
- 6 years ago
- Views:
Transcription
1 OLED Investor Presentation
2 Forward-Looking Statements All statements in this document that are not historical, such as those relating to Universal Display Corporation s technologies and potential applications of those technologies, the Company s expected results as well as the growth of the OLED market and the Company s opportunities in that market, are forward-looking statements within the meaning of the Private Securities Litigation Reform Act of You are cautioned not to place undue reliance on any forward-looking statements in this document, as they reflect Universal Display Corporation s current views with respect to future events and are subject to risks and uncertainties that could cause actual results to differ materially from those contemplated. These risks and uncertainties are discussed in greater detail in Universal Display Corporation s periodic reports on Form 10-K and Form 10-Q filed with the Securities and Exchange Commission, including, in particular, the section entitled Risk Factors in Universal Display Corporation s annual report on Form 10-K for the year ended December 31, Universal Display Corporation disclaims any obligation to update any forward-looking statement contained in this document. 2


3 Who We Are Critical OLED Innovator & Enabler Fabless OLED IP Licensor & Material Supplier Proprietary PHOLEDs 4,500+ Global Patents* *4500+ Pending and Issued Patents Worldwide as of October 26,


4 What is an OLED? 30-40nm An Organic Light Emitting Diode is a series of organic thin films between two conductors When electrical current is applied, bright light is emitted OLEDs can be used for displays and lighting OLEDs are not just thin and efficient - they can also be made flexible and transparent 4
5 Business Model Revenues License & Royalty Fees OLED Enabler Patent Licensing Innovation & Invention Device & Architecture IP Material Sales PHOLED Emitters & Hosts Composition of Matter IP 5
6 $ billions AMOLED Display Market Potential $60 $54 $48 $42 Mobile Growth Tablet /PC Growth TV Growth Mobile TV Tablet / PC Other $52.1 $47.9 $41.3 $36 $30 $24 $24.0 $33.2 $18 $12 $6 $0 $15.8 $12.4 $ M* 257M* 391M* 430M* 572M* 683M* 768M* 821M* *Unit Numbers are for mobile phones only Source: IHS OLED Display Market Tracker Q
7 millions of square meters OLED Panel Area Demand Mobile Growth IT/Wearables Growth TV Growth 16 Mobile Phone OLED TV Wearables/Mobile PC Other AMOLED Source: IHS OLED Display Market Tracker Q


8 Lower Power Usage Superior Aesthetics More Cost Effective Strong OLED Display Market Drivers RED Phosphorescence reduces power consumption by 25% Add GREEN: 45% cumulative reduction Add BLUE: 75% cumulative reduction Enabled by PHOLEDs Improved image quality Thin and Light 180 degree viewing angle 2,000,000+: 1 contrast ratio TRUE BLACK Real-time video speeds excellent for 3D Self-emissive display Low UV output Flexible Fewer manufacturing process steps Lower bill-ofmaterials No backlight required No color filter required No liquid crystal required Reduced driver IC costs Enables non-glass substrates 8


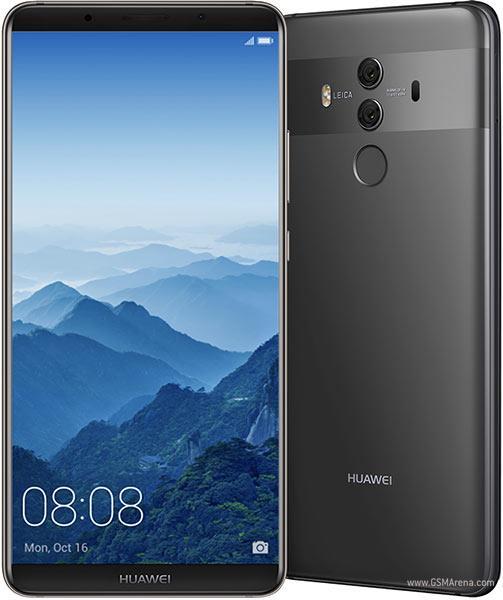


9 New OLED Smartphones LG V30 Huawei Mate 10 Pro Motorola Moto Z2 Force Edition Apple iphone X Google Pixel 2 XL Samsung Galaxy Note8 Meizu Pro 7 Oppo R11 OnePlus 5 Gionee M7 vivo X20 Hisense A2 Pro 9


10 More OLED Products Huawei Watch 2 Dell Alienware 13 (2017) Samsung Galaxy Book LG - 65 Wallpaper OLED TV Lenovo ThinkPad X1 Yoga (OLED) Sony PlayStation VR Porsche Mission E Car Panasonic EZ1002 4K OLED TV Oculus Rift Galaxy Gear Series LG Watch Style Apple Watch 10

 Better Performance, More Efficient Thinner and")
11 LCD vs. OLED Backlight Unit Diffuser Sheet TFT Cell Polarized Film TFT+OLED+Refiner Polarized Film Polarized Film Prism Color Filter Lower BOM (bill of materials) Better Performance, More Efficient Thinner and Flexible Form Factor Vivid Colors and Superior Contrast Ratio Image source: LG 11


12 Energy-efficient & environmentally friendly Highly desirable color quality Novel form factor & Low Cost Potential Strong OLED Lighting Market Drivers Low drive voltage Low operating temperatures, cool to touch Long lifetime Easy to control Wide range of CCT, high CRI possible Color tunable Instant ON, Dimmable without flicker No glare, no noise Low UV content Thin and lightweight Transparent Non-breakable, Conformable, Flexible, Foldable, Rollable Scaling advantage Roll to roll process Image source: LG Display 12


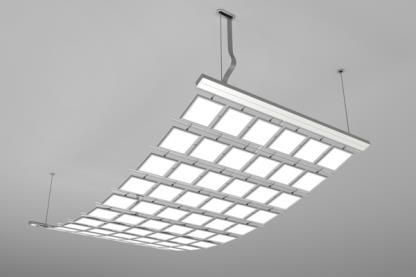


13 OLED Lighting Around the World Today PEW * *Now 13


14 Ink Jet Innovation: Future Revenue Streams Barrier Encapsulation Nozzle Liquid Solution Printing P2OLED Organic Vapor Jet Printing (OVJP) Barrier Encapsulation 14


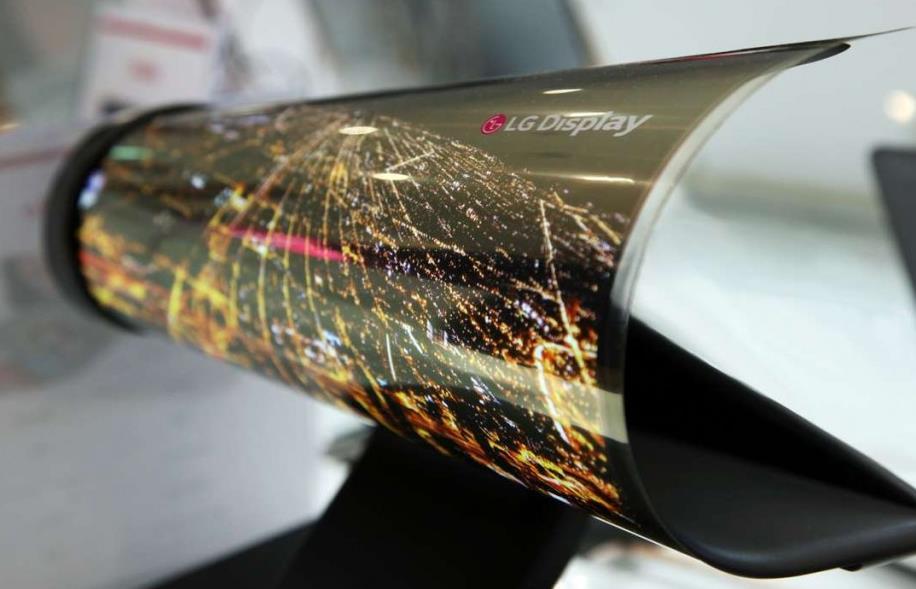
15 Future Growth: Flexible Unbreakable Lighter Thinner New Form Factors 15

16 Strong, Broad and Deep Patent Portfolio Printable Phosphorescent OLEDs Device Architectures Lighting Encapsulation Light Out- Coupling Flexible OLEDs Manufacturing Processes & Equipment Phosphorescent OLEDs (PHOLEDs) 16
 Taiwan (I-250 / P-103) 3,033 patents issued (I) + 1,553 patents pending (P) For a total of 4,586 (I & P)* *as of October 26, 2017 17")
17 Patents are Universal United States (I-999 / P-432) Europe (I-554 / P-190) China (I-249 / P-179) South Korea (I-235 / P-354) Japan (I-725 / P-184) Taiwan (I-250 / P-103) 3,033 patents issued (I) + 1,553 patents pending (P) For a total of 4,586 (I & P)* *as of October 26,


18 Strategic Relationships with Blue Chip Partners Display Lighting 18

19 Historical Financial Performance Revenues $191.0 $191.0 $198.9 ($ in millions) Income $45.5** $44.8** $48.1 $146.6 $32.6* $83.2 $61.3 $9.7 $ Hosts $11.2 $6.0 $34.2 $41.3 $12.5 $1.4 Royalty & License $15.3 $31.7 $47.0 $63.2 $77.8 $96.1 Emitters $26.2 $38.4 $61.6 $85.6 $100.6 $ *adjusted net income; 2013 included $41.4M net benefit from release of income tax valuation allowances of $59.4M and deferred income tax expense of $17.9M; GAAP net income was $74.1M **adjusted net income; excludes inventory write-down and its related impact on our effective tax rate see "Reconciliation of Non-GAAP Measures" for further discussion of these non-gaap measures on slide 20 and our Form 10-K for the year ended Dec. 31,
20 Reconciliation of non-gaap measures The following table details our reconciliation of non-gaap measures to the most directly comparable GAAP measures: (in thousands, except per share data) Year Ended December 31, (Unaudited) Operating Results: Net income (loss) $ 14,678 $ 41,854 $ 74,052 Non-GAAP Reconciling Items: Inventory write-down 33,000 3,918 Tax impact of inventory write-down (2,836) (251) Deferred income tax expense 17,934 Release of income tax valuation allowances (59,352) Total non-gaap reconciling items (30,164) (41,418) Non-GAAP Measures: Adjusted net income $ 44,842*** $ 45,521*** $ 32,634 Adjusted net income per common share, basic $ 0.96* $ 0.98* $ 0.71* Adjusted net income per common share, diluted $ 0.94* $ 0.98* $ 0.70** * The adjusted net income per common share, basic and diluted is derived from dividing adjusted net income by the number of weighted average shares used in computing basic and diluted net income per common share. ** The adjusted net income per common share, diluted for the year ended December 31, 2013, is derived from dividing adjusted net income by adjusted weighted average shares of 46,582,347, which excludes the amount of any excess tax benefits in assumed proceeds in calculating the weighted average shares using the treasury stock method. The exclusion is intended to present our diluted net income per common share for the year ended December 31, 2013 as if our assessment of the future realizability of our deferred tax assets did not change and the income tax valuation allowances were not reversed, consistent with prior periods. For the year ended December 31, 2014, there is no difference between net income per common share and adjusted net income per common share. *** Adjusted net income assumes an effective tax rate of 32% and 29% for the years ended December 31, 2015 and 2014, respectively and is based on excluding the impact of the inventory write down Non-GAAP Measures - To supplement our selected financial data presented in accordance with U.S. generally accepted accounting principles (GAAP), we use certain non-gaap measures. These non-gaap measures include adjusted net income (loss), adjusted net income (loss) per common share, basic and adjusted income (loss) per common share, diluted. Reconciliation to the nearest GAAP measures of all non-gaap measures included in the presentation can be found within the tables detailing the reconciliation of non-gaap measures to GAAP measures above. We have provided these non-gaap measures to enhance investors' overall understanding of our current financial performance, and as a means to evaluate period-to-period comparisons. We believe that these non- GAAP measures provide meaningful supplemental information regarding our financial performance by excluding the effect of the release of income tax valuation allowances that may not be indicative of recurring core business operating results. We believe that the non-gaap measures that exclude the impact of the release of income tax valuation allowances and deferred income tax expense recognized after the release of the allowances, when viewed with GAAP results, enhance the comparability or results against prior periods and allow for greater transparency of financial results. The presentation of non-gaap measures is not intended to be considered in isolation or as a substitute for, or superior to, the financial information prepared and presented in accordance with GAAP. 20
21 Robust Capital Structure ($ in thousands) Cash, Cash Equivalents and Investments September 30, 2017 $380,229 Total Assets $727,170 Long-term Debt A/P and Accrued Liab. $34,474 Deferred Revenue $36,261 Shareholders Equity $623,010 Total Shares Outstanding* 46,871,720 *Weighted average diluted shares used in computing net income (loss) per common share 21
22 Company Summary Global OLED Materials & Technology Leader Strong Financial Performance Lighting up the OLED Revolution License & Sell Proprietary Phosphorescent OLED Technology and Materials to Display & Solid- State Lighting Manufacturers Fabless Model; Partnering w/ PPG ~211 Employees (144 R&D, 72 PhDs); Largest Global PHOLED Team Blue-Chip Customer Base Displays: Samsung, LG Display, BOE, Tianma, AUO, EDO, JDI Lighting: Kaneka, Konica Minolta, LG Display, Lumiotec, OLEDWorks, OSRAM, Sumitomo Chemical Working with over 25 Companies. OLED Leader Leading Customers Strong Financials Robust IP $380M Cash, no debt* ~$8.10 in cash/share* High Margin Business Lean Operating Model *as of Sept. 30, 2017 Comprehensive & Robust IP Largest Phosphorescent OLED (PHOLED) Technology & Materials Portfolio Over 4,500** Issued & Pending Patents Worldwide and Growing **as of Oct. 27,
OLED Investor Presentation
 OLED Investor Presentation Forward-Looking Statements All statements in this document that are not historical, such as those relating to Universal Display Corporation s technologies and potential applications
OLED Investor Presentation
 OLED Investor Presentation Forward-Looking Statements All statements in this document that are not historical, such as those relating to Universal Display Corporation s technologies and potential applications
Universal Display Corporation Announces First Quarter 2018 Financial Results
 5/3/2018 Universal Display Corporation Announces First Quarter 2018 Financial Results EWING, N.J.--(BUSINESS WIRE)-- Universal Display Corporation (Nasdaq: OLED), enabling energy-efficient displays and
Universal Display Corporation Announces Third Quarter 2017 Financial Results
 11/2/2017 Universal Display Corporation Announces Third Quarter 2017 Financial Results EWING, N.J.--(BUSINESS WIRE)-- Universal Display Corporation (Nasdaq: OLED), enabling energy-efficient displays and
TO OUR SHAREHOLDERS: on a $15 million manufacturing expansion phase with our partner, PPG Industries. We further strengthened our compe ve role as a
 2016AnnualReport TOOURSHAREHOLDERS: TheadoponofOLEDdisplaysconnuestogrowacrossacolorful arrayofbright,beauful,thinconsumerproducts.in2016,oled penetraonofthesmartphonemarketreachedapproximately 25%,andOLEDTVshipmentsmorethandoubledtoapproximately
James P. Clappin President, Corning Glass Technologies
 James P. Clappin President, Corning Glass Technologies Investor Meeting February 8, 2013 Forward Looking and Cautionary Statements Certain statements in this presentation constitute forward looking statements
Company Presentation 3Q11
 Company Presentation 3Q11 Safe Harbor Statement Statements in this presentation that are not strictly historical, including the statements regarding the market, economy, the Company s epaper, LCD and other
FPD Overview. November 6 th, 2017 Gil Oron, Corporate Vice President
 FPD Overview November 6 th, 2017 Gil Oron, Corporate Vice President Forward-Looking Statements The matters discussed in this presentation are forward-looking statements within the meaning of the U.S. Private
Edwards Lifesciences Corporation Unaudited Consolidated Statements of Operations
 Unaudited Consolidated Statements of Operations Three Months Ended March 31, (in millions, except per share data) 2003 2002 Net sales $212.5 $162.3 Cost of goods sold 89.1 69.1 Gross profit 123.4 93.2
Shaping the Future of Electronics
 Shaping the Future of Electronics Asher Levy, CEO New York, NY November 6 th, 2017 Forward-Looking Statements The matters discussed in this presentation are forward-looking statements within the meaning
UNIVERSAL DISPLAY CORPORATION (Exact name of registrant as specified in its charter)
") UNITED STATES SECURITIES AND EXCHANGE COMMISSION Washington, D.C. 20549 FORM 10-Q (Mark One) QUARTERLY REPORT PURSUANT TO SECTION 13 OR 15(d) OF THE SECURITIES EXCHANGE ACT OF 1934 For the quarterly period
UNITED STATES SECURITIES AND EXCHANGE COMMISSION Washington, D.C. 20549 FORM 10-Q (Mark One) QUARTERLY REPORT PURSUANT TO SECTION 13 OR 15(d) OF THE SECURITIES EXCHANGE ACT OF 1934 For the quarterly period
Himax Technologies, Inc. Reports Fourth Quarter and Full Year 2012 Financial Results
 Reports Fourth Quarter and Full Year 2012 Financial Results Company Meets Fourth Quarter and Full Year 2012 Revenues, Gross Margin and EPS Guidance Sales increased 12.7% year over year to $190.6 million
Merchant Photomask Leader. Photronics, Inc. Jefferies 2017 Technology Conference May 9, 2017
 Merchant Photomask Leader Photronics, Inc. Jefferies 2017 Technology Conference May 9, 2017 Safe Harbor Statement This presentation and some of our comments may contain projections or other forward-looking
The Leader in Photonics
 The Leader in Photonics August 2015 Forward-Looking Statements & Non-GAAP Measurement Forward-Looking Statements The statements in this presentation that relate to guidance, projections, future plans,
All amounts are presented on the basis of Generally Accepted Accounting Principles in the U.S. ( U.S. GAAP ).
.") News & Information 1-7-1 Konan, Minato-ku Tokyo 108-0075 Japan No. 13-145E 3:00 P.M. JST, October 31, 2013 Consolidated Financial Results for the Second Quarter Ended September 30, 2013 Tokyo, October
News & Information 1-7-1 Konan, Minato-ku Tokyo 108-0075 Japan No. 13-145E 3:00 P.M. JST, October 31, 2013 Consolidated Financial Results for the Second Quarter Ended September 30, 2013 Tokyo, October
Exceeded revenue guidance. Strong margin expansion. Merger update. Page 3. Auto, mobile and telecom exceeded expectations
 October 23, 2013 Page 1 Statements in this release that are not historical are forward-looking and are subject to various risks and uncertainties that could cause actual results to vary materially from
Fiscal Year ending March 31, 2014 Third Quarter Consolidated Financial Results
 January 30, 2014 Fiscal Year ending March 31, 2014 Third Quarter Consolidated Financial Results Nine months: April 1, 2013 December 31, 2013 Konica Minolta, Inc. Stock exchange listings: Tokyo (First Sections)
Investor Conference 2013/ 05/ 14
 Investor Conference 2013/ 05/ 14 Safe Harbor Statement Statements in this presentation that are not strictly historical, including the statements regarding the market, economy, the Company s epaper, LCD
FAIR ISAAC CORPORATION CONDENSED CONSOLIDATED BALANCE SHEETS (In thousands) (Unaudited)
 (Unaudited)") CONDENSED CONSOLIDATED BALANCE SHEETS (In thousands) March 31, September 30, 2016 2015 ASSETS: Current assets: Cash and cash equivalents $ 85,374 $ 86,120 Accounts receivable, net 155,207 158,773 Prepaid
CONDENSED CONSOLIDATED BALANCE SHEETS (In thousands) March 31, September 30, 2016 2015 ASSETS: Current assets: Cash and cash equivalents $ 85,374 $ 86,120 Accounts receivable, net 155,207 158,773 Prepaid
NASDAQ Global Select: IIVI 2014 INVEST Pennsylvania Equity Conference
 A Global Leader in Engineered Materials & Opto-electronic Components NASDAQ Global Select: IIVI 2014 INVEST Pennsylvania Equity Conference Richard P. Figel, Director of Financial Reporting and Taxation
FAIR ISAAC CORPORATION CONDENSED CONSOLIDATED BALANCE SHEETS (In thousands) (Unaudited)
 (Unaudited)") CONDENSED CONSOLIDATED BALANCE SHEETS (In thousands) June 30, September 30, 2016 2015 ASSETS: Current assets: Cash and cash equivalents $ 118,155 $ 86,120 Accounts receivable, net 155,196 158,773 Prepaid
CONDENSED CONSOLIDATED BALANCE SHEETS (In thousands) June 30, September 30, 2016 2015 ASSETS: Current assets: Cash and cash equivalents $ 118,155 $ 86,120 Accounts receivable, net 155,196 158,773 Prepaid
APPLIED MATERIALS DELIVERS STRONG THIRD QUARTER RESULTS
 Howard Clabo (editorial/media) 408.748.5775 Michael Sullivan (financial community) 408.986.7977 APPLIED MATERIALS DELIVERS STRONG THIRD QUARTER RESULTS sales of $2.79 billion, up 11 percent year over year
Q Results. May 2015
 Q1 2015 Results May 2015 Safe Harbor Forward-Looking Statements. Our presentation today, including the slides contained herein, contains "forwardlooking statements" within the meaning of the Private Securities
Motorola Mobility Announces Second-Quarter Financial Results
 Motorola Mobility Announces Second-Quarter Financial Results Second Quarter Financial Highlights Net revenues of $3.3 billion, up 28 percent from second quarter 2010 GAAP net loss of $0.19 per share compared
Q Results. November 2014
 Q3 2014 Results November 2014 Safe Harbor Forward-Looking Statements. Our presentation today, including the slides contained herein, contains "forwardlooking statements" within the meaning of the Private
Motorola Mobility Announces First-Quarter Financial Results
 Motorola Mobility Announces First-Quarter Financial First Quarter Financial Highlights Net revenues of $3.0 billion, up 22 percent from first quarter 2010 GAAP net loss of $0.27 per share compared to $0.72
Fiscal Year ending March 31, 2014 Second Quarter Consolidated Financial Results
 October 31, 2013 Fiscal Year ending March 31, 2014 Second Quarter Consolidated Financial Results Six months: April 1, 2013 September 30, 2013 Konica Minolta, Inc. Stock exchange listings: Tokyo (First
No E 3:00 P.M. JST, July 29, 2010
 News & Information 1-7-1 Konan, Minato-ku Tokyo 108-0075 Japan Consolidated Financial Results for the First Quarter Ended June 30, No.10-096E 3:00 P.M. JST, July 29, Tokyo, July 29, -- Sony Corporation
Asia Display EQUITIES ELECTRONIC EQUIPMENT. Micro-LED the next generation display technology
 Asia Display EQUITIES ELECTRONIC EQUIPMENT Micro-LED the next generation display technology Asia Developed by Apple, micro-led offers superb image quality at a fraction of the power consumption; production
FAIR ISAAC CORPORATION CONDENSED CONSOLIDATED BALANCE SHEETS (In thousands) (Unaudited)
 (Unaudited)") CONDENSED CONSOLIDATED BALANCE SHEETS (In thousands) June 30, September 30, 2018 2017 ASSETS: Current assets: Cash and cash equivalents $ 119,929 $ 105,618 Accounts receivable, net 182,419 168,586 Prepaid
CONDENSED CONSOLIDATED BALANCE SHEETS (In thousands) June 30, September 30, 2018 2017 ASSETS: Current assets: Cash and cash equivalents $ 119,929 $ 105,618 Accounts receivable, net 182,419 168,586 Prepaid
FAIR ISAAC CORPORATION CONDENSED CONSOLIDATED BALANCE SHEETS (In thousands) (Unaudited)
 (Unaudited)") CONDENSED CONSOLIDATED BALANCE SHEETS (In thousands) 2018 2017 ASSETS: Current assets: Cash and cash equivalents $ 90,023 $ 105,618 Accounts receivable, net 208,865 168,586 Prepaid expenses and other current
CONDENSED CONSOLIDATED BALANCE SHEETS (In thousands) 2018 2017 ASSETS: Current assets: Cash and cash equivalents $ 90,023 $ 105,618 Accounts receivable, net 208,865 168,586 Prepaid expenses and other current
scr.zacks.com 10 S. Riverside Plaza, Suite 1600, Chicago, IL (OIIM-NASDAQ) OUTLOOK ZACKS ESTIMATES
 OUTLOOK ZACKS ESTIMATES") Small-Cap Research April 30, 2014 Lisa Thompson 312-265-9154 lthompson@zacks.com scr.zacks.com 10 S. Riverside Plaza, Suite 1600, Chicago, IL 60606 O 2 Micro International Ltd (OIIM-NASDAQ) OIIM: Undervalued
Small-Cap Research April 30, 2014 Lisa Thompson 312-265-9154 lthompson@zacks.com scr.zacks.com 10 S. Riverside Plaza, Suite 1600, Chicago, IL 60606 O 2 Micro International Ltd (OIIM-NASDAQ) OIIM: Undervalued
Quarterly Financial Statements for the Third Quarter Ended December 31, 2017 And Outlook for the Fiscal Year Ending March 31, 2018
 Quarterly Financial Statements for the Third Quarter Ended December 31, 2017 And Outlook for the Fiscal Year Ending March 31, 2018 February 2, 2018 Sony Corporation Quarterly Financial Statements (Unaudited)
News & Information. Consolidated Financial Results for the Second Quarter Ended September 30, No E 3:00 P.M. JST, October 29, 2010
 News & Information 1-7-1 Konan, Minato-ku Tokyo 108-0075 Japan No.10-148E 3:00 P.M. JST, October 29, Consolidated Financial Results for the Second Quarter Ended September 30, Tokyo, October 29, -- Sony
Safe Harbor Statement
 1 November 19, 2014 Safe Harbor Statement Forward-Looking Statements. Our presentation today, including the slides contained herein, contains "forward-looking statements" within the meaning of the Private
Quarterly Financial Statements for the First Quarter Ended June 30, 2018 And Outlook for the Fiscal Year Ending March 31, 2019
 Quarterly Financial Statements for the First Quarter Ended June 30, 2018 And Outlook for the Fiscal Year Ending March 31, 2019 July 31, 2018 Sony Corporation Quarterly Financial Statements (Unaudited)
Amkor Technology, Inc. Investor Presentation
 Amkor Technology, Inc. Investor Presentation May 2013 Enabling a Microelectronic World Disclaimer Forward-Looking Statement Disclaimer All information and other statements contained in this presentation,
Investor Presentation
 Investor Presentation (NASDAQ: TRIP) Q3 2012 Safe Harbor Statement Forward-Looking Statements. Our presentation today, including the slides contained herein, contains "forward-looking statements" within
Diversified global provider of leading engineered technologies to the energy, environmental, and industrial markets
 Diversified global provider of leading engineered technologies to the energy, environmental, and industrial markets Notes to Investors Forward-Looking Statements and Non-GAAP Information Any statements
Multi-Fineline Electronix, Inc. JANUARY 2016
 Multi-Fineline Electronix, Inc. JANUARY 2016 Forward-Looking Language Statement This includes forward-looking statements that involve risks and uncertainties. These forward-looking statements include,
(Billions of yen, millions of U.S. dollars, except per share amounts) Second quarter ended September 30 Change in
 Second quarter ended September 30 Change in") News & Information 6-7-35 Kitashinagawa Shinagawa-ku Tokyo 141-0001 Japan 1 No: 06--101E 3:00 P.M. JST, October 26, Consolidated Financial Results for the Second Quarter Ended September 30, Tokyo, October
News & Information 6-7-35 Kitashinagawa Shinagawa-ku Tokyo 141-0001 Japan 1 No: 06--101E 3:00 P.M. JST, October 26, Consolidated Financial Results for the Second Quarter Ended September 30, Tokyo, October
Investor Update. February 24, 2017
 Investor Update February 24, 2017 comscore, Inc. Proprietary. 1 Cautionary Statement During this presentation, we make certain forward-looking statements concerning plans and expectations for comscore,
FINANCIAL RESULTS FOR THE THIRD QUARTER AND THE NINE-MONTH PERIOD ENDED DECEMBER 31, 2000
 News & Information 6-7-35 Kitashinagawa Shinagawa-ku Tokyo 141-0001 Japan No: 01-004E Date: January 25, 2001 FINANCIAL RESULTS FOR THE THIRD QUARTER AND THE NINE-MONTH PERIOD ENDED DECEMBER 31, 2000 FOR
Roper Technologies, Inc. EPG Annual Spring Conference
 Roper Technologies, Inc. EPG Annual Spring Conference May 21, 2018 Safe Harbor Statement The information provided in this presentation contains forward-looking statements within the meaning of the federal
VARITRONIX INTERNATIONAL LIMITED (Incorporated in Bermuda with limited liability) (Stock Code: 710)
 (Stock Code: 710)") THIS CIRCULAR IS IMPORTANT AND REQUIRES YOUR IMMEDIATE ATTENTION If you are in any doubt as to any aspect of this circular or as to the action you should take, you should consult your stockbroker or other
THIS CIRCULAR IS IMPORTANT AND REQUIRES YOUR IMMEDIATE ATTENTION If you are in any doubt as to any aspect of this circular or as to the action you should take, you should consult your stockbroker or other
Q2 FY2014 Consolidated Financial Results
 Q2 FY214 Consolidated Financial Results (Three months ended September 3, 214) Sony Corporation Q2 FY214 Consolidated Results and FY214 Consolidated Results Forecast Segments Outlook 1 Q2 FY214 Consolidated
TC TECH Sweden AB (publ) Interim Report March
 Interim Report March") TC TECH Sweden AB (publ) Interim Report March 31 Net sales amounted to 0 (3 141) TSEK in the first quarter of. Net profit/loss totalled 2 648 (4 472) TSEK in the first quarter of. Cash flow from operating
TC TECH Sweden AB (publ) Interim Report March 31 Net sales amounted to 0 (3 141) TSEK in the first quarter of. Net profit/loss totalled 2 648 (4 472) TSEK in the first quarter of. Cash flow from operating
Quarterly Financial Statements for the Second Quarter Ended September 30, 2018 And Outlook for the Fiscal Year Ending March 31, 2019
 Quarterly Financial Statements for the Second Quarter Ended September 30, 2018 And Outlook for the Fiscal Year Ending March 31, 2019 October 30, 2018 Sony Corporation Quarterly Financial Statements (Unaudited)
(NASDAQ: HIMX) Himax Technologies. Bullish. Investment Highlights
 Himax Technologies. Bullish. Investment Highlights") (NASDAQ: HIMX) Bullish Overview Recent Price $8.63 52 Week Range $4.76 - $16.15 1 Month Range $8.07 - $12.19 Avg Daily Volume 6606645.0 PE Ratio 25.36 Earnings Per Share Year EPS 2014(E) $0.36 Capitalization
(NASDAQ: HIMX) Bullish Overview Recent Price $8.63 52 Week Range $4.76 - $16.15 1 Month Range $8.07 - $12.19 Avg Daily Volume 6606645.0 PE Ratio 25.36 Earnings Per Share Year EPS 2014(E) $0.36 Capitalization
1. ANALYSIS of BUSINESS PERFORMANCE and FINANCIAL POSITION
 1. ANALYSIS of BUSINESS PERFORMANCE and FINANCIAL POSITION (1) Business Performance Analysis a. Overview of Performance Net sales Gross profit Ordinary income Income before income taxes and minority interests
Himax Technologies, Inc. Reports First Quarter 2015 Financial Results and Provides Second Quarter 2015 Guidance
 Himax Technologies, Inc. Reports First Quarter 2015 Financial Results and Provides Second Quarter 2015 Guidance Company Meets Q1 Revenue, Gross Margin, and EPS Guidance Provides Second Quarter 2015 Guidance
2014 Investor Day. November 19, 2014
 2014 Investor Day November 19, 2014 Forward-Looking Statements This presentation includes certain forward-looking statements within the meaning of the Private Securities Litigation Reform Act of 1995,
Qualcomm Announces Fourth Quarter and Fiscal 2017 Results Fiscal 2017 Revenues $22.3 billion GAAP EPS $1.65, Non-GAAP EPS $4.28
 FOR IMMEDIATE RELEASE Qualcomm Contact: John Sinnott Vice President, Investor Relations Phone: 1-858-658-4813 e-mail: ir@qualcomm.com Qualcomm Announces Fourth Quarter and Fiscal Results Fiscal Revenues
HIMAX REPORTS FOURTH QUARTER AND FULL YEAR 2009 FINANCIAL RESULTS
 HIMAX REPORTS FOURTH QUARTER AND FULL YEAR 2009 FINANCIAL RESULTS Highlights: Market share expansion in small- and medium-sized display driver segment in 2009, with handset display drivers shipment increasing
2014/15 Annual Results. May 21, 2015
 2014/15 Annual Results May 21, 2015 Forward Looking Statement This presentation contains forward-looking statements which are statements that refer to expectations and plans for the future and include,
Q Conference Call
 Q4 2017 Conference Call > Veeco Instruments Inc. > February 12, 2018 1 Q4 2017 / FY 2017 Conference Call Veeco Instruments Inc 2018 Safe Harbor To the extent that this presentation discusses expectations
DELL INC. Condensed Consolidated Statement of Income and Related Financial Highlights (in millions, except per share data and percentages) (unaudited)
 (unaudited)") Condensed Consolidated Statement of Income and Related Financial Highlights (in millions, except per share data and percentages) Three Months Ended % Growth Rates July 30, April 30, July 31, 2010 (1) 2010
Condensed Consolidated Statement of Income and Related Financial Highlights (in millions, except per share data and percentages) Three Months Ended % Growth Rates July 30, April 30, July 31, 2010 (1) 2010
4th Quarter Supplemental Information February 14, 2018
 4th Quarter 2017 Supplemental Information February 14, 2018 Safe Harbor This presentation is intended to be disclosure through methods reasonably designed to provide broad, non-exclusionary distribution
Asia TFT-LCD Sector SECTOR REVIEW. More to go. ('000 sq m) (%) 3Q12 1Q11 3Q09 1Q09
 (%) 3Q12 1Q11 3Q09 1Q09") 1Q09 3Q09 1Q10 3Q10 1Q11 3Q11 1Q12 3Q12 1Q13 3Q13 Jan-10 Mar-10 May-10 Jul-10 Sep-10 Nov-10 Jan-11 Mar-11 May-11 Jul-11 Sep-11 Nov-11 Jan-12 Mar-12 May-12 Jul-12 03 September 2012 Asia Pacific Equity Research
1Q09 3Q09 1Q10 3Q10 1Q11 3Q11 1Q12 3Q12 1Q13 3Q13 Jan-10 Mar-10 May-10 Jul-10 Sep-10 Nov-10 Jan-11 Mar-11 May-11 Jul-11 Sep-11 Nov-11 Jan-12 Mar-12 May-12 Jul-12 03 September 2012 Asia Pacific Equity Research
INVESTOR PRESENTATION
 INVESTOR PRESENTATION Q4 2016 RESULTS March 2, 2017 October 26, 2016 ASM proprietary information 2017 ASM CAUTIONARY NOTE REGARDING FORWARD-LOOKING STATEMENTS Cautionary note regarding forward-looking
Investor Presentation. August 15, 2017
 Investor Presentation August 15, 2017 Forward-Looking Statements; Non-GAAP Financial Measures This presentation contains forward-looking statements that are based on our current expectations, forecasts
Identiv, Inc. (INVE) Q Earnings Presentation. November 9, :00 PM PST (5:00 PM EST)
 Q Earnings Presentation. November 9, :00 PM PST (5:00 PM EST)") Identiv, Inc. (INVE) Q3 2016 Earnings Presentation November 9, 2016 2:00 PM PST (5:00 PM EST) Safe Harbor Statement Note Regarding Forward-Looking Information This presentation contains forward-looking
Identiv, Inc. (INVE) Q3 2016 Earnings Presentation November 9, 2016 2:00 PM PST (5:00 PM EST) Safe Harbor Statement Note Regarding Forward-Looking Information This presentation contains forward-looking
ELECTRONIC ARTS REPORTS Q1 FY14 FINANCIAL RESULTS
 ELECTRONIC ARTS REPORTS Q1 FY14 FINANCIAL RESULTS Q1 Non-GAAP Net Revenue and EPS Results Exceed Guidance Q1 Non-GAAP Digital Net Revenue Up 17% Versus Prior Year EA Signs Publishing Agreement with TenCent
FOR IMMEDIATE RELEASE IR CONTACT: Deborah Crawford. Netflix Announces Q Financial Results
 FOR IMMEDIATE RELEASE IR CONTACT: Deborah Crawford Wednesday, April 21, 2010 VP, Investor Relations (408) 540-3712 PR CONTACT: Steve Swasey VP, Corporate Communications (408) 540-3947 Netflix Announces
Brightcove Announces Financial Results for Third Quarter 2013
 October 24, 2013 Brightcove Announces Financial Results for Third Quarter 2013 Generates non-gaap income from operations for first time in company's history BOSTON--(BUSINESS WIRE)-- (NASDAQ: BCOV), a
Third Quarter October 2017
 Third Quarter 2017 25 October 2017 Disclaimer This presentation and its enclosures and appendices (jointly referred to as the Presentation ) has been produced by Asetek A/S (the Company ) and has been
DELL INC. Condensed Consolidated Statement of Financial Position (in millions) (unaudited)
 (unaudited)") Condensed Consolidated Statement of Financial Position (in millions) Assets: Cash & cash equivalents $ 14,061 $ 14,623 $ 13,293 $ 13,852 $ 12,814 $ 10,635 $ 13,913 $ 13,852 Short-term investments 418 509
Condensed Consolidated Statement of Financial Position (in millions) Assets: Cash & cash equivalents $ 14,061 $ 14,623 $ 13,293 $ 13,852 $ 12,814 $ 10,635 $ 13,913 $ 13,852 Short-term investments 418 509
Konica Minolta Group 1Q / March 2008 Consolidated Financial Results Three months: Apr. - Jun. 2007
 Konica Minolta Group / March 2008 Consolidated Financial Results Three months: Apr. - Jun. 2007 August 2, 2007 Yasuo Matsumoto Senior Executive Officer Konica Minolta Holdings, Inc. Cautionary Statement:
CalAmp Reports Second Quarter Fiscal 2018 Financial Results
 NEWS RELEASE CalAmp Reports Second Quarter Fiscal 2018 Financial Results 9/28/2017 Q2 revenue of $89.8 million Awarded the largest SaaS contract in the company's history MRM Telematics product revenue
FOR IMMEDIATE RELEASE IR CONTACT: Deborah Crawford. Netflix Announces Q Financial Results
 FOR IMMEDIATE RELEASE IR CONTACT: Deborah Crawford Thursday, October 22, 2009 VP, Investor Relations 408 540-3712 PR CONTACT: Steve Swasey VP, Corporate Communications 408 540-3947 Netflix Announces Q3
GAAP/Non-GAAP Reconciliation and Other Management Metrics. 3rd Quarter 2017
 GAAP/Non-GAAP Reconciliation and Other Management Metrics 3rd Quarter 2017 Use of Non-GAAP Financial Information Use of Non-GAAP Financial Information The Company occasionally utilizes financial measures
NLSN 4Q and FY 2011 Investor Presentation
 NLSN 4Q and FY 2011 Investor Presentation Forward Looking Statements The following discussion contains forward-looking statements, including those about Nielsen s outlook and prospects, in the meaning
Final Results for Fiscal 2010
 MARUWA CO., LTD. 3-83, Minamihonjigahara-cho, Owariasahi-city, Aichi-pref., 488-0044 JAPAN 27 Apr. 2010 Final Results for Fiscal 2010 MARUWA CO., LTD. today announced its consolidated business results
Final Results for Fiscal 2009
 MARUWA CO., LTD. 3-83, Minamihonjigahara-cho, Owariasahi-city, Aichi-pref., 488-0044 JAPAN 8 May 2009 Final Results for Fiscal 2009 MARUWA CO., LTD. today announced its consolidated business results for
Consolidated Financial Results for the First Quarter Ended June 30, 2006
 News & Information 6-7-35 Kitashinagawa Shinagawa-ku Tokyo 141-0001 Japan Consolidated Financial Results for the First Quarter Ended June 30, 1 No: 06-063E 3:00 P.M. JST, July 27, Tokyo, July 27, -- Sony
ELECTRONIC ARTS REPORTS Q3 FY15 FINANCIAL RESULTS
 ELECTRONIC ARTS REPORTS Q3 FY15 FINANCIAL RESULTS Q3 Net Revenue and EPS Results Exceed Guidance Fiscal Year 2015 Net Revenue and EPS Guidance Raised Achieved Record Cash Flow for a Calendar Year Period
Q3 FY07 Earnings July 25, 2007
 Q3 FY07 Earnings July 25, 2007 Safe Harbor Before we proceed with our presentation, we would like to point out that the following discussion will contain forward-looking statements from industry consultants,
DELL INC. Condensed Consolidated Statement of Income and Related Financial Highlights (in millions, except per share data and percentages) (unaudited)
 (unaudited)") Condensed Consolidated Statement of Income and Related Financial Highlights (in millions, except per share data and percentages) Three Months Ended % Growth Rates 2013 2012 Yr. to Yr. Net revenue Products
Condensed Consolidated Statement of Income and Related Financial Highlights (in millions, except per share data and percentages) Three Months Ended % Growth Rates 2013 2012 Yr. to Yr. Net revenue Products
Consolidated Results of Kyocera Corporation and its Subsidiaries for the Nine Months Ended December 31, 2007
 Consolidated Results of Kyocera Corporation and its Subsidiaries for the Nine Months Ended December 31, 2007 The consolidated financial statements are prepared in conformity with accounting principles
Investor Presentation
 Investor Presentation (NASDAQ: TRIP) Q4 2012 Safe Harbor Statement Forward-Looking Statements. Our presentation today, including the slides contained herein, contains "forward-looking statements" within
Your Testing Quality is Our Commitment. CHROMA ATE INC. 1Q Investor Conference. Paul Ying, CFO. 24 th April, 2012
 Your Testing Quality is Our Commitment. CHROMA ATE INC. 2012 1Q. 2012 Investor Conference Paul Ying, CFO 24 th April, 2012 1 Disclaimer This presentation contains some forward-looking statements that are
Investor Presentation
 Investor Presentation (NASDAQ: TRIP) Q2 2013 Safe Harbor Statement Forward-Looking Statements. Our presentation today, including the slides contained herein, contains "forward-looking statements" within
Q Results November 2016
 Q3 2016 Results November 2016 Safe Harbor Forward-Looking Statements. Our presentation today, including the slides contained herein, contains "forwardlooking statements" within the meaning of the Private
Carlisle to Acquire Accella Performance Materials. The Premier Specialty Polyurethane Platform
 Carlisle to Acquire Accella Performance Materials The Premier Specialty Polyurethane Platform Forward Looking Statements This presentation contains forward-looking statements within the meaning of the
Intuitive Surgical Announces Fourth Quarter Earnings
 Intuitive Surgical Announces Fourth Quarter Earnings January 25, 2018 SUNNYVALE, Calif., Jan. 25, 2018 (GLOBE NEWSWIRE) -- Intuitive Surgical, Inc. (NASDAQ:ISRG), a global technology leader in robotic-assisted,
TC TECH Sweden AB (publ) Interim Report 30 September 2016
 Interim Report 30 September 2016") TC TECH Sweden AB (publ) Interim Report 30 September Net sales amounted to 0 (0) TSEK in the third quarter of. Net profit/loss totalled -5 498 (-1 381) TSEK in the third quarter of the year. Cash flow
TC TECH Sweden AB (publ) Interim Report 30 September Net sales amounted to 0 (0) TSEK in the third quarter of. Net profit/loss totalled -5 498 (-1 381) TSEK in the third quarter of the year. Cash flow
Clean, commercial energy solutions for the material handling industry. Copyright 2016, Plug Power Inc.
 Clean, commercial energy solutions for the material handling industry. Copyright 2016, Plug Power Inc. May, 2016 Safe Harbor Statement This communication contains forward-looking statements within the
KULICKE & SOFFA INDUSTRIES NASDAQ: KLIC DECEMBER QUARTER 2018 INVESTOR PRESENTATION
 KULICKE & SOFFA INDUSTRIES DECEMBER QUARTER 2018 INVESTOR PRESENTATION SAFE HARBOR STATEMENT In addition to historical statements, this press release contains statements relating to future events and our
Stifel Investor Conference
 Roper Technologies, Inc. Stifel Investor Conference June 15, 2017 Safe Harbor Statement The information provided in this presentation contains forward-looking statements within the meaning of the federal
Konica Minolta Group Consolidated 3rd Quarter Financial Results
 Konica Minolta Group Consolidated 3rd Quarter Financial Results Three months ended December 31, 2003 Supplementary Information February 12, 2004 Konica Minolta Holdings, Inc. Highlight of 3Q financial
Second Quarter of FY 2018 (July 1, 2018 Sep 30, 2018) Japan Display Inc. Consolidated Financial Results. November 12, 2018
 Japan Display Inc. Consolidated Financial Results. November 12, 2018") Second Quarter of FY 2018 (July 1, 2018 Sep 30, 2018) Consolidated Financial Results Japan Display Inc. November 12, 2018 Today s Speakers Yoshiyuki Tsukizaki Chief Operating Officer and President Takanobu
Second Quarter of FY 2018 (July 1, 2018 Sep 30, 2018) Consolidated Financial Results Japan Display Inc. November 12, 2018 Today s Speakers Yoshiyuki Tsukizaki Chief Operating Officer and President Takanobu
Business Results for Nine Months ended December 31, 2014
 Business Results for Nine Months ended December 31, 2014 February 6, 2015 This is a summary in English from the original material in Japanese. In case of any discrepancy between the translation and the
Alphabet Announces Third Quarter 2018 Results
 Alphabet Announces Third Quarter 2018 Results MOUNTAIN VIEW, Calif. October 25, 2018 Alphabet Inc. (NASDAQ: GOOG, GOOGL) today announced financial results for the quarter ended. "Our business continues
(Billions of yen, millions of U.S. dollars, except per share amounts) Second quarter ended September 30 Change in
 Second quarter ended September 30 Change in") News & Information 1-7-1 Konan, Minato-ku Tokyo 108-0075 Japan No: 08-139E 3:00 P.M. JST, October 29, Consolidated Financial Results for the Second Quarter Ended September 30, Tokyo, October 29, -- Sony
News & Information 1-7-1 Konan, Minato-ku Tokyo 108-0075 Japan No: 08-139E 3:00 P.M. JST, October 29, Consolidated Financial Results for the Second Quarter Ended September 30, Tokyo, October 29, -- Sony
Digital Turbine Reports Fiscal 2019 Third Quarter Results
 February 5, 2019 Digital Turbine Reports Fiscal 2019 Third Quarter Results Revenue from Continuing Operations of $30.4 Million Represented 34% Annual Growth Gross Margin Expansion and Operating Leverage
Amkor Technology, Inc. Investor Presentation
 Amkor Technology, Inc. Investor Presentation February 2018 Connecting People and Technology 1 Disclaimer Forward-Looking Statement Disclaimer All information and other statements contained in this presentation,
2016/17 Q1 Earnings Announcement
 2016/17 Earnings Announcement August 17, 2016 New York August 18, 2016 Hong Kong 2016 Lenovo Internal. All rights reserved. Forward Looking Statement This presentation contains forward-looking statements
Amkor Technology, Inc. Investor Presentation
 Amkor Technology, Inc. Investor Presentation June 2017 Connecting People and Technology 1 Disclaimer Forward-Looking Statement Disclaimer All information and other statements contained in this presentation,
DELL INC. Condensed Consolidated Statement of Income and Related Financial Highlights (in millions, except per share data and percentages) (unaudited)
 (unaudited)") Condensed Consolidated Statement of Income and Related Financial Highlights (in millions, except per share data and percentages) Three Months Ended % Growth Rates February 3, October 28, January 28, 2012
Condensed Consolidated Statement of Income and Related Financial Highlights (in millions, except per share data and percentages) Three Months Ended % Growth Rates February 3, October 28, January 28, 2012
Cree Reports Financial Results for the Third Quarter of Fiscal Year 2017
 April 25, Cree Reports Financial Results for the Third Quarter of Fiscal Year DURHAM, N.C.--(BUSINESS WIRE)-- Cree, Inc. (Nasdaq: CREE) today announced financial results for its third quarter of fiscal,