This financial report covers the consolidated entity consisting of Computershare Limited and its controlled entities.
|
|
|
- Hubert Hancock
- 6 years ago
- Views:
Transcription


1 COMPUTERSHARE ANNUAL REPORT 2017
2 This financial report covers the consolidated entity consisting of Computershare Limited and its controlled entities. The financial report is presented in United States dollars (USD), unless otherwise stated. Computershare Limited is a company limited by shares, incorporated and domiciled in Australia. Its registered office and principal place of business is: The financial report was authorised for issue by the directors on 18 September The company has the power to amend and reissue the financial report. A separate notice of meeting including a proxy form is enclosed with this financial report. Computershare Limited Yarra Falls 452 Johnston Street, Abbotsford Victoria 3067 Australia
3 CONTENTS * OVERVIEW Financial highlights and financial calendar 4 Chairman s Report 5 CEO s Report 6 Computershare at a glance 8 Key financial metrics 10 Growth 12 Profitability 14 Capital Management 15 Corporate Responsibility 16 People 18 Group Operating Overview 20 Business Strategies and Prospects 22 GOVERNANCE Corporate Governance Statement 24 Directors Report 36 Auditor s Independence Declaration 52 FINANCIALS Consolidated Statement of Comprehensive Income 53 Consolidated Statement of Financial Position 54 Consolidated Statement of Changes in Equity 55 Consolidated Cash Flow Statement 56 Notes to the Consolidated Financial Statements 57 REPORTS Directors Declaration 104 Declaration to the Board of Directors 105 Independent Auditor s Report 106 FURTHER INFORMATION Shareholder information 113 Corporate directory 114 * The Chairman s Report, Chief Executive Officer s Report, Group Operating Overview and Business Strategies and Prospects comprise our Operating and Financial Review (OFR) and form part of the Directors Report.
4 FINANCIAL HIGHLIGHTS JUNE 2017 JUNE 2016 % CHANGE STATUTORY RESULTS Total revenue 2,105.8 million 1,961.1 million 7.4% Net profit after non-controlling interests (NCI) million million 69.4% Statutory earnings per share cents cents 70.8% MANAGEMENT ADJUSTED RESULTS Management EBITDA million million 1.5% Management net profit after NCI million million -2.0% Management earnings per share cents cents -1.2% BALANCE SHEET Total assets 2 3,947.0 million 3,975.5 million -0.7% Total shareholders equity 2 1,237.0 million 1,106.5 million 11.8% PERFORMANCE INDICATORS Free cash flow (excluding SLS advances) million million 7.9% Net debt to management EBITDA (excluding non-recourse debt) times 2.12 times times Return on equity % 26.90% Down 130 bps Staff numbers 17,706 17,839 For a reconciliation between statutory and management adjusted results, refer to note 4 in the notes to the financial statements. 1 These financial indicators are based on management adjusted results. Management adjusted results are used, along with other measures, to assess operating business performance. The Group believes that exclusion of certain items permits better analysis of the Group s performance on a comparative basis and provides a better measure of underlying operating performance. Management adjustment items that were income to the Group are included in statutory results as other income and therefore management total revenue is consistent with statutory total revenue. Return on equity is calculated as management NPAT after NCI over average monthly shareholders equity. 2 The June 16 balance has been restated to reflect the correction of an immaterial prior period error which resulted in the reduction of the Milestone carrying value by $2.2 million. 3 Reclassification of dividends received from associates and joint ventures from investing cash flows to operating cash flows in June Where constant currency references are used in this report, constant currency equals FY2017 results translated to USD at FY2016 average exchange rates. FINANCIAL CALENDAR AUGUST 2017 Record date for final dividend 18 SEPTEMBER 2017 Final dividend paid 14 NOVEMBER 2017 The Annual General Meeting of Computershare Limited ABN LOCATION: Computershare Conference Centre Yarra Falls, 452 Johnston Street Abbotsford, Victoria 3067 TIME: 10.00am 14 FEBRUARY 2018 Announcement of financial results for the half year ending 31 December Computershare Annual Report 2017

5 CHAIRMAN S REPORT I am pleased to report that Computershare delivered solid earnings growth, strong free cash flow and an increased dividend for shareholders in FY2017. With our growth, profitability and capital management strategies beginning to drive improved returns, we are entering a new period of sustained earnings growth at CPU. YEAR IN REVIEW FY2017 marked an important inflection point in Computershare s earnings. We delivered management EPS in line with upgraded guidance, an increase of 3.5% on FY2016 in constant currency terms, which is a solid result given the challenges we faced during the year. These included cyclically depressed corporate action revenues, the lowest margin income yield in the Company s history and a higher tax rate. Positively, in the second half, margin income improved for the first time in several years. Given these challenges, our results show the strength of our underlying business performance. We carefully designed deliberate strategies to drive this strengthened performance and earnings potential. In FY2016 we assessed our growth opportunities, invested in our capabilities and improved our competitive strengths. In FY2017 we made encouraging progress and delivered both earnings growth and strong cash flow; with our growth engines and cost out management strategies contributing to our profitability. We are building significant earnings potential with our growing mortgage services businesses and our global share plans business. At the end of this financial period, our share plans business had around $125 billion of assets under administration. Adding in our multi-stage cost out program and the $16.7 billion of average client balances that we manage, we believe we can deliver sustained earnings growth. Our balance sheet also continues to strengthen given our significant cash flow and our moves to simplify the Computershare business. We sold both our Melbourne headquarters and our investment in INVeSHARE during the year. Our debt leverage ratio is now below our policy range, enabling us to announce a new share buy-back program. The final FY2017 dividend is AU 19 cents, a rise of 11.8%, which brings the total dividend for the year to AU 36 cents, an overall increase of 9.1% for the year. OUTLOOK Most significantly, we are positioning Computershare for a period of sustained earnings growth. FY2017 was the beginning of a multi-year earnings growth phase. Our starting guidance for FY2018 assumes around 7.5% growth in management EPS in constant currency. Whilst we do not specifically guide to management EBITDA, we do expect it to grow at a faster rate than EPS. In bridging the two, we note that amortisation and the tax rate are increasing as our US businesses, including mortgage services, contribute a larger share of Group profits. ACKNOWLEDGMENTS Computershare is well placed to deliver more value to shareholders, clients and communities. On behalf of my fellow Directors, I thank you for your support as a shareholder and look forward to your continuing involvement in FY2018. I would also like to thank all of our people around the world for their dedicated efforts in delivering these results. I know you are extremely capable and deeply committed to delivering the best outcomes for clients, and that every day you live Computershare s special culture by doing the right thing. Finally, I would also like to thank Stuart Irving, our CEO and President, for his talented and dedicated leadership; and the rest of my fellow board members for their expertise, skills and support. Simon Jones Chairman 5

6 CEO S REPORT * We are progressing with our strategic priorities to build growth engines, reduce costs to improve profitability and manage our capital to enhance returns for shareholders. In FY2017, Management Revenue was up by 10.6%. Our revenues benefited from the maiden contribution from the UKAR contract, our largest ever contract win. Excluding UK mortgage services, Group revenue increased by around 1.1% percent, with a slight acceleration in the second half. Management EPS came in at cents, an increase of 3.5%. Management EBITDA was $557.2 million, an increase of 4.6%. Around 55% of our earnings were delivered in the second half. Excluding margin income, underlying EBITDA was up by 9.6%. FY2017 BUILDING SUSTAINED EARNINGS GROWTH Our growth, profitability and capital management strategies are driving our performance and importantly, our earnings power. This earnings power is important because it gives us the confidence to highlight our belief that we are at the beginning of a multi-year earnings growth phase. Growth Our self-funded growth engines have performed strongly in FY2017. Mortgage services increased revenues by 71%. On a combined basis across the US and UK, this business now accounts for almost 25% of Group revenues; it s a sizeable business with rising profitability. EBITDA effectively doubled to $78 million. The two main lead indicators in this business are unpaid principal balances (UPB; the value of loans under service) and service quality. These are the foundations for building a profitable and sustainable business. We are executing to plan in US mortgage services, and continue to build towards scale and the anticipated returns we affirmed at our Investor and Analyst Briefing in April. At the scale of servicing approximately $100 billion of UPB, we are seeking to build a business that will deliver 20% profit before tax margins and 12-14% post tax, post maintenance capex free cash flow return on average invested capital. At the end of June the UPB we serviced in our US business grew to $59.7 billion, up from $52.9 billion and in the UK, we serviced 64 billion. Our reputation for service quality also continues to grow and we continue to be rated as one of the world s best mortgage servicers by rating agencies. In this sensitive market, where service quality can determine regulatory risk, our reputation for quality is creating new servicing opportunities for us with the major banks and mortgage bond holders. The UKAR contract is a good news story, the integration is ahead of plan and the anticipated synergy benefits are being delivered, with more to come. We won a number of new originating challenger bank clients in the period. These will grow their originations over the medium term, helping to build a sustainable, growth business. Share plans are our other growth engine. This business enjoys a combination of structural growth and at the moment, cyclical recovery. Excluding margin income where low rates affected our yield, especially in the key UK market; revenues increased by 13% and EBITDA increased by 58%. The fundamental earnings driver for this business is the number of units, typically the number of share options and performance rights, which we administer. Assuming these units become in the money as equity markets rise, they are likely to be exercised at some point. At the time of exercise, a sell or transfer order is usually created, and these orders generate transactional revenues for us. We administer around $125 billion of these units around the world. Our scale means we are able to drive operating leverage as well as provide data insights to our clients who strive to create effective plans for both retaining and rewarding their employees. This unique value proposition is resonating well. * All references to Management Results in the CEO s report are in constant currency unless otherwise stated 6 Computershare Annual Report 2017
7 Profitability Our cost management program is on track and beginning to deliver the expected benefits. $13.7 million of savings were realised in FY2017, which is slightly ahead of schedule. Our target of $85 million $100 million total savings, which we have published for stages one and two of the program, is also on track. With stage three to be quantified next calendar year, we expect there is more to come in this area. We can already see these cost saving initiatives driving margin improvement in our mature registry business line. Specifically in US registry, the largest in the Group, EBITDA increased at a faster rate than the Group average. Register maintenance was affected by the loss of flow-on effect from corporate actions. We look forward to a modest recovery in corporate actions in FY2018. Margin income is another profit driver and part of our earnings potential. Lower yields were again a drag on earnings in FY2017. Margin income fell by $11.7 million in the period. I am pleased to say that this drag, after many consecutive halves of decline, has turned positive. Margin income increased by $1.8 million in the second half of the year. Yields are slowly recovering from the lowest level in Computershare s history and we stand to benefit if more rate rises eventuate as markets anticipate. With $16.7 billion of actual average daily client balances in FY2017 and $10.2 billion being exposed to interest rates, we have significant leverage to a rising rate cycle, which is part of our earnings potential. Capital management Capital management is our strategy to enhance shareholder returns and free cash flow is a strong feature of these results. At actual exchange rates, we generated free cash flow of over $362 million in the year. With the proceeds from asset sales we are simplifying the business and recycling capital for higher growth and returns. In this period we were able to reduce our leverage ratio to 1.60x, which is below the 1.75 times to 2.25 times policy range. This gives us additional capacity to self-fund our growth and drive improved returns for shareholders. The 1.60x number does not include the $90 million of sale proceeds we expect from the sale of our share in our Indian JV with Karvy, which should close later this year. We also continue to be presented with inorganic growth opportunities. Any purchase must be within our core competencies and be strategically aligned to the existing Group business. Furthermore it must be financially accretive. We are highly disciplined in this regard. FY2018 OUTLOOK A SIMPLER, MORE TRANSPARENT, DISCIPLINED AND PROFITABLE COMPUTERSHARE The execution of our growth, profitability and capital management strategies is underway and on track. Our underlying business performance is robust and we are building significant earnings potential to drive future performance. We will continue to grow mortgage services, maintain our profitability in registries, invest for growth in employee share plans and support these initiatives with a rigorous and ongoing cost management program. We look forward to margin income continuing to recover. We will also continue to manage and recycle capital to self-fund our growth and improve returns for shareholders. Our business model, with around 70% of revenues recurring, generates strong free cash flow. In conclusion, I would like to re-affirm a commitment we made in February 2016 when this journey to the new Computershare began. We said then a simpler, more transparent, disciplined and profitable Computershare is emerging, with a focus on building and protecting scale in core markets to drive operating leverage, delivering sustained earnings growth and improved shareholder returns. This is as true and relevant today as it was then. In FY2016 we made meaningful progress defining and setting out the strategies for the Group. In FY2017 we started executing against these strategies and doing what we said we would do. We have demonstrated more progress, and have started to deliver positive earnings growth. In FY2018 and beyond we will continue our relentless pursuit of this goal. In delivering these strategies I must thank all the Computershare staff globally who have worked so diligently in challenging markets to deliver this result. We are proud of Computershare s special culture that motivates us to do the right thing, whether that s driving innovation or delivering exceptional service to our clients. You can see that coming through in our results and we look forward to making further progress in the year ahead. Stuart Irving Chief Executive Officer and President 7
8 COMPUTERSHARE AT A GLANCE Edinburgh Skipton Dublin Monaghan Bristol Jersey Madrid Barcelona Paris Stockholm Doxford Crossflatts Copenhagen Rotterdam London Frankfurt Munich Rome Olten Milan Turin Hyderabad Beijing Hong Kong Manila Johannesburg Perth Adelaide Maroochydore Brisbane Sydney Melbourne Auckland KEY OPERATIONAL STATS (AS AT 30 JUNE 2017) ~8 billion , million * Market cap countries offices clients shareholders and participants *Includes Indian JV 8 Computershare Annual Report 2017
9 STAFF NUMBERS IN EACH REGION 5,611 ASIA 1,568 AUSTRALIA AND NEW ZEALAND Calgary Vancouver Denver San Francisco Louisville Los Angeles Phoenix College Station Chicago Boston New York New Jersey Toronto Montreal 1,169 CANADA 399 CONTINENTAL EUROPE 4,408 UNITED KINGDOM, CHANNEL ISLANDS AND AFRICA 4,551 UNITED STATES 13.9 million $125 billion $16.7 billion $59.7 billion 64 billion calls handled by our call centres share plan assets under administration client balances UPB under service (US) UPB under service in (UK) 9
10 KEY FINANCIAL METRICS MANAGEMENT REVENUE MANAGEMENT EBITDA USD million USD million MANAGEMENT EPS STATUTORY EPS USD cents USD cents CASH FLOW FROM OPERATIONS DIVIDEND PER SHARE USD million AUD cents 10 Computershare Annual Report 2017
11 NET OPERATING CASH FLOW EXCLUDING SLS ADVANCES NET DEBT TO EBITDA RATIO EXCLUDING NON-RECOURSE SLS ADVANCE DEBT USD million Times REVENUE BY PRODUCT 1% Technology and other revenue 8% Communication services 11% Employee share plans 4% Stakeholder relationship management Register maintenance 33% Corporate actions 6% Business services 37% EBITDA BY PRODUCT 1% Technology and other revenue 7% Communication services Register maintenance and corporate actions 48% 10% Employee share plans 2% Stakeholder relationship management Business services 32% 11
12 GROWTH Building growth engines in employee share plans and mortgage services MORTGAGE SERVICES In the US and UK, Computershare offers a full range of services across the mortgage services value chain. It s an industry we have grown to know well, that aligns with our core strengths. We are building competitive differentiation through our focus on servicing quality, technology and product offerings. FINANCIAL RESULTS IN FY2017 COMPARISON IN CONSTANT CURRENCY ($ MILLION) CC FY2016 ACTUAL CC VARIANCE US mortgage services revenue $257.2 $ % UK mortgage services revenue $280.6 $ % Total mortgage services revenue $537.8 $ % Total mortgage services EBITDA $78.0 $ % HIGHLIGHTS WE SERVICE $59.7 billion 64 billion ~ 600K mortgages UPB in the US UPB in the UK across US and UK INNOVATIVE SOLUTIONS US > Third party mortgage solutions offering > 1st generation private label program for prime sub-servicing clients > New Property Solutions website UK > New online mortgage customer service platform, iconnect INCREASED RATED Capital Markets Cooperative patron count to 431 mortgage companies The highest mortgage servicer ratings globally (Fitch Ratings and Standard and Poor s) INTEGRATED > UK mortgage services functionality, targeting a single platform in FY2019 > Loan boarding function, based in Denver, US > Capital Markets Cooperative and Altavera, allowing us to provide services across the mortgage services value chain in the US COMPLETED > $4 billion Federal National Mortgage Association mortgage servicing rights excess deal with a new capital partner Oakhill Advisors, recycling over $24 million in capital > First Specialized Loan Services managed sale of $200 million in Federal Home Loan Mortgage Corporation non-performing loans > Government National Mortgage Association/Federal Housing Administration readiness program FOCUS FOR FY2018 US MORTGAGE SERVICING > Continue to build scale to $100 billion Unpaid Principal Balances > Drive diversified revenue mix > Increase efficiencies and productivity through technology UK MORTGAGE SERVICING > Continue integration of UK mortgage services functionality onto a single platform > Target the retail banks, with increasing regulatory costs driving outsourcing needs in this market > Grow servicing volumes for new challenger bank clients 12 Computershare Annual Report 2017
13 EMPLOYEE SHARE PLANS Computershare leverages local knowledge and full service expertise to support complex global requirements for our employee share plan clients. We offer technology that helps clients provide share plans to reward and retain their employees. Our growth strategy is to continue to build the client base and volume of assets under administration to drive high quality recurring revenues coupled with potential transaction fees. FINANCIAL RESULTS IN FY2017 COMPARISON IN CONSTANT CURRENCY ($ MILLION) CC FY2016 ACTUAL CC VARIANCE Total employee share plans revenue $235.6 $ % Employee share plans EBITDA $60.8 $ % EBITDA margin % 25.8% 25.4% +40bps EBITDA ex margin income $42.4 $ % HIGHLIGHTS WE ADMINISTER INNOVATIVE SOLUTIONS IMPROVED $125 billion $1.8 billion of share plan assets client balances > Leveraging data insight and share plans expertise to optimise reward and retain outcomes globally > New application to enhance user experience and design for equity professionals in Australia > Improved research and insight program to ensure Computershare remains the market leader in the US > Established a Professional Services Group to enhance offering in the US Overall client satisfaction, with Net Promoter Score for share plans in the UK increasing by 41 points INTEGRATED SyncBase financial reporting solution LAUNCHED > Lenovo s global employee share plan, spanning 25 jurisdictions and 25,000 participants > New share plan for 4,000 Maire Tecnimont employees in Italy FOCUS FOR FY2018 EMPLOYEE SHARE PLANS > Continue to invest in customer facing technology and product refreshes to improve our competitive position > Roll out data analytics and new reporting capabilities > Complete current service improvement programme 13
14 PROFITABILITY Reducing costs to deliver margin expansion and improved profitability Our cost management program is on track and beginning to deliver the expected benefits, with $13.7 million of savings realised in FY2017. Our target of $85 million $100 million total savings for stages one and two is also on track, with stage three to be quantified next calendar year. ACTIVITY TOTAL COST SAVINGS ESTIMATES $ MILLION EXPECTED BENEFIT REALISATION (CUMULATIVE) FY2017 FY2018 FY2019 FY2020 Stage 1 Louisville (unchanged) % 45% 70% 100% Stage 2 Spans of control ~15 45% 95% 100% Operational efficiencies % 80% 100% Procurement % 100% Process automation ~20-20% 80% 100% Other % 100% Total estimate These cost saving initiatives are driving margin improvement in our mature registry business line. Specifically, in US registry, the largest in the Group, where EBITDA also increased at a faster rate than the Group average. However, overall register maintenance revenues were impacted by the loss of flow on effect from corporate actions. FINANCIAL RESULTS IN FY2017 COMPARISON IN CONSTANT CURRENCY ($ MILLION) CC FY2016 ACTUAL CC VARIANCE Register maintenance revenue $703.4 $ % Corporate actions revenue $125.8 $ % Total register maintenance & corporate actions revenue $829.2 $ % Register maintenance & corporate actions EBITDA $262.8 $ % EBITDA margin % 31.7% 30.6% +110bps EBITDA ex margin income $202.3 $ % HIGHLIGHTS INNOVATIVE SOLUTIONS > Portfolio Tax Pack for shareholders in Australia > Integrated Nasdaq s beneficial holder analysis capabilities into Australian Issuer Online > Enhanced third party data access to payment information for audit and tax professionals in Australia > New online share sale facility for NZ holders who hold Australian stocks > Private markets solution in the US > New products in US Real Estate Investment Trust market > Virtual meeting product, allowing US companies to host a virtual or hybrid AGM > New tablet based voting system for AGMs in Germany > Electronic admission cards for AGMs in Denmark RATED 98% positive UK s No. 1 registrar in the JP Morgan Registry Survey (Australia) for the third year in a row INCREASED > Number of staff located in Louisville to over 600 FOCUS FOR FY2018 REGISTRY > Continue to be the leading global provider of registry services > Drive margin growth by developing innovative solutions, cross-selling services and increasing operational efficiency > Explore opportunities to cross-sell beyond pure registry (Corporate Trust, Virtual Meetings, Compliance and Governance Solutions) COST MANAGEMENT > Roll out a whole of organisation framework for operations reporting to improve processing efficiency > Continue to automate and digitise internal applications > Transition the Louisville migration to a business as usual state 14 Computershare Annual Report 2017
15 CAPITAL MANAGEMENT Enhancing shareholder returns Capital management is a strategy for us to enhance shareholder returns. We generated free cash flow of over $362 million in the year. This strong free cash flow enables us to reduce debt and increase distributions to shareholders. It also provides us with the flexibility to consider inorganic growth opportunities albeit on disciplined acquisition criteria. CPU SHARE PRICE PERFORMANCE VS. ASX 200 SINCE IPO 27 MAY 1994 > 30 JUNE 2017 CPU SHARE PRICE % ASX % HIGHLIGHTS DELEVERAGED > Net debt (excluding non-recourse SLS advance debt) fell 23.1% to $867.7 million > Net debt to EBITDA ratio down to 1.60x from 2.12x. Below board target range of between 1.75x 2.25x creating additional capacity to enhance shareholder returns. INCREASED > Full year dividends of AU 36 cents per share, +9.1% on pcp > Includes final FY2017 dividend AU 19 cents, +11.8% on pcp RECYCLING CAPITAL TO GROWTH ENGINES > Disposal of CPU s global headquarters in Melbourne > Disposal of investment in INVeSHARE Inc > Acquired $85.8 million of net US mortgage servicing rights CONTINUED EXAMINED To apply disciplined acquisitions criteria, including scale, alignment with CPU core competencies and potential to be financially accretive Land registry opportunities FOCUS FOR FY2018 CAPITAL MANAGEMENT > Complete share buy-back of up to AUD 200 million > Finalise the $90 million sale of our Indian joint venture, Karvy Computershare > Enhance operating earnings to improve total returns for shareholders 15


16 CORPORATE RESPONSIBILITY We know that corporate responsibility is part of doing business successfully. Computershare is committed to acting in an environmentally friendly and socially responsible manner and we seek to do so throughout our global business operations and activities. SUSTAINABILITY We have sustainability and environmental programmes in place around the globe to further minimise our already low impact on the natural world, underpinned by our environmental policy and annual sustainability objectives. For more information, please visit PROGRESS ON OBJECTIVES GREEN OFFICE CHALLENGE 7 TREE PLANTING PROGRAM EXISTING REDUCTION TARGETS NEW REDUCTION TARGETS > We received 36 eligible entries globally for our 7th Green Office Challenge: the Green Oscars > Projects delivered either an environmental or a community benefit for local areas > The global winner was an initiative in Hong Kong. Employees sold handmade exfoliating soap made from office coffee grounds in aid of a local environmental charity > During FY2017 we planted 1,988 trees around the world as part of our commitment to lower the impact of our business flights > During their lifetime, these trees will cover ~10% of the carbon emitted by our business air travel in FY2016 > We will work with our partners around the world to plant further trees relative to FY2017 air travel > We have reduction targets in place across six of our locations > Burr Ridge and Munich relocated during FY2017 so data benchmarking has recommenced > A summary is below, with further details available on our website. We continue to try and meet targets that have not yet been achieved > We have set new five-year reduction targets at five additional locations > We now measure electricity and gas consumption against office size (SQM), not FTE. Based on analysis of our existing targets, this has been shown to provide more accurate results and will be adopted in all future electricity and gas reduction targets REDUCTION TARGETS 2017/18 TARGETS Melbourne, AU Bristol, UK East Beaver Creek, CA Burr Ridge, USA* Canton, USA GENERAL WASTE ELECTRICITY NATURAL GAS WATER N/A 2019/20 TARGETS Auckland, NZ N/A N/A N/A Hong Kong N/A N/A N/A Munich, DE* N/A N/A N/A * At time of relocation. Targets will be replaced once benchmark data has been collected. = target currently achieved = target not achieved LOCAL ACHIEVEMENTS BRISTOL, UK MUNICH, GERMANY NEWPORT, UK NORTH AMERICA Employees were given a free reusable cup to purchase hot drinks, saving 10,000 disposable cups from landfill so far. Our team relocated to LEED-certified offices and overhauled their IT infrastructure, resulting in a reduction in electricity consumption of ~50%. We ve switched our primary data centre in EMEA to a data hall in Newport, UK, which uses 100% renewable energy. Our US and Canadian offices have achieved a 20% reduction in printer paper use over the last five years. FOCUS FOR FY2018 > Increase our environmental data collection and reporting > Expand our global tree planting program > Investigate the use of the Green Cloud to reduce carbon footprint 16 Computershare Annual Report 2017


17 COMMUNITY In addition to the volunteer opportunities we give our employees each year, many staff members also contribute to ongoing community events and charity initiatives in their local area reading and number buddies supporting local schools in Bristol Christmas hampers donated to families in need in Australia jars of honey from our beehives in Bristol, UK sold at a charity auction computers donated to schools in the US pairs of glasses donated in the US , ,000+ clothing items and blankets donated to homeless people in Australia cups of hot soup served to the homeless on Nelson Mandela Day in South Africa coats donated during Homelessness Awareness Week in the UK items of clothing donated in global Dress for Success campaign donated to housing charities in the UK by The DPS Charity Donations Fund CHANGE A LIFE > AUD 8 MILLION RAISED FOR CHANGE A LIFE SINCE LAUNCH > DONATIONS OF AUD 990,000 SUPPORTED OUR PROJECTS IN FY2017 Founded in 2005, Change A Life is our global community giving program that invests in projects that provide long-term solutions to the communities involved. We focus on long-term change that is felt on a global stage and provides an opportunity for people to build up their skills for a brighter and more sustainable future. Computershare matches all employee payroll donations. CURRENT PROJECTS Achievements in FY2017 Farmer Managed Natural Regeneration Ghana Change A Life s sixth World Vision project has worked to reduce the annual hunger gap for over 8,400 children and their families in Talensi District, Ghana. The five-year project, ending in September 2017 has helped teach land management skills that lead to better harvests, more sustainable food production and a healthier ecosystem for the entire region. > Trained 400 lead farmers from 10 communities to identify and promote more sustainable use of natural resources in their areas > Established new FMNR sites in three communities. Lead farmers from each of the communities (10 men and 10 women) were trained on how to prune and nurture shrubs > Collaborated with the Ghana National Fire Service to train fire stewards (30 women and 30 men) in fire-fighting and prevention skills > Trained 200 farmers from 10 communities on land preparation techniques to improve soil health on their land > Trained women in 10 communities how to build and use fuel-efficient cooking stoves > Trained farmers on bond and contour farming principles > Arranged exchange visits for FMNR lead farmers > Hosted government representatives for meetings and field visits > Supervised and audited over 200 Savings Groups, helping families improve and diversify their incomes Achievements in FY2017 Come-Share Education Project Sri Lanka Come-Share provides educational funding for children from year ten (O level) onwards. In Sri Lanka, education up until year ten is free and many children from poor backgrounds can complete up until year ten unassisted. After this point many children are forced into manual labour, even if their school results are very good. Computershare has supported Come-Share for 15 years. > Launched a voluntary contributions scheme, to allow past beneficiaries to give back to the program > Initiated an empowerment and motivation project to provide support to beneficiaries beyond their school years > Provided toolkits to graduates for Vocational Training and self-employment > Travelled to multiple districts to provide relief to children affected by a recent drought, providing 1,500 exercise books and shoes and socks for school wear for 180 children > Provided 50 English to Sinhala dictionaries to a remote area in Alagollewa to help students improve their English language skills > Commenced support for 20 students from two schools in the flood affected Matara district FOCUS FOR FY2018 > Implement employee consultation program for charity selection > Allocate 20% of donations to charities that are local to our offices > Finalise new local and global charities for Change A Life to support 17


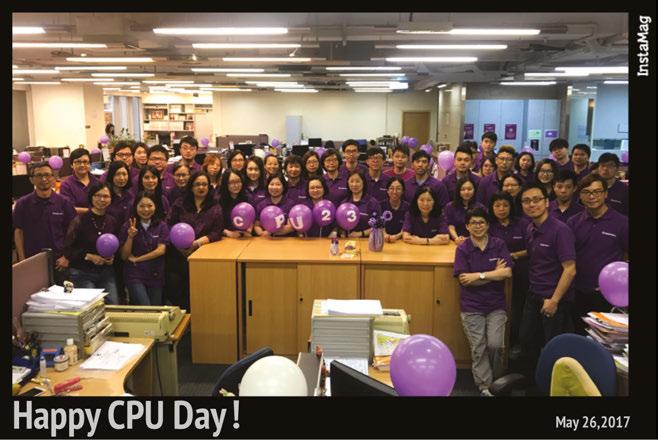
18 PEOPLE At Computershare, we expect a lot from our employees and we rely on them to protect and grow our business. We hire, develop, reward, promote and retain our people on the basis of their talent and commitment and the results they achieve. We offer a wide variety of training and professional development opportunities, great benefits including a generous employee share plan, and a supportive work environment. We know that looking after our people ensures success for them, for us and for our clients, and we are proud of our special culture. COMPUTERSHARE DAY On 26 May we celebrated our inaugural Computershare Day, marking 23 years since Computershare was listed on the Australian Securities Exchange. Employees around the world took part in the event, which included a most purple team competition. We also used the day to launch our Purple Person awards, which recognised 23 employees for their contribution to Computershare and for embodying our values. OUR 23 PURPLE PEOPLE FOR 2017 ARE: Amy Griffith Louisville USA Anna Macfarlane Skipton UK Ben Jones Melbourne Australia Dennis Skagias Chicago USA Evan Giosis Melbourne Australia Garion Chaffe Bristol UK Ibrahim Hussein Sydney Australia Imre van Wagtendonk Rome Italy Ivy Ng Hong Kong James Leggett Bristol UK Jane Clifford Bristol UK Jason Zhao Montreal Canada Joanne Hallett Bristol UK Jobe Lau Hong Kong Joel Halligan Denver USA Laura Wozniak Chicago USA Lisa Garrett St. Helier UK Mark Fitzgibbon Canton USA Megan Peagler Denver USA Niamh Murphy Brisbane Australia Nicki Priem Melbourne Australia Nora Pushian Calgary Canada Todd Regan Chicago USA 18


19 19
20 GROUP OPERATING OVERVIEW PRINCIPAL ACTIVITIES The principal activities of the consolidated entity during the course of the financial year were the operation of investor services, employee share plan services, communication services, business services, stakeholder relationship management services and technology services. > > The investor services operations comprise the provision of registry maintenance and related services. > > The employee share plan services operations comprise the provision of administration and related services for employee share and option plans. > > The communication services operations comprise document composition and printing, intelligent mailing, inbound process automation, scanning and electronic delivery. > > The business services operations comprise the provision of mortgage servicing activities, corporate trust, class action, bankruptcy, childcare voucher administration, tenant bond protection services and mutual fund administration support services. > > The stakeholder relationship management services group provides investor analysis, investor communication and management information services to companies, including their employees, shareholders and other security industry participants. > > Technology services includes the provision of software, specialising in share registry and financial services. Computershare has a range of regulated businesses around the world, including transfer agencies, licensed dealers, corporate trusts and mortgage servicers. REVIEW OF OPERATIONS Overview Business services revenue grew 37.7% on FY2016 to become the largest business stream by revenue, delivering $834.2 million in constant currency terms. The substantial improvement was due to a full period contribution from the UKAR contract win, which saw UK mortgage servicing revenues grow substantially by $187.3 million. Growth was also achieved in US mortgage servicing, class actions and corporate trust. However, weaker results were recorded in the deposit protection scheme and voucher services businesses in the UK and the Australian utility services business. Business services EBITDA grew 24.4% year-on-year on a constant currency basis to $180.7 million. Revenue in the investor services business, with cyclically depressed corporate actions, posted the weakest results since 2005, delivering $125.8 million (year-on-year in constant currency terms). This had a flow on effect on register maintenance revenues which were down 3.4% to $703.4 million. While Hong Kong and Canada saw improved register maintenance revenues, this was offset by weaker results in the US, UCIA and Australia. At the EBITDA level, the consolidated investor services business fell by 1.2% over FY2016 on a constant currency basis but margins improved, underpinned by strong cost management. Employee share plans benefited from higher transactional volumes and improved equity markets and revenue was up 6% in constant currency terms notwithstanding margin income weakness following the cut in UK interest rates. Strong improvements were registered across the globe with the Asian business delivering ongoing robust organic growth. Employee share plans EBITDA grew 7.6% in constant currency and 58.2% excluding the impact of margin income. Revenue for the Communication Services business was up 0.6% but EBITDA fell by 16.5% to $38.6 million in constant currency. Disposals of the Group s global headquarters in Melbourne, Australia and INVeSHARE equity investment were both concluded during the period. Revenue Comparison in constant currency Business stream CC $ million FY2016 Actual $ million CC Variance FY2017 Actual $ million Business services % Register maintenance % Corporate actions % Employee share plans % Communication services % Stakeholder relationship mgt* % 79.8 Technology & other revenue* % 26.6 Total management revenue 2, , % 2,114.0 * It is anticipated that in FY2018, stakeholder relationship mgt and tech & other revenue streams will be consolidated into other business streams. Comparative revenues would be provided. 20 Computershare Annual Report 2017
21 Regions CC $ million Comparison in constant currency FY2016 Actual $ million CC Variance FY2017 Actual $ million ANZ % Asia % UCIA % CEU % 93.8 USA % Canada % Total management revenue 2, , % 2,114.0* * Total management revenue excludes two management adjustment items further described in note 4 of the financial statements: a gain on disposals of the Australian head office premises and the investment in INVeSHARE totalling $52.8 million and an acquisition accounting adjustment related to UK Asset Resolutions Limited of $1.3 million. Regional management revenue excludes intersegment eliminations. Operating costs Operating expenses were up 12.9% on FY2016 to USD $1,626.1 million in constant currency terms. The increase was driven by a number of factors, the most significant of which was the impact of delivering the UKAR contract appointment work. Acquisitions and costs associated with revenue related activity (business mix) also contributed to the higher costs. Importantly, the Group s cost out programme is beginning to deliver benefits with $13.7 million of cost out achieved in the period and business as usual operating expenditure was up only 0.3% during the period in constant currency. Technology costs as a percentage of revenue remained at 12.4%, a modest increase on FY2016, again largely driven by the UKAR mortgage services contract appointment. Earnings per share Statutory basic earnings per share Statutory diluted earnings per share Management basic earnings per share Management diluted earnings per share The management basic and diluted earnings per share amounts have been calculated to exclude the impact of management adjusted items (refer to note 4 in this financial report). All EPS numbers above have been translated at actual not constant currency FX rates cents 2016 cents 21
22 BUSINESS STRATEGIES AND PROSPECTS OUTLOOK In August 2017, we reported that we expect management EPS in constant currency to increase by +7.5% on FY2017. The outlook assessment is subject to the forward-looking statements disclaimer in our annual results announcement and assumes that there is a modest improvement in corporate actions revenue compared to FY2017, and that interest rate markets perform broadly in line with expectations that existed at the time of providing that guidance and equity markets remain at the levels that existed at the time of providing that guidance. Computershare s strategy is to be the leading provider of services in our selected markets by leveraging our core skills and competencies to deliver outstanding client outcomes from engaged staff. We focus on new products and services to reinforce market leadership in established markets and invest in technology and innovation to deliver productivity gains and improved cost outcomes. RISKS The Board is ultimately responsible for ensuring that Computershare s risk management practices are sufficient to mitigate the risks present in our business as efficiently and effectively as possible. The Board delegates some of this responsibility to the Risk and Audit Committee. Computershare has a clear approach to the oversight and management of risk, based on the three lines of defence model. This model provides a simple framework for the implementation and oversight of risk management in which management, as the first line of defence, has primary responsibility for risk management and control activities. The risk function, as part of the second line of defence, is responsible for setting and implementing the risk framework and supporting tools and methodologies as well as providing advisory support to management. The internal audit function, as the third line of defence, provides an independent and objective assurance function with the responsibility of confirming that the framework, policies, and controls designed to manage key risks are being executed by management. Internal audit carries out regular systematic monitoring of control activities and reports its findings to the senior managers of each business unit as well as to the Risk and Audit Committee. RISK SUMMARY The following outlines areas of material risk that could impact our ability to achieve our strategic objectives and future financial prospects including, where applicable, our exposure to economic, environmental or social sustainability risks and how we seek to mitigate or manage them. Strategic and regulatory risk Our businesses operate in highly-regulated markets around the world and our success can be impacted by changes to the regulatory environment and the structure of these markets. As an organisation we pay very close attention to regulatory developments globally and play an active role in consulting with regulators on changes which could impact our business. Many of our key businesses are also subject to direct regulatory oversight and we are required to maintain the appropriate regulatory approvals and licenses to operate, and in some cases adhere to certain financial covenants. Our business is also at risk of disruption from new technologies and alternative service providers. This means we must be constantly looking for ways to improve our services by investing in new technologies and processes. We have also established a dedicated innovation team which is responsible for rapidly assessing the viability of new business ideas and initiatives in an agile yet systematic manner using proven innovation techniques. In recent periods we have seen the emergence of distributed ledger technology or blockchain as a technology, which has the potential to be deployed across financial market systems, including post trade clearing and settlement of securities. Deployment of distributed ledger technology into financial markets, if it ultimately proves to be a viable option, will require extensive dialogue and consultation with regulators and industry participants and its ultimate market structure implications are not yet known. Computershare is adopting a measured and considered approach to blockchain. We are pursuing a dual track approach in terms of assessing the commercial value of introducing innovative blockchain services in market adjacencies, while also rigorously defending our existing role and overall market positioning. We also believe that our global presence makes us an attractive partner to blockchain solution providers and gives us access to a wide range of potential commercial blockchain opportunities. Our future prospects also depend on finding and executing on opportunities to grow and diversify our business. We are potentially constrained by market structure and competition law restrictions from significantly growing our registry services footprint by acquisition (unless subsequent market structure changes present new opportunities) and this has inevitably changed the focus of our investment decisions. There is also inherent risk in any acquisition, including risk of financial loss or missed earnings potential from inappropriate acquisition decisions as well as integration risk in its implementation. Computershare has a strong track record of acquiring and integrating businesses successfully, in particular in the businesses of registry and employee share plan administration. We have a deliberately focused acquisition strategy with rigorous approval processes and we also undertake subsequent reviews of our acquisitions and their performance. 22 Computershare Annual Report 2017
23 Financial risk Our financial performance each year is underpinned by significant annuity revenue. However, there is also a material proportion of revenue that is derived from transactional activity that is dependent on factors outside our control, which can be challenging to predict. Changes to market activity generally and foreign exchange rates have the ability to impact on our financial performance. Margin income is a key contributor to earnings. Changes in investment restrictions, interest rates and to the level of balances that we hold on behalf of clients can have a material impact on the Group s earnings. We also have strong relationships with the global financial institutions that hold our client balances. We have robust policies and other protections to manage risks associated with placing those funds and we also make significant investments in processes and technology to identify, allocate, reconcile and oversee client monies. We also experience vigorous competition in all of the markets in which we operate and the actions of our competitors can impact on our financial prospects. For example, aggressive price discounting by competitors could adversely affect our existing pricing arrangements or ability to retain existing clients and also win new clients. We continually strive to remain the leading provider of services in all our business lines globally and invest significantly in new technology and services to maintain our market-leading position. Operational risk Computershare is responsible for managing valuable client data. This presents a range of challenges, from ensuring the security and integrity of that data as well as the continuity of our service in the face of internal and external factors. We manage these risks through extensive business continuity planning and testing as well as rigorous internal controls around the ability to access and modify client data. We also make significant investments in technology and services to protect data at rest, in motion and at end point, including a specialist information security team whose responsibilities include ensuring we have appropriate and effective systems in place to protect our and our clients data from unauthorised access. Our dedicated financial crime team is also responsible for analysing information and transactions to mitigate the risk of fraud (both internal and external) and these resources are focused on areas of highest potential exposure. Computershare also undertakes high volumes of transactional processes, some of which are complex. There is a risk that failure to process these transactions correctly could result in liabilities being incurred to third parties. We invest significantly in technology to automate processes where possible. We also have policies, processes and corresponding controls to assist in mitigating this risk, which are routinely tested. The Group also maintains insurance. 23
24 CORPORATE GOVERNANCE STATEMENT 1. COMPUTERSHARE S APPROACH TO CORPORATE GOVERNANCE The Board is committed to maintaining high standards of corporate governance by overseeing a sound and effective governance framework for the management and conduct of Computershare s business. This corporate governance statement sets out a description of Computershare s main corporate governance practices. Computershare s governance arrangements complied with each of the recommendations set by the ASX Corporate Governance Council throughout the reporting period. In this statement Group is used to refer to Computershare Limited and its controlled entities, and references to Group management refer to the Group s Chief Executive Officer and the executives reporting directly to the Chief Executive Officer. This Corporate Governance Statement has been approved by the Board and is current as at 19 September BOARD RESPONSIBILITIES The Board is responsible for the corporate governance of the Group and is governed by the principles set out in the Board Charter. A copy of the Board-approved Charter is available from The principal role of the Board is to ensure the long-term prosperity of the Group and, in doing so, to determine the Group s strategic direction. The Board also sets broad corporate governance principles, which govern the Group s business operations and accountability, and ensures that those principles are effectively implemented by Group management. The Board s other reserved powers and duties can be divided into five distinct areas of responsibility, an overview of which is provided below: > > Strategic planning for the Group involves commenting on, and providing final approval of, the Group s corporate strategy and related performance objectives, as developed by Group management, as well as monitoring Group management s implementation of, and performance with respect to, that agreed corporate strategy. > > Financial matters includes approving the Group s budgets and other performance indicators and monitoring progress against them, as well as approving and monitoring financial and other reporting, internal and external audit plans, enterprise risk management plans and the progress of major capital expenditure, acquisitions and divestitures. > > Corporate governance incorporates overseeing Computershare s corporate governance framework, including approving changes made to key supporting Group policies and overseeing Computershare s reporting to shareholders and its compliance with its continuous disclosure obligations. > > Overseeing Group management involves the appointment and, if required, removal of the Chief Executive Officer and the monitoring of his or her ongoing performance, as well as, if applicable, the appointment and if required, removal of Group management personnel, including the Chief Financial Officer and Company Secretary. > > Remuneration comprises the approval of Computershare s overall remuneration framework and determining the remuneration of non-executive directors within the limits approved by shareholders. The Board has delegated the responsibility for day-to-day management and administration of Computershare to the Chief Executive Officer. Ultimately, Group management is responsible for managing the Group in accordance with the corporate strategy, plans and policies approved by the Board, and is required to provide appropriate information to the Board to ensure it can effectively discharge its duties. 3. BOARD COMPOSITION AND DIRECTOR APPOINTMENT Computershare s Constitution states that the Board must have a minimum of three and a maximum of ten directors. Re-appointment is not automatic and if retiring directors would like to continue to hold office they must submit themselves for re-election by Computershare s shareholders at the Annual General Meeting. No director (other than the Chief Executive Officer) may be in office for longer than three years without facing re-election. In addition to ensuring that the Board has the mix of skills, knowledge and experience commonly required across boards of major ASX listed companies, the Board is also focused on ensuring that its composition aligns with the Group s strategic objectives and that it has the necessary skills and expertise to provide oversight of those areas of the Group s business where there is greatest scope to increase shareholder value in the future. As a global organisation, it is also of great importance to the Board that it has an appropriate balance of directors who are based in Australia, as well as directors who are based in or who have experience of regions where there are significant group operations. The Board also considers its size should be conducive to effective discussion and efficient decision making. The Board regularly reassesses its composition to ensure that it continues to meet these requirements. 24 Computershare Annual Report 2017
25 To assist in this process the Board has developed a Board skills matrix which sets out the skills and experiences that the Board has or is looking to achieve. The current skills and experience of the Board assessed as a whole against the matrix is as follows: Leadership and governance Total out of eight Directors Strategy 8 Innovation and entrepreneurship 4 CEO level experience 5 Other non-executive director experience 7 Corporate governance 6 Business experience M&A and capital markets experience 8 International business experience 6 Working in regulated industries 6 Outsourced business services 6 Business development/access to networks 5 Financial and risk Accounting and finance 5 Banking and treasury 5 Audit, risk management and compliance 5 Other Technology 5 HR/remuneration 5 Geographic experience North America 6 UK and Europe 8 Asia 3 Australia 6 There was no change to the composition of the Board during the reporting period. All of Computershare s non-executive directors have signed formal letters of appointment setting out the key terms and conditions relating to their appointment as a director. Senior managers at Computershare also sign employment agreements, except in certain overseas jurisdictions due to local employment practices. Proposed appointees to the Board are subject to appropriate background checks. The format of these checks is dependent on the residence of the proposed director but would typically include police and bankruptcy checks and searches of relevant public records and filings. This is in addition to confirmation of the proposed director s experience and character as appropriate. Any director appointed by the Board will be required to stand for election at the next AGM, at which time the Company will provide in the notice of meeting all material information known to the Company that is relevant for shareholders to decide on whether or not to appoint the director. On appointment, all new directors undertake an induction process. They receive copies of all key governance documents as well as briefings from senior management on material matters relating to the Computershare group including strategic considerations, financial performance, major markets and business lines and operational and technological capability. As the Board holds meetings in all of the major markets in which the Group operates, new directors are, along with the rest of the Board, given the opportunity to meet with regional management and visit operational facilities during those meetings. Computershare does not have a formal programme of professional development for its directors. Directors receive briefings on material developments, including structural developments and market changes, that relate to the Group s operations. Directors may also request that the Company provide them with specific development opportunities which they may consider necessary to improve their skills and knowledge. 25


26 CORPORATE GOVERNANCE STATEMENT THE DIRECTORS As at the date of this Annual Report, the Board composition (with details of the professional background of each director) is as follows: Simon Jones M.A. (Oxon), A.C.A. Position: Chairman Age: 61 Independent: Yes Years of service: 12 Term of office Simon Jones was appointed to the Board in November 2005 as a non-executive director. Simon was last re-elected by shareholders in 2016 and was appointed as Computershare s Chairman in November Skills and experience Simon is a chartered accountant with extensive experience in investment advisory, valuations, mergers and acquisitions, public offerings, audit and venture capital. Simon was previously a Managing Director of N.M. Rothschild and Sons (Australia) and Head of Audit and Business Advisory (Australia & New Zealand) and Corporate Finance (Melbourne) at Arthur Andersen. Other directorships and offices Director of Canterbury Partners Chairman of the Advisory Board of MAB Corporation Pty Ltd Chairman of Melbourne IT Limited (retired May 2017) Board Committee membership Chairman of the Nomination Committee Member of the Risk and Audit Committee Member of the Remuneration Committee Member of the Acquisitions Committee Stuart Irving Position: Chief Executive Officer Age: 46 Independent: No Years of service: 3 Term of office Stuart Irving was appointed Chief Executive Officer and President of Computershare on 1 July He joined Computershare in Skills and experience Stuart held a number of roles at The Royal Bank of Scotland before joining Computershare as IT Development Manager in the UK. Stuart subsequently worked in South Africa, Canada and the US before becoming Chief Information Officer for North America in 2005 and then the Computershare Group s Chief Information Officer in Board Committee membership Member of the Nomination Committee Member of the Acquisitions Committee Christopher John Morris Position: Non-Executive Director Age: 69 Independent: No Years of service: 39 Term of office Chris Morris and an associate established Computershare in He was appointed Chief Executive Officer in 1990 and oversaw the listing of Computershare on the ASX in Chris became the Group s Executive Chairman in November 2006 and relinquished his executive responsibilities in September 2010 and subsequently stood down as Chairman in November Chris was last re-elected in Skills and experience Chris has worked across the global securities industry for more than 30 years. His knowledge, long-term strategic vision and passion for the industry have been instrumental in transforming Computershare from an Australian business into a successful global public company. Other directorships and offices Non-Executive Chairman of Smart Parking Limited (appointed in March 2009) Non-Executive Chairman of DTI Limited (appointed in June 2011) Board Committee memberships Chairman of the Acquisitions Committee Member of the Nomination Committee Member of the Remuneration Committee 26 Computershare Annual Report 2017


27 Penelope Jane Maclagan BSc (Hons), DipEd Position: Non-Executive Director Age: 65 Independent: No Years of service: 22 Term of office Penny Maclagan joined Computershare in 1983 and was appointed to the Board as an executive director in May Penny relinquished her executive responsibilities in September Penny was last re-elected in Skills and experience Penny has over 30 years of experience and knowledge in the securities industry. Having led Computershare s Technology Services business until 2008, Penny has a very deep understanding of Computershare s leading proprietary technology that contributes to its competitive advantage in the global marketplace. Other directorships and offices Non-Executive Director of Smart Parking Limited (appointed in February 2011) Board Committee membership Member of the Nomination Committee Member of the Remuneration Committee Tiffany Lee Fuller B.Com, GAICD, ACA Position: Non-Executive Director Age: 47 Independent: Yes Years of service: 3 Term of office Tiffany Fuller was appointed to the Board on 1 October 2014 as a non-executive director. Tiffany was elected by shareholders at the Company s AGM in November Skills and experience Tiffany has held various corporate finance, financial advisory and management consulting positions with Arthur Andersen in Australia, the US and UK. She held roles in investment banking with Rothschild Australia and was also Director and Principal of the Rothschild e-fund focusing on investments in early stage technology companies in Australia and New Zealand. Tiffany has also been appointed as a non-executive director for various public and private entities in both the for and not for profit sectors. Other directorships and offices Non-Executive Director of Costa Group Holdings Limited (appointed in 2015) Non-Executive Director of Smart Parking Technologies (since 2011) Board Committee membership Chair of the Risk and Audit Committee Member of the Remuneration Committee Member of the Nomination Committee Arthur Leslie (Les) Owen BSc, FIA, FPMI Position: Non-Executive Director Age: 68 Independent: Yes Years of service: 10 Term of office Les Owen was appointed to the Board on 1 February 2007 as a non-executive director. Les was last re-elected in Skills and experience Les is a qualified actuary with over 35 years experience in the financial services industry. He held Chief Executive Officer roles with AXA Asia Pacific Holdings and AXA Sun Life plc and was a member of the Global AXA Group Executive Board. He was also a member of the Federal Treasurer s Financial Sector Advisory Council. Other directorships and offices Non-Executive Director of Discovery Holdings Limited (a South African-listed health and life insurer) Non-Executive Director of the Royal Mail Group Plc Board Committee membership Member of the Risk and Audit Committee Member of the Remuneration Committee Member of the Nomination Committee 27


28 CORPORATE GOVERNANCE STATEMENT Dr Markus Kerber Dipl.oec, Dr. Rer. Soc. Position: Non-Executive Director Age: 54 Independent: Yes Years of service: 6 Markus Kerber was first appointed to the Board as a non-executive director in August In November 2009 he was required to retire due to his appointment as the Head of the Planning Department in the German Treasury and re-joined the Board in Markus was last re-elected to the Board in Skills and experience Markus is a non-executive director of Commerzbank AG and an investor in various start-up companies in Germany, the UK and the US. Between 2006 and 2016, Markus held positions as the Director General of the Federation of German Industries, the Head of the Planning Department in the German Treasury and also as the Director General at the German Ministry of the Interior. Between 1998 and 2005 he was Chief Financial Officer, Chief Operating Officer and Vice Chairman of the Supervisory Board of GFT Technologies AG. Prior to that Markus worked as an investment banker in London in the equity capital markets divisions of Deutsche Bank AG and S.G. Warburg & Co Limited. Other directorships and offices Member of the Supervisory Board of Commerzbank Aktiengesellschaft Member of the Board of Supervisory Directors of KfW Joseph Mark Velli BA, MBA Position: Non-Executive Director Age: 58 Independent: Yes Years of service: 3 Term of office Joseph Velli was appointed to the Board on 1 October 2014 as a non-executive director. Joseph was elected by shareholders at the Company s AGM in November Skills and experience Joseph is a retired financial services and technology executive with extensive securities servicing, M&A and public board experience. For most of his career, Joseph served as Senior Executive Vice President of The Bank of New York and as a member of the Bank s Senior Policy Committee. During his 22-year tenure with the Bank, Joseph s responsibilities included heading Global Issuer Services, Global Custody and related Investor Services, Global Liquidity Services, Pension and 401k Services, Consumer and Retail Banking, Correspondent Clearing and Securities Services. Most recently Joseph served as the Chairman and Chief Executive Officer of Convergex Group. Other directorships and offices Non-Executive Director of Paychex, Inc. Board Committee membership Chairman of the Remuneration Committee Member of the Nomination Committee Board committee membership Member of the Acquisitions Committee Member of the Remuneration Committee Member of the Nomination Committee 28 Computershare Annual Report 2017
29 4. BOARD INDEPENDENCE The Board has considered each of the eight directors in office as at the date of this Annual Report and has determined that a majority (five out of eight) are independent, and were so throughout the reporting period. The three directors who are not considered to be independent are Chris Morris, Penny Maclagan and Stuart Irving due to their past or present involvement in the senior management of the Company and, in the case of Chris Morris, his substantial shareholding in the Company. To determine the independence of a director, the Board has to consider a number of different factors, including those set out below: > > whether the director acts (or has recently acted) in an executive capacity for the Company > > the materiality of the director s shareholding in the Company (if any) > > the existence of any other material relationship between the director and a member of the Group (for example, where the director is or has been an officer of a significant adviser, supplier or customer) > > the ability of the director to exercise his or her judgement independently 5. BOARD MEETINGS AND REPORTS The Board met in person on four occasions in the reporting period. In-person meetings will generally take place over two full days and provide the Board with the opportunity to meet the senior management in the region where the meeting is held, so that the Board visits all of the Group management team in person over the year. At its meetings, the Board will also discuss the Group s results, prospects and short and long-term strategy, as well as other matters, including operational performance and legal, governance and compliance issues. The Board also convened three other meetings by telephone during the reporting period. Group management provides monthly reports to the Board detailing current financial information concerning the Group and each of the regions in which it operates. Management also provides additional information on matters of interest to the Board, including operational performance, major initiatives and the Group s risk profile, as appropriate. The Committees of the Board also meet regularly to fulfil their duties, as discussed further below. 6. BOARD COMMITTEES To assist in discharging its responsibilities, the Board has established four committees. The Risk and Audit Committee The principal function of the Risk and Audit Committee is to provide assistance to the Board in fulfilling its corporate governance and oversight responsibilities in relation to the Company s financial reporting, internal control structure, risk management systems, internal audit function and external audit requirements. The Risk and Audit Committee is chaired by Non-Executive Director Tiffany Fuller. The Committee currently has two other permanent non-executive members, Simon Jones and Les Owen. Each member of this Committee is considered by the Board to be independent. The Board regards these members as having the required financial expertise and an appropriate understanding of the markets in which the Group operates. The Chief Executive Officer, the Chief Financial Officer, the Group Head of Internal Audit, the Group Risk Officer and the Company s external auditors are invited to meetings of the Risk and Audit Committee at the Committee s discretion. The Risk and Audit Committee is governed by a Board-approved charter. A copy of this Risk and Audit Committee Charter is available from The Nomination Committee The main functions of the Nomination Committee are to review the competence, expertise, performance, constitution and succession of the Board, as well as the performance of individual directors. The Nomination Committee generally meets on each occasion that the Board meets in person. All current directors are members of the Nomination Committee and it is chaired by Simon Jones in his capacity as Chairman of the Board. The Nomination Committee s policy for the appointment of directors is to select candidates whose skills, expertise, qualifications, networks and knowledge of the markets in which Computershare operates (and other markets into which it may expand) complement those of existing Board members so that the Board as a whole has the requisite skills, diversity and experience to fulfil its duties. The Nomination Committee is governed by a Board-approved charter. A copy of this Nomination Committee Charter is available from 29
30 CORPORATE GOVERNANCE STATEMENT The Remuneration Committee The Remuneration Committee s primary function is to advise the Board on matters relating to the remuneration of the Group s key management personnel and specifically to consider, review and make recommendations to the Board about the following matters: > > the Chief Executive Officer s remuneration policy recommendations > > remuneration and contract terms for the Chief Executive Officer and the Group s key management personnel > > terms and conditions of long-term incentive plans, short-term incentive plans, share rights plans, performance targets and bonus payments for the Chief Executive Officer and the Group s key management personnel > > terms and conditions of any employee incentive plans > > the recommendations of the Chief Executive Officer on offers to executives under any long-term incentive plan established by the Company from time to time > > remuneration of non-executive directors within the limits approved by shareholders > > content of the remuneration report to be included in the Company s Annual Report The Committee is chaired by Joseph Velli. The Committee comprises all directors, except the CEO Stuart Irving. Pursuant to its Charter, the Committee must always be comprised of a majority of independent directors. The Remuneration Committee met on three occasions during the reporting period. The Committee has access to Group management and, where necessary, may consult independent experts to discharge its responsibilities effectively. The Remuneration Committee is governed by a Board-approved charter. A copy of this Remuneration Committee Charter is available from The Acquisitions Committee To assist in fulfilling its corporate governance and oversight responsibilities with respect to prospective acquisitions and divestitures being considered by the Group, the Board has established an Acquisitions Committee. The Committee receives reports from Group management on acquisition and divestiture opportunities and provides advice on matters such as the price, terms, structure and strategic management of such opportunities. The Committee is also authorised to approve transactions to be entered into by Group companies, provided that it does so within the scope of authority delegated to the Committee by the Board from time to time. The Acquisitions Committee is chaired by Chris Morris and also comprises Simon Jones, Markus Kerber, Stuart Irving and Mark Davis (the Group s Chief Financial Officer). For details of directors attendance at Committee meetings, see the Directors Report, which starts on page 36 of this Annual Report. 7. EQUITY PARTICIPATION BY NON-EXECUTIVE DIRECTORS The Board encourages non-executive directors to own shares in the Company, however the Company has not awarded shares to non-executive directors. As at 30 June 2017, all non-executive directors held a relevant interest in shares in the Company. 8. REMUNERATION For information relating to the Group s remuneration practices, and details relating to the directors remuneration and that of the Group s key management personnel during the year ended 30 June 2017, see the Remuneration Report, which starts on page 39 of this Annual Report and is incorporated into this corporate governance statement by reference. In addition to the disclosures contained in the Remuneration Report, it should be noted that the Board is keen to encourage equity holdings in the Company by employees with a view to aligning staff and shareholder interests. Many employees have participated (and continue to participate) in the various equity plans offered by the Company, and the directors believe that, historically, this has contributed significantly to the Group s success. 9. ANNUAL REVIEW OF BOARD AND GROUP MANAGEMENT PERFORMANCE The Board s performance is regularly reviewed by the directors of the Company as a whole (acting as the Nomination Committee). These reviews are undertaken in an open manner each time the Board meets in person. There is a standing agenda item at each in-person Board meeting for directors to be given an opportunity to discuss any concerns they may have with the Board s and its Committees performance as well as any steps that can be taken to maintain their effectiveness. Directors also completed a questionnaire relating to Board and Committee performance during the reporting period and the Board then reviewed and discussed the responses. The directors believe that this process works well for its size and composition. The process for evaluating the performance of individual directors is an informal one. The Chairman is responsible for engaging directly with directors on any individual performance concerns. Directors are able to raise concerns they might have with an individual director s performance directly with the Chairman. The Board annually reviews the Chief Executive Officer s performance while the Chief Executive Officer annually reviews the performance of the other members of Group management against their KPIs for the year. This review process results in each member of Group management receiving a proposed numerical rating which determines their short-term incentive outcomes for the year. The proposed rating given to each member of Group management is then reviewed by the Remuneration Committee. 30 Computershare Annual Report 2017
31 The Risk and Audit Committee also undertakes an annual review of its performance. The review comprises completion of a questionnaire by the individual members of the Committee and a review by the Committee of the responses. 10. IDENTIFYING AND MANAGING BUSINESS RISKS The Business Strategies and Prospects section of this Annual Report contains a summary of Computershare s approach to managing risk within the organisation. In respect of the reporting period, the Board received a report from the Chief Executive Officer and the Chief Financial Officer that confirms, among other things, the following: > > The Declaration to the Board of Directors of Computershare Limited, a copy of which is included in this Annual Report (see page 105) as required by section 295A of the Corporations Act 2001, is founded on a sound risk management and internal control system that is operating effectively in all material respects in relation to financial reporting risks. > > The Group s material business risks have been managed effectively. The Risk and Audit Committee also undertook a review of the Group s risk management framework during the reporting period and was satisfied that it remained sound. 11. DIVERSITY AND INCLUSION FY2017 has been a year of transition for our diversity and inclusion (D&I) work. We have updated our policy (below) and re-set our objectives for FY2018 onwards. This report therefore covers our progress during FY2017 and outlines our focus areas for FY2018. Diversity Policy We see diversity as a source of strength. The more different perspectives we have, the better equipped we ll be to meet the demands of our diverse global customer base. We want every person who joins our team, every customer and every supplier to feel welcome. We believe in equality for everyone, regardless of age, ethnicity, gender identity, race, religion, disability or sexual orientation. That applies throughout our company, around the world with no exceptions, regardless of differences. We will hire, develop, reward, promote and retain people purely on the basis of their talents, commitment, potential and the results they achieve. We will work hard to make sure everyone is included within our organisation, removing barriers and obstacles to give everyone an equal opportunity to succeed. Progress during FY2017 We established a global network of senior management level country-based D&I champions, responsible for ensuring that the company s D&I policy and specific global objectives are carried forward at a local level, taking into account country specific laws and regulations. The group is chaired jointly by two global executive management team members. The group identified a set of twelve Quick Wins and has worked on them collectively during the year. 1. Establish a network of diversity champions across business units 2. Establish focus groups in each region to better understand what our people are looking for with regard to our approach to diversity; taking the best ideas from the groups and implementing globally 3. Publish our gender data internally in a form everyone can understand and commit to update it on a regular basis 4. All people managers to start learning about unconscious bias with the aim of raising awareness 5. Global Management Team and their direct reports who are people managers to have diversity goals as a specific objective 6. All jobs to be advertised internally 7. All recruitment ads to state that we welcome applications from everyone, and provide link to diversity policy 8. Each country to explore cost-effective membership of a professional diversity group that can help provide local knowledge and experience to help with delivery of our diversity objectives. (e.g. Australia is signed up to the Diversity Council of Australia) 9. Review and update diversity policy for consideration by CPU board 10. Review our marketing materials to make sure we have a good balance of diverse imagery in place add content to our brand guidelines to make sure we maximise this going forward 11. Make sure exit interviews are in place globally and ask specific questions on diversity and inclusion 12. Undertake a sustained communication program around diversity and inclusion 31
32 CORPORATE GOVERNANCE STATEMENT Feedback on measurable objectives Listed below is the summary of the objectives that were established in This is the last year we will report on these specific objectives as a new set have been put in place for FY2018. It is important to note that the objectives outlined below do not exclude male employee participation in any relevant programmes. Objectives Measurement FY2017 Results 1. Recognised opportunity culture Our employees believe that Computershare has an equal opportunity culture where men and women are able to demonstrate equally their talent, commitment and results. Via the annual global staff survey, the majority of employees agree that men and women at Computershare have equal opportunity to demonstrate their talents, commitment and results. The annual global staff survey (three months into the FY) showed a slight increase in staff stating that Computershare is progressing towards greater diversity and inclusion, with a rating of 6.9 versus 6.8 the previous year. 2. Development of high potential women As part of the Company s succession planning process, high potential women are identified and developed for career progression. All high potential women are identified and are actively developed for career progression. Their development is reviewed annually. Regional heads reviewed the progress of identified high potential women as part of the annual employee review process. 3. Mentoring and networking women Where identified as valuable, mentoring and/or networking programmes are implemented to develop women in our business. Programme implementation and results are reviewed annually. Mentoring and/or networking programmes continue to be available on a needs basis to employees. 4. Improve support for pregnancy and maternity leave Programmes are implemented that provide better support for pregnant women in the workplace; and for women commencing, on and returning from, maternity leave. Over 80% of women return to the workforce from maternity leave. An annual report to the CEO monitors progress. Currently operating at above target rates in each region. Globally Computershare has a return rate in excess of 85%. 5. Flexible working arrangements implemented Flexible working initiatives are supported by management and where appropriate made available to employees to achieve improved business outcomes and support work/life balance. Flexible working arrangements are defined in the appropriate workplace policies and/or are actively used as an engagement tool by management. Management feedback on usage and effectiveness is provided to the CEO annually. Flexible working arrangements are available to our employees. Requests for a flexible arrangement are assessed by Human Resources and the business unit involved. Gender diversity statistics Overall CPU FY2017 Change to Role Category F M F M Total female % Board (inc CEO) % 75% 8 = Direct reports of CEO % 88% 16 + Company Executive % 72% Senior Manager % 63% Manager % 53% 1,239 = Other 5,727 4,473 56% 44% 10,200 - Grand Total 6,499 5,502 54% 46% 12,001 Data valid as at 30 June Our joint venture in India where Computershare is not the active manager is excluded. Company Executive means a person reporting to a direct report of the CEO. Senior Manager means a person reporting to a Company Executive. 32 Computershare Annual Report 2017
33 FY2018 focus areas and objectives We will work with an external partner to further define our overall global strategy for D&I. This will be completed in conjunction with our regional champions and communicated to staff prior to the end of the calendar year. We will also put in place resources to help us better keep track of and report on our D&I initiatives around the globe. FY2018 Objectives Objective 1. Building on the 12 Quick Wins, work with an external partner to draw up an appropriate, global strategic plan for D&I over the next five years 2. Evaluate employee opinion of Computershare s progress towards greater diversity and inclusion, with the aim of increasing scores 3. Work towards our goal of a minimum 30% female representation at senior levels (Direct reports of CEO and Company Executive) by Increase the amount of flexible working arrangements in place across the company 5. Maintain the number of women returning from maternity leave at 80%+. Additionally, measure and report on the retention of these women in the three years after return. 6. Increase the number of staff filling internal vacancies through appropriate training, development and awareness of the opportunities. Measurement Plan to be defined and communicated to all employees by the end of 2017 Feedback to be evaluated from scores in the annual global employee survey To be measured using statistics from our employee records To be measured using statistics from our employee records To be measured using statistics from our employee records To be measured using statistics from our employee records 12. WORKPLACE GENDER EQUALITY REPORT In accordance with the requirements of the Workplace Gender Equality Act 2012, on 31 May 2017 Computershare Australia lodged its annual compliance report with the Workplace Gender Equality Agency. A copy of this report is available from Any comments regarding this report can be submitted via to the following address: wgea.comments@computershare.com.au. 13. SECURITIES TRADING POLICY The Company has a Securities Trading Policy in place which sets out the restrictions that apply to the Group s directors, officers and employees trading in Computershare securities. The policy explains the insider trading laws as they relate to trading in Computershare securities and the securities of Computershare s clients. It also sets out the penalties that apply to insider trading offences under the Corporations Act 2001 and makes clear that Computershare adopts a zero tolerance approach to breaches of insider trading laws. The policy imposes additional restrictions on dealings in Computershare securities by Computershare directors and certain specified executives (designated persons). These designated persons may deal in Computershare securities during the four week period after the Company releases its half year and full year financial results, and after the date on which its Annual General Meeting is held, subject always to the laws on insider trading. In addition, these designated persons may only deal in Computershare securities outside those specified four week trading windows with an express prior clearance by a nominated director. During certain prohibited periods, being the period between 15 December and the Company s release of its half year results and the period between 15 June and the Company s release of its full year results, and such other periods as may be determined by the Board from time to time, clearance to deal can only be given in exceptional circumstances. Under the policy, designated persons are also prohibited from entering into an arrangement pursuant to which they seek to hedge the economic risk associated with an unvested incentive award made to them by Computershare. The list of designated persons is set out in Schedule 1 of the Securities Trading Policy. It is reviewed and updated as appropriate, having regard to any changes in the structure of or the creation of new roles within Group management. An up-to-date copy of the Board-approved Securities Trading Policy is available from CORPORATE REPORTING The Chief Executive Officer and the Chief Financial Officer have made a Declaration to the Board of Directors in respect of the year ended 30 June 2017, as detailed on page 105 of this Annual Report. The Chief Executive Officer and the Chief Financial Officer also provided an equivalent statement to the Directors in respect of the Company s half year report for the period ended 31 December
34 CORPORATE GOVERNANCE STATEMENT 15. CONFLICT OF INTEREST AND INDEPENDENT ADVICE If a director has an actual or potential conflict of interest in a matter under consideration by the Board or a Committee of the Board, that director must promptly disclose that conflict of interest and abstain from deliberations on the matter. In that circumstance, the director is not permitted to exercise any influence over other Board members or Committee members on that issue, nor receive relevant Board or Committee papers. The Company permits any director or Committee of the Board to obtain external advice about transactions or matters of concern at the Company s cost. Directors seeking independent advice must obtain the approval of the Chairman, who is required to act reasonably in deciding whether the request is appropriate. 16. ETHICAL STANDARDS Computershare recognises the need for directors and employees to perform to the highest standards of behaviour and business ethics. The Board has adopted a Code of Conduct that sets out the principles and standards with which all officers and employees are expected to comply as they perform their respective functions. The Code recognises the legal and other obligations that the Company has to legitimate stakeholders, and requires that directors, officers and employees maintain the highest standards of propriety and act in accordance with the law. A copy of the Group s Board-approved Code of Conduct is available from the corporate governance section of SHAREHOLDER COMMUNICATIONS AND INVESTOR RELATIONS Computershare has an investor relations program in place with the aim of facilitating effective communication between Computershare and its investors. A key feature of this program is to ensure that shareholders are notified of, or are otherwise able to access information necessary to assess Computershare s performance. Information is communicated to shareholders through the following means: > > The Annual Report, which is distributed to all shareholders who elect to receive it. An overview of the previous financial year is also included in the Notice of AGM that all shareholders receive. > > The AGM and any other shareholder meetings called from time to time to obtain shareholder approval as required. > > The Company s website, which contains information regarding the Company and the Group and its corporate governance framework. The Investor Relations section of the website also includes information released to the ASX, a copy of investor and analyst briefing documentation, press releases and webcasts. > > By to those shareholders who have supplied their address for the purpose of receiving communications from the Company electronically. Computershare actively encourages shareholders to provide an address to facilitate more timely and effective communication with them and runs campaigns from time to time to encourage greater adoption. Computershare also encourages shareholders to participate in the Company s AGM. Shareholders who are unable to attend and vote in person at the meeting are encouraged to vote electronically via Computershare s service known as InvestorVote, where they can view an electronic version of the voting form and accompanying materials and submit their votes. Computershare also encourages shareholders who are unable to attend the AGM to communicate any issues or questions by writing to the Company. 18. COMMITMENT TO AN INFORMED MARKET RELATING TO COMPUTERSHARE SECURITIES The Board has a Market Disclosure Policy to ensure the fair and timely disclosure of price-sensitive information to the investment community as required by applicable law. In order to effectively manage its continuous disclosure obligations, the Chief Executive Officer has established a Disclosure Committee which is responsible for the following matters: > > considering what information needs to be released to the market by Computershare, although routine administrative announcements may be made by the Company Secretary without consulting the Disclosure Committee > > ensuring announcements relating to significant matters are referred to the Board for consideration and approval, namely announcements relating to the Company s half and full year financial reports, financial projections and future financial performance as well as changes to the Group s policy or strategy > > approving the disclosure of information to the market for matters not referred to the Board > > implementing adequate systems for ensuring the timely disclosure of material information to the market, including where such information needs to be released urgently The Disclosure Committee consists of the Chief Executive Officer, the Chief Financial Officer, the Head of Investor Relations and the Company Secretary. Where the urgency of an issue, which under the policy is to be referred to the Board, prevents its consideration by the full Board, an announcement relating to that issue may be approved for release to the market by all available directors in conjunction with the Disclosure Committee. Further, in circumstances where it is considered appropriate to request a trading halt (for example, where Computershare is required to disclose information to the market, but for whatever reason is unable to do so promptly and without delay) the Chief Executive Officer, or if the Chief Executive Officer is unavailable, the Chairman or the Chief Financial Officer, is authorised to request a trading halt on behalf of the Company. The full Board is to be consulted as far as is practicable on any request for a trading halt. A copy of the Board-approved Market Disclosure Policy is available from the corporate governance section of 34 Computershare Annual Report 2017
35 19. EXTERNAL AUDITORS The Company s policy is to appoint external auditors who demonstrate professional ability and independence. The auditor s performance is reviewed annually. PricewaterhouseCoopers were appointed as the external auditors in May PricewaterhouseCoopers normally rotates audit engagement partners on listed companies every five years. It is also PricewaterhouseCoopers policy to provide an annual declaration of independence, a copy of which can be found on page 52 of this Annual Report. The external auditor is required to attend the Company s Annual General Meeting and be available to answer shareholder questions about the conduct of the audit and the preparation of the content of the audit report, the accounting policies adopted by the Company in relation to the preparation of the financial statements and the independence of the auditor in relation to the conduct of the audit. An analysis of fees paid to the external auditors, including a breakdown of fees for non-audit services, is provided in the Directors Report (see page 51 of this Annual Report). 20. INTERNAL AUDITORS Computershare has a dedicated Group Internal Audit function. The function is led by the Group Head of Internal Audit who has a reporting line to the Chairman of the Risk and Audit Committee. Group Internal Audit is authorised to audit all areas of the Computershare Group without the need for prior approval. In carrying out its responsibilities, it has full and unrestricted access to all records, property, functions, IT systems and staff in the Group. Each financial year, the function develops an annual audit plan which is approved by the Risk and Audit Committee. The function s key responsibilities are to review and appraise the adequacy, design and effectiveness of the Group s system of internal controls and evaluate and improve the effectiveness of risk management, control and governance processes and to identify control gaps. On completion of audit assignments, Internal Audit will issue written reports which are distributed to management and communicated to the Risk and Audit Committee. Where the report identifies specific findings and recommendations, the report will include an action plan from management to implement appropriate corrective action. All internal audits are conducted in accordance with the Institute of Internal Auditor s Standards for the Professional Practice of Internal Auditing. 21. WHISTLEBLOWING The Board has approved a Whistleblower Policy that specifically outlines procedures for dealing with allegations of improper conduct made by directors, officers or employees of the Company or parties external to Computershare. Concerns can be raised anonymously in a number of ways, including through the Company s online whistleblower reporting system, by telephone or by mail. Any reported concerns are assessed and handled by regional Whistleblower officers. The Group Whistleblower Officer also provides quarterly reports to the Group Risk and Audit Committee on any concerns reported over the period. All Computershare employees have received training about the Company s Whistleblower Policy, including how to detect and report improper conduct. A copy of the Whistleblower Policy is available from CORPORATE AND SOCIAL RESPONSIBILITY For details relating to the Company s corporate and social responsibility initiatives, see pages 16 to 17 of this Annual Report. 23. HEALTH AND SAFETY Computershare aims to provide and maintain a safe and healthy work environment. Computershare acts to meet this commitment by implementing work practices and procedures throughout the Group that comply with the relevant regulations governing workplaces in each country in which the Group operates. Employees are expected to take all practical measures to ensure a safe and healthy working environment, in keeping with their defined responsibilities and applicable laws. 24. COMPANY SECRETARY The Company Secretary during the reporting period was Dominic Horsley. Under Computershare s Constitution, the appointment and removal of the Company Secretary is a matter for the Board. Among other matters, the Company Secretary advises the Board on governance procedures and supports their effectiveness by monitoring Board policy and procedures, coordinating the completion and dispatch of Board meeting agendas and papers and assisting with the induction of new Directors. The Company Secretary is accountable to the Board, through the Chairman, for these responsibilities. Dominic Horsley joined the Company in June 2006, having previously practised law at one of Asia Pacific s leading law firms and worked as a Corporate Counsel with a major listed Australian software and services supplier. Dominic completed a Bachelor of Arts (Hons) in Economics at the University of Cambridge and completed his legal studies at the College of Law in London. Dominic is also the Chief Legal Counsel for the Group s Asia Pacific operations and is a Fellow of the Governance Institute of Australia. All directors have access to the advice and services of the Company Secretary. 35
36 DIRECTORS REPORT DIRECTORS REPORT The Board of Directors of Computershare Limited has pleasure in submitting its report in respect of the financial year ended 30 June DIRECTORS The names of the directors of the Company in office during the whole year and up to the date of this report, unless otherwise indicated, are: Non-executive Simon David Jones (Chairman) Christopher John Morris Tiffany Lee Fuller Markus Erhard Kerber Penelope Jane Maclagan Arthur Leslie Owen Joseph Mark Velli Executive Stuart James Irving (President and Chief Executive Officer) PRINCIPAL ACTIVITIES The principal activities of the Group are outlined in the Group Operating Review set out on pages 20 to 21 and form part of this report. CONSOLIDATED PROFIT The profit of the consolidated entity for the financial year was $271.7 million after income tax. Net profit attributable to members of the parent entity was $266.4 million, which represents an increase of 69.3% on the previous year s result of $157.3 million. Profit of the consolidated entity for the financial year after management adjustment items was $297.3 million after income tax and non-controlling interests. This represents a decrease of 2.0% on the 2016 result of $303.5 million. Net profit after management adjustment items is determined as follows: Net profit attributable to members of the parent entity 266, ,334 Management adjustment items (net of tax): Amortisation Amortisation of intangible assets 39,302 64,043 Acquisitions and disposals Gain on disposals (48,838) (325) Acquisition related restructuring costs 1,443 1,304 Acquisition accounting adjustments (1,056) 46,341 Acquisition and disposal related expenses 666 2,408 Foreign currency translation reserve write-off on disposals - 25,904 Gain on acquisition - (8,891) Asset write-down - 1,687 Other Major restructuring costs 20,477 8,465 Voucher Services impairment 11,315 - Put option liability re-measurement 7,080 7,526 Marked to market adjustments derivatives 488 (2,256) Net profit after management adjustment items 297, , Computershare Annual Report 2017
37 Management adjustment items Management results are used, along with other measures, to assess operating business performance. The Group believes that exclusion of certain items permits better analysis of the Group s performance on a comparative basis and provides a better measure of underlying operating performance. Description of management adjustment items can be found in note 4 of the financial statements. The non-ifrs financial information contained within this Directors report has not been audited in accordance with the Australian Auditing Standards. DIVIDENDS The following dividends of the consolidated entity have been paid or declared since the end of the preceding financial year: Ordinary shares A final dividend in respect of the year ended 30 June 2016 was declared on 10 August 2016 and paid on 13 September This was an ordinary dividend of AU 17 cents per share franked to 20% amounting to AUD 92.9 million ($69.8 million). An interim dividend was declared on 15 February 2017 and paid on 22 March This was an ordinary dividend of AU 17 cents per share franked to 30% amounting to AUD 92.9 million ($69.8 million). A final dividend in respect of the year ended 30 June 2017 was declared by the directors of the Company on 16 August 2017 and paid on 18 September This was an ordinary unfranked dividend of AU 19 cents per share. As the dividend was not declared until 16 August 2017, a provision was not recognised as at 30 June REVIEW OF OPERATIONS The review of operations is outlined in the Group Operating Review set out on pages 20 to 21 and forms part of this report. SIGNIFICANT EVENTS AND SIGNIFICANT CHANGES IN ACTIVITIES A discussion of significant events and significant changes in activities, if applicable, is included in the Group Operating Review set out on pages 20 to 21 and forms part of this report. In the opinion of the directors, there were no other significant changes in the affairs of the consolidated entity during the financial year under review that are not otherwise disclosed in this report or the consolidated accounts. SIGNIFICANT EVENTS AFTER YEAR END No other matter or circumstance has arisen since the end of the financial year which is not otherwise dealt with in this report or in the consolidated financial statements that has significantly affected or may significantly affect the operations of the consolidated entity, the results of those operations, or the state of affairs of the consolidated entity in subsequent financial years. For details of significant post balance date events refer to notes 9 (disposal of Karvy Computershare Private Limited) and 28 (share buy-back). LIKELY DEVELOPMENTS AND FUTURE RESULTS A discussion of business strategies and prospects is set out on pages 22 to 23 and forms part of this report. ENVIRONMENTAL REGULATIONS The Computershare Group is not subject to significant environmental regulation. INFORMATION ON DIRECTORS The qualifications, experience and responsibilities of directors together with details of all directorships of other listed companies held by a director in the three years to 30 June 2017 and any contracts to which the director is a party to under which they are entitled to a benefit are outlined in the Corporate Governance Statement and form part of this report. 37
38 DIRECTORS REPORT Directors interests At the date of this report, the direct and indirect interests of the directors in the securities of the Company are: Name Number of ordinary shares Number of performance rights SJ Irving 27, ,692 TL Fuller 2,000 - SD Jones 19,957 - ME Kerber 40,000 - PJ Maclagan 11,543,868 - CJ Morris 35,131,000 - AL Owen 12,910 - JM Velli 10,000 - Meetings of directors The number of meetings of the Board of Directors (and of Board Committees) and the number of meetings attended by each of the directors during the financial year were: Directors Meetings Risk and Audit Committee Meetings Nomination Committee Meetings Remuneration Committee Meetings A B A B A B A B SJ Irving TL Fuller SD Jones ME Kerber PJ Maclagan CJ Morris AL Owen JM Velli A Number of meetings attended B Number of meetings held during the time the director held office during the financial year. The Board also has an Acquisitions Committee comprising SD Jones, ME Kerber, CJ Morris, SJ Irving and MB Davis (Chief Financial Officer). The Committee receives a monthly report and meets on an informal basis as necessary. Accordingly, it is not included in the above table. The Board also forms sub-committees to consider specific transaction opportunities as appropriate. INFORMATION ON COMPANY SECRETARY The qualifications, experience and responsibilities of the Company Secretary are outlined in the Corporate Governance Statement and form part of this report. INDEMNIFICATION OF OFFICERS During the period, the Group paid an insurance premium to insure directors and executive officers of the Group and its controlled entities against certain liabilities. Disclosure of the amount of insurance premium payable and a summary of the nature of liabilities covered by the insurance contract is prohibited by the insurance policy. 38 Computershare Annual Report 2017
39 REMUNERATION REPORT This report covers: A. Remuneration strategy B. A summary of key remuneration highlights in the current financial year C. The structure of remuneration at Computershare D. Details of remuneration and service contracts E. Proportions of fixed and performance related remuneration F. Other information A. REMUNERATION STRATEGY Computershare s remuneration strategy is designed to: > > Be competitive in the local employment market where an executive is based so as to support the attraction and retention of a talented executive team. > > Motivate executives to deliver excellent performance; and > > Align remuneration outcomes for executives with the interests of shareholders. Computershare s remuneration strategy and structure is reviewed by the Board and the Remuneration Committee on an ongoing basis for its appropriateness and effectiveness. B. A SUMMARY OF KEY REMUNERATION HIGHLIGHTS IN THE CURRENT FINANCIAL YEAR Set out below are some of the key remuneration outcomes and highlights which occurred during the FY2017 year: > > There was no broad based salary increase for staff globally. There was also no general salary increase for the Group s executive and key management personnel and no increase in non-executive director fees. > > Short-term incentive (STI) outcomes for senior executives were modestly up in FY2017 on FY2016 this was attributable to an improvement in FY2017 Group EBITDA as compared to budget and there was also an increase in Group management EPS of approximately 3.5% as compared to FY2016 on a constant currency basis. > > Long term incentive awards granted in FY15 were tested against their relevant performance hurdles based on performance over 1 July 2014 to 30 June Awards subject to the management EPS hurdle failed to meet the threshold EPS target of US cents per share. Awards subject to the TSR hurdle narrowly missed the vesting threshold of 50% with Computershare s ranking of 43% (being the 57 th ranked company in the peer group of the ASX100). > > The final award of performance rights under Computershare s legacy long-term incentive plan that were granted in 2012 are vesting in August/September The 50% of the awards that were subject to a performance target of at least 7.5% annual compound growth in management EPS over a five year performance period will lapse as the target was not met. The 50% of awards subject to a retention condition will vest for those executives who satisfy the five year period. This equates to 475,000 vested shares. > > Computershare staff remain active participants in the various share plans offered by Computershare globally with participation rates for the broad based plans typically exceeding more than 60% of eligible staff. The Board also undertook a benchmark review of the Group CEO s remuneration in financial year This was the first benchmark review of the Group CEO s remuneration undertaken since his appointment in The outcome of the review revealed that the Group CEO s remuneration was substantially below market rates as compared to industry and size based peers with total remuneration being well below the 25th percentile. As a result of that review, the Board approved a market adjustment to the Group CEO s base salary from AUD 910,000 to AUD 1,190,000 (equal to a 30.7% increase) and a corresponding increase in total remuneration. Following and despite the review, the Group CEO s remuneration in FY2017 still remained significantly below the 25th percentile when compared to a peer group of companies with comparative market capitalisation. The Board also undertook a further review in FY2017 of the structure of the remuneration incentives and mix for the Group CEO and Group CFO. As a result, the Board has implemented changes effective from FY18 onwards to simplify the structure of the STI plan for the Group CEO and Group CFO and to further align it to the Group s strategic objectives. The Board also determined to adjust for these executives the remuneration mix between STI and LTI such that the amount allocated to STI has been increased and the amount allocated to LTI has been correspondingly decreased. Further details regarding these changes will be provided in the remuneration disclosures for FY18. The statutory pay disclosures for the Group CEO in FY2017 as set out on page 45 of this report include an amount in respect of Other benefits paid. These exclusively relate to payments made in accordance with the Group s expatriate policy as the Group CEO agreed to relocate himself and his family to the United Kingdom for a short term period because of a number of key strategic projects currently taking place across the Group in the northern hemisphere. 39
40 DIRECTORS REPORT C. THE STRUCTURE OF REMUNERATION Non-executive directors Computershare s total non-executive directors fee pool has a limit of AUD 2.0 million. This limit was approved by shareholders in November SD Jones receives a fixed fee of AUD 325,000 as Chairman. All other non-executive directors receive a base fee of AUD 150,000. TL Fuller receives an additional AUD 75,000 as the Chair of the Risk and Audit Committee and other non-chair members of the Risk and Audit Committee (AL Owen and SD Jones) receive an additional AUD 25,000 per annum as members on that committee. JM Velli, as Chairman of the Remuneration Committee receives an additional AUD 25,000 for performing those duties. These fees are inclusive of statutory superannuation where applicable. Market data obtained by Computershare confirmed that non-executive director fees are at or below the 25th percentile when compared to companies in the ASX 100 as well as a smaller comparator group of companies by market capitalisation. There were no non-executive director fee increases in FY2017. Computershare has adopted a policy that if any director wishes to receive their director fees in a different currency to AUD, then they can elect to do so and an exchange rate will be struck at the start of each financial year for the fees payable in that year. The Board has recently amended this policy such that if there is material change (up or down) in the foreign exchange rate applicable to an overseas director that director s fee in AUD will be adjusted accordingly. No bonuses, either short or long-term, are paid to non-executive directors. They are not provided with retirement benefits other than statutory superannuation entitlements (where applicable). They do not receive shares or options from Computershare. CEO and other senior executives Remuneration for the CEO and other key senior executives comprises three main components, being a fixed base salary (which is not at risk), a variable short-term incentive (STI) which is calculated by reference to current year s performance and a variable long-term incentive (LTI) which comprises awards of performance rights over shares in Computershare. For the Group CEO and CFO the mix between fixed, short-term variable and long-term variable remuneration in FY2017 was as follows (based on on-target performance): Fixed remuneration Variable remuneration Base Salary STI LTI CEO/CFO 35% 15% 50% Short-term incentives STI incentives for senior executives at Computershare in FY2017 comprised a cash bonus (CSTI) and a grant of Computershare shares made on a deferred vesting basis (DSTI). Executives are provided with an on target package guide which is an amount equal to the value of the base salary and their STI assuming on target performance. If an executive achieves on target performance their total STI award would be equal to approximately 43% of their base salary. The maximum entitlement that an executive could receive as an STI would be 75% of their base salary. 40 Computershare Annual Report 2017
41 The following table explains how each component of the STI (being the CSTI and the DSTI) are determined and the limits that apply to each component. Component CSTI (short-term cash bonus) DSTI (short-term incentive satisfied by the grant of equity on a deferred basis) % of on target package guide 15% (equal to 21.4% of base salary) 15% (equal to 21.4% of base salary) Minimum entitlement Nil Nil Maximum entitlement Measurement Comment 22.5% of the on target package guide (equal to 32% of base salary) 30% of the on target package guide (equal to 43% of base salary) 70% of CSTI is calculated by reference to performance against the budgeted management EBITDA of the business unit(s) or region(s) for which the relevant executive is responsible. On target performance for an executive is meeting the relevant budgeted management EBITDA target for that executive and the maximum entitlement is reached if the executive achieves 120% of their budgeted management EBITDA target. No CSTI is payable based on financial performance if the executive achieves less than 80% of their target. The remaining 30% of CSTI is calculated based on personal objectives tailored to the executive s responsibilities and role. Matters typically covered include cost control, business expansion, risk management and service levels. 50% of DSTI is calculated by reference to the Group s management earnings per share (EPS) growth over the year on a constant currency basis. On target performance is management EPS growth over the financial year of 7.5% and the maximum entitlement is reached if management EPS growth over the financial year exceeds 15%. No DSTI is payable based on management EPS growth if EPS growth over the year is 0% or less. The remaining 50% of DSTI is calculated based on strategic, cultural and organisational measures. These measures are regularly reviewed and typically cover non-financial performance, leadership, replaceability and character. Calculated and paid annually after the release of the annual results. The CSTI strongly aligns the executive s CSTI with the performance of the business unit(s) or region(s) they manage. Calculated annually after the release of the annual results. Grants are not generally made until after the release of the annual report. The DSTI aligns an executive s remuneration with the overall Group s performance, and provides an incentive for executives to work to maximise overall Group performance as well as the performance of the particular business unit(s) they manage. Deferred vesting: DSTI grants are unable to be sold for two years after the date of grant and are also subject to forfeiture if an executive resigns or is terminated for cause in this period. DSTI grants are designed as an incentive to encourage long-term, sustainable performance. The management adjustment items applied to determine management EBITDA (for CSTI) and management EPS (for DSTI) are set out in note 4 of the financial statements. The Board retains the discretion to review management adjustment items before the calculation of STI awards to executives. STI outcomes in the 2017 financial year The table below shows the STI paid or payable to each Computershare executive who is identified as key management personnel for entitlements referable to performance in the financial year ended 30 June The table sets out the actual amounts awarded as STI and how they relate to the maximum entitlement for each executive. Executive STI awarded (USD) STI as percentage of maximum SJ Irving 459, % SA Cameron 121, % PA Conn 218, % MB Davis 285, % SHE Herfurth 136, % ML McDougall 152, % SR Rothbloom 451, % N Sarkar 205, % SS Swartz 142, % JLW Wong 269, % 41
42 DIRECTORS REPORT Long-term incentives The Group CEO and CFO and other eligible senior executives also receive as part of their total remuneration a long-term incentive award which comprises a grant of performance rights (also known as zero exercise price options) over Computershare shares. The executives who receive long-term incentive awards will generally comprise the executives who are identified as key management personnel in this report as well as a small number of other senior executives who are identified as being particularly important to the longer term future of Computershare. Details of the long-term incentive plan, which is known as Computershare s LTI plan, are set out below. Key features of the LTI plan Eligibility Participants in the LTI plan comprise the Group s CEO and CFO and a limited pool of the most senior executives who are important to the Company s future. Frequency and value of grants Awards under the LTI plan will typically be made annually. A resolution to approve the proposed grant of performance rights under the LTI plan to the Group CEO is put to shareholders each year at the Company s AGM. The value of an award made to an eligible executive under the LTI plan is calculated as a percentage of the executive s base salary plus on target STI award (being both the cash (CSTI) and deferred shares (DSTI) components). For awards made in November 2016, the Group CEO and CFO received an LTI award equal to 50% of their total remuneration package. For other eligible executives, the value of their LTI award was in a range of approximately 25% to 35% of their total remuneration package. The actual number of performance rights that an eligible executive receives is calculated by dividing that executive s LTI award entitlement by the face value of Computershare s share price. For a grant of performance rights in a given financial year, face value is the volume weighted average share price over the five trading days after the full year results announcement for the prior financial year. For awards made in November 2016 in respect of the financial year 2017, the face value of Computershare s share price for the purpose of calculating LTI award entitlements was AUD EPS growth performance hurdle Under the LTI plan, 50% of each award is subject to a management EPS growth hurdle that is tested once at the end of a three year performance period and will vest in accordance with the table below: Performance rights subject to Compound annual growth in management adjusted EPS over the performance period EPS hurdle that vest (%) Maximum % or above 15% or greater 100% Between threshold % and maximum % Between 5% and 15% Progressive pro rata vesting between 50% to 100% (i.e. on a straight line basis) Threshold % 5% 50% Less than the threshold % Less than 5% 0% The Board believes that the EPS growth hurdle under the LTI plan provides an appropriate incentive to its management team to achieve sustainable growth outcomes for the Computershare Group over the longer term. The Board reviews the management EPS performance hurdles from time to time to ensure that this remains the case. Total Shareholder Return performance hurdle The remaining 50% of each award under the LTI plan is subject to a performance measure based on Total Shareholder Return or TSR. For these purposes, TSR means the change in shareholder value over the performance period by measuring movement in share price plus dividends (assuming reinvestment). The performance measure compares the TSR of Computershare s shares against the TSR of the companies within the ASX 100 index at the start of the performance period on the following basis: Relative TSR ranking against peer group Performance rights subject to TSR hurdle that vest (%) At or above the 75th percentile 100% Between the 50th to 75th percentile Progressive pro rata vesting between 50% to 100% (i.e. on a straight line basis) Equal to the 50th percentile 50% Below the 50th percentile 0% The Board has chosen to compare the TSR of Computershare against the ASX 100 index as there is not a narrow comparator group of companies that are listed on exchanges globally that Computershare can readily compare itself with. The Board believes that having a performance measure that compares Computershare s TSR performance with the TSR of companies in a broad index (the ASX 100) will further align the remuneration outcomes for its senior executives with the investment performance of its shareholders. 42 Computershare Annual Report 2017
43 As at the date of this report, there are 1.5 million performance rights outstanding under the LTI plan. These include 750,375 performance rights that were granted to 13 executives in the financial year 2017 and which are due to vest in September 2019 (subject to performance against hurdles). Other plan features Other features of the LTI plan include Board discretion to determine award outcomes for executives in certain circumstances such as cessation of employment or a change of control and also to cash settle awards on vesting if local regulations or practices make it appropriate to do so. The LTI plan also includes a clawback mechanism that may be triggered in the event of fraud, dishonesty or material misstatement of financial statements. LTI outcomes in the 2017 financial year LTI awards that were granted in November 2014 were subject to performance hurdles based on performance over the period 1 July 2014 to 30 June For performance rights subject to the EPS performance hurdle, to meet the vesting threshold of 5% compound growth in EPS over the performance period would have required FY2017 EPS to be at least US cents per share. Accordingly, all of the LTI awards subject to the EPS performance test lapsed. For performance rights subject to the TSR performance hurdle, Computershare s relative TSR ranking against the peer group was 43% and this was below the threshold vesting hurdle of 50%. Accordingly, all of the LTI awards subject to the TSR performance test lapsed. Overview of the legacy DLI plan The Computershare LTI plan was introduced in 2014 following a review of the then current long-term incentive plan which was known as the Deferred Long-Term Incentive Plan (DLI plan). The DLI plan is now a legacy plan and vesting of the final awards under that plan is occurring in August / September The DLI plan comprised awards of performance rights where 50% of awards were subject to a performance hurdle based on Computershare meeting management EPS growth targets, while the remaining 50% were subject to a retention condition which is satisfied if the relevant executive remains with Computershare for five years. Of the final awards that were granted in 2012, the 50% of awards subject to a retention period have or will vest in full for executives who remain employed on the vesting date and all of the 50% of awards subject to the management EPS hurdle have or will lapse. Other remuneration Like all our employees, key management personnel can participate in the Group s general employee share plans. An overview of the Group s employee option and share plans is disclosed in note 41 of the financial statements. Computershare pays cash bonuses and makes STI awards (but not LTI grants) to a further group of senior executives in accordance with the same STI structure as outlined above. Computershare will also generally pay discretionary cash bonuses and make allocations of shares (subject to deferred vesting periods) to an additional broader pool of high performing employees who are not participants in the structured STI award program. On occasions, the Group allocates shares (subject to deferred vesting periods) outside the structured annual cycle, for instance as sign-on incentives, as part of specific project incentives or in recognition of exceptional performance. Relationship between remuneration and Group s performance One of the key principles of Computershare s remuneration strategy is to ensure that there is a link between the remuneration outcomes for executives and company performance and its consequent impact on shareholder interests. The Board believes that the use of a management EPS growth hurdle and a relative TSR hurdle under the Group s executive LTI plan supports that alignment. Similarly the Board believes that short-term incentive outcomes for executives should reflect a combination of personal objectives as well as targets that are based on financial performance. The following table highlights some of the key financial results for Computershare over the period from the financial year 2013 to the financial year 2017 with the corresponding average STI outcomes for executive key management personnel over the same period Management EBITDA (USD million) Statutory EPS (US cents) Management EPS (US cents) Management EPS (US cents) constant currency Total Dividend (AU cents per share) Share price as at 30 June (AUD) Average STI received as % of maximum opportunity for executive KMP (%) Translated at FY2017 average exchange rates 43
44 DIRECTORS REPORT D. DETAILS OF REMUNERATION AND SERVICE CONTRACTS Directors The directors of Computershare Limited who held the position during the current financial year are listed below. Non-executive Executive CJ Morris TL Fuller SD Jones ME Kerber PJ Maclagan AL Owen JM Velli SJ Irving President and Chief Executive Officer Key management personnel other than directors The individuals listed below are key management personnel of the Group other than directors (within the meaning of the Australian accounting standard AASB 124 Related Party Disclosures) who have the authority and responsibility for planning, directing and controlling the activities of the Group. All individuals named below held their position for the whole of the financial year ended 30 June Name Position Employer SA Cameron President Australia and New Zealand Computershare Investor Services Pty Ltd PA Conn President Global Capital Markets Computershare Inc (US) MB Davis Chief Financial Officer Computershare Ltd SHE Herfurth President Continental Europe CPU Deutschland GmbH & Co KG ML McDougall Chief Information Officer Computershare Technology Services Pty Ltd SR Rothbloom President North America Computershare Inc (US) N Sarkar President United Kingdom, Channel Islands, Ireland and South Africa Computershare Investor Services PLC (UK) SS Swartz President Canada Computershare Trust Company of Canada JLW Wong President Asia Computershare Hong Kong Investor Services Limited Service contracts On appointment to the board, all non-executive directors sign a formal appointment letter which includes details of their director fees. Non-executive directors do not have notice periods and are not entitled to receive termination payments. Except for the Group CEO, no director may be in office for longer than three years without facing re-election. Please refer to Section 3 of the Corporate Governance Statement for further information on the Company s re-election process. Neither the Group CEO nor other executive key management personnel are employed under fixed term arrangements with Computershare. Their notice periods are based on contractual provisions and local laws (e.g. for the Group CEO and CFO and for those executives based in Australia this is 30 days notice). On termination of employment key management personnel are entitled to statutory entitlements in their respective jurisdictions of employment. The DSTI plan provides for full vesting on redundancy or termination by the Group other than for cause. The DLI plan has a structured pro rata arrangement in the same circumstances and under the LTI plan, subject to Board discretion otherwise, performance rights for good leavers will not vest on cessation of employment but instead a pro rata proportion will be eligible to be retained by the executive and will be subject to vesting at the end of the original performance period based on satisfaction of the applicable performance measures. Otherwise, none of these executives would, subject in some instances to local requirements in the jurisdictions where the Group operates, receive special termination payments should they cease employment for any reason. Amounts of remuneration Details of the nature and amount of each element of the total remuneration for each director and member of key management personnel for the year ended 30 June 2017 are set out in the table below. Where remuneration was paid in anything other than USD, it has been translated at the average exchange rate for the financial year (for example the 2017 USD/AUD average rate was , the 2016 USD/AUD average rate was ). 44 Computershare Annual Report 2017
45 Statutory remuneration details Financial Year Short-term Salaries and fees $ Cash profit share and bonuses $ Long-term Other 1 $ Post employment benefits Share based payments expense Other 4 Total Superannuation /pension $ Shares $ Performance rights/ options 2 $ Phantom plan 3 $ $ $ Directors SJ Irving , ,584 44,764 14, , ,378 1,989, , ,109 11,046 14,043 11, , ,139,060 TL Fuller , , , , , ,539 SD Jones , , , , , ,342 ME Kerber , , , ,159 PJ Maclagan , , , ,099 CJ Morris , , , ,311 AL Owen , , , ,966 JM Velli , , , ,171 Other key management personnel SA Cameron ,882 68,092 (817) 14,753 39, ,345-1, , ,481 72,487 (777) 14,043 55, , ,997 PA Conn , , , , , , , ,369 (39,118) ,121 MB Davis 5⁵ , ,336 10,075 14,753 91, ,818-2,220 1,200, , ,025 9,773 14, , ,549-2, ,651 SHE Herfurth ,290 79, ,022 69,064 3, , ,020 71, ,657 26,890 2, ,763 ML McDougall ,851 89,919 6,581 14,753 57,531 72,879-6, , ,854 84,917 6,364 14,043 71,674 53,724-2, ,742 SR Rothbloom ,190, ,272-29, , , ,816, ,190, ,779-29, ,190 (13,530) - - 1,643,428 N Sarkar , , , ,743-2, , , ,786-45,596 89,251 41,393-2, ,024 SS Swartz ,679 81,339-12,873 44,295 81,002-3, , ,450 51,242-13,665 42,855 58,969-2, ,099 JLW Wong , , ,869 71, ,838-2,144 1,148, , , ,719 87,958 (10,917) - 2, ,288 1 Other long-term remuneration comprises long service leave accruals and other long-term entitlements. 2 Performance rights expense has been included in the total remuneration on the basis that it is considered probable at the date of this financial report that the performance condition and service condition will be met. In future reporting periods, if the probability requirement regarding the EPS performance condition or the service condition is not met, a credit to remuneration will be included consistent with the accounting treatment. As part of the 2018 financial year budget process, it was no longer considered probable that the performance condition applicable to 50% of the performance rights granted on 1 December 2015 would be met. On this basis, the accounting expense (excluding the TSR component) related to prior years has been reversed. Similarly, for the 2016 financial year the expense related to the 50% of the performance rights granted on 25 September 2012 and 100% of the performance rights granted on 1 December 2014 was reversed. 3 The Phantom Share Awards Plan (Phantom Plan) functions as an alternative to the DSTI Share Plan to employees who are resident for tax purposes in countries where the taxation and/or legal requirements mean the DSTI Share Plan does not achieve the most effective outcome for Computershare or those employees. Awards under the Phantom Plan are cash-settled and vest after specified periods of service have been completed. 4 Other includes payments made to key management personnel engaged on overseas assignments in accordance with Computershare s expatriate policy and benefits related to Computershare s general employee share plan as detailed in note 41 of the financial statements. For SJ Irving, the amount reflects payments for his and his family s relocation to the United Kingdom on a short term basis due to business requirements. 5 Key management personnel are paid in their local currency. Foreign exchange rate movements can impact on comparison between the years in US dollar terms. 45
46 DIRECTORS REPORT Actual remuneration received The table below represents the actual remuneration outcomes for executive key management personnel in the financial year Amounts paid in currencies other than USD are translated at average exchange rates applicable to each financial year. Statutory remuneration disclosures prepared in accordance with the Corporations Act 2001 and Australian Accounting Standards differ from the numbers presented below, as they include (among other benefits) expensing for equity grants that are yet to vest and may never vest. The statutory remuneration table in respect of the executive key management personnel is presented in the table above. Financial year Fixed pay 1 $ Cash STI for performance $ Other benefits and cash payments 2 $ Deferred STI vested 3 $ Performance rights vested 4 $ Total actual remuneration $ SJ Irving , , , ,128 2,129, , , ,999-1,094,977 SA Cameron ,635 74,954 2,989 59, ,838 1,222, ,524 54,631 3,877 66, ,274 PA Conn , ,320-80, , , , , ,290 MB Davis , , , ,128 1,448, , , , ,595 SHE Herfurth ,290 70,215 3,441 64, ,838 1,213, ,020 94,602 2,847 66, ,837 ML McDougall ,604 87,807 4,405 73, , ,897 86,100-77, ,154 SR Rothbloom ,219, , ,286-1,675, ,219, , ,001-1,628,558 N Sarkar ,656 91,225 5,325 85, ,419 1,084, , ,764 3,086 91, ,646 SS Swartz ,552 51, , , ,115 74, ,322 JLW Wong , ,381 37,936 93, ,419 1,446, , ,015 25, ,521-1,067,284 1 Represents base salary plus superannuation/pension. 2 Other includes payments made to key management personnel engaged on overseas assignments in accordance with Computershare s expatriate policy and shares held in the Deferred Employee Share Plan (note 41) that vested in the relevant financial year and the phantom shares vesting. For SJ Irving, the amount reflects payments for his and his family s relocation to the United Kingdom on a short term basis due to business requirements. 3 Deferred STI that vested in the relevant financial year. The five day weighted average share price used to value the deferred STI at vesting date is AUD 9.90 for awards vested on 1 September 2016 (1 September 2015: AUD 9.87). 4 Performance rights that vested in the relevant financial year. These were rights granted under the legacy DLI plan, which were generally granted on a non-annual basis and with a five-year performance and retention period. The five-day weighted average share price used to value the performance rights at vesting date is AUD for awards vested on 19 September Key management personnel are paid in their local currency. Foreign exchange rate movements can impact on comparison between the years in US dollar terms. 46 Computershare Annual Report 2017
47 1. Short-term salary and fees, cash profit share and bonuses, long-term other, post-employment benefits Directors SJ Irving, TL Fuller, SD Jones, PJ Maclagan, and CJ Morris are paid in Australian dollars. Although the non-executive director fees for ME Kerber, AL Owen and JM Velli are set in Australian dollars, they can elect to be paid in Euros, British pounds and United States dollars respectively based on an exchange rate set at the start of each financial year. Group CEO and other executive key management personnel There were no general increases to base salary and STI award packages for the executive key management personnel in the financial year S Swartz received an increase of CAD 25,000 in financial year 2017 in recognition of his greater experience in the role. All executive key management personnel receive their salary and other cash payments in their local currency. 2. Shares granted as remuneration under DSTI Plan Set out below is a summary of shares granted under the DSTI plan and the maximum value of shares that are expected to vest in the future if the vesting conditions are met: Date granted Number granted Number vested during the year Number outstanding end of the year Financial year in which grant may vest Value at grant date (if granted this year) Maximum total value of grant yet to be expensed $ $ SA Cameron 1/10/2014 7,981 (7,981) - Vested - - 1/10/2015 4,241-4,241 FY ,033 1/10/2016 5,082-5,082 FY ,071 24,465 PA Conn 1/10/ ,879 (10,879) - Vested - - 1/10/2015 7,751-7,751 FY ,543 1/10/2016 9,738-9,738 FY ,783 46,880 MB Davis 1/10/ ,538 (14,538) - Vested - - 1/10/ ,568-10,568 FY ,557 1/10/ ,512-11,512 FY ,770 55,420 SHE Herfurth 1/10/2014* 8,468 (8,468) - Vested - - 1/10/2015* 4,719-4,719 FY ,242 1/10/2016* 5,935-5,935 FY ,797 37,346 ML McDougall 1/10/2014 9,940 (9,940) - Vested - - 1/10/2015 6,362-6,362 FY ,550 1/10/2016 7,508-7,508 FY ,199 36,145 SR Rothbloom 1/10/ ,161 (25,161) - Vested - - 1/10/ ,460-11,460 FY ,195 1/10/ ,798-19,798 FY ,104 95,310 N Sarkar 1/10/ ,539 (11,539) - Vested - - 1/10/2015 9,327-9,327 FY ,670 1/10/ ,822-11,822 FY ,215 56,913 SS Swartz 1/10/2014 5,196 (5,196) - Vested - - 1/10/2015 5,114-5,114 FY ,657 1/10/2016 6,143-6,143 FY ,437 29,573 JLW Wong 1/10/ ,574 (12,574) - Vested - - 1/10/2015 6,881-6,881 FY ,921 1/10/ ,560-10,560 FY ,264 50,837 * Awards made under the Phantom Plan Fair values of shares at grant date are determined using the closing share price on grant date. 47
48 DIRECTORS REPORT 3. Performance rights Performance rights granted under the DLI plan and the LTI plan are for no consideration and carry no dividend or voting rights. Each performance right carries an entitlement to one fully paid ordinary share in Computershare Limited. Set out below is a summary of performance rights granted under the DLI and LTI plans. Date granted Number granted Number vested during the year Number lapsed during the year Number outstanding end of the year Financial year in which grant may vest Value at grant date (if granted this year) Maximum total value of grant yet to be expensed $ $ SJ Irving 12/10/ ,000 (75,000) (75,000) - FY /09/ , ,000 FY /12/ , ,084 FY /12/ , ,522 FY ,128 16/12/ , ,170 FY ,277, ,806 SA Cameron 04/05/ ,000 (100,000) (100,000) - FY /09/ , ,000 FY /12/ , ,654 FY /12/ , ,144 FY ,235 16/12/ , ,036 FY , ,382 PA Conn 25/09/ , ,000 FY /12/ , ,937 FY /12/ , ,024 FY ,228 16/12/ , ,708 FY , ,797 MB Davis 12/10/ ,000 (75,000) (75,000) - FY /09/ , ,000 FY /12/ , ,728 FY /12/ , ,461 FY ,612 16/12/ , ,115 FY , ,226 SHE Herfurth 12/10/ ,000 (100,000) (100,000) - FY /09/ , ,000 FY /12/ , ,069 FY /12/ , ,768 FY ,067 16/12/ , ,314 FY , ,780 ML McDougall 1/12/ , ,533 FY /12/ , ,885 FY ,657 16/12/ , ,783 FY , ,110 SR Rothbloom 25/09/ , ,000 FY /12/ , ,086 FY /12/ , ,487 FY ,609 16/12/ , ,583 FY , ,300 N Sarkar 12/10/ ,000 (50,000) (50,000) - FY /09/ , ,000 FY /12/ , ,411 FY /12/ , ,498 FY ,126 16/12/ , ,223 FY , ,430 SS Swartz 1/12/ , ,288 FY /12/ , ,895 FY ,457 16/12/ ,237-37,237 FY , ,399 JLW Wong 12/10/ ,000 (50,000) (50,000) - FY /09/ , ,000 FY /12/ , ,000 FY /12/ , ,698 FY ,018 16/12/ , ,057 FY , , Computershare Annual Report 2017
49 Shareholdings of key management personnel The number of ordinary shares in Computershare Limited held during the financial year by each director and the other named key management personnel, including details of shares granted as remuneration during the current financial year and ordinary shares provided as the result of the exercise of remuneration options during the current financial year, are included in the table below. Balance at beginning of the year Vested under DSTI plan On exercise of options/ performance rights On market purchases/ (sales) Other Balance at end of the year Value of options/ performance rights exercised $ Directors SJ Irving 17,837-75,000 (39,122) - 53,715 - TL Fuller 2, ,000 - SD Jones 17, ,000 - M Kerber 40, ,000 - PJ Maclagan 12,617, (998,157) - 11,618,868 - CJ Morris 37,431, (2,300,000) - 35,131,000 - AL Owen 12, ,910 - JM Velli 10, ,000 - Other key management personnel SA Cameron 78 7, ,000 (108,418) PA Conn 503,752 10,879-1, ,479 - MB Davis 14,420 14,538 75,000 (87,123) - 16,835 - SHE Herfurth 1, ,000 (76,439) ,708 - ML McDougall 63,990 9,940 - (46,481) - 27,449 - SR Rothbloom 83,479 25,161 - (10,497) - 98,143 - N Sarkar 7,782 11,539 50,000 (61,539) 716 8,498 - SS Swartz - 5,196 - (5,196) JLW Wong 163,037 12,574 50,000 (25,000) 4, ,771 - E. PROPORTIONS OF FIXED AND PERFORMANCE RELATED REMUNERATION The percentage value of total remuneration relating to the current financial year received by key management personnel that consists of fixed and performance related remuneration is as follows: % of fixed/ non-performance related remuneration % of total remuneration received as cash bonus (CSTI) % of remuneration received as equity bonus (DSTI) % of total remuneration received as performance related rights/options* SJ Irving 60.14% 10.75% 0.00% 29.11% TL Fuller % 0.00% 0.00% 0.00% SD Jones % 0.00% 0.00% 0.00% ME Kerber % 0.00% 0.00% 0.00% PJ Maclagan % 0.00% 0.00% 0.00% CJ Morris % 0.00% 0.00% 0.00% AL Owen % 0.00% 0.00% 0.00% JM Velli % 0.00% 0.00% 0.00% SA Cameron 50.84% 10.44% 6.08% 32.64% PA Conn 56.10% 12.77% 7.41% 23.72% MB Davis 46.66% 11.60% 6.71% 35.03% SHE Herfurth 49.28% 11.93% 9.96% 28.83% ML McDougall 61.40% 13.06% 8.35% 17.19% SR Rothbloom 63.73% 13.13% 6.73% 16.41% N Sarkar 52.93% 12.02% 8.48% 26.57% SS Swartz 56.70% 13.67% 7.45% 22.18% JLW Wong 65.58% 12.43% 5.93% 16.06% * Excludes the performance rights reversal in the year ended 30 June
50 DIRECTORS REPORT F. OTHER INFORMATION Loans and other transactions with directors and executives Computershare made no loans to directors and executive directors or other key management personnel during the current financial year. CJ Morris had a significant interest in Lumi Technologies Limited until 31 March This entity provides meeting services to Computershare on ordinary commercial terms and conditions. Total value of services provided in the period to 31 March 2017 was $744,152. Computershare also provides services to Lumi Technologies Limited, which comprise rental of premises and voucher services, on ordinary commercial terms and conditions. Total value of services provided in the period to 31 March 2017 was $177,157. The consolidated entity made rental payments related to property used by Computershare and owned by CJ Morris. Payments made in the year ended 30 June 2017 amounted to $27,528. As a matter of Board approved policy, the Group maintains a register of all transactions between employees and the consolidated entity. It is established practice for any director to excuse himself or herself from discussion and voting upon any transaction in which that director has an interest. The consolidated entity has a Board approved ethics policy governing many aspects of workplace conduct, including management and disclosure of conflicts of interest. Derivative instruments Computershare s policy forbids key management personnel to deal in derivatives designed as a hedge against exposure to unvested shares in Computershare Limited. Shares under option Unissued ordinary shares in Computershare Limited under performance rights at the date of this report are as follows: Date granted Financial year of expiry Number under performance rights Performance rights 25/09/ ,000 1/12/ ,916 16/12/ ,375 AUDITOR PricewaterhouseCoopers continues in office in accordance with section 327 of the Corporations Act Auditor s independence declaration A copy of the auditor s signed independence declaration as required under section 307C of the Corporations Act 2001 is provided immediately after this report. Non-audit services The Group may decide to employ its auditor, PricewaterhouseCoopers, on assignments in addition to their statutory audit duties where the auditor s expertise and experience with the Group are important. The Board is satisfied that the provision of non-audit services is compatible with the general standard of independence for auditors imposed by the Corporations Act 2001 and internal guidelines. Further details regarding the Board s internal policy for engaging PricewaterhouseCoopers for non-audit services are set out in the Corporate Governance Statement. The directors are satisfied that the provision of non-audit services by PricewaterhouseCoopers, as set out below, did not compromise the auditor independence requirements of the Corporations Act 2001 for the following reasons: > > No services were provided by PricewaterhouseCoopers that are prohibited by policy (the policy lists services that cannot be undertaken). > > None of the services provided undermine the general principles relating to auditor s independence, including reviewing or auditing the auditor s own work, acting in a management capacity or a decision making capacity for the Group, acting as an advocate for the Group or jointly sharing economic risks and rewards. 50 Computershare Annual Report 2017
51 During the year the following amounts were incurred in relation to services provided by PricewaterhouseCoopers and its network firms. 1. Audit services Audit and review of the financial statements and other audit work by PricewaterhouseCoopers Australia Audit and review of the financial statements and other audit work by network firms of PricewaterhouseCoopers Australia 2,849 2, Other services ,774 3,395 Other assurance services performed by PricewaterhouseCoopers Australia Other assurance services performed by network firms of PricewaterhouseCoopers Australia 1,698 2,139 Tax advice on acquisitions provided by network firms of PricewaterhouseCoopers Australia ,078 2,466 Total Auditor s Remuneration 5,852 5,861 ROUNDING OF AMOUNTS The Group is of a kind referred to in ASIC Corporations (Rounding in Financial/Directors Reports) Instrument 2016/191, issued by the Australian Securities and Investments Commission, relating to the rounding off of amounts in the Directors Report. Amounts in the Directors Report have been rounded off in accordance with that Class order to the nearest thousand dollars unless specifically stated to be otherwise. Signed in accordance with a resolution of the directors. SD Jones Chairman SJ Irving Chief Executive Officer 18 September
52 AUDITOR S INDEPENDENCE DECLARATION Auditor s Independence Declaration As lead auditor for the audit of Computershare Limited for the year ended 30 June 2017, I declare that to the best of my knowledge and belief, there have been: (a) (b) no contraventions of the auditor independence requirements of the Corporations Act 2001 in relation to the audit; and no contraventions of any applicable code of professional conduct in relation to the audit. This declaration is in respect of Computershare Limited and the entities it controlled during the period. Anton Linschoten Melbourne Partner 18 September 2017 PricewaterhouseCoopers PricewaterhouseCoopers, ABN Riverside Quay, SOUTHBANK VIC 3006, GPO Box 1331, MELBOURNE VIC 3001 T: , F: , Liability limited by a scheme approved under Professional Standards Legislation. 52 Computershare Annual Report 2017
53 CONSOLIDATED STATEMENT OF COMPREHENSIVE INCOME for the year ended 30 June 2017 Revenue from continuing operations Sales revenue 2 2,100,811 1,957,860 Other revenue 2 4,951 3,265 Total revenue from continuing operations 2,105,762 1,961,125 Other income 2 62,365 27,740 Expenses Direct services 1,438,887 1,405,410 Technology costs 286, ,570 Corporate services 23,145 22,047 Finance costs 54,394 54,480 Total expenses 1,802,858 1,742,507 Share of net profit/(loss) of associates and joint ventures accounted for using the equity method (1,349) Profit before related income tax expense 365, ,009 Income tax expense/(credit) 6 94,223 83,211 Profit for the year 271, ,798 Other comprehensive income that may be reclassified to profit or loss Available-for-sale financial assets 11 (62) Cash flow hedges - (497) Exchange differences on translation of foreign operations 5,680 (17,005) Income tax relating to components of other comprehensive income 6 (4,078) (6,841) Total other comprehensive income for the year, net of tax 1,613 (24,405) Total comprehensive income for the year 273, ,393 Profit for the year attributable to: Members of Computershare Limited 266, ,334 Non-controlling interests 5,306 4,464 Total comprehensive income for the year attributable to: Note , ,798 Members of Computershare Limited 266, ,912 Non-controlling interests 6,395 3, , ,393 Basic earnings per share (cents per share) cents cents Diluted earnings per share (cents per share) cents cents The above consolidated statement of comprehensive income is presented in United States dollars and should be read in conjunction with the accompanying notes. 53
54 CONSOLIDATED STATEMENT OF FINANCIAL POSITION as at 30 June 2017 Note CURRENT ASSETS Cash and cash equivalents 7 489, ,575 Bank deposits 6,505 20,174 Receivables , ,343 Loan servicing advances , ,139 Available-for-sale financial assets 20 1, Other financial assets 17 19,396 18,655 Inventories 18 3,748 4,512 Current tax assets 4,026 6,423 Derivative financial instruments ,952 Other current assets 19 28,417 29,694 Assets classified as held for sale 9 57,082 26,128 Total current assets 1,251,701 1,315,186 NON-CURRENT ASSETS Receivables Investments accounted for using the equity method 32 11,021 25,157 Available-for-sale financial assets 20 34,391 17,487 Property, plant and equipment , ,535 Deferred tax assets 6 178, ,644 Derivative financial instruments 13 19,440 48,035 Intangibles 10 2,341,856 2,273,628 Total non-current assets 2,695,329 2,660,362 Total assets 3,947,030 3,975,548 CURRENT LIABILITIES Payables , ,921 Interest bearing liabilities , ,088 Current tax liabilities 44,816 29,131 Provisions 23 46,616 40,688 Derivative financial instruments 13 3,653 1,238 Deferred consideration 24 21,914 12,402 Mortgage servicing related liabilities 25 25,323 30,383 Liabilities directly associated with assets classified as held for sale 9 57,413 - Other liabilities 26 2,205 39,486 Total current liabilities 753, ,337 NON-CURRENT LIABILITIES Payables 22 4,300 9,740 Interest bearing liabilities 14 1,455,837 1,603,217 Deferred tax liabilities 6 258, ,100 Provisions 23 26,635 29,129 Deferred consideration 24 48,953 65,969 Derivative financial instruments 13 3,374 5,500 Mortgage servicing related liabilities , ,222 Other liabilities 26 2,164 2,801 Total non-current liabilities 1,956,861 2,072,678 Total liabilities 2,710,002 2,869,015 Net assets 1,237,028 1,106,533 EQUITY Contributed equity Reserves 29 (98,487) (95,872) Retained earnings 30 1,315,607 1,188,890 Total parent entity interest 27 1,217,120 1,093,018 Non-controlling interests 27 19,908 13,515 Total equity 1,237,028 1,106, The above consolidated statement of financial position is presented in United States dollars and should be read in conjunction with the accompanying notes. 54 Computershare Annual Report 2017
55 CONSOLIDATED STATEMENT OF CHANGES IN EQUITY for the year ended 30 June 2017 Attributable to members of Computershare Limited Noncontrolling Interests Note Contributed Equity Reserves Retained Earnings Total Total Equity Total equity at 1 July (95,872) 1,188,890 1,093,018 13,515 1,106,533 Profit for the year , ,395 5, ,701 Available-for-sale financial assets ,591-4,591 1,089 5,680 Exchange differences on translation of foreign operations Income tax (expense)/credits - (4,078) - (4,078) - (4,078) Total comprehensive income for the year , ,919 6, ,314 Transactions with owners in their capacity as owners: Dividends provided for or paid - - (139,678) (139,678) (2) (139,680) Share buy-back 28 - (3,458) - (3,458) - (3,458) Cash purchase of shares on market - (15,105) - (15,105) - (15,105) Share based remuneration - 15,424-15,424-15,424 Balance at 30 June (98,487) 1,315,607 1,217,120 19,908 1,237,028 Total equity at 1 July ,703 (33,762) 1,160,106 1,162,047 13,394 1,175,441 Profit for the year , ,334 4, ,798 Available-for-sale financial assets - (62) - (62) - (62) Cash flow hedges - (497) - (497) - (497) Exchange differences on translation of - (16,022) - (16,022) (983) (17,005) foreign operations Income tax (expense)/credits - (6,841) - (6,841) - (6,841) Total comprehensive income for the year - (23,422) 157, ,912 3, ,393 Transactions with owners in their capacity as owners: Dividends provided for or paid - - (128,550) (128,550) (2,799) (131,349) Share buy-back 28 (35,703) (37,469) - (73,172) - (73,172) Transactions with non-controlling interests (561) (561) Cash purchase of shares on market - (12,177) - (12,177) - (12,177) Share based remuneration - 10,958-10,958-10,958 Balance at 30 June (95,872) 1,188,890 1,093,018 13,515 1,106,533 The above consolidated statement of changes in equity is presented in United States dollars and should be read in conjunction with the accompanying notes. 55
56 CONSOLIDATED CASH FLOW STATEMENT for the year ended 30 June 2017 Note CASH FLOWS FROM OPERATING ACTIVITIES Receipts from customers 2,201,306 2,001,817 Payments to suppliers and employees (1,670,948) (1,521,470) Loan servicing advances (net) 37,387 (68,137) Dividends received from associates, joint ventures and equity securities 2,469 1,146 Interest paid and other finance costs (56,136) (53,786) Interest received 2,912 2,564 Income taxes paid (59,308) (57,042) Net operating cash flows 7 457, ,092 CASH FLOWS FROM INVESTING ACTIVITIES Payments for purchase of controlled entities and businesses (net of cash acquired) and intangible assets (110,700) (167,848) including MSRs Proceeds from sale of property, plant and equipment 66,240 - Proceeds from disposal of associates and joint ventures 23,786 1,532 Proceeds from/(payments for) investments 1,489 (19,984) Payments for property, plant and equipment (34,215) (25,317) Proceeds from sale of subsidiaries and businesses, net of cash disposed - (6,511) Net investing cash flows (53,400) (218,128) CASH FLOWS FROM FINANCING ACTIVITIES Payment for purchase of ordinary shares share based awards (15,105) (12,177) Proceeds from borrowings 466, ,918 Repayment of borrowings (680,565) (439,840) Loan servicing borrowings (net) (13,586) 41,381 Dividends paid ordinary shares (net of dividend reinvestment plan) (129,672) (123,057) Purchase of ordinary shares dividend reinvestment plan (10,006) (5,493) Dividends paid to non-controlling interests in controlled entities (2) (2,799) Payments for on-market share buy-back (3,458) (71,830) Repayment of finance leases (30,071) (6,684) Net financing cash flows (416,418) (125,581) Net increase/(decrease) in cash and cash equivalents held (12,136) (38,617) Cash and cash equivalents at the beginning of the financial year 526, ,092 Exchange rate variations on foreign cash balances (3,756) (38,900) Cash and cash equivalents at the end of the year* 510, ,575 * Cash and cash equivalents at 30 June 2017 includes $20.8 million cash (2016: nil) presented in the assets classified as held for sale line item in the consolidated statement of financial position The above consolidated cash flow statement is presented in United States dollars and should be read in conjunction with the accompanying notes. 56 Computershare Annual Report 2017
57 NOTES TO THE CONSOLIDATED FINANCIAL STATEMENTS 1. Basis of preparation Results and key balances 2. Revenue and other income 3. Expenses 4. Earnings per share 5. Segment information 6. Income tax expense and balances 7. Notes to the consolidated cash flow statement 8. Business combinations 9. Assets and liabilities classified as held for sale 10. Intangible assets 11. Impairment Financial risk management 12. Financial risk management 13. Derivative financial instruments 14. Interest bearing liabilities Other balance sheet items 15. Receivables 16. Loan servicing advances 17. Other financial assets 18. Inventories 19. Other current assets 20. Available-for-sale financial assets 21. Property, plant and equipment 22. Payables 23. Provisions 24. Deferred consideration 25. Mortgage servicing related liabilities 26. Other liabilities Equity 27. Interests in equity 28. Contributed equity 29. Reserves 30. Retained earnings and dividends Group structure 31. Details of controlled entities 32. Investments in associates and joint ventures 33. Deed of cross guarantee 34. Parent entity financial information Unrecognised items 35. Contingent liabilities 36. Commitments 37. Capital expenditure commitments 38. Significant events after year end Other information 39. Related party disclosures 40. Key management personnel disclosures 41. Employee and executive benefits 42. Remuneration of auditors 57
58 NOTES TO THE CONSOLIDATED FINANCIAL STATEMENTS 1. BASIS OF PREPARATION The principal accounting policies adopted in the preparation of the financial report are set out below. These policies have been consistently applied to all the periods presented, unless otherwise stated. The financial report is for the consolidated entity consisting of Computershare Limited and its controlled entities, referred to collectively throughout these financial statements as the consolidated entity, the Group or Computershare. Basis of preparation of full year financial report This general purpose financial report for the reporting period ended 30 June 2017 has been prepared in accordance with Australian Accounting Standards, other authoritative pronouncements of the Australian Accounting Standards Board and the Corporations Act Computershare Limited is a for-profit entity for the purpose of preparing financial statements. This report is to be read in conjunction with any public announcements made by Computershare Limited during the reporting period in accordance with the continuous disclosure requirements of the Corporations Act 2001 and Australian Securities Exchange Listing Rules. Where necessary, comparative figures have been adjusted to conform with changes in presentation in the current period. Compliance with IFRS The financial statements of Computershare Limited and its controlled entities also comply with International Financial Reporting Standards (IFRS) as issued by the International Accounting Standards Board (IASB). Historical cost convention The financial statements have been prepared under the historical cost convention as modified by the revaluation of available-for-sale financial assets and financial assets and liabilities (including derivative instruments) at fair value through profit or loss. Principles of consolidation The consolidated financial statements include the assets and liabilities of the parent entity, Computershare Limited, and its controlled entities. All intercompany balances and transactions have been eliminated. Where an entity either began or ceased to be controlled during the year, the results are consolidated only from the date control commenced or up to the date control ceased. Financial statements of foreign controlled entities, associates and joint ventures presented in accordance with overseas accounting principles are, for consolidation purposes, adjusted to comply with Group policy and Australian Accounting Standards. Controlled entities Controlled entities are all those entities over which the Group has control. The Group controls an entity when the Group is exposed to, or has rights to, variable returns from its involvement with the entity and has the ability to affect those returns through its power over the entity. Controlled entities are fully consolidated from the date on which control is transferred to the Group. They are de-consolidated from the date that control ceases. The acquisition method of accounting is used to account for the acquisition of controlled entities by the Group. Investments in associated entities Associates are all entities over which the Group has significant influence but not control or joint control. This generally accompanies a shareholding of between 20% and 50% of the voting rights. Interests in associates are accounted for using the equity method. Investments in joint ventures Joint ventures are arrangements where Computershare has joint control with another party over that arrangement and each party has rights to the net assets of that arrangement. Joint control is the agreed sharing of control, which exists when decisions about relevant activities require unanimous consent of parties sharing control. Interests in joint ventures are accounted for using the equity method. Changes in ownership interests The Group treats transactions with non-controlling interests that do not result in a loss of control as transactions with equity owners of the Group. A change in ownership interest results in an adjustment between the carrying amounts of the controlling and non-controlling interests to reflect their relative interests in the controlled entity. Any difference between the amount of the adjustment to non-controlling interests and any consideration paid or received is recognised in a separate reserve within equity attributable to owners of the parent entity. 58 Computershare Annual Report 2017
59 Foreign currency Functional and presentation currency Items included in the financial statements of each of the Group s entities are measured using the currency of the primary economic environment in which the entity operates (the functional currency ). The consolidated financial statements are presented in US dollars as a significant portion of the Group s activity is denominated in US dollars. Transactions and balances Foreign currency transactions are converted to US dollars at exchange rates approximating those in effect at the date of each transaction. Amounts payable and receivable in foreign currencies at balance date are converted to US dollars at the average of the buy and sell rates available on the close of business at balance date. Revaluation gains and losses are brought to account as they occur. Exchange differences relating to monetary items are included in profit or loss, as exchange gains or losses, in the period when the exchange rates change, except when deferred in equity as qualifying cash flow hedges and qualifying net investment hedges. Group companies The results and financial position of all the Group entities that have a functional currency different from the presentation currency are translated into the presentation currency as follows: > > Assets and liabilities for each statement of financial position presented are translated at the closing rate at the date of that statement > > Income and expenses for each statement of comprehensive income are translated at average exchange rates > > All resulting exchange differences are recognised in other comprehensive income On consolidation, exchange differences arising from the translation of any net investment in foreign entities, and of borrowings and other currency instruments designated as hedges of such investments, are recognised in other comprehensive income and reflected in equity. Goodwill and fair value adjustments arising on acquisition of a foreign entity are treated as assets and liabilities of the foreign entity and are translated at the closing rate. Key estimates and judgements Estimates and judgements are continually evaluated and are based on historical experience and other factors, including expectations of future events that may have a financial impact on the entity and that are believed to be reasonable under the circumstances. The Group makes estimates and assumptions concerning the future. The resulting accounting estimates will, by definition, seldom equal the related actual results. The significant estimates and assumptions made in the current financial year are set out in the relevant notes: Note Key accounting estimates and judgements 2 Revenue and other income 6 Provision for income tax 6 Deferred tax assets relating to carry forward tax losses 8 Accounting for business combinations 11 Impairment Rounding of amounts The consolidated entity is of a kind referred to in ASIC Corporations (Rounding in Financial/Directors Reports) Instrument 2016/191, issued by the Australian Securities and Investments Commission, relating to the rounding off of amounts in the financial report. In accordance with this Class Order, amounts in the financial report have been rounded off to the nearest thousand dollars, or in certain cases, the nearest dollar. New and amended accounting standards and interpretations adopted from 1 July 2016 The Group has adopted the following standards and amendments commencing 1 July 2016: > > AASB Amendments to Australian Accounting Standards Clarification of Acceptable Methods of Depreciation and Amortisation > > AASB Amendments to Australian Accounting Standards Annual improvements to Australian Accounting Standards cycle > > AASB Amendments to Australian Accounting Standards Disclosure initiative: Amendments to AASB 101, and > > AASB Amendments to Australian Accounting Standards Scope and Application Paragraphs The adoption of these amendments did not have any impact on the current period or any prior period and is not likely to affect future periods. 59
60 NOTES TO THE CONSOLIDATED FINANCIAL STATEMENTS New and amended standards and interpretations issued but not yet effective Certain new accounting standards have been published that are not mandatory for 30 June 2017 reporting periods and have not been early adopted by the Group. The Group s assessment of the impact of these new standards is set out below. AASB 15 Revenue from contracts with customers AASB 15 is a new standard in relation to recognition of revenue and will replace AASB 118 which covers revenue arising from the sale of goods and services and AASB 111 which covers construction contracts. This standard is mandatory for financial years commencing on or after 1 January The Group will adopt AASB 15 in the financial year beginning 1 July Under AASB 15, revenue is recognised in a manner that depicts the transfer of promised goods or services to customers in an amount that reflects the consideration to which the provider of the goods or services expects to be entitled. The new standard requires adoption of the following 5-step model of revenue recognition: > > Identify the contract with a customer > > Identify performance obligations under the contract > > Determine transaction price > > Allocate transaction price to performance obligations under the contract > > Recognise revenue when or as the entity satisfies its performance obligations The Group is continuing a group-wide project assessing the effects of applying the new standard on the Group s financial statements. It is expected that some timing difference in revenue recognition may occur on adoption of AASB 15 given the nature of the Group s business and its customer contracts. At this stage, the Group is not able to estimate the effect of the new rules on the Group s financial statements. The Group will continue to assess the impact of the new standard to ensure timely implementation. AASB 9 Financial Instruments AASB 9 addresses the classification, measurement and derecognition of financial assets and financial liabilities and introduces new rules for hedge accounting and a new impairment model for financial assets. The standard is mandatory for financial years commencing on or after 1 January 2018 and the Group will apply AASB 9 in the financial year beginning 1 July AASB 9 replaces the classification and measurement requirements of AASB 139 with the approach that classifies financial assets based on a business model for managing financial assets and whether the contractual cash flows represent solely payments of principal and interest. Financial assets can be classified as financial assets at amortised cost, financial assets at fair value through profit or loss or financial assets at fair value through other comprehensive income. The Group does not expect the new guidance to have a significant impact on the classification and measurement of its financial assets. AASB 9 will change hedge accounting by introducing more principle based approach to hedge effectiveness testing and by increasing eligibility of both hedge instruments and hedged items. The Group will apply the new hedge accounting requirements from 1 July 2018 and it expects that the Group s current hedge relationships will qualify as continuing hedges upon adoption of AASB 9. The new impairment model requires the recognition of impairment provisions based on expected credit losses rather than incurred credit losses as is the case under AASB 139. Expected credit losses are probability weighted amounts determined by evaluating a range of possible outcomes and taking into account the time value of money, past events, current conditions and forecasts of future economic conditions. The Group is currently assessing the effects of the new impairment model. Although some impact of the new rules is expected (e.g, the method of provisioning for doubtful debtors will change), it is not expected to be material for the Group. AASB 16 Leases AASB 16 is a new standard in relation to leases which will primarily affect the accounting by lessees and will result in the recognition of almost all leases on balance sheet. The standard removes the current distinction between operating and financing leases and requires recognition of an asset (the right to use the leased item) and a financial liability to pay rental. The only exemption relates to short-term and low-value leases. Additionally operating lease expense will be replaced with interest and depreciation impacting EBITDA metrics. This standard is applicable to financial years commencing on or after 1 January 2019 and is available for early adoption, if AASB 15 has been applied. The Group does not expect to adopt AASB 16 before its operative date but will make the final decision once the impact assessment is completed. As at the reporting date, the Group has non-cancellable operating lease commitments of $224.5 million (refer to note 36). However, the Group has not yet determined to what extent these commitments will result in the recognition of an asset and a liability for future payments and how this will affect the Group s profit and classification of cash flows. There are no other standards that are not yet effective and that would be expected to have a material impact on the consolidated entity in the current or future reporting periods and on foreseeable future transactions. 60 Computershare Annual Report 2017
61 2. REVENUE AND OTHER INCOME Note Sales revenue Rendering of services 2,100,811 1,957,860 Other revenue Dividends received 2, Interest received 2,912 2,564 Total other revenue 4,951 3,265 Total revenue from continuing operations 2,105,762 1,961,125 Other income Gain on disposals 4 52, Rent received 3,632 3,734 Gain on acquisition 4 1,316 11,113 Marked to market adjustments - derivatives - 3,244 Other 4,653 9,324 Total other income 62,365 27,740 Revenue Revenue is measured at the fair value of the consideration received or receivable. Amounts disclosed as revenue are net of returns, trade discounts and volume rebates. The Group recognises revenue when the amount of revenue can be reliably measured, it is probable that future economic benefits will flow to the consolidated entity and specific criteria have been met for each of the Group s activities. The Group bases its estimates on historical results, taking into consideration the type of customer, the type of transaction and the specifics of each arrangement. Services revenue is recognised in the accounting period in which the services are rendered. For fixed-price contracts, revenue is recognised under the percentage of completion method, based on the actual service provided as proportion of the total services to be provided. Other revenue Other revenue includes interest income on short-term deposits controlled by the consolidated entity, and royalties and dividends received from other entities. Interest income is recognised using the effective interest method. Royalties and dividends are recognised as revenue when the right to receive payment is established. Insurance recoveries The consolidated entity recognises amounts receivable under its insurance policies, net of any relevant excess amounts, upon indemnity being acknowledged by the insurers Key estimates and judgements As part of Computershare s appointment by UK Asset Resolution to undertake its mortgage servicing activities, it was agreed that a fixed fee would be payable to Computershare over four years for the provision of infrastructure to support core services under the contract. Based on the adopted percentage of completion method which links the fixed fee to the infrastructure costs incurred over the applicable period, the Group is required to reassess the projected costs and the related fee recognition on an annual basis. This reassessment may lead to fluctuations in the fixed fee amounts recognised in future years. Judgement is required with regard to the total cost estimate, the percentage of costs incurred to date and the length of the applicable recognition period. 61
62 NOTES TO THE CONSOLIDATED FINANCIAL STATEMENTS 3. EXPENSES Profit before tax includes the following specific expenses: Depreciation and amortisation Depreciation of property, plant and equipment 35,188 38,715 Amortisation of intangible assets 106, ,683 Amortisation of mortgage servicing related liabilities (22,119) (12,382) Total amortisation (net) 83, ,301 Total depreciation and amortisation 119, ,016 Finance costs Interest expense 51,733 51,886 Loan facility fees and other borrowing expenses 2,661 2,594 Total finance costs 54,394 54,480 Other operating expense items Operating lease rentals 62,492 58,463 Technology spending research and development 75,763 76,882 Employee entitlements (excluding superannuation and other pension) expense 835, ,140 Superannuation and other pension expense 40,513 37,437 Profit before tax includes the following individually material expenses. Further information is included in note Individually material items Voucher Services impairment 11,315 - Put option liability re-measurement 7,080 7,526 Acquisition related accounting adjustments - 45,642 Foreign currency translation reserve write-off on disposals - 25,904 Asset write-down - 1,687 Depreciation and amortisation Refer to notes 10, 21 and 25 for further details on depreciation and amortisation. Finance costs Finance costs are recognised as an expense when they are incurred. Operating lease rentals Operating leases are leases in which a significant portion of the risks and rewards of ownership are not transferred to the Group. Payments made under operating leases (net of any incentives received from the lessor) are charged to the statement of comprehensive income on a straight-line basis over the period of the lease. Technology spending research and development These are operating expenses incurred on Group research and development activities. Employee entitlements Employee entitlements include salaries and wages, leave entitlements, incentives and share-based payment awards. The Group s accounting policy for liabilities associated with employee benefits is set out in notes 22 and 23. The policy relating to share-based payments is set out in note 41. Superannuation and other pension expense The Group makes contributions to various defined contribution superannuation and pension plans. The Group has no further payment obligations once the contributions have been paid. The contributions are recognised as employee benefit expense when they become payable. 62 Computershare Annual Report 2017
63 4. EARNINGS PER SHARE Year ended 30 June 2017 Basic EPS Diluted EPS Management Basic EPS Management Diluted EPS Earnings per share (cents per share) cents cents cents cents Reconciliation of earnings Profit for the year 271, , , ,701 Non-controlling interest (profit)/loss (5,306) (5,306) (5,306) (5,306) Add back management adjustment items (see below) ,877 30,877 Net profit attributable to the members of Computershare Limited 266, , , ,272 Weighted average number of ordinary shares used as denominator in calculating earnings per share 546,330, ,259, ,330, ,259,360 Year ended 30 June 2016 Earnings per share (cents per share) cents cents cents cents Reconciliation of earnings Profit for the year 161, , , ,798 Non-controlling interest (profit)/loss (4,464) (4,464) (4,464) (4,464) Add back management adjustment items (see below) , ,206 Net profit attributable to the members of Computershare Limited 157, , , ,540 Weighted average number of ordinary shares used as denominator in calculating earnings per share 550,992, ,917, ,992, ,917,891 Reconciliation of weighted average number of shares used as the denominator: 2017 Number 2016 Number Weighted average number of ordinary shares used as the denominator in calculating basic earnings per share 546,330, ,992,891 Adjustments for calculation of diluted earnings per share: Performance rights 928, ,000 Weighted average number of ordinary shares and potential ordinary shares used as the denominator in calculating diluted earnings per share 547,259, ,917,891 No performance rights have been issued since the end of the reporting period. Calculation of earnings per share Basic earnings per share Basic earnings per share is calculated by dividing profit attributable to members of Computershare Limited by the weighted average number of ordinary shares outstanding during the financial year. Diluted earnings per share Diluted earnings per share is determined by adjusting the weighted average number of shares used in the calculation of basic earnings per share to take into account the weighted average number of additional ordinary shares that would have been outstanding assuming the conversion of all dilutive potential ordinary shares, such as performance rights. Management basic earnings per share Management basic earnings per share exclude certain items. Management adjusted results are used, along with other measures, to assess operating business performance. The Group believes that exclusion of certain items permits better analysis of the Group s performance on a comparative basis and provides a better measure of underlying operating performance. The net profit used in the management earnings per share calculation is adjusted for management adjustment items net of tax. 63
64 NOTES TO THE CONSOLIDATED FINANCIAL STATEMENTS For the year ended 30 June 2017 management adjustment items were as follows: Gross Tax effect Net of tax Amortisation Amortisation of intangible assets (59,928) 20,626 (39,302) Acquisitions and disposals Gain on disposals 52,764 (3,926) 48,838 Acquisition related restructuring costs (1,836) 393 (1,443) Acquisition accounting adjustments 1,316 (260) 1,056 Acquisition related expenses (891) 225 (666) Other Major restructuring costs (33,638) 13,161 (20,477) Voucher Services impairment (11,315) - (11,315) Put option liability re-measurement (7,080) - (7,080) Marked to market adjustments derivatives (693) 205 (488) Total management adjustment items (61,301) 30,424 (30,877) Management Adjustment Items Management adjustment items net of tax for the year ended 30 June 2017 were as follows: Amortisation > > Customer contracts and other intangible assets that are recognised on business combinations or major asset acquisitions are amortised over their useful life in the statutory results but excluded from management earnings. The amortisation of these intangibles for the year ended 30 June 2017 was $39.3 million. Amortisation of intangibles purchased outside of business combinations (e.g. mortgage servicing rights) is included as a charge against management earnings. Acquisitions and disposals > > Disposals of the Australian head office premises and the investment in INVeSHARE Inc. resulted in a profit of $39.5 million and $9.3 million respectively. > > Restructuring costs of $1.4 million were incurred associated with the Gilardi and HML acquisitions. > > A benefit of $1.1 million was recorded on finalisation of acquisition accounting for assets taken over under the mortgage servicing contract with UK Asset Resolution Limited. > > Expenses related to the Gilardi, RicePoint and Six Securities Services acquisitions amounted to $0.7 million. Other > > Costs of $20.5 million were incurred in relation to the major operations rationalisation underway in Louisville, USA and stage 2 of the global structural cost review initiative. > > Due to the previously announced implementation of the new UK Tax Free childcare scheme (refer ASX Market Announcement of 30 July 2014), which has the effect of progressively reducing the earnings of Computershare s Voucher Services business, an impairment charge of $11.3 million was booked against goodwill related to this business. It is expected that the remaining goodwill of $15.2 million associated with Voucher Services will be written off over the coming years. > > The put option liability re-measurement resulted in an expense of $7.1 million related to the Karvy joint venture arrangement in India. > > Derivatives that have not received hedge designation are marked to market at the reporting date and taken to profit and loss in the statutory results. The marked to market valuation resulted in a loss of $0.5 million. 64 Computershare Annual Report 2017
65 For the year ended 30 June 2016 management adjustment items were as follows: Amortisation Gross Tax effect Net of tax Amortisation of intangible assets (96,134) 32,091 (64,043) Acquisitions and disposals Acquisition related accounting adjustments (45,642) (699) (46,341) Foreign currency translation reserve write-off on disposals (25,904) - (25,904) Gain on acquisition 11,113 (2,222) 8,891 Acquisition and disposal related expenses (3,480) 1,072 (2,408) Acquisition related restructuring costs (2,002) 698 (1,304) Asset write-down (1,687) - (1,687) Gain on disposal Other Major restructuring costs (14,545) 6,080 (8,465) Put option liability re-measurement (7,526) - (7,526) Marked to market adjustments derivatives 3,244 (988) 2,256 Total management adjustment items (182,238) 36,032 (146,206) 5. SEGMENT INFORMATION The operating segments presented reflect the manner in which the Group has been internally managed and the financial information reported to the chief operating decision maker in the current financial year. The chief operating decision maker is the Computershare Limited Chief Executive Officer (CEO). The Group has determined the operating segments based on the reports reviewed by the CEO that are used to make strategic decisions and assess performance. There are seven operating segments. Six of them are geographic: Asia, Australia and New Zealand, Canada, Continental Europe, UCIA (United Kingdom, Channel Islands, Ireland & Africa) and the United States of America. In addition, Technology and Other segment comprises the provision of software specialising in share registry and financial services. It is also a research and development function, for which discrete financial information is reviewed by the CEO. In each of the six geographic segments the consolidated entity offers a combination of its core products and services: investor services, business services, employee share plan services, communication services and stakeholder relationship management services. Investor services comprise the provision of registry maintenance and related services. Business services comprise the provision of bankruptcy class action and utilities administration services, voucher services, corporate trust services and mortgage servicing activities. Employee share plan services comprise the provision of administration and related services for employee share and option plans. Communication services comprise intelligent mailing, inbound process automation, scanning and electronic delivery. Stakeholder relationship management services comprise the provision of investor analysis, investor communication and management information services to companies, including their employees, shareholders and other security industry participants. Corporate function includes entities whose main purpose is to hold intercompany investments and conduct financing activities. It is not considered an operating segment and includes activities that are not allocated to other operating segments. OPERATING SEGMENTS Asia Australia & New Zealand Canada Continental Europe Technology & Other UCIA United States June 2017 Total segment revenue 142, , ,949 93, , , ,084 2,330,677 and other income External revenue and 138, , ,960 92,741 15, , ,362 2,106,670 other income Intersegment revenue 4, , ,931 3,283 3, ,007 Management adjusted EBITDA 48,857 38,094 75,958 20,301 20,708 85, , ,990 June 2016 Total segment revenue 128, , ,080 80, , , ,850 2,182,723 and other income External revenue and 124, , ,274 80,772 15, , ,816 1,961,501 other income Intersegment revenue 3, , ,812 2,775 4, ,222 Management adjusted EBITDA 45,231 45,741 67,440 13,732 25, , , ,805 Total 65
66 NOTES TO THE CONSOLIDATED FINANCIAL STATEMENTS Segment revenue The revenue reported to the CEO is measured in a manner consistent with that of the statement of comprehensive income. Sales between segments are included in the total segment revenue, whereas sales within a segment have been eliminated from segment revenue. Sales between segments are at normal commercial rates and are eliminated on consolidation. Segment revenue reconciles to total revenue from continuing operations as follows: Total operating segment revenue and other income 2,330,677 2,182,723 Intersegment eliminations (224,007) (221,222) Corporate revenue and other income (908) (376) Total revenue from continuing operations 2,105,762 1,961,125 Management adjusted EBITDA Management adjusted results are used, along with other measures, to assess operating business performance. The Group believes that exclusion of certain items permits better analysis of the Group s performance on a comparative basis and provides a better measure of underlying operating performance. A reconciliation of management adjusted EBITDA to operating profit before income tax is provided as follows: Management adjusted EBITDA operating segments 536, ,805 Management adjusted EBITDA corporate 3,801 8,804 Management adjusted EBITDA 540, ,609 Management adjustment items (before related income tax effect): Amortisation of intangible assets (59,928) (96,134) Gain on disposals 52, Acquisition related restructuring costs (1,836) (2,002) Acquisition accounting adjustments 1,316 (45,642) Acquisition and disposal related expenses (891) (3,480) Foreign currency translation reserve write-off on disposals - (25,904) Gain on acquisition - 11,113 Asset write-down - (1,687) Major restructuring costs (33,638) (14,545) Voucher Services impairment (11,315) - Put option liability re-measurement (7,080) (7,526) Marked to market adjustments derivatives (693) 3,244 Total management adjustment items (note 4) (61,301) (182,238) Finance costs (54,394) (54,480) Other amortisation and depreciation (59,172) (50,882) Profit before income tax from continuing operations 365, ,009 External revenue per business line The table below outlines revenue from external customers for each business line: Register Maintenance 697, ,796 Corporate Actions 125, ,510 Business Services 785, ,722 Stakeholder Relationship Management 79,806 70,107 Employee Share Plans 220, ,186 Communication Services 177, ,416 Technology and Other Revenue 18,295 20,388 Total 2,105,762 1,961, Computershare Annual Report 2017
67 Geographical Information Geographical allocation of external revenue Geographical allocation of non-current assets Australia 242, , , ,542 United Kingdom 399, , , ,760 United States 991, ,049 1,778,250 1,701,048 Canada 180, , , ,552 Other non-significant countries 291, , , ,122 Total 2,105,762 1,961,125 2,480,052 2,450, Revenues are allocated based on the countries in which the entities are located. The parent entity is domiciled in Australia. Revenue from external customers in countries other than Australia amounts to $1,863.4 million (2016: $1,703.8 million). Non-current assets exclude financial instruments and deferred tax assets and are allocated to countries based on where the assets are located. Non-current assets held in countries other than Australia amount to $2,311.1 million (2016: $2,263.5 million). 6. INCOME TAX EXPENSE AND BALANCES Income tax expense The income tax expense represents tax on the pre-tax accounting profit adjusted for income and expenses never to be assessed or allowed for taxation purposes. This is also adjusted for changes in deferred tax assets and liabilities attributable to temporary differences between the tax bases of assets and liabilities and their carrying amounts in the financial statements and unused tax losses. The income tax expense is calculated on the basis of the tax laws enacted or substantively enacted at the end of the reporting period. Income tax expense is recognised in profit or loss, except to the extent that it relates to items recognised in other comprehensive income or directly in equity. In this case, tax is also recognised in other comprehensive income or directly in equity, respectively. (a) Income tax expense Current tax expense Current tax expense 79,009 64,323 Effect of changes in tax rates 4,950 3,557 Under/(over) provided in prior years 1,444 1,585 Total current tax expense 85,403 69,465 Deferred tax expense/(benefit) Decrease/(increase) in deferred tax assets (19,062) (51,961) (Decrease)/increase in deferred tax liabilities 27,882 65,707 Total deferred tax expense/(credit) 8,820 13,746 Total income tax expense 94,223 83,211 (b) Numerical reconciliation of income tax expense to prima facie tax payable Profit before income tax expense 365, , The tax expense for the financial year differs from the amount calculated on profit. The differences are reconciled as follows: Prima facie income tax expense thereon at 30% 109,777 73,503 Tax effect of permanent differences: Disposal of Australian head office premises and redemption of investment in INVeSHARE (13,854) - Effect of changes in tax rates 4,950 3,557 Voucher services goodwill impairment 2,235 - Prior year tax (over)/under provided 1,444 1,585 Contingent consideration re-measurement - 9,463 Net other deductible (10,329) (4,897) Income tax expense 94,223 83,211 67
68 NOTES TO THE CONSOLIDATED FINANCIAL STATEMENTS (c) Amounts recognised directly in equity Deferred tax share based remuneration 794 (30) (d) Tax benefit/(expense) relating to items of other comprehensive income Cash flow hedges Net investment hedges (4,078) (6,947) (4,078) (6,841) (e) Unrecognised tax losses As at 30 June 2017, companies within the consolidated entity had estimated unrecognised tax losses of $3.7 million (2016: $1.1 million) available to offset against future years taxable income. Deferred tax balances Deferred tax assets and liabilities are recognised for temporary differences calculated at the tax rates expected to apply when the differences reverse. Deferred tax assets are recognised for deductible temporary differences and unused tax losses to the extent it is probable that future taxable amounts will be available to utilise them. Deferred tax assets and liabilities are offset when there is a legally enforceable right to offset current tax assets and liabilities and when the deferred tax balances relate to the same taxation authority. Deferred tax assets and liabilities are not recognised for temporary differences between the carrying amount and tax bases of investments in controlled entities where the parent entity is able to control the timing of the reversal of the temporary differences and it is probable that the differences will not reverse in the foreseeable future. Deferred tax assets The balance comprises temporary differences attributable to: Tax losses 35,138 35,166 Mortgage servicing related liabilities 72,392 61,456 Intangible assets 45,276 42,917 Financial instruments and foreign exchange 36,259 55,252 Provisions 22,791 20,383 Other creditors and accruals 18,605 6,959 Property, plant and equipment 13,309 9,882 Employee benefits 6,701 6,576 Finance leases 6,377 3,255 Deferred revenue 5,265 3,903 Share based remuneration 4,672 3,826 Doubtful debts 2,015 2,452 Other 7,464 6,962 Total deferred tax assets 276, ,989 Set-off of deferred tax liabilities pursuant to set-off provisions (97,589) (80,345) Net deferred tax assets 178, ,644 Movements during the year Opening balance at 1 July 178, ,348 Currency translation difference 1,424 (3,354) Credited/(charged) to profit or loss 19,062 51,961 Credited/(charged) to equity 794 (30) Credited/(charged) to other comprehensive income (4,078) (6,947) Set-off of deferred tax liabilities (17,244) (52,839) Arising from acquisitions/(disposals) Other (524) - Closing balance at 30 June 178, ,644 The total deferred tax assets expected to be recovered after more than 12 months amount to $164.7 million (2016: $155.3 million) Computershare Annual Report 2017
69 Deferred tax liabilities The balance comprises temporary differences attributable to: Goodwill 253, ,449 Intangible assets 93,085 69,828 Financial instruments and foreign exchange 5,964 14,594 Other 3,759 3,574 Total deferred tax liabilities 355, ,445 Set-off of deferred tax assets pursuant to set-off provisions (97,589) (80,345) Net deferred tax liabilities 258, ,100 Movements during the year: Opening balance at 1 July 232, ,512 Currency translation difference 169 (1,801) Charged/(credited) to profit or loss 27,882 65,707 Charged/(credited) to other comprehensive income - (106) Set-off of deferred tax assets (17,244) (52,839) Arising from acquisitions/(disposals) 15,344 6,627 Closing balance at 30 June 258, ,100 The total deferred tax liabilities expected to be settled after more than 12 months amounts to $354.9 million (2016: $304.8 million) Key estimates and judgements The Group is subject to income taxes in Australia and jurisdictions where it has foreign operations. Significant judgement is required in determining the provision for income taxes. There are many transactions and calculations undertaken during the ordinary course of business for which the ultimate tax determination is uncertain. Where the final outcome is different from the amounts that were initially recognised, such differences will impact the current and deferred tax provisions in the period in which such determination is made. The Group has recognised deferred tax assets relating to carried forward tax losses to the extent that it is probable that future taxable profits will be available against which these assets can be utilised. The assumptions regarding future utilisation, and therefore the recognition of deferred tax assets, may change due to future operating performance and other factors. Contingent liability Australian thin capitalisation The Group has been working with the Australian Taxation Office (ATO) and Her Majesty s Revenue and Customs to renew an existing bilateral advance pricing arrangement in relation to remuneration to be paid to the Australian Group from its ownership and licensing of certain intangible assets. As part of that process, the ATO undertook collateral review activities and during the reporting period issued a draft position paper challenging the inclusion of certain of these intangible assets in the thin capitalisation calculation used by the Australian Group to determine the amount of tax deductible interest on Australian borrowings between 1 July 2010 and 30 June Computershare disagrees with the ATO s views and, if the ATO maintains its views, intends to vigorously defend its position. This process may take some years to resolve. As the Group does not expect to pay additional tax related to this matter, no provision was recognised in the June 2017 balance sheet. If Computershare is unsuccessful in defending its position, the maximum potential primary tax liability in respect of the period from 1 July 2010 to 30 June 2017 excluding interest is estimated at $44.8 million. 7. NOTES TO THE CONSOLIDATED CASH FLOW STATEMENT (a) Cash and cash equivalents Cash and cash equivalents comprise cash at bank and on hand, and short-term deposits with original maturities of three months or less that are readily convertible to known amounts of cash and are subject to an insignificant risk of changes in value, net of outstanding bank overdrafts. Cash and cash equivalents exclude broker client deposits reflected in the statement of financial position that are recorded as other current financial assets. Cash and cash equivalents in the consolidated cash flow statement are reconciled to the consolidated statement of financial position as follows: Shown as cash and cash equivalents in the consolidated statement of financial position 489, ,575 Shown as cash and cash equivalents in the assets held for sale line item of the consolidated statement of financial 20,766 - position (refer to note 9) Cash and cash equivalents in the consolidated cash flow statement 510, ,
70 NOTES TO THE CONSOLIDATED FINANCIAL STATEMENTS (b) Reconciliation of net profit after income tax to net cash from operating activities Net profit after income tax 271, ,798 Adjustments for: Depreciation and amortisation 119, ,016 Contingent consideration re-measurement - 45,642 Net (gain)/loss on asset disposals and asset write-downs (52,237) 27,266 Gain on acquisition (1,316) (11,113) Share of net (profit)/loss of associates and joint ventures accounted for using equity method (655) 1,349 Employee benefits share based expense 15,028 10,366 Impairment charge Voucher Services 11,315 - Fair value adjustments 7,773 3,889 Changes in assets and liabilities: (Increase)/decrease in receivables (47,634) (63,719) (Increase)/decrease in inventories 797 (1,710) (Increase)/decrease in loan servicing advances 37,387 (68,137) (Increase)/decrease in other current assets 1,340 5,116 Increase/(decrease) in payables and provisions 60,168 21,160 Increase/(decrease) in tax balances 34,915 26,169 Net cash and cash equivalents from operating activities 457, ,092 (c) Acquisitions and disposals of businesses For details of businesses acquired during the year and related cash flows refer to note BUSINESS COMBINATIONS The Group continues to seek acquisition and other growth opportunities where value can be added and returns enhanced for the shareholders. The following controlled entities and businesses were acquired by the consolidated entity at the date stated and their operating results have been included in the Group s results from the acquisition date. Where goodwill is marked as provisional, identification and valuation of net assets acquired will be completed within a 12-month measurement period in accordance with the Group s accounting policy. (a) On 1 January 2017, Computershare acquired Six Securities Services AG, a registry business in Switzerland. Total consideration was $6.2 million. This business combination did not materially contribute to the total revenue of the Group. Details of the acquisition were as follows: Cash consideration 4,211 Contingent consideration 1,955 Total purchase consideration 6,166 Less fair value of identifiable assets acquired (1,001) Provisional goodwill on consolidation 5,165 (b) On 31 August 2016, Computershare acquired RicePoint Administration Inc., an independent class action administrator based in London, Canada. Total consideration was $3.6 million. This business combination did not materially contribute to the total revenue of the Group. Details of the acquisition were as follows: Cash consideration 1,531 Contingent consideration 2,063 Total purchase consideration 3,594 Less fair value of identifiable assets acquired (1,794) Goodwill on consolidation 1, Computershare Annual Report 2017
71 The acquisition method of accounting is used to account for all business combinations, regardless of whether equity instruments or other assets are acquired. The consideration transferred for the acquisition of a controlled entity comprises the fair value of the assets transferred, the liabilities incurred and the equity interests issued by the Group. The consideration transferred also includes the fair value of any contingent consideration arrangement and the fair value of any pre-existing equity interest in the controlled entity. Acquisition-related costs are expensed as incurred. Identifiable assets acquired as well as liabilities and contingent liabilities assumed in a business combination are, with limited exceptions, measured initially at their fair values at the acquisition date. Within 12 months of completing the acquisition, identifiable intangible assets are valued and separately recognised in the statement of financial position. On an acquisition-by-acquisition basis, the Group recognises any non-controlling interest in the acquiree either at fair value or at the non-controlling interest s proportionate share of the acquiree s net identifiable assets. The excess of the consideration transferred, the amount of any non-controlling interest in the acquiree and the acquisition-date fair value of any previous equity interest in the acquiree over the fair value of the Group s share of the net identifiable assets acquired is recorded as goodwill. If those amounts are less than the fair value of the net identifiable assets of the controlled entity acquired and the measurement of all amounts has been reviewed, the difference is recognised directly in profit or loss as a gain on bargain purchase. Contingent consideration is classified either as equity or a financial liability. Amounts classified as a financial liability are subsequently re-measured to fair value with changes in fair value recognised in profit or loss. In accordance with the accounting policy, the acquisition accounting for Capital Markets Cooperative, LLC (CMC), UK Asset Resolution Limited (UKAR), SyncBASE Inc. (SyncBASE), PR im Turm HV-Service AG (PR im Turm) and Altavera, LLC (Altavera) has been finalised. Intangible assets of $28.3 million for CMC, $8.3 million for SyncBASE, $3.3 million for PR im Turm and $1.5 million for Altavera have been reclassified out of goodwill. Key estimates and judgements Acquisition accounting requires that management make estimates with regard to valuation of certain non-monetary assets and liabilities of the acquired entities. These estimates have particular impact in terms of valuation of intangible assets, contingent consideration liabilities and provisions. To the extent that these items are subject to determination during the initial 12 months after acquisition, the variation to estimated value will be adjusted through goodwill. To the extent that determination occurs after 12 months, any variation will impact profit or loss in the relevant period. 9. ASSETS AND LIABILITIES CLASSIFIED AS HELD FOR SALE Assets classified as held for sale Cash and cash equivalents 20,766 - Receivables 19,104 - Property, plant and equipment 8,684 26,128 Intangibles 7,847 - Deferred tax assets Other current assets Total assets held for sale 57,082 26,128 Liabilities directly associated with assets classified as held for sale Put option liability 45,684 - Payables 9,915 - Current tax liabilities 1,107 - Provisions Total liabilities held for sale 57,413 - Non-current assets are classified as held for sale if their carrying amount will be recovered principally through a sale transaction rather than through continuing use and a sale is considered highly probable. Assets and liabilities classified as held for sale are measured at the lower of carrying amount and fair value less costs to sell at the time of the reclassification, and are presented separately within current assets and current liabilities in the consolidated statement of financial position. An impairment loss is recognised for any initial or subsequent write-down of the asset to fair value less costs to sell. A gain is recognised for any subsequent increases in fair value less costs to sell of an asset, but not in excess of any cumulative impairment loss previously recognised. A gain or loss not previously recognised by the date of the sale of the non-current asset is recognised at the date of derecognition
72 NOTES TO THE CONSOLIDATED FINANCIAL STATEMENTS On 3 August 2017, Computershare agreed to sell its 50% interest in its Indian venture Karvy Computershare Private Limited (Karvy). Completion is expected to occur before the end of calendar 2017 refer to Computershare s ASX Market Announcement dated 4 August 2017 for more details. The sale is estimated to result in a post-tax accounting gain of $120 million subject to future changes in net assets and foreign exchange rates, and will be recorded in next year s results. Karvy is classified as a disposal group held for sale as at 30 June On 9 September 2016, Computershare completed the sale of the land and building housing its Australian head office. A post-tax gain of $39.5 million was recognised in other income in the consolidated statement of comprehensive income during the reporting period. The land and building were classified as assets held for sale at 30 June INTANGIBLE ASSETS Goodwill Customer contracts and relationships Mortgage Servicing Rights At 1 July 2016 Opening cost 1,575, , ,792 41,492 2,624,246 Opening accumulated amortisation and impairment - (281,392) (43,192) (26,034) (350,618) Opening net book amount 1,575, , ,600 15,458 2,273,628 Additions (net of adjustments and reclassifications) 1 (9,264) 32, ,179 13, ,367 Disposals - - (8,643) - (8,643) Amortisation charge 2 - (51,685) (46,026) 5 (8,320) (106,031) Impairment charge (11,315) (11,315) Currency translation difference 5,504 (2,459) - (348) 2,697 Other 3 (7,847) (7,847) Closing net book amount 1,552, , ,110 19,962 2,341,856 At 30 June 2017 Cost 1,552, , ,816 50,146 2,656,813 Accumulated amortisation and impairment - (199,067) (85,706) (30,184) (314,957) Closing net book amount 1,552, , ,110 19,962 2,341,856 At 1 July 2015 Opening cost 1,560, , ,051 86,395 2,415,213 Opening accumulated amortisation and impairment - (205,900) (18,720) (58,295) (282,915) Opening net book amount 1,560, , ,331 28,100 2,132,298 Additions 1 43,208 65, ,741 3, ,894 Amortisation charge 2 - (81,525) (24,472) (14,686) (120,683) Currency translation difference (27,968) (12,476) - (1,437) (41,881) Closing net book amount 1,575, , ,600 15,458 2,273,628 At 30 June 2016 Cost 1,575, , ,792 41,492 2,624,246 Accumulated amortisation and impairment - (281,392) (43,192) (26,034) (350,618) Closing net book amount 1,575, , ,600 15,458 2,273,628 1 Additions comprise recognition of intangible assets resulting from business combinations and direct purchases as well as adjustments and reclassifications made on finalisation of acquisition accounting. 2 Amortisation charge is included within direct services expense in the statement of comprehensive income. 3 Includes $7.8 million goodwill reclassified as held for sale as at 30 June Other intangible assets include intellectual property, software and brands. 5 The gross amount of mortgage servicing rights amortisation is partially offset in the statement of comprehensive income by the amortisation of the related mortgage servicing liabilities. Other 4 Total 72 Computershare Annual Report 2017
73 Goodwill Goodwill represents the excess of the cost of an acquisition over the fair value of the Group s share of the net identifiable assets acquired. Goodwill is carried at cost less accumulated impairment losses and is tested for impairment annually or more frequently, if events or changes in circumstances indicate that it might be impaired. On disposal or termination of a previously acquired business, any remaining balance of associated goodwill is included in the determination of profit or loss on disposal. The acquired goodwill can be attributed to the expected future cash flows of the acquired businesses associated with the collective experience of management and staff and the synergies expected to be achieved as a result of full integration into the Computershare Group. Where acquisitions have been made during the period, the Group has 12 months from the acquisition date in which to finalise the accounting, including calculation of goodwill. Until the expiry of the 12-month period provisional amounts have been included in the consolidated results. Acquired intangible assets Acquired intangible assets have a finite useful life and are carried at fair value at the date of acquisition less accumulated amortisation and impairment losses. Amortisation is calculated using the straight line method to allocate value over their estimated useful lives, typically ranging from one to twenty years. Mortgage servicing rights Mortgage servicing rights acquired as part of business combination are carried at their fair value at the date of acquisition less accumulated amortisation and impairment losses. Mortgage servicing rights acquired as part of ongoing operations are carried at cost less accumulated amortisation and impairment losses. Amortisation for all servicing rights is calculated using the straight line method over their estimated useful lives. Software and research and development costs All research-related costs are expensed as incurred. Software development costs are capitalised where they meet the recognition criteria for capitalisation, and are subsequently amortised using the straight line method to allocate their value over their estimated useful lives, typically ranging from eight to fifteen years. 11. IMPAIRMENT Impairment test for goodwill For the purpose of impairment testing, assets are grouped at the lowest levels for which there are largely independent cash inflows (cash generating units). Goodwill is allocated to cash generating units (CGUs), or groups of CGUs, expected to benefit from synergies of the business combination. As the Group continues to acquire operations and reorganise the way that operations are managed, reporting structures may change giving rise to a reassessment of cash generating units and/or the allocation of goodwill to those cash generating units. The carrying amount of goodwill has been allocated to the following groups of CGU s constituting most of the Group s operating segments: Asia 78,217 84,574 Australia and New Zealand 164, ,083 Canada 117, ,474 Continental Europe 31,324 26,876 United Kingdom, Channel Islands, Ireland and Africa (UCIA) 88,453 99,319 United States 1,072,923 1,082,572 1,552,976 1,575,898 When testing for impairment, the carrying amount of each group of CGUs is compared with its recoverable amount. The recoverable amount is determined based on a value-in-use calculation for each group of CGUs to which goodwill has been allocated. The value-in-use calculation uses the discounted cash flow methodology for each CGU typically based upon five years of cash flow projections plus a terminal value
74 NOTES TO THE CONSOLIDATED FINANCIAL STATEMENTS Key estimates and judgements Key assumptions used in the value-in-use calculations are described below for each group of CGUs with allocated goodwill. As there are a number of CGUs in most of the operating segments, presented below are weighted averages of the assumptions applied to individual CGUs. Five-year post-tax cash flow projections are based upon approved budgets covering a one-year period, with subsequent periods based upon the Group s expectations of growth excluding the impact of possible future acquisitions, business improvement and restructuring. The earnings growth rates applied beyond the initial five-year period are as follows in 2017: Asia 3.9% (2016: 3.8%), Australia and New Zealand 3.0% (2016: 3.0%), Canada 2.0% (2016: 2.5%), Continental Europe 1.7% (2016: 1.8%), UCIA 3.0% (2016: 3.0%) and the United States 3.0% (2016: 3.0%). In performing the value-in-use calculations for each CGU, the Group has applied post-tax discount rates to discount the forecast future attributable post-tax cash flows. The discount rates used reflect the risks specific to each CGU. The equivalent pre-tax discount rates are as follows: Asia 11.9% (2016: 11.5%), Australia and New Zealand 12.4% (2016: 12.2%), Canada 10.1% (2016: 9.8%), Continental Europe 9.7% (2016: 9.9%), UCIA 9.7% (2016: 9.4%) and United States 10.4% (2016: 10.0%). Impact of reasonably possible changes in key assumptions As impairment testing is based on assumptions and judgements, the Group has considered sensitivity of the impairment test results to changes in key assumptions. For all operating segments, the recoverable amount exceeds the carrying amount when testing for reasonably possible changes in key assumptions. Impairment Impairment losses are recognised in profit or loss in the reporting period when the carrying amount exceeds recoverable amount. The recoverable amount is the higher of an asset s fair value less costs to sell and value in use. Voucher Services Due to the previously announced implementation of the new UK Tax Free childcare scheme (refer ASX Market Announcement of 30 July 2014), which has the effect of progressively reducing the earnings of Computershare s Voucher Services business, this CGU is expected to cease cash flow generation in the future. During the year, an impairment charge of $11.3 million was booked against goodwill, calculated as the difference between the value in use and the carrying amount of the business. This charge is included under direct services in the expense section of the statement of comprehensive income. It is expected that the remaining goodwill associated with this business of $15.2 million will be written off over the coming years. Voucher Services is part of the UCIA segment. 12. FINANCIAL RISK MANAGEMENT Financial risk management objectives The Group s activities expose it to a variety of financial risks: market risk (including foreign exchange risk and interest rate risk), liquidity risk and credit risk. The Group s overall financial risk management is carried out by a central treasury department (Group Treasury) under policies approved by the Board. The Board provides written principles for overall risk management, as well as policies covering specific areas such as currency risk management, interest rate risk management, counterparty risk management and the use of derivative financial instruments. Derivative financial instruments are used to manage specifically identified interest rate and foreign currency risks. The Group Treasury function provides services to the business. It also monitors and manages the financial risks relating to the operations of the Group. Group Treasury identifies, evaluates and hedges financial risks in close cooperation with the regional treasury centres and reports regularly to the Board. Capital risk management objectives The primary objective of the Group s capital management is to ensure that it minimises the working capital funding requirements through effective controls in order to support its businesses and maximise shareholder value. A key financial ratio for the Group is net financial indebtedness to management adjusted earnings before interest, tax, depreciation and amortisation (Management EBITDA). Net debt is calculated as interest bearing liabilities less cash and cash equivalents. Interest bearing liabilities 1,573,065 1,863,305 Cash and cash equivalents* (510,683) (526,575) Net debt 1,062,382 1,336,730 Management EBITDA (note 5) 540, ,609 Net debt to Management EBITDA Net debt to Management EBITDA (excluding non-recourse debt) Excludes non-recourse SLS advance debt of $194.6 million (2016: $208.2 million). * 2017 includes $20.8 million (2016: nil) cash presented in assets classified as held for sale Computershare Annual Report 2017
75 The Group manages its capital structure and makes adjustments to it in line with changes in economic conditions. To achieve its target capital structure, the Group may adjust the dividend payment to shareholders, conduct share buy-backs or issue new shares. For details of the recent on-market share buy-back refer to note 28. No changes were made to the capital structure objectives or processes during the current financial year. Financial risk factors The key financial risk factors that arise from the Group s activities are outlined below. (a) Interest rate risk Interest rate risk arises from the possibility that changes in interest rates will affect future cash flows or fair values of financial instruments. The consolidated entity is exposed to interest rate risk through its primary financial assets and liabilities and as a result of maintaining agent and escrow agent bank accounts on behalf of clients. Given the nature of the client balances, neither the funds nor an offsetting liability are included in the Group s financial statements. Average client balances during the year approximated $16.7 billion (2016: $15.7 billion) and in relation to these balances, the consolidated entity has in place interest rate derivatives totalling $1.8 billion notionally (2016: $1.7 billion). The table below provides an indication of sensitivity of the Group s profit before tax to movements in interest rates with all other variables held constant Sensitivity of profit before tax 2016 Sensitivity of profit before tax Movement in basis points AUD 80 (79) 106 (106) USD (3,432) 3,416 (6,303) 4,662 CAD 469 (469) 413 (413) GBP 374 (374) (3,976) 4,000 EUR (276) (97) Other 155 (96) 179 (130) Total (2,630) 2,674 (9,484) 7,916 The sensitivity of profit before tax to interest rate movements is the effect of assumed reasonably possible changes in interest rates for one year, based on the on-balance sheet floating rate financial assets and liabilities as at 30 June The total sensitivity analysis is based on the assumption that there are parallel shifts in the yield curve. The above sensitivity calculation includes the impact of changes in interest rates on the fair value of recognised derivatives but excludes the impact on interest income derived from client balances. Client balances have been excluded from the sensitivity analysis as they are not reflected in the Group s consolidated statement of financial position. Interest income is earned on these balances at various fixed and floating interest rates. In a rising interest rate environment, client balances that earn interest income will result in an increase to profit, while in a falling interest rate environment, client balances that earn interest income will result in a decrease to profit. Total margin income generated on client balances for the year was $136.2 million (2016: $153.3 million), reflecting a yield of 0.82% (2016: 0.98%) on average client balances. If the Group was able to achieve an additional yield of 0.5% on the total average balances of $16.7 billion held during the reporting period, the Group s profit before tax would have increased by $83.3 million. (b) Foreign exchange risk Foreign exchange risk arises from future commercial transactions and recognised assets and liabilities denominated in a currency that is not the relevant entity s functional currency. Entities within the Group typically enter into external transactions and recognise external assets and liabilities that are denominated in their functional currency. Whilst a number of entities within the Group hold bank account balances in a currency which is not their local functional currency, these balances do not expose the Group to significant foreign exchange risk. Foreign exchange risk also arises from net investments in foreign operations held in Europe, Canada, South Africa and Asia Pacific. Accordingly, the Group s financial position can be affected significantly by movements in the relevant currency exchange rate when translating into the consolidated entity s presentation currency, the United States dollar. The consolidated entity also has debt that is designated as a hedge of net investment in foreign operations. On consolidation, any foreign exchange gains or losses on these balances are transferred to the foreign currency translation reserve. (c) Credit risk Credit exposure represents the extent of credit related losses that the consolidated entity may be subject to on amounts to be received from financial assets, which include receivables, cash and cash equivalents and other financial instruments. The consolidated entity, while exposed to credit related losses in the event of non-payment by clients, does not expect any significant clients to fail to meet their obligations. The Group s trading terms do not generally include the requirement for customers to provide collateral as security for financial assets and consequently, the consolidated entity does not hold any collateral as security. 75
76 NOTES TO THE CONSOLIDATED FINANCIAL STATEMENTS The consolidated entity s exposure to credit risk is as indicated by the carrying amounts of its financial assets. Concentrations of credit risk exist when clients have similar economic characteristics that would cause their ability to meet contractual obligations to be similarly affected by changes in economic or other conditions. The consolidated entity s concentration of credit risk is minimised due to transactions with a large number of clients in various countries and industries. The registry and plans sector transacts with various listed companies across a number of countries. The consolidated entity does not have a significant exposure to any individual client apart from its contract with UK Asset Resolution Limited, a UK government entity. Transactions involving derivative financial instruments are with counterparties with whom the Group has signed International Swaps and Derivatives Association agreements and who maintain sound credit arrangements. To supplement credit ratings of counterparties the Group has a Board approved policy on managing client balance exposure. (d) Liquidity Risk Liquidity risk management implies maintaining sufficient cash and the availability of funding. The Group has staggered its various debt maturities to reduce re-financing risk. Whilst impacted by acquisitions from time to time, the Group maintains sufficient cash balances and committed credit facilities to meet ongoing commitments. Maturity information for the Group s debt facility is as follows: Debt facility utilised Maturity profile (in the 12 months ending) $million June June June June June June June Total The Group had access to unutilised committed debt of $328.1 million maturing in July Maturities of financial liabilities The table below breaks down the Group s financial liabilities into relevant maturity groupings. The amounts disclosed in the table are the contractual undiscounted cash flows. For interest rate swaps the cash flows have been estimated using the forward interest rates applicable at the end of the reporting period. Contractual maturities of financial liabilities Less than 1 year Between 1-5 years More than 5 years Total contractual cash flows As at 30 June 2017 Non-derivatives Trade payables 17, ,150 Other payables 416,823 4, ,123 Borrowings (excluding finance leases) 172,103 1,342, ,448 1,754,339 Finance lease liabilities (undiscounted) 5,462 4,740-10,202 Total non-derivatives 611,538 1,351, ,448 2,202,814 Derivatives Net settled (interest rate swaps) 1, ,335 Gross settled (cross currency and FX swaps) (Inflow) (179,985) - - (179,985) Outflow 178, ,811 Total derivatives Computershare Annual Report 2017
77 Contractual maturities of financial liabilities As at 30 June 2016 Non-derivatives Less than 1 year Between 1-5 years More than 5 years Total contractual cash flows Trade payables 23, ,366 Other payables 359,555 9, ,295 Borrowings (excluding finance leases) 285,816 1,238, ,566 2,002,487 Finance lease liabilities (undiscounted) 33,258 7,957-41,215 Put option liability 37, ,275 Total non-derivatives 739,270 1,255, ,566 2,473,638 Derivatives Net settled (interest rate swaps) 1, ,922 Gross settled (cross currency and FX swaps) (Inflow) (554,310) - - (554,310) Outflow 549, ,274 Total derivatives (3,058) (2,114) (e) Fair value measurements The fair value of financial assets and liabilities must be estimated for recognition and measurement or for disclosure purposes. The measurement hierarchy used is as follows: Level 1: The fair value of financial instruments traded in active markets is based on quoted market prices at the end of the reporting period for identical assets and liabilities. The quoted market price used for financial assets held by the Group is the current bid price. These instruments are included in level 1. Level 2: The fair value of financial instruments that are not traded in an active market is determined using valuation techniques which maximise the use of observable market data and rely as little as possible on entity-specific estimates. The Group uses a variety of methods and makes assumptions that are based on market conditions existing at the end of each reporting period. This includes inputs other than quoted prices included within level 1 that are observable for the asset or liability, either directly (as prices) or indirectly (derived from prices). If all significant inputs required to fair value an instrument are observable, the instrument is included in level 2. Such instruments include derivative financial instruments and the portion of borrowings included in the fair value hedge. Specific valuation techniques used to value financial instruments are as follows: > > Quoted market prices or dealer quotes are used for similar instruments. > > The fair value of interest rate swaps is calculated as the present value of the estimated future cash flows based on observable yield curves. > > The fair value of forward foreign exchange contracts is determined using forward exchange rates at the balance sheet date. > > The fair value of cross currency swaps is a combination of the fair value of forward foreign exchange contracts determined using forward exchange rates at the balance sheet date (for the final principal exchange) and the use of quoted market prices or dealer quotes for similar instruments (for the basis valuation). > > The fair value of interest rate swaptions is calculated using the Black-Scholes formula and quoted market prices. Level 3: Valuation methodology of the asset or liability uses inputs that are not based on observable market data (unobservable inputs). This is the case of investments in unconsolidated structured entities (refer to note 20), which are included in the available-for-sale financial assets and deferred consideration (note 24) arising from business combinations. The amount of contingent consideration recognised on business combinations is typically referenced to revenue or EBITDA targets. The Group estimates the fair value of the expected future payments based on the terms of each earn-out agreement and management s knowledge of the business taking into account the likely impact of the current economic environment. Contingent consideration amounts are re-measured every reporting period based on most recent projections. Gains or losses arising from changes in fair value are recognised in profit or loss in the period in which they arise. The fair value of the investment in structured entities is determined by reference to the equity interest in net assets of these entities, which approximate their fair values. As profits are realised and dividends are paid to equity investors, the net assets of these entities decrease and so does the fair value of the Group s investment. 77
78 NOTES TO THE CONSOLIDATED FINANCIAL STATEMENTS The following tables present the Group s financial assets and liabilities measured and recognised at fair value at 30 June The comparative figures are also presented below. As at 30 June 2017 Level 1 Level 2 Level 3 Total Assets Derivative financial instruments - 19,910-19,910 Available-for-sale financial assets 2,743-33,231 35,974 Total assets 2,743 19,910 33,231 55,884 Liabilities Borrowings - 474, ,298 Derivative financial instruments - 7,027-7,027 Deferred consideration ,867 70,867 Total liabilities - 481,325 70, ,192 As at 30 June 2016 Assets Derivative financial instruments - 49,987-49,987 Available-for-sale financial assets 1,761-16,317 18,078 Total assets 1,761 49,987 16,317 68,065 Liabilities Borrowings - 452, ,451 Derivative financial instruments - 6,738-6,738 Deferred consideration ,371 78,371 Total liabilities - 459,189 78, ,560 The following table presents the changes in level 3 items for the periods ended 30 June 2017 and 30 June 2016: Available-for-sale financial assets Deferred consideration liability Opening balance at 1 July 16,317 6,034 (78,371) (11,454) Additions 18,561 10,683 (11,012) (30,337) Payments ,111 3,728 Gains/(losses) recognised in profit or loss (499) - - (44,752) Return of capital (1,148) (400) - - Currency translation difference - - 1,405 4,444 Closing balance at 30 June 33,231 16,317 (70,867) (78,371) Fair value of financial assets and liabilities The carrying amounts of cash and cash equivalents, receivables, loan servicing advances, payables, non-interest bearing liabilities, finance leases and loans approximate their fair values for the Group except for the unhedged portion of USD Senior Notes of $325.0 million (2016: $395.0 million), where the fair value based on level 2 valuation techniques described above was $330.6 million as at 30 June 2017 (2016: $419.8 million) Computershare Annual Report 2017
79 13. DERIVATIVE FINANCIAL INSTRUMENTS The Group uses derivative financial instruments to manage specifically identified interest rate and foreign currency risks. Derivatives are initially recognised at fair value on the date a derivative contract is entered into and are subsequently re-measured to their fair value at each balance date. The method of recognising the resulting gain or loss depends on whether the derivative is designated as a hedging instrument, and if so, the nature of the item being hedged. The Group designates certain financial instruments, including derivatives, as either hedges of net investments in a foreign operation, hedges of firm commitments or highly probable forecast transactions (cash flow hedges) or fair value hedges. Derivative assets Current 470 1,952 Non-current 19,440 48,035 19,910 49,987 Derivative assets current and non-current Fair values of interest rate derivatives designated as cash flow hedges (a) - 65 Fair values of interest rate derivatives designated as fair value hedges (b) 19,702 47,075 Fair value of derivatives for which hedge accounting has not been applied 208 2,847 Total derivative assets 19,910 49,987 Derivative liabilities Current 3,653 1,238 Non-current 3,374 5,500 7,027 6,738 Derivative liabilities current and non-current Fair values of interest rate derivatives designated as cash flow hedges (a) Fair values of cross currency derivatives designated as hedge of net investment (c) 2, Fair value of derivatives for which hedge accounting has not been applied 3,995 5,760 Total derivative liabilities 7,027 6,738 (a) The gain or loss from remeasuring the designated cash flow hedging instruments at fair value is deferred in equity in the cash flow hedge reserve (note 29) to the extent that the hedge is effective and reclassified into profit or loss when the hedged income is recognised. The ineffective portion is recognised in profit or loss immediately. In the year ended 30 June 2017, a loss of $0.3 million was transferred to the profit or loss (30 June 2016: $0.1 million loss). There were no transfers to the statement of comprehensive income in the year ended 30 June 2017 (30 June 2016: $0.5 million loss). (b) The gain or loss from remeasuring the designated fair value hedging instruments at fair value is recognised immediately in profit or loss. Refer to note 14 for further disclosure on the interest rate derivatives designated as fair value hedges. (c) The gain or loss from remeasuring the designated net investment hedging instruments at fair value is recognised in equity in the foreign currency translation reserve (note 29) to the extent that the hedge is effective. The ineffective portion is recognised in the profit or loss immediately. In the year ended 30 June 2017, a loss of $0.4 million was recognised in profit or loss (30 June 2016: $0.9 million gain). Hedging At the inception of the transaction, the Group documents the relationship between hedging instruments and hedged items as well as its risk management objective and strategy for undertaking various hedge transactions. The Group also documents its assessment, both at hedge inception and on an ongoing basis, of whether the derivatives that are used in hedging transactions have been and will continue to be highly effective in offsetting changes in fair values or cash flows of hedged items. Hedge of net investment Changes in the fair value of foreign currency debt balances that are designated and qualify as hedging instruments are recorded in other comprehensive income in the foreign currency translation reserve. The change in value of the net investment is recorded in the foreign currency translation reserve in accordance with requirements of AASB 121 The effects of Changes in Foreign Exchange Rates. The gain or loss relating to the ineffective portion is recognised immediately in profit or loss
80 NOTES TO THE CONSOLIDATED FINANCIAL STATEMENTS Cash flow hedge The Group uses interest rate derivatives to manage interest rate exposure. These derivatives are entered into as part of a hedging relationship. The effective portion of changes in the fair value of derivatives which are designated and qualify as cash flow hedges is recognised in other comprehensive income in the cash flow hedge reserve. The gain or loss relating to the ineffective portion is recognised immediately in profit or loss. Amounts accumulated in equity are recycled to profit or loss in the periods when the hedged item will affect profit or loss (for instance when the future cash flows that are hedged occur). When a hedging instrument expires or is sold or terminated, or when a hedge no longer meets the criteria for hedge accounting, any cumulative gain or loss existing in equity at that time remains in equity and is recognised when the forecast transaction is ultimately recognised in profit or loss. When a forecast transaction is no longer expected to occur, the cumulative gain or loss that was reported in equity is immediately reclassified to profit or loss. Fair value hedge The Group uses interest rate derivatives to manage the fixed interest exposure that arises as a result of the issued US Senior Notes. Changes in the fair value of these derivatives are recorded in profit or loss, together with any changes in the fair value of the hedged liabilities that are attributable to the hedged risk. Derivatives that do not qualify for hedge accounting Certain forward exchange contracts and foreign currency options do not qualify for hedge accounting. Changes in the fair value of any derivative instrument that does not qualify for hedge accounting are recognised immediately in profit or loss. 14. INTEREST BEARING LIABILITIES Borrowings are initially recognised at fair value and are subsequently measured at amortised cost. Any difference between the proceeds (net of transaction costs) and the redemption amount is recognised in profit or loss over the borrowing period using the effective interest method. Borrowings are classified as current liabilities unless the Group has a legal right to defer settlement of the liability for at least 12 months after the balance sheet date. Current Bank loans (SLS non-recourse advance facility) (a) 71, ,210 USD Senior Notes (b) 39,901 21,606 Lease liabilities secured (c) 5,363 30, , ,088 Non-current Bank loans (SLS non-recourse advance facility) (a) 122,622 - Revolving syndicated bank facilities (d) 569, ,647 USD Senior Notes (b) 758, ,678 Lease liabilities secured (c) 4,661 7,892 1,455,837 1,603,217 (a) The borrowings of the overseas subsidiary engaged in mortgage servicing activities are secured against the loan servicing advances without recourse to the Group. (b) On 22 March 2005, Computershare US, a controlled entity, issued 52 notes in the United States with the total value of $318.5 million. These notes were six, seven, ten and twelve years in tenor and were issued at fair value, with no premium or discount. The six, seven and ten year notes with a total value of $297.5 million were repaid in prior years. The twelve year notes with a total value of $21.0 million were repaid during the 2017 financial year. On 29 July 2008, Computershare US issued a further 26 notes in the United States with a total value of $235.0 million. These notes were for a tenor of ten years. On 9 February 2012, Computershare Investor Services Inc, a controlled entity, issued 62 notes in the United States with a total value of $550.0 million. These notes were for tenors of six, seven, ten and twelve years. Fixed interest is paid on all the issued notes on a semi-annual basis. The Group uses interest rate derivatives to manage the fixed interest exposure Computershare Annual Report 2017
81 The following table provides a reconciliation of the USD Senior Notes. USD Senior Notes Reconciliation USD Senior Notes at cost 785, ,000 Fair value adjustments 13,470 39,284 Total net debt 798, ,284 Interest rate derivative (asset) - fair value hedge (note 13) (19,702) (47,075) Total 778, ,209 Fair value adjustments represent loan origination fees and the revaluation of the hedged portion of the USD Senior Notes. Hedged USD Senior Notes amounted to $460.0 million as at 30 June 2017 (2016: $411.0 million). The gain or loss from re-measuring the hedging instruments (interest rate derivatives) at fair value is recognised immediately in the statement of comprehensive income along with the change in fair value of the underlying hedged item (USD Senior Notes). The fair value adjustment of the hedged USD Senior Notes reflects the valuation change due to lower market interest rates at balance sheet date for the term until maturity. The increase is offset by the fair value of interest rate derivatives used to effectively convert the USD fixed interest rate notes to floating interest rates. The conversion to floating interest rate using derivatives provides a hedge against the Group s USD interest rate risk exposure. (c) The lease liability is secured directly against the assets to which the leases relate (note 36). During the year, Computershare sold the land and building housing its Australian head office. The sale was completed on 9 September The associated finance lease arrangement was terminated on 4 August 2016 and was classified as a current liability as at 30 June (d) The consolidated entity maintains revolving syndicated facilities that were executed on 17 July The first facility, as amended on 20 December 2016, is a multi-currency facility of $450.0 million maturing on 7 July 2020 and the second facility is a USD only facility of $450.0 million maturing on 17 July The facilities were drawn to an equivalent of $571.9 million at 30 June The facilities are subject to negative pledge undertakings and impose certain covenants upon the consolidated entity. The Group has complied with the negative pledge undertakings and covenants imposed on it for the year ended 30 June RECEIVABLES Current Trade receivables 219, ,622 Less: provision for impairment (8,285) (10,446) Trade receivables (net) 211, ,176 Accrued revenue 179, ,444 Other non-trade amounts 31,918 62, , ,343 Non-current Other Trade and other receivables Trade and other receivables are recognised initially at fair value and subsequently measured at amortised cost, less a provision for impairment. Trade receivables generally have settlement terms of 30 days. Impairment of trade receivables Collectability and impairment are assessed on an ongoing basis. Impairment is recognised in the profit or loss when there is objective evidence that the Group will not be able to collect the amounts due according to the original trade and other receivable terms. Factors considered when determining if impairment exists include ageing and timing of expected receipts and the creditworthiness of counterparties. Debts that are known to be uncollectible are written off. The Group has recognised a gain of $0.4 million (2016: $3.8 million loss) in respect of impaired trade receivables during the year ended 30 June The amount has been included in the direct services expense and technology costs lines in the statement of comprehensive income
82 NOTES TO THE CONSOLIDATED FINANCIAL STATEMENTS The analysis of trade receivables for the consolidated entity that were past due but not impaired is as follows: Neither past due nor impaired Less than 30 days overdue Past due but not impaired More than 30 days but less than 90 days overdue More than 90 days overdue 30 June ,434 31,890 13,099 6, , June ,531 36,263 15,477 7, ,176 All other receivables do not contain impaired assets and are not past due. 16. LOAN SERVICING ADVANCES Current Loan servicing advances 217, ,139 Loan servicing advances are recognised initially at fair value and subsequently measured at amortised cost, less a provision for impairment. An overseas subsidiary performing loan servicing activities regularly makes payments on behalf of mortgagors related to taxes, insurance, principal and interest. The receivable represents the total value of these payments yet to be recovered. In general, the overseas subsidiary is reimbursed for advances from collections from the relevant pool of mortgages. In the event that pool level collections are not adequate for full reimbursement, the outstanding advances receive priority over any other liability from the proceeds from the liquidation of the property. Although it takes longer than 12 months for a portion of the loan servicing receivables to be collected, all servicing advances are classified as current. This reflects the fact that collections occur within the normal operating cycle of the overseas subsidiary. 17. OTHER FINANCIAL ASSETS Current Broker client deposits 19,396 18,655 Broker deposits are recognised initially at fair value and subsequently measured at amortised cost. An overseas entity is a licensed deposit taker. This controlled entity accepts deposits in its own name, and records these funds as other financial assets together with a corresponding liability (note 22). The deposits are insured through a local regulatory authority. 18. INVENTORIES Raw materials and stores, at cost 3,748 4,406 Work in progress, at cost ,748 4,512 Inventories are valued at the lower of cost and net realisable value. Cost is assigned on a first-in first-out basis. Net realisable value is the estimated selling price in the ordinary course of business less the estimated costs of completion and the estimated costs to sell. 19. OTHER CURRENT ASSETS Prepayments 27,208 26,887 Other 1,209 2,807 28,417 29, AVAILABLE-FOR-SALE FINANCIAL ASSETS Current Debt securities 1, Equity securities , Non-current Equity securities 34,391 17,487 Available-for-sale financial assets are initially recognised at fair value plus transaction costs and are subsequently carried at fair value. Unrealised gains and losses for changes in fair value are recognised in other comprehensive income in the available-for-sale asset reserve. When available-for-sale financial assets are sold, the accumulated fair value adjustments are reclassified to profit or loss Total Computershare Annual Report 2017
83 Investment in structured entities Non-current equity securities include $29.3 million of investments in unconsolidated structured entities (2016: $16.3 million). An overseas subsidiary of the Group occasionally sells economic benefits and obligations associated with mortgage servicing rights to unconsolidated structured entities while retaining a 20% equity interest in these entities. An unaffiliated third party, which owns 80% of the structured entities as asset manager, provides investment opportunities to investors and is considered a sponsor of these entities. The overseas subsidiary of the Group continues to service the loans associated with the mortgage servicing rights sold to the structured entities and receives a portion of compensation for providing such services. The structured entities are designed to hold assets that will generate cash flows for their equity investors. The acquisition of these assets is fully funded at inception and future financial support is not expected to be required. As there is no obligation to provide further funding, the exposure to loss from the Group s interest in the structured entities is limited to the carrying amount of the investment. 21. PROPERTY, PLANT AND EQUIPMENT Land Building, freehold and leasehold Plant and Equipment owned and leased Fixtures and Fittings Motor Vehicles Leasehold improvements At 1 July 2016 Opening net book amount 8,220 33,669 48,528 6, , ,535 Acquisition of entities and businesses Additions ,522 2, ,003 35,255 Disposals - (2) (229) (166) (19) (15) (431) Depreciation charge - (1,454) (23,326) (2,773) (61) (7,574) (35,188) Currency translation differences (238) (984) 404 (56) (709) Transfers and other* 446 (486) (3,362) (330) (25) (2,715) (6,472) Closing net book amount 9,236 31,205 47,591 5, , ,897 Cost 9,236 42, ,874 33, , ,491 Accumulated depreciation - (11,451) (251,283) (27,626) (448) (36,786) (327,594) At 30 June ,236 31,205 47,591 5, , ,897 At 1 July 2015 Opening net book amount 22,000 51,932 53,730 9, , ,107 Acquisition of entities and - 1, ,638 businesses Additions - 4,348 22,374 1, ,895 30,879 Disposals - (720) (42) - (14) - (776) Depreciation charge - (1,946) (26,243) (3,223) (83) (7,220) (38,715) Asset write-down (1,190) (497) (1,687) Currency translation differences (1,977) (6,021) (1,833) (527) (10) (415) (10,783) Transfers and other* (10,613) (14,975) (373) (4) 4 (167) (26,128) Closing net book amount 8,220 33,669 48,528 6, , ,535 Cost 8,220 45, ,509 34, , ,513 Accumulated depreciation - (11,343) (235,981) (27,571) (737) (31,346) (306,978) At 30 June ,220 33,669 48,528 6, , ,535 * Includes $6.5 million (2016: $26.1 million) land, buildings and related property, plant and equipment re-classified as held for sale as at 30 June Property, plant and equipment are stated at historical costs less accumulated depreciation and impairment. Cost includes the purchase price and expenditure that is directly attributable to bringing the asset to the location and condition necessary for its intended use. Total 83
84 NOTES TO THE CONSOLIDATED FINANCIAL STATEMENTS Depreciation Items of property, plant and equipment excluding freehold land are depreciated on a straight line basis over their estimated useful life. The assets residual values and useful lives are reviewed, and adjusted if appropriate, at the end of each reporting period. Depreciation expense has been determined based on the following typical rates of depreciation: > > Buildings (2.5% per annum) > > Plant and equipment (10% to 50% per annum) > > Fixtures and fittings (13% to 50% per annum) > > Motor vehicles (15% to 40% per annum) Leasehold improvements are depreciated over the shorter of the useful life of the improvements or the term of the lease. Leased property, plant and equipment Leased property, plant and equipment where the Group has substantially all the risks and benefits of ownership are classified as finance leases. Assets acquired under finance leases are capitalised and depreciated over the shorter of the lease term and the useful life of the asset. Lease payments are allocated between interest expense and reduction in the lease corresponding liability. The following classes of assets include carrying amounts where the Group is a lessee under a finance lease: Leased assets Building, freehold and leasehold 1,342 1,282 Plant and equipment owned and leased 6,306 6, ,648 7,883 Leases in which a significant portion of the risks and rewards of ownership are retained by the lessor are classified as operating leases. Operating lease assets are not capitalised and lease payments (net of any incentives received from the lessor) are charged to profit or loss on a straight line basis over the period of the lease. 22. PAYABLES Current Trade payables unsecured 17,150 23,366 Expense accruals 153, ,919 Deferred revenue 36,426 30,052 Interest payable 24,040 18,135 GST/VAT payable 20,768 19,843 Broker client deposits (note 17) 19,396 18,655 Employee entitlements 18,775 19,749 Other payables 144, , , ,921 Non-current Other payables 4,300 9,740 4,300 9,740 Trade and other payables represent liabilities for those goods and services provided to the Group prior to the end of the financial year that are unpaid. The amounts are unsecured and are usually paid within 30 days of recognition Computershare Annual Report 2017
85 23. PROVISIONS Provisions are recognised when the Group has a present legal or constructive obligation as a result of past events, it is probable that an outflow of resources will be required to settle the obligation and the amount can be reliably estimated. Where there are a number of similar obligations, the likelihood that an outflow will be required in settlement is determined by considering the class of obligations as a whole. Provisions are measured at the Group s best estimate of the expenditure required to settle the present obligation at the reporting date and discounted to present value where the impact of discounting is material. The discount rate used to determine the present value reflects current market assessments of the time value of money and the risks specific to the liability. Current Restructuring 20,590 9,910 Acquisitions related 1,609 9,992 Tax related 7,316 7,316 Lease related 1,242 2,484 Other 15,859 10,986 46,616 40,688 Non-current Employee entitlements 14,306 14,424 Acquisitions related 11,339 13,878 Other ,635 29,129 Restructuring Restructuring provisions are recognised when a detailed plan for restructuring has been developed and a valid expectation has been raised in the affected employees that the terminations will be carried out. Acquisitions related Acquisition related provisions relate to significant provisions acquired as part of business combinations and are first recognised at the date of acquisition. Tax related Tax related provisions relate to potential tax liabilities associated with prior years business activities. Employee entitlements Employee entitlements provision represents long service leave and other employee entitlements. Where payments to the employee are not expected to be settled wholly within 12 months, they are measured as the present value of expected future payments for the services provided by employees up to the reporting date. Liability for benefits accruing to employees in relation to employee bonuses and annual leave is recognised in payables
86 NOTES TO THE CONSOLIDATED FINANCIAL STATEMENTS Lease related Lease related provisions represent costs to restore leased premises to their original condition at the end of the respective lease terms. Movements in each class of current provision during the financial year are set out below. Restructuring Acquisitions related Tax related Lease related Carrying amount at start of year 9,910 9,992 7,316 2,484 10,986 40,688 Additions 24, ,848 34,718 Payments (14,064) (8,461) (824) (3,983) (27,332) Reversals - (2,403) - (812) (983) (4,198) Transfers and other 349 2,539 - (116) 281 3,053 Foreign exchange movements 6 (58) - 29 (290) (313) Carrying amount at end of year 20,590 1,609 7,316 1,242 15,859 46,616 Movements in each class of non-current provision during the financial year, other than employee entitlements, are set out below. Acquisitions related Carrying amount at start of year 13, ,705 Additions Transfers and other (2,539) (603) (3,142) Carrying amount at end of year 11, , DEFERRED CONSIDERATION Current Deferred settlements on acquisition of entities 21,914 12,402 Non-current Deferred settlements on acquisition of entities 48,953 65,969 Non-current deferred settlements on acquisition of entities are payable in between one and five years. 25. MORTGAGE SERVICING RELATED LIABILITIES Current Mortgage servicing related liabilities 25,323 30,383 Non-current Mortgage servicing related liabilities 157, ,222 Mortgage servicing related liabilities represent the portion of the economic benefits of mortgage servicing rights that has been transferred to third parties. The liabilities are amortised over the same useful life as the related mortgage servicing rights (note 10). 26. OTHER LIABILITIES Current Put option liability (a) - 37,275 Lease inducements (b) 2,205 2,211 2,205 39,486 Non-current Lease inducements (b) 2,164 2,801 (a) Non-controlling interest shareholders of Computershare s Indian subsidiary Karvy (Karvy Computershare Private Limited) have an option to sell their shareholding to Computershare. The put option liability reflects Computershare s obligation to pay should this option be exercised. On 3 August 2017, Computershare agreed to sell its 50% interest in Karvy. The put option liability was reclassified as held for sale at 30 June 2017 (note 9) as the put option will be extinguished on completion of the sale. (b) Lease inducements represent cash payments received as allowances for leasehold improvements made to a number of premises. These receipts are accounted for as reductions in rental expense over the lease term. Other Other 2017 Total Total Computershare Annual Report 2017
87 27. INTERESTS IN EQUITY Members of the parent entity Non-controlling interests Interest in the equity of the consolidated entity: Contributed equity ordinary shares Reserves (98,487) (95,872) (5,401) (6,490) Retained earnings 1,315,607 1,188,890 24,319 19,015 Total interests in equity 1,217,120 1,093,018 19,908 13, CONTRIBUTED EQUITY Ordinary share capital bears no special terms or conditions affecting income or capital entitlements of the shareholders and is classified as equity. Costs directly attributable to the issue of new shares are recognised directly in equity as a deduction, net of tax, from the proceeds. If the Group reacquires its own equity instruments, for example as the result of a share buy-back, those instruments are deducted from equity and the associated shares are cancelled. No gain or loss is recognised in the profit or loss and the consideration paid including any directly attributable incremental costs (net of income taxes) is recognised directly in equity. Share buy-back On 18 August 2015, Computershare announced an on-market buy-back of shares with an aggregate value of AUD million for capital management purposes. The on-market share buy-back ended on 31 August 2016, with 9,877,069 ordinary shares purchased and cancelled at a total cost of AU$105.2 million (US$76.6 million). From 1 July 2016 until 31 August 2016, the Company purchased and cancelled 500,000 ordinary shares at a total cost of AU$4.6 million (US$3.5 million) with an average price of AU$9.20 and a price range from AU$9.03 to AU$9.33. Since the effect of share buy-backs over the years has reduced contributed equity to nil, a reserve has been created to reflect the excess value of shares bought over the original amount of subscribed capital. There has been no issue of ordinary shares during the year ended 30 June Movement in contributed equity Number of shares Balance at 1 July ,826,010 - Share buy-back (500,000) (3,458) Transfer to share buy-back reserve - 3,458 Balance as at 30 June ,326,010 - On 16 August 2017, Computershare announced an on-market buy-back of shares with an aggregate value of up to AUD million for capital management purposes. The buy-back commenced on 30 August
88 NOTES TO THE CONSOLIDATED FINANCIAL STATEMENTS 29. RESERVES Capital redemption reserve 2 2 Foreign currency translation reserve (72,526) (73,039)* Share buy-back reserve (40,927) (37,469) Cash flow hedge reserve (4,855) (4,855) Share based payments reserve 44,244 43,925 Equity related contingent consideration reserve (8,199) (8,199) Available-for-sale asset reserve Transactions with non-controlling interests (16,504) (16,504) (98,487) (95,872) Movements during the year: Foreign currency translation reserve Opening balance (73,039) (50,070)* Translation of controlled entities 4,591 (45,527) Amounts reclassified to profit or loss during the year - 29,505 Deferred tax (4,078) (6,947) Closing balance (72,526) (73,039) * 2016 comparative balance has been restated to reflect the correction of an immaterial prior period error resulting in the reclassification within equity of $14.4 million from the foreign currency translation reserve to retained earnings Share buy-back reserve Opening balance (37,469) - Excess value of shares bought over the original amount of subscribed capital (3,458) (37,469) Closing balance (40,927) (37,469) Cash flow hedge reserve Opening balance (4,855) (4,464) Revaluation - (497) Deferred tax Closing balance (4,855) (4,855) Share based payments reserve Opening balance 43,925 45,144 Cash purchase of shares for employee and executive share plans (15,105) (12,177) Share based payments expense 15,424 10,958 Closing balance 44,244 43,925 Equity related contingent consideration reserve Opening balance (8,199) (8,199) Closing balance (8,199) (8,199) Available-for-sale asset reserve Opening balance Revaluation 11 (62) Closing balance Transactions with non-controlling interests Opening balance (16,504) (16,504) Closing balance (16,504) (16,504) 88 Computershare Annual Report 2017
89 Nature and purpose of reserves (a) Foreign currency translation reserve On consolidation, exchange differences arising on translation of the foreign controlled entities are taken to the foreign currency translation reserve. This amount is the net of gains and losses on hedge transactions and intercompany loans after adjusting for related income tax effects. When a foreign operation is disposed, the associated exchange differences are reclassified to profit or loss as part of the gain or loss on sale. (b) Share buy-back reserve This reserve is used to record the excess value of shares bought over the original amount of subscribed capital. (c) Cash flow hedge reserve This reserve records the portion of the gain or loss on a hedging instrument in a cash flow hedge that is determined to be in an effective hedge relationship. (d) Share based payments reserve The share based payments reserve is used to recognise the fair value of shares which will vest to employees under employee and executive share plans. This reserve is also used to record cash purchase of shares for employee share plans. (e) Equity related contingent consideration reserve This reserve is used to reflect deferred consideration for acquisitions which is payable through the issue of parent entity equity instruments. (f) Available for sale asset reserve Changes in the fair value of investments classified as available for sale financial assets, such as equities, after adjusting for related income tax effects are taken to this reserve. Amounts are reclassified to profit or loss when the associated assets are sold or impaired. (g) Transactions with non-controlling interests This reserve is used to record the differences which may arise as a result of transactions with non-controlling interests that do not result in a loss of control. 30. RETAINED EARNINGS AND DIVIDENDS Retained earnings Retained earnings at the beginning of the financial year 1,188,890 1,160,106* Ordinary dividends provided for or paid (139,678) (128,550) Net profit attributable to members of Computershare Limited 266, ,334 Retained earnings at the end of the financial year 1,315,607 1,188,890 * 2016 comparative balance has been restated to reflect the correction of two immaterial prior period errors the reclassification within equity of $14.4 million from the foreign currency translation reserve to retained earnings and the reduction of the carrying value of investments by $2.2 million (refer to note 32) Dividends Ordinary Final dividend paid during the financial year in respect of the previous year, AUD 17 cents per share franked to 20% (2016 AUD 16 cents per share franked to 25%) Interim dividend paid in respect of the current financial year ended June 2017, AUD 17 cents per share franked to 30% (2016 AUD 16 cents per share franked to 100%) 69,841 64,726 69,837 63,824 A final dividend in respect of the year ended 30 June 2017 was declared by the directors of the Company on 16 August 2017, to be paid on 18 September This is an unfranked ordinary dividend of AU 19 cents per share. As the dividend was not declared until 16 August 2017, a provision was not recognised as at 30 June Dividend franking account Franking credits available for subsequent financial years based on a tax rate of 30% 20,470 10,292 89
90 NOTES TO THE CONSOLIDATED FINANCIAL STATEMENTS 31. DETAILS OF CONTROLLED ENTITIES The financial year-end of all controlled entities is 30 June with the exception of Computershare Canada Inc and its controlled entities, Computershare Hong Kong Investor Services Limited and its controlled entities, Computershare International Information Consultancy Services (Beijing) Company Ltd and Karvy Computershare Private Limited and its controlled entities due to local statutory reporting requirements. These entities prepare results on a 30 June year end basis for consolidation purposes. Voting power is in accordance with the ownership interest held unless otherwise stated. The consolidated financial statements as at 30 June 2017 include the following controlled entities: Percentage of shares held Name of controlled entity Place of incorporation 2017 % 2016 % Computershare Limited Australia (2) - - A.C.N Pty Ltd Australia (1)(2) A.C.N Pty Ltd Australia (1)(2) A.C.N Pty Limited Australia (1)(4) A.C.N Pty Limited Australia (1)(4) CDS International Pty Limited Australia (1)(2) Communication Services Australia Pty Limited Australia (1)(2) Computershare Clearing Pty Limited Australia (1) Computershare Communication Services Pty Limited Australia (1)(2) Computershare Dealing Services Pty Ltd Australia (1) Computershare Depositary Pty Limited Australia (1) Computershare Finance Company Pty Limited Australia (1)(2) Computershare Investor Services Pty Limited Australia (1)(2) Computershare Plan Co Pty Ltd Australia (1) Computershare Plan Managers Pty Ltd Australia (1) Computershare Technology Services Pty Ltd Australia (1)(2) Computershare Utility Services Pty Ltd Australia (1)(2) CPU Share Plans Pty Limited Australia (1) CRS Custodian Pty Ltd Australia (1) Financial Market Software Consultants Pty Ltd Australia (1) Georgeson Shareholder Communications Australia Pty. Ltd. Australia (1) Global edelivery Group Pty Ltd Australia (1) Obadele Pty Ltd Australia (1)(2) Q M Industries (N.S.W.) Pty. Ltd. Australia (1) Registrars Holding Pty Ltd Australia (1)(2) Sepon (Australia) Pty. Limited Australia (1) Source One Communications Australia Pty Ltd Australia (1) Switchwise Pty Ltd Australia (1) Karvy Computershare W.L.L Bahrain (3) Computershare Investor Services (Bermuda) Limited Bermuda (1) Computershare Investor Services (BVI) Limited British Virgin Islands (1) Computershare Canada Inc Canada (1) Computershare Governance Services Ltd Canada (1) Computershare Investment Inc. Canada (1) Computershare Investments (Canada) (Holdings) ULC Canada (1) Computershare Investments (Canada) (No.1) ULC Canada (1) Computershare Investments (Canada) (No.2) ULC Canada (1) Computershare Investments (Canada) (No.3) ULC Canada (1) Computershare Investments (Canada) (No.4) ULC Canada (1) Computershare Investor Services Inc Canada (1) Computershare Services Canada Inc Canada (1) Computershare Technology Services Inc Canada (1) Computershare Trust Company of Canada Canada (1) Georgeson Shareholder Communications Canada Inc Canada (1) RicePoint Administration Inc. Canada (1)(4) SyncBASE Inc. Canada (1) Computershare Investor Services (Cayman) Limited Cayman Islands (1) Computershare Annual Report 2017
91 Name of controlled entity Computershare International Information Consultancy Services (Beijing) Company Ltd Place of incorporation Percentage of shares held 2017 % 2016 % China (1) Computershare A/S Denmark (1) Georgeson Shareholder SAS France (1) Computershare Communication Services GmbH Germany (1) Computershare Deutschland GmbH & Co. KG Germany (1) Computershare Governance Services GmbH Germany (1) Computershare Verwaltungs GmbH Germany (1) Grundstücksentwicklungs Gesellschaft Am Schönberg GmbH Germany (1) PR Im Turm HV-Service AG Germany (1)(5) Computershare Investor Services (Guernsey) Limited Guernsey (1) Computershare Asia Limited Hong Kong (1) Computershare Hong Kong Development Limited Hong Kong (1) Computershare Hong Kong Investor Services Limited Hong Kong (1) Computershare Hong Kong Nominees Limited Hong Kong (1) Computershare Hong Kong Trustees Limited Hong Kong (1) Hong Kong Registrars Limited Hong Kong (1) Karvy Computershare Private Limited India (3) Computershare Finance Ireland Limited Ireland (1) Computershare Governance Services Limited Ireland (1) Computershare Investor Services (Ireland) Limited Ireland (1) Computershare Services Nominees (Ireland) Limited Ireland (1) Computershare Trustees (Ireland) Limited Ireland (1) HML Mortgage Services Ireland Limited Ireland (1) Specialist Mortgage Services Ireland Limited Ireland (1) Computershare Investor Services (IOM) Limited Isle of Man (1) Computershare Italy S.r.l. Italy (1) Computershare S.p.A. Italy (1) Georgeson S.r.l. Italy (1) Proxitalia S.r.l. Italy (1) Computershare Company Secretarial Services (Jersey) Limited Jersey (1) Computershare DR Nominees Limited Jersey (1) Computershare Investor Services (Jersey) Limited Jersey (1) Computershare Nominees (Channel Islands) Limited Jersey (1) Computershare Offshore Services Limited Jersey (1) Computershare Trustees (C.I.) Limited Jersey (1) Computershare Trustees (Jersey) Limited Jersey (1) EES Nominees International Limited Jersey (1) Karvy Computershare (Malaysia) Sdn Bhd Malaysia (3) Computershare Netherlands B.V. Netherlands (1) Computershare Investor Services Limited New Zealand (1) Computershare Nominees NZ Limited New Zealand (1) ConnectNow New Zealand Limited New Zealand (1) CRS Nominees Limited New Zealand (1) ZAO <<Ediniy Registrator>> Russia (1)(5) - 98 CIS Company Secretaries (Pty) Ltd South Africa (1) Computershare (Pty) Ltd South Africa (1) Computershare Investor Services (Pty) Ltd South Africa (1) Computershare Nominees (Pty) Ltd South Africa (1) Computershare Outsourcing (Pty) Ltd South Africa (1) Computershare South Africa (Pty) Ltd South Africa (1) Computershare TR Services (Pty) Ltd South Africa (1) Minu (Pty) Ltd South Africa (1) Georgeson S.l Spain (1) Computershare AB Sweden (1)
92 NOTES TO THE CONSOLIDATED FINANCIAL STATEMENTS Name of controlled entity Place of incorporation Percentage of shares held Computershare Schweiz AG Switzerland (1)(4) Baseline Capital Limited United Kingdom (1) Computershare (Russia) Limited United Kingdom (1) Computershare Company Nominees Limited United Kingdom (1) Computershare Governance Services (UK) Limited United Kingdom (1) Computershare Investments (UK) (No.2) Limited United Kingdom (1) Computershare Investments (UK) (No.3) Limited United Kingdom (1) Computershare Investments (UK) (No.5) Limited United Kingdom (1) Computershare Investments (UK) (No.6) Limited United Kingdom (1) Computershare Investments (UK) (No.7) Limited United Kingdom (1) Computershare Investments (UK) (No.8) Limited United Kingdom (1) Computershare Investments (UK) (No.9) Limited United Kingdom (1) Computershare Investments (UK) Limited United Kingdom (1) Computershare Investor Services PLC United Kingdom (1) Computershare Limited United Kingdom (1) Computershare Mortgage Services Limited United Kingdom (1) Computershare PEP Nominees Limited United Kingdom (1) Computershare Regional Services Limited United Kingdom (1) Computershare Services Limited United Kingdom (1) Computershare Services Nominees Limited United Kingdom (1) Computershare Technology Services (UK) Limited United Kingdom (1) Computershare Trustees Limited United Kingdom (1) Computershare Voucher Services Limited United Kingdom (1) Credit Advisory Services Limited United Kingdom (1) EES Capital Trustees Limited United Kingdom (1) EES Corporate Trustees Limited United Kingdom (1) EES Services (UK) Limited United Kingdom (1) EES Trustees Limited United Kingdom (1) Homeloan Management Limited United Kingdom (1) KB Analytics Limited United Kingdom (1) Legotla Investments (UK) Limited United Kingdom (1) Mortgage Systems Limited United Kingdom (1) NRC Investments (UK) Limited United Kingdom (1) Pathbold Limited United Kingdom (1) Topaz Finance Limited United Kingdom (1) Administar Services Group LLC United States of America (1) Altavera, LLC United States of America (1) Altavera Mortgage Services, LLC United States of America (1) Capital Markets Cooperative, LLC United States of America (1) Capital Markets Holdings, Inc. United States of America (1) CMC Funding, Inc. United States of America (1) Computershare Communication Services Inc. United States of America (1) Computershare Finance LLC United States of America (1) Computershare Governance Services Inc. United States of America (1) Computershare Holdings Inc. United States of America (1) Computershare Holdings LLC United States of America (1) Computershare Inc. United States of America (1) Computershare Mortgage Services LLC United States of America (1) Computershare Mortgage Solutions LLC United States of America (1) Computershare Technology Services, Inc. United States of America (1) Computershare Trust Company, N.A. United States of America (1) Computershare US United States of America (1) Computershare US Investments LLC United States of America (1) Computershare US Services Inc. United States of America (1) Computershare Valuation Services LLC United States of America (1)(4) % 2016 % 92 Computershare Annual Report 2017
93 Name of controlled entity Place of incorporation Percentage of shares held Data Point Analysis Group, LLC United States of America (1) Georgeson LLC United States of America (1) Georgeson Securities Corporation United States of America (1) Gilardi & Co., LLC United States of America (1) Gilco LLC United States of America (1) GTU Ops Inc. United States of America (1) HELOC Funding II Trust United States of America (1) KCC Class Action Services LLC United States of America (1) Kurtzman Carson Consultants Inc. United States of America (1) Kurtzman Carson Consultants, LLC United States of America (1) MSR Robin Advances (Depositor) LLC United States of America (1) MSR Robin Advances Issuer Trust United States of America (1) RCNG LLC United States of America (1) Rosenthal & Company, LLC United States of America (1) Settlement Recovery Group LLC United States of America (1) SLS Funding III LLC United States of America (1) SLS Investco LLC United States of America (1) SLS Servicer Advance Revolving Trust 1 United States of America (1) Specialized Asset Management LLC United States of America (1) Specialized Loan Servicing Holdings LLC United States of America (1) Specialized Loan Servicing LLC United States of America (1) Specialized Title Services LLC United States of America (1) (1) Controlled entities audited by PricewaterhouseCoopers member firms. (2) These wholly owned companies have entered into a deed of cross guarantee dated 26 June 2008 with Computershare Limited which provides that all parties to the deed will guarantee to each creditor payment in full of any debt of each company participating in the deed on the winding-up of that company. As a result of ASIC Corporations (Wholly-owned Companies) Instrument 2016/785 these companies are relieved from the requirement to prepare a financial report and directors report. (3) These companies are controlled entities as Computershare Limited is exposed to, or has rights to, variable returns from its involvement with these companies and has the ability to affect those returns through its power over these companies. (4) These companies became controlled entities during the year ended 30 June (5) These companies ceased to be controlled entities during the year ended 30 June % 2016 % 93
94 NOTES TO THE CONSOLIDATED FINANCIAL STATEMENTS 32. INVESTMENTS IN ASSOCIATES AND JOINT VENTURES Investments in associates and joint ventures are accounted for using the equity method of accounting. Under this method, the investments are initially recognised at cost and the carrying value is subsequently adjusted for increases or decreases in the Group s share of post-acquisition profit or loss and movements in other comprehensive income. The Group s share of post-acquisition profits or losses from investments in associates and joint ventures is recognised in the profit or loss. Dividends received or receivable are recognised as a reduction of the carrying amount of the investment. Set out below are the associates and joint ventures of the Group at 30 June 2017: Ownership interest Consolidated carrying amount Name Place of incorporation Principal activity Associates Expandi Ltd United Kingdom Investor Services ,136 6,045 Milestone Group Pty Ltd 1 Australia Technology Services ,759 3,423 The Reach Agency Holdings Pty Ltd 2 Australia Investor Services ,072 1,244 INVeSHARE Inc. 3 United States Investor Services ,326 Mergit s.r.l. Italy Technology Services Total investments in associates 10,967 25,053 Joint ventures Computershare Pan Africa Holdings Ltd Mauritius Investor Services Asset Checker Ltd United Kingdom Investor Services VisEq GmbH Germany Investor Services Total investment in joint ventures Total investment in associates and joint ventures 11,021 25,157 1 June 2016 balance has been restated to reflect the correction of an immaterial prior period error, which resulted in the reduction of the Milestone carrying value by $2.2 million. 2 The previous investment in The Reach Agency Pty Ltd became an investment in the newly created holding entity The Reach Agency Holdings Pty Ltd. The Reach Agency Holdings Pty Ltd owns 100% of The Reach Agency Pty Ltd. The current interest in The Reach Agency Holdings Pty Ltd is 46.5%. June 2017 % 3 INVeSHARE Inc. was disposed during the reporting period. A post-tax gain of $9.3 million was recorded on the disposal. June 2016 % June 2017 June 2016 The movements in the carrying amount of equity accounted investments in associates and joint ventures are as follows: Associates Joint Ventures Carrying amount at the beginning of the financial year 25,053 27, ,558 Disposal of investments (14,383) - - (1,200) Share of net result (after income tax) 705 (1,339) (50) (10) Dividends received (421) (254) - (203) Share of movement in reserves 13 (1,192) - (41) Carrying amount at the end of the financial year 10,967 25, Computershare Annual Report 2017
95 33. DEED OF CROSS GUARANTEE Computershare Limited and each wholly-owned subsidiary party to a deed of cross guarantee dated 26 June 2008 (together the Closed Group ) are listed in note 31. Set out below is a consolidated statement of comprehensive income, a consolidated statement of financial position and a summary of movements in consolidated retained earnings of the Closed Group for the year ended 30 June Computershare Limited Closed Group Statement of financial position Current assets Cash and cash equivalents 38,507 30,942 Receivables 57,633 70,560 Inventories Other current assets 3,611 3,088 Derivative financial instruments Assets classified as held for sale 9,131 23,842 Total current assets 110, ,030 Non-current assets Receivables 114, ,982 Other financial assets 1,787,692 1,735,067 Property, plant and equipment 8,783 10,797 Deferred tax assets 49,926 48,579 Intangibles 131, ,061 Derivative financial instruments 19,440 48,014 Other non-current assets Total non-current assets 2,112,411 2,113,186 Total assets 2,222,420 2,243,216 Current liabilities Payables 298, ,896 Lease liabilities 1,554 25,966 Current tax liabilities 19,306 6,715 Provisions 746 1,006 Derivative financial instruments 3,653 1,236 Liabilities directly associated with assets classified as held for sale 45,713 - Other liabilities 94 37,385 Total current liabilities 369, ,204 Non-current liabilities Payables 125, ,163 Interest bearing liabilities 269, ,509 Lease liabilities 1,294 1,411 Deferred tax liabilities 7,355 15,917 Provisions 11,643 11,656 Derivative financial instruments 3,374 5,500 Other liabilities Total non-current liabilities 419, ,627 Total liabilities 789, ,831 Net assets 1,433,265 1,339,385 Equity Contributed equity ordinary shares - - Reserves (84,774) (114,016) Retained earnings 1,518,039 1,453,401 Total equity 1,433,265 1,339,
96 NOTES TO THE CONSOLIDATED FINANCIAL STATEMENTS Computershare Limited Closed Group Statement of comprehensive income Revenues from continuing operations Sales revenue 231, ,832 Other revenue 237, ,075 Total revenue from continuing operations 468, ,907 Other income 52,411 60,547 Expenses Direct services 175, ,193 Technology costs 65,936 71,897 Corporate services 23,129 22,030 Finance costs 23,937 24,545 Total expenses 288, ,665 Share of net profit/(loss) of associates and joint ventures accounted for using the equity method Profit before income tax expense 232, ,931 Income tax expense/(credit) 27,953 29,383 Profit for the year 204, ,548 Other comprehensive income Exchange differences on translation of foreign operations 44,000 (42,365) Total other comprehensive income for the year, net of tax 44,000 (42,365) Total comprehensive income for the year 248, ,183 Set out below is a summary of movements in consolidated retained profits for the year of the Closed Group. Retained earnings at the beginning of the financial year 1,453,401 1,419,416 Profit for the year 204, ,548 Dividends provided for or paid (139,678) (128,563) Retained earnings at the end of the financial year 1,518,039 1,453, PARENT ENTITY FINANCIAL INFORMATION (a) Summary financial information The individual financial statements for the parent entity show the following aggregate amounts: Balance sheet Current assets 73,370 64,501 Non-current assets 1,229, ,016 Total assets 1,302, ,517 Current liabilities 62,560 63,098 Non-current liabilities 835, ,479 Total liabilities 897, ,577 Equity Contributed equity ordinary shares - - Reserves Share buy-back reserve (40,927) (37,469) Capital redemption reserve 2 2 Foreign currency translation reserve 77,704 68,136 Share based payment reserve 33,364 33,162 Equity related consideration (2,327) (2,327) Available-for-sale asset reserve (60) (60) Retained earnings 337,530 38,496 Total equity 405,286 99,940 Profit/(loss) attributable to members of the parent entity 438,713 45,825 Total comprehensive income attributable to members of the parent entity 448,281 35, Computershare Annual Report 2017
97 (b) Guarantees The parent entity s financial guarantees have been outlined in note 35. (c) Contingent liabilities The parent entity did not have any contingent liabilities as at 30 June 2017 or 30 June 2016 other than the Australian thin capitalisation contingent liability outlined in note 6 and the matters outlined in note 35. (d) Parent entity financial information The financial information for the parent entity, Computershare Limited has been prepared on the same basis as the consolidated financial statements, except as set out below. Investments in controlled entities, associates and joint venture entities Investments in controlled entities, associates and joint venture entities are accounted for at cost in the financial statements of Computershare Limited. Dividends received from associates and joint ventures are recognised in the parent entity s profit or loss, rather than being deducted from the carrying amount of these investments. Tax consolidation legislation Computershare Limited and its wholly-owned Australian controlled entities formed a tax consolidation group with effect from 1 July Members of the tax consolidated group also entered into a tax sharing deed, which includes a tax funding arrangement. As a consequence, Computershare Limited, as the head entity in the tax consolidation group, has recognised the current tax liability (or receivable) relating to the wholly owned Australian controlled entities in this group in the financial statements as if that liability (or receivable) was its own. Amounts receivable or payable under the tax sharing deed are recognised separately as intercompany payables or receivables. 35. CONTINGENT LIABILITIES (a) Guarantees and Indemnities Guarantees and indemnities of $900.0 million (2016: $900.0 million) have been given to the consolidated entity s bankers by Computershare Limited, ACN Pty Ltd, Computershare Investments (UK) (No. 3) Ltd, Computershare Finance Company Pty Ltd, Computershare US and Computershare Investor Services Inc under a $450.0 million 3-year Multi-currency Syndicated Facility Agreement and a $450.0 million 5-year USD Syndicated Facility Agreement both executed on 17 July 2014 (refer to note 14 for further detail). Guarantees and indemnities of $785.0 million (2016: $806.0 million) have been given to US Institutional Accredited Investors by Computershare Limited, ACN Pty Ltd, Computershare Finance Company Pty Ltd, Computershare US, Computershare Investments (UK) (No. 3) Ltd and Computershare Investor Services Inc under a Note and Guarantee Agreement dated 22 March 2005, 29 July 2008 and 9 February Bank guarantees of AUD 3.1 million (2016: AUD 4.8 million) have been given in respect of facilities provided to Australian subsidiaries. Bank guarantees of ZAR 7.8 million (2016: 1.6 million) have been given in respect of facilities provided to South African subsidiaries. A performance guarantee of ZAR 16.0 million (2016: ZAR 16.0 million) has been given by Computershare (Pty) Ltd to provide security for the performance of obligations as a Central Securities Depository Participant. (b) Legal and Regulatory Matters Due to the nature of operations, certain commercial claims in the normal course of business have been made against the consolidated entity in various countries. An inherent difficulty in predicting the outcome of such matters exists, but in the opinion of the Group, based on current knowledge and in consultation with legal counsel, we do not expect any material liability to the Group to eventuate. The status of all claims is monitored on an ongoing basis, together with the adequacy of any provisions recorded in the Group s Financial Statements. For the Australian thin capitalisation contingent liability refer to note 6. (c) Other The Group is subject to regulatory capital requirements administered by relevant regulatory bodies in countries where Computershare operates. Failure to meet minimum capital requirements, or other ongoing regulatory requirements, can initiate action by the regulators that, if undertaken, could revoke or suspend the Group s ability to provide trust services to customers in these markets. At all relevant times Group controlled entities have met all minimum capital requirements. Computershare Limited (Australia) has issued a letter of warrant to Computershare (Pty) Ltd. This obligates Computershare Limited (Australia) to maintain combined tier one capital of at least ZAR million. 97
98 NOTES TO THE CONSOLIDATED FINANCIAL STATEMENTS Potential withholding and other tax liabilities arising from distribution of all retained distributable earnings of all foreign incorporated controlled entities are $41.3 million (2016: $47.1 million). No provision is made for withholding tax on unremitted earnings of applicable foreign incorporated controlled entities as there is currently no intention to remit these earnings to the parent entity. In consideration of the Australian Securities and Investments Commission agreeing to allow AUD 5.0 million to form part of the net tangible assets of Computershare Clearing Pty Ltd so that it can meet certain financial requirements under the conditions of its Australian Financial Services Licence, Computershare Limited has agreed to make, at the request of Computershare Clearing Pty Ltd, a AUD 5.0 million loan to it. Computershare Limited has agreed to subordinate its loan to any other unsecured creditors of Computershare Clearing Pty Ltd. The loan was made pursuant to a deed of subordination dated 7 January In consideration of the Australian Securities and Investments Commission agreeing to allow AUD 5.0 million to form part of the net tangible assets of Computershare Share Plans Pty Ltd so that it can meet certain financial requirements under the conditions of its Australian Financial Services Licence, Computershare Limited has agreed to make, at the request of Computershare Share Plans Pty Ltd, a AUD 5.0 million loan to it. Computershare Limited has agreed to subordinate its loan to any other unsecured creditors of Computershare Share Plans Pty Ltd. The loan was made pursuant to a deed of subordination dated 5 July Computershare Limited (Australia), as the parent entity, has undertaken to own, either directly or indirectly, all of the equity interests and to guarantee performance of the obligations of Computershare Investor Services Pty Ltd, Computershare Trust Company NA, Georgeson LLC, Georgeson Securities Corporation, Computershare Trust Company of Canada and Computershare Investor Services Inc with respect to any financial accommodation related to transactional services provided by BMO Harris Bank, Chicago. 36. COMMITMENTS (a) Retirement benefits Defined Contribution Funds The Group maintains defined contribution superannuation schemes which provide benefits to all employees upon their disability, retirement or death. Employee contributions to the funds are based upon various percentages of employees gross salaries as set out below: Australian controlled entities contribute to the defined contribution funds as follows: > > Category 1 Management (employer contributions, voluntary employee contributions) > > Category 2 Staff (statutory employer contributions of 9.5%, voluntary employee contributions) > > Category 3 SGC Staff and casual and fixed term employees (statutory employer contributions, voluntary employee contributions) Foreign controlled entities contribute to the defined contribution funds as follows: > > United Kingdom entities between 7% and 10% of employees gross salaries > > United States entities voluntary employee contributions with matching employer contribution up to 4% of employees base salaries > > Canadian entities between 2% and 7% of employees base salaries dependent upon years of service > > South African entities 12.25% of employees gross salaries > > New Zealand entities voluntary employee contributions with matching employer contribution up to 6% of employees base salaries > > Hong Kong entities between 5% and 20% of employees base salary dependent upon years of service > > Indian entity 12% of employees gross salaries Defined Benefit Funds Where material to the Group, a liability or asset in respect of these plans is recognised in the consolidated statement of financial position, and is measured as the present value of the defined benefit obligation at the reporting date plus unrecognised actuarial gains (less unrecognised actuarial losses) less the fair value of the superannuation fund s assets at that date and any unrecognised past service cost. Karvy Computershare Private Limited maintained a defined benefit superannuation scheme which provides benefits to 4,303 employees (2016: 3,663). Actuarial valuation of the scheme is provided by the Life Insurance Corporation, which maintains the fund. The net liability is not material to the Group. Computershare Deutschland GmbH & Co. KG and Computershare Communication Services GmbH maintained a defined benefit scheme which provides benefits to 9 employees (2016: 9). An actuarial assessment of the scheme was completed as at 30 June 2017 and defined benefit plan liability recognised in accordance with the actuarial valuation. The net liability is not material to the Group. 98 Computershare Annual Report 2017
99 (b) Finance lease commitments Commitments in relation to finance leases are payable as follows: Not later than 1 year 5,462 33,258 Later than 1 year but not later than 5 years 4,740 7,957 Minimum lease payments 10,202 41,215 Less: Future finance charges Not later than 1 year (99) (2,986) Later than 1 year but not later than 5 years (79) (65) Total future finance charges (178) (3,051) Net finance lease liability 10,024 38,164 Reconciled to: Current liability (note 14) 5,363 30,272 Non-current liability (note 14) 4,661 7,892 10,024 38,164 (c) Operating lease commitments Commitments for minimum lease payments in relation to non-cancellable operating leases are payable as follows: Not later than 1 year 51,623 45,263 Later than 1 year but not later than 5 years 114, ,627 Later than 5 years 58,043 45, , ,285 (d) Other An overseas subsidiary performing loan servicing activities is obliged, in certain circumstances, to make payments on behalf of mortgagors related to taxes, insurance, principal and interest. The amount of these advance payments fluctuates over time as it depends on the type of loans being serviced and their performance. As part of an MSR transaction completed in this reporting period, the overseas subsidiary undertook to purchase in 24 months from acquisition date any previously advanced amounts related to this MSR that remain uncollected at that point in time at fair value, rather than acquire the advances upon the MSR acquisition as is customary. The overseas subsidiary will have the responsibility to fund any new advances associated with this portfolio of loans. 37. CAPITAL EXPENDITURE COMMITMENTS Capital expenditure commitments contracted for at balance date but not recorded in the financial statements are as follows: Fit-out of premises 96 - Plant and equipment 1,635 1,296 1,731 1, SIGNIFICANT EVENTS AFTER YEAR END Post balance date events are included in notes 9 (disposal of Karvy) and 28 (share buy-back). No matter or circumstance has arisen since the end of the financial year which is not otherwise dealt with in this financial report that has significantly affected or may significantly affect the operations of the consolidated entity, the results of those operations or the state of affairs of the consolidated entity in subsequent financial years
100 NOTES TO THE CONSOLIDATED FINANCIAL STATEMENTS 39. RELATED PARTY DISCLOSURES Key management personnel disclosures are included in note 40. Detailed remuneration disclosures are provided in the remuneration report. Directors shareholdings Shares in the parent entity Ordinary shares held at the end of the financial year 46,885,493 50,147,772 Net ordinary shares purchased/(sold) by directors during the financial year (3,337,279) (290,000) Ordinary dividends received during the year in respect of those ordinary shares 12,643,464 11,709,346 (a) Wholly owned Group intercompany transactions and outstanding balances The parent entity and its controlled entities entered into the following transactions during the year within the wholly owned Group: > > Loans were advanced and repayments received on loans and intercompany accounts > > Fees were exchanged between entities > > Interest was charged between entities > > The parent entity and its Australian controlled entities have been parties to a tax sharing deed, which includes a tax funding arrangement (note 34) > > Dividends were paid between entities > > Bank guarantees were provided by the parent entity to its controlled entities (note 35) These transactions were undertaken on commercial terms and conditions. Ultimate controlling entity The ultimate controlling entity of the Group is Computershare Limited. (b) Ownership interests in related parties Interests in controlled entities are set out in note 31. Interests held in associates and joint ventures are disclosed in note 32. (c) Transactions with associates and joint ventures The following transactions occurred with associates and joint ventures: Sales and purchases of goods and services Sales to 125, ,964 Purchases from 1,111,348 1,993,643 Outstanding balances arising from sales and purchases of goods and services Trade receivables 54,457 1,199,020 Trade payables 3,331 72,658 Loans to associates Loan receivable from INVeSHARE Inc. - 7,192,730 These transactions were undertaken on commercial terms and conditions $ 2017 $ 2016 $ 2016 $ 100 Computershare Annual Report 2017
101 40. KEY MANAGEMENT PERSONNEL DISCLOSURES Key management personnel compensation Short-term employee benefits 8,121,378 7,861,927 Other long-term benefits 60,603 26,406 Post-employment benefits 257, ,033 Share based payments 2,580,944 1,143,461 Other 369,716 16,933 Total 11,390,321 9,334,760 For detailed remuneration disclosures please refer to section A to F of the remuneration report within the Directors Report. 41. EMPLOYEE AND EXECUTIVE BENEFITS Certain employees are entitled to participate in share and performance rights schemes. A transaction is classified as share-based compensation where the Group receives services from employee and pays for these in shares or similar equity instruments. For each of the Group s share plans, the fair value is measured at grant date and the expense is recognised over the relevant vesting period in the income statement with a corresponding increase in the share based payments reserve. The expense is adjusted to reflect actual and expected levels of vesting. (a) Share plans Exempt Employee Share Plan During the year ended 30 June 2001 the Group introduced an Exempt Employee Share Plan. The Plan gives Computershare employees in Australia the opportunity to acquire shares in Computershare Limited. Each year, participating employees can make contributions from their pre-tax salary to acquire AUD 500 worth of shares. Such employee contributions are matched by the Group with an additional AUD 500 worth of shares being acquired for each participating employee. All permanent employees in Australia with at least 6 months service and employed at the allocation date are entitled to participate in this Plan. Deferred Employee Share Plan During the year ended 30 June 2002 a Deferred Employee Share Plan was established to enable Computershare to match dollar for dollar any employee pre-tax contributions to a maximum of AUD 3,000 per employee. Shares purchased and funded by an employee s pre-tax salary must remain in the plan for a minimum of 1 year. Matching shares funded by the Group must be kept in the plan for a minimum of 2 years or they will be forfeited. All permanent employees in Australia employed at the allocation date are entitled to participate in this Plan. A derivative of this Plan and the Exempt Employee Share Plan have been made available to employees in New Zealand, Hong Kong, China, the United Kingdom, Ireland, Jersey, Germany, Canada, South Africa and the United States of America. Subject to the discretion of the Board, shares in the parent entity may also be allocated to selected employees in accordance with an employee share plan on a discretionary basis having regard to special circumstances as determined by the Remuneration Committee. Such shares may be subject to vesting and performance criteria as determined by the Board or the Remuneration Committee. Deferred Short-Term Incentive (DSTI) Share Plan The Group also provides DSTI awards to key management personnel and other senior executives as part of a structured STI plan and then other high performing employees on a discretionary basis. Recipients of DSTI awards must complete specified periods of service as a minimum before any share awards under the DSTI plan become unconditional. Number of employee shares held Ordinary shares Opening balance 10,522,529 10,031,383 Shares purchased on the market 3,741,252 3,050,756 Forfeited shares reissued 303,124 23,424 Shares forfeited (256,280) (139,873) Shares withdrawn (3,515,568) (2,443,161) Closing balance 10,795,057 10,522,529 Fair value of shares granted through the employee share plan ()* 32,277 23,050 * Weighted average fair value of shares is determined by the closing price at the end of the day s trading on the Australian Securities Exchange on the allocation date. The average price per share purchased on market was AUD $ $ 2016 $ 101
102 NOTES TO THE CONSOLIDATED FINANCIAL STATEMENTS Phantom Share Awards Plan The Phantom Share Awards Plan (Phantom Plan) was introduced in 2013 as an alternative to the DSTI Share Plan to employees who are resident for tax purposes in countries where the taxation and/or legal requirements mean the DSTI Share Plan does not achieve the most effective outcome for Computershare or those employees. Awards under the Phantom Plan are cash-settled and vest after specified periods of service have been completed. (b) Performance rights Long-Term Incentive Plan The Board has offered to eligible key management personnel and senior group executives in the Group performance rights under long-term incentive plans. In 2014, the Board approved the terms of a new Long-Term Incentive Plan, known as the LTI Plan, which replaces the DLI plan. Performance rights are granted for no consideration and carry no dividend or voting rights. Each performance right carries an entitlement to one fully paid ordinary share in Computershare Limited subject to satisfaction of performance hurdles and continued employment over a three year performance period. Under the plan, 50% of each award of performance rights is subject to EPS hurdle criteria and 50% is subject to TSR Performance criteria. Unvested performance rights lapse on employee s termination, subject to Board discretion. Set out below are summaries of performance rights granted under the LTI Plan: Balance at beginning of the year Granted during the year Exercised during the year Forfeited during the year Balance at end of the year Exercisable at end of the year Grant date Approximate exercise date Exercise price 1 Dec 2014 Sep 2017 $ , ,529-1 Dec 2015 Sep 2018 $ , , Dec 2016 Sep 2019 $ , ,375 - Total 1,281, , ,031,820 - No performance rights expired during the period covered by the above table. The fair value of performance rights granted under the 2017 LTI plan were assessed using the following parameters: 2017 Plan EPS 2017 Plan TSR Grant Date 16 Dec Dec 2016 Hurdle start date 1 Jul Jul 2016 Hurdle end date 30 Jun Jun 2019 Share price at grant date AUD$12.31 AUD$12.31 Fair value at measurement date (i) AUD $11.42 AUD $8.54 Exercise price AUD $0.00 AUD $0.00 Expected volatility (ii) 24.34% 24.34% Option life 3 years 3 years Expected dividend yield p.a (iii) 2.82% 2.82% Risk free rate p.a (iv) 1.95% n/a i) To allow for the TSR hurdle, a Monte Carlo simulation was used to value the performance rights. To allow for the EPS hurdle, a closed form Black-Scholes model was used to value the performance rights. ii) Expected volatility is based on historical daily share price for the three-year period preceding the grant date. iii) Expected dividend yield is based on historic yield for the three-year period immediately preceding the grant date. iv) Risk free interest rate is based on the three-year Australian Bank Bill Swap Rate at grant date. 102 Computershare Annual Report 2017
103 Deferred Long-Term Incentive Plan The previous long-term incentive plan, known as the DLI Plan, was offered to eligible key management personnel and senior managers in the Group. Performance rights were granted for no consideration and carry no dividend or voting rights. Under the DLI Plan each performance right carries an entitlement to one fully paid ordinary share in Computershare Limited subject to satisfaction of performance hurdles and/or continued employment over a five year performance period. Set out below are summaries of performance rights granted under the plan: Balance at beginning of the year Granted during the year Exercised during the year Lapsed during the year Balance at end of the year Exercisable at end of the year Grant date Approximate exercise date Exercise price 12 Oct 2011 Sep 2016 $ ,000 - (350,000) (350,000) May 2012 Sep 2016 $ ,000 - (100,000) (100,000) Sep 2012 Sep 2017 $ , ,000 - Total 1,850,000 - (450,000) (450,000) 950,000 - No performance rights expired during the period covered by the above table. (c) Employee benefits recognised Performance rights expense 2, Share plan and options expense 14,430 11,593 Aggregate employee entitlement liability (note 22 and 23) 33,081 34, REMUNERATION OF AUDITORS During the year the following fees were paid or payable for services provided by the auditor of the parent entity, its network firms and non-related audit firms: Assurance services Auditing or review of financial statements PricewaterhouseCoopers Australia Network firms of PricewaterhouseCoopers Australia 2,849 2,691 3,774 3,395 Other assurance services PricewaterhouseCoopers Australia Network firms of PricewaterhouseCoopers Australia 1,698 2,139 2,078 2,456 Taxation services Related practices of PricewaterhouseCoopers Australia Remuneration received, or due and receivable, by auditors other than the auditor of the parent entity and its affiliates for: Auditing or review of financial statements
104 DIRECTORS DECLARATION In the directors opinion: (a) the financial statements and notes set out on pages 53 to 103 are in accordance with the Corporations Act 2001, including: (i) complying with Accounting Standards, the Corporations Regulations 2001 and other mandatory professional reporting requirements; and (ii) giving a true and fair view of the consolidated entity s financial position as at 30 June 2017 and of its performance for the financial year ended on that date; and (b) there are reasonable grounds to believe that the company will be able to pay its debts as and when they become due and payable; and (c) at the date of this declaration, there are reasonable grounds to believe that the members of the Closed Group identified in note 31 will be able to meet any obligations or liabilities to which they are, or may become, subject to by virtue of the deed of cross guarantee described in note 33. Note 1 confirms that the financial statements also comply with International Financial Reporting Standards as issued by the International Accounting Standards Board. The directors have been given the declarations by the Chief Executive Officer and Chief Financial Officer required by section 295A of the Corporations Act Signed in accordance with a resolution of the directors. SD Jones Chairman SJ Irving Director 18 September Computershare Annual Report 2017
105 DECLARATION TO THE BOARD OF DIRECTORS The Chief Executive Officer and Chief Financial Officer state that: (a) the financial records of the consolidated entity for the financial year ended 30 June 2017 have been properly maintained in accordance with section 286 of the Corporations Act 2001; and (b) the financial statements, and the notes to the financial statements, of the consolidated entity, for the financial year ended 30 June 2017: (i) (ii) comply with Accounting Standards, the Corporations Regulations 2001 and other mandatory professional reporting requirements; and give a true and fair view of the consolidated entity s financial position as at 30 June 2017 and of their performance for the financial year ended on that date. SJ Irving Chief Executive Officer MB Davis Chief Financial Officer 18 September
106 INDEPENDENT AUDITOR S REPORT Independent auditor s report To the shareholders of Computershare Limited Report on the audit of the financial report Our opinion In our opinion: (a) The accompanying financial report of Computershare Limited (the Company) and its controlled entities (together the Group) is in accordance with the Corporations Act 2001, including: i. giving a true and fair view of the Group's financial position as at 30 June 2017 and of its financial performance for the year then ended ii. complying with Australian Accounting Standards and the Corporations Regulations (b) the financial report and notes also comply with International Financial Reporting Standards as disclosed in Note 1. What we have audited The Group financial report comprises: the consolidated statement of financial position as at 30 June 2017 the consolidated statement of comprehensive income for the year then ended the consolidated statement of changes in equity for the year then ended the consolidated cash flow statement for the year then ended the notes to the consolidated financial statements, which include a summary of significant accounting policies the directors declaration. Basis for opinion We conducted our audit in accordance with Australian Auditing Standards. Our responsibilities under those standards are further described in the Auditor s responsibilities for the audit of the financial report section of our report. We believe that the audit evidence we have obtained is sufficient and appropriate to provide a basis for our opinion. Independence We are independent of the Group in accordance with the auditor independence requirements of the Corporations Act 2001 and the ethical requirements of the Accounting Professional and Ethical Standards Board s APES 110 Code of Ethics for Professional Accountants (the Code) that are relevant to our audit of the financial report in Australia. We have also fulfilled our other ethical responsibilities in accordance with the Code. PricewaterhouseCoopers, ABN Riverside Quay, SOUTHBANK VIC 3006, GPO Box 1331, MELBOURNE VIC 3001 T: , F: , Computershare Annual Report 2017

107 Our audit approach An audit is designed to provide reasonable assurance about whether the financial report is free from material misstatement. Misstatements may arise due to fraud or error. They are considered material if individually or in aggregate, they could reasonably be expected to influence the economic decisions of users taken on the basis of the financial report. We tailored the scope of our audit to ensure that we performed enough work to be able to give an opinion on the financial report as a whole, taking into account the geographic and management structure of the Group, its accounting processes and controls and the industry in which it operates. Materiality For the purpose of our audit we used overall Group materiality of $17 million, which represents approximately 5% of the Group s profit before tax. We applied this threshold, together with qualitative considerations, to determine the scope of our audit and the nature, timing and extent of our audit procedures and to evaluate the effect of misstatements on the financial report as a whole. We chose Group profit before tax, because in our view it is an important financial statement metric commonly used in assessing the performance of the Group. We selected a 5% threshold based on our professional judgement, noting it is within the range of commonly acceptable thresholds. Audit Scope Our audit focused on where the Group made subjective judgements; for example, significant accounting estimates involving assumptions and inherently uncertain future events. The Group operates in more than 20 countries, with the majority of its business based in 4 geographical locations Australia, United States, United Kingdom and Canada. The Group engagement team determined the nature, timing and extent of work that needed to be performed by it and by component auditors operating under instruction. We structured our audit approach as follows: We audited certain entities in Australia, United States, United Kingdom and Canada due to their financial significance to the Group. We performed specified risk focused procedures on certain account balances for other entities in the Group. We carried out further procedures at the Group level, including procedures over consolidation and preparation of the financial statements. 107
2017 ANNUAL GENERAL MEETING
 2017 ANNUAL GENERAL MEETING Delivering sustained earnings growth 14 November 2017 2017 ANNUAL GENERAL MEETING Chairman s address Simon Jones 14 November 2017 FY17: A year of solid growth Final Dividend
Computershare 2017 Annual General Meeting
 Computershare 2017 Annual General Meeting Chairman s speech Simon Jones, Chairman Welcome to the Computershare 2017 Annual General Meeting. My name is Simon Jones and I am your Chair. We have a quorum
COMPUTERSHARE LIMITED (ASX:CPU) FINANCIAL RESULTS FOR THE FULL YEAR ENDED 30 JUNE August 2014
 FINANCIAL RESULTS FOR THE FULL YEAR ENDED 30 JUNE August 2014") COMPUTERSHARE LIMITED (ASX:CPU) FINANCIAL RESULTS FOR THE FULL YEAR ENDED 30 JUNE 2014 13 August 2014 NOTE: All figures (including comparatives) are presented in US Dollars (unless otherwise stated). The
COMPUTERSHARE LIMITED (ASX:CPU) FINANCIAL RESULTS FOR THE FULL YEAR ENDED 30 JUNE 2014 13 August 2014 NOTE: All figures (including comparatives) are presented in US Dollars (unless otherwise stated). The
COMPUTERSHARE LIMITED (ASX:CPU) FINANCIAL RESULTS FOR THE HALF YEAR ENDED 31 DECEMBER February 2015
 FINANCIAL RESULTS FOR THE HALF YEAR ENDED 31 DECEMBER February 2015") COMPUTERSHARE LIMITED (ASX:CPU) FINANCIAL RESULTS FOR THE HALF YEAR ENDED 31 DECEMBER 2014 11 February 2015 NOTE: All figures (including comparatives) are presented in US Dollars unless otherwise stated.
COMPUTERSHARE LIMITED (ASX:CPU) FINANCIAL RESULTS FOR THE HALF YEAR ENDED 31 DECEMBER 2014 11 February 2015 NOTE: All figures (including comparatives) are presented in US Dollars unless otherwise stated.
COMPUTERSHARE LIMITED
 COMPUTERSHARE LIMITED Execution on track for sustained earnings growth 2017 Half Year Results Presentation Stuart Irving Chief Executive Officer and President Mark Davis Chief Financial Officer 15 February
MARKET ANNOUNCEMENT MARKET ANNOUNCEMENT. Date: 5 March Australian Securities Exchange
 MARKET ANNOUNCEMENT Computershare Limited ABN 71 005 485 825 Yarra Falls, 452 Johnston Street Abbotsford Victoria 3067 Australia PO Box 103 Abbotsford Victoria 3067 Australia Telephone 61 3 9415 5000 Facsimile
1H17 Results - CEO and CFO conference call script
 MARKET ANNOUNCEMENT Computershare Limited ABN 71 005 485 825 Yarra Falls, 452 Johnston Street Abbotsford Victoria 3067 Australia PO Box 103 Abbotsford Victoria 3067 Australia Telephone 61 3 9415 5000 Facsimile
Computershare Limited Annual General Meeting
 MARKET ANNOUNCEMENT Computershare Limited ABN 71 005 485 825 Yarra Falls, 452 Johnston Street Abbotsford Victoria 3067 Australia PO Box 103 Abbotsford Victoria 3067 Australia Telephone 61 3 9415 5000 Facsimile
FY2018 Results CEO and CFO conference call script
 FY2018 Results CEO and CFO conference call script Stuart Irving, Chief Executive Officer and President Good morning everyone and welcome to Computershare s 2018 Full Year Results conference call. We appreciate
MARKET ANNOUNCEMENT MARKET ANNOUNCEMENT
 MARKET ANNOUNCEMENT Computershare Limited ABN 71 005 485 825 Yarra Falls, 452 Johnston Street Abbotsford Victoria 3067 Australia PO Box 103 Abbotsford Victoria 3067 Australia Telephone 61 3 9415 5000 Facsimile
2018 ANNUAL GENERAL MEETING
 2018 ANNUAL GENERAL MEETING Executing to plan 14 November 2018 2018 ANNUAL GENERAL MEETING Chairman s address Simon Jones 14 November 2018 Executive summary FY18 solid results, fastest rate of earnings
COMPUTERSHARE LIMITED
 COMPUTERSHARE LIMITED 2016 Half Year Results Presentation Stuart Irving Chief Executive Officer and President Mark Davis Chief Financial Officer 10 February 2016 1H16 overview Simpler, more transparent
Computershare Limited Annual General Meeting
 MARKET ANNOUNCEMENT Computershare Limited ABN 71 005 485 825 Yarra Falls, 452 Johnston Street Abbotsford Victoria 3067 Australia PO Box 103 Abbotsford Victoria 3067 Australia Telephone 61 3 9415 5000 Facsimile
Computershare Limited Half Year Results 2015 Presentation
 V1DIS Computershare Limited Half Year 215 Presentation Stuart Irving Mark Davis 11 February 215 Introduction CEO s Report 2 V1DIS Introduction Stuart Irving PRESIDENT & CHIEF EXECUTIVE OFFICER Summary
COMPUTERSHARE LIMITED
 COMPUTERSHARE LIMITED Solid results performing to plan 2019 Half Year Results Presentation Stuart Irving Chief Executive Officer and President Mark Davis Chief Financial Officer 13 February 2019 1H19 Executive
Interim Results 2004 Presentation. 26 February 2004
 Interim Results 2004 Presentation 26 February 2004 1 Market Overview and Financial Results Tom Honan Chief Financial Officer 2 Summary of Results Net operating profit after tax (excluding outside equity
COMPUTERSHARE LIMITED (ASX:CPU) FINANCIAL RESULTS FOR THE HALF YEAR ENDED 31 DECEMBER February 2015
 FINANCIAL RESULTS FOR THE HALF YEAR ENDED 31 DECEMBER February 2015") COMPUTERSHARE LIMITED (ASX:CPU) FINANCIAL RESULTS FOR THE HALF YEAR ENDED 31 DECEMBER 2014 11 February 2015 NOTE: All figures (including comparatives) are presented in US Dollars unless otherwise stated.
COMPUTERSHARE LIMITED (ASX:CPU) FINANCIAL RESULTS FOR THE HALF YEAR ENDED 31 DECEMBER 2014 11 February 2015 NOTE: All figures (including comparatives) are presented in US Dollars unless otherwise stated.
COMPUTERSHARE LIMITED (ASX:CPU) FINANCIAL RESULTS FOR THE FULL YEAR ENDED 30 JUNE August 2014
 FINANCIAL RESULTS FOR THE FULL YEAR ENDED 30 JUNE August 2014") COMPUTERSHARE LIMITED (ASX:CPU) FINANCIAL RESULTS FOR THE FULL YEAR ENDED 3 JUNE 214 13 August 214 NOTE: All figures (including comparatives) are presented in US Dollars (unless otherwise stated). The
COMPUTERSHARE LIMITED (ASX:CPU) FINANCIAL RESULTS FOR THE FULL YEAR ENDED 3 JUNE 214 13 August 214 NOTE: All figures (including comparatives) are presented in US Dollars (unless otherwise stated). The
Investor Presentation
 Investor Presentation May 2013 48,000 employees 200 offices 70 countries 1 global platform Table of Contents I. Company Description II. Global Growth Strategy III. Financial Overview IV. Appendix 2 Company
31 March 2018 Audited Preliminary Results. 6 June 2018
 31 March 2018 Audited Preliminary Results 6 June 2018 1 Presentation Team Euan Fraser Chief Executive Officer Stuart McNulty UK Chief Executive Officer John Paton Chief Financial Officer Has led Alpha
COMPUTERSHARE LIMITED (ASX:CPU) FINANCIAL RESULTS FOR THE FULL YEAR ENDED 30 JUNE (Comparisons are to the full year ended 30 June 2007)
 FINANCIAL RESULTS FOR THE FULL YEAR ENDED 30 JUNE (Comparisons are to the full year ended 30 June 2007)") COMPUTERSHARE LIMITED (ASX:CPU) FINANCIAL RESULTS FOR THE FULL YEAR ENDED 30 JUNE 2008 (Comparisons are to the full year ended 30 June 2007) 13 August 2008 NOTE: All figures (including comparatives) are
COMPUTERSHARE LIMITED (ASX:CPU) FINANCIAL RESULTS FOR THE FULL YEAR ENDED 30 JUNE 2008 (Comparisons are to the full year ended 30 June 2007) 13 August 2008 NOTE: All figures (including comparatives) are
Computershare Limited Annual General Meeting
 MARKET ANNOUNCEMENT Computershare Limited ABN 71 005 485 825 Yarra Falls, 452 Johnston Street Abbotsford Victoria 3067 Australia PO Box 103 Abbotsford Victoria 3067 Australia Telephone 61 3 9415 5000 Facsimile
ASX Release 27 November 2018
 ASX Release 27 November 2018 2018 ANNUAL GENERAL MEETING CHAIRMAN S SPEECH Introduction Welcome to the Bravura Solutions 2018 AGM. Bravura Solutions has enjoyed another successful year in FY18, with the
For personal use only
 Click to edit Master text styles IDP Education FY16 Results Presentation Twelve months to 30 June 2016 11 February 2016 Important notice and disclaimer Click Disclaimer to edit Master text styles The material
FY2018 Half Year Results Investor Presentation
 FY2018 Half Year Results Investor Presentation February 2018 DISCLAIMER The material in this presentation has been prepared by IMF Bentham Limited (IMF) and is general background information about IMF's
11 November Dear Sir. Results of Annual General Meeting
 11 November 2008 Computershare Limited ABN 71 005 485 825 Yarra Falls, 452 Johnston Street Abbotsford Victoria 3067 Australia PO Box 103 Abbotsford Victoria 3067 Australia Telephone 61 3 9415 5000 Facsimile
2018 FULL YEAR INVESTOR PRESENTATION SILVER CHEF LIMITED
 2018 FULL YEAR INVESTOR PRESENTATION SILVER CHEF LIMITED 1986 2005 2008 2011 2013 2018 Silver Chef established by Non-Executive Chairman Allan English Silver Chef listed on ASX Launched GoGetta in Australia
ASX PRELIMINARY FINAL REPORT. Computershare Limited ABN June 2013
 ASX PRELIMINARY FINAL REPORT Computershare Limited ABN 71 005 485 825 30 June 2013 Lodged with the ASX under Listing Rule 4.3A Contents Results for Announcement to the Market 1 Appendix 4E item 2 Preliminary
ASX Announcement. 16 November AGM Presentations
 ASX Announcement 16 November 2016 AGM Presentations In accordance with the ASX Listing Rules and the Corporations Act 2001, attached are the presentations to be given at today s Annual General Meeting.
For personal use only
 The Manager Company Announcements Office Australian Stock Exchange Exchange Centre 20 Bridge Street SYDNEY NSW 2000 5 May 2016 ELECTRONIC LODGEMENT Dear Sir or Madam, RE: CHAIRMAN AND CEO'S ADDRESS 2016
Dreamscape Networks Limited (ASX: DN8) First Half FY18 Results Presentation 22 February 2018
 First Half FY18 Results Presentation 22 February 2018") Dreamscape Networks Limited (ASX: DN8) First Half FY18 Results Presentation 22 February 2018 1 H1 FY18 overview: a busy 6 months Revenue up 30% to $29.3m Bookings up 17% to $29.9m Adjusted EBITDA down
Dreamscape Networks Limited (ASX: DN8) First Half FY18 Results Presentation 22 February 2018 1 H1 FY18 overview: a busy 6 months Revenue up 30% to $29.3m Bookings up 17% to $29.9m Adjusted EBITDA down
ASX HALF-YEAR REPORT. Computershare Limited ABN December 2014
 ASX HALF-YEAR REPORT Computershare Limited ABN 71 005 485 825 31 December 2014 Lodged with the ASX under Listing Rule 4.2A This information should be read in conjunction with the 30 June 2014 Annual Report.
For personal use only
 MARKET ANNOUNCEMENT For personal use only Computershare Limited ABN 71 005 485 825 Yarra Falls, 452 Johnston Street Abbotsford Victoria 3067 Australia PO Box 103 Abbotsford Victoria 3067 Australia Telephone
Computershare Limited Half Year Results 2008 Presentation
 Computershare Limited Half Year 2008 Presentation Stuart Crosby Tom Honan 13 February 2008 Introduction CEO s Report 2 Introduction Stuart Crosby President & CEO 3 Highlights Introduction Management EPS
XERO LIMITED ANNUAL REPORT 2014
 XERO LIMITED ANNUAL REPORT XERO LIMITED ANNUAL REPORT Chairman and Chief Executive s report 1-2 Management commentary 3-9 Auditors report 10 Financial statements 11-15 Notes to the financial statements
Cover-More Group. UBS Australasia Conference. November 2015
 Cover-More Group UBS Australasia Conference November 2015 Executive summary: FY15 overview Cover-More delivered another year of double digit earnings growth, with offshore business growing substantially.
Annual Results Presentation: May Todd Hunter: Chief Executive Officer Aaron Saunders: Group Chief Financial Officer
 Todd Hunter: Chief Executive Officer Aaron Saunders: Group Chief Financial Officer FY17 FINANCIAL HIGHLIGHTS Continuing To Deliver Growth Operating Revenue $252.4m 48% Record NPBT $24.6m 14% Strong NPAT
Brambles reports results for the half-year ended 31 December 2017
 Brambles Limited ABN 89 118 896 021 Level 10, 123 Pitt Street Sydney NSW 2000 Australia GPO Box 4173 Sydney NSW 2001 Tel +61 2 9256 5222 Fax +61 2 9256 5299 www.brambles.com 19 February 2018 The Manager
Attached is an ASX and Media Release from Brambles Limited on its financial results for the year ended 30 June 2018.
 Brambles Limited ABN 22 000 129 868 Level 10 Angel Place 123 Pitt Street Sydney NSW 2000 Australia GPO Box 4173 Sydney NSW 2001 Tel +61 2 9256 5222 Fax +61 2 9256 5299 www.brambles.com 24 August 2018 The
Financial results for year ended 30 June 2013 INVESTOR PRESENTATION
 Financial results for year ended 30 June 2013 INVESTOR PRESENTATION Tony Klim, Chief Executive Officer Rebecca Lowde, Chief Financial Officer 21 August 2013 Agenda > Corporate overview > Group highlights
Total Transaction Value (TTV) (unaudited) $1,870m Up 9% Revenue and other income $150.5m Up 26% Statutory NPAT $22.1m Up 28%
 (unaudited) $1,870m Up 9% Revenue and other income $150.5m Up 26% Statutory NPAT $22.1m Up 28%") 24 February, 2017 ASX RELEASE Corporate Travel Management reports record 1HFY17 profit, Trading at top end of FY2017 profit guidance, or $97m 1HFY17 Results Highlights: Total Transaction Value (TTV) (unaudited)
24 February, 2017 ASX RELEASE Corporate Travel Management reports record 1HFY17 profit, Trading at top end of FY2017 profit guidance, or $97m 1HFY17 Results Highlights: Total Transaction Value (TTV) (unaudited)
Business Update. USPP Conference Miami. Luis Damasceno Group CFO Michael Williams Group Finance Director & Treasurer January 2019
 Business Update USPP Conference Miami Luis Damasceno Group CFO Michael Williams Group Finance Director & Treasurer 23-25 January 2019 www.alsglobal.com IMPORTANT NOTICE AND DISCLAIMER This presentation
Strategic priorities. Sustainable banking. Inspire and engage our people. A better bank contributing to a better world. Enhance client centricity
 banking business operations Compliance Employee health and safety Workforce diversity and Environmental impact inclusion Clients interests centre stage and sustainable relationships Privacy of clients
Shaping the Future. Morgan Stanley Emerging Companies Conference ASX:NVT. 17 June 2014
 Shaping the Future Morgan Stanley Emerging Companies Conference ASX:NVT 17 June 2014 Disclaimer Important Notice and Disclaimer This document has been prepared by Navitas Limited ABN 69 109 613 309 ("Navitas"
US Mortgage Services. Execution on track for scale and anticipated returns. Nick Oldfield CEO, US Mortgage Services. 27 April 2017
 US Mortgage Services Execution on track for scale and anticipated returns Nick Oldfield CEO, US Mortgage Services 27 April 2017 Executive summary Execution on track for scale and anticipated returns Compelling
HALF YEAR RESULTS PRESENTATION 2018 RESULTS FOR THE SIX MONTHS ENDED 31 MAY 2018
 HALF YEAR RESULTS PRESENTATION 2018 RESULTS FOR THE SIX MONTHS ENDED 31 MAY 2018 2018 Overview Encouraging first half performance with accelerated momentum in Q2 Adjusted operating profit +6% to 20.4m
ASX Announcement FY2017 RESULTS
 9.0 ASX Announcement 28 August, 2017 FY2017 RESULTS Net profit $7.0m Final dividend 2.5c, fully franked Composer contract secured with UK retail brand leader Major institutional bank s transition to Syn~
For personal use only. FY16 Results Presentation
 FY16 Results Presentation PAGE 1 Agenda 1. Highlights 2. FY16 Results Trading performance Balance sheet and cash flow Capital management 3. Business Update Our objectives The JB HI-FI model Store portfolio
ELECTROCOMPONENTS Full-year results for the year ended 31 March 2018
 ELECTROCOMPONENTS Full-year results for the year ended 31 March 2018 24 May 2018 SAFE HARBOUR This presentation contains certain statements, statistics and projections that are or may be forward-looking.
Full year results 30 June 2018.
 CORPORATE TRAVEL MANAGEMENT Full year results 30 June 2018. Presented by: Jamie Pherous, Founder & Managing Director Date: 22 nd August, 2018 PAGE 2 Disclaimer The information in this presentation does
For personal use only
 Financial Results Half Year FY18 Ivan Slavich Chief Executive Officer Energy Action Limited Michael Fahey Chief Operating Officer & Chief Financial Officer Energy Action Limited Half Year FY18 Results
AUB GROUP LTD HALF YEAR RESULTS
 AUB GROUP LTD HALF YEAR RESULTS FOR THE PERIOD ENDED 31 DECEMBER 2017 (1H18) 26 FEBRUARY 2018 Page 1 - AUB Group Ltd 1H18 Results NOTICE SUMMARY INFORMATION This document has been prepared by AUB Group
For professional investors only. Welcome to BMO Global Asset Management
 For professional investors only Welcome to BMO Global Asset Management Welcome In a complex and interconnected world, identifying the right investments can be a daunting task. At BMO Global Asset Management,
FULL YEAR RESULTS PRESENTATION 2017 RESULTS FOR YEAR ENDED 30 NOVEMBER 2017
 FULL YEAR RESULTS PRESENTATION 2017 RESULTS FOR YEAR ENDED 30 NOVEMBER 2017 2017 Overview Encouraging full year performance with strong Q4 and exit rate into 2018 Adjusted profit before tax up 9% to 44.5m
For personal use only
 20 th February 2018 ASX RELEASE Corporate Travel Management Reports Half Year Results On Track to Achieve Top End of FY18 Guidance 1H18 Results Highlights: Total Transaction Value (TTV) (unaudited) $2,258.5m
It is therefore pleasing to report that this evolution of BOQ has continued throughout this financial year.
 1 2 Good morning everyone. I will start with the highlights of the results. The strategy we have been implementing in the past few years has transformed BOQ into a resilient, multi-channel business that
The Food Travel Experts.
 The Food Travel Experts www.foodtravelexperts.com Presentation structure 1. Group highlights Kate Swann 2. Financial review Jonathan Davies 3. Business review Kate Swann 4. Q&A All 2 Group highlights Strong
Class Limited. FY18 Results Presentation. Kevin Bungard, CEO 21 August 2018
 Class Limited FY18 Results Presentation Kevin Bungard, CEO 21 August 2018 Important information This presentation is provided for information purposes only. The information in this presentation is in a
For personal use only. Lovisa Holdings Limited 2019 HALF YEAR
 Lovisa Holdings Limited 2019 HALF YEAR SHANE FALLSCHEER CHRIS LAUDER MANAGING DIRECTOR CHIEF FINANCIAL OFFICER Some of the information contained in this presentation contains forward - looking statements
Investment Capabilities
 Investment Capabilities Global Equities Solutions April 2017 This communication is for investment professionals only and should not be distributed to or relied upon by retail clients. It is only intended
John Menzies plc. Interim Results Presentation 14 August 2018
 John Menzies plc Interim Results Presentation 14 August 2018 Results Overview Highlights Underlying operating profit at 33.9m, up 18% at constant currency Profit progression John Menzies plc H1 underlying
Building strength with the Institutional Bank.
 Building strength with the Institutional Bank. We set ourselves apart by striving to provide our customers with world-class insights. This means we put our focus and energy into deeply understanding a
Presentation for UBS Conference
 MARKET ANNOUNCEMENT Computershare Limited ABN 71 005 485 825 Yarra Falls, 452 Johnston Street Abbotsford Victoria 3067 Australia PO Box 103 Abbotsford Victoria 3067 Australia Telephone 61 3 9415 5000 Facsimile
Financial Year 2016 Results. 17 May 2016
 Financial Year 2016 Results 17 May 2016 Agenda CEO update Financial update Outlook Strategy Update Q&A CEO Update Richard Kimber Chief Executive Officer Delivering on the Accelerate Strategy A 3 year ACCELERATE
Royal Bank of Canada. Annual Report
 Royal Bank of Canada 2010 Annual Report Vision Values Strategic goals Always earning the right to be our clients first choice Excellent service to clients and each other Working together to succeed Personal
Full year results 2017.
 CORPORATE TRAVEL MANAGEMENT Full year results 2017. Presented by: Jamie Pherous, Founder & Managing Director Date: 22 nd August 2017 PAGE 2 Disclaimer. The information in this presentation does not constitute
CHALLENGER LIMITED ANNUAL GENERAL MEETING CEO S ADDRESS 26 NOVEMBER :30AM THE WESLEY CENTRE 220 PITT STREET SYDNEY
 CHALLENGER LIMITED ANNUAL GENERAL MEETING CEO S ADDRESS 26 NOVEMBER 2012 10:30AM THE WESLEY CENTRE 220 PITT STREET SYDNEY Thank you Peter and good morning. It s an honour to be addressing you, for the
May Global Growth Strategy
 May 2012 Global Growth Strategy Jones Lang LaSalle Global Growth Strategy G1 G3 Build our local and regional leasing and capital markets businesses G5 Connections Capture the leading share of global capital
Performance summary FOR THE YEAR ENDED 31 MARCH 2015
 Performance summary FOR THE YEAR ENDED 31 MARCH 2015 Constant currency NZ $000 2015 2014 Variance % Variance % 4 Sales revenue 96,349 96,720-0.4% 0.7% EBITDA 1 12,682 11,286 12.4% 13.4% NPAT 3 5,690 4,708
The Food Travel Experts.
 The Food Travel Experts www.foodtravelexperts.com SSP Group plc Annual Results 2016 29 November 2016 Presentation structure 1. Group highlights Kate Swann 2. Financial review Jonathan Davies 3. Business
Financial results & business update. Quarter and year ended 31 December February 2017
 Financial results & business update Quarter and year ended 31 December 2016 14 February 2017 Disclaimer 3 Any remarks that we may make about future expectations, plans and prospects for the company constitute
Supplemental Information Earnings Call
 Supplemental Information Earnings Call Fourth-Quarter 2015 Market volume & outlook JLL Research Investment volumes remain solid; outlook steady Market Volumes Actual Forecast Capital Markets (1) LC USD
Overview of Heartland New Zealand Limited to 30 June Annual Meeting 1 November 2013 Page 1
 Overview of Heartland New Zealand Limited to 30 June 2014 Annual Meeting 1 November 2013 Page 1 Important Notice This presentation has been prepared by Heartland New Zealand Limited (Heartland) (NZX: HNZ)
2017 Results Presentation.
 2017 Results Presentation www.moelisaustralia.com 20 February 2018 Moelis Australia Overview Moelis Australia is a leading diversified financial services group incorporating Corporate Advisory, Equities
STRATEGY NORGES BANK INVESTMENT MANAGEMENT
 STRATEGY 2017 2019 NORGES BANK INVESTMENT MANAGEMENT Our mission is to safeguard and build financial wealth for future generations. Contents Strategy 2017 2019 We are a large global investor and a long-term
Thank you, Cameron, for the introduction, and good morning. We are pleased to present Axsesstoday s FY18 end of year results, and FY19 guidance.
 1300 586 936 ir@axsesstoday.com.au www.axsesstoday.com.au Level 9, 360 Collins Street Melbourne, Vic 3000, Australia ASX Announcement AXL FY18 Results Conference Call - Transcript Melbourne, 27 August
O P E R A T I O N A L A N D C O S T E F F I C I E N C I E S F O R A C O M P E T I T I V E E D G E
 O P E R A T I O N A L A N D C O S T E F F I C I E N C I E S F O R A C O M P E T I T I V E E D G E I n v e s t m e n t O p e r a t i o n s O u t s o u r c i n g F O C U S O N Y O U R C O R E S T R E N
INVESTOR PRESENTATION
 INVESTOR PRESENTATION December 18, 2018 Mark Harris, Chief Financial Officer Julie Creed, VP, Real Estate & Investor Relations 0 1 SAFE HARBOR STATEMENT Our presentation may contain forward-looking statements.
Actuarial Transformation The Future Actuary
 Actuarial Transformation The Future Actuary Prepared by: Rick Shaw Kaise Stephan Presented to the Actuaries Institute General Insurance Seminar Sydney This paper has been prepared for the Actuaries Institute
Independent, global provider of corporate and fund administration services. Preliminary Results Presentation Year ended 31 December 2015
 Independent, global provider of corporate and fund administration services Preliminary Results Presentation Year ended 31 December 2015 Agenda Key highlights and group overview Dean Godwin Financial review
For professional investors only. Welcome to BMO Global Asset Management
 For professional investors only Welcome to BMO Global Asset Management Welcome In a complex and interconnected world, identifying the right investments can be a daunting task. At BMO Global Asset Management,
2017 FULL YEAR RESULTS
 2017 FULL YEAR RESULTS ESTABLISHING LEADING POSITIONS IN NEW GROWTH SECTORS Malcolm Bundey Managing Director and CEO Richard Betts Chief Financial Officer 16 August 2017 Pact Group Holdings Ltd ABN: 55
LafargeHolcim makes good progress in 2017; Strategy 2022 to drive growth. EPS 11.9% up on prior year excluding impairment and divestments
 Zurich, 07:00, March 2, 2018 LafargeHolcim makes good progress in 2017; Strategy 2022 to drive growth 4.7% growth in Net Sales on like-for-like basis Recurring EBITDA up 6.1% on like-for-like basis EPS
In accordance with the Listing Rules, I enclose a letter to Shareholders, for release to the market.
 16 February 2018 The Manager Market Announcements Office Australian Securities Exchange 4 th Floor, 20 Bridge Street SYDNEY NSW 2000 Office of the Company Secretary Level 41 242 Exhibition Street MELBOURNE
APPENDIX 4D. Data # 3 Limited. Reporting period Half-year ended 31 December 2014 Previous corresponding period Half-year ended 31 December 2013
 APPENDIX 4D Name of entity Data # 3 Limited ABN 31 010 545 267 Reporting period Half-year ended 31 December 2014 Previous corresponding period Half-year ended 31 December 2013 RESULTS FOR ANNOUNCEMENT
2016 FULL YEAR RESULTS. February 28th, 2017
 2016 FULL YEAR RESULTS February 28th, 2017 INTRODUCTORY MATERS Forward-Looking Information This document contains certain forward-looking statements which speak only as of the date on which they are made.
WESCO International John Engel Chairman, President and CEO. William Blair & Company 36 th Annual Growth Stock Conference June 14, 2016
 WESCO International John Engel Chairman, President and CEO William Blair & Company 36 th Annual Growth Stock Conference June 14, 2016 Safe Harbor Statement Note: All statements made herein that are not
For personal use only
 ASX: LVH MARKET RELEASE LiveHire December Quarterly Report, 18 January 2018 Melbourne, Australia Quarter Highlights LiveHire s key performance metric and lead indicator, Talent Community Connections (TCCs),
For personal use only
 The Manager Company Announcements Office Australian Stock Exchange Exchange Centre 20 Bridge Street SYDNEY NSW 2000 9 September 2014 ELECTRONIC LODGEMENT Dear Sir or Madam IRESS CEO Presentation - Goldman
Principal risks and uncertainties
 Principal risks and uncertainties Strategic report Principal risks are a risk or a combination of risks that, given the Group s current position, could seriously affect the performance, future prospects
Turners Automotive Group Annual Meeting of Shareholders. 20 September 2017
 Turners Automotive Group Annual Meeting of Shareholders 20 September 2017 BOARD OF DIRECTORS GRANT BAKER: Non-executive Chairman Appointed September 2009 Represents Business Bakery and other interests:
Full-Year 2016 Results Presentation
 Full-Year 2016 Results Presentation ASX Limited Dominic Stevens Peter Hiom Ramy Aziz 18 August 2016 Financial Results FY16 Revenue $746.3m 6.5% Expenses $170.6m (6.5%) EBITDA $575.7m 6.5% NPAT $426.2m
OM Asset Management Business Review 2016
 OM Asset Business Review 2016 2 Business review Institutional Asset Peter Bain Chief Executive Officer OM Asset (OMAM) We are an institutionally driven, active investment management business delivered
The State of the CIO in 2018
 Chief Information Officer The State of the CIO in 2018 A Three-Year Study of a Rapidly Changing Role The onset of digital disruption and the ensuing shorter business cycles has dramatically changed the
Forward-Looking Statements
 Forward-Looking Statements The following information contains, or may be deemed to contain, forwardlooking statements. By their nature, forward-looking statements involve risks, assumptions and uncertainties
IRESS Half Year Profit Announcement 2018
 IRESS Half Year Profit Announcement 2018 Incorporating APPENDIX 4D For the six months ended 30 June 2018 delivering outcomes today, developing for tomorrow, designing for the future. 0110101 0111011 0110101
FY17 Results. IDP Education FY17 Results Presentation
 FY17 Results IDP Education FY17 Results Presentation 22 August 2017 Important Notice and Disclaimer Disclaimer Non-IFRS Financial Information The material in this presentation has been prepared by IDP
FY18 1 ST HALF RESULTS
 26 FEBRUARY 2018 FY18 1 ST HALF RESULTS Chief Executive Officer : Chief Financial Officer : John Croll James Orlando isentia.com AGENDA Overview of H1 FY18 Results Strategic Focus H1 FY18 Financial Performance
ALTERNATIVE INVESTMENTS
 ALTERNATIVE INVESTMENTS FIERA CAPITAL ALTERNATIVE INVESTMENT SOLUTIONS Fiera Capital combines the flexibility and efficiency of an alternative investment strategies manager with the deep resources of a
Full Year results and outlook
 PRESENTATION TO INVESTORS & ANALYSTS Full Year results and outlook David Banfield, Group CEO 29 August 2018 for 12 months 1 July 2017 30 June 2018 Strong international performance drives double digit earnings