The Great Muddle Through. Wayne McGauley Head of Retail, IML March 2014
|
|
|
- Dina May
- 5 years ago
- Views:
Transcription


1 The Great Muddle Through Wayne McGauley Head of Retail, IML March
2 Agenda Intro to IML The Great Muddle Through Investment strategy Portfolio focus for clients Summary 2
3 Agenda Intro to IML The Great Muddle Through Investment strategy Portfolio focus for clients Summary 3
4 About IML Boutique manager established in 1998 Circa $5bln FUM retail and institutional clients Disciplined and consistent true to label value style Owned by IML investment staff and Treasury Group (TRG) Large investment team with experienced leadership Market leading performance over 15 years 4
5 Investment Philosophy: focus on quality We seek to buy and own: Companies with a competitive advantage, with recurring earnings, run by capable management, that can grow,...at a reasonable price. 5
6 Retail Investor Needs Capital preservation Reasonable capital growth Income focused 6
7 IML - Meeting the expectations of a Value Manager Feature Reasonable Capital growth over time Resilience in falling markets Low volatility Consistent income Tax effective IML 7 This is what differentiates IML
8 The IML experience capture the ups, avoid the downs 6.00% Total Return 1yr to Jan % Benchmark % 2.00% IML % 0.00% -2.00% -4.00% -6.00% Feb Mar Apr May Jun Jul Aug Sep Oct Nov Dec Jan Portfolio Benchmark 8 IML Australian Share Fund monthly returns v benchmark, As at 31 January 2014


9 Annualized Return IML 15 year history - looking to smooth volatility 12 Risk/Return Since IM L Inception 07/1998 to 01/2014 Investors Mutual WS Australian Share Fund Value Investing S&P/ASX Total Return Annualized Standard Deviation Source: Factset as at 31st January 2014
10 Agenda Intro to IML The Great Muddle Through Investment strategy Portfolio focus for clients Summary 10
11 Australian household debt deleveraging ongoing 11 Source: Factset as at 31 Dec 2013

12 Australian mortgage equity withdrawal. 12
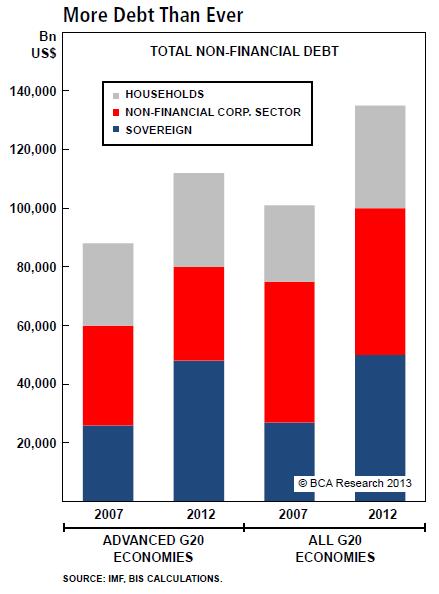
13 Deleveraging ongoing 13

14 QE = monetary madness 14
15 Australian 10 year bond yields...driving equities 12.0% Australia 10Y Treasury Yield 12.0% 11.0% 11.0% 10.0% 10.0% 9.0% 9.0% 8.0% 8.0% 7.0% 7.0% 6.0% 6.0% 5.0% 5.0% 4.0% % 3.0% 3.0% 2.0% '94 '95 '96 '97 '98 '99 '00 '01 '02 '03 '04 '05 '06 '07 '08 '09 '10 '11 '12 '13 2.0% 15 Source: RBC, January 2014
16 Looking Back Over History S&P/ASX Return Composition Calendar Year Dividend Return % 4% 4% 4% 4% 4% 4% 5% 5% 4% 5% 5% 4% EPS change 6% 2% 4% 19% 22% 14% 9% -15% -12% 18% 4% -10% 6% PE change 0% -14% 5% 3% -4% 4% 3% -31% 49% -17% -18% 27% 9% Total Return 10% -9% 15% 28% 23% 24% 16% -38% 37% 2% -11% 20% 20% Source: Factset 16
17 PE s expanded. Source: Factset 17

18 EPS revisions 18
19 The Great Muddle Through US: slow and patchy recovery Europe: ongoing sovereign debt issues China: slowing to more sustainable levels Record low interest rates and large quantitative easing Lacklustre global economic outlook set to continue, supported by Central Bank liquidity measures 19
20 Global GDP. Source: OECD, CBA 20
21 OECD Composite Leading Indicators Source: OECD, CBA 21
22 Australian Economy Economy patchy Consumer and business confidence volatile Employment and wage growth soft Interest rates set to stay low Federal Government fiscal consoliation 22
23 Misery Index 23 Source: CBA as at 31 May 2013

24 Employment - participation rate falling 24
25 Real savings rate relatively low 25

26 Unit Labor Cost in Manufacturing 26
27 Mining Investment 8% Mining investment, % of GDP 7% 6% 5% 4% 3% 2% 1% 0% Sources: ABS; Butlin (1964, 1985); RBA; Withers, Endres and Perry (1985). As at 30 June

28 Australia s demographics working age of population declining 28

29 Australia s demographics number of retirees growing 29
30 Overall Outlook Economic growth to a muddle through Volatility remains a risk Earnings growth for most companies will be much harder to achieve Bonds markets driving equity markets Very selective environment! 30
31 Agenda Intro to IML The Great Muddle Through Investment strategy Portfolio focus for clients Summary 31
32 The dilemma of the Australian Market Sector distribution- ASX 300 Index 44% 39% Financials Materials Other 17% Source :IML as at 30 December,
33 IML Australian Share Fund Sector positioning 39% Investors Mutual Australian Share Fund Sector Weights As at 31st January % 29% 24% 19% 14% 9% 4% -1% IMAS Sector Weights % ASX300 Sector Weights % 33
34 Banks PEs historic v today 17 Major bank forward PEs Oct-98 Oct-99 Oct-00 Oct-01 Oct-02 Oct-03 Oct-04 Oct-05 Oct-06 Oct-07 Oct-08 Oct-09 Oct-10 Oct-11 Oct-12 CBA NAB WBC ANZ 34 Source: Factset as at 30 September 2013
35 Banks - Credit Growth 35 Source : Shaw
36 Banks - interest payments to disposable income 36 Source: RBA & company data as at 30 September 2013
37 Basis Points Banks - bad debts 400 Bad Debt Charges ANZ CBA NAB WBC 37 Source: RBA & company data as at 30 September 2013
38 Resources - focus on quality only Supply side not supportive stockpiles and pipelines Demand side lackluster Competitive suppliers Cost pressures 38
39 Resources - China s fixed asset investment declining YTD fixed asset investment 39
40 Resources - Chinese house prices Source: Factset as at 31 st December

41 41 Resources - the supply side
42 The case against cyclicals Earnings expectations too high downgrades appearing De-leveraging ongoing Inflation in essential household items Fiscal consolidation Employment and wage growth not evident First home buyers not active 42
43 IML s focus - very stock specific environment: Acquisitions Restructuring New products Contracted growth Market share gains 43
44 Agenda Intro to IML The Great Muddle Through Investment strategy Portfolio focus for clients Summary 44
45 Portfolio focus for clients Active management large and uneven dispersion of EPS High Quality portfolio (low beta) Recurring income and growing overtime Portfolio that is resilient 45
46 Annualized Return IML 15 year history - looking to smooth volatility 12 Risk/Return Since IM L Inception 07/1998 to 01/2014 Investors Mutual WS Australian Share Fund Value Investing S&P/ASX Total Return Annualized Standard Deviation Source: Factset as at 31st January 2014


47 Risk - there is a meaningful difference 47 Source: Morningstar as at 31st
48 Australia... highest yielding stock market Country Dividend Yield (Next 12m) Australia 4.7% United States 2.2% United Kingdom 4.0% Germany 3.0% Japan 1.7% China 1.4% 48 Source: Factset as at Feb 2014
49 Income - the least volatile component of investment returns 70% S&P/ASX years to Sep 2013 Return Composition 100% Risk Composition 94% 60% 58% 80% 50% 40% 42% 60% 30% 20% 40% 10% 20% 6% 0% Capital Return Income Return 0% Capital Standard Deviation Income Standard Deviation 49 Source: IRESS
50 Income - important & consistent component to returns IML Australian Share Fund Income Growth Total Return 1 year +4.34% +8.60% % 3 years p.a % +7.57% % 5 years p.a % +9.46% % Since Inception p.a. (June 1998) +5.00% +6.62% % As at 31 January %+ of income is underpinned by franked dividend yield ^% Performance per annum. *Fund returns are calculated net of management fees, and assuming all distributions are re-invested. Investors should be aware that past performance is not indicative of future performance. Returns can be volatile, reflecting rises and falls in the value of underlying investments. **The benchmark for this Fund is the S&P/ASX 300 Accumulation Index. 50
51 Why income/yield is so important Income/Yield - Key Attributes Downside protection a sustainable yield provides a floor to share prices Lower levels of volatility high yielding stocks are inherently less volatile Immune to investor sentiment income is the reliable component of the total return Reliable Cashflow predictable and growing in nature 51

52 First Rule of Investing % +11% % +43% % +100% 50 52
53 Outperforming in Down Markets - IML Reliable and Repeatable 100% 90% 87% 80% 70% 70% 60% 50% 54% 55% 47% 52% 40% 30% 20% 10% 0% IML Australian Share Value A Value B Value C Value D Style Neutral 53 Source: Morningstar Monthly returns since inception as at 31st December 2013


54 Downside protection critical for clients 54 Source: Morningstar Direct as at 31st December 2013

55 Downside protection - this is why it is critical 55
56 Agenda Intro to IML The Great Muddle Through Investment strategy Portfolio focus for cleints Summary 56
57 Conclusion Low return, volatile environment Invest in quality companies that are not heavily reliant on the economic cycle Many cyclical stocks remain unattractive Value present in many quality industrial stocks that pay consistent dividends 57
58 IML Australia Share Fund: Performance ASX300 IML Outperformance 6 months +5.01% +5.60% +0.59% 1 year % % +2.36% 3 years p.a % % +5.38% 5 years p.a % % +1.89% Since Inception p.a. (circa 15 years - June 1998) +8.85% % +2.77% As at 31 January
59 IML - Meeting the expectations of a Value Manager Feature Reasonable Capital growth over time Resilience in falling markets Low volatility Consistent income Tax effective IML 59 This is what differentiates IML

60 While the information contained in this presentation has been prepared with all reasonable care, Investors Mutual Limited accepts no responsibility or liability for any errors or omissions or misstatements however caused. This is general financial product advice only and is not intended to constitute a securities recommendation. This information does not account for your investment objectives, particular needs or financial situation. Statements of opinion are those of IML unless otherwise attributed. Except where specifically attributed to another source, all figures are based on IML research and analysis. Investors should be aware that past performance is not indicative of future performance. Returns can be volatile, reflecting rises and falls in the value of underlying investments. Potential investors should seek independent advice as to the suitability of the Fund to their investment needs. The fact that shares in a particular company may have been mentioned should not be interpreted as a recommendation to either buy, sell or hold that stock. Any commentary about specific securities is within the context of the investment strategy for the given portfolio. Investors Mutual Limited is the issuer of the Investors Mutual Australian Share Fund, Investors Mutual Industrial Share Fund, Investors Mutual Future Leaders Fund, Investors Mutual Australian Smaller Companies Fund, Investors Mutual Small Cap Fund and Investors Mutual Equity Income Fund. Applications can only be made on the form in the current Product Disclosure Statements dated 2nd September 2013 or through IDPS products that include these Funds. The Product Disclosure Statements can be obtained by contacting Investors Mutual or at Potential investors should consider the Product Disclosure Statements before deciding whether to invest, or continue to invest in the Funds. The prospective P/E ratios and earnings forecasts referred to in this presentation constitute estimates which have been calculated by IML's investment team based on IML's investment processes and research Morningstar, Inc. All rights reserved. Neither Morningstar, nor its affiliates nor their content providers guarantee the data or content contained herein to be accurate, complete or timely nor will they have any liability for its use or distribution. To the extent that any of this information constitutes advice, it is general advice and has been prepared by Morningstar Australasia Pty Ltd ABN: , AFSL: and/or Morningstar Research Limited (subsidiaries of Morningstar, Inc.) without reference to your objectives, financial situation or needs. You should consider the advice in light of these matters and, if applicable, the relevant Product Disclosure Statement (in respect of Australian products) or Investment Statement (in respect of New Zealand products) before making any decision to invest. Neither Morningstar, nor Morningstar s subsidiaries, nor Morningstar s employees can provide you with personalised financial advice. To obtain advice tailored to your particular circumstances, please contact a professional financial adviser. Please refer to our Financial Services Guide (FSG) for more information 60
QV Equities Limited. Investor Update - 1 -
 QV Equities Limited Investor Update - 1 - March roadshow 2015 QV Equities Limited Intro & Business Update Managed by Investors Mutual Focused on Ex-20 stocks Listed 22 August 2014 Quality and experienced
> Macro Investment Outlook
 > Macro Investment Outlook Dr Shane Oliver Head of Investment Strategy and Chief Economist October 214 The challenge for investors how to find better yield and returns as bank deposit rates stay low 9
Australian Banks. Money Talks vertically challenged AUSTRALIA. Inside. Majors average short positions and banks index
 Jun- Dec- Jun- Dec- Jun- Dec- Jun-1 Dec-1 Jun-11 Dec-11 Jun-1 Dec-1 Jun-1 Dec-1 Jun-1 Dec-1 Jun- Dec- AUSTRALIA Repricing generally follows an election s Nov Aug 1 Sep 1 1-1 Source: RBA, Macquarie Research,
Spheria Australian Smaller Companies Fund
 29-Jun-18 $ 2.7686 $ 2.7603 $ 2.7520 28-Jun-18 $ 2.7764 $ 2.7681 $ 2.7598 27-Jun-18 $ 2.7804 $ 2.7721 $ 2.7638 26-Jun-18 $ 2.7857 $ 2.7774 $ 2.7690 25-Jun-18 $ 2.7931 $ 2.7848 $ 2.7764 22-Jun-18 $ 2.7771
12/02/2018. Industry Evolution Insights SMSF Investments. Investing towards Where are we today? Anton Tagliaferro
 Industry Evolution Insights SMSF Investments Investing towards 2021 Anton Tagliaferro Investment Director, Investors Mutual Where are we today? Global economies growing steadily Record low interest rates
Tuesday, 28 October About the CBG Fund 1. CBG Australian Equities Fund Performance
 MARKET ANNOUNCEMENT CBG Fund September 2014 Quarterly Report Tuesday, 28 October 2014 The September 2014 Quarterly Report from CBG Asset Management Limited (CBG) on the performance of its CBG Australian
As at 31 December 2016, Bentley had ~$3.97 million (29.3% of its net assets) invested in the CBG Fund (30 September 2016: ~$3.99 million (27.7%)).
 invested in the CBG Fund (30 September 2016: ~$3.99 million (27.7%)).") Tuesday, 31 January 2017 MARKET ANNOUNCEMENT CBG Fund December 2016 Quarterly Report The December 2016 Quarterly Report from CBG Asset Management Limited (CBG) on the performance of its CBG Australian
Tuesday, 31 January 2017 MARKET ANNOUNCEMENT CBG Fund December 2016 Quarterly Report The December 2016 Quarterly Report from CBG Asset Management Limited (CBG) on the performance of its CBG Australian
Protected Loan Taxation Guide
 Protected Loan Taxation Guide An Explanatory Note The taxation implications of your Protected Loan (PL) can depend on a number of factors. In order to assist you in identifying the implications of your
1H17 RESULTS INVESTOR UPDATE
 For personal use only 9 March 2017 1H17 RESULTS INVESTOR UPDATE SIX MONTHS TO 31 DECEMBER 2016 IMPORTANT NOTE This information was prepared by Perpetual Investment Management Limited (PIML) ABN 18 000
Auscap Asset Management The Long and the Short of it
 Auscap Asset Management The Long and the Short of it Asset Strategy Forum October/November 2017 Auscap Asset Management Limited ACN 158 929 143 AFSL 428014 ARSN 615 542 213 Who are we? 2 Auscap Long Short
Global Equities. Q&A roadshow #QAroadshow2016. Gavin Marriott Product Manager
 Global Equities Q&A roadshow 216 #QAroadshow216 Gavin Marriott Product Manager June 216 For professional advisers only. This material is not suitable for retail clients Questions What will drive global
Returns To: 1mth 3mths 6mths 1yr 2yrs 3yrs Inception 30 June 2016 (%) (%) (%) (%) (% p.a.) (% p.a.) (% p.a.) T (08) T (08)
 (%) (%) (%) (% p.a.) (% p.a.) (% p.a.) T (08) T (08)") Friday, 29 July 2016 MARKET ANNOUNCEMENT CBG Fund June 2016 Quarterly Report The June 2016 Quarterly Report from CBG Asset Management Limited (CBG) on the performance of its CBG Australian Equities Fund
Friday, 29 July 2016 MARKET ANNOUNCEMENT CBG Fund June 2016 Quarterly Report The June 2016 Quarterly Report from CBG Asset Management Limited (CBG) on the performance of its CBG Australian Equities Fund
Term Deposits. Figure 1. Term Deposit Spread over Relevant BBSW: November v October. 3 Month Spread. Background on Term Deposits
 Deposit Review November 2016 Term Deposits Jack Pobjoy Credit Analyst (+61) 3 9670 8615 jack.pobjoy@bondadviser.com.au While global interest rate volatility continues, term deposit (TD s) rate spreads
DAC Wealth Builder: $10,000 Growth from Inception
 DAC Wealth Builder: $10,000 Growth from Inception $13,500 $13,416 $13,000 $12,500 $12,000 $11,500 $11,000 $10,500 $10,000 12/2014 03/2015 06/2015 09/2015 12/2015 03/2016 06/2016 09/2016 12/2016 03/2017
DAC Short Term: $10,000 Growth from Inception
 DAC Short Term: $10,000 Growth from Inception $10,900 $10,909 $10,800 $10,700 $10,600 $10,500 $10,400 $10,300 $10,200 $10,100 $10,000 11/2014 02/2015 05/2015 08/2015 11/2015 02/2016 05/2016 08/2016 11/2016
DAC Wealth Protector: $10,000 Growth from Inception
 DAC Wealth Protector: $10,000 Growth from Inception $11,600 $11,661 $11,400 $11,200 $11,000 $10,800 $10,600 $10,400 $10,200 $10,000 12/2014 03/2015 06/2015 09/2015 12/2015 03/2016 06/2016 09/2016 12/2016
Credit Suisse First Boston Asian Investment Conference
 Credit Suisse First Boston Asian Investment Conference Philip Chronican Chief Financial Officer Westpac Banking Corporation 25 March 2004 Westpac at a glance Established 1817 Top 100 bank globally 1 Core
Lincoln Australian Income Fund ARSN
 Lincoln Australian Income Fund ARSN 155 355 301 Maximise your income potential PRODUCT BROCHURE Investment Manager: Lincoln Indicators Pty Ltd ABN 23 006 715 573, AFSL 237740 Responsible Entity: Equity
Australian Banks. Funding markets open for now
 AUSTRALIA Weekly performance 4% 2% % -2% -4% -6% -8% -1% Source: IRESS, August 212 Rolling monthly performance 8% 6% 4% 2% % -2% -4% -6% Source: IRESS, August 212 Rolling yearly performance % 15% 5% -5%
IOOF Presentation. Peter Mahoney. April 2012
 IOOF Presentation Peter Mahoney April 2012 1 contents 1. philosophy & process 2. investment team 3. performance 4. stock insight & strategy 5. summary 6. appendices 2 1 proven investment approach the way
2009 Half Year Results. Analyst and shareholder briefing 18 February 2009
 2009 Half Year Results Analyst and shareholder briefing 18 February 2009 Agenda Group highlights David Deverall Financial results Roger Burrows Outlook David Deverall 1 Agenda Group highlights David Deverall
National Australia Bank
 AUSTRALIA NAB AU Price (at 08:23, 03 Jul 2012 GMT) Outperform A$23.68 Volatility index Low 12-month target A$ 27.66 12-month TSR % +24.9 Valuation A$ - DCF (WACC 12.6%, beta 1.0, ERP 5.0%, RFR 5.8%) 25.14
National Australia Bank
 AUSTRALIA NAB AU Price (at 06:10, 27 Jul 2015 GMT) Outperform A$33.91 Valuation A$ - DCF (WACC 9.6%, beta 1.0, ERP 5.0%, RFR 5.8%) 37.74 12-month target A$ 39.39 12-month TSR % +22.1 Volatility Index Low
PIMCO: The New Neutral
 PIMCO: The New Neutral Philanthropy Summit 2015 Investing in the New Neutral world April 2015 PIMCO Australia Pty Ltd ABN 54 084 280 508 AFS Licence 246862 Level 19, 363 George St. Sydney, NSW 2000 telephone:
QBE Insurance. QBE ANZ performance: LMI vs. Excl. LMI (A$m) Source: Company data, Macquarie Research, April 16. Earnings and target price revision
 Source: Company data, Macquarie Research, April 16. Earnings and target price revision") AUSTRALIA QBE AU Price (at 10:44, 27 Apr 2016 GMT) Neutral A$11.19 Valuation A$ - DCF (WACC 9.3%, beta 1.1, ERP 5.0%, RFR 3.8%) 11.34 12-month target A$ 12.00 12-month TSR % +12.7 Volatility Index Low/Medium
AUSTRALIA QBE AU Price (at 10:44, 27 Apr 2016 GMT) Neutral A$11.19 Valuation A$ - DCF (WACC 9.3%, beta 1.1, ERP 5.0%, RFR 3.8%) 11.34 12-month target A$ 12.00 12-month TSR % +12.7 Volatility Index Low/Medium
ASET FlexShares Real Assets Allocation Index Fund
 FlexShares Real Assets Allocation Index Fund ETF.com segment: Equity: Global - Total Market Competing ETFs: QXGG, FVC, DWLV, VT, ACWI Related ETF Channels: Trend-Following, Size and Style, Smart-Beta ETFs,
Suncorp Metway Ltd. John Mulcahy, Chief Executive Officer. UBS Global Financial Services Conference. 12 May 2008
 Suncorp Metway Ltd John Mulcahy, Chief Executive Officer UBS Global Financial Services Conference 12 May 2008 Agenda Overview of Suncorp Key numbers Key challenges Summary Suncorp at a glance Group total
QV Equities Investor Update
 QV Equities Investor Update February 2016-1 - About IML Boutique manager established in 1998 Disciplined focus on quality and value Over $5bn FUM - retail and institutional clients Large investment team
Australian Shares 99.7% Other 0.3%
 Fund Overview About the Fund The Fund aims to provide returns from companies that are expected to deliver a growing dividend stream over time. The Fund is expected to generate tax effective returns by:
The Compelling Case for Value
 The Compelling Case for Value July 2, 2018 SOLELY FOR THE USE OF INSTITUTIONAL INVESTORS AND PROFESSIONAL ADVISORS 0 Jan-75 Jan-77 Jan-79 Jan-81 Jan-83 Jan-85 Jan-87 Jan-89 Jan-91 Jan-93 Jan-95 Jan-97
WHY EQUITIES NOW? THINGS TO CONSIDER
 October 4, 2017 WHY EQUITIES NOW? THINGS TO CONSIDER Scott Krauthamer, CFA, CAIA Managing Director Equities, AB MJ Zayac Director, Institutional Retirement Specialist, AB There is no guarantee that any
Investment Update. Agenda 7/11/2013. The University of Melbourne TOPIC PRESENTER. David Schneider Head of Research & Quant Methods
 Investment Update The University of Melbourne 7 November, 2013 Agenda TOPIC Investment Update (45 min) UniSuper Investment Options & Advice (10 min) PRESENTER David Schneider Head of Research & Quant Methods
Why Totus Capital? Diversified fundamental stock picking portfolio with emphasis on positive attribution from long book and short book
 November 2018 Why Totus Capital? Totus Capital is an independent investment firm managing funds on behalf of high net worth individuals, unitholders of platforms and institutions Totus Capital manages
Lonsec Diversified Direct Model Portfolios
 Lonsec Diversified Direct Model Portfolios ISSUE DATE 06-11-2014 Performance review Model portfolios RETURNS TO 30 SEP 2014 SECURE DEFENSIVE CONSERVATIVE BALANCED GROWTH HIGH GROWTH 3 MONTHS (%) MODEL
WAM CAPITAL LTD (WAM) ABN INVESTMENT UPDATE & NET TANGIBLE ASSETS REPORT JUNE 2013
 ABN INVESTMENT UPDATE & NET TANGIBLE ASSETS REPORT JUNE 2013") WAM CAPITAL LTD (WAM) ABN 34 086 587 395 INVESTMENT UPDATE & NET TANGIBLE ASSETS REPORT JUNE 2013 Exercise your options by 31 July 2013 to receive the proposed 6.0c per share fully franked final dividend
WAM CAPITAL LTD (WAM) ABN 34 086 587 395 INVESTMENT UPDATE & NET TANGIBLE ASSETS REPORT JUNE 2013 Exercise your options by 31 July 2013 to receive the proposed 6.0c per share fully franked final dividend
11,000 10,500 10,000 9,500. 9,000 Dec Source: Bloomberg. Cash
 Commentary Growth of $, INCOME REINVESTED PORTFOLIO COMMENTARY The big news in markets for the month of June centred around the UK's decision to leave the European Union, this generally impacted equity
Fund Size $ mil. November Fund Performance Summary Gross of Fees
 November 2017 Fund Performance Summary Gross of Fees Australian Equity - Scientific BlackRock Australian Alpha Tilts Fund BGL0006AU 425.9 1.21 6.15 8.36 12.27 7.14 16.91 13.16 9.88 11.44 10.55 31-Oct-97
For personal use only
 AMYF SERIES QUARTERLY UPDATE 1 OCTOBER 2016 31 DECEMBER 2016 SUMMARY AUSTRALIAN MASTERS YIELD FUND SERIES (AMYF SERIES) HIGHLIGHTS AMYF Series announced the following quarterly dividends and capital returns:
New S&P/ASX indices measure the returns from franking credits
 In 2000, franking credits became fully refundable to low tax Australian investors, helping to supplement the returns for superannuation funds and tax exempt investors. For tax exempt investors such as
Asset allocation achieving the right mix
 Asset allocation achieving the right mix Learning outcomes The objective of the presentation is to help develop your understanding of: The benefits and drawbacks of a range of asset allocation styles The
NAB Market Select Fund (Australian Equities Class)
") NAB Market Select Fund (Australian Equities Class) Fund Information Investment Manager Currency Issue Date Maturity Date Reference Asset Citigroup First Investment Management Australia Limited AUD 1.0994
NAB Market Select Fund (Australian Equities Class) Fund Information Investment Manager Currency Issue Date Maturity Date Reference Asset Citigroup First Investment Management Australia Limited AUD 1.0994
For personal use only
 Dec-14 Jan-15 Feb-15 Mar-15 Apr-15 May-15 Jun-15 Jul-15 Aug-15 Sep-15 Oct-15 Nov-15 Dec-15 Jan-16 Feb-16 Mar-16 Apr-16 May-16 Jun-16 Jul-16 Aug-16 Sep-16 Oct-16 Nov-16 Dec-16 Jan-17 Feb-17 Mar-17 Apr-17
Term Deposit Review: January 2019
 Fixed Income Markets Credit Research 7 February 2019 Term Deposit Review: January 2019 Simon Fletcher Head of Research (+61) 3 9670 8615 simon.fletcher@bondadviser.com.au Charlie Callan Credit Analyst
Weekly Market Commentary
 LPL FINANCIAL RESEARCH Weekly Market Commentary November 18, 2014 Emerging Markets Opportunity Still Emerging Burt White Chief Investment Officer LPL Financial Jeffrey Buchbinder, CFA Market Strategist
2001 Investor Roadshow Presentation 12 November
 2001 Investor Roadshow Presentation 12 November 2001 www.commbank.com.au Disclaimer The material that follows is a presentation of general background information about the Bank s activities current at
Presentation of Half Year Results 13 February
 Presentation of Half Year Results 13 February 2001 www.commbank.com.au Disclaimer The material that follows is a presentation of general background information about the Bank s activities current at the
INVESTOR UPDATE OCTOBER 2016
 INVESTOR UPDATE OCTOBER 2016 IMPORTANT NOTE This information was prepared by Perpetual Investment Management Limited (PIML) ABN 18 000 866 535, AFSL 234426 and issued by Perpetual Trustee Company Limited
BROAD COMMODITY INDEX
 BROAD COMMODITY INDEX COMMENTARY + STRATEGY FACTS JUNE 2017 80.00% CUMULATIVE PERFORMANCE ( SINCE JANUARY 2007* ) 60.00% 40.00% 20.00% 0.00% -20.00% -40.00% -60.00% -80.00% ABCERI S&P GSCI ER BCOMM ER
Earnings and target price revision. Price catalyst. Catalyst: 1H14 result in February Action and recommendation
 AUSTRALIA CBA AU Price (at 06:10, 10 Sep 2013 GMT) Neutral A$73.63 Valuation A$ - DCF (WACC 10.3%, beta 1.0, ERP 5.0%, RFR 5.5%) 50.40 12-month target A$ 66.15 12-month TSR % -5.0 Volatility Index Low
BROAD COMMODITY INDEX
 BROAD COMMODITY INDEX COMMENTARY + STRATEGY FACTS APRIL 2017 80.00% CUMULATIVE PERFORMANCE ( SINCE JANUARY 2007* ) 60.00% 40.00% 20.00% 0.00% -20.00% -40.00% -60.00% -80.00% ABCERI S&P GSCI ER BCOMM ER
FY18 Results Presentation 31 July Thomas Beregi, CEO Michael Eadie, CFO
 FY18 Results Presentation 31 July 2018 Thomas Beregi, CEO Michael Eadie, CFO Leadership in the credit impaired consumer segment ANALYTICS & DISCIPLINE OPERATIONAL EXCELLENCE SUSTAINABILITY & COMPLIANCE
2015 Market Review & Outlook. January 29, 2015
 2015 Market Review & Outlook January 29, 2015 Economic Outlook Jason O. Jackman, CFA President & Chief Investment Officer Percentage Interest Rates Unexpectedly Decline 4.5 10-Year Government Yield 4 3.5
For personal use only
 VGI Partners Global Investments Limited (ASX Code: VG1) 1H 2019 Investor Briefing 5 February 2019 Disclaimer VGI Partners Pty Limited (ABN 33 129 188 450) (VGI Partners) is the holder of an Australian
BROAD COMMODITY INDEX
 BROAD COMMODITY INDEX COMMENTARY + STRATEGY FACTS AUGUST 2018 120.00% 100.00% 80.00% 60.00% 40.00% 20.00% 0.00% -20.00% -40.00% -60.00% CUMULATIVE PERFORMANCE ( SINCE JANUARY 2007* ) -80.00% ABCERI S&P
Lincoln Australian Income Fund ARSN
 Lincoln Australian Income Fund ARSN 155 355 301 Maximise your income potential PRODUCT BROCHURE Investment Manager: Lincoln Indicators Pty Ltd (Lincoln) ABN 23 006 715 573, as Corporate Authorised Representative
Term Deposits. Deposit Review May Background on Term Deposits
 Deposit Review May Term Deposits Simon Fletcher Head of Research (+61) 3 9670 8615 simon.fletcher@bondadviser.com.au Ethan Xing Quantitative Analyst (+61) 3 9670 8615 ethan.xing@bondadviser.com.au With
BT Personal Portfolio Service: Superannuation and Pension. Annual Report for the year ended 30 June 2009
 BT Personal Portfolio Service: Superannuation and Pension Annual Report for the year ended 30 June 2009 Contents 3 Recent developments and changes 6 Investment overview 9 Understanding the risks of investing
A Global Economic and Market Outlook
 A Global Economic and Market Outlook Presented by Dr Chris Caton December 2008 US Housing starts and Permits 2.3 (Millions) Permits Starts 2.1 1.9 1.7 1.5 1.3 1.1 0.9 0.7 96 97 98 99 00 01 02 03 04 05
Russia: Macro Outlook for 2019
 October 2018 Russia: Macro Outlook for 2019 Natalia Orlova Head of Alfa Bank Macro Insights +7 495 795 36 77 norlova@alfabank.ru Egypt Saudi Arabia Brazil S. Africa UAE Iraq China Japan US Mexico UK Russia
ANZ Bank. What execution risk? Earnings and target price revision. Price catalyst. Catalyst: 1Q17 Trading update, February 2017.
 AUSTRALIA ANZ AU Price (at 09:15, 18 Jan 2017 GMT) Neutral A$30.11 Valuation A$ 30.69- - Sum of Parts/GG 31.47 12-month target A$ 31.00 12-month TSR % +8.4 Volatility Index Low/Medium GICS sector Banks
GWX SPDR S&P International Small Cap ETF
 SPDR S&P International Small Cap ETF ETF.com segment: Equity: Developed Markets Ex-U.S. - Small Cap Competing ETFs: SCZ, SCHC, HSCZ, FNDC, DLS Related ETF Channels: Equity, Vanilla, Size and Style, Broad-based,
MLC Horizon 1 - Bond Portfolio
 Horizon 1 - Bond Portfolio Annual Review September 2009 Investment Management Level 12, 105 153 Miller Street North Sydney NSW 2060 review for the year ending 30 September 2009 Page 1 of 11 Important information
Investors Have Allocated Less to Value
 Investors Have Allocated Less to Value by Over $1 Trillion Compared to 10 Years Ago Equity Asset Under Management $20,000,000,000,000 $18,000,000,000,000 $16,000,000,000,000 $14,000,000,000,000 $12,000,000,000,000
AUSTRALIAN SECURITISATION FORUM Australian Market Review and Outlook. Ken Hanton May 2018
 AUSTRALIAN SECURITISATION FORUM Australian Market Review and Outlook Ken Hanton May 2018 Australian Bond Market Source: Australian Fixed Income Securities in a Low Rate World. Christopher Kent, RBA, Assistant
2007 Full Year Results. Analyst and institutional shareholder briefing 22 August 2007
 2007 Full Year Results Analyst and institutional shareholder briefing 22 August 2007 Agenda Group highlights David Deverall Financial results John Nesbitt Outlook David Deverall 1 Agenda Group highlights
ROBO ROBO Global Robotics and Automation Index ETF
 Global Robotics and Automation Index ETF ETF.com segment: Equity: Global - Total Market Competing ETFs: LEGR, ROBT, FANZ, VT, ACWI Related ETF Channels: Equal-Weighted, Smart-Beta ETFs, Total Market, Broad-based,
Aurora Funds Management Generating Income from Equities
 Aurora Funds Management Generating Income from Equities Australian ASX Presentation February 2009 Issuer & Responsibile Entity Disclaimer Neither the information or presentation is intended to be an offer
Déjà vu FY17-18 Investments update How we fared in FY18 and why we think it will be different in FY19
 Déjà vu FY17-18 Investments update How we fared in FY18 and why we think it will be different in FY19 Webinar for accredited financial advisers Date: 24 July 2018 Presenter: Stephen Fallet, Manager, Investment
Perpetual Trustees Australia Limited ( Perpetual )
") Perpetual Trustees Australia Limited ( Perpetual ) Perpetual: Key messages Australian financial services company participating actively in wealth management and securitisation The Australian wealth management
Perpetual Trustees Australia Limited ( Perpetual ) Perpetual: Key messages Australian financial services company participating actively in wealth management and securitisation The Australian wealth management
Dividend Growth as a Defensive Equity Strategy August 24, 2012
 Dividend Growth as a Defensive Equity Strategy August 24, 2012 Introduction: The Case for Defensive Equity Strategies Most institutional investment committees meet three to four times per year to review
Investment and Insurance Services Division 19 October 2004
 Investor Half Day Investment and Insurance Services Division 19 October 2004 Disclaimer The material that follows is a presentation of general background information about the Bank s activities current
Schroder Asian Income Monthly Fund Update
 Schroder Asian Income Monthly Fund Update Fund Performance As at 30 September 2014, SGD 1 month Year to date Since launch* Schroder Asian Income Fund (Bid-Bid) (%) -1.7 8.4 35.2 Schroder Asian Income Fund
Australian Banks. Insolent Insolvencies
 AUSTRALIA Insolvencies Stubborn # of Insolvencies 17, 16, 15, 14, 13, 12, 11, 1, Source: ASIC, Macquarie Research, Dec 212 WA/VIC insolvencies deterioration 2.4 2.2 Jan- 2 1.8 1.6 1.4 1.2 1 Source: ASIC,
MONTHLY MARKET SNAPSHOT
 Your fund. Your wealth. Your future. MONTHLY MARKET SNAPSHOT Commentary on the global economy and performance of the financial markets MONTHLY MARKET SNAPSHOT (KEY INSIGHTS) DECEMBER 2017 The 2017 calendar
Global Low Volatility Equity
 Marketing Communication Global Low Volatility Equity Investment objectives Outperform with significantly less variability Reduce volatility Maintain standard deviation of 3% to 4% less than index Outperform
TAMING THE BEAST. How to harness emerging markets and sleep at night October RARE Infrastructure Limited ABN AFSL
 TAMING THE BEAST How to harness emerging markets and sleep at night October 2017 RARE Infrastructure Limited ABN 84 119 339 052 AFSL 307727 Contents 1 RARE and the Emerging Markets Opportunity 2 Pure Exposure
Lonsec Diversified Direct Model Portfolios
 Lonsec Diversified Direct Model Portfolios ISSUE DATE 30-04-2015 Performance review Model portfolios RETURNS TO 31 MAR 2015 SECURE DEFENSIVE CONSERVATIVE BALANCED GROWTH HIGH GROWTH 3 MONTHS (%) MODEL
DMX Capital Partners Limited August 2017 Shareholder Update
 DMX Capital Partners August 2017 Shareholder Update An investment company managed by: DMX Asset Management ACN 169 381 908 AFSL 459 120 Level 4, 92 Pitt Street, Sydney, NSW 2000 PO Box 916, Milsons Point,
VGI Partners Global Investments Limited (ASX Code: VG1) 2018 Investor Briefing
 2018 Investor Briefing") VGI Partners Global Investments Limited (ASX Code: VG1) 2018 Investor Briefing Disclaimer VGI Partners Pty Limited (ABN 33 129 188 450) (VGI Partners) is the holder of an Australian Financial Services
VGI Partners Global Investments Limited (ASX Code: VG1) 2018 Investor Briefing Disclaimer VGI Partners Pty Limited (ABN 33 129 188 450) (VGI Partners) is the holder of an Australian Financial Services
Platinum Asset Management
 AUSTRALIA PTM AU Price (at 06:10, 11 Jul 2016 GMT) Neutral A$5.52 Valuation A$ - DCF (WACC 9.3%, beta 1.2, ERP 5.0%, RFR 3.3%) 5.19 12-month target A$ 5.36 12-month TSR % +2.6 Volatility Index Low/Medium
Economic & Market Update. Matthew Drennan Executive General Manager, Zurich Investments
 Economic & Market Update Matthew Drennan Executive General Manager, Zurich Investments General Advice Warning This information in this presentation is general in nature and does not take into account the
HEWU ishares Currency Hedged MSCI United Kingdom ETF
 ishares Currency Hedged MSCI United Kingdom ETF ETF.com segment: Equity: U.K. - Total Market Competing ETFs: EWU, DBUK, QGBR, FKU, FLGB Related ETF Channels: U.K., Total Market, Currency Hedged, Single
Perpetual Trustees Australia Limited ( Perpetual ) November Presentation to Macquarie Equities
 November Presentation to Macquarie Equities") Perpetual Trustees Australia Limited ( Perpetual ) November 2004 Presentation to Macquarie Equities Content Business and Financial Overview Business operations Wealth Management Business operations Corporate
Perpetual Trustees Australia Limited ( Perpetual ) November 2004 Presentation to Macquarie Equities Content Business and Financial Overview Business operations Wealth Management Business operations Corporate
Bank of Queensland. Half-Year Results 29 February FY08 Half-Year Results
 Bank of Queensland Half-Year Results 29 February 2008 1 Agenda Result highlights Financial result in detail BOQ Portfolio Strategy and outlook David Liddy Managing Director & CEO Ram Kangatharan Group
Japan s equity performance has been surprisingly good over the medium/long-term
 Currency Hedged (ASX: HJPN) While most Australians know Japan as an important trading partner, it probably remains under-appreciated as an investment opportunity by many investors. After all, Japan is
NIB Holdings. Lowest in 4 years still enough A$3.72 AUSTRALIA. Event. Impact. Earnings and target price revision. Price catalyst
 AUSTRALIA NHF AU Price (at 09:52, 02 Mar 2016 GMT) Outperform A$3.72 Valuation A$ 3.85 - DCF (WACC 8.5%, beta 1.0, ERP 5.0%, RFR 3.8%, TGR 2.5%) 12-month target A$ 4.00 12-month TSR % +11.7 Volatility
Fixed income. income investors. Michael Korber Head of Credit. August 2009
 Fixed income Old lessons re-learned for income investors Michael Korber Head of Credit August 2009 Role of fixed income in a portfolio The role of fixed income in a portfolio a fixed or floating rate of
Summit Strategies Group 8182 Maryland Avenue, 6th Floor St. Louis, Missouri
 Summit Strategies Group 8182 Maryland Avenue, 6th Floor St. Louis, Missouri 63105 314.727.7211 Quarterly Review Global Equity Market Update GLOBAL EQUITY MARKETS CALENDAR YEAR RETURNS 2002 2003 2004 2005
Product Assessment. APN A-REIT Fund. Report data as at 30 Apr 2012 Rating issued on 28 May APIR Code. Asset Class.
 Report data as at 30 Apr 2012 Rating issued on 28 May 2012 Product Assessment APN A-REIT Fund Highly Recommended Recommended Approved Not Approved Redeem VIEWPOINT & RATING The APN A-REIT Fund (the Fund)
Why is Totus Capital different?
 Contents Why is Totus Capital different? 4 Totus Capital 5 Portfolio Manager profile 6 Performance 7 Portfolio snapshot 8 Organisational structure 9 The Totus Capital edge 10 Totus Alpha Fund 12 Fund summary
Coca-Cola Amatil. Not as fizzy as it looks A$8.78 AUSTRALIA. Event. Impact. Earnings and target price revision. Price catalyst
 AUSTRALIA CCL AU Price (at CLOSE#, 21 Aug 2015) Underperform A$8.78 Valuation A$ 8.47 - DCF (WACC 8.7%, beta 1.0, ERP 5.0%, RFR 3.8%, TGR 1.9%) 12-month target A$ 8.99 12-month TSR % +7.3 Volatility Index
BT Financial Group. David Clarke CEO BT Financial Group. 29 July 2004
 BT Financial Group David Clarke CEO BT Financial Group 29 July 2004 BTFG significant progress over the year A single, modern, wealth management company Well balanced, diversified business mix Performing
URTH ishares MSCI World ETF
 ishares MSCI World ETF ETF.com segment: Equity: Developed Markets - Total Market Competing ETFs: BOTZ, SNSR, RFDI, FDRR, JPGE Related ETF Channels: Total Market, Broad-based, Vanilla, Equity, Size and
Summit Strategies Group 8182 Maryland Avenue, 6th Floor St. Louis, Missouri
 Summit Strategies Group 8182 Maryland Avenue, 6th Floor St. Louis, Missouri 63105 314.727.7211 Quarterly Review Global Equity Market Update GLOBAL EQUITY MARKETS CALENDAR YEAR RETURNS 2002 2003 2004 2005
Kingsgate Consolidated
 AUSTRALIA KCN AU Price (at 6:11, 31 Jul 215 GMT) Underperform A$.67 Valuation A$ - DCF (WACC 12.%, beta 1.6, ERP 5.%, RFR 3.8%).3 12-month target A$.3 12-month TSR % -54.9 Volatility Index Very High GICS
Monetary Policy Update
 Economics & Markets Research Monetary Policy Update 8 October 2008 ANZ Macro and Interest Rate Research Warren Hogan Head of Australian Economics and Interest Rate Research +61 2 9227 1562 warren.hogan@anz.com
QUARTERLY FUNDS REVIEW Q2 2017
 QUARTERLY FUNDS REVIEW Q2 2017 IMPORTANT NOTE AMP Capital Funds Management Limited (ABN 15 159 557 721, AFSL 426455) and ipac asset management limited (ABN 22 003 257 225, AFSL 234655) are the issuers
Eastern Point Trust Company Basic Plan Portfolio
 Eastern Point Trust Company Basic Plan Portfolio January 2001 - August 2018 (Single Computation) 400 350 300 250 200 150 100 50 Dec 2000 Dec 2003 Dec 2005 Dec 2007 Dec 2009 Dec 2011 Dec 2013 Dec 2015 Aug
GROWTH IN ASEAN SHOWS RESILIENCE UNDER GLOBAL LIQUIDITY INFUSION
 May-1 Nov-1 May-1 Nov-1 THIS QUARTER IN ASIA Asian Business Cycle Indicators (ABCIs), Vol.11 April July 213 Source: OECD Development Centre GROWTH IN ASEAN SHOWS RESILIENCE UNDER GLOBAL LIQUIDITY INFUSION
HAHA CSOP China CSI 300 A-H Dynamic ETF
 CSOP China CSI 3 A-H Dynamic ETF ETF.com segment: Equity: China - Total Market Competing ETFs: MCHI, GXC, ASHR, KBA, PEK Related ETF Channels: Smart-Beta ETFs, China, Total Market, Single Country, Asia-Pacific,