POWERED BY SUNLIGHT 2016 ANNUAL REPORT
|
|
|
- Amber Parker
- 5 years ago
- Views:
Transcription


1 POWERED BY SUNLIGHT 2016 ANNUAL REPORT

2
3 CONTENTS CHIEF EXECUTIVE OFFICER S MESSAGE 1 MANAGEMENT S DISCUSSION AND ANALYSIS 5 MANAGEMENT S RESPONSIBILITY FOR THE CONSOLIDATED FINANCIAL STATEMENTS 29 INDEPENDENT AUDITOR S REPORT 30 CONSOLIDATED STATEMENTS OF FINANCIAL POSITION 31 CONSOLIDATED STATEMENTS OF INCOME (LOSS) AND COMPREHENSIVE INCOME (LOSS) 32 CONSOLIDATED STATEMENTS OF CHANGES IN EQUITY (DEFICIENCY) 33 CONSOLIDATED STATEMENTS OF CASH FLOWS 34 NOTES TO CONSOLIDATED FINANCIAL STATEMENTS 35

4

5 VIC NEUFELD Chief Executive Officer Message A SUCCESSFUL TRANSITION YEAR IN REVIEW It has been said that a successful company is based on 10% strategy and 90% execution. This past year, I am most proud of Aphria s strategic direction and vision as stated when our journey as Canada s 13th Licensed Producer began in late 2014, and even more proud of the Aphria team in terms of our unwavering commitment to execution. We stated that our market approach will be methodical and sustainable, with patient growth as measured in grams sold and average selling price reflective of our market leadership positioning. Our greenhouse growing strengths will be leveraging our low cost producer status. Our strong balance sheet will support both opex and capex requirements. On all fronts, our actual reported metrics have been realized. To be a best-in-class organization, a company needs to have a firm commitment to its core values. There needs to a proper balance between investing in people and capital and marketing initiatives that are serving both current and long term objectives. In fiscal 2016, the Aphria growth story has managed to meet and surpass these objectives. We have added solid leadership in critical areas that supports our entrepreneurial speed and spirit. Successful financing secured in December 2015 is further evidence that the Aphria story resonates with the investing community. Our positive earnings and cash flow from operations in both our third and fourth quarters is industry-leading. While many competitors continue to struggle with cash burn rates that are concerning, Aphria has delivered strong and sustainable results to our shareholders. With gross margins ranging from 70% to 75%, we are well poised to continue the growth of operating free cash flow. Looking ahead, and based on solid building blocks already in place, our recently approved Part 2 expansion ($10.0m with funding from current cash position), we will have capacity of 100,000 feet of greenhouse growing space and 25,000 feet of infrastructure, which in turn will support an estimated annual production of over 6,000 kgs of dried Cannabis. Construction of this added capacity is well underway, with a construction completion date expected by early November. Once approved by Health Canada, our oil distribution license will add significant revenue base serving patients demanding oil extracts. Patient on boarding remains strong. Having successfully secured significant land and existing greenhouse capacity in June 2016, which allows Aphria to have a fully built out campus of approximately 1,000,000 feet of growing and processing, we will be capable of growing in excess of 60,000 kilos of dried cannabis. This will serve both the dried bud for medical and recreational use as well as a significant opportunity in oil distribution. Furthermore, given our fixed cost structures, this future added capacity will continue to grind down our growing cost structures. The continuation of the Aphria success story has a few governmental influences that will be communicated over the next few months. First, the government s August 24th response to the Allard injunction, and secondly, the November 2016 recommendations regarding recreational use. Regardless of the path that these 2 game-changing announcements take, I can assure you that Aphria is well positioned to re-engineer, if necessary, certain strategies to remain an industry leader. Our proven strengths and sustainable operational metrics provides the confidence I have in Aphria. 1
 August 2015 October 2015 November 2015")
 Amended licence for wholesale shipments & Bought deal - $11.")
6 MILESTONES REACHED Licence to produce cannabis oil Cash flow break-even reached (12 months) August 2015 October 2015 November 2015 December 2015 Part expansion finished call HC (22,000 sq. ft.) Amended licence for wholesale shipments & Bought deal - $11.5 million raised ($1.30)


7 HC inspection of Part expansion & CannWay acquisition CF Greenhouse acquisition announced January 2016 February 2016 March 2016 May 2016 Licence to produce in Part expansion received, YTD cash flow break-even reached & Profitability attained Cannabis oil ready call to HC

8 4
9 MANAGEMENT S DISCUSSION & ANALYSIS This management discussion and analysis ( MD&A ) of the financial condition and results of operations of Aphria Inc., (the Company or Aphria ), is for the three and twelve months ended May 31, It is supplemental to, and should be read in conjunction with the Company s audited consolidated financial statements and the accompanying notes for year ended May 31, 2016, as well as the financial statements and MD&A for the year ended May 31, The Company s financial statements are prepared in accordance with International Financial Reporting Standards ( IFRS ). All amounts presented herein are stated in Canadian dollars, unless otherwise indicated. This MD&A has been prepared by reference to the MD&A disclosure requirements established under National Instrument Continuous Disclosure Obligations ( NI ) of the Canadian Securities Administrators. Additional information regarding Aphria Inc. is available on our website at or through the SEDAR website at In this MD&A, reference is made to cash costs to produce per gram, all-in cost of goods sold per gram, adjusted gross profit, adjusted gross margin, EBITDA, cash break-even and EBITDA percentage, which are not measures of financial performance under IFRS. The Company calculates each as follows: Cash costs to produce per gram is equal to cost of sales less the non-cash increase (plus the non-cash decrease) in the fair value ( FV ) of biological assets, if any, amortization and packaging costs divided by grams sold in the quarter. Management believes this measure provides useful information as it removes non-cash and post production expenses tied to our growing costs and provides a benchmark of the Company against its competitors. All-in cost of goods sold per gram is equal to cost of sales less the non-cash increase (plus the non-cash decrease) in the FV of biological assets, if any, divided by grams sold in the quarter. Management believes this measure provides useful information as a benchmark of the Company against its competitors. Adjusted gross profit is equal to gross profit less the non-cash increase (plus the non-cash decrease) in the FV of biological assets, if any. Management believes this measure provides useful information as it removes fair value metrics tied to increasing stock levels (decreasing stock levels) required by IFRS. Adjusted gross margin is adjusted gross profit divided by sales. Management believes this measure provides useful information as it represents the gross profit based on the Company s cost to produce inventory sold and removes fair value metrics tied to increasing stock levels (decreasing stock levels) required by IFRS. EBITDA is net income(loss), plus (minus) income tax expense (recovery), plus (minus) finance expense(income), plus amortization, plus share-based compensation, plus (minus) non-cash FV adjustments related to biological assets, plus amortization of non-capital assets, plus bad debts, plus (minus) loss(gain) on sale of capital assets and certain one-time non-operating items, as determined by management. Management believes this measure provides useful information as it is a commonly used measure in the capital markets and as it is a close proxy for repeatable cash generated by operations. Cash break-even is the year-to-date EBITDA of the Company. Management believes this measure provides useful information as it includes all EBITDA for the year-to-date. EBITDA percentage is equal to EBITDA divided by revenue. Management believes this measure provides useful information as it is a commonly used measure in the capital markets. These measures are not necessarily comparable to similarly titled measures used by other companies. All amounts in this MD&A are expressed in Canadian dollars and where otherwise indicated. This MD&A is prepared as of July 7,
 and was continued in Ontario on December 1, 2014. On December 2, 2014, Black Sparrow, a Capital Pool Company, completed its qualifying transaction with Pure Natures Wellness Inc.")
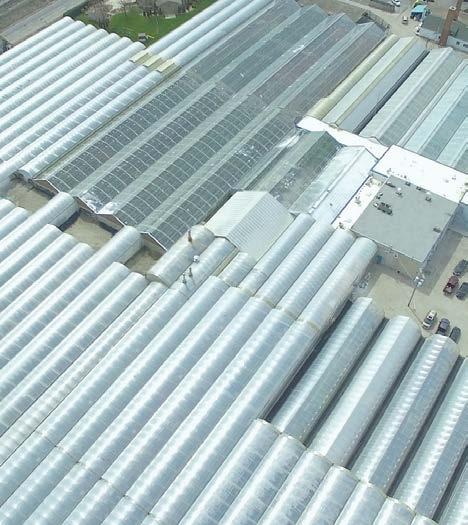
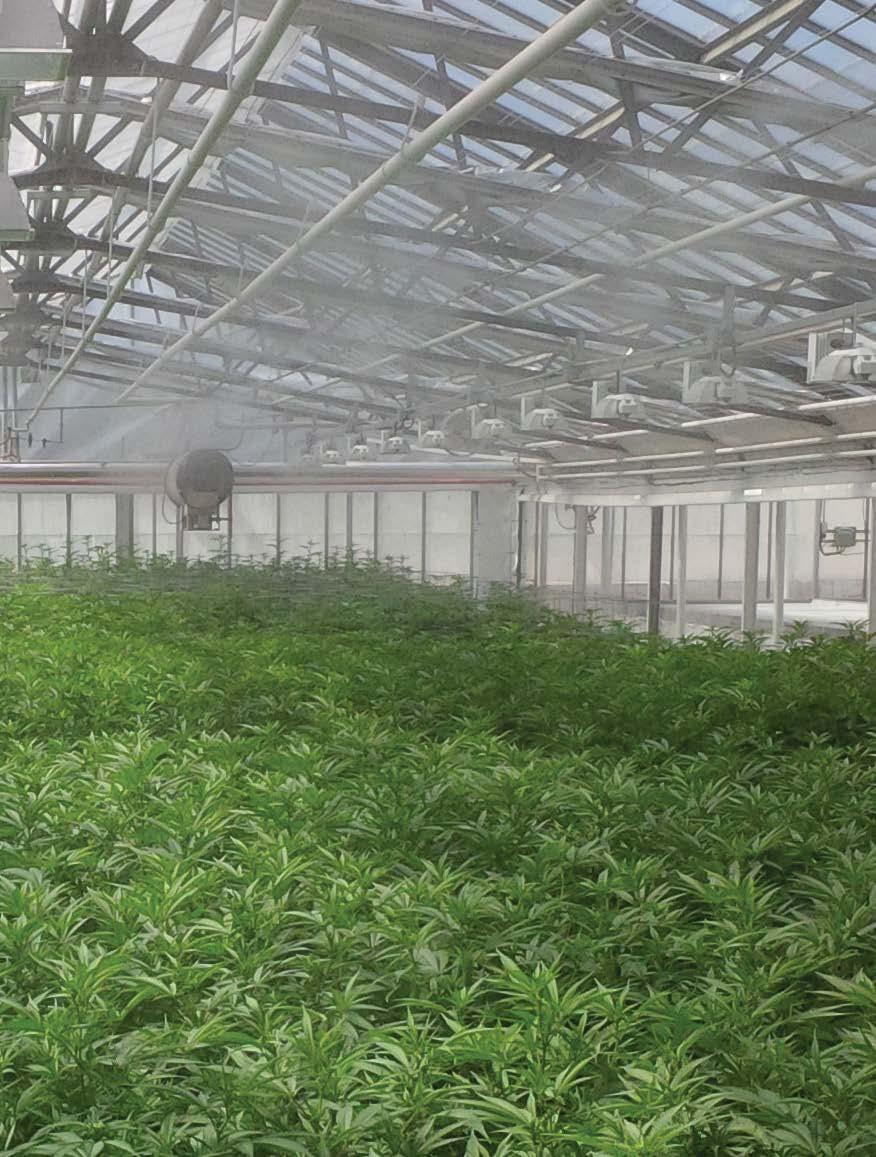
10 COMPANY OVERVIEW Aphria Inc. was incorporated under the Business Corporations Act (Alberta) on June 22, 2011 as Black Sparrow Capital Corp. ( Black Sparrow ) and was continued in Ontario on December 1, On December 2, 2014, Black Sparrow, a Capital Pool Company, completed its qualifying transaction with Pure Natures Wellness Inc. d/b/a Aphria ( PNW ). For further information on this transaction, please refer to the management information circular dated October 28, The Company s common shares are listed under the symbol APH on the TSX Venture Exchange ( TSX-V ) and are listed under symbol APHQF on the US OTCQB exchange. PNW, a wholly-owned subsidiary of the Company, is licenced to produce and sell medical marijuana under the provisions of the Marihuana for Medical Purposes Regulations ( MMPR ). PNW received its licence to produce and sell medical marijuana on November 26, PNW s operations are based in Leamington, Ontario. The Leamington greenhouse facility provides Aphria with the opportunity to be a scalable low cost producer of medical marijuana. The Company is focused on producing and selling medical marijuana through a two-pronged growth strategy, including both retail sales and wholesale channels. Retail sales are primarily sold through Aphria s online store as well as telephone orders. Wholesale shipments are sold to other MMPR Licenced Producers. INVESTOR HIGHLIGHTS Q Q Patient registrations 4,675 4,000 Revenue $ 2,776,316 $ 2,679,898 Kilograms sold Cash cost / gram $ 1.15 $ 1.67 All-in cost of goods sold / gram $ 2.08 $ 2.22 Adjusted gross margin 74.5% 73.4% Cash and cash equivalents on hand $ 16,472,664 $ 12,053,547 Working capital $ 20,626,394 $ 15,868,075 Investment in capital assets (1) $ 434,600 $ 1,175,007 (1) Following the end of the year the Company closed the purchase of land and greenhouses, for a cost of $6.1 million, at the company s current operations site. Retail & wholesale platforms No crop failures since inception Strong capital base with dilutive warrant attributes that average $1.51 Strong executive team o 40+ years of Pharma experience o 35+ years of greenhouse growing experience 6
11 ANNUAL HIGHLIGHTS Aphria reports positive earnings before tax for two consecutive quarters The Company reported positive earnings before tax for both the third and fourth quarter including net income both with and without IFRS fair value adjustments. The earnings before tax for the third and fourth quarters were $3,720 and $102,164 with IFRS fair value adjustments and $88,543 and $64,777 without IFRS fair value adjustments, respectively. Continued improvement as one of the lowest cost producers in the industry Aphria s cost per gram sold has continually improved throughout the year. The Company s all-in cost of sales per gram was $2.08 in the fourth quarter versus $2.22 in the third quarter, a 6% improvement largely related to the allocation of our fixed overhead costs over the added production volumes attributable to our Part I expansion. The Company s cash cost to produce per gram was $1.15 in the fourth quarter versus $1.67 in the third quarter, a 31% improvement, also tied to the allocation of fixed overhead costs over the added production volumes attributable to our Part I expansion. Patient intake Over the course of the year the Company grew its patient base from 1,050 at May 31, 2015 to 4,675 at May 31, Quarter over quarter Aphria has grown its patient base by approximately 700 patients, from 4,000 at the end of the third quarter. This growth is a product of Aphria s long-standing relationships with multiple sales platforms and the recently on-boarded sales platforms at the end of the fiscal year. Closing of bought deal financing On December 11, 2015, the Company announced the closing of its bought deal financing. Under the bought deal, the Company raised net proceeds of $10,400,111, after accounting for underwriting, legal and other costs and issued 8,846,370 units each consisting of one share and one half warrant at an exercise price of $1.75. The Company plans to use the proceeds primarily to fund future expansion. Cannway purchase On January 13, 2016, the Company acquired 100% of the outstanding shares of Cannway Pharmaceuticals Ltd. Cannway specializes in providing support services to veterans and first responders. As a result of the acquisition, the Company expects to further secure ties to Canada s veteran and first responder population allowing it to improve treatment solutions for these men and women. Approval of Part I expansion On February 11, 2016, Aphria received Health Canada approval to begin cultivation in its newly built out expansion. The expansion is comprised of an additional 21,000 square feet of production space, a 900 square foot oil extraction room, as well as 6,100 square feet of fully functional research and development laboratories. The expansion doubles the company s annual production capabilities. Oil extraction Since obtaining approval of its Part expansion, the Company has begun R&D and commercial production of cannabis oil. The Company requested inspection for approval to sell cannabis oil on May 3, 2016 and is currently awaiting inspection. The Company has finished cannabis oil product in inventory which is ready for commercial sale immediately upon obtaining approval. 7


12 FY 2017 OBJECTIVES Board approval of Part II expansion (57,000 sq. ft.) Secure Licence to sell cannabis oil YTD profitability Liberal gov t introduction of recreational regulations Close CF Greenhouse acquisition Allard decision Part II expansion completion Future financing to fund recreational capacity

13 FAIR VALUE MEASUREMENTS Impact of fair value metrics on biological assets and inventory In accordance with IFRS, the Company is required to record its biological assets at fair value. During the growth phase, the cost of each plant is accumulated on a weekly basis. At the time of harvest, the accumulated cost of each plant is based on the number of grams harvested. Upon harvest, the Company increases the cost value to fair value. As at May 31, 2016, the Company s harvested cannabis and cannabis oil, as detailed in Note 9 of its financial statements, is as follows: Harvested cannabis at cost $ 993,744 Harvested cannabis fair value increment 721,153 Cannabis oil at cost 106,838 Cannabis oil fair value increment 58,222 Cannabis products at fair value $ 1,879,957 In an effort to increase transparency, the Company s cannabis product, which consists of dried flower and cannabis oil, is carried at a fair value of $3.75 per gram and $0.63 per ml respectively. For clarification purposes, the Company does not assign any value to sugar leaf or fan leaf. 9
 84,823 Cost of sales excluding IFRS adjustments $ 707,309 $ 711,850 Grams sold 340,422 322,368 All-in cost of sales")
14 COSTS PER GRAM Calculation of all-in cost of sales per gram The Company calculates all-in cost of sales per gram as follows: MAY 31, 2016 THREE MONTHS ENDED FEBRUARY 29, 2016 Cost of sales for the quarter $ 669,922 $ 796,673 Net effect of FV change in biological assets (37,387) 84,823 Cost of sales excluding IFRS adjustments $ 707,309 $ 711,850 Grams sold 340, ,368 All-in cost of sales per gram $ 2.08 $ 2.22 Calculation of cash costs to produce per gram The Company calculates cash costs to produce per gram as follows: Cost of sales excluding IFRS adjustments from above MAY 31, 2016 THREE MONTHS ENDED FEBRUARY 29, 2016 $ 707,309 $ 711,850 Amortization (247,510) (120,646) Packaging costs (66,744) (52,849) Cash costs to produce $ 393,055 $ 538,355 Grams sold 340, ,368 Cash costs to produce per gram $ 1.15 $

 divided by grams sold")

15 PRODUCTION COSTS PER GRAM Other Public LPs Q1-16 Q2-16 Q3-16 Q4-16 Competitor #1 Competitor #2 Competitor #3 Cash All-in All-in costs equal to cost of sales (excluding any fair value of biological assets adjustments) divided by grams sold in quarter. Cash costs equal to cost of sales less amortization reported in cost of sales, all divided by grams sold in quarter. Competitor info based on SEDAR filed financial results for reporting periods in March, April or May 2016.
16 INDUSTRY TRENDS AND RISKS The Company s overall performance and results of operations are subject to a number of risks and uncertainties. Reliance on the Licence Aphria s ability to grow, store and sell medical marijuana in Canada is dependent on maintaining its licence with Health Canada. Failure to comply with the requirements of the licence or any failure to maintain its licence would have a material adverse impact on the business, financial condition and operating results of Aphria. Although Aphria believes it will meet the requirements of the MMPR for extension of the licence, there can be no guarantee that Health Canada will extend or renew the licence or, if it is extended or renewed, that it will be extended or renewed on the same or similar terms. Should Health Canada not extend or renew the licence or should it renew the licence on different terms, the business, financial condition and results of the operation of Aphria would be materially adversely affected. Legislative or Regulatory Reform The commercial medical marijuana industry is a new industry and the Company anticipates that such regulations will be subject to change as the Federal Government monitors Licenced Producers in action. Aphria s operations are subject to a variety of laws, regulations, guidelines and policies relating to the manufacture, import, export, management, packaging/labelling, advertising, sale, transportation, storage and disposal of medical marijuana but also including laws and regulations relating to drugs, controlled substances, health and safety, the conduct of operations and the protection of the environment. While to the knowledge of management Aphria is currently in compliance with all such laws, any changes to such laws, regulations, guidelines and policies due to matters beyond the control of Aphria may cause adverse effects to its operations. Federal Court Case On March 21, 2014, the Federal Court of Canada issued an order affecting the repeal of the Marihuana Medical Access Regulations ( MMAR ) and the application of certain portions of the MMPR which are inconsistent with the MMAR in response to a motion brought by four individuals. The risks to the business represented by this or similar actions are that they might lead to court rulings or legislative changes that allow those with existing licences to possess and/or grow medical marijuana and perhaps others to opt out of the regulated supply system implemented through the MMPR. This could significantly reduce the addressable market for Aphria s products and could materially and adversely affect the business, financial condition and results of operations of Aphria. Limited Operating History Aphria, through its operating subsidiary PNW, which incorporated in 1994, began carrying on business in 2012 and did not generate revenue from the sale of products until late The Company is therefore subject to many of the risks common to early-stage enterprises, including under-capitalization, cash shortages, limitations with respect to personnel, financial, and other resources and lack of revenues. There is no assurance that the Company will be successful in achieving a return on shareholders investment and the likelihood of success must be considered in light of the early stage of operations. History of Losses The Company has incurred losses in recent periods. Aphria may not be able to achieve or maintain profitability and may continue to incur significant losses in the future. In addition, Aphria expects to continue to increase operating expenses as it implements initiatives to continue to grow its business. If Aphria s revenues do not increase to offset these expected increases in costs and operating expenses, Aphria will not be profitable. 12
17 Competition after legalization of recreational use of marijuana On October 19, 2015, the Liberal Party of Canada ( Party ) obtained a majority government in Canada. The Party has committed to the legalization of recreational cannabis in Canada, though no model for this regulatory change has been publicly disclosed or timeline for implementation put forward. This regulatory change may not be implemented at all. The introduction of a recreational model for cannabis production and distribution may impact the medical marijuana market. The impact of this potential development may be negative for the Company and could result in increased levels of competition in its existing medical market and/or the entry of new competitors in the overall cannabis market in which the Company operates. There is potential that the Company will face intense competition from other companies, some of which can be expected to have longer operating histories and more financial resources and manufacturing and marketing experience than the Company. Increased competition by larger and better financed competitors could materially and adversely affect the business, financial condition and results of operations of the Company. The government has only issued to date a limited number of licenses, under the MMPR, to produce and sell medical marijuana. There are, however, several hundred applicants for licenses. The number of licenses granted could have an impact on the operations of the Company. Because of the early stage of the industry in which the Company operates, the Company expects to face additional competition from new entrants. According to Health Canada there are currently 29 Licensed Producers. If the number of users of medical marijuana in Canada increases, the demand for products will increase and the Company expects that competition will become more intense, as current and future competitors begin to offer an increasing number of diversified products. To remain competitive, the Company will require a continued level of investment in research and development, marketing, sales and client support. The Company may not have sufficient resources to maintain research and development, marketing, sales and client support efforts on a competitive basis which could materially and adversely affect the business, financial condition and results of operations of the Company. Risks Inherent in an Agricultural Business Aphria s business involves the growing of medical marijuana, an agricultural product. Such business will be subject to the risks inherent in the agricultural business, such as insects, plant diseases and similar agricultural risks. Although Aphria expects that any such growing will be completed indoors under climate controlled conditions, there can be no assurance that natural elements will not have a material adverse effect on any such future production. Product Liability As a distributor of products designed to be ingested by humans, Aphria faces an inherent risk of exposure to product liability claims, regulatory action and litigation if its products are alleged to have caused significant loss or injury. In addition, the sale of Aphria s products involves the risk of injury to consumers due to tampering by unauthorized third parties or product contamination. Previously unknown adverse reactions resulting from human consumption of Aphria s products alone or in combination with other medications or substances could occur. Aphria may be subject to various product liability claims, including, among others, that Aphria s products caused injury or illness, include inadequate instructions for use or include inadequate warnings concerning possible side effects or interactions with other substances. A product liability claim or regulatory action against Aphria could result in increased costs, could adversely affect Aphria s reputation with its clients and consumers generally, and could have a material adverse effect on our results of operations and financial condition of Aphria. There can be no assurances that Aphria will be able to obtain or maintain product liability insurance on acceptable terms or with adequate coverage against potential liabilities. Such insurance is expensive and may not be available in the future on acceptable terms, or at all. The inability to obtain sufficient insurance coverage on reasonable terms or to otherwise protect against potential product liability claims could prevent or inhibit the commercialization of Aphria s potential products. 13

18 UNIQUE COST SAVINGS THEM APHRIA NEW GREENHOUSE BUILD OR RETROFIT $55 square foot INDOOR GROW $250 - $300 square foot

19 = Aphria s cost - $0.005 / L Competitor s fertilizer cost - $0.22 / L Aphria s costs are 2% of our competitors Aphria s annual electrical costs $5.50 / sq. ft. Indoor grower s annual electrical costs $65.00 / sq. ft. Aphria s costs are 8% of our competitors* 3X hours usage 2X light density 2X Cooling * - Ontario based 15

20 Exchange Restrictions on Business The Toronto Venture Stock Exchange ( TSX-V ) required that, as a condition to listing, the Company deliver an undertaking confirming that, while listed on the TSX-V, the Company will only conduct the business of production, acquisition, sale and distribution of medical marijuana in Canada as permitted under our Licence with Health Canada. This undertaking could have an adverse effect on the Company s ability to export marijuana from Canada and on its ability to expand its business into other areas, including the provision of non-medical marijuana, in the event that the laws were to change to permit such sales and the Company is still listed on the TSX-V and still subject to such undertaking at the time. This undertaking may prevent the Company from expanding into new areas of business while the Company s competitors have no such restrictions. All such restrictions could materially and adversely affect the growth, business, financial condition and results of operations of the Company. Reliance on a Single Facility To date, Aphria s activities and resources have been primarily focused on the premises leased in Leamington, Ontario. Aphria expects to continue the focus on this facility for the foreseeable future. Adverse changes or developments affecting the existing facility could have a material and adverse effect on Aphria s ability to continue producing medical marijuana, its business, financial condition and prospects. Expansion of Facilities The expansion of facilities is subject to Health Canada regulatory approvals. While management does not anticipate significant issues receiving the necessary approvals, the delay or denial of such approvals would have a material adverse impact on the business and may result in Aphria not meeting anticipated or future demand when it arises. Competition from other licenced producers The Company may face increased competition from other licenced producers as the industry matures. Increased competition from larger and/or better-financed competitors could have a material and adverse effect on the business and financial condition of Aphria. In addition, there may be pressure for industry consolidation creating larger companies with increased scope. To date, Health Canada has only issued a limited number of licences under the MMPR. However, there are numerous pending applications for licences. A significant increase in the number of licences granted could have an impact on the operations of the Company. The Company intends to remain competitive through maintaining low cost production and investment in research and development, marketing, sales and client support. 16
21 RESULTS OF OPERATIONS Revenue Revenue for the three months ended May 31, 2016 was $2,776,316 versus $499,890 in same period of the prior year and $2,679,898 for the three months ended February 29, The increase in revenue during the quarter was largely related to: A larger originating patient base; Continued improvement in grams sold per order; and, A refinement in the strains, resulting in an increase in the average selling price per gram. These factors were offset by: Lower re-order rates within certain patient categories; and, Delay in the approval of Part I expansion. Revenue for the twelve months ended May 31, 2016 was $8,433,929 versus $551,430 in the same period in the prior year. The reason for the increase in sales in the twelve-month period is consistent with the reasons for the increase in sales in the three-month period above. Gross profit and gross margin The gross profit for the three months ended May 31, 2016 was $2,106,394, compared to $585,705 in the same period in the prior year and $1,883,225 for the three months ended February 29, The increase in gross profit from the prior year is consistent with the much larger patient base over the prior year combining with our decreasing production costs. The lower gross profit in the prior year was a result of low sales volumes combined with pre-distribution growing costs that did not offset the non-cash increase in the fair value of its biological assets being grown, which produced a gross profit value greater than sales for the three-month period. The gross profit for the twelve months ended May 31, 2016 was $5,977,428, compared to a gross profit of $794,851 in the same period of the prior year. The gross profit in the prior year was a result of low sales volumes combined with pre-distribution growing costs that did not offset the non-cash increase in the fair value of its biological assets being grown, this produced a gross profit value greater than sales for the twelve-month period. With sales volumes in their infancy in the prior year, due to not beginning commercial sale until December 2014, management believes more appropriate comparisons of gross profit and gross margin are between the three months ended May 31, 2016 and the three months ended February 29, The gross profit for the three months ended May 31, 2016 increased $223,169 to $2,106,394, compared to $1,883,225 in the prior quarter, as shown below: MAY 31, 2016 THREE MONTHS ENDED FEBRUARY 29, 2016 Revenue $ 2,776,316 $ 2,679,898 Cost of sales Cost of goods sold 459, ,204 Amortization 247, ,646 Net effect of FV change in biological assets (37,387) 84, , ,673 Gross profit $ 2,106,394 $ 1,883,225 Gross margin 75.9% 70.3% 17
22 Cost of sales currently consist of three main categories: (i) cost of goods sold; (ii) amortization and, (iii) change in biological assets. (i) Cost of goods sold include the direct cost of materials and labour related to the medical marijuana sold. This would include growing, cultivation and harvesting costs, stringent quality assurance and quality control, as well as packaging and labelling. All medical marijuana shipped and sold by Aphria has been grown and produced by the Company. (ii) Amortization includes the amortization of production equipment and leasehold improvements utilized in the production of medical marijuana. (iii) Net effect of FV change in biological assets is part of the Company s cost of sales due to IFRS standards relating to agriculture and biological assets (i.e. living plants or animals). This line item represents the net effect of the non-cash fair value adjustment of biological assets (medical marijuana) produced and sold in the period. The increase in gross margin in the fourth quarter compared to the third quarter was attributable to the increased growing capacity associated with the approval of Part I expansion in late February, which allowed the Company to allocate its fix overhead cost across higher volumes of finished goods in the quarter. In the fourth quarter, the cost of goods sold as a percentage of sales was 16.6% compared to 22.1% in the third quarter. Management believes that the use of non-cash IFRS adjustments in calculating gross profit and gross margin can be confusing due to the large value of non-cash fair value metrics required. Accordingly, management believes the use of an adjusted gross profit and adjusted gross margin provides a better representation of performance by excluding non-cash fair value metrics required by IFRS. Adjusted gross profit and adjusted gross margin are non-gaap financial measures that do not have any standardized meaning prescribed by IFRS and may not be comparable to similar measures presented by other companies. The gross profit has been adjusted from IFRS by removing the non-cash change in biological assets of $37,387. The following is the Company s adjusted gross profit and adjusted gross margin as compared to IFRS for the quarter: THREE MONTHS ENDED THREE MONTHS ENDED MAY 31, 2016 IFRS ADJUSTMENTS MAY 31, 2016 ADJUSTED Revenue $ 2,776,316 $ -- $ 2,776,316 Cost of sales Cost of goods sold 459, ,799 Amortization 247, ,510 Net effect of FV change in biological assets (37,387) 37, ,922 37, ,309 Gross profit $ 2,106,394 37,387 $ 2,069,007 Gross margin 75.9% 74.5% 18
23 The following is the Company s adjusted gross profit and adjusted gross margin, as compared to IFRS, for the year ended May 31, 2016: THREE MONTHS ENDED THREE MONTHS ENDED MAY 31, 2016 IFRS ADJUST- MAY 31, 2016 ADJUSTED Revenue $ 8,433,929 $ -- $ 8,433,929 Cost of sales Cost of goods sold 1,861, ,861,440 Amortization 590, ,415 Net effect of FV change in biological assets 4,646 (4,646) -- 2,456,501 (4,646) 2,451,855 Gross profit $ 5,977,428 $ (4,646) $ 5,982,074 Gross margin 70.9% 70.9% Selling, general and administrative Selling, general and administrative expenses are comprised of general and administrative costs, share-based compensation, selling, marketing and promotion costs, amortization and research and development costs. These costs increased by $987,728 to $2,113,780 from $1,126,052 in the same quarter in the prior year and increased $2,877,631 to $7,068,089 from $4,190,458 for the year. T H R E E M O N T H S E N D E D M AY T W E LV E M O N T H S E N D E D M AY General and administrative $ 783,136 $ 601,710 $ 2,425,123 $ 2,082,417 Share-based compensation 57, , ,314 1,261,589 Selling, marketing and promotion 1,109, ,415 3,598, ,217 Amortization 163,463 22, ,763 56,707 Research and development 2 69, ,408 69,528 $ 2,113,780 $ 1,126,052 $ 7,068,089 $ 4,190,458 General and administrative costs T H R E E M O N T H S E N D E D M AY T W E LV E M O N T H S E N D E D M AY Executive compensation $ 296,208 $ 141,638 $ 752,337 $ 679,692 Consulting fees 5,410 24,613 39, ,893 Office and general 165, , , ,063 Professional fees 95,422 70, , ,488 Salaries and wages 125, , , ,235 Travel and accommodation 83,033 81, , ,136 Rent 12,703 (24,768) 45,064 62,910 $ 783,136 $ 601,710 $ 2,425,123 $ 2,082,417 19
24 The increase in general and administrative costs during the quarter was largely related to an increase in: Executive compensation associated with increases in compensation payable to senior executives, as well as executive bonuses pertaining to fiscal 2016 that were fully expensed in the quarter; Salaries and wages and office and general as a result of increased activity within the business over the same period in the prior year; and, Professional fees, predominantly comprised of legal costs, associated with various negotiations and reviews of current and potential business relationships necessary to sustain growth of the Company. These factors were partially offset by decreases in: Office and general associated with a one-time donation of $100,000 to the Arthritis Society made in the prior period; and, Consulting fees associated with the Company s raising of capital, reverse takeover and licence with Health Canada in the prior period. The increase in general and administrative costs during the year was largely related to the same factors as in the three-month period with two minor differences: The smaller variance in executive compensation is tied to the buy-out of the Company s original chief executive officer in the prior year; and, Increase in travel and accommodations and office and general, both relating to increased activity within the business in the current year. SHARE-BASED COMPENSATION The Company recognized share-based compensation expense of $57,235 for the three months ended May 31, 2016 compared to $104,178 for the three months ended May 31, Share-based compensation was valued using the Black-Scholes valuation model and represents a non-cash expense. The decrease in share-based compensation is consistent with the decrease in stock options issued and vesting during the respective period. For the twelve months ended May 31, 2016, the Company incurred share-based compensation of $462,314 as compared to $1,261,589 in the prior year. 565,000 options were granted during the twelve-month period ended May 31, 2016, as compared to 4,520,000 options in the comparable period of the prior year. SELLING, MARKETING AND PROMOTION COSTS For the three months ended May 31, 2016, the Company incurred selling, marketing and promotion costs of $1,109,944, versus $328,415 in the comparable prior period. These costs related to commissions on sales, the Company s call centre operations, shipping costs, as well as the development of promotional and information materials. The increase is directly correlated with the increase in patient volumes over the comparable period. For the twelve months ended May 31, 2016, the Company incurred selling, marketing and promotion costs of $3,598,481 as opposed to $720,217 in the comparable prior period. The increase in costs in the twelve-month period is consistent with the increase in the three-month period. AMORTIZATION The Company incurred amortization charges of $163,463 for the three months ended May 31, 2016 compared to $22,221 for the same period in the prior year. The increase in amortization charges are a result of the acquisition of the Cannway brand and the associated amortization of the brand, as well as, other capital expenditures made during the current year. The Company incurred amortization charges of $361,763 for the twelve months ended May 31, 2016 compared to $56,707 for the same period in the prior year. The increase for the twelve-month period is consistent with the increase for the three-month period. 20

25 RESEARCH AND DEVELOPMENT Research and development costs of $2 were expensed during the three months ended May 31, 2016 compared to $69,528 in same period last year. The Company s research and development activities were concentrated in the first three quarters as it developed its oil production capabilities. These costs partially relate to researching aspects of the genetics of various cannabis strains, including phenotyping, and testing the growth patterns of cannabis under different conditions. Management anticipates increasing the consistency of finished product through this testing, which would reduce costs of production while still providing customers a high quality product. The balance of the expenses relate to the extraction of cannabis oils and related derivatives for future commercialization. For the twelve months ended May 31, 2016, the Company incurred research and development costs of $220,408 as opposed to $69,528 in the comparable prior period. The increase in costs primarily relates to: Increased phenotyping of genetics; and, Lab testing costs associated with phenotyping and genetic selection. Formulation and method development for oil extraction Non-operating items During the three months ended May 31, 2016, the Company earned non-operating income of $109,550 related to finance income compared to a non-operating income of $58,964 related to finance income in the prior year, the increase is due to the company having more cash on hand. During the twelve months ended May 31, 2016, the Company earned non-operating income of $288,622, consisting of $281,497 of finance income and $7,125 related to a gain on sale of capital assets, compared to a non-operating loss of $3,147,837, related primarily to listing costs in the prior year. Net income The net income for the three months ended May 31, 2016 was $1,302,164 or $0.02 per share as opposed to a net loss in the same period of the prior year of $481,380 or $0.01 per share both basic and fully diluted. The net income for the twelve months ended May 31, 2016 was $397,961 or $0.01 per share compared to a net loss of $6,543,444 or $0.14 in the prior year both basic and fully diluted. 21
26 EBITDA EBITDA is a non-gaap financial measure that does not have any standardized meaning prescribed by IFRS and may not be comparable to similar measures presented by other companies. The Company calculates EBITDA as net income(loss), plus (minus) income tax expense (recovery), plus (minus) finance expense (income), plus amortization, plus share-based compensation, plus (minus) non-cash FV adjustments related to biological assets, plus amortization of non-capital assets, plus bad debts, plus (minus) loss (gain) on sale of capital assets, all as follows: MAY 31, 2016 THREE MONTHS ENDED TWELVE MONTHS ENDED Net income $ 1,302,164 $ 397,961 Income tax recovery (1,200,000) (1,200,000) Finance income (109,550) (281,497) Amortization 410, ,178 Share-based compensation 57, ,314 Non cash FV adjustments in biological assets (37,387) 4,646 Amortization of non-capital assets 58, ,009 Bad debts 38,996 51,402 Gain on sale of capital assets -- (7,125) EBITDA $ 520,685 $ 572,888 LIQUIDITY AND CAPITAL RESOURCES Cash flow used in operations for the twelve months improved by $4,454,883 from cash flow used in operations of $5,443,017 in the twelve-month period of the prior year to $988,134 in the current twelve-month period. The improvement in cash flow used in operations is primarily a result of a: Reduction in net loss for the period; Reduction in other receivables, which primarily related to an HST receivable collected in the period; and, Increase in accounts payable and accrued liabilities, which primarily related to reduced unpaid capital expenditures at the end of the period. These factors were partially offset by: An increase in accounts receivable. Cash resources / working capital requirements The Company constantly monitors and manages its cash flows to assess the liquidity necessary to fund operations. As at May 31, 2016, Aphria maintained $16,472,664 of cash and cash equivalents on hand, compared to $7,051,909 at May 31, 2015 and $12,053,547 at February 29, Cash and cash equivalents on hand increased $9,420,755 throughout the year and $4,419,117 in the quarter. The increase in cash is primarily due to the bought deal financing on January 11, 2016 and the exercise of warrants expiring June 3, Working capital provides funds for the Company to meet its operational and capital requirements. As at May 31, 2016, the Company maintained working capital of $20,626,394. The Company does not have any long-term liabilities. Management expects the Company to have adequate funds available on hand to meet the Company s planned growth and expansion of facilities over the next 12 months. 22
27 Capital asset and investment spending For the three months ended May 31, 2016, the Company invested $434,600 in capital assets. For the twelve months ended May 31, 2016, the Company invested $4,426,059 in capital assets, of which $1,033,289 are considered maintenance CAPEX and the remainder, $3,392,770, growth CAPEX related to the Company s Part I expansion. Financial covenants The Company does not currently have any financial covenants that it must meet. Contractual obligations and off-balance sheet financing The Company has a lease commitment until December 31, 2018 for the rental of greenhouse and office space from a related party. The Company has an option to extend this lease for two additional 5 year periods. The Company has a leased commitment until April 30, 2019 for a motor vehicle. Minimum payments payable over the next five years are as follows: PAYMENTS DUE BY PERIOD Total Less than 1 year 1 3 years 4 5 years After 5 years Operating leases (1) $ 601,505 $ 232,840 $ 368,665 $ -- $ -- Motor vehicle lease 57,314 20,229 37, Total $ 658,819 $ 253,069 $ 405,750 $ -- $ -- (1) As a result of the land acquisition purchase, the operating leases related to the land and greenhouses terminated June 30, Except as disclosed elsewhere in this MD&A, there have been no material changes with respect to the contractual obligations of the Company during the year. Aphria does not maintain any off-balance sheet financing. Share capital Aphria has the following securities issued and outstanding, as at May 31, 2016: PRESENTLY OUTSTANDING EXERCISABLE EXERCISABLE & IN-THE MONEY* FULLY DILUTED Common stock 70,053,933 70,053,933 Stock options -- 3,906,454 3,849,787 4,975,000 Warrants -- 17,572, ,419 17,572,872 Compensation warrants -- 1,149,115 1,149,115 1,149,115 Warrants on exercise of compensation options ,391 Fully diluted 70,053,933 94,016,311 *Based on closing price on May 31, 2016 of $1.37 per share 23
28 QUARTERLY RESULTS The following table sets out certain unaudited financial information for each of the eight fiscal quarters up to and including the fourth quarter of fiscal 2016, ended May 31, The information has been derived from the Company s unaudited consolidated financial statements. Past performance is not a guarantee of future performance and this information is not necessarily indicative of results for any future period. AUG/15 NOV/15 FEB/16 MAY/16 Sales $ 950,740 $ 2,026,975 $ 2,679,898 $ 2,776,316 Net income (loss) (476,825) (431,098) 3,720 1,302,164 Income (loss) per share - basic (0.01) (0.00) Income (loss) per share fully diluted (0.01) (0.00) AUG/14 NOV/14 FEB/15 MAY/15 Sales $ -- $ -- $ 51,540 $ 499,890 Net loss (1,600,104) (1,358,849) (3,103,111) (481,380) Loss per share - basic (0.04) (0.04) (0.06) (0.01) Loss per share fully diluted (0.04) (0.04) (0.06) (0.01) The Company obtained its MMPR licence to produce and sell on November 26, 2014, with sales commencing shortly thereafter. The Company recognized listing costs of $2,708,031 in the third quarter of 2015, $314,037 in the second quarter of 2015, and $256,000 in the first quarter of RELATED PARTY BALANCES AND TRANSACTIONS Prior to going public, the Company funded operations through the support of related parties. Since going public, the Company has continued to leverage the purchasing power of these related parties for certain of its growing related expenditures. The Company owed $nil to related parties as at May 31, 2016 ( $nil). These amounts were due upon demand and are non-interest bearing. These parties are related as they are corporations that are controlled by certain officers and directors of the Company (Mr. Cole Cacciavillani and Mr. John Cervini). The Company transacts with related parties in the normal course of business. Through these related parties, Aphria is able to leverage the purchasing power for growing related commodities and labour, which provides the Company with better rates than if Aphria was sourcing these on its own. These transactions are measured at their exchange amounts. During the three months ended May 31, 2016, related party corporations charged or incurred expenditures on behalf of the Company totaling $254,519 ( $154,417), which were or are to be reimbursed, including rent of $58,210 ( $26,484). During the twelve months ended May 31, 2016, related party corporations charged or incurred expenditures on behalf of the Company totaling $1,139,788 ( $574,951), which were or are to be reimbursed, including rent of $193,593 ( $105,935). 24
29 SUBSEQUENT EVENTS Land Acquisition Purchase Subsequent to the end of the year, the Company closed the Purchase Agreement to acquire 9 acres of greenhouses, situated on 36 acres of property, known as 265 Talbot Street West, in Leamington, Ontario. The purchase price for the land and greenhouses was $6.1 million and is considered a non-arm s length transaction because the vendor is a director and officer of the Company. $3.25 million of the purchase price was payable in cash on closing, and the remainder will be paid as a vendor take-back mortgage, bearing interest at 6.75% per annum, with a 5-year term and amortization. The Company maintains a right of first refusal to acquire an additional acre of property, known as 243 Talbot Street West, in Leamington, Ontario. The vendor maintains a put option on the same property valued at $1 million, subject to annual inflationary adjustments equal to the increases in the Consumer Price Index, which put option can be only be exercised on upon certain operating metrics being achieved. Warrant exercise Subsequent to the end of the year, shareholders of the Company exercised 797,414 warrants through a number of individual transactions. As part of those transactions, the Company received $956,897 in cash. Stock option grant Subsequent to the end of the year, the Company granted 278,000 stock options to directors, officers, employees and a consultant of the Company. The stock options are exercisable at $1.40. This MD&A contains forward-looking statements within the meaning of applicable securities legislation with regards to expected financial performance, strategy and business conditions. We use words such as forecast, future,, should, could, enable, potential, contemplate, believe, anticipate, estimate, plan, expect, intend, may, project, will, would and similar expressions are intended to identify forward-looking statements, although not all forward-looking statements contain these identifying words. These statements reflect management s current beliefs with respect to future events and are based on information currently available to management. Forwardlooking statements involve significant known and unknown risks and uncertainties. Many factors could cause actual results, performance or achievement to be materially different from any future forward-looking statements. Factors that may cause such differences include, but are not limited to, general economic and market conditions, investment performance, financial markets, legislative and regulatory changes, technological developments, catastrophic events and other business risks. These forward-looking statements are as of the date of this MD&A and the Company and management assume no obligation to update or revise them to reflect new events or circumstances except as required by securities laws. The Company and management caution readers not to place undue reliance on any forward-looking statements, which speak only as of the date made. Some of the specific forward-looking statements in this MD&A include, but are not limited to, statements with respect to the following: the intended expansion of the Company s facilities and receipt of approval from Health Canada to complete such expansion; the expected growth in the number of patients using the Company s medical marijuana; and the anticipated future gross margins of the Company s operations. 25


30 CAPACITY FOR FUTURE (EXISTING FOOTPRINT) PART II EXPANSION (Ready for April 2017, pending HC approvals) 57,000 square $55 per square foot Grow to 100,000 square feet of production space FULLY FUNDED


 Build to current")
31 4.75 ACRES OF GREENHOUSE READY Minor CAPEX to make operational Spring & fall crop only (v. 6 crops in current greenhouses) OR could demolish and build to current Leamington greenhouse standards 17 ACRES OF BUILDABLE GREENHOUSE CAPACITY ON VACANT LAND $55 per square foot to expand (equipment extra) Build to current Leamington greenhouse standards


32 POWERED BY SUNLIGHT C O N S O L I D A T E D FINANCIAL STATEMENTS FOR THE YEAR ENDED MAY 31, 2016 AND MAY 31, 2015 (Expressed in Canadian Dollars, unless otherwise noted)
MANAGEMENT S DISCUSSION & ANALYSIS
 MANAGEMENT S DISCUSSION & ANALYSIS This management discussion and analysis ( MD&A ) of the financial condition and results of operations of Aphria Inc., (the Company or Aphria ), is for the three and twelve
Aphria Inc. CONDENSED INTERIM CONSOLIDATED FINANCIAL STATEMENTS FOR THE NINE MONTHS ENDED FEBRUARY 29, 2016 and FEBRUARY 28, 2015
 CONDENSED INTERIM CONSOLIDATED FINANCIAL STATEMENTS FOR THE NINE MONTHS ENDED FEBRUARY 29, 2016 and FEBRUARY 28, 2015 (Unaudited, expressed in Canadian Dollars, unless otherwise noted) Notice of No Auditor
DOJA Cannabis Company Limited (Formerly SG Spirit Gold Inc.)
") DOJA Cannabis Company Limited (Formerly SG Spirit Gold Inc.) Management s Discussion and Analysis For the three and six months ended September 30, 2017 Introduction This management s discussion and analysis
DOJA Cannabis Company Limited (Formerly SG Spirit Gold Inc.) Management s Discussion and Analysis For the three and six months ended September 30, 2017 Introduction This management s discussion and analysis
PREMIUM MEDICAL CANNABIS POWERED BY SUNLIGHT
 PREMIUM MEDICAL CANNABIS POWERED BY SUNLIGHT Q2 2018 Investor Presentation PREMIUM January MEDICAL CANNABIS 10, 2018 POWERED BY SUN DISCLAIMER This documentation is a presentation (the Presentation ) of
Aphria Inc. CONDENSED INTERIM CONSOLIDATED FINANCIAL STATEMENTS FOR THE THREE MONTHS AND SIX MONTHS ENDED NOVEMBER 30, 2016 and NOVEMBER 30, 2015
 CONDENSED INTERIM CONSOLIDATED FINANCIAL STATEMENTS FOR THE THREE MONTHS AND SIX MONTHS ENDED NOVEMBER 30, 2016 and NOVEMBER 30, 2015 (Unaudited, expressed in Canadian Dollars, unless otherwise noted)
ABcann Global Corporation. (formerly Panda Capital Inc.) Management s Discussion & Analysis
 Management s Discussion & Analysis") ABcann Global Corporation (formerly Panda Capital Inc.) Management s Discussion & Analysis For the Three and Six Months Ended June 30, 2017 Introduction This management s discussion and analysis ( MD&A
ABcann Global Corporation (formerly Panda Capital Inc.) Management s Discussion & Analysis For the Three and Six Months Ended June 30, 2017 Introduction This management s discussion and analysis ( MD&A
POWERED BY SUNLIGHT CONSOLIDATED FINANCIAL STATEMENTS FOR THE YEAR ENDED MAY 31, 2016 AND MAY 31, 2015
 POWERED BY SUNLIGHT CONSOLIDATED FINANCIAL STATEMENTS FOR THE YEAR ENDED AND (Expressed in Canadian Dollars, unless otherwise noted) Management s Responsibility for the Consolidated Financial Statements
Pure Natures Wellness Inc. d/b/a Aphria
 CONDENSED INTERIM FINANCIAL STATEMENTS FOR THE SIX MONTHS ENDED NOVEMBER 30, 2014 AND SEVEN MONTHS ENDED NOVEMBER 30, 2013 (Unaudited, Expressed in Canadian Dollars, unless otherwise noted) Notice of No
EMERALD HEALTH THERAPEUTICS, INC. (Formerly T-Bird Pharma Inc.) MANAGEMENT DISCUSSION AND ANALYSIS For the three and six months ended June 30, 2016
 MANAGEMENT DISCUSSION AND ANALYSIS For the three and six months ended June 30, 2016") EMERALD HEALTH THERAPEUTICS, INC. MANAGEMENT DISCUSSION AND ANALYSIS Dated: August 22, 2016 Forward-Looking Statements... 2 Overview... 3 Recent Developments and Events after the Reporting Period... 4
EMERALD HEALTH THERAPEUTICS, INC. MANAGEMENT DISCUSSION AND ANALYSIS Dated: August 22, 2016 Forward-Looking Statements... 2 Overview... 3 Recent Developments and Events after the Reporting Period... 4
APHRIA INC. MANAGEMENT S DISCUSSION & ANALYSIS
 This management discussion and analysis ( MD&A ) of the financial condition and results of operations of Aphria Inc., (the Company or Aphria ), is for the three months ended August 31, 2017. It is supplemental
EMERALD HEALTH THERAPEUTICS, INC. (Formerly T-Bird Pharma Inc.)
") EMERALD HEALTH THERAPEUTICS, INC. MANAGEMENT DISCUSSION AND ANALYSIS Dated: November 25, 2016 Forward-Looking Statements... 2 Overview... 3 Recent Developments and Events after the Reporting Period...
EMERALD HEALTH THERAPEUTICS, INC. MANAGEMENT DISCUSSION AND ANALYSIS Dated: November 25, 2016 Forward-Looking Statements... 2 Overview... 3 Recent Developments and Events after the Reporting Period...
PREMIUM MEDICAL CANNABIS POWERED BY SUNLIGHT
 PREMIUM MEDICAL CANNABIS POWERED BY SUNLIGHT Q2 2018 Investor Presentation PREMIUM January MEDICAL CANNABIS 10, 2018 POWERED BY SUN DISCLAIMER This documentation is a presentation (the Presentation ) of
The Hydropothecary Corporation. Company Overview. Management Discussion & Analysis. For the three and nine months ending April 30, 2017 and 2016
 For the three and nine months ending April 30, 2017 and 2016 This management discussion and analysis ( MD&A ) of the financial condition and results of operations of The Hydropothecary Corporation and
EVE & CO INCORPORATED MANAGEMENT S DISCUSSION AND ANALYSIS OF FINANCIAL RESULTS
 (TSXV: EVE) EVE & CO INCORPORATED MANAGEMENT S DISCUSSION AND ANALYSIS OF FINANCIAL RESULTS For the three and nine month periods ended July 31, 2018 Date: October 1, 2018 EVE & CO INCORPORATED Management
EVE & CO INCORPORATED
 (TSXV: EVE) MANAGEMENT S DISCUSSION AND ANALYSIS OF FINANCIAL RESULTS EVE & CO INCORPORATED For the three- and twelve-month periods ended October 31, 2018 Date: December 31, 2018 Eve & Co Incorporated
Cronos Group Inc. (formerly PharmaCan Capital Corp.) Management s Discussion & Analysis
 Management s Discussion & Analysis") Cronos Group Inc. (formerly PharmaCan Capital Corp.) Management s Discussion & Analysis For the Three Month Periods Ended March 31, 2017 and March 31, 2016 Introduction This Management Discussion and Analysis
Cronos Group Inc. (formerly PharmaCan Capital Corp.) Management s Discussion & Analysis For the Three Month Periods Ended March 31, 2017 and March 31, 2016 Introduction This Management Discussion and Analysis
APHRIA INC. ANNUAL INFORMATION FORM. For the fiscal year ended May 31, 2017
 APHRIA INC. ANNUAL INFORMATION FORM For the fiscal year ended May 31, 2017 DATED: July 12, 2017 TABLE OF CONTENTS ANNUAL INFORMATION FORM... 3 FORWARD-LOOKING STATEMENTS... 3 CORPORATE STRUCTURE... 4 GENERAL
CONDENSED INTERIM CONSOLIDATED FINANCIAL STATEMENTS (UNAUDITED) EMBLEM CORP. FOR THE THREE AND SIX MONTHS ENDED JUNE 30, 2018
 EMBLEM CORP. FOR THE THREE AND SIX MONTHS ENDED JUNE 30, 2018") CONDENSED INTERIM CONSOLIDATED FINANCIAL STATEMENTS (UNAUDITED) OF EMBLEM CORP. FOR THE THREE AND SIX MONTHS ENDED JUNE 30, 2018 NOTICE OF UNAUDITED CONDENSED INTERIM CONSOLIDATED FINANCIAL STATEMENTS
CONDENSED INTERIM CONSOLIDATED FINANCIAL STATEMENTS (UNAUDITED) OF EMBLEM CORP. FOR THE THREE AND SIX MONTHS ENDED JUNE 30, 2018 NOTICE OF UNAUDITED CONDENSED INTERIM CONSOLIDATED FINANCIAL STATEMENTS
SUPREME PHARMACEUTICALS INC.
 SUPREME PHARMACEUTICALS INC. MANAGEMENT S DISCUSSION AND ANALYSIS OF FINANCIAL RESULTS For the nine months ended March 31, 2016 Date: May 30, 2016 SUPREME PHARMACEUTICALS INC. Management Discussion and
Canopy Growth Corporation (Formerly Tweed Marijuana Inc.)
") Canopy Growth Corporation (Formerly Tweed Marijuana Inc.) Management s Discussion and Analysis of the Financial Condition and Results of Operations For the three and six months ended September 30, 2015
Canopy Growth Corporation (Formerly Tweed Marijuana Inc.) Management s Discussion and Analysis of the Financial Condition and Results of Operations For the three and six months ended September 30, 2015
BLISSCO CANNABIS CORP. MANAGEMENT DISCUSSION AND ANALYSIS Nine Months Ended October 31, 2018
 MANAGEMENT DISCUSSION AND ANALYSIS Nine Months Ended 1.1 Date This Management Discussion and Analysis ( MD&A ) of BlissCo Cannabis Corp. (the Company or BlissCo ) has been prepared by management as of
Cronos Group Inc. (formerly PharmaCan Capital Corp.) Management s Discussion & Analysis
 Management s Discussion & Analysis") Cronos Group Inc. (formerly PharmaCan Capital Corp.) Management s Discussion & Analysis For the Year Ended December 31, 2016 Introduction This Management Discussion and Analysis ( MD&A ) provides relevant
Cronos Group Inc. (formerly PharmaCan Capital Corp.) Management s Discussion & Analysis For the Year Ended December 31, 2016 Introduction This Management Discussion and Analysis ( MD&A ) provides relevant
Highlights for Village Farms U.S. Hemp/CBD Initiative
 Village Farms International Reports Fourth Quarter and Year End 2018 Financial Results Cannabis Joint Venture, Pure Sunfarms, Generates Positive Net Income in First Full Quarter of Sales and for the Full
EMERALD HEALTH THERAPEUTICS, INC. MANAGEMENT DISCUSSION AND ANALYSIS For the three months ended March 31, 2017
 EMERALD HEALTH THERAPEUTICS, INC. MANAGEMENT DISCUSSION AND ANALYSIS For the three months ended March 31, 2017 Dated: May 25, 2017 - 2 - TABLE OF CONTENTS Forward-Looking Statements... 3 Overview... 4
EMERALD HEALTH THERAPEUTICS, INC. (Formerly T-Bird Pharma Inc. and formerly Firebird Energy Inc.)
") EMERALD HEALTH THERAPEUTICS, INC. MANAGEMENT DISCUSSION AND ANALYSIS Dated: November 18, 2015 Introduction... 2 Forward-Looking Statements... 2 Description of Business... 3 Recent Developments and Subsequent
EMERALD HEALTH THERAPEUTICS, INC. MANAGEMENT DISCUSSION AND ANALYSIS Dated: November 18, 2015 Introduction... 2 Forward-Looking Statements... 2 Description of Business... 3 Recent Developments and Subsequent
EMERALD HEALTH THERAPEUTICS, INC. MANAGEMENT DISCUSSION AND ANALYSIS For the three and nine months ended September 30, 2017
 EMERALD HEALTH THERAPEUTICS, INC. MANAGEMENT DISCUSSION AND ANALYSIS For the three and nine months ended September 30, 2017 Dated: November 15, 2017 - 2 - TABLE OF CONTENTS Forward-Looking Statements...
(TSXV: LABS) MEDIPHARM LABS CORP. MANAGEMENT S DISCUSSION AND ANALYSIS FOR THE YEAR ENDED DECEMBER 31, 2018
 MEDIPHARM LABS CORP. MANAGEMENT S DISCUSSION AND ANALYSIS FOR THE YEAR ENDED DECEMBER 31, 2018") (TSXV: LABS) MEDIPHARM LABS CORP. FOR THE YEAR ENDED DECEMBER 31, 2018 April 3, 2019 This management s discussion and analysis ( MD&A ) of the financial condition and performance of (the Company ) was
(TSXV: LABS) MEDIPHARM LABS CORP. FOR THE YEAR ENDED DECEMBER 31, 2018 April 3, 2019 This management s discussion and analysis ( MD&A ) of the financial condition and performance of (the Company ) was
CANNABIS WHEATON INCOME CORP. MANAGEMENT S DISCUSSION AND ANALYSIS OF FINANCIAL RESULTS FOR THE PERIOD ENDED MARCH 31, Stated in Canadian Funds
 CANNABIS WHEATON INCOME CORP. MANAGEMENT S DISCUSSION AND ANALYSIS OF FINANCIAL RESULTS FOR THE PERIOD ENDED MARCH 31, 2018 Stated in Canadian Funds DATE: MAY 30, 2018 For the Period Ended March 31, 2018
Management s Discussion and Analysis
 - 1 - Management s Discussion and Analysis For the Three and Nine Months Ended September 30, 2018 This Management s Discussion and Analysis ( MD&A ) is prepared as at November 29, 2018 and should be read
Canopy Growth Corporation (Formerly Tweed Marijuana Inc.)
") Condensed interim consolidated financial statements Canopy Growth Corporation (Formerly Tweed Marijuana Inc.) For the Three and Six Months Ended September 30, 2015 and 2014 September 30, 2015 and 2014
Condensed interim consolidated financial statements Canopy Growth Corporation (Formerly Tweed Marijuana Inc.) For the Three and Six Months Ended September 30, 2015 and 2014 September 30, 2015 and 2014
CANOPY GROWTH CORPORATION
 CONDENSED INTERIM CONSOLIDATED FINANCIAL STATEMENTS (Unaudited) (IN CANADIAN DOLLARS) TABLE OF CONTENTS Condensed interim consolidated statements of financial position... 1 Condensed interim consolidated
VILLAGE FARMS INTERNATIONAL REPORTS YEAR END 2017 FINANCIAL RESULTS AND ANNOUNCES PLAN TO INCREASE PURE SUNFARMS 2019 PRODUCTION BY UP TO 30%
 VILLAGE FARMS INTERNATIONAL REPORTS YEAR END 2017 FINANCIAL RESULTS AND ANNOUNCES PLAN TO INCREASE PURE SUNFARMS 2019 PRODUCTION BY UP TO 30% Pure Sunfarms to Pursue Accelerated Production Ramp Up Plan
The discussion and analysis in this MD&A is based on information available to management as of August 13, 2018.
 MANAGEMENT'S DISCUSSION AND ANALYSIS This following Management's Discussion and Analysis provides a review of the financial condition and results of operations for CannTrust Holdings Inc. (the "Company"
VILLAGE FARMS INTERNATIONAL REPORTS THIRD QUARTER 2018 FINANCIAL RESULTS/PURE SUNFARMS EXPANDING CANNABIS PRODUCTION AND SALES
 FOR IMMEDIATE RELEASE VILLAGE FARMS INTERNATIONAL REPORTS THIRD QUARTER 2018 FINANCIAL RESULTS/PURE SUNFARMS EXPANDING CANNABIS PRODUCTION AND SALES NOT FOR DISTRIBUTION OVER UNITED STATES WIRE SERVICES
Aphria Inc. CONDENSED INTERIM CONSOLIDATED FINANCIAL STATEMENTS FOR THE THREE MONTHS AND SIX MONTHS ENDED NOVEMBER 30, 2017 AND NOVEMBER 30, 2016
 CONDENSED INTERIM CONSOLIDATED FINANCIAL STATEMENTS FOR THE THREE MONTHS AND SIX MONTHS ENDED NOVEMBER 30, AND NOVEMBER 30, 2016 (Unaudited, expressed in Canadian Dollars, unless otherwise noted) Condensed
The Hydropothecary Corporation
 For the three months ended October 31, 2017 and 2016 This management discussion and analysis ( MD&A ) of the financial condition and results of operations of The Hydropothecary Corporation and its wholly-owned
WEEDMD INC. CONDENSED INTERIM CONSOLIDATED FINANCIAL STATEMENTS
 CONDENSED INTERIM CONSOLIDATED FINANCIAL STATEMENTS WEEDMD INC. For the three and nine months ended 2018 and 2017 (Unaudited - Expressed in Canadian Dollars) CONDENSED INTERIM CONSOLIDATED FINANCIAL STATEMENTS
GLOBAL LEADER IN MEDICAL CANNABIS CREATED BY APHRIA AND NUUVERA COMBINATION
 GLOBAL LEADER IN MEDICAL CANNABIS CREATED BY APHRIA AND NUUVERA COMBINATION Combination capitalizes on Nuuvera s expansive international footprint, expanding network into Europe, Africa and the Middle
THC BIOMED INTL LTD.
 Management s Discussion and Analysis For the Nine Months Ended April 30, 2016 INTRODUCTION This ( MD&A ) of the operating results and financial condition of THC BioMed Intl Ltd. (the Company or Thelon
ORGANIGRAM HOLDINGS INC. ANNUAL INFORMATION FORM
 ORGANIGRAM HOLDINGS INC. ANNUAL INFORMATION FORM For the fiscal year ended August 31, 2015 DATED: May 4, 2016 TABLE OF CONTENTS ANNUAL INFORMATION FORM...3 FORWARD-LOOKING STATEMENTS...3 CORPORATE STRUCTURE...4
OrganiGram Holdings Inc. Management s Discussion and Analysis of Financial Condition and Results of Operations ( MD&A )
") OrganiGram Holdings Inc. Management s Discussion and Analysis of Financial Condition and Results of Operations ( MD&A ) For the Fiscal Year Ended August 31,2015 ORGANIGRAM HOLDINGS INC. MANAGEMENT DISCUSSION
OrganiGram Holdings Inc. Management s Discussion and Analysis of Financial Condition and Results of Operations ( MD&A ) For the Fiscal Year Ended August 31,2015 ORGANIGRAM HOLDINGS INC. MANAGEMENT DISCUSSION
SUPREME PHARMACEUTICALS INC.
 SUPREME PHARMACEUTICALS INC. MANAGEMENT S DISCUSSION AND ANALYSIS OF FINANCIAL RESULTS For the six months ended December 31, 2016 Date: March 1, 2017 SUPREME PHARMACEUTICALS INC. Management Discussion
CannTrust Holdings Inc.
 Condensed interim consolidated financial statements (Unaudited) CannTrust Holdings Inc. For the three months ended March 31, 2018 and March 31, 2017 (Expressed in Canadian dollars) Condensed Interim Consolidated
OrganiGram Holdings Inc. Management s Discussion and Analysis of Financial Condition and Results of Operations ( MD&A )
") OrganiGram Holdings Inc. Management s Discussion and Analysis of Financial Condition and Results of Operations ( MD&A ) Second Quarter Fiscal 2015 ORGANIGRAM HOLDINGS INC. MANAGEMENT DISCUSSION AND ANALYSIS
OrganiGram Holdings Inc. Management s Discussion and Analysis of Financial Condition and Results of Operations ( MD&A ) Second Quarter Fiscal 2015 ORGANIGRAM HOLDINGS INC. MANAGEMENT DISCUSSION AND ANALYSIS
THE SUPREME CANNABIS COMPANY, INC.
 THE SUPREME CANNABIS COMPANY, INC. CONSOLIDATED FINANCIAL STATEMENTS FOR THE YEAR ENDED JUNE 30, 2018 and JUNE 30, 2017 Management s Responsibility for Financial Reporting To the Shareholders of The Supreme
Condensed interim consolidated financial statements of HEXO Corp. (formerly The Hydropothecary Corporation)
") Condensed interim consolidated financial statements of HEXO Corp. (formerly The Hydropothecary Corporation) For the three months ended October 31, 2018 and 2017 Table of Contents Condensed Interim Consolidated
Condensed interim consolidated financial statements of HEXO Corp. (formerly The Hydropothecary Corporation) For the three months ended October 31, 2018 and 2017 Table of Contents Condensed Interim Consolidated
WEEDMD INC. (Formerly Aumento Capital V Corporation)
") CONSOLIDATED FINANCIAL STATEMENTS WEEDMD INC. December 31, 2017 and 2016 (Expressed in Canadian Dollars) CONSOLIDATED FINANCIAL STATEMENTS For the Years Ended December 31, 2017 and 2016 CONTENTS Page Auditor
CONSOLIDATED FINANCIAL STATEMENTS WEEDMD INC. December 31, 2017 and 2016 (Expressed in Canadian Dollars) CONSOLIDATED FINANCIAL STATEMENTS For the Years Ended December 31, 2017 and 2016 CONTENTS Page Auditor
DRAFT MANAGEMENT S DISCUSSION AND ANALYSIS OF FINANCIAL CONDITION AND RESULTS OF OPERATIONS
 thescore, Inc. DRAFT MANAGEMENT S DISCUSSION AND ANALYSIS OF FINANCIAL CONDITION AND RESULTS OF OPERATIONS For the Three Months Ended November 30, 2017 The following is Management's Discussion and Analysis
OrganiGram Holdings Inc. Management s Discussion and Analysis of Financial Condition and Results of Operations ( MD&A )
") OrganiGram Holdings Inc. Management s Discussion and Analysis of Financial Condition and Results of Operations ( MD&A ) Third Quarter Fiscal 2015 ORGANIGRAM HOLDINGS INC. MANAGEMENT DISCUSSION AND ANALYSIS
OrganiGram Holdings Inc. Management s Discussion and Analysis of Financial Condition and Results of Operations ( MD&A ) Third Quarter Fiscal 2015 ORGANIGRAM HOLDINGS INC. MANAGEMENT DISCUSSION AND ANALYSIS
Harvest One Cannabis Inc.
 Condensed Combined Consolidated Interim Financial Statements of Harvest One Cannabis Inc. For the three months ended September 30, 2017 and 2016 Table of contents Condensed combined consolidated interim
CONDENSED CONSOLIDATED INTERIM FINANCIAL STATEMENTS
 CONDENSED CONSOLIDATED INTERIM FINANCIAL STATEMENTS (UNAUDITED PREPARED BY MANAGEMENT) (EXPRESSED IN CANADIAN DOLLARS) THREE MONTH PERIOD ENDED FEBRUARY 28, 2018 (formerly Genovation Capital Corp.) NOTICE
MANAGEMENT S DISCUSSION AND ANALYSIS OF FINANCIAL CONDITION AND RESULTS OF OPERATIONS
 thescore, Inc. MANAGEMENT S DISCUSSION AND ANALYSIS OF FINANCIAL CONDITION AND RESULTS OF OPERATIONS For the Three and Nine Months Ended May 31, 2018 and 2017 The following is Management's Discussion and
Emerald Health Therapeutics Reports 1 st Quarter 2018 Financial Results and Provides Corporate Update
 Emerald Health Therapeutics Reports 1 st Quarter 2018 Financial Results and Provides Corporate Update Commences commercial production at its Pure Sunfarms Delta 3 joint venture greenhouse operation VICTORIA,
I n v e s t o r P r e s e n t a t i o n A c q u i s i t i o n o f C a n n a F a r m s
 I n v e s t o r P r e s e n t a t i o n A c q u i s i t i o n o f C a n n a F a r m s July 30, 2018 TSX-V: VIVO OTCQB: ABCCF Disclaimer Certain information included in this presentation, which was prepared
ORGANIGRAM HOLDINGS INC. $35,003,000 9,860,000 Common Shares
 No securities regulatory authority has expressed an opinion about these securities and it is an offence to claim otherwise. This short form prospectus constitutes a public offering of these securities
OrganiGram Holdings Inc. Management s Discussion and Analysis of Financial Condition and Results of Operations ( MD&A )
") OrganiGram Holdings Inc. Management s Discussion and Analysis of Financial Condition and Results of Operations ( MD&A ) For the Three-month Period Ended November 30, 2014 1.1 Introduction ORGANIGRAM HOLDINGS
OrganiGram Holdings Inc. Management s Discussion and Analysis of Financial Condition and Results of Operations ( MD&A ) For the Three-month Period Ended November 30, 2014 1.1 Introduction ORGANIGRAM HOLDINGS
Investor Presentation May September 2017
 Investor Presentation May 2018 September 2017 Forward Looking Statements 2 This presentation contains certain "forward looking statements". These statements relate to future events or future performance
Liberty Health Sciences Inc. (formerly, SecureCom Mobile Inc.)
") CONDENSED INTERIM CONSOLIDATED FINANCIAL STATEMENTS Liberty Health Sciences Inc. FOR THE THREE MONTHS ENDED MAY 31, 2018 (in Canadian Dollars) NOTICE TO READER Under National Instrument 51-102, Part 4,
CONDENSED INTERIM CONSOLIDATED FINANCIAL STATEMENTS Liberty Health Sciences Inc. FOR THE THREE MONTHS ENDED MAY 31, 2018 (in Canadian Dollars) NOTICE TO READER Under National Instrument 51-102, Part 4,
Investor Presentation March September 2017
 Investor Presentation March 2018 September 2017 Forward Looking Statements 2 This presentation contains certain "forward looking statements". These statements relate to future events or future performance
POCML 4 INC. Management s Discussion and Analysis. (a Capital Pool Corporation) For the Quarter Ended: March 31, Date of Report: May 30, 2018
 For the Quarter Ended: March 31, Date of Report: May 30, 2018") POCML 4 INC. (a Capital Pool Corporation) Management s Discussion and Analysis For the Quarter Ended: March 31, 2018 Date of Report: May 30, 2018 This management s discussion and analysis of the financial
POCML 4 INC. (a Capital Pool Corporation) Management s Discussion and Analysis For the Quarter Ended: March 31, 2018 Date of Report: May 30, 2018 This management s discussion and analysis of the financial
Investor Presentation February September 2017
 Investor Presentation February 2018 September 2017 Forward looking statements 2 This presentation contains certain "forward looking statements". These statements relate to future events or future performance
Financial and Operational Summary
 Choice Properties Real Estate Investment Trust Reports Solid Third Quarter 2013 Results Executing on Growth Strategy with Financial and Operating Performance In Line with Expectations Not for distribution
TSX:LEAF Investor Presentation March 2018
 TSX:LEAF Investor Presentation March 2018 Price Close (Mar 16, 2018): $19.34 Market Capitalization: $1.9 billion Basic and F.D. Shares: 99.8/109.6 million Forward-Looking Information This Presentation
Aphria Inc. CONDENSED INTERIM CONSOLIDATED FINANCIAL STATEMENTS FOR THE THREE MONTHS ENDED AUGUST 31, 2017 AND AUGUST 31, 2016
 CONDENSED INTERIM CONSOLIDATED FINANCIAL STATEMENTS FOR THE THREE MONTHS ENDED AUGUST 31, AND AUGUST 31, 2016 (Unaudited, expressed in Canadian Dollars, unless otherwise noted) Notice of No Auditor Review
CANOPY GROWTH CORPORATION
 CONDENSED INTERIM CONSOLIDATED FINANCIAL STATEMENTS (Unaudited) (IN CANADIAN DOLLARS) TABLE OF CONTENTS Condensed interim consolidated statements of financial position... 1 Condensed interim consolidated
MANAGEMENT S DISCUSSION AND ANALYSIS FOR THE 13 AND 26 WEEKS ENDED NOVEMBER 4, 2017
 MANAGEMENT S DISCUSSION AND ANALYSIS FOR THE 13 AND 26 WEEKS ENDED NOVEMBER 4, 2017 Forward-Looking Information... 1 Overview of the Business... 3 Food Retailing... 3 Summary Results Second Quarter...
Not for distribution to U.S. News Wire Services or dissemination in the United States
 Choice Properties Real Estate Investment Trust Reports Solid Results for the Fourth Quarter Ended December 31, 2013 Closed the year on strong footing and well positioned to benefit from future potential
VILLAGE FARMS INTERNATIONAL REPORTS FIRST QUARTER 2018 FINANCIAL RESULTS AND ANNOUNCES COMMENCEMENT OF COMMERCIAL-SCALE GROWING AT DELTA 3 GREENHOUSE
 FOR IMMEDIATE RELEASE VILLAGE FARMS INTERNATIONAL REPORTS FIRST QUARTER 2018 FINANCIAL RESULTS AND ANNOUNCES COMMENCEMENT OF COMMERCIAL-SCALE GROWING AT DELTA 3 GREENHOUSE NOT FOR DISTRIBUTION OVER UNITED
Investor Presentation. TSX Venture (OGI) OTCQX Best Market (OGRMF)
 OTCQX Best Market (OGRMF)") Investor Presentation TSX Venture (OGI) OTCQX Best Market (OGRMF) Disclaimer & Cautionary Statements This document is current as of February 8, 2019, except where otherwise stated. The information contained
Investor Presentation TSX Venture (OGI) OTCQX Best Market (OGRMF) Disclaimer & Cautionary Statements This document is current as of February 8, 2019, except where otherwise stated. The information contained
HARVEST ENTERPRISES GROUP OF COMPANIES
 HARVEST ENTERPRISES GROUP OF COMPANIES MANAGEMENT S DISCUSSION & ANALYSIS FOR THE THREE AND SIX MONTHS ENDED JUNE 30, 2018 AND 2017 (Expressed in United States dollars) MD&A of Harvest Enterprises Group
CONDENSED INTERIM CONSOLIDATED FINANCIAL STATEMENTS WEEDMD INC.
 CONDENSED INTERIM CONSOLIDATED FINANCIAL STATEMENTS WEEDMD INC. Three Months Ended March 31, 2018 and 2017 (Unaudited - Expressed in Canadian Dollars) CONDENSED INTERIM CONSOLIDATED FINANCIAL STATEMENTS
Condensed Interim Consolidated Financial Statements
 Condensed Interim Consolidated Financial Statements (Expressed in Canadian Dollars) CONDENSED INTERIM CONSOLIDATED STATEMENTS OF FINANCIAL POSITION ASSETS June 30 December 31 2018 2017 Current Cash and
TSX:LEAF Investor Presentation December 2017 Top Licensed Producer
 TSX:LEAF Investor Presentation December 2017 Top Licensed Producer Price Close (Dec 7, 2017): $15.47 Market Capitalization: $1.5 billion Basic and F.D. Shares: 94.1/101.4 million Forward-Looking Information
Financial Highlights (1)
") Loblaw Companies limited 2013 Annual Report Financial review Financial Highlights (1) As at or for the periods ended December 28, 2013 and December 29, 2012 2013 2012 (2) 2011 (3) (millions of Canadian
Loblaw Companies limited 2013 Annual Report Financial review Financial Highlights (1) As at or for the periods ended December 28, 2013 and December 29, 2012 2013 2012 (2) 2011 (3) (millions of Canadian
EMERALD HEALTH THERAPEUTICS, INC.
 EMERALD HEALTH THERAPEUTICS, INC. MANAGEMENT DISCUSSION AND ANALYSIS For the three and six months ended June 30, 2018 Dated: August 29, 2018-1 - TABLE OF CONTENTS Forward-Looking Statements... 3 Overview...
Forward-looking Statements
 MANAGEMENT S DISCUSSION AND ANALYSIS OF ACERUS PHARMACEUTICALS CORPORATION (FORMERLY TRIMEL PHARMACEUTICALS CORPORATION) FOR THE THREE AND NINE MONTHS ENDED SEPTEMBER 30, 2015 The following management
Forward-looking Statements
 MANAGEMENT S DISCUSSION AND ANALYSIS OF FINANCIAL CONDITION AND RESULTS OF OPERATIONS The following management s discussion and analysis ( MD&A ) dated November 5, is intended to assist the readers in
Namaste Technologies Inc. Management Discussion and Analysis Three and six months ended February 28, 2018
 Namaste Technologies Inc. Management Discussion and Analysis Three and six months ended 1 This Management s Discussion and Analysis ( MD&A ) has been prepared as at and should be read in conjunction with
Nurturing Shareholder Growth
 JULY 2018 Nurturing Shareholder Growth EMBLEM CORP. TSXV: EMC DISCLAIMER This documentation is a presentation (the Presentation ) of general background information about Emblem Corp s., ( Emblem ) activities
Condensed Interim Consolidated Financial Statements (Unaudited)
") Condensed Interim Consolidated Financial Statements (Unaudited) Eve & Co Incorporated For the three and nine month periods ended July 31, 2018 The accompanying unaudited condensed interim consolidated
Condensed Interim Consolidated Financial Statements (Unaudited) Eve & Co Incorporated For the three and nine month periods ended July 31, 2018 The accompanying unaudited condensed interim consolidated
Liberty Health Sciences Inc. (formerly, SecureCom Mobile Inc.)
") CONDENSED INTERIM CONSOLIDATED FINANCIAL STATEMENTS Liberty Health Sciences Inc. FOR THE THREE AND SIX MONTHS ENDED AUGUST 31, 2018 (in Canadian Dollars) NOTICE TO READER Under National Instrument 51-102,
CONDENSED INTERIM CONSOLIDATED FINANCIAL STATEMENTS Liberty Health Sciences Inc. FOR THE THREE AND SIX MONTHS ENDED AUGUST 31, 2018 (in Canadian Dollars) NOTICE TO READER Under National Instrument 51-102,
THC BIOMED INTL LTD.
 CAUTION REGARDING FORWARD LOOKING STATEMENTS This MD&A contains certain statements that constitute forward-looking statements (within the meaning of the Canadian securities legislation and the U.S. Private
A Powerful Strategic Combination
 A Powerful Strategic Combination Forward Looking Statements This Presentation (the Document ) by Aurora Cannabis Inc. ( Aurora or the Company ) has been compiled by management of the Company solely for
AURORA CANNABIS INC. MANAGEMENT S DISCUSSION AND ANALYSIS. For the three-month period ended September 30, 2017
 MANAGEMENT S DISCUSSION AND ANALYSIS For the three-month period ended September 30, 2017 This Management s Discussion and Analysis ( MD&A ) reports on the consolidated financial condition and operating
CRONOS GROUP INC. CONSOLIDATED FINANCIAL STATEMENTS
 CRONOS GROUP INC. CONSOLIDATED FINANCIAL STATEMENTS For the Years Ended December 31, 2017 and December 31, 2016 (Expressed in Canadian dollars) Cronos Group Inc. Consolidated Financial Statements For the
FIRST QUARTER REPORT TO SHAREHOLDERS
 eady Q1 FIRST QUARTER REPORT TO SHAREHOLDERS 12 WEEKS ENDING MARCH 24, 2018 2018 First Quarter Report to Shareholders Management s Discussion and Analysis Financial Results Notes to the Unaudited Interim
Condensed Interim Consolidated Financial Statements (In Canadian dollars) MEDRELEAF CORP. Three months ended June 30, 2017 and 2016 (Unaudited)
 MEDRELEAF CORP. Three months ended June 30, 2017 and 2016 (Unaudited)") Condensed Interim Consolidated Financial Statements (In Canadian dollars) MEDRELEAF CORP. Condensed Interim Consolidated Statements of Financial Position (In thousands of Canadian dollars) Assets June
Condensed Interim Consolidated Financial Statements (In Canadian dollars) MEDRELEAF CORP. Condensed Interim Consolidated Statements of Financial Position (In thousands of Canadian dollars) Assets June
EMERALD HEALTH THERAPEUTICS, INC.
 EMERALD HEALTH THERAPEUTICS, INC. MANAGEMENT DISCUSSION AND ANALYSIS For the three months ended March 31, 2018 Dated: May 28, 2018-1 - TABLE OF CONTENTS Forward-Looking Statements... 3 Overview... 5 Recent
Condensed Interim Consolidated Financial Statements
 Condensed Interim Consolidated Financial Statements (Expressed in Canadian Dollars) CONDENSED INTERIM CONSOLIDATED STATEMENTS OF FINANCIAL POSITION ASSETS September 30, December 31, 2017 2016 Current Cash
THIRD QUARTER REPORT TO UNITHOLDERS FOR THE NINE MONTHS ENDED SEPTEMBER 30, 2010
 THIRD QUARTER REPORT TO UNITHOLDERS FOR THE NINE MONTHS ENDED SEPTEMBER 30, 2010 W A J A X I N C O M E F U N D 2010 WAJAX INCOME FUND News Release TSX Symbol: WJX.UN WAJAX REPORTS SIGNIFICANTLY IMPROVED
The Second Cup Ltd. Management s Discussion and Analysis
 CAUTION REGARDING FORWARD-LOOKING STATEMENTS Certain statements in this ( MD&A ) may constitute forward-looking statements within the meaning of applicable securities legislation. The terms the Company,
StorageVault Canada Inc.
 StorageVault Canada Inc. (the Corporation ) Form 51-102F1 Management s Discussion and Analysis For Three Months Ended March 31, 2018 The following Management s Discussion and Analysis ( MD&A ) provides
BLUERUSH MEDIA GROUP CORP.
 This management s discussion and analysis of the consolidated financial condition and results of operation ( MD&A ) of BlueRush Media Group Corp. ( BlueRush or the Company ) should be read in conjunction
TSX:LEAF Investor Presentation October 2017
 TSX:LEAF Investor Presentation October 2017 Price Close (Oct 6, 2017): $9.80 Market Capitalization: $890 million Basic and F.D. Shares: 90.8/93.2 million Forward-Looking Information This Presentation contains
EMBLEM CORP. MANAGEMENT S DISCUSSION AND ANALYSIS For the year ended December 31, 2016
 MANAGEMENT S DISCUSSION AND ANALYSIS CAUTIONARY NOTE REGARDING FORWARD-LOOKING STATEMENTS This Management s Discussion and Analysis [ MD&A ] of Emblem Corp. [ Emblem or the Company ] contains forward-looking
Loblaw Companies Limited Reports 2013 First Quarter Results and Announces 9.1% Increase to Quarterly Common Share Dividend (1)
") NEWS RELEASE Loblaw Companies Limited Reports 2013 First Quarter Results and Announces 9.1% Increase to Quarterly Common Share Dividend (1) BRAMPTON, ONTARIO May 1, 2013 Loblaw Companies Limited (TSX:
NEWS RELEASE Loblaw Companies Limited Reports 2013 First Quarter Results and Announces 9.1% Increase to Quarterly Common Share Dividend (1) BRAMPTON, ONTARIO May 1, 2013 Loblaw Companies Limited (TSX:
CRS Electronics Inc. Management Discussion and Analysis. Fourth Quarter and the Year Ended December 31, Dated: April 16, 2010
 CRS Electronics Inc. - Management Discussion and Analysis Fourth Quarter and Year Ended December 31, 2009 CRS Electronics Inc. Management Discussion and Analysis Fourth Quarter and the Year Ended December
BLUERUSH MEDIA GROUP CORP.
 This management s discussion and analysis of the consolidated financial condition and results of operation ( MD&A ) of BlueRush Media Group Corp. ( BlueRush or the Company ) should be read in conjunction
StorageVault Canada Inc.
 StorageVault Canada Inc. (the Corporation ) Form 51-102F1 Management s Discussion and Analysis For Three Months Ended and Fiscal Year Ended December 31, 2017 The following Management s Discussion and Analysis
OrganiGram Holdings Inc. Management s Discussion and Analysis of Financial Condition and Results of Operations ( MD&A )
") OrganiGram Holdings Inc. Management s Discussion and Analysis of Financial Condition and Results of Operations ( MD&A ) For the Six-month Period Ended August 31, 2014 ORGANIGRAM HOLDINGS INC. MANAGEMENT
OrganiGram Holdings Inc. Management s Discussion and Analysis of Financial Condition and Results of Operations ( MD&A ) For the Six-month Period Ended August 31, 2014 ORGANIGRAM HOLDINGS INC. MANAGEMENT