Investments that stand the test of time
|
|
|
- Sharlene Leonard
- 5 years ago
- Views:
Transcription

1 ANNUAL REPORT FOR THE FINANCIAL YEAR ENDED 31 OCTOBER 2018 Investments that stand the test of time FORWARD Your Investments
2 FINANCIAL STATEMENTS FOR THE FINANCIAL YEAR ENDED 31 OCTOBER 2018
3 CONTENTS PAGE(S) INVESTORS' LETTER 1 MANAGER'S REPORT 2-9 Fund Objective and Policy Performance Data Market Review Fund Performance Portfolio Structure Market Outlook Investment Strategy Unit Holdings Statistics Soft Commissions and Rebates STATEMENT BY MANAGER 10 TRUSTEE'S REPORT 11 INDEPENDENT AUDITORS REPORT STATEMENT OF COMPREHENSIVE INCOME 16 STATEMENT OF FINANCIAL POSITION 17 STATEMENT OF CHANGES NET ASSETS ATTRIBUTABLE TO UNIT HOLDERS 18 STATEMENT OF CASH FLOWS 19 NOTES TO THE FINANCIAL STATEMENTS DIRECTORY 49
4 INVESTORS LETTER Dear Valued Investor, Thank you for your continued support and for the confidence that you have placed in us. We are pleased to share that CIMB-Principal Asset Management Berhad ( CIMB-Principal ) Malaysia has achieved RM54.02 billion in Asset under Management ( AUM ) as at September The Edge Thomson Reuters Lipper Malaysia Fund Awards 2018 Best Fund Over 5 Years, Equity Global - Malaysia : CIMB-Principal Global Titans Fund Best Fund Over 5 Years, Equity Asia Pacific ex Japan - Malaysia : CIMB-Principal Asian Equity Fund Best Fund Over 5 Years, Equity Asia Pacific ex Japan - Malaysia : CIMB Islamic Asia Pacific Equity Fund Best Fund Over 5 Years, Equity Malaysia Diversified - Malaysia : CIMB-Principal Equity Growth & Income Fund Best Fund Over 5 Years, Mixed Asset MYR Bal - Malaysia : CIMB-Principal Income Plus Balanced Fund Best Fund Over 3 Years, Equity Global - Malaysia : CIMB-Principal Global Titans Fund In addition, we received recognition from Fundsupermart.com for Fund House of the Year award and Recommended Unit Trust 2018/2019 awards for the following funds: CIMB-Principal Global Titans Fund CIMB-Principal Asia Pacific Dynamic Income Fund CIMB Islamic Asia Pacific Equity Fund CIMB-Principal Greater China Equity Fund CIMB-Principal PRS Plus Conservative CIMB-Principal PRS Plus Growth Our latest accomplishment is The Asset Triple A Private Banking, Wealth Management, Investment and Exchange-Traded Fund ( ETF ) Awards 2018 where we have been recognized for the Best Wealth Manager in Malaysia. These prestigious awards are a celebration of the trust that you have placed in us and testament to our capability in bringing potential value to your financial goals and needs. We look forward to serving you for many years to come and to the best of our ability. Thank you. Yours faithfully, for CIMB-Principal Asset Management Berhad Munirah Khairuddin Chief Executive Officer 1
5 MANAGER S REPORT FUND OBJECTIVE AND POLICY What is the investment objective of the Fund? The investment objective of the Fund is to achieve maximum capital appreciation over the long-term through all types of investments. Has the Fund achieved its objective? For the period under review, the Fund s total return declined by 4.07% while the benchmark declined by 4.98%. Nevertheless, the Fund s objective is still in place which is to provide capital growth over the long term. What are the Fund investment policy and principal investment strategy? The Fund may invest at least 70% of its Net Assets Value ("NAV") in equities, up to 28% of the Fund s NAV in other permissible investments and at least 2% of the Fund s NAV in liquid assets. In line with its objective, the investment policy and strategy of the Fund will focus on investment in shares of companies with growth potential. Fund category/type Equity/Aggressive Growth How long should you invest for? Recommended five (5) years or more Indication of short-term risk (low, moderate, high) High When was the Fund launched? Class MYR 28 September 1995 Class SGD 18 February 2016 What was the size of the Fund as at 31 October 2018? RM million ( million units) What is the Fund s benchmark? Financial Times Stock Exchange ( FTSE ) Bursa Malaysia Top 100 ( FBM100 ) Index. Note: The Fund s benchmark is for performance comparison purpose only. Investors should note that the risk profile of the Fund is not the same as the risk profile of the benchmark. What is the Fund distribution policy? The Manager has the discretion to distribute part or all of the Fund s distributable income. The distribution (if any) may vary from period to period depending on the investment objective and the performance of the Fund. What was the net income distribution for the financial year ended 31 October 2018? The Fund distributed a total net income of RM44.05 million to unit holders for the financial year ended 31 October NAV (Before) NAV (After) Distribution on 26 October Class MYR Class SGD Distribution on 22 November Class MYR
6 PERFORMANCE DATA Details of portfolio composition of the Fund for the last three financial years are as follows: % % % Quoted securities - Construction Consumer Products Consumer Products & Services Energy Finance Financial Services Health care Industrials Industrial Products & Services Infrastructure Project Companies ( IPC ) Plantation Property Real Estate Investment Trust ("REIT") Technology Telecommunication & Media Trading/Services Transportation & Logistics Utilities Cash and other net assets Performance details of the Fund for the last three financial years are as follows: NAV (RM Million) - Class MYR Class SGD Units in circulation (Million) - Class MYR Class SGD NAV per unit (RM) - Class MYR Class SGD Highest NAV per unit (RM) - Class MYR Class SGD Lowest NAV per unit (RM) - Class MYR Class SGD Total return (%) - Class MYR (4.07) Class SGD (4.10) Capital growth (%) - Class MYR (20.83) 7.41 (5.95) - Class SGD (4.32)
7 PERFORMANCE DATA (CONTINUED) Performance details of the Fund for the last three financial years are as follows (continued): Income distribution (%) - Class MYR Class SGD Management Expense Ratio ("MER") (%) ^ Portfolio Turnover Ratio ("PTR") (times) # ^ The Fund's MER decrease from 1.67% to 1.65% due to decrease in expenses during the financial year under review. # The Fund's PTR increased to 1.01 times from 0.89 as there was more trading activity for the financial year under review Gross/Net distribution per unit (sen) Distribution on 26 October Class MYR Class SGD Distribution on 22 November Class MYR Distribution on 24 October Class MYR % % % % % Annual total return - Class MYR (4.07) (4.58) (Launch date: 28 September 1995) Since inception to % Annual total return - Class SGD (4.10) 4.51 (Launch date: 18 February 2016) Past performance is not necessarily indicative of future performance and that unit prices and investment returns may go down, as well as up. All performance figures for the financial year have been extracted from Lipper. 4
8 MARKET REVIEW (1 NOVEMBER 2017 TO 31 OCTOBER 2018) The FBM100 Index fell points or 5.0% to 11, points over the financial year under review. The FTSE Bursa Malaysia Kuala Lumpur Composite Index ( FBMKLCI ) fell 1.7% in November 2017 as construction stocks underperformed on worries of foreign contractors dominance after a change in Mass Rapid Transit ( MRT ) 3 Project Delivery Partner ( PDP ) format to turnkey contractor with mandatory funding. The FBMKLCI then recovered by 4.60% in December 2017 on the back of window dressing activities, driven by banking and technology stocks. For 2017, net foreign inflow amounted to RM10.3 billion. The FBMKLCI started on a positive note in 2018 by rising 4.0% in January 2018 on the back of outperformance in Permodalan Nasional Berhad ( PNB ) related companies. The buoyant market was also aided by the strengthening of Ringgit Malaysia ( RM ) by 3.90% and the increase in crude oil prices by 3.3% during the month. Foreign investors were net buyers of RM3.4 billion in January February 2018 was a volatile month as investors began re-pricing more and earlier interest rate hikes in the United States ( US ), on the back of higher inflation expectations. In line with the global rout, the FBMKLCI corrected points or 0.7% to 1, points. The FBMKLCI had fallen sharply from a high of 1,870 points (2 February 2018) to a low of 1,812 points (6 February 2018), before recouping most its losses by month end. Consumer Price Inflation ( CPI ) eased in January 2018 to 2.7% (3.5% year-on-year ( y-o-y ) in December 2017) due to currency gains and a higher base, as fuel prices and electricity tariffs were raised a year ago. In February 2018, foreign investors net sold about RM1.1 billion. March 2018 was a positive month as the FBMKLCI added 7.26 points or 0.4% to 1, points despite rising concerns of escalating US-China trade disputes. Large caps continued to outperform the broader market and small caps. The rise continued into April 2018 with the FBMKLCI reaching a high of 1, points on 19 April 2018, before losing momentum to close at 1, points. In April 2018, the RM depreciated 1.5%, while the 10-year MGS rose 19 basis points to 4.13%. Construction and finance outperformed during the month. The market sold off in May 2018 with the FBMKLCI falling 6.9%, rattled by headline news of a higher RM1 trillion national debt burden, concerns about the fiscal position and sovereign credit rating following the zero-rating of the Good and Services Tax ( GST ), cancellation of mega infrastructure projects and the sanctity of toll roads concession agreements. Sentiment was further dampened by the weak first quarter corporate earnings season. Meanwhile, global trade tensions were back in focus, and there was fear of contagion from Italian politics. These were happening against a backdrop of Central Banks plans to normalise monetary policies, leading to worries of possible policy missteps. The sell-off continued into June 2018 on the back of heavy foreign selling, with the FBMKLCI falling 2.8% or 49 points to close at 1,691 points, as investors repriced policy risk. After two consecutive months of net foreign selling post 14 th General Election ( GE14 ), the FBMKLCI ended higher by 5.2% or 87 points to close at 1,779 points in July 2018, as local investors started to bargain-hunt. Foreigners continued to sell in the market with a total net outflow of RM1.7 billion, which is much lower than the RM4.9 billion in June The recovery continued into August 2018 with the FBMKLCI rising 2.0% or 35 points to close at 1,819 points, which is just 27 points lower than the last trading day prior to GE14. Foreign selling tapered off to just RM97 million during the month. 5
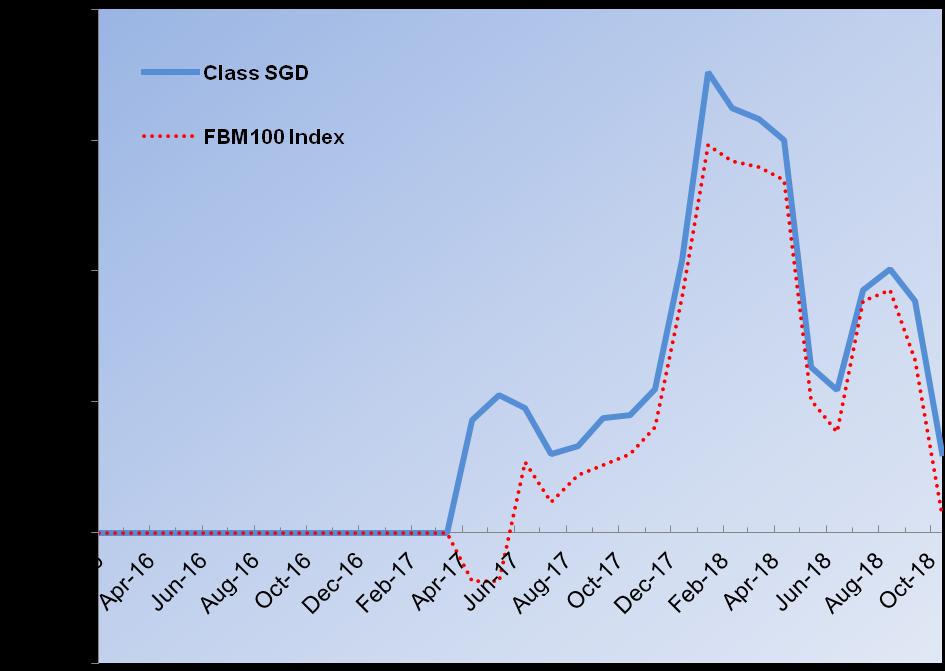
9 MARKET REVIEW (1 NOVEMBER 2017 TO 31 OCTOBER 2018) (CONTINUED) September 2018 saw the FBMKLCI succumbed to selling pressure as investors locked in gains made in the previous month on worries that the US200 billion trade tariff imposed on China may impact global growth and Emerging Market ( EM ) currencies. The downtrend was exacerbated by the financial crisis in Argentina which led investors to flee the peso, causing worry of a contagion effect in emerging markets. Sentiment in the local bourse was further affected by the announcement of the cancellation of 3 China-backed projects (the East Coast Rail Link ( ECRL ) and the 2 gas pipeline projects estimated at USD23 billion and the deferment of Kuala Lumpur-Singapore High-Speed Rail ( HSR ) to September 2020, which sent the Construction Index tumbling by 5.38% month-on-month ( m-o-m ). The FBMKLCI ended October 2018 lower by 4.68% or 84 points to close at 1,709 points. On a yearto-date ( YTD ) basis, the FBMKLCI is lower by 4.88%. The release of the mid-term review of the austere 11 th Malaysia Plan offered no reprieve as investors further locked in gains made due to rising economic risk and uncertainties. Local investors were concerned that the government would unveil new taxes and announce higher fiscal deficits for Budget Telecommunication companies were the biggest losers on the back of regulatory risk, while construction sector underperformed on MRT Line 2 project cost cut. During the month, the MYR weakened by 1.1% while the 10Y Malaysian Government Securities ( MGS ) rose by 10 basis points ( bps ) to 4.08%. Brent crude oil fell to USD75 per barrel, down by 9% m-o-m. FUND PERFORMANCE Class MYR 1 year to years to years to Since inception to % % % % Income Capital (20.83) (20.03) (32.18) 3.63 Total Return (4.07) Benchmark (4.98) 3.27 (5.44) Average Total Return (4.07) For the financial year under review, the Fund fell 4.07%, outperforming the benchmark by 0.91%. Since Class SGD 1 year to inception to % % Income Capital (4.32) (1.68) Total Return (4.10) 4.08 Benchmark (4.98) 2.36 Average Total Return (4.10) 1.75 For the financial year under review, the Fund fell 4.10%, outperforming the benchmark by 0.88%. 6
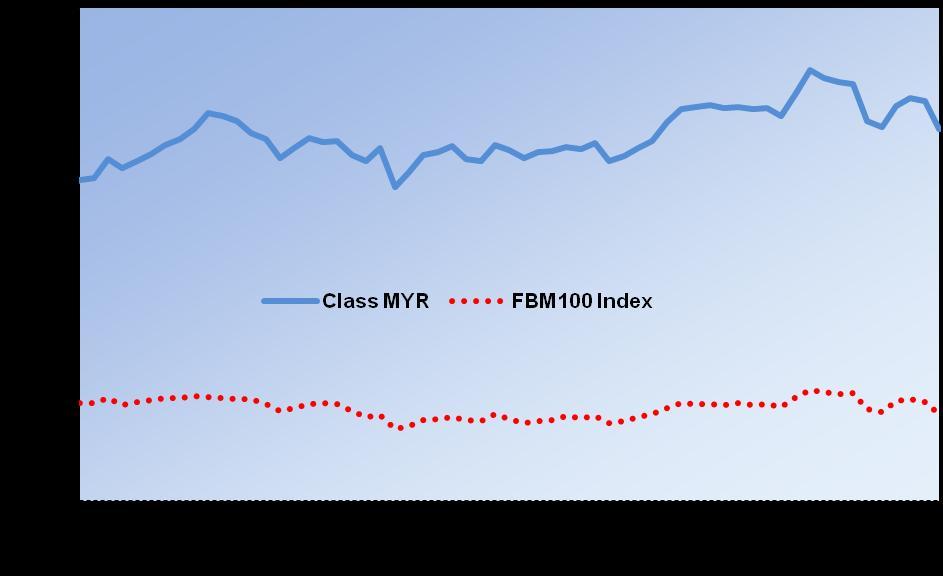
10 FUND PERFORMANCE (CONTINUED) CLASS MYR CLASS SGD 7
11 FUND PERFORMANCE (CONTINUED) Changes in NAV Class MYR Changes % NAV (RM Million) (13.65) NAV/unit (RM) (20.86) Class SGD Changes % NAV (RM Million) >100 NAV/unit (RM) (4.47) NAV of the Fund declined by 13.65% for the financial year under review due to negative investment performance while NAV per unit fell by 20.86% due to income distribution and negative investment performance. Performance data represents the combined income and capital return as a result of holding units in the Fund for the specified length of time, based on NAV to NAV price. The performance data assumes that all earnings from the Fund are reinvested and are net of management and trustee fees. Past performance is not reflective of future performance and income distributions are not guaranteed. Unit prices and income distributions, if any, may fall and rise. All performance figures for the financial year have been extracted from Lipper. PORTFOLIO STRUCTURE Asset allocation (% of NAV) Quoted securities Cash and other net assets TOTAL Asset allocation was reduced from 97.65% as at 31 October 2017 to 84.15% as at 31 October 2018 due to rising concerns of escalating US-China trade disputes and the potential slowdown in the global economy. A minimal level of liquid assets was maintained primarily for redemption purposes. MARKET OUTLOOK* We continue to reiterate our short-term cautious stance on the domestic market for the rest of 2018 and in first quarter of We deem the recent Budget as progressive for the future but having a neutral impact to the market in the short-term. Targeted spending on the bottom 40% of households with monthly income of RM3,900 and below ( B40 ) Group and tax refunds will be positive for the consumer sector while higher fiscal deficits will put the government in a position with limited safety net in the event of a global meltdown. The focus of domestic investors will now turn to global events, especially the US Mid-Term Election and the US Federal Reserve (the Fed ) future interest rate trajectory. * This market outlook does not constitute an offer, invitation, commitment, advice or recommendation to make a purchase of any investment. The information given in this article represents the views of CIMB-Principal or based on data obtained from sources believed to be reliable by CIMB-Principal. Whilst every care has been taken in preparing this, CIMB-Principal makes no guarantee, representation or warranty and is under no circumstances liable for any loss or damage caused by reliance on, any opinion, advice or statement made in this market outlook. 8
12 INVESTMENT STRATEGY On the back of the above uncertainties, we reiterate our capital preservation investment strategy with preference for big cap Government-Linked Companies ( GLCs ) and companies with strong fundamentals and solid cash flow and dividends in sectors such as Utilities & Renewable Energy, and Industrials. We are also positive on exporters as US-China trade conflicts may benefit technologyrelated and Electronics Manufacturing Services ( EMS ) players in Malaysia. UNIT HOLDINGS STATISTICS Breakdown of unit holdings by size as at 31 October 2018 are as follows: CLASS MYR No. of unit holders No. of units held % of units held Size of unit holdings (units) (million) 5,000 and below 53, ,001-10,000 1, ,001-50,000 4, , ,000 1, ,001 and above Total 60, CLASS SGD Size of unit holdings (units) No. of unit holders No. of units held % of units held (million) 5,000 and below ,001-10, ,001-50, , , ,001 and above Total SOFT COMMISSIONS AND REBATES CIMB-Principal Asset Management Berhad (the Manager ) and the Trustee (including their officers) will not retain any form of rebate or soft commission from, or otherwise share in any commission with, any broker in consideration for directing dealings in the investments of the Funds unless the soft commission received is retained in the form of goods and services such as financial wire services and stock quotations system incidental to investment management of the Funds. All dealings with brokers are executed on best available terms. During the financial year under review, the Manager and Trustee did not receive any rebates from the brokers or dealers but have retained soft commission in the form of goods and services such as financial wire services and stock quotations system incidental to investment management of the Funds. 9
13 STATEMENT BY MANAGER TO THE UNIT HOLDERS OF We, being the Director of CIMB-Principal Asset Management Berhad (the Manager ), do hereby state that, in the opinion of the Manager, the accompanying audited financial statements set out on pages 16 to 48 are drawn up in accordance with the provisions of the Deeds and give a true and fair view of the financial position of the Fund as at 31 October 2018 and of its financial performance, changes in net assets attributable to unit holders and cash flows for the financial year then ended in accordance with the provisions of the Malaysian Financial Reporting Standards ( MFRS ) and International Financial Reporting Standards ( IFRS ). For and on behalf of the Manager CIMB-Principal Asset Management Berhad (Company No.: K) MUNIRAH KHAIRUDDIN Chief Executive Officer/Executive Director ALEJANDRO ECHEGORRI Executive Director Kuala Lumpur 14 December
14 TRUSTEE S REPORT TO THE UNIT HOLDERS OF We have acted as Trustee of CIMB-Principal Malaysia Equity Fund (the Fund ) for the financial year ended 31 October To the best of our knowledge, CIMB-Principal Asset Management Berhad (the Manager ), has operated and managed the Fund in accordance with the following:- a) limitations imposed on the investment powers of the Manager and the Trustee under the Deeds, the Securities Commission s Guidelines on Unit Trust Funds, the Capital Markets and Services Act 2007 and other applicable laws; b) valuation/pricing is carried out in accordance with the Deeds and any regulatory requirements; and c) creation and cancellation of units are carried out in accordance with the Deeds and any regulatory requirements. During this financial year, a total distribution of sen per unit (gross) for MYR class and 1.00 sen per unit (gross) for SGD class respectively have been distributed to the unit holders of the Fund. We are of the view that the distributions are not inconsistent with the objective of the Fund. For HSBC (Malaysia) Trustee Berhad Tan Bee Nie Head, Trustee Operations Kuala Lumpur 14 December
15 INDEPENDENT AUDITORS REPORT TO THE UNIT HOLDERS OF (Incorporated in Malaysia) REPORT ON THE AUDIT OF THE FINANCIAL STATEMENTS Our opinion In our opinion, the financial statements of CIMB-Principal Malaysia Equity Fund (the Fund ) give a true and fair view of the financial position of the Fund as at 31 October 2018, and of its financial performance and its cash flows for the year then ended in accordance with Malaysian Financial Reporting Standards and International Financial Reporting Standards. What we have audited We have audited the financial statements of the Fund, which comprise the statement of financial position as at 31 October 2018, and the statement of comprehensive income, statement of changes in net assets attributable to unit holders and statement of cash flows for the year then ended, and notes to the financial statements, including a summary of significant accounting policies, as set out on pages 16 to 48. Basis for opinion We conducted our audit in accordance with approved standards on auditing in Malaysia and International Standards on Auditing. Our responsibilities under those standards are further described in the Auditors responsibilities for the audit of the financial statements section of our report. We believe that the audit evidence we have obtained is sufficient and appropriate to provide a basis for our opinion. Independence and other ethical responsibilities We are independent of the Fund in accordance with the By-Laws (on Professional Ethics, Conduct and Practice) of the Malaysian Institute of Accountants ( By-Laws ) and the International Ethics Standards Board for Accountants Code of Ethics for Professional Accountants ( IESBA Code ), and we have fulfilled our other ethical responsibilities in accordance with the By-Laws and the IESBA Code. 12
16 INDEPENDENT AUDITORS REPORT TO THE UNIT HOLDERS OF (CONTINUED) (Incorporated in Malaysia) REPORT ON THE FINANCIAL STATEMENTS (CONTINUED) Information other than the financial statements and auditors report thereon The Manager of the Fund is responsible for the other information. The other information comprises Manager s report but does not include the financial statements of the Fund and our auditors report thereon. Our opinion on the financial statements of the Fund does not cover the other information and we do not express any form of assurance conclusion thereon. In connection with our audit of the financial statements of the Fund, our responsibility is to read the other information and, in doing so, consider whether the other information is materially inconsistent with the financial statements of the Fund or our knowledge obtained in the audit or otherwise appears to be materially misstated. If, based on the work we have performed, we conclude that there is a material misstatement of this other information, we are required to report that fact. We have nothing to report in this regard. Responsibilities of the Manager for the financial statements The Manager of the Fund is responsible for the preparation of the financial statements of the Fund that give a true and fair view in accordance with Malaysian Financial Reporting Standards and International Financial Reporting Standards. The Manager is also responsible for such internal control as the Manager determines is necessary to enable the preparation of financial statements of the Fund that are free from material misstatement, whether due to fraud or error. In preparing the financial statements of the Fund, the Manager is responsible for assessing the Fund s ability to continue as a going concern, disclosing, as applicable, matters related to going concern and using the going concern basis of accounting unless the Manager either intends to liquidate the Fund or to cease operations, or has no realistic alternative but to do so. 13
17 INDEPENDENT AUDITORS REPORT TO THE UNIT HOLDERS OF (CONTINUED) (Incorporated in Malaysia) REPORT ON THE FINANCIAL STATEMENTS (CONTINUED) Auditors responsibilities for the audit of the financial statements Our objectives are to obtain reasonable assurance about whether the financial statements of the Fund as a whole are free from material misstatement, whether due to fraud or error, and to issue an auditors report that includes our opinion. Reasonable assurance is a high level of assurance, but is not a guarantee that an audit conducted in accordance with approved standards on auditing in Malaysia and International Standards on Auditing will always detect a material misstatement when it exists. Misstatements can arise from fraud or error and are considered material if, individually or in the aggregate, they could reasonably be expected to influence the economic decisions of users taken on the basis of these financial statements As part of an audit in accordance with approved standards on auditing in Malaysia and International Standards on Auditing, we exercise professional judgement and maintain professional scepticism throughout the audit. We also: (a) (b) (c) (d) (e) Identify and assess the risks of material misstatement of the financial statements of the Fund, whether due to fraud or error, design and perform audit procedures responsive to those risks, and obtain audit evidence that is sufficient and appropriate to provide a basis for our opinion. The risk of not detecting a material misstatement resulting from fraud is higher than for one resulting from error, as fraud may involve collusion, forgery, intentional omissions, misrepresentations, or the override of internal control. Obtain an understanding of internal control relevant to the audit in order to design audit procedures that are appropriate in the circumstances, but not for the purpose of expressing an opinion on the effectiveness of the Fund s internal control. Evaluate the appropriateness of accounting policies used and the reasonableness of accounting estimates and related disclosures made by the Manager. Conclude on the appropriateness of the Manager s use of the going concern basis of accounting and, based on the audit evidence obtained, whether a material uncertainty exists related to events or conditions that may cast significant doubt on the Fund s ability to continue as a going concern. If we conclude that a material uncertainty exists, we are required to draw attention in our auditors report to the related disclosures in the financial statements of the Fund or, if such disclosures are inadequate, to modify our opinion. Our conclusions are based on the audit evidence obtained up to the date of our auditors report. However, future events or conditions may cause the Fund to cease to continue as a going concern. Evaluate the overall presentation, structure and content of the financial statements of the Fund, including the disclosures, and whether the financial statements represent the underlying transactions and events in a manner that achieves fair presentation. 14
18 INDEPENDENT AUDITORS REPORT TO THE UNIT HOLDERS OF (CONTINUED) (Incorporated in Malaysia) REPORT ON THE AUDIT OF THE FINANCIAL STATEMENTS (CONTINUED) Auditors responsibilities for the audit of the financial statements (continued) We communicate with the Manager regarding, among other matters, the planned scope and timing of the audit and significant audit findings, including any significant deficiencies in internal control that we identify during our audit. OTHER MATTERS This report is made solely to the unit holders of the Fund and for no other purpose. We do not assume responsibility to any other person for the content of this report. PRICEWATERHOUSECOOPERS PLT LLP LCA & AF 1146 Chartered Accountants Kuala Lumpur 14 December
19 STATEMENT OF COMPREHENSIVE INCOME FOR THE FINANCIAL YEAR ENDED 31 OCTOBER Note RM RM INVESTMENT (LOSS)/INCOME Dividend income 7,841,621 9,022,322 Interest income from deposits with licensed financial institutions 701, ,490 Net (loss)/gain on financial assets at fair value through profit or loss 8 (12,308,302) 17,063,332 Net foreign exchange gain/(loss) 57,019 (70) (3,708,596) 26,765,074 EXPENSES Management fee 4 3,758,538 4,251,356 Trustee s fee 5 125, ,712 Audit fee 15,300 14,500 Tax agent s fee 5,800 3,000 Transaction costs 1,330,950 1,398,707 Other expenses 223, ,284 5,458,967 6,220,559 (LOSS)/PROFIT BEFORE FINANCE COST AND TAXATION (9,167,563) 20,544,515 Finance costs (excluding increase in net assets attributable to unit holders): - Class MYR (44,047,100) - - Class SGD (10,712) - 6 (44,057,812) - (LOSS)/PROFIT BEFORE TAXATION (53,225,375) 20,544,515 Taxation (3,032) (DECREASE)/ INCREASE IN NET ASSETS ATTRIBUTABLE TO UNIT HOLDERS (53,224,890) 20,541,483 (Decrease)/ Increase in net assets attributable to unit holders are made up as follows: Realised amount (37,285,652) 15,402,281 Unrealised amount (15,939,238) 5,139,202 (53,224,890) 20,541,483 The accompanying notes to the financial statements form an integral part of the audited financial statements. 16
20 STATEMENT OF FINANCIAL POSITION AS AT 31 OCTOBER Note RM RM ASSETS Cash and cash equivalents 9 37,091,543 14,048,517 Financial assets at fair value through profit or loss 8 193,927, ,896,537 Amount due from stockbrokers 381,320 1,341,156 Amount due from Manager 152, ,904 Dividends receivable 166, ,344 TOTAL ASSETS 231,719, ,854,458 LIABILITIES Amount due to stockbrokers - 1,525,960 Amount due to Manager 533,795 7,808,952 Accrued management fee 300, ,493 Amount due to Trustee 10,012 11,483 Distribution payable 408, Tax payable Other payables and accruals 17,100 59,588 TOTAL LIABILITIES (EXCLUDING NET ASSETS ATTRIBUTABLE TO UNIT HOLDERS) 1,269,400 9,751,033 NET ASSET VALUE OF THE FUND 230,450, ,103,425 NET ASSETS ATTRIBUTABLE TO UNIT HOLDERS 230,450, ,103,425 REPRESENTED BY: FAIR VALUE OF OUTSTANDING UNITS (RM) - Class MYR 227,125, ,036,013 - Class SGD 3,324,495 67, ,450, ,103,425 NUMBER OF UNITS IN CIRCULATION (UNITS) - Class MYR 230,809, ,536,787 - Class SGD 1,071,679 20, ,881, ,557,547 NET ASSET VALUE PER UNIT (RM) - Class MYR Class SGD NET ASSET VALUE PER UNIT IN RESPECTIVE CURRENCIES - Class MYR RM RM Class SGD SGD SGD The accompanying notes to the financial statements form an integral part of the audited financial statements. 17
21 STATEMENT OF CHANGES IN NET ASSETS ATTRIBUTABLE TO UNIT HOLDERS FOR THE FINANCIAL YEAR ENDED 31 OCTOBER RM RM NET ASSETS ATTRIBUTABLE TO UNIT HOLDERS AT THE BEGINNING OF THE FINANCIAL YEAR 263,103, ,614,701 Movement due to units created and cancelled during the financial year: - Creation of units from applications - Class MYR 9,878,596 13,090,912 - Class SGD 3,793, ,277 13,671,810 13,364,189 - Creation of units from distributions - Class MYR 43,202, Class SGD 1,348-43,203, Cancellation of units - Class MYR (35,971,985) (61,211,229) - Class SGD (331,846) (205,719) (36,303,831) (61,416,948) (Decrease)/ Increase in net assets attributable to unit holders during the financial year: (53,224,890) 20,541,483 NET ASSETS ATTRIBUTABLE TO UNIT HOLDERS AT THE END OF THE FINANCIAL YEAR 230,450, ,103,425 The accompanying notes to the financial statements form an integral part of the audited financial statements. 18
22 STATEMENT OF CASH FLOWS FOR THE FINANCIAL YEAR ENDED 31 OCTOBER Note RM RM CASH FLOWS FROM OPERATING ACTIVITIES Proceeds from disposal of quoted securities 278,640, ,524,098 Purchase of quoted securities (229,876,534) (241,432,498) Dividend income received 7,892,646 8,970,566 Interest income received from deposits with licensed financial institutions 701, ,490 Management fee paid (3,802,667) (4,274,072) Trustee s fee paid (126,756) (142,469) Payments for other fees and expenses (286,682) (427,203) Net realised foreign exchange loss (125) (204) Tax refund received - 81,891 Net cash generated from operating activities 53,141,260 25,979,599 CASH FLOWS FROM FINANCING ACTIVITIES Cash proceeds from units created 13,882,977 13,273,600 Payments for cancellation of units (43,579,303) (54,052,779) Distribution paid (446,108) (394,451) Net cash used in financing activities (30,142,434) (41,173,630) Net increase/(decrease) in cash and cash equivalents 22,998,826 (15,194,031) Effects of foreign exchange differences 44, Cash and cash equivalents at the beginning of the financial year 14,048,517 29,242,414 Cash and cash equivalents at the end of the financial year 9 37,091,543 14,048,517 Cash and cash equivalents comprises of: Deposits with licensed financial institutions 33,328,666 13,960,862 Bank balances 3,762,877 87,655 Cash and cash equivalents at the end of the financial year 9 37,091,543 14,048,517 The accompanying notes to the financial statements form an integral part of the audited financial statements. 19
23 NOTES TO THE FINANCIAL STATEMENTS FOR THE FINANCIAL YEAR ENDED 31 OCTOBER THE FUND, THE MANAGER AND ITS PRINCIPAL ACTIVITIES CIMB-Principal Malaysia Equity Fund (the Fund ) was constituted pursuant to a Deed dated 11 July 2005 and is now governed by a Principal Master Deed dated 15 May 2008, a Fourth Supplemental Master Deed dated 18 March 2009, a Fifth Supplemental Master Deed dated 16 July 2009, a Thirteenth Supplemental Master Deed dated 26 June 2012 and an Eighteenth Supplemental Master Deed dated 25 March 2015 all executed between the Management Company and the Universal Trustee (Malaysia) Berhad (hereinafter known as the "Previous Trustee"), a Seventeenth Supplemental Master Deed dated 19 March 2015 entered into between the Management Company, the previous Trustee and the Trustee, in respect of a change in trustee to the Fund (hereinafter collectively the "Initial Deed") and a Principal Master Deed dated 10 April 2015 (collectively referred to as the Deeds ), between CIMB- Principal Asset Management Berhad (the Manager ) and HSBC (Malaysia) Trustee Berhad (the Trustee ). The Fund may invest at least 70% of its NAV in equities and up to 28% of the Fund s NAV in other permissible investments and at least 2% of the Fund s NAV in liquid assets. In line with its objective, the investment policy and strategy of the Fund will focus on investment in shares of companies with growth potential. All investments are subjected to the Securities Commission Malaysia ( SC ) Guidelines on Unit Trust Funds, SC requirements, the Deeds, except where exemptions or variations have been approved by the SC, internal policies and procedures and the Fund s objective. The Manager, a company incorporated in Malaysia, is jointly owned by CIMB Group Sdn Bhd and Principal International (Asia) Limited. The principal activities of the Manager are the establishment and management of unit trust funds and fund management activities. 2. SUMMARY OF SIGNIFICANT ACCOUNTING POLICIES The following accounting policies have been used consistently in dealing with items which are considered material in relation to the financial statements: (a) Basis of preparation The financial statements have been prepared in accordance with the provisions of the MFRS and IFRS. The financial statements have been prepared under the historical cost convention, as modified by financial assets at fair value through profit or loss. The preparation of financial statements in conformity with MFRS and IFRS requires the use of certain critical accounting estimates and assumptions that affect the reported amounts of assets and liabilities and disclosure of contingent assets and liabilities at the date of the financial statements, and the reported amounts of revenues and expenses during the reported year. It also requires the Manager to exercise their judgement in the process of applying the Fund s accounting policies. Although these estimates and assumptions are based on the Manager s best knowledge of current events and actions, actual results may differ. The areas involving a higher degree of judgement or complexity, or areas where assumptions and estimates are significant to the financial statements are disclosed in Note 2(m). 20
24 2. SUMMARY OF SIGNIFICANT ACCOUNTING POLICIES (CONTINUED) (a) Basis of preparation (continued) Standards, amendments to published standards and interpretations to existing standards that are effective: The Fund has applied the following amendments for the first time for the financial year beginning 1 November 2017: Amendments to MFRS 107 Statement of Cash Flows - Disclosure Initiative (effective from 1 January 2017) introduce an additional disclosure on changes in liabilities arising from financing activities. The adoption of these amendments did not have any impact on the current financial year or any prior year and is not likely to affect future years. The standards, amendments to published standards and interpretations to existing standards that are applicable to the Fund but not yet effective and have not been early adopted are as follows: (i) Financial year beginning on/after 1 November 2018 MFRS 9 Financial Instruments (effective from 1 January 2018) will replace MFRS 139 Financial Instruments: Recognition and Measurement. MFRS 9 retains but simplifies the mixed measurement model in MFRS 139 and establishes three primary measurement categories for financial assets: amortised cost, fair value through profit or loss and fair value through other comprehensive income OCI. The basis of classification depends on the entity s business model and the contractual cash flow characteristics of the financial asset. Investments in equity instruments are always measured at fair value through profit or loss with an irrevocable option at inception to present changes in fair value in OCI (provided the instrument is not held for trading). A debt instrument is measured at amortised cost only if the entity is holding it to collect contractual cash flows and the cash flows represent principal and interest. For liabilities, the standard retains most of the MFRS 139 requirements. These include amortised cost accounting for most financial liabilities, with bifurcation of embedded derivatives. The main changes are: For financial liabilities classified as FVTPL, the fair value changes due to own credit risk should be recognized directly to OCI. There is no subsequent recycling to profit or loss. When a financial liability measured at amortised cost is modified without this resulting in derecognition, a gain or loss, being the difference between the original contractual cash flows and the modified cash flows discounted at the original effective interest rate, should be recognized immediately in profit or loss. MFRS 9 introduces an expected credit loss ( ECL ) model on impairment that replaces the incurred loss impairment model used in MFRS 139. The expected credit loss model is forward-looking and eliminates the need for a trigger event to have occurred before credit losses are recognised. 21
25 2. SUMMARY OF SIGNIFICANT ACCOUNTING POLICIES (CONTINUED) (a) Basis of preparation (continued) (i) Financial year beginning on/after 1 November 2018 (continued) The Fund has reviewed its financial assets and liabilities and has assessed the following impact from the adoption of the new standard on 1 November 2018: There will be no impact on the Fund s accounting for financial assets as the Fund s equity investments currently measured at fair value through profit or loss will continue to be measured on the same basis under MFRS 9. There will be no impact on the Fund s accounting for financial liabilities as the new requirements only affect the accounting for financial liabilities that are designated at fair value through profit or loss and the Fund does not have any such liabilities. The new impairment model requires the recognition of impairment provisions based on ECL rather than only incurred credit losses as is the case under MFRS 139. It applies to financial assets classified at amortised cost. Based on the assessments undertaken to date, the Fund does not expect any loss allowance to be recognised upon adoption of MFRS 9. (b) Financial assets and financial liabilities Classification The Fund designates its investment in quoted securities as financial assets at fair value through profit or loss at inception. Financial assets are designated at fair value through profit or loss when they are managed and their performance evaluated on a fair value basis. Loans and receivables are non-derivative financial assets with fixed or determinable payments that are not quoted in an active market and have been included in current assets. The Fund s loans and receivables comprise cash and cash equivalents, amount due from stockbrokers, amount due from Manager and dividends receivable. Financial liabilities are classified according to the substance of the contractual arrangements entered into and the definitions of a financial liability. The Fund classifies amount due to stockbrokers, amount due to Manager, accrued management fee, amount due to Trustee, distribution payable, and other payables and accruals as other financial liabilities. Recognition and measurement Regular purchases and sales of financial assets are recognised on trade-date, the date on which the Fund commits to purchase or sell the asset. Investments are initially recognised at fair value. Transaction costs are expensed in the statement of comprehensive income. Financial liabilities, within the scope of MFRS 139, are recognised in the statement of financial position when, and only when, the Fund becomes a party to the contractual provisions of the financial instrument. 22
26 2. SUMMARY OF SIGNIFICANT ACCOUNTING POLICIES (CONTINUED) (b) Financial assets and financial liabilities (continued) Recognition and measurement (continued) Financial assets are derecognised when the rights to receive cash flows from the investments have expired or have been transferred and the Fund has transferred substantially all risks and rewards of ownership. Financial liabilities are derecognised when it is extinguished, i.e. when the obligation specified in the contract is discharged or cancelled or expired. Unrealised gains or losses arising from changes in the fair value of the financial assets at fair value through profit or loss are presented in the statement of comprehensive income within net gain or loss on financial assets at fair value through profit or loss in the financial year which they arise. Dividend income from financial assets at fair value through profit or loss is recognised in the statement of comprehensive income as part of gross dividend income when the Fund s right to receive payments is established. Quoted securities in Malaysia are valued at the last done market price quoted on Bursa Malaysia Securities Bhd ( Bursa Securities ) at the date of the statement of financial position. If a valuation based on the market price does not represent the fair value of the quoted securities, for example during abnormal market conditions or when no market price is available, including in the event of a suspension in the quotation of the quoted securities for a period exceeding 14 days, or such shorter period as agreed by the Trustee, then the quoted securities are valued as determined in good faith by the Manager, based on the methods or bases approved by the Trustee after appropriate technical consultation. Deposits with licensed financial institutions are stated at cost plus accrued interest calculated on the effective interest method over the period from the date of placement to the date of maturity of the respective deposits. Loans and receivables and other financial liabilities are subsequently carried at amortised cost using the effective interest method. Impairment for assets carried at amortised costs For assets carried at amortised cost, the Fund assesses at the end of the reporting year whether there is objective evidence that a financial asset or group of financial assets is impaired. A financial asset or a group of financial assets is impaired and impairment losses are incurred only if there is objective evidence of impairment as a result of one or more events that occurred after the initial recognition of the asset (a loss event ) and that loss event (or events) has an impact on the estimated future cash flows of the financial asset or group of financial assets that can be reliably estimated. The amount of the loss is measured as the difference between the asset s carrying amount and the present value of estimated future cash flows (excluding future credit losses that have not been incurred) discounted at the financial asset s original effective interest rate. The asset s carrying amount is reduced and the amount of the loss is recognised in statement of comprehensive income. If loans and receivables has a variable interest rate, the discount rate for measuring any impairment loss is the current effective interest rate determined under the contract. 23
27 2. SUMMARY OF SIGNIFICANT ACCOUNTING POLICIES (CONTINUED) (b) Financial assets and financial liabilities (continued) Impairment for assets carried at amortised costs (continued) As a practical expedient, the Fund may measure impairment on the basis of an instrument s fair value using an observable market price. If, in a subsequent financial year, the amount of the impairment loss decreases and the decrease can be related objectively to an event occurring after the impairment was recognised (such as an improvement in the debtor s credit rating), the reversal of the previously recognised impairment loss is recognised in statement of comprehensive income. When an asset is uncollectible, it is written off against the related allowance account. Such assets are written off after all the necessary procedures have been completed and the amount of the loss has been determined. (c) Income recognition Dividend income is recognised on the ex-dividend date when the right to receive payment is established. Interest income from deposits with licensed financial institutions is recognised on a time proportionate basis using effective interest rate method on an accrual basis. Realised gain or loss on disposal of quoted securities is accounted for as the difference between the net disposal proceeds and the carrying amount of quoted securities, determined on a weighted average cost basis. (d) Foreign Currency Functional and presentation currency Items included in the financial statements of the Fund are measured using the currency of the primary economic environment in which the Fund operates (the functional currency ). The financial statements are presented in Ringgit Malaysia ( RM ), which is the Fund s functional and presentation currency. Due to mixed factors in determining the functional currency of the Fund, the Manager has used its judgement to determine the functional currency that most faithfully represents the economic effects of the underlying transactions, events and conditions and have determined the functional currency to be in RM primarily due to the following factors: i) Significant portion of the fund s units are denominated in RM; ii) Significant portion of the fund s NAV is invested in investment denominated in RM; and iii) All of the Fund s expenses are denominated in RM. Transactions and balances Foreign currency transactions are translated into the functional currency using the exchange rates prevailing at the dates of the transactions or valuation where items are remeasured. Foreign exchange gains and losses resulting from the settlement of such transactions and from the translation at year-end exchange rates of monetary assets and liabilities denominated in foreign currencies are recognised in statement of comprehensive income. 24
28 2. SUMMARY OF SIGNIFICANT ACCOUNTING POLICIES (CONTINUED) (e) Creation and cancellation of units Prior to 18 February 2016, the Fund classifies its puttable instruments as equity in accordance with MFRS132 (Amendment) Financial Instruments: Presentation. However, the amendment requires puttable financial instruments that meet the definition of equity to be classified as financial liability when certain strict criteria are not met. Those criteria include: the units entitle the holder to a proportionate share of the Fund s NAV; the units are the most subordinated class and class features are identical; there is no contractual obligations to deliver cash or another financial asset other than the obligation on the Fund to repurchase; and the total expected cash flows from the units over its life are based substantially on the profit or loss of the Fund. These conditions were not met when Class SGD was issued on 18 February 2016 as this class does not have identical features with the pre-existing Class MYR. The units are subsequently classified as financial liabilities. Cancellable units can be put back to the Fund at any time for cash equal to a proportionate share of the Fund s NAV of respective classes. The outstanding units are carried at the redemption amount that is payable at the date of the statement of financial position if the unit holder exercises the right to put back the unit to the Fund. Units are created and cancelled at the unit holders option at prices based on the Fund s NAV per unit of respective classes at the close of business on the relevant dealing day. The Fund s NAV per unit of respective classes is calculated by dividing the net assets attributable to members of respective classes with the total number of outstanding units of respective classes. (f) Cash and cash equivalents For the purpose of statement of cash flow, cash and cash equivalents comprise bank balances and deposits held in highly liquid investments that are readily convertible to known amount of cash and which are subject to an insignificant risk of change in value. (g) Taxation Current tax expense is determined according to Malaysian tax laws at the current rate based upon the taxable profit income earned during the financial year. (h) Distribution A distribution to the Fund s unit holders is accounted for as a finance cost in the statement of comprehensive income. A proposed distribution is recognised as a financial liability in the year in which it is approved by the Trustee. 25
29 2. SUMMARY OF SIGNIFICANT ACCOUNTING POLICIES (CONTINUED) (i) Amount due from/to stockbrokers Amount due from and amount due to stockbrokers represent receivables for quoted securities sold and payables for quoted securities purchased that have been contracted for but not yet settled or delivered on the statement of financial position date respectively. These amounts are recognised initially at fair value and subsequently measured at amortised cost using the effective interest method, less provision for impairment for amount due from stockbrokers. A provision for impairment of amount due from stockbrokers is established when there is objective evidence that the Fund will not be able to collect all amounts due from the relevant stockbroker. Significant financial difficulties of the stockbroker, probability that the stockbroker will enter bankruptcy or financial reorganisation, and default in payments are considered indicators that the amount due from stockbrokers is impaired. Once a financial asset or a group of similar financial assets has been written down as a result of an impairment loss, interest income is recognised using the rate of interest used to discount the future cash flows for the purpose of measuring the impairment loss. (j) Transactions costs Transaction costs are costs incurred to acquire or dispose financial assets or liabilities at fair value through profit or loss. They include fees and commissions paid to agents, advisors, brokers and dealers. Transaction costs, when incurred, are immediately recognised in the statement of comprehensive income as expenses. (k) Increase/Decrease in net asset attributable to unit holders Income not distributed is included in net asset attributable to unit holders. (l) Segment information Operating segments are reported in a manner consistent with the internal reporting used by the chief operating decision-maker. The chief operating decision-maker is responsible for allocating resources and assessing performance of the operating segments. (m) Critical accounting estimates and judgements in applying accounting policies The Fund makes estimates and assumptions concerning the future. The resulting accounting estimates will, by definition, rarely equal the related actual results. To enhance the information content of the estimates, certain key variables that are anticipated to have material impact to the Fund s results and financial position are tested for sensitivity to changes in the underlying parameters. Estimates and judgement are continually evaluated by the Manager and are based on historical experience and other factors, including expectations of future events that are believed to be reasonable under the circumstances. In undertaking any of the Fund s investment, the Manager will ensure that all assets of the Fund under management will be valued appropriately, that is at fair value and in compliance with the SC Guidelines on Unit Trust Funds. However, the Manager is of the opinion that in applying these accounting policies, no significant judgement was required. 26
30 3. FINANCIAL INSTRUMENTS AND RISK MANAGEMENT OBJECTIVES AND POLICIES Financial instruments of the Fund are as follows: Financial assets at fair value through profit or loss Loans and receivables Total RM RM RM 2018 Cash and cash equivalents (Note 9) - 37,091,543 37,091,543 Quoted securities (Note 8) 193,927, ,927,383 Amount due from stockbrokers - 381, ,320 Amount due from Manager - 152, ,996 Dividends receivable - 166, , ,927,383 37,792, ,719, Cash and cash equivalents (Note 9) - 14,048,517 14,048,517 Quoted securities (Note 8) 256,896, ,896,537 Amount due from stockbrokers - 1,341,156 1,341,156 Amount due from Manager - 350, ,904 Dividends receivable - 217, , ,896,537 15,957, ,854,458 All current liabilities, except for tax payable, are financial liabilities which are carried at amortised cost. The investment objective of the Fund is to achieve maximum capital appreciation over the longterm through all types of investments. The Fund is exposed to a variety of risks which include market risk (inclusive of price risk, interest rate risk and currency risk), credit risk and liquidity risk. Financial risk management is carried out through internal control process adopted by the Manager and adherence to the investment restrictions as stipulated in the Deeds and SC Guidelines on Unit Trust Funds. (a) Market risk (i) Price risk Price risk is the risk that the fair value of an investment in quoted securities will fluctuate because of changes in market prices (other than those arising from interest rate risk). The value of quoted securities may fluctuate according to the activities of individual companies, sector and overall political and economic conditions. Such fluctuation may cause the Fund s NAV and prices of units to fall as well as rise, and income produced by the Fund may also fluctuate. The price risk is managed through diversification and selection of quoted securities and other financial instruments within specified limits according to the Deeds. 27
31 3. FINANCIAL INSTRUMENTS AND RISK MANAGEMENT OBJECTIVES AND POLICIES (CONTINUED) (a) Market risk (continued) (i) Price risk (continued) The Fund s overall exposure to price risk was as follows: RM RM Financial assets at fair value through profit or loss: - Quoted securities 193,927, ,896,537 The table below summarises the sensitivity of the Fund s profit or loss and NAV to movements in prices of quoted securities at the end of each reporting year. The analysis is based on the assumptions that the price of the quoted securities fluctuated by 5% with all other variables held constant. This represents management s best estimate of a reasonable possible shift in the quoted securities, having regard to the historical volatility of the prices. % Change in price of quoted securities Market value Impact on profit or loss and NAV RM RM % 184,231,014 (9,696,369) 0% 193,927,383-5% 203,623,752 9,696, % 244,051,710 (12,844,827) 0% 256,896,537-5% 269,741,364 12,844,827 (ii) Currency risk Currency risk is associated with investments that are quoted and/or priced in foreign currency denomination. Foreign currency risk is the risk that the value of financial instruments will fluctuate due to changes in foreign exchange rates. The Manager will evaluate the likely directions of a foreign currency versus RM based on considerations of economic fundamentals such as interest rate differentials, balance of payments position, debt levels, and technical chart considerations. The following table sets out the foreign currency risk concentrations arising from the denomination of the Fund s financial instruments in foreign currencies: Cash and cash equivalents RM RM Financial assets SGD 3,623,907 66,777 28
32 3. FINANCIAL INSTRUMENTS AND RISK MANAGEMENT OBJECTIVES AND POLICIES (CONTINUED) (a) Market risk (continued) (ii) Currency risk (continued) Net assets attributable to unit holders RM RM Financial liabilities SGD (3,324,598) (67,412) The table below summarises the sensitivity of the Fund s profit or loss and NAV to changes in foreign exchange movements at the end of each reporting year. The analysis is based on the assumption that the foreign exchange rate fluctuates by 5%, with all other variables remain constants. This represents management s best estimate of a reasonable possible shift in the foreign exchange rate, having regard to historical volatility of this rate. Disclosures below are shown in absolute terms, changes and impacts could be positive or negative. Change in foreign exchange rate Impact on profit or loss/nav % RM RM SGD 5 14,965 (32) -5 (14,965) 32 (iii) Interest rate risk Interest rate is a general economic indicator that will have an impact on the management of the Fund. Fair value interest rate risk is the risk that the value of a financial instrument will fluctuate due to changes in market interest rates. The Fund s exposure to fair value interest rate risk arises from investments in money market instruments. The interest rate risk is expected to be minimal as the Fund s investments comprise mainly short term deposits with approved licensed financial institutions. Cash flow interest rate risk is the risk that the future cash flows of a financial instrument will fluctuate because of changes in market interest rates. The Fund is not exposed to cash flow interest rate risk as the Fund does not hold any financial instruments at variable interest rate. As at the end of each financial year, the Fund is not exposed to a material level of interest rate risk. 29
33 3. FINANCIAL INSTRUMENTS AND RISK MANAGEMENT OBJECTIVES AND POLICIES (CONTINUED) (b) Credit risk Credit risk refers to the risk that a counterparty will default on its contractual obligation resulting in financial loss to the Fund. The credit risk arising from placements of deposits in licensed financial institutions is managed by ensuring that the Fund will only place deposits in reputable licensed financial institutions. For amount due from Manager, the settlement terms of the proceeds from the creation of units receivable from the Manager are governed by the SC Guidelines on Unit Trust Funds. For amount due from stockbrokers, the settlement terms are governed by the relevant rules and regulations as prescribed by respective stock exchanges. The credit risk is minimal as all transactions in quoted securities are settled/paid upon delivery using approved stockbrokers. The following table sets out the credit risk concentration of the Fund: Cash and cash equivalents Amount due from stockbrokers Amount due from Manager Dividends receivable Total RM RM RM RM RM 2018 Financial Services - HSBC Bank Malaysia Bhd (AAA) 3,762, ,762,877 - Malayan Banking Bhd (AAA) 6,219, ,219,372 - Public Bank Bhd (AAA) 10,842, ,842,953 - Hong Leong Bank Bhd (AA1) 16,266, ,266,341 - RHB Investment Bk Bhd (AA2) - Other (Not Rated) Telecommunications - Not rated Otherp - 381, , ,290 36, , ,029 - Not Rated , ,996 37,091, , , ,319 37,792,178 30
34 3. FINANCIAL INSTRUMENTS AND RISK MANAGEMENT OBJECTIVES AND POLICIES (CONTINUED) (b) Credit risk (continued) The following table sets out the credit risk concentration of the Fund (continued): Cash and cash equivalents Amount due from stockbrokers Amount due from Manager Dividends receivable Total RM RM RM RM RM 2017 Finance - HSBC Bank Malaysia Bhd (AAA) 87, ,655 - CIMB Bank Bhd (AAA) 3,821, ,821,640 - CIMB Investment Bank Bhd (AAA) - 919, ,792 - Malayan Banking Bhd (AAA) 2,700, ,003 2,823,251 - Public Bank Bhd (AAA) 4,901, ,901,899 - Hong Leong Bank Bhd (AA1) 2,537, ,150 2,618,226 - Hong Leong Investment Bank Bhd (AA1) - 99, ,019 - Others (Not Rated) - 322,345 13, ,530 Trading/Services - Not rated Others - Not Rated , ,904 14,048,517 1,341, , ,344 15,957,921 All financial assets of the Fund as at the end of each financial year are neither past due nor impaired. 31
35 3. FINANCIAL INSTRUMENTS AND RISK MANAGEMENT OBJECTIVES AND POLICIES (CONTINUED) (c) Liquidity risk Liquidity risk is the risk that the Fund will encounter difficulty in meeting its financial obligations. The Manager manages this risk by maintaining sufficient level of liquid assets to meet anticipated payments and cancellations of the units by unit holders. Liquid assets comprise bank balances and deposits with licensed financial institutions, which are capable of being converted into cash within 7 business days. This is expected to reduce the risks for the entire portfolio without limiting the Fund s growth potentials. The table below summarises the Fund s financial liabilities into relevant maturity groupings based on the remaining year as at the statement of financial position date to the contractual maturity date. The amounts in the table are the contractual undiscounted cash flows. Less than 1 month Between 1 month to 1 year Total RM RM RM 2018 Amount due to Manager 533, ,795 Accrued management fee 300, ,364 Amount due to Trustee 10,012 10,012 Distribution payable - 400, ,964 Other payables and accruals - 17,100 17,100 Net assets attributable to unit holders * 230,457, ,457,326 Contractual undiscounted cash flows 231,301, , ,719, Amount due to stockbrokers 1,525,960-1,525,960 Amount due to Manager 7,808,952-7,808,952 Accrued management fee 344, ,493 Amount due to Trustee 11,483-11,483 Distribution payable Other payables and accruals 21,359 38,229 59,588 Net assets attributable to unit holders * 263,103, ,103,425 Contractual undiscounted cash flows 272,815,672 38, ,853,973 * Outstanding units are redeemed on demand at the holder s option. However, the Manager does not envisage that the contractual maturity disclosed in the table above will be representative of the actual cash outflows, as holders of these instruments typically retain them for the medium to long term. 32
36 3. FINANCIAL INSTRUMENTS AND RISK MANAGEMENT OBJECTIVES AND POLICIES (CONTINUED) (d) Fair value estimation Fair value is defined as the price that would be received to sell an asset or paid to transfer a liability in an orderly transaction between market participants at the measurement date (i.e. an exit price). The fair value of financial assets traded in active markets (such as trading securities) are based on quoted market prices at the close of trading on the financial year end date. The Fund utilises the last traded market price for financial assets where the last traded price falls within the bid-ask spread. In circumstances where the last traded market price is not within the bid-ask spread, the Manager will determine the point within the bid-ask spread that is most representative of the fair value. An active market is a market in which transactions for the asset or liability take place with sufficient frequency and volume to provide pricing information on an ongoing basis. The fair value of financial assets that are not traded in an active market is determined by using valuation techniques. (i) Fair value hierarchy The table below analyses financial instruments carried at fair value. The different levels have been defined as follows: Quoted prices (unadjusted) in active market for identical assets or liabilities (Level 1) Inputs other than quoted prices included within Level 1 that are observable for the asset or liability, either directly (that is, as prices) or indirectly (that is, derived from prices) (Level 2) Inputs for the asset and liability that are not based on observable market data (that is, unobservable inputs) (Level 3) The level in the fair value hierarchy within which the fair value measurement is categorised in its entirety is determined on the basis of the lowest level input that is significant to the fair value measurement in its entirety. For this purpose, the significance of an input is assessed against the fair value measurement in its entirety. If a fair value measurement uses observable inputs that require significant adjustment based on unobservable inputs, that measurement is a Level 3 measurement. Assessing the significance of a particular input to the fair value measurement in its entirety requires judgement, considering factors specific to the asset or liability. The determination of what constitutes observable requires significant judgement by the Fund. The Fund considers observable data to be that market data that is readily available, regularly distributed or updated, reliable and verifiable, not proprietary, and provided by independent sources that are actively involved in the relevant market. 33
37 3. FINANCIAL INSTRUMENTS AND RISK MANAGEMENT OBJECTIVES AND POLICIES (CONTINUED) (d) Fair value estimation (continued) (i) Fair value hierarchy (continued) Level 1 Level 2 Level 3 Total RM RM RM RM 2018 Financial assets at fair value through profit or loss: - Quoted securities 193,927, ,927, Financial assets at fair value through profit or loss: - Quoted securities 256,896, ,896,537 Investments whose values are based on quoted market prices in active markets, and are therefore classified within Level 1, include active listed equities. The Fund does not adjust the quoted prices for these instruments. The Fund s policies on valuation of these financial assets are stated in Note 2(b). (ii) The carrying values of cash and cash equivalents, amount due from stockbrokers, amount due from Manager, dividends receivable and all current liabilities are a reasonable approximation of their fair values due to their short term nature. 4. MANAGEMENT FEE In accordance with the Deeds, the Manager is entitled to a maximum management fee of 1.50% per annum calculated and accrued daily based on the NAV of the Fund. For the financial year ended 31 October 2018, the management fee is recognised at a rate of 1.50% per annum (2017: 1.50% per annum) for each classes. There is no further liability to the Manager in respect of management fee other than amounts recognised above. 34
38 5. TRUSTEE S FEE In accordance with the Deeds, the Trustee is entitled to a maximum trustee fee of 0.05% per annum, calculated daily based on the NAV of the Fund. The Trustee s fee includes the local custodian fee but excludes the foreign sub-custodian fees and charges. For the financial year ended 31 October 2018, the Trustee s fee is recognised at the rate of 0.05% per annum (2017: 0.05% per annum) (including local custodian fee but excluding foreign sub-custodian fee). There is no further liability to the Trustee in respect of Trustee s fee other than the amount recognised above. 6. FINANCE COST Distribution to unit holders is derived from the following sources: RM RM Dividend income 1,559,966 - Interest income from deposits with licensed financial institutions 144,330 - Net realised gain on disposal of investments 1,536,575 - Prior financial year s realised income 41,152,940-44,393,811 - Less: Expenses (342,679) - Taxation (485) - Net distribution amount 44,050,647 - Distribution on 22 November 2017 Gross/Net distribution per unit (sen) Class MYR Net distribution per unit (sen) Distribution on 26 October 2018 Gross/Net distribution per unit (sen) - Class SGD Class MYR Net distribution per unit (sen) Gross distribution is derived using total income less total expenses. Net distribution above is sourced from current and prior financial years realised income. Gross distribution per unit is derived from gross realised income less expenses, divided by the number of units in circulation. Net distribution per unit is derived from gross realised income less expenses and taxation, divided by the number of units in circulation. There are unrealised losses of RM15,939,238 during the financial year (2017: RM Nil). 35
39 7. TAXATION RM RM Tax charged for the financial year: - Overprovision of prior year tax (485) - - Withholding tax - 3,032 (485) 3,032 A numerical reconciliation between the profit before taxation multiplied by the Malaysian statutory income tax rate and tax expense of the Fund is as follows: RM RM (Loss)/Profit before taxation (9,167,563) 20,544,515 Taxation at Malaysian statutory rate of 24% (2017: 24%) (2,200,215) 4,930,684 Tax effects of: Investment income not subject to tax 890,064 (6,423,618) Expenses not deductible for tax purposes 364, ,135 Restriction on tax deductible expenses for Unit Trust Fund 945,581 1,100,799 Over provision of prior year tax (485) - Investment income subject to withholding tax - 3,032 Taxation (485) 3, FINANCIAL ASSETS AT FAIR VALUE THROUGH PROFIT OR LOSS RM RM Designated at fair value through profit or loss at inception: - Quoted securities 193,927, ,896,537 Net (loss)/gain on financial assets at fair value through profit or loss: - Realised gain on disposals 3,675,136 11,924,134 - Unrealised fair value (loss)/gain (15,983,438) 5,139,198 (12,308,302) 17,063,332 36
40 8. FINANCIAL ASSETS AT FAIR VALUE THROUGH PROFIT OR LOSS (CONTINUED) Name of counter Aggregate Market Percentage Quantity cost value of NAV Units RM RM % 2018 QUOTED SECURITIES Construction Muhibbah Engineering M Bhd 571,200 1,790,599 1,582, ,200 1,790,599 1,582, Consumer Products & Services AirAsia Group Bhd 777,800 2,619,385 2,045, Genting Malaysia Bhd 1,010,300 9,099,889 7,415, Genting Plantations Bhd 1,888,700 10,050,792 8,480, MBM Resources Bhd 537,700 1,308,439 1,070, Petronas Dagangan Bhd 137,600 3,685,172 3,577, Salutica Bhd 1,199, , , Sime Darby Bhd 584,810 1,277,846 1,286, ,136,410 28,777,965 24,487, Energy Dialog Group Bhd 1,506,200 3,991,882 5,106, Hibiscus Petroleum Bhd 941, ,561 1,054, Petronas Gas Bhd 149,100 2,818,388 2,725, Yinson Holdings Bhd 960,400 3,337,111 4,273, ,557,300 11,117,942 13,159, Financial Services Aeon Credit Service (M) Bhd 163,100 1,975,645 2,462, Aeon Credit Service M Bhd - ICULS 124, , , Alliance Bank Malaysia Bhd 510,300 2,194,829 2,020, Bursa Malaysia Bhd 305,700 2,668,549 2,237, CIMB Group Holdings Bhd 1,209,606 6,541,728 6,918,946 3 Hong Leong Bank Bhd 268,200 4,178,755 5,551, Hong Leong Financial Group 124,400 1,986,156 2,286, Malayan Banking Bhd 1,419,140 12,539,343 13,467, Public Bank Bhd 842,293 16,572,673 20,720, RHB Bank Bhd 333,000 1,710,924 1,741, ,300,539 50,493,402 57,591,
41 8. FINANCIAL ASSETS AT FAIR VALUE THROUGH PROFIT OR LOSS (CONTINUED) Name of counter Aggregate Market Percentage Quantity cost value of NAV Units RM RM % 2018 (Continued) QUOTED SECURITIES (CONTINUED) Health Care Top Glove Corporation Bhd 412,800 1,505,043 2,452, Industrial Products Tat Sang Holdings Bhd - Delisted 31, Industrial Products & Svc ATA IMS Bhd 1,814,600 2,899,190 3,012, Petronas Chemicals Group Bhd 1,031,900 7,800,372 9,648, Sunway Bhd - WB 03/10/ , , Uchi Technologies Bhd 771,900 2,421,628 2,238, V.S. Industry 3,608,300 6,148,864 5,773, ,601,670 19,270,054 20,781, Plantation FGV Holdings Bhd 922,900 2,177,375 1,292, Globetronics Technology Bhd 260,400 2,807,661 2,512, IOI Corporation Bhd 1,299,900 5,940,166 5,849, Kuala Lumpur Kepong Bhd 141,200 3,434,192 3,518, Sime Darby Plantation Bhd 950,310 7,120,051 4,998, ,574,710 21,479,445 18,171, Property SP Setia Bhd - Preference shares 564, , , Technology Globetronics Technology Bhd 931,200 2,502,768 2,057, Inari Amertron Bhd 2,219,750 4,780,341 4,350, Malaysian Pacific Industries Bhd 201,200 2,504,142 2,181, Pentamaster Corporation Bhd 441,100 1,151,775 1,385, Revenue Group Bhd 1,321,500 1,582,045 1,334, Unisem Bhd 359,600 1,098,387 1,039, ,474,350 13,619,458 12,348,
42 8. FINANCIAL ASSETS AT FAIR VALUE THROUGH PROFIT OR LOSS (CONTINUED) Name of counter Aggregate Percentage Quantity cost Market value of NAV Units RM RM % 2018 (Continued) QUOTED SECURITIES (CONTINUED) Telecommunications & Media Axiata Group Bhd 2,100,791 10,314,298 7,163, Digi.com Bhd 262,700 1,267,185 1,132, ,363,491 11,581,483 8,295, Transportation & Logistics Malaysia Airports Holdings Bhd 1,101,500 9,274,265 9,142, MISC Bhd 547,500 4,104,908 3,339, Pos Malaysia Bhd 326,000 1,253, , Westports Holdings Bhd 667,500 2,352,895 2,276, ,642,500 16,985,258 15,723, Utilities Tenaga Nasional Bhd 1,277,200 17,174,438 18,774, ,277,200 17,174,438 18,774, TOTAL QUOTED SECURITIES 39,507, ,359, ,927, ACCUMULATED UNREALISED LOSS ON FINANCIAL ASSETS AT FAIR VALUE THROUGH PROFIT OR LOSS (431,904) TOTAL FINANCIAL ASSETS AT FAIR VALUE THROUGH PROFIT OR LOSS 193,927,383 39
43 8. FINANCIAL ASSETS AT FAIR VALUE THROUGH PROFIT OR LOSS (CONTINUED) Name of counter Aggregate Market Percentage Quantity cost value of NAV Units RM RM % 2017 QUOTED SECURITIES Construction Econpile Holdings Bhd 562, ,380 1,749, Gamuda Bhd 534,900 2,679,359 2,808, IJM Corporation Bhd 816,500 2,836,305 2,604, Mitrajaya Holdings Bhd 2,196,000 3,117,762 2,064, Muhibbah Engineering (M) Bhd 465,700 1,345,318 1,327, WCT Holdings Bhd 880,080 1,984,559 1,460, ,455,780 12,442,683 12,014, Consumer Products IOI Corporation Bhd 1,375,500 6,285,636 6,134, Kuala Lumpur Kepong Bhd 235,700 5,397,938 5,798, Malayan Flour Mills Bhd 1,256,200 2,881,911 2,437, Vizione Holdings Bhd 8,100, ,349 1,336, ,967,800 15,561,834 15,706, Finance Aeon Credit Services (M) Bhd 62, , , Aeon Credit Service (M) Bhd - ICULS 124, , , Alliance Financial Group Bhd 631,500 2,488,081 2,330, AMMB Holdings Bhd 930,500 4,295,510 3,982, Bursa Malaysia Bhd 238,200 2,389,702 2,379, CIMB Group Holdings Bhd 3,307,481 17,353,750 20,307, Hong Leong Bank Bhd 270,500 3,643,414 4,311, Hong Leong Financial Group Bhd 94,400 1,419,645 1,576, Malayan Banking Bhd 2,509,093 21,508,511 23,209, Public Bank Bhd 975,693 17,502,654 19,962, RHB Bank Bhd 685,600 3,518,191 3,482, ,830,167 74,817,370 82,566, Industrials Fajarbaru Builder Group Bhd 1,499,100 1,459,757 1,356, Mieco Chipboad Bhd 455, , , Pecca Group Bhd 1,489,300 2,608,828 2,099, Petronas Chemicals Group Bhd 539,700 3,743,630 3,977, SKP Resources Bhd 1,520,100 2,660,235 2,690, Pos Malaysia Bhd 751,400 4,043,851 4,125, Tat Sang Holdings Bhd * 31, ,286,400 14,998,505 14,787,
44 8. FINANCIAL ASSETS AT FAIR VALUE THROUGH PROFIT OR LOSS (CONTINUED) Name of counter 2017 (CONTINUED) QUOTED SECURITIES (CONTINUED) Aggregate Market Percentage Quantity cost value of NAV Units RM RM % IPC Digi.Com Bhd 841,400 4,127,225 4,207, Plantation Genting Plantations Bhd 346,700 3,738,158 3,702, Properties SP Setia Bhd 641,076 2,179,647 2,096, SP Setia Bhd - Preference Shares 564, , , Sunway Bhd 2,647,333 4,062,080 4,579, Sunway Bhd - Warrant 374, , ,227,579 6,805,927 7,508, Technology Inari Amertron Bhd 1,575,400 3,963,510 4,426, Malaysian Pacific Industries Bhd 166,100 1,730,227 2,312, ,741,500 5,693,737 6,738, Trading/Services Airasia Bhd 2,051,400 6,879,495 6,851, Axiata Group Bhd 2,304,064 11,586,794 12,418, Bermaz Auto Bhd 506,500 1,102,069 1,033, Dayang Enterprise Hldg Bhd 1,921,500 2,311,538 1,662, Dialog Group Bhd 2,498,100 4,768,707 5,645, Genting Bhd 1,004,600 9,052,258 9,091, Genting Malaysia Bhd 246,600 1,204,933 1,240, Malaysia Airports Hldg Bhd 1,236,600 9,626,068 10,239, MBM Resources Bhd 419,400 1,040, , MISC Bhd 392,500 3,132,719 2,727, My E.G. Services Bhd 1,346,650 2,626,026 2,949, Petronas Dagangan Bhd 83,400 2,064,801 1,998, Sapura Energy Bhd 1,633,600 3,065,726 2,613, Sime Darby Bhd 1,685,610 13,492,634 15,507, Telekom Malaysia Bhd 889,258 6,151,216 5,646, Tenaga Nasional Bhd 1,579,400 20,384,314 23,691, Tiong Nam Logistics Holdings Bhd 507, , , Yinson Holdings Bhd 1,193,300 3,965,447 4,725, ,500, ,159, ,663, TOTAL QUOTED SECURITIES 61,197, ,345, ,896,
45 8. FINANCIAL ASSETS AT FAIR VALUE THROUGH PROFIT OR LOSS (CONTINUED) Name of counter 2017 (CONTINUED) QUOTED SECURITIES (CONTINUED) Aggregate Market Percentage Quantity cost value of NAV Units RM RM % ACCUMULATED UNREALISED GAIN ON FINANCIAL ASSETS AT FAIR VALUE THROUGH PROFIT OR LOSS 15,551,534 TOTAL FINANCIAL ASSETS AT FAIR VALUE THROUGH PROFIT OR LOSS 256,896,537 * The counter has been de-listed on 27 October 2003 as the counter does not have an adequate level of financial condition to warrant continued listing. The counter will continue to remain deposited with the Malaysian Central Depository Sdn Bhd as it is not mandatory for the securities to be withdrawn. 9. CASH AND CASH EQUIVALENTS RM RM Deposits with licensed financial institutions 33,328,666 13,960,862 Bank balances 3,762,877 87,655 37,091,543 14,048,517 The weighted average effective interest rate per annum is as follows: % % Deposits with licensed financial institutions Deposits with licensed financial institutions of the Fund have an average maturity of 10 days (2017: 3 days). 42
46 10. NUMBER OF UNITS IN CIRCULATION (UNITS) No. of units No. of units Class MYR (i) 230,809, ,536,787 Class SGD (ii) 1,071,679 20, ,881, ,557,547 (i) Class MYR No. of units No. of units At the beginning of the financial year 211,536, ,034,486 Add: Creation of units from applications 8,560,262 10,972,091 Add: Creation of units from distributions 41,502,896 - Less: Cancellation of units (30,790,115) (50,469,790) At the end of the financial year 230,809, ,536,787 (ii) Class SGD No. of units No. of units At the beginning of the financial year 20,760 - Add: Creation of units from applications 1,149,594 84,710 Add: Creation of units from distribution 439 Less: Cancellation of units (99,114) (63,950) At the end of the financial year 1,071,679 20, MANAGEMENT EXPENSE RATIO ( MER ) % % MER MER is derived from the following calculation: MER = (A + B + C + D + E) x 100 F A B C D E F = Management fee = Trustee s fee = Audit fee = Tax agent s fee = Other expenses excluding Goods and Services Tax ( GST ) on transaction costs = Average NAV of the Fund calculated on a daily basis The average NAV of the Fund for the financial year calculated on a daily basis is RM250,623,569 (2017: RM283,423,394). 43
47 12. PORTFOLIO TURNOVER RATIO ( PTR ) PTR (times) PTR is derived based on the following calculation: (Total acquisition for the financial year + total disposal for the financial year) 2 Average NAV of the Fund for the financial year calculated on a daily basis where: total acquisition for the financial year total disposal for the financial year = RM227,741,026 (2017: RM240,100,958) = RM278,401,878 (2017: RM261,950,710) 13. UNITS HELD BY THE MANAGER AND PARTIES RELATED TO THE MANAGER, AND SIGNIFICANT RELATED PARTY TRANSACTIONS AND BALANCES The related parties and their relationship with the Fund are as follows: Related parties CIMB-Principal Asset Management Bhd Principal Financial Group, Inc. Principal International (Asia) Ltd Subsidiaries and associates of Principal Financial Group Inc., other than above, as disclosed in its financial statements CIMB Group Holdings Bhd CIMB Group Sdn Bhd Subsidiaries and associates of CIMB Group Holdings Bhd, other than above, as disclosed in its financial statements CIMB Bank Bhd CIMB Investment Bank Bhd Relationship The Manager Ultimate holding company of shareholder of the Manager Shareholder of the Manager Fellow subsidiary and associated companies of the ultimate holding company of shareholder of the Manager Ultimate holding company of shareholder of the Manager Shareholder of the Manager Fellow subsidiary and associated companies of the ultimate holding company of shareholder of the Manager Fellow related party to the Manager Fellow related party to the Manager 44
48 13. UNITS HELD BY THE MANAGER AND PARTIES RELATED TO THE MANAGER, AND SIGNIFICANT RELATED PARTY TRANSACTIONS AND BALANCES (CONTINUED) Units held by the Manager and parties related to the Manager Class MYR No. of units No. of RM units RM Manager CIMB-Principal Asset Management Bhd 38,471 37, , ,990 Class SGD No. of units No. of RM units RM Manager CIMB-Principal Asset Management Bhd In the opinion of the Manager, the above units were transacted at the prevailing market price. The units are held beneficially by the Manager for booking purposes. Other than the above, there were no units held by the Directors or parties related to the Manager. In addition to related party disclosures mentioned elsewhere in the financial statements, set out below are other significant related party transactions and balances. The Manager is of the opinion that all transactions with the related companies have been entered into in the normal course of business at agreed terms between the related parties RM RM Significant related party transactions Interest income from deposits with licensed financial institution: - CIMB Bank Bhd 12,962 75,552 Cash placements with licensed financial institution - CIMB Bank Bhd 28,553, ,632,000 Significant related party balance Deposits with licensed financial institution: - CIMB Bank Bhd - 3,821,639 45
49 14. TRANSACTIONS WITH BROKERS/DEALERS Details of transactions with the top 10 brokers/dealers for financial year ended 31 October 2018 are as follows: Brokers/Dealers Percentage of total brokerage fees Value of trades Percentage of total trades Brokerage fees RM % RM % CIMB Investment Bank Bhd # 81,934, , Macquarie Malaysia Sdn Bhd 72,028, , Affin Hwang Investment Bank Bhd 55,190, , KAF Seagroat & Campbell Securi 46,198, , Hong Leong Investment Bank 39,941, , Maybank Investment Bank Bhd 39,479, , RHB Investment Bank Bhd 37,557, , JPMorgan Securities (M) Sdn Bhd 28,563, , Credit Suisse M Sdn Bhd 27,129, , CLSA Securities (M) Sdn Bhd 21,292, , Others 29,520, , ,835, ,060,
50 14. TRANSACTIONS WITH BROKERS/DEALERS (CONTINUED) Details of transactions with the top 10 brokers/dealers for financial year ended 31 October 2017 are as follows: Brokers/Dealers Percentage of total brokerage fees Value of trades Percentage of total trades Brokerage fees RM % RM % CIMB Investment Bank Bhd # 130,357, , Credit Suisse Securities (Malaysia) Sdn Bhd 61,524, , Macquarie Malaysia Sdn Bhd 60,417, , CLSA Securities Malaysia Sdn Bhd 42,519, , Maybank Investment Bank Bhd 41,068, , JPMorgan Securities (Malaysia) Sdn Bhd 41,003, , Hong Leong Investment Bank Bhd 39,177, , RHB Investment Bank Bhd 28,884, , KAF Seagroat & Campbell Securities Sdn Bhd 16,050, , UBS Securities Malaysia Sdn Bhd 9,808, , Others 31,238, , ,051, ,112, # Included in the transactions are trades conducted with CIMB Investment Bank Bhd, fellow related party to the Manager amounting to RM81,934,791 (2017: RM130,357,806) respectively. The Manager is of the opinion that all transactions with the related companies have been entered into in the normal course of business at agreed terms between the related parties. 47
51 15. SEGMENT INFORMATION The internal reporting provided to the chief operating decision-maker for the Fund s assets, liabilities and performance is prepared on a consistent basis with the measurement and recognition principles of MFRS and IFRS. The chief operating decision-maker is responsible for the performance of the Fund and considers the business to have a single operating segment located in Malaysia. Asset allocation decisions are based on a single, integrated investment strategy and the Fund s performance is evaluated on an overall basis. The investment objective of the Fund is to achieve maximum capital appreciation over the long-term through all types of investments. The reportable operating segment derives its income by seeking investments to achieve targeted returns consummate with an acceptable level of risk within the portfolio. These returns consist of interest income and dividend income earned from investments and gains on the appreciation in the value of investments, which are derived from Ringgit denominated deposits with licensed financial institutions in Malaysia and quoted securities listed on Bursa Securities, Malaysia. There were no changes in reportable operating segment during the financial year. 16. APPROVAL OF FINANCIAL STATEMENTS The financial statements have been approved for issue by the Manager on 14 December
52 DIRECTORY Head office of the Manager CIMB-Principal Asset Management Berhad (Company No.: K) 10 th Floor, Bangunan CIMB, Jalan Semantan, Damansara Heights, Kuala Lumpur, MALAYSIA. Tel: (03) Postal address CIMB-Principal Asset Management Berhad (Company No.: K) P.O.Box 10571, Kuala Lumpur, MALAYSIA. Website address General investment enquiries (03) Trustee for the CIMB-Principal Malaysia Equity Fund HSBC (Malaysia) Trustee Berhad (Company No.: T) 13 th Floor, Bangunan HSBC, South Tower, No. 2, Leboh Ampang, Kuala Lumpur, MALAYSIA. Tel: (03) Fax: (03) Auditors of the Trusts and of the Manager PricewaterhouseCoopers (Company No. AF: 1146) Level 10, 1 Sentral, Jalan Rakyat, Kuala Lumpur Sentral, PO Box 10192, Kuala Lumpur, MALAYSIA. Tel: (03) Fax: (03)
 7718 3100 Email service@cimb-principal.com.")
53 CIMB-Principal Asset Management Berhad ( K) Enquiries: Customer Care Centre (603) Website
CIMB-PRINCIPAL ASIA PACIFIC DYNAMIC GROWTH FUND FINANCIAL STATEMENTS FOR THE FINANCIAL YEAR ENDED 28 FEBRUARY 2018
 FINANCIAL STATEMENTS FOR THE FINANCIAL YEAR ENDED 28 FEBRUARY 2018 CONTENTS PAGE(S) INVESTORS LETTER 1 MANAGER S REPORT 2-11 Fund Objective and Policy Performance Data Market Review Fund Performance Portfolio
CIMB-PRINCIPAL EQUITY FUND FINANCIAL STATEMENTS FOR THE FINANCIAL YEAR ENDED 30 JUNE 2018
 FINANCIAL STATEMENTS FOR THE FINANCIAL YEAR ENDED 30 JUNE 2018 CONTENTS PAGE(S) INVESTORS' LETTER 1 MANAGER S REPORT 2-7 Fund Objective and Policy Performance Data Market Review Fund Performance Portfolio
CIMB ISLAMIC DALI EQUITY THEME FUND FINANCIAL STATEMENTS FOR THE FINANCIAL YEAR ENDED 30 NOVEMBER 2018
 FINANCIAL STATEMENTS FOR THE FINANCIAL YEAR ENDED 30 NOVEMBER 2018 CONTENTS PAGE(S) INVESTORS' LETTER 1 MANAGER'S REPORT 2-10 Fund Objective and Policy Performance Data Market Review Fund Performance Portfolio
CIMB-PRINCIPAL EQUITY FUND UNAUDITED FINANCIAL STATEMENTS FOR THE SIX MONTHS FINANCIAL PERIOD ENDED 31 DECEMBER 2018
 UNAUDITED FINANCIAL STATEMENTS FOR THE SIX MONTHS FINANCIAL PERIOD ENDED 31 DECEMBER 2018 CONTENTS PAGE(S) INVESTORS' LETTER 1 MANAGER S REPORT 2-7 Fund Objective and Policy Performance Data Market Review
CIMB-PRINCIPAL CONSERVATIVE BOND FUND FINANCIAL STATEMENTS FOR THE FINANCIAL PERIOD FROM 8 AUGUST 2017 (DATE OF LAUNCH) TO 28 FEBRUARY 2018
 TO 28 FEBRUARY 2018") FINANCIAL STATEMENTS FOR THE FINANCIAL PERIOD FROM 8 AUGUST 2017 (DATE OF LAUNCH) TO 28 FEBRUARY 2018 CONTENTS PAGE(S) INVESTORS' LETTER 1 MANAGER S REPORT 2-8 Fund Objective and Policy Performance Data
FINANCIAL STATEMENTS FOR THE FINANCIAL PERIOD FROM 8 AUGUST 2017 (DATE OF LAUNCH) TO 28 FEBRUARY 2018 CONTENTS PAGE(S) INVESTORS' LETTER 1 MANAGER S REPORT 2-8 Fund Objective and Policy Performance Data
CIMB ISLAMIC DEPOSIT FUND FINANCIAL STATEMENT FOR THE FINANCIAL YEAR ENDED 31 JANUARY 2018
 FINANCIAL STATEMENT FOR THE FINANCIAL YEAR ENDED 31 JANUARY 2018 CONTENTS PAGE(S) INVESTORS' LETTER 1 MANAGER'S REPORT 2-9 Fund Objective and Policy Performance Data Market Review Fund Performance Portfolio
CIMB-PRINCIPAL EQUITY INCOME FUND FINANCIAL STATEMENTS FOR THE FINANCIAL YEAR ENDED 31 JANUARY 2019
 FINANCIAL STATEMENTS FOR THE FINANCIAL YEAR ENDED 31 JANUARY 2019 CONTENTS PAGE(S) INVESTORS' LETTER 1 MANAGER S REPORT 2-7 Fund Objective and Policy Performance Data Market Review Fund Performance Portfolio
CIMB-PRINCIPAL KLCI-LINKED FUND UNAUDITED FINANCIAL STATEMENTS FOR THE SIX MONTHS FINANCIAL PERIOD ENDED 31 MARCH 2018
 UNAUDITED FINANCIAL STATEMENTS FOR THE SIX MONTHS FINANCIAL PERIOD ENDED 31 MARCH 2018 CONTENTS PAGE(S) INVESTORS' LETTER 1 MANAGER'S REPORT 2-7 Fund Objective and Policy Performance Data Market Review
CIMB ISLAMIC MONEY MARKET FUND FINANCIAL STATEMENTS FOR THE FINANCIAL YEAR ENDED 30 NOVEMBER 2018
 FINANCIAL STATEMENTS FOR THE FINANCIAL YEAR ENDED 30 NOVEMBER 2018 CONTENTS PAGE(S) INVESTORS LETTER 1 MANAGER S REPORT 2-8 Fund Objective and Policy Performance Data Market Review Fund Performance Portfolio
CIMB-PRINCIPAL EQUITY GROWTH & INCOME FUND FINANCIAL STATEMENTS FOR THE FINANCIAL YEAR ENDED 30 APRIL 2018
 FINANCIAL STATEMENTS FOR THE FINANCIAL YEAR ENDED 30 APRIL 2018 CONTENTS PAGE(S) INVESTORS LETTER 1 MANAGER S REPORT 2-7 Fund Objective and Policy Performance Data Market Review Fund Performance Portfolio
CIMB-PRINCIPAL CHINA-INDIA-INDONESIA EQUITY FUND UNAUDITED FINANCIAL STATEMENTS FOR THE SIX MONTHS FINANCIAL PERIOD ENDED 31 MARCH 2018
 UNAUDITED FINANCIAL STATEMENTS FOR THE SIX MONTHS FINANCIAL PERIOD ENDED 31 MARCH 2018 CONTENTS PAGE(S) INVESTORS LETTER 1 MANAGER S REPORT 2-6 Fund Objective and Policy Performance Data Market Review
CIMB-PRINCIPAL PRS PLUS EQUITY UNAUDITED FINANCIAL STATEMENTS FOR THE SIX MONTHS FINANCIAL PERIOD ENDED 31 JULY 2018
 UNAUDITED FINANCIAL STATEMENTS FOR THE SIX MONTHS FINANCIAL PERIOD ENDED 31 JULY 2018 CONTENTS PAGE(S) MEMBERS LETTER 1 PRS PROVIDER S REPORTS 2-11 Fund objective and policy Performance data Market review
Investments that stand the test of time
 UNAUDITED INTERIM REPORT FOR THE SIX MONTHS FINANCIAL PERIOD ENDED 31 OCTOBER 2018 Investments that stand the test of time FORWARD Your Investments UNAUDITED FINANCIAL STATEMENTS FOR THE SIX MONTHS FINANCIAL
CIMB-PRINCIPAL DEPOSIT FUND 2 UNAUDITED FINANCIAL STATEMENTS FOR THE FINANCIAL PERIOD FROM 19 JUNE 2017 (DATE OF LAUNCH) TO 31 MARCH 2018
 TO 31 MARCH 2018") UNAUDITED FINANCIAL STATEMENTS FOR THE FINANCIAL PERIOD FROM 19 JUNE 2017 (DATE OF LAUNCH) TO 31 MARCH 2018 CONTENTS PAGE(S) INVESTORS LETTER 1 MANAGER S REPORT 2-10 Fund Objective and Policy Performance
UNAUDITED FINANCIAL STATEMENTS FOR THE FINANCIAL PERIOD FROM 19 JUNE 2017 (DATE OF LAUNCH) TO 31 MARCH 2018 CONTENTS PAGE(S) INVESTORS LETTER 1 MANAGER S REPORT 2-10 Fund Objective and Policy Performance
CIMB ISLAMIC SMALL CAP FUND FINANCIAL STATEMENTS FOR THE FINANCIAL YEAR ENDED 31 MAY 2018
 FINANCIAL STATEMENTS FOR THE FINANCIAL YEAR ENDED 31 MAY 2018 CONTENTS PAGE(S) INVESTORS LETTER 1 MANAGER S REPORT 2-8 Fund Objective and Policy Performance Data Market Review Fund Performance Portfolio
CIMB-PRINCIPAL PREFERRED SECURITIES FUND FINANCIAL STATEMENTS FOR THE FINANCIAL PERIOD FROM 11 JANUARY 2017 (DATE OF LAUNCH) TO 31 OCTOBER 2017
 TO 31 OCTOBER 2017") FINANCIAL STATEMENTS FOR THE FINANCIAL PERIOD FROM 11 JANUARY 2017 (DATE OF LAUNCH) TO 31 OCTOBER 2017 CONTENTS PAGE(S) INVESTORS' LETTER 1 MANAGER'S REPORT 2-9 Fund Objective and Policy Performance Data
FINANCIAL STATEMENTS FOR THE FINANCIAL PERIOD FROM 11 JANUARY 2017 (DATE OF LAUNCH) TO 31 OCTOBER 2017 CONTENTS PAGE(S) INVESTORS' LETTER 1 MANAGER'S REPORT 2-9 Fund Objective and Policy Performance Data
CIMB-PRINCIPAL PRS PLUS ASIA PACIFIC EX JAPAN EQUITY FINANCIAL STATEMENTS FOR THE FINANCIAL YEAR ENDED 31 JANUARY 2018
 FINANCIAL STATEMENTS FOR THE FINANCIAL YEAR ENDED 31 JANUARY 2018 CONTENTS PAGE(S) MEMBERS LETTER 1 PRS PROVIDER S REPORT 2-10 Fund Objective and Policy Performance Data Market Review Fund Performance
CIMB ISLAMIC ASIA PACIFIC EQUITY FUND FINANCIAL STATEMENTS FOR THE FINANCIAL YEAR ENDED 30 APRIL 2018
 FINANCIAL STATEMENTS FOR THE FINANCIAL YEAR ENDED 30 APRIL 2018 CONTENTS PAGE(S) INVESTORS' LETTER 1 MANAGER S REPORT 2-7 Fund Objective and Policy Performance Data Market Review Fund Performance Portfolio
CIMB-PRINCIPAL STRATEGIC BOND FUND FINANCIAL STATEMENTS FOR THE FINANCIAL YEAR ENDED 31 DECEMBER 2018
 FINANCIAL STATEMENTS FOR THE FINANCIAL YEAR ENDED 31 DECEMBER 2018 CONTENTS PAGE(S) INVESTORS' LETTER 1 MANAGER'S REPORT 2-8 Fund Objective and Policy Performance Data Market Review Fund Performance Portfolio
Investments that stand the test of time
 UNAUDITED QUARTERLY REPORT FOR THE QUARTER AND FINANCIAL PERIOD ENDED 31 JULY 2018 Investments that stand the test of time FORWARD Your Investments UNAUDITED QUARTERLY REPORT FOR THE QUARTER AND FINANCIAL
CIMB-PRINCIPAL EMERGING MARKETS MULTI ASSET FUND FINANCIAL STATEMENTS FOR THE FINANCIAL PERIOD FROM 6 JANUARY 2017 (DATE OF LAUNCH) TO 31 JANUARY 2018
 TO 31 JANUARY 2018") FINANCIAL STATEMENTS FOR THE FINANCIAL PERIOD FROM 6 JANUARY 2017 (DATE OF LAUNCH) TO 31 JANUARY 2018 CONTENTS PAGE(S) INVESTORS' LETTER 1 MANAGER'S REPORT 2-12 Fund Objective and Policy Performance Data
FINANCIAL STATEMENTS FOR THE FINANCIAL PERIOD FROM 6 JANUARY 2017 (DATE OF LAUNCH) TO 31 JANUARY 2018 CONTENTS PAGE(S) INVESTORS' LETTER 1 MANAGER'S REPORT 2-12 Fund Objective and Policy Performance Data
CIMB-PRINCIPAL MONEY MARKET INCOME FUND FINANCIAL STATEMENTS FOR THE FINANCIAL YEAR ENDED 31 DECEMBER 2017
 FINANCIAL STATEMENTS FOR THE FINANCIAL YEAR ENDED 31 DECEMBER 2017 CONTENTS PAGE(S) INVESTORS LETTER 1 MANAGER S REPORT 2-8 Fund Objective and Policy Performance Data Market Review Fund Performance Portfolio
Investments that stand the test of time
 UNAUDITED QUARTERLY REPORT FOR THE QUARTER AND FINANCIAL PERIOD ENDED 31 AUGUST 2018 Investments that stand the test of time FORWARD Your Investments UNAUDITED QUARTERLY REPORT FOR THE QUARTER AND FINANCIAL
Investments that stand the test of time
 ANNUAL REPORT FOR THE FINANCIAL YEAR ENDED 31 AUGUST 2018 Investments that stand the test of time FORWARD Your Investments FINANCIAL STATEMENTS FOR THE FINANCIAL YEAR ENDED 31 AUGUST 2018 CONTENTS PAGE(S)
CIMB ISLAMIC PRS PLUS ASIA PACIFIC EX JAPAN EQUITY UNAUDITED FINANCIAL STATEMENTS FOR THE SIX MONTHS FINANCIAL PERIOD ENDED 28 FEBRUARY 2018
 UNAUDITED FINANCIAL STATEMENTS FOR THE SIX MONTHS FINANCIAL PERIOD ENDED 28 FEBRUARY 2018 CONTENTS PAGE(S) MEMBERS LETTER 1 SHARIAH ADVISER S REPORT 2 STATEMENT BY PRS PROVIDER 3 TRUSTEE S REPORT 4 PRS
CIMB-PRINCIPAL ASEAN EQUITY FUND FINANCIAL STATEMENTS FOR THE FINANCIAL YEAR ENDED 30 APRIL 2018
 FINANCIAL STATEMENTS FOR THE FINANCIAL YEAR ENDED 30 APRIL 2018 CONTENTS PAGE(S) INVESTORS' LETTER 1 MANAGER'S REPORT 2-7 Fund Objective and Policy Performance Data Market Review Fund Performance Portfolio
CIMB ISLAMIC ASIA PACIFIC EQUITY FUND FINANCIAL STATEMENTS FOR THE FINANCIAL YEAR ENDED 30 APRIL 2017
 FINANCIAL STATEMENTS FOR THE FINANCIAL YEAR ENDED 30 APRIL 2017 CONTENTS PAGE(S) INVESTORS' LETTER 1 MANAGER S REPORT 2-7 Fund Objective and Policy Performance Data Market Review Fund Performance Portfolio
KAF TACTICAL FUND ANNUAL REPORT 31 AUGUST 2018
 KAF TACTICAL FUND ANNUAL REPORT 31 AUGUST 2018 KAF INVESTMENT FUNDS BERHAD (334195-K) MANAGER S REPORT We are pleased to present the Manager s Report for the financial year ended 31 August 2018 (the period).
CIMB ISLAMIC DALI EQUITY GROWTH FUND UNAUDITED FINANCIAL STATEMENTS FOR THE SIX MONTHS FINANCIAL PERIOD ENDED 30 NOVEMBER 2018
 UNAUDITED FINANCIAL STATEMENTS FOR THE SIX MONTHS FINANCIAL PERIOD ENDED 30 NOVEMBER 2018 CONTENTS PAGE(S) INVESTORS LETTER 1 MANAGER S REPORT 2-8 Fund Objective and Policy Performance Data Market Review
CIMB ISLAMIC MONEY MARKET FUND FINANCIAL STATEMENTS FOR THE FINANCIAL YEAR ENDED 30 NOVEMBER 2017
 FINANCIAL STATEMENTS FOR THE FINANCIAL YEAR ENDED 30 NOVEMBER 2017 CONTENTS PAGE(S) INVESTORS LETTER 1-2 MANAGER S REPORT 3-9 Fund Objective and Policy Performance Data Market Review Fund Performance Portfolio
CIMB-PRINCIPAL MALAYSIA EQUITY FUND (formerly known as CIMB-PRINCIPAL EQUITY FUND 2) UNAUDITED FINANCIAL STATEMENTS
 UNAUDITED FINANCIAL STATEMENTS") UNAUDITED FINANCIAL STATEMENTS FOR THE SIX MONTHS FINANCIAL PERIOD ENDED 30 APRIL 2016 CONTENTS PAGE(S) INVESTORS' LETTER 1 MANAGER'S REPORT 2-7 Fund Objective and Policy Performance Data Market Review
UNAUDITED FINANCIAL STATEMENTS FOR THE SIX MONTHS FINANCIAL PERIOD ENDED 30 APRIL 2016 CONTENTS PAGE(S) INVESTORS' LETTER 1 MANAGER'S REPORT 2-7 Fund Objective and Policy Performance Data Market Review
CIMB-PRINCIPAL GLOBAL DIVIDEND MAXIMISER FUND FINANCIAL STATEMENTS FOR THE FINANCIAL YEAR ENDED 30 NOVEMBER 2017
 FINANCIAL STATEMENTS FOR THE FINANCIAL YEAR ENDED 30 NOVEMBER 2017 CONTENTS PAGE(S) INVESTORS' LETTER 1 MANAGER'S REPORT 2-11 Fund Objective and Policy Performance Data Market Review Fund Performance Portfolio
CIMB-PRINCIPAL GLOBAL MULTI ASSET INCOME FUND UNAUDITED QUARTERLY REPORT FOR THE QUARTER AND FINANCIAL PERIOD ENDED 30 APRIL 2018
 UNAUDITED QUARTERLY REPORT FOR THE QUARTER AND FINANCIAL PERIOD ENDED 30 APRIL 2018 CONTENTS PAGE(S) INVESTORS LETTER 1 MANAGER S REPORT 2-7 Fund Objective and Policy Performance Data Market Review Fund
CIMB-PRINCIPAL ASEAN TOTAL RETURN FUND FINANCIAL STATEMENTS FOR THE FINANCIAL YEAR ENDED 30 NOVEMBER 2017
 FINANCIAL STATEMENTS FOR THE FINANCIAL YEAR ENDED 30 NOVEMBER 2017 CONTENTS PAGE(S) INVESTORS LETTER 1 MANAGER S REPORT 2-10 Fund Objective and Policy Performance Data Market Review Fund Performance Portfolio
CIMB ISLAMIC ENHANCED SUKUK FUND FINANCIAL STATEMENTS FOR THE FINANCIAL YEAR ENDED 31 MARCH 2018
 FINANCIAL STATEMENTS FOR THE FINANCIAL YEAR ENDED 31 MARCH 2018 CONTENTS PAGE(S) INVESTORS LETTER 1 MANAGER S REPORT 2-8 Fund Objective and Policy Performance Data Market Review Fund Performance Portfolio
CIMB-PRINCIPAL BALANCED FUND FINANCIAL STATEMENTS
 FINANCIAL STATEMENTS FOR THE FINANCIAL YEAR ENDED 31 DECEMBER 2017 CONTENTS PAGE(S) INVESTORS LETTER 1 MANAGER S REPORT 2-8 Fund Objective and Policy Performance Data Market Review Fund Performance Portfolio
CIMB ISLAMIC PRS PLUS GROWTH UNAUDITED FINANCIAL STATEMENTS FOR THE SIX MONTHS FINANCIAL PERIOD ENDED 28 FEBRUARY 2018
 UNAUDITED FINANCIAL STATEMENTS FOR THE SIX MONTHS FINANCIAL PERIOD ENDED 28 FEBRUARY 2018 CONTENTS PAGE(S) MEMBERS LETTER 1 SHARIAH ADVISER S REPORT 2 STATEMENT BY THE PRS PROVIDER 3 TRUSTEE S REPORT 4
CIMB-PRINCIPAL PRS PLUS ASIA PACIFIC EX JAPAN EQUITY
 UNAUDITED FINANCIAL STATEMENTS FOR THE SIX MONTHS FINANCIAL PERIOD ENDED 31 JULY 2018 CONTENTS PAGE(S) MEMBERS LETTER 1 PRS PROVIDER'S REPORT 2-10 Fund Objective and Policy Performance Data Market Review
INVESTORS' LETTER 1 MANAGER'S REPORT 2-7
 CONTENTS PAGE(S) INVESTORS' LETTER 1 MANAGER'S REPORT 2-7 Fund Objective and Policy Performance Data Market Review Fund Performance Portfolio Structure Market Outlook Investment Strategy Unit Holdings
CIMB-PRINCIPAL US MORTGAGE FUND UNAUDITED QUARTERLY REPORT FOR THE QUARTER AND FINANCIAL PERIOD ENDED 30 APRIL 2018
 UNAUDITED QUARTERLY REPORT FOR THE QUARTER AND FINANCIAL PERIOD ENDED 30 APRIL 2018 CONTENTS PAGE(S) INVESTORS' LETTER 1 MANAGER'S REPORT 2-10 Fund Objective and Policy Performance Data Market Review Fund
CIMB ISLAMIC DALI EQUITY THEME FUND FINANCIAL STATEMENTS FOR THE FINANCIAL YEAR ENDED 30 NOVEMBER 2017
 FINANCIAL STATEMENTS FOR THE FINANCIAL YEAR ENDED 30 NOVEMBER 2017 CONTENTS PAGE(S) INVESTORS' LETTER 1 MANAGER'S REPORT 2-10 Fund Objective and Policy Performance Data Market Review Fund Performance Portfolio
Investments that stand the test of time
 UNAUDITED INTERIM REPORT FOR THE SIX MONTHS FINANCIAL PERIOD ENDED 31 AUGUST 2018 Investments that stand the test of time FORWARD Your Investments UNAUDITED FINANCIAL STATEMENTS FOR THE SIX MONTHS FINANCIAL
CIMB ISLAMIC MONEY MARKET FUND UNAUDITED FINANCIAL STATEMENTS
 UNAUDITED FINANCIAL STATEMENTS FOR THE SIX MONTHS FINANCIAL PERIOD ENDED 31 MAY 2018 CONTENTS PAGE(S) INVESTORS LETTER 1 MANAGER S REPORT 2-7 Fund Objective and Policy Performance Data Market Review Fund
CIMB FTSE ASEAN 40 MALAYSIA UNAUDITED QUARTERLY REPORT FOR THE FINANCIAL PERIOD FROM 1 JULY 2017 TO 30 SEPTEMBER 2017
 UNAUDITED QUARTERLY REPORT FOR THE FINANCIAL PERIOD FROM 1 JULY 2017 TO 30 SEPTEMBER 2017 CONTENTS PAGE(S) INVESTORS' LETTER 1 MANAGER'S REPORT 2-7 Fund Objective and Policy Performance Data Market Review
CIMB ISLAMIC BALANCED WHOLESALE FUND-OF-FUNDS UNAUDITED QUARTERLY REPORT
 UNAUDITED QUARTERLY REPORT FOR THE QUARTER AND FINANCIAL PERIOD ENDED 30 JUNE 2018 CONTENTS PAGE(S) INVESTORS' LETTER 1 MANAGER S REPORT 2-7 Fund Objective and Policy Performance Data Market Review Fund
CIMB ISLAMIC AL-AZZAM EQUITY FUND FINANCIAL STATEMENTS FOR THE FINANCIAL YEAR ENDED 28 FEBRUARY 2017
 FINANCIAL STATEMENTS FOR THE FINANCIAL YEAR ENDED 28 FEBRUARY 2017 CONTENTS PAGE(S) INVESTORS LETTER 1 MANAGER S REPORT 2-7 Fund Objective and Policy Performance Data Market Review Fund Performance Portfolio
CIMB ISLAMIC DALI ASIA PACIFIC EQUITY GROWTH FUND UNAUDITED FINANCIAL STATEMENTS FOR THE SIX MONTHS FINANCIAL PERIOD ENDED 30 APRIL 2017
 UNAUDITED FINANCIAL STATEMENTS FOR THE SIX MONTHS FINANCIAL PERIOD ENDED 30 APRIL 2017 CONTENTS PAGE(S) INVESTORS LETTER 1 MANAGER S REPORT 2-7 Fund Objective and Policy Performance Data Market Review
CIMB-PRINCIPAL ASIA PACIFIC DYNAMIC INCOME FUND UNAUDITED FINANCIAL STATEMENTS FOR THE SIX MONTHS FINANCIAL PERIOD ENDED 30 SEPTEMBER 2017
 UNAUDITED FINANCIAL STATEMENTS FOR THE SIX MONTHS FINANCIAL PERIOD ENDED 30 SEPTEMBER 2017 CONTENTS PAGE(S) INVESTORS' LETTER 1 MANAGER'S REPORT 2-11 Fund Objective and Policy Performance Data Market Review
CIMB-PRINCIPAL ASIAN EQUITY FUND UNAUDITED FINANCIAL STATEMENTS FOR THE SIX MONTHS FINANCIAL PERIOD ENDED 31 DECEMBER 2017
 UNAUDITED FINANCIAL STATEMENTS FOR THE SIX MONTHS FINANCIAL PERIOD ENDED 31 DECEMBER 2017 CONTENTS PAGE(S) INVESTORS' LETTER 1 MANAGER'S REPORT 2-7 Fund Objective and Policy Performance Data Market Review
Investments that stand the test of time
 UNAUDITED INTERIM REPORT FOR THE SIX MONTHS FINANCIAL PERIOD ENDED 31 OCTOBER 2018 Investments that stand the test of time FORWARD Your Investments UNAUDITED FINANCIAL STATEMENTS FOR THE SIX MONTHS FINANCIAL
Hong Leong Asia-Pacific Dividend Fund
 Reaching out to you Hong Leong Asia-Pacific Dividend Fund Annual Report 2016/2017 31 October 2017 Audited Hong Leong Asia-Pacific Dividend Fund Contents Page Manager s Review and Report 1-9 Statement by
CIMB ISLAMIC AGGRESSIVE WHOLESALE FUND-OF-FUNDS UNAUDITED QUARTERLY REPORT
 UNAUDITED QUARTERLY REPORT FOR THE QUARTER AND FINANCIAL PERIOD ENDED 30 JUNE 2018 CONTENTS PAGE(S) INVESTORS' LETTER 1 MANAGER S REPORT 2-7 Fund Objective and Policy Performance Data Market Review Fund
CIMB-PRINCIPAL PRS PLUS CONSERVATIVE UNAUDITED FINANCIAL STATEMENTS FOR THE SIX MONTHS FINANCIAL PERIOD ENDED 31 JULY 2017
 UNAUDITED FINANCIAL STATEMENTS FOR THE SIX MONTHS FINANCIAL PERIOD ENDED 31 JULY 2017 CONTENTS PAGE(S) MEMBERS' LETTER 1 PRS PROVIDER S REPORT 2-10 Fund Objective and Policy Performance Data Market Review
CIMB ISLAMIC SUKUK FUND FINANCIAL STATEMENTS FOR THE FINANCIAL YEAR ENDED 31 AUGUST 2017
 FINANCIAL STATEMENTS FOR THE FINANCIAL YEAR ENDED 31 AUGUST 2017 CONTENTS PAGE(S) INVESTORS LETTER 1-2 MANAGER S REPORT 3-8 Fund Objective and Policy Performance Data Market Review Fund Performance Portfolio
CIMB-PRINCIPAL ASIA PACIFIC DYNAMIC INCOME FUND FINANCIAL STATEMENTS FOR THE FINANCIAL YEAR ENDED 31 MARCH 2018
 FINANCIAL STATEMENTS FOR THE FINANCIAL YEAR ENDED 31 MARCH 2018 CONTENTS PAGE(S) INVESTORS' LETTER 1 MANAGER'S REPORT 2-12 Fund Objective and Policy Performance Data Market Review Fund Performance Portfolio
INVESTORS' LETTER 1 MANAGER S REPORT 2-7
 CONTENTS PAGE(S) INVESTORS' LETTER 1 MANAGER S REPORT 2-7 Fund Objective and Policy Performance Data Market Review Fund Performance Portfolio Structure Market Outlook Investment Strategy Unit Holdings
CIMB ISLAMIC BALANCED GROWTH FUND UNAUDITED FINANCIAL STATEMENTS FOR THE SIX MONTHS FINANCIAL PERIOD ENDED 30 JUNE 2018
 UNAUDITED FINANCIAL STATEMENTS FOR THE SIX MONTHS FINANCIAL PERIOD ENDED 30 JUNE 2018 CONTENTS PAGE(S) INVESTORS' LETTER 1 MANAGER'S REPORT 2-8 Fund Objective and Policy Performance Data Market Review
Hong Leong Dividend Fund
 Reaching out to you Hong Leong Dividend Fund Annual Report 2017/2018 31 August 2018 Audited Hong Leong Dividend Fund Contents Page Manager s Review and Report 1-11 Statement by the Manager 12 Trustee s
CIMB-PRINCIPAL ASEAN TOTAL RETURN FUND UNAUDITED FINANCIAL STATEMENT FOR THE SIX MONTHS FINANCIAL PERIOD ENDED 31 MAY 2017
 UNAUDITED FINANCIAL STATEMENT FOR THE SIX MONTHS FINANCIAL PERIOD ENDED 31 MAY 2017 CONTENTS PAGE(S) INVESTORS LETTER 1 MANAGER S REPORT 2-9 Fund Objective and Policy Performance Data Market Review Fund
Hong Leong Consumer Products Sector Fund
 Reaching out to you Hong Leong Consumer Products Sector Fund Annual Report 2017/2018 30 September 2018 Audited Hong Leong Consumer Products Sector Fund Contents Page Manager s Review and Report 1-10 Statement
INVESTORS' LETTER 1 MANAGER'S REPORT 2-6
 CONTENTS PAGE(S) INVESTORS' LETTER 1 MANAGER'S REPORT 2-6 Fund Objective and Policy Performance Data Market Review Fund Performance Portfolio Structure Market Outlook Investment Strategy Unit Holdings
INVESTORS' LETTER 1 MANAGER'S REPORT 2-8
 CONTENTS PAGE(S) INVESTORS' LETTER 1 MANAGER'S REPORT 2-8 Fund Objective and Policy Performance Data Market Review Fund Performance Portfolio Structure Market Outlook Investment Strategy Unit Holdings
CIMB-PRINCIPAL BALANCED INCOME FUND FINANCIAL STATEMENTS FOR THE FINANCIAL YEAR ENDED 31 AUGUST 2017
 FINANCIAL STATEMENTS FOR THE FINANCIAL YEAR ENDED 31 AUGUST 2017 CONTENTS PAGE(S) INVESTORS' LETTER 1-2 MANAGER S REPORT 3-10 Fund Objective and Policy Performance Data Market Review Fund Performance Portfolio
Investments that stand the test of time
 UNAUDITED INTERIM REPORT FOR THE SIX MONTHS FINANCIAL PERIOD ENDED 30 SEPTEMBER 2018 Investments that stand the test of time FORWARD Your Investments UNAUDITED FINANCIAL STATEMENTS FOR THE SIX MONTHS FINANCIAL
Statement Of Changes In Net Asset Value 15
 CONTENTS Fund Information 2 Financial Highlights 4 Fund Performance Market Review Fund Review Fund Returns Asset Allocation Income Distribution 5 Report Of The Trustee 8 Statement By The Manager 9 Independent
INVESTORS' LETTER 1 MANAGER'S REPORT 2-7
 CONTENTS PAGE(S) INVESTORS' LETTER 1 MANAGER'S REPORT 2-7 Fund Objective and Policy Performance Data Market Review Fund Performance Portfolio Structure Market Outlook Investment Strategy Unit Holdings
1 General Information 1. 2 Manager s Report 2. 3 Policy On Stockbroking Rebates And Soft Commissions 8. 4 Statement By The Manager 9
 CONTENTS PAGE 1 General Information 1 2 Manager s Report 2 3 Policy On Stockbroking Rebates And Soft Commissions 8 4 Statement By The Manager 9 5 Trustee s Report 10 6 Independent Auditors Report 11 7
CIMB-PRINCIPAL PRS PLUS ASIA PACIFIC EX JAPAN EQUITY
 CONTENTS PAGE(S) MEMBERS LETTER 1 PRS PROVIDER'S REPORT 2-10 Fund Objective and Policy Performance Data Market Review Fund Performance Portfolio Structure Market Outlook Investment Strategy Members Statistics
Hong Leong Bond Fund
 Reaching out to you Hong Leong Bond Fund Annual Report 2016/2017 30 June 2017 Audited Hong Leong Bond Fund Contents Page Manager s Review and Report Statement by the Manager Trustee s Report Independent
CIMB FTSE ASEAN 40 MALAYSIA UNAUDITED QUARTERLY REPORT FOR THE FINANCIAL PERIOD FROM 1 JULY 2015 TO 30 SEPTEMBER 2015
 UNAUDITED QUARTERLY REPORT FOR THE FINANCIAL PERIOD FROM 1 JULY 2015 TO 30 SEPTEMBER 2015 CONTENTS PAGE(S) INVESTORS' LETTER 1 MANAGER'S REPORT 2-7 Fund Objective and Policy Performance Data Market Review
Hong Leong Consumer Products Sector Fund
 Reaching out to you Hong Leong Consumer Products Sector Fund Annual Report 2016/2017 30 September 2017 Audited Hong Leong Consumer Products Sector Fund Contents Page Manager s Review and Report 1-9 Statement
1 General Information 1. 2 Manager s Report 3. 3 Policy On Stockbroking Rebates And Soft Commissions 9. 4 Statement By The Manager 10
 CONTENTS PAGE 1 General Information 1 2 Manager s Report 3 3 Policy On Stockbroking Rebates And Soft Commissions 9 4 Statement By The Manager 10 5 Trustee s Report 11 6 Independent Auditors Report 12 7
Hong Leong Asia-Pacific Dividend Fund
 Reaching out to you Hong Leong Asia-Pacific Dividend Fund Interim Report 2017/2018 30 April 2018 Unaudited Hong Leong Asia-Pacific Dividend Fund Contents Page Manager s Review and Report 1-10 Statement
Select Asia Pacific (Ex Japan) REITs and Infrastructure Fund
 REITs and Infrastructure Fund") Affin Hwang Select Asia Pacific (Ex Japan) REITs and Infrastructure Fund (Formerly known as Hwang Asia Pacific (Ex Japan) REITs and Infrastructure Fund) Annual Report 30 April 2015 MANAGER Affin Hwang
Affin Hwang Select Asia Pacific (Ex Japan) REITs and Infrastructure Fund (Formerly known as Hwang Asia Pacific (Ex Japan) REITs and Infrastructure Fund) Annual Report 30 April 2015 MANAGER Affin Hwang
Hong Leong Penny Stock Fund
 Reaching out to you Hong Leong Penny Stock Fund Annual Report 2016/2017 31 August 2017 Audited Hong Leong Penny Stock Fund Contents Page Manager s Review and Report 1-9 Statement by the Manager 10 Trustee
United Income Plus Fund. Annual Report 31 July 2018
 United Income Plus Fund Annual Report 31 July 2018 UNITED INCOME PLUS FUND Audited Annual Report and Financial Statements For the Financial Year Ended 31 July 2018 TABLE OF CONTENTS PAGE NO (A) MANAGER
EASTSPRING INVESTMENTS GLOBAL EMERGING MARKETS FUND ANNUAL REPORT
 EASTSPRING INVESTMENTS GLOBAL EMERGING MARKETS FUND ANNUAL REPORT FOR THE FINANCIAL YEAR ENDED 31 DECEMBER 2018 ERRATA SHEET This errata sheet contains revisions made to Statement by the Manager in the
ANNUAL REPORT EASTSPRING INVESTMENTS MY FOCUS FUND
 ANNUAL REPORT EASTSPRING INVESTMENTS MY FOCUS FUND FOR THE FINANCIAL YEAR ENDED 31 DECEMBER 2013 Annual Report TABLE OF CONTENTS Fund Information 2 Key Performance Data 4 Manager s Report 6 Market Review
Aberdeen Islamic Asia Pacific Ex Japan Equity Fund. Annual Report 30 June 2018
 Aberdeen Islamic Asia Pacific Ex Japan Equity Fund Annual Report 30 June 2018 TABLE OF CONTENTS FUND INFORMATION 2 FUND PERFORMANCE DATA 3-5 MANAGER S REPORT 6-8 STATEMENT OF COMPREHENSIVE INCOME 9 STATEMENT
INVESTORS' LETTER 1 MANAGER'S REPORT 2-9
 CONTENTS PAGE(S) INVESTORS' LETTER 1 MANAGER'S REPORT 2-9 Fund Objective and Policy Performance Data Market Review Fund Performance Portfolio Structure Market Outlook Investment Strategy Unit Holdings
ANNUAL REPORT EASTSPRING INVESTMENTS INDONESIA EQUITY MY FUND
 ANNUAL REPORT EASTSPRING INVESTMENTS INDONESIA EQUITY MY FUND FOR THE FINANCIAL YEAR ENDED 31 MARCH 2013 Annual Report TABLE OF CONTENTS Fund Information 2 Key Performance Data 4 Manager s Report 6 Market
ANNUAL REPORT. EASTSPRING INVESTMENTS INDONESIA EQUITY MY FUND (formerly known as Prudential Indonesia Equity Fund)
") ANNUAL REPORT EASTSPRING INVESTMENTS INDONESIA EQUITY MY FUND (formerly known as Prudential Indonesia Equity Fund) FOR THE FINANCIAL YEAR ENDED 31 MARCH 2012 TABLE OF CONTENTS Fund Information... 2 Fund
ANNUAL REPORT EASTSPRING INVESTMENTS INDONESIA EQUITY MY FUND (formerly known as Prudential Indonesia Equity Fund) FOR THE FINANCIAL YEAR ENDED 31 MARCH 2012 TABLE OF CONTENTS Fund Information... 2 Fund
1 General Information 1. 2 Manager s Report 2. 3 Policy On Stockbroking Rebates And Soft Commissions 8. 4 Statement By The Manager 9
 CONTENTS PAGE 1 General Information 1 2 Manager s Report 2 3 Policy On Stockbroking Rebates And Soft Commissions 8 4 Statement By The Manager 9 5 Trustee s Report 10 6 Independent Auditors Report 11 7
Investments that stand the test of time
 ANNUAL REPORT FOR THE FINANCIAL YEAR ENDED 31 AUGUST 2018 Investments that stand the test of time FORWARD Your Investments FINANCIAL STATEMENTS FOR THE FINANCIAL YAER ENDED 31 AUGUST 2018 CONTENTS PAGE(S)
CIMB ISLAMIC BALANCED FUND FINANCIAL STATEMENTS FOR THE FINANCIAL YEAR ENDED 30 SEPTEMBER 2017
 FINANCIAL STATEMENTS FOR THE FINANCIAL YEAR ENDED 30 SEPTEMBER 2017 CONTENTS PAGE(S) INVESTORS' LETTER 1-2 MANAGER'S REPORT 3-11 Fund Objective and Policy Performance Data Market Review Fund Performance
CIMB ISLAMIC BALANCED FUND UNAUDITED FINANCIAL STATEMENTS FOR THE SIX MONTHS FINANCIAL PERIOD ENDED 31 MARCH 2017
 UNAUDITED FINANCIAL STATEMENTS FOR THE SIX MONTHS FINANCIAL PERIOD ENDED 31 MARCH 2017 CONTENTS PAGE(S) INVESTORS' LETTER 1 MANAGER'S REPORT 2-9 Fund Objective and Policy Performance Data Market Review
FLEXI GROWTH & INCOME FUND
 CONTENTS PAGE 1 General Information 1 2 Manager s Report 3 3 Policy On Stockbroking Rebates And Soft Commissions 9 4 Statement By The Manager 10 5 Trustee s Report 11 6 Independent Auditors Report 12 7
MAYBANK Q-CASH FUND Annual report For the financial year ended 31 March 2018
 Maybank Asset Management Sdn Bhd (421779-M) Level 12, Tower C Dataran Maybank No.1 Jalan Maarof 59000 Kuala Lumpur, Malaysia Telephone +603 2297 7888 Facsimile +603 2297 7998 www.maybank-am.com Annual
SHARIAH PROGRESS FUND
 CONTENTS PAGE 1 General Information 1 2 Manager s Report 3 3 Policy On Stockbroking Rebates And Soft Commissions 9 4 Statement By The Manager 10 5 Trustee s Report 11 6 Shariah Adviser s Report 12 7 Independent
Hong Leong Growth Fund
 Reaching out to you Hong Leong Growth Fund Annual Report 2017/2018 30 June 2018 Audited Hong Leong Growth Fund Contents Page Manager s Review and Report 110 Statement by the Manager 11 Trustee s Report
ML SHARIAH FLEXI FUND
 CONTENTS PAGE 1 General Information 1 2 Manager s Report 3 3 Policy On Stockbroking Rebates And Soft Commissions 9 4 Statement By The Manager 10 5 Trustee s Report 11 6 Shariah Adviser s Report 12 7 Independent
SHARIAH ASIA-PACIFIC FUND
 CONTENTS PAGE 1 General Information 1 2 Manager s Report 2 3 Policy On Stockbroking Rebates And Soft Commissions 8 4 Statement By The Manager 9 5 Trustee s Report 10 6 Shariah Adviser s Report 11 7 Independent
MAYBANK ENHANCED CASH XII FUND
 Maybank Asset Management Sdn Bhd (421779-M) Level 12, Tower C Dataran Maybank No.1 Jalan Maarof 59000 Kuala Lumpur, Malaysia Telephone +603 2297 7888 Facsimile +603 2297 7998 www.maybank-am.com MAYBANK
Select Balanced Fund. Interim Report 30 September MANAGER Affin Hwang Asset Management Berhad ( T)
") Affin Hwang Select Balanced Fund Interim Report 30 September 2015 MANAGER Affin Hwang Asset Management Berhad (429786-T) TRUSTEE HSBC (Malaysia) Trustee Berhad (1281-T) AFFIN HWANG SELECT BALANCED FUND
Affin Hwang Select Balanced Fund Interim Report 30 September 2015 MANAGER Affin Hwang Asset Management Berhad (429786-T) TRUSTEE HSBC (Malaysia) Trustee Berhad (1281-T) AFFIN HWANG SELECT BALANCED FUND
1 General Information 1. 2 Manager s Report 3. 3 Policy On Stockbroking Rebates And Soft Commissions 9. 4 Statement By The Manager 10
 CONTENTS PAGE 1 General Information 1 2 Manager s Report 3 3 Policy On Stockbroking Rebates And Soft Commissions 9 4 Statement By The Manager 10 5 Trustee s Report 11 6 Independent Auditors Report 12 7
Hong Leong Income Management Fund
 Reaching out to you Hong Leong Income Management Fund First Quarter Report 2018 31 May 2018 Unaudited Hong Leong Income Management Fund Contents Page Manager s Review and Report Statement by the Manager
INVESTORS' LETTER 1 MANAGER'S REPORT 2-7
 CONTENTS PAGE(S) INVESTORS' LETTER 1 MANAGER'S REPORT 2-7 Fund Objective and Policy Performance Data Market Review Fund Performance Portfolio Structure Market Outlook Investment Strategy Unit Holdings
TAIslamicFund. Forthe nancialyearended 31May2018 ( T)
") AnnualReport TAIslamicFund Forthe nancialyearended 31May2018 (340588-T) Contents Contents 1 Key Performance Data 2 Manager s Report 4 Market Review 7 Economic Outlook 8 Market Outlook And Investment Strategy
AnnualReport TAIslamicFund Forthe nancialyearended 31May2018 (340588-T) Contents Contents 1 Key Performance Data 2 Manager s Report 4 Market Review 7 Economic Outlook 8 Market Outlook And Investment Strategy
PRS Moderate Fund. Interim Report 31 January MANAGER Affin Hwang Asset Management Berhad ( T)
") Affin Hwang PRS Moderate Fund Interim Report 31 January 2017 MANAGER Affin Hwang Asset Management Berhad (429786-T) TRUSTEE CIMB Commerce Trustee Berhad (313031-A) AFFIN HWANG PRS MODERATE FUND Interim
Affin Hwang PRS Moderate Fund Interim Report 31 January 2017 MANAGER Affin Hwang Asset Management Berhad (429786-T) TRUSTEE CIMB Commerce Trustee Berhad (313031-A) AFFIN HWANG PRS MODERATE FUND Interim
Select Bond Fund. Annual Report 31 March MANAGER Affin Hwang Asset Management Berhad ( T) TRUSTEE HSBC (Malaysia) Trustee Berhad (1281-T)
 TRUSTEE HSBC (Malaysia) Trustee Berhad (1281-T)") Affin Hwang Select Bond Fund Annual Report 31 March 2016 MANAGER Affin Hwang Asset Management Berhad (429786-T) TRUSTEE HSBC (Malaysia) Trustee Berhad (1281-T) AFFIN HWANG SELECT BOND FUND Annual Report
Affin Hwang Select Bond Fund Annual Report 31 March 2016 MANAGER Affin Hwang Asset Management Berhad (429786-T) TRUSTEE HSBC (Malaysia) Trustee Berhad (1281-T) AFFIN HWANG SELECT BOND FUND Annual Report