LPL Financial Announces First Half and Second Quarter Financial Results
|
|
|
- Rafe Lindsey
- 5 years ago
- Views:
Transcription
, parent company of LPL Financial Corporation (\"LPL Financial\"), today announced net income of $8.0 million for the second quarter of 2010, down $7.6 million or 48.")
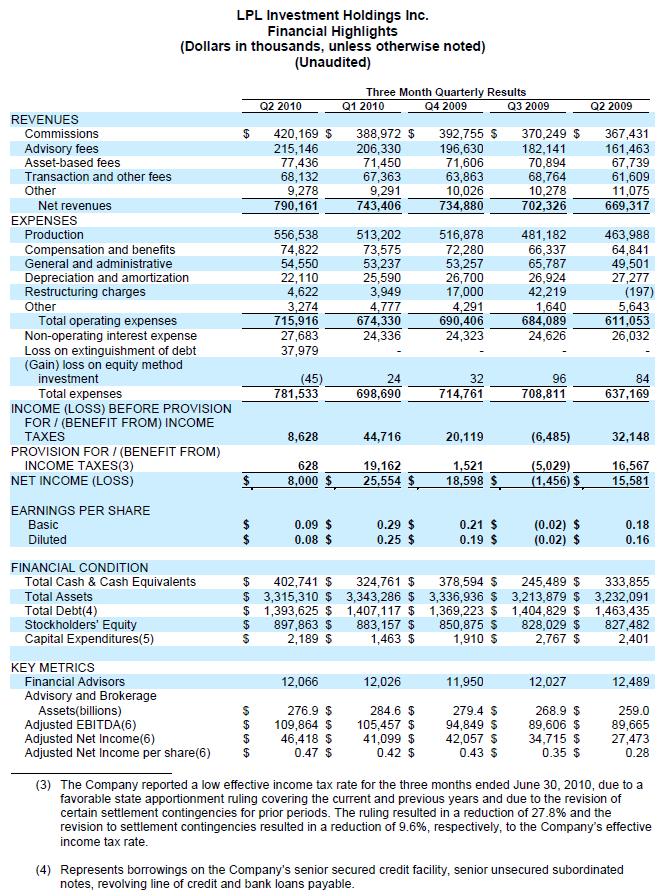
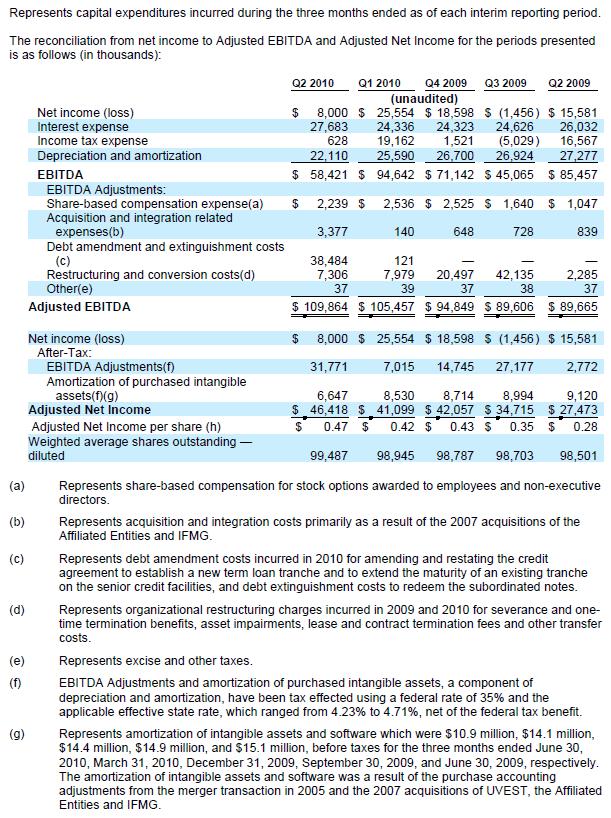
1 July 22, 2010 LPL Financial Announces First Half and Second Quarter Financial Results Boston, MA - July 22, LPL Investment Holdings Inc. (the "Company"), parent company of LPL Financial Corporation ("LPL Financial"), today announced net income of $8.0 million for the second quarter of 2010, down $7.6 million or 48.7% from the second quarter of Second quarter results include $23.1 million in after-tax debt financing expense which the Company incurred in a previously announced debt restructuring to enhance financial flexibility, and $2.8 million in after-tax restructuring charges related to the previously announced conversion of the operations of the affiliated entities to the Company's self clearing platform in the third quarter of Adjusted Net Income for the second quarter was $46.4 million, up 69.0% from the second quarter of 2009 (1). Adjusted EBITDA for the quarter increased 22.5% to $109.9 million from the second quarter of 2009 (1). A reconciliation of these non-gaap measures to GAAP measures, along with an explanation of these metrics, is provided below. For the first six months of 2010, net income of $33.6 million was up 10.5% compared to the same period in Adjusted Net Income through June year to date was $87.5 million, up 65.8% from the same period in Adjusted EBITDA for the first six months increased 25.5% to $215.3 million from the same period in Net revenue for the second quarter of 2010 increased 18.1% to $790.2 million over the same quarter for the prior year, and year to date increased 16.9% to $1.5 billion over the first six months of The Company's net revenue growth was driven primarily by the growth in advisory and brokerage assets, which increased 6.9% from $259.0 billion as of June 30, 2009, to $276.9 billion as of June 30, 2010, as well as by growth in the average productivity of the financial advisors. Operational Highlights The Company redeemed all of its senior unsecured subordinated notes, strengthening the balance sheet and enhancing financial flexibility. The decline in net income for the first six months and second quarter of 2010 is largely attributed to non-operating expenses incurred in connection with this debt retirement. On May 13, 2010, Moody's Investors Service revised the Company's corporate family rating outlook to positive from stable. On the same day, Standard & Poor's revised the Company's counterparty credit rating outlook to positive from stable. The Company continued to achieve growth with its fee-based platforms. Advisory assets were $78.9 billion as of June 30, 2010, up 20.8% from advisory assets of $65.3 billion as of June 30, Assets in the Company's cash sweep programs, which impacts asset-based fees, averaged $18.6 billion for the second quarter of 2010 and $21.3 billion for the same period in the prior year. Variance in fees generated from these assets are also impacted by the effective federal funds rate which averaged 0.19% for the second quarter of 2010 compared to 0.18% for the same period in the prior year.

2 In the second quarter of 2010, the Company added new bank and credit union partnerships, as well as continued to attract financial advisors and RIAs from wirehouses, insurance broker-dealers and other independent brokerage firms. Year over year growth was offset due to anticipated attrition related to the integration of the operations of three of the Company's affiliated broker-dealers, which was experienced in the third quarter of 2009 through the first quarter of Excluding the impact of the attrition due to this integration (720 advisors), LPL Financial added 297 net new advisor relationships year over year, representing 2.5% advisor growth. Financial advisors affiliated with the Company continued to earn distinction in key media and industry rankings. In June, six advisors were named to the Barron's Top 100 Women Financial Advisors in America, a prestigious ranking based on data provided by over 400 women financial advisors across the United States. Two LPL Financial advisors were among the ten advisors named in the Outstanding Advisor Awards of Registered Rep., a leading industry publication, which recognizes advisors who are superior performers in money management, client service and philanthropic activities. Additionally, two bank and credit union-based program managers affiliated with LPL Financial were named to the Bank Investment Consultant Top 20 Program Managers, a ranking based principally on average advisor productivity. Subsequent to the second quarter close, the Company announced on July 14, 2010, a definitive agreement under which it will acquire certain assets from National Retirement Partners Inc. ("NRP"). NRP's advisors offer products and services to retirement plan sponsors and participants and comprehensive financial services to high net worth individuals. Through this asset purchase, NRP's independent advisors will have the opportunity to join LPL Financial. This transaction will further enhance the capabilities and presence of LPL Financial in the group retirement plan space, while providing unique benefits for both NRP advisors who join LPL Financial as well as for existing LPL Financial advisors. The transaction is expected to close in the fourth quarter of 2010, subject to customary closing conditions including regulatory approvals. Please see the Company's July 14, 2010 press release for additional details.

3 About LPL Financial LPL Financial is an independent broker-dealer with over 2,500 employees and offices in Boston, Charlotte, and San Diego. LPL Financial and its affiliates offer proprietary technology, comprehensive clearing and compliance services, practice management programs and training, and independent research to over 12,000 independent financial advisors and financial advisors at financial institutions. Additionally, the company supports over 4,000 financial advisors who are affiliated and licensed with insurance companies with customized clearing, advisory platforms and technology solutions. For more information, please visit Member FINRA/SIPC Forward-Looking Statements This press release may contain forward-looking statements (regarding the Company's future financial condition, results of operations, business strategy and financial needs, and other similar matters) that involve risks and uncertainties. Forward-
4 looking statements can be identified by words such as "anticipates," "expects," "believes," "plans," "predicts," and similar terms. Forward-looking statements are not guarantees of future performance and actual results may differ significantly from the results discussed in the forward-looking statements. Important factors that may cause such differences include, but are not limited to, changes in general economic and financial market conditions, fluctuations in the value of assets under management, effects of competition in the financial services industry, changes in the number of the Company's financial advisors and institutions and their ability to effectively market financial products and services, the effect of current, pending and future legislation, regulation and regulatory actions, and other factors set forth in the Company's Amendment No. 2 to Form S-1/A filed on July 9, 2010, which is available on and Use of Non-GAAP Financial Measures Adjusted Net Income represents net income before: (a) share-based compensation expense, (b) amortization of intangible assets and software, a component of depreciation and amortization, resulting from the merger transaction in 2005 and the 2007 acquisition of UVEST, the Affiliated Entities, and IFMG, (c) debt amendment and extinguishment costs and (d) restructuring and conversion costs. Reconciling items are tax effected using the income tax rates in effect for the applicable period, adjusted for any potentially non-deductible amounts. Adjusted Net Income per share represents Adjusted Net Income divided by weighted average outstanding shares on a fully diluted basis. The Company prepared Adjusted Net Income and Adjusted Net Income per share to eliminate the effects of items that it does not consider indicative of its core operating performance. The Company believes this measure provides investors with greater transparency by helping illustrate the underlying financial and business trends relating to results of operations and financial condition and comparability between current and prior periods. Adjusted Net Income and Adjusted Net Income per share are not measures of the Company's financial performance under GAAP and should not be considered as an alternative to net income or earnings per share or any other performance measure derived in accordance with GAAP, or as an alternative to cash flows from operating activities as a measure of profitability or liquidity. Adjusted EBITDA is defined as EBITDA (net income plus interest expense, income tax expense, depreciation and amortization), further adjusted to exclude certain non-cash charges and other adjustments set forth in the table above. The Company presents Adjusted EBITDA because the Company considers it a useful financial metric in assessing the Company's operating performance from period to period by excluding certain items that the Company believes are not representative of its core business, such as certain material non-cash items and other adjustments that are outside the control of management. Adjusted EBITDA is a non-gaap measure as defined by Regulation G under the Securities Act and does not purport to be an alternative to net income as a measure of operating performance or to cash flows from operating activities as a measure of liquidity. In addition, Adjusted EBITDA can differ significantly from company to company depending on long-term strategic decisions regarding capital structure, the tax jurisdictions in which companies operate and capital investments.

5
6
7
 428-3215 Email: investor.")
8 Media Relations Michael Herley / David Lilly Kekst and Company Phone: or media.inquiries@lpl.com Investor Relations Ian Lee Solebury Communications Group LLC Phone: (203) investor.relations@lpl.com
LPL Financial Announces Fourth Quarter and Full-Year 2010 Financial Results
 February 7, 2011 LPL Financial Announces Fourth Quarter and Full-Year Financial Results Record Levels of Advisory and Brokerage Assets Help Fuel Record Full Year Profitability Strong Net New Advisor Growth
LPL Financial Announces Financial Results for First Quarter 2013
 April 25, 2013 LPL Financial Announces Financial Results for First Quarter 2013 - Improved Advisor Productivity and Market Conditions Lift Assets to $394 Billion Leading to Record Revenue of $975 Million
LPL Financial Announces Financial Results for Second Quarter 2013
 July 31, 2013 LPL Financial Announces Financial Results for Second Quarter 2013 - Record-Setting Net Revenue Exceeds $1 Billion - - Quarterly Dividend Raised 40% to $0.19 Per Share - BOSTON, July 31, 2013
LPL Financial Announces Third Quarter 2017 Results
 Investor Relations - Chris Koegel, (617) 897-4574 For Immediate Release Media Relations - Jeff Mochal, (704) 733-3589 investor.lpl.com/contactus.cfm LPL Financial Announces Third Quarter 2017 Results Key
LPL Financial Announces Second Quarter 2017 Results
 Investor Relations - Chris Koegel, (617) 897-4574 For Immediate Release Media Relations - Jeff Mochal, (704) 733-3589 investor.lpl.com/contactus.cfm LPL Financial Announces Second Quarter 2017 Results
LPL Financial Announces Third Quarter 2016 Results
 Investor Relations - Chris Koegel, (617) 897-4574 For Immediate Release Media Relations - Jeff Mochal, (704) 733-3589 investor.lpl.com/contactus.cfm LPL Financial Announces Third Quarter 2016 Results Key
William Blair Growth Stock Conference June 15, Member FINRA/SIPC
 William Blair Growth Stock Conference June 15, 2011 Member FINRA/SIPC Safe Harbor Disclosure The following information contains forward-looking statements. Forward-looking statements include statements
Bottomline Technologies Reconciliation to Non GAAP Measures Three Months Ended June 30, 2013
 Reconciliation to Measures Three Months Ended June 30, 2013 Non Cash Amortization of Equity Based Integration Restructuring Interest GAAP Intangible Assets Compensation Related Expenses Expenses Expense
Q Earnings Key Metrics
 Q2 2017 Earnings Key Metrics LPL Financial Holdings Inc. Q2 2017 Earnings July 27, 2017 Member FINRA/SIPC 1 Notice to Investors: Non-GAAP Financial Measures The management of LPL Financial Holdings Inc.
Q Earnings Key Metrics
 Q1 2017 Earnings Key Metrics LPL Financial Holdings Inc. Q1 2017 Earnings April 27, 2017 Member FINRA/SIPC 1 Notice to Investors: Non-GAAP Financial Measures The management of LPL Financial Holdings Inc.
Q Earnings Key Metrics
 Q3 2017 Earnings Key Metrics LPL Financial Holdings Inc. Q3 2017 Earnings October 26, 2017 Member FINRA/SIPC 1 Notice to Investors: Non-GAAP Financial Measures The management of LPL Financial Holdings
Q Earnings Key Metrics
 Q4 2017 Earnings Key Metrics LPL Financial Holdings Inc. Q4 2017 Earnings February 1, 2018 Member FINRA/SIPC 1 Notice to Investors: Safe Harbor Statement Statements in this presentation regarding LPL Financial
LPL Financial Announces Second Quarter 2018 Results
 Investor Relations - Chris Koegel, (617) 897-4574 For Immediate Release Media Relations - Jeff Mochal, (704) 733-3589 investor.lpl.com/contactus.cfm LPL Financial Announces Second Quarter 2018 Results
LPL Financial. Purchase of National Planning Holdings, Inc. August 15, Member FINRA/SIPC
 LPL Financial Purchase of National Planning Holdings, Inc. August 15, 2017 Member FINRA/SIPC Notice to Investors: Safe Harbor Statement Statements in this presentation regarding LPL Financial Holdings
Q Earnings Key Metrics
 Q1 2018 Earnings Key Metrics LPL Financial Holdings Inc. Q1 2018 Earnings May 3, 2018 Member FINRA/SIPC 1 Notice to Investors: Safe Harbor Statement Statements in this presentation regarding LPL Financial
LPL Financial. Investor Presentation Q October 26, Member FINRA/SIPC
 LPL Financial Investor Presentation Q3 2017 October 26, 2017 Member FINRA/SIPC Notice to Investors: Safe Harbor Statement Statements in this presentation regarding the Company's future financial and operating
The Strength of Partnership:
 The Strength of Partnership: Preparing for Changes in the Retirement Plan Marketplace Plan Sponsor and Employer Guide LPL Financial Navigating the Sea Change in Retirement Plans As an employer, you share
E*TRADE FINANCIAL CORPORATION ANNOUNCES FOURTH QUARTER AND FULL YEAR 2018 RESULTS
 FOR IMMEDIATE RELEASE E*TRADE Media Relations 646-521-4418 mediainq@etrade.com E*TRADE Investor Relations 646-521-4406 ir@etrade.com E*TRADE FINANCIAL CORPORATION ANNOUNCES FOURTH QUARTER AND FULL YEAR
Q September Member FINRA/SIPC
 Q3 2012 Investor Meetings September 2012 Member FINRA/SIPC Safe harbor disclosure The following information contains forward-looking statements. Forward-looking statements include statements regarding
E*TRADE FINANCIAL CORPORATION ANNOUNCES FOURTH QUARTER AND FULL YEAR 2017 RESULTS. E*TRADE Bank reduces Tier 1 leverage ratio threshold to 7.
 FOR IMMEDIATE RELEASE E*TRADE Media Relations 646-521-4418 mediainq@etrade.com E*TRADE Investor Relations 646-521-4406 ir@etrade.com E*TRADE FINANCIAL CORPORATION ANNOUNCES FOURTH QUARTER AND FULL YEAR
Reconciliation of Non-GAAP Metrics and Definitions
 Reconciliation of Non-GAAP Metrics and Definitions Definitions of Non-GAAP Financial Measures Adjusted EBITDA GAAP net income excluding the following items: interest income; income taxes; depreciation
Fourth Quarter and Full-Year 2018 Earnings Call February 20, 2019
 Fourth Quarter and Full-Year 2018 Earnings Call February 20, 2019 1 2019 2017 ServiceSource International, Inc. All rights reserved. Important Information This presentation refers to certain non-gaap financial
Ladenburg Thalmann Reports Fourth Quarter and Full Year 2013 Results
 March 13, 2014 Ladenburg Thalmann Reports Fourth Quarter and Full Year 2013 Results Revenues Increase 22% to Record $793 Million in 2013 Total Client Assets Exceed $85 Billion Shareholders Equity of $193.4
LPL Financial. Bernstein s 34 th Annual Strategic Decisions Conference. May 31, Member FINRA/SIPC
 LPL Financial Bernstein s 34 th Annual Strategic Decisions Conference May 31, 2018 Member FINRA/SIPC Notice to Investors: Safe Harbor Statement Statements in this presentation regarding LPL Financial Holdings
ITRON, INC. CONSOLIDATED STATEMENTS OF OPERATIONS
 , INC. CONSOLIDATED STATEMENTS OF OPERATIONS (Unaudited, in thousands, except per share data) Revenues $ 447,536 $ 571,640 Cost of revenues 307,413 388,535 Gross profit 140,123 183,105 Operating expenses
ITRON, INC. CONSOLIDATED STATEMENTS OF OPERATIONS
 , INC. CONSOLIDATED STATEMENTS OF OPERATIONS (Unaudited, in thousands, except per share data) Revenues $ 489,353 $ 482,175 $ 964,148 $ 929,711 Cost of revenues 326,312 322,587 646,572 630,000 Gross profit
ITRON, INC. CONSOLIDATED STATEMENTS OF OPERATIONS
 , INC. CONSOLIDATED STATEMENTS OF OPERATIONS (Unaudited, in thousands, except per share data) Revenues $ 474,795 $ 447,536 Cost of revenues 320,260 307,413 Gross profit 154,535 140,123 Operating expenses
ITRON, INC. CONSOLIDATED STATEMENTS OF OPERATIONS
 , INC. CONSOLIDATED STATEMENTS OF OPERATIONS (Unaudited, in thousands, except per share data) Revenues $ 571,640 $ 563,691 Cost of revenues 388,535 378,713 Gross profit 183,105 184,978 Operating expenses
FAIR ISAAC CORPORATION CONDENSED CONSOLIDATED BALANCE SHEETS (In thousands) (Unaudited)
 (Unaudited)") CONDENSED CONSOLIDATED BALANCE SHEETS (In thousands) June 30, September 30, 2018 2017 ASSETS: Current assets: Cash and cash equivalents $ 119,929 $ 105,618 Accounts receivable, net 182,419 168,586 Prepaid
CONDENSED CONSOLIDATED BALANCE SHEETS (In thousands) June 30, September 30, 2018 2017 ASSETS: Current assets: Cash and cash equivalents $ 119,929 $ 105,618 Accounts receivable, net 182,419 168,586 Prepaid
FAIR ISAAC CORPORATION CONDENSED CONSOLIDATED BALANCE SHEETS (In thousands) (Unaudited)
 (Unaudited)") CONDENSED CONSOLIDATED BALANCE SHEETS (In thousands) 2018 2017 ASSETS: Current assets: Cash and cash equivalents $ 90,023 $ 105,618 Accounts receivable, net 208,865 168,586 Prepaid expenses and other current
CONDENSED CONSOLIDATED BALANCE SHEETS (In thousands) 2018 2017 ASSETS: Current assets: Cash and cash equivalents $ 90,023 $ 105,618 Accounts receivable, net 208,865 168,586 Prepaid expenses and other current
Fourth Quarter Financial Supplement
 Fourth Quarter 2015 Financial Supplement Table of Contents Financial Highlights 1 and Group Insurance Statistics 2 Membership 3 Statements of Net Income (Loss) by Segment 4-5 Balance Sheets 6 Condensed
THE POWER OF AFFILIATION
 CONFIDENT CHOICES We offer no proprietary investment products and engage in no investment banking activities, which means: 1. Our research and market insights are always objective. 2. Your advisor is free
ITRON, INC. CONSOLIDATED STATEMENTS OF OPERATIONS
 , INC. CONSOLIDATED STATEMENTS OF OPERATIONS (Unaudited, in thousands, except per share data) Revenues $ 470,103 $ 489,353 $ 918,350 $ 964,148 Cost of revenues 351,532 326,312 661,580 646,572 Gross profit
ITRON, INC. CONSOLIDATED STATEMENTS OF OPERATIONS
 , INC. CONSOLIDATED STATEMENTS OF OPERATIONS (Unaudited, in thousands, except per share data) Revenues $ 504,063 $ 615,555 $ 1,654,843 $ 1,791,647 Cost of revenues 332,266 438,559 1,103,196 1,237,722 Gross
ITRON, INC. CONSOLIDATED STATEMENTS OF OPERATIONS
 , INC. CONSOLIDATED STATEMENTS OF OPERATIONS (Unaudited, in thousands, except per share data) Revenues $ 523,335 $ 642,477 $ 2,178,178 $ 2,434,124 Cost of revenues 359,835 449,944 1,463,031 1,687,666 Gross
STIFEL REPORTS FOURTH QUARTER AND FULL-YEAR 2018 FINANCIAL RESULTS
 February 1, 2019 FOR IMMEDIATE RELEASE Media Contact: Neil Shapiro (212) 895-1891 Investor Contact: Joel Jeffrey (212) 271-3610 www.stifel.com/investor-relations STIFEL REPORTS FOURTH QUARTER AND FULL-YEAR
TransUnion Reports Third Quarter 2011 Results
 gb0 Contact E-mail David McCrary TransUnion investor.relations@transunion.com Telephone 312 985 2860 CHICAGO, November 7, 2011 TransUnion Reports Third Quarter 2011 Results TransUnion Corp. ( TransUnion
LPL Financial. Goldman Sachs US Financial Services Conference December 4, Member FINRA/SIPC
 LPL Financial Goldman Sachs US Financial Services Conference 2018 December 4, 2018 Member FINRA/SIPC Notice to Investors: Safe Harbor Statement Statements in this presentation regarding LPL Financial Holdings
Reconciliation of Non-GAAP Financial Measures. Adjusted Operating Income Reconciliation
 Reconciliation of Non-GAAP Financial Measures Adjusted Operating Income Reconciliation Adjusted operating income is not a measure of financial performance under generally accepted accounting principles
Reconciliation of Non-GAAP Items Required by SEC Rules
 2016 ACTUAL RESULTS CVS Health is providing non-gaap information that excludes certain items because of the nature of these items and the impact they have on the analysis of underlying business performance
Safe Harbor. Non-GAAP Financial Information
 1 Safe Harbor This document contains forward-looking statements within the meaning of the Private Securities Litigation Reform Act of 1995, including financial projections subject to risks, uncertainties
(Unaudited) Reconciliation GAAP to Non-GAAP (In thousands) Pro Forma As Adjusted. Pro Forma Adjustments. Pro Forma As Adjusted. Pro Forma Adjustments
 Reconciliation GAAP to Non-GAAP (In thousands) Pro Forma As Adjusted. Pro Forma Adjustments. Pro Forma As Adjusted. Pro Forma Adjustments") Supplemental Presentation of Selected Quarterly Non-GAAP Financial Information for Fiscal Years 2014-2015, Including Proforma Related to Automotive Business Divesture and Reconciliation to GAAP As announced
Supplemental Presentation of Selected Quarterly Non-GAAP Financial Information for Fiscal Years 2014-2015, Including Proforma Related to Automotive Business Divesture and Reconciliation to GAAP As announced
LPL Financial. Credit Suisse 19 th Annual Financial Services Forum. February 13, Member FINRA/SIPC
 LPL Financial Credit Suisse 19 th Annual Financial Services Forum February 13, 2018 Member FINRA/SIPC Notice to Investors: Safe Harbor Statement Statements in this presentation regarding LPL Financial
E*TRADE GROUP, INC. REPORTS 364 PERCENT GROWTH IN EARNINGS PER SHARE FROM ONGOING OPERATIONS AND 13 PERCENT GROWTH IN REVENUE YEAR OVER YEAR
 FOR IMMEDIATE RELEASE E*TRADE Financial Media Contact Connie Dotson E*TRADE Group, Inc. 916-858-8835 mediainq@etrade.com E*TRADE Financial Investor Relations Contact Robert Simmons E*TRADE Group, Inc.
The NASDAQ OMX Group. Q110 Earnings Presentation. April 30, 2010
 The NASDAQ OMX Group Q110 Earnings Presentation April 30, 2010 Disclaimers Cautionary Note Regarding Forward-Looking Statements Information set forth in this communication contains forward-looking statements
Itron, Inc. Comparison of Key 2015 Financial Metrics to Preliminary Results Announced February 17, Total operating expenses 486, ,839
 Itron, Inc. Comparison of Key 2015 Financial Metrics to Preliminary Results Announced February 17, 2016 (Unaudited, in thousands, except per share data) (announced Feb. 17, 2016) Preliminary FY 2015 Final
Investor Contact: Charlotte McLaughlin HD Supply Investor Relations
 Investor Contact: Charlotte McLaughlin HD Supply Investor Relations 770-852-9100 InvestorRelations@hdsupply.com Media Contact: Quiana Pinckney, APR HD Supply Public Relations 770-852-9057 Quiana.Pinckney@hdsupply.com
LPL Financial. Investor Presentation Q February 12, Member FINRA/SIPC
 LPL Financial Investor Presentation Q4 2018 February 12, 2019 Member FINRA/SIPC Notice to Investors: Safe Harbor Statement Statements in this presentation regarding LPL Financial Holdings Inc. s (together
LPL Financial LLC (SEC I.D. No )
") 75 State Street, 22nd Floor Boston, MA 02109 1055 LPL Way Fort Mill, SC 29715 4707 Executive Drive San Diego, CA 92121 LPL Financial LLC (SEC I.D. No. 8-17668) Statement of Financial Condition June 30,
75 State Street, 22nd Floor Boston, MA 02109 1055 LPL Way Fort Mill, SC 29715 4707 Executive Drive San Diego, CA 92121 LPL Financial LLC (SEC I.D. No. 8-17668) Statement of Financial Condition June 30,
December 4, Business Unit Performance. Facilities Maintenance
 HD Supply Holdings, Inc. Announces Fiscal Third-Quarter Results, Raises Full-Year Guidance Midpoint and Announces an Additional $500 million Share Repurchase Authorization December 4, ATLANTA, Dec. 04,
FTI Consulting Reports Second Quarter 2013 Results
 FTI Consulting, Inc. 777 South Flagler Drive, Suite 1500 West Palm Beach, FL 33401 +1.561.515.6078 Investor & Media Contact: Mollie Hawkes +1.617.747.1791 mollie.hawkes@fticonsulting.com FTI Consulting
E*TRADE FINANCIAL CORPORATION ANNOUNCES SECOND QUARTER 2018 RESULTS
 FOR IMMEDIATE RELEASE E*TRADE Media Relations 646-521-4418 mediainq@etrade.com E*TRADE Investor Relations 646-521-4406 ir@etrade.com E*TRADE FINANCIAL CORPORATION ANNOUNCES SECOND QUARTER 2018 RESULTS
THE POWER OF AFFILIATION. Supporting Your Financial Advisor Who Serves You
 THE POWER OF AFFILIATION Supporting Your Financial Advisor Who Serves You Effective wealth management is enhanced by the right partner. In the same way you benefit from the knowledge and guidance of your
PURSUE YOUR FINANCIAL GOALS. Model Wealth Portfolios
 PURSUE YOUR FINANCIAL GOALS Model Wealth Portfolios INVESTMENT STRATEGIES FOR THE ROAD AHEAD Your financial advisor has the tools and experience to help you evaluate your situation and adapt your investment
CSG SYSTEMS INTERNATIONAL, INC. DISCLOSURES FOR NON-GAAP FINANCIAL MEASURES
 CSG SYSTEMS INTERNATIONAL, INC. DISCLOSURES FOR NON-GAAP FINANCIAL MEASURES Use of Non-GAAP Financial Measures and Limitations To supplement its condensed consolidated financial statements presented in
NIELSEN REPORTS FIRST QUARTER 2011 RESULTS
 News Release Investor Relations: Liz Zale, +1 646 654 4593 Media Relations: Kristie Bouryal, +1 646 654 5577 NIELSEN REPORTS FIRST QUARTER 2011 RESULTS Revenue for the quarter grew 8.9% to $1,302 million,
j2 Global Reports Fourth Quarter and Year End 2018 Results and Provides 2019 Outlook
 j2 Global Reports Fourth Quarter and Year End 2018 Results and Provides 2019 Outlook February 12, 2019 Achieves Record Revenues Provides Fiscal 2019 Financial Estimates Announces Thirtieth Consecutive
GAAP/Non-GAAP Reconciliation and Other Management Metrics. 3rd Quarter 2017
 GAAP/Non-GAAP Reconciliation and Other Management Metrics 3rd Quarter 2017 Use of Non-GAAP Financial Information Use of Non-GAAP Financial Information The Company occasionally utilizes financial measures
Q Financial Supplement
 Reconcilation of GAAP and Non-GAAP Financial Measures Non-GAAP Net Income and Non-GAAP EPS (in thousands except per share data) 2014 2015 Three Months Ending June 30, Low Range Guidance (1) High Range
CC Media Holdings, Inc. Reports Second Quarter 2009 Results
 CC Media Holdings, Inc. Reports Second Quarter 2009 Results ---------------- San Antonio, Texas August 10, 2009 CC Media Holdings, Inc. (OTCBB: CCMO) today reported results for its second quarter ended
NASDAQ OMX ANNOUNCES FOURTH QUARTER 2009 RESULTS - NON-GAAP DILUTED EPS $0.46 (GAAP DILUTED EPS $0.20)
") NEWS RELEASE February 8, 2010 NASDAQ OMX ANNOUNCES FOURTH QUARTER 2009 RESULTS - NON-GAAP DILUTED EPS $0.46 (GAAP DILUTED EPS $0.20) New York, N.Y. The NASDAQ OMX Group, Inc. ("NASDAQ OMX "; NASDAQ: NDAQ)
NEWS RELEASE February 8, 2010 NASDAQ OMX ANNOUNCES FOURTH QUARTER 2009 RESULTS - NON-GAAP DILUTED EPS $0.46 (GAAP DILUTED EPS $0.20) New York, N.Y. The NASDAQ OMX Group, Inc. ("NASDAQ OMX "; NASDAQ: NDAQ)
TD AMERITRADE Holding Corporation
 www.amtd.com TD AMERITRADE Holding Corporation TD AMERITRADE Holding Corporation, through its brokerage subsidiaries, (1) combines innovative trading technology, easy-to-use and understand trading tools,
Disclaimers. Cautionary Note Regarding Forward-Looking Statements. Non-GAAP Information. Website Disclosure
 The NASDAQ OMX Group Q409 Earnings Presentation February 8, 2010 Disclaimers Cautionary Note Regarding Forward-Looking Statements Information set forth in this communication contains forward-looking statements
ON SEMICONDUCTOR CORPORATION AND SUBSIDIARIES UNAUDITED CONSOLIDATED STATEMENT OF OPERATIONS (in millions, except per share data)
") ON SEMICONDUCTOR CORPORATION AND SUBSIDIARIES UNAUDITED CONSOLIDATED STATEMENT OF OPERATIONS (in millions, except per share data) Quarter Ended October 2, Year Ended Revenues $ 840.3 $ 904.2 $ 864.2 $
ON SEMICONDUCTOR CORPORATION AND SUBSIDIARIES UNAUDITED CONSOLIDATED STATEMENT OF OPERATIONS (in millions, except per share data) Quarter Ended October 2, Year Ended Revenues $ 840.3 $ 904.2 $ 864.2 $
Analog Devices, Fourth Quarter, Fiscal Schedule A Revenue and Earnings Summary (Unaudited) (In thousands, except per-share amounts) Nov.
 (In thousands, except per-share amounts) Nov.") Analog Devices, Fourth Quarter, Fiscal Schedule A Revenue and Earnings Summary (Unaudited) (In thousands, except per-share amounts) Revenue $ 814,247 $ 727,752 $ 678,133 $ 2,864,773 $ 2,633,689 Year-to-year
Analog Devices, Fourth Quarter, Fiscal Schedule A Revenue and Earnings Summary (Unaudited) (In thousands, except per-share amounts) Revenue $ 814,247 $ 727,752 $ 678,133 $ 2,864,773 $ 2,633,689 Year-to-year
HD Supply Holdings, Inc. Announces Fiscal 2016 Third-Quarter Results
 Investor Contact: Charlotte McLaughlin HD Supply Investor Relations 770-852-9100 InvestorRelations@hdsupply.com Media Contact: Quiana Pinckney, APR HD Supply Public Relations 770-852-9057 Quiana.Pinckney@hdsupply.com
4 th Quarter 2018 Earnings Release Conference Call
 4 th Quarter 2018 Earnings Release Conference Call February 20, 2019 1 2019 Belden Inc. belden.com @beldeninc Safe Harbor Statement Our commentary and responses to your questions may contain forward-looking
Web.com Reports Fourth Quarter and Full Year 2017 Financial Results
 Web.com Reports Fourth Quarter and Full Year 2017 Financial Results Strong financial and operating performance in the fourth quarter Significant progress on strategic priorities for the year Generated
Endurance International Group Reports 2017 Fourth Quarter and Full Year Results
 Endurance International Group Reports 2017 Fourth Quarter and Full Year Results Fiscal Year 2017 GAAP revenue of $1.177 billion Net loss of $99.8 million Adjusted EBITDA of $350.8 million Cash flow from
UNITED RENTALS, INC. CONDENSED CONSOLIDATED STATEMENTS OF INCOME (UNAUDITED) (In millions, except per share amounts)
 (In millions, except per share amounts)") CONDENSED CONSOLIDATED STATEMENTS OF INCOME (UNAUDITED) (In millions, except per share amounts) Revenues: Equipment rentals $ 916 $ 523 Sales of rental equipment 123 76 Sales of new equipment 21 18 Contractor
CONDENSED CONSOLIDATED STATEMENTS OF INCOME (UNAUDITED) (In millions, except per share amounts) Revenues: Equipment rentals $ 916 $ 523 Sales of rental equipment 123 76 Sales of new equipment 21 18 Contractor
Ceridian Reports Second Quarter 2018 Results
 Ceridian Reports Second Quarter 2018 Results Cloud revenue of $127.8 million, up 35.5% year-over-year Total revenue of $179.3 million, up 13.8% year-over-year Operating loss of $11.3 million, which includes
Q Earnings. GAAP to Non-GAAP Reconciliation
 Q1 2012 Earnings GAAP to Non-GAAP Reconciliation This presentation contains forward-looking statements relating to, among other things, our outlook for full year 2012 bookings, adjusted EBITDA, stock-based
FAIR ISAAC CORPORATION CONDENSED CONSOLIDATED BALANCE SHEETS (In thousands) (Unaudited)
 (Unaudited)") CONDENSED CONSOLIDATED BALANCE SHEETS (In thousands) June 30, September 30, 2016 2015 ASSETS: Current assets: Cash and cash equivalents $ 118,155 $ 86,120 Accounts receivable, net 155,196 158,773 Prepaid
CONDENSED CONSOLIDATED BALANCE SHEETS (In thousands) June 30, September 30, 2016 2015 ASSETS: Current assets: Cash and cash equivalents $ 118,155 $ 86,120 Accounts receivable, net 155,196 158,773 Prepaid
ABOUT LPL FINANCIAL. The strength of partnership
 ABOUT LPL FINANCIAL The strength of partnership supporting FINANCIAL advisors who serve you the need for objective advice has never been greater Amid an ever-changing investment landscape, investors need
LPL RETIREMENT PLAN ADVISORS
 LPL RETIREMENT PLAN ADVISORS Providing Tools for Plan Success ADDRESSING THE CHALLENGE If you re like most plan sponsors, you have many demanding challenges competing for your attention. LPL advisors work
FAIR ISAAC CORPORATION CONDENSED CONSOLIDATED BALANCE SHEETS (In thousands) (Unaudited)
 (Unaudited)") CONDENSED CONSOLIDATED BALANCE SHEETS (In thousands) March 31, September 30, 2016 2015 ASSETS: Current assets: Cash and cash equivalents $ 85,374 $ 86,120 Accounts receivable, net 155,207 158,773 Prepaid
CONDENSED CONSOLIDATED BALANCE SHEETS (In thousands) March 31, September 30, 2016 2015 ASSETS: Current assets: Cash and cash equivalents $ 85,374 $ 86,120 Accounts receivable, net 155,207 158,773 Prepaid
HD Supply Holdings, Inc. Announces 2017 Second-Quarter Results and Reaffirms Full-Year Guidance
 Investor Contact: Charlotte McLaughlin HD Supply Investor Relations 770-852-9100 InvestorRelations@hdsupply.com Media Contact: Quiana Pinckney HD Supply Public Relations 770-852-9057 Quiana.Pinckney@hdsupply.com
HD Supply Holdings, Inc. Announces 2017 Third-Quarter Results, Raises Full-Year Guidance
 Investor Contact: Charlotte McLaughlin HD Supply Investor Relations 770-852-9100 InvestorRelations@hdsupply.com Media Contact: Quiana Pinckney, APR HD Supply Public Relations 770-852-9057 Quiana.Pinckney@hdsupply.com
Investors: Michael D. Neese VP, Investor Relations (804)
") NEWS RELEASE For Immediate Release August 17, 2016 Investors: Michael D. Neese VP, Investor Relations (804) 287-8126 michael.neese@pfgc.com Media: Joe Vagi Manager, Corporate Communications (804) 484-7737
NEWS RELEASE For Immediate Release August 17, 2016 Investors: Michael D. Neese VP, Investor Relations (804) 287-8126 michael.neese@pfgc.com Media: Joe Vagi Manager, Corporate Communications (804) 484-7737
Ceridian Reports Fourth Quarter and Full Year 2018 Results
 Ceridian Reports Fourth Quarter and Full Year Results Fourth quarter Cloud revenue of $148.3 million, up 27.5% year-over-year Fourth quarter total revenue of $200.3 million, up 9.8% year-over-year Excluding
LPL Financial LLC (SEC I.D. No )
") 75 State Street, 22th Floor Boston, MA 02109 1055 LPL Way Fort Mill, SC 29715 4707 Executive Drive San Diego, CA 92121 LPL Financial LLC (SEC I.D. No. 8-17668) Statement of Financial Condition December
75 State Street, 22th Floor Boston, MA 02109 1055 LPL Way Fort Mill, SC 29715 4707 Executive Drive San Diego, CA 92121 LPL Financial LLC (SEC I.D. No. 8-17668) Statement of Financial Condition December
Web.com Reports Fourth Quarter and Full Year 2016 Financial Results
 Web.com Group, Inc. 12808 Gran Bay Parkway West Jacksonville, FL 32258 T: (904) 680-6600 F: (904) 880-0350 NASDAQ: WEB Web.com Reports Fourth Quarter and Full Year 2016 Financial Results Solid progress
CommScope Holding Company, Inc. Condensed Consolidated Statements of Operations (Unaudited -- In thousands, except per share amounts)
") Condensed Consolidated Statements of Operations (Unaudited -- In thousands, except per share amounts) Three Months Ended March 31, 2018 2017 Net sales $ 1,120,517 $ 1,137,285 Operating costs and expenses:
Condensed Consolidated Statements of Operations (Unaudited -- In thousands, except per share amounts) Three Months Ended March 31, 2018 2017 Net sales $ 1,120,517 $ 1,137,285 Operating costs and expenses:
Colliers International Group Inc.
 Colliers International Group Inc. Third Quarter 2017 Financial Results October 31, 2017 Forward-Looking Statements This presentation includes or may include forward-looking statements. Forward-looking
Nielsen Holdings N.V. Reports Fourth Quarter and Full Year 2010 Results
 March 01, 2011 Nielsen Holdings N.V. Reports Fourth Quarter and Full Year 2010 Results Revenue for the year grew 6.6% to $5,126 million, 6.1% constant currency Adjusted EBITDA for the year grew 7.5% to
ServiceNow, Inc. Condensed Consolidated Statements of Operations (in thousands, except share and per share data) (Unaudited)
 (Unaudited)") Condensed Consolidated Statements of Operations (in thousands, except share and per share data) Revenues: Subscription $ 179,907 $ 117,375 Professional services and other 32,057 21,715 Total revenues 211,964
Condensed Consolidated Statements of Operations (in thousands, except share and per share data) Revenues: Subscription $ 179,907 $ 117,375 Professional services and other 32,057 21,715 Total revenues 211,964
Q Earnings. GAAP to Non-GAAP
 Q4 2011 Earnings GAAP to Non-GAAP Reconciliation This presentation contains forward-looking statements relating to, among other things, our outlook for full year 2012 bookings, adjusted EBITDA, stock-based
ServiceNow, Inc. Condensed Consolidated Statements of Operations (in thousands, except share and per share data)
") Condensed Consolidated Statements of Operations (in thousands, except share and per share data) December 31, 2015 December 31, 2014 December 31, 2015 December 31, 2014 Revenues: Subscription $ 244,702
Condensed Consolidated Statements of Operations (in thousands, except share and per share data) December 31, 2015 December 31, 2014 December 31, 2015 December 31, 2014 Revenues: Subscription $ 244,702
Virtu Announces Third Quarter 2017 Results
 Virtu Announces Third Quarter 2017 Results NEW YORK, NY, November 7, 2017 Virtu Financial, Inc. (NASDAQ: VIRT), a leading technology-enabled market maker and liquidity provider to the global financial
MSCI. Raymond James 38 th Annual Institutional Investors Conference. Kathleen Winters, CFO. March 8, 2017
 MSCI Raymond James 38 th Annual Institutional Investors Conference Kathleen Winters, CFO March 8, 2017 2017 MSCI Inc. All rights reserved. Please refer to the disclaimer at the end of this document. FORWARD
Platform Specialty Products Corporation Announces Third Quarter 2018 Financial Results
 Platform Specialty Products Corporation Announces Third Quarter 2018 Financial Results Net sales from continuing operations increased 2% on a reported basis to $489 million; growth of 3% on an organic
Second Quarter 2017 Reconciliation of Non-GAAP Financial Measures
 Second Quarter 2017 Reconciliation of Non-GAAP Financial Measures Adjusted Operating Income Reconciliation Adjusted operating income is not a measure of financial performance under generally accepted accounting
Sapient Reports First Quarter 2011 Results
 For Immediate Release Reports First Quarter 2011 Results Service Revenues Up 32% Over Q1 2010 Non-GAAP Operating Profit Increases 74% Over Q1 2010 Investor Relations Contact: Dean Ridlon tel: +1.617.963.1598
SEAGATE TECHNOLOGY PLC CONDENSED CONSOLIDATED BALANCE SHEETS (In millions) (Unaudited)
 (Unaudited)") CONDENSED CONSOLIDATED BALANCE SHEETS (In millions) ASSETS June 30, (a) Current assets: Cash and cash equivalents $ 2,285 $ 2,539 Accounts receivable, net 1,209 1,199 Inventories 1,014 982 Other current
CONDENSED CONSOLIDATED BALANCE SHEETS (In millions) ASSETS June 30, (a) Current assets: Cash and cash equivalents $ 2,285 $ 2,539 Accounts receivable, net 1,209 1,199 Inventories 1,014 982 Other current
Novatel Wireless Reports Second Quarter 2013 Financial Results
 August 7, 2013 Novatel Wireless Reports Second Quarter 2013 Financial Results Consolidated second quarter revenue increased 6% sequentially SAN DIEGO--(BUSINESS WIRE)-- (NASDAQ: NVTL), a leading provider
Revenue $144M $134M $119M $110M $102M $89M $76M $71M $61M $55M $46M $150 $125 $100 $50 $25
 Revenue ($M) $150 $134M $144M $125 $100 $89M $102M $110M $119M $75 $50 $46M $55M $61M $71M $76M $25 $0 Q1'13 Q2'13 Q3'13 Q4'13 Q1'14 Q2'14 Q3'14 Q4'14 Q1'15 Q2'15 Q3'15 1 Adj. EBITDA ($M) Adjusted EBITDA
NASDAQ REPORTS THIRD QUARTER 2018 RESULTS; DELIVERS SOLID ORGANIC REVENUE GROWTH
 N E W S R E L E A S E D A T E : October 24, 2018 NASDAQ REPORTS THIRD QUARTER 2018 RESULTS; DELIVERS SOLID ORGANIC REVENUE GROWTH Third quarter 2018 net revenues 1 were $600 million, including 5% organic
Ally Financial Inc. Auto Securitization - Corporate Overview 2Q 2018
 Ally Financial Inc. Auto Securitization - Corporate Overview 2Q 2018 Contact Ally Investor Relations at (866) 710-4623 or investor.relations@ally.com Forward-Looking Statements and Additional Information
Ladenburg Thalmann Reports Fourth Quarter and Full Year 2012 Results
 March 18, 2013 Ladenburg Thalmann Reports Fourth Quarter and Full Year 2012 Results Generated Record Revenues of $650 Million in 2012 Client Assets Grow to Approximately $75 Billion MIAMI-- Tabular information
Shutterfly Announces Second Quarter 2018 Financial Results
 Shutterfly Inc Logo Shutterfly Announces Second Quarter 2018 Financial Results August 7, 2018 REDWOOD CITY, Calif.--(BUSINESS WIRE)--Aug. 7, 2018-- (NASDAQ:SFLY), the leading online retailer and manufacturer