Investor Presentation January 2019
|
|
|
- Virginia Singleton
- 5 years ago
- Views:
Transcription

1 Investor Presentation January 2019
2 Company Information NYSE Ticker NGL Energy Partners LP Contact Information Corporate Headquarters NGL Energy Partners LP 6120 South Yale Avenue, Suite 805 Tulsa, Oklahoma Website Investor Relations Contact us at (918) or us at NGL Unit Price (1) $ Market Capitalization (1)(2) $ 1.74 Billion Enterprise Value (1)(2) $ 4.16 Billion Yield (1) 14.77% InvestorInfo@nglep.com Forward Looking Statements This presentation includes forward looking statements within the meaning of federal securities laws. All statements, other than statements of historical fact, included in this presentation are forward looking statements, including statements regarding the Partnership s future results of operations or ability to generate income or cash flow, make acquisitions, or make distributions to unitholders. Words such as anticipate, project, expect, plan, goal, forecast, intend, could, believe, may and similar expressions and statements are intended to identify forward-looking statements. Although management believes that the expectations on which such forward-looking statements are based are reasonable, neither the Partnership nor its general partner can give assurances that such expectations will prove to be correct. Forward looking statements rely on assumptions concerning future events and are subject to a number of uncertainties, factors and risks, many of which are outside of management s ability to control or predict. If one or more of these risks or uncertainties materialize, or if underlying assumptions prove incorrect, the Partnership s actual results may vary materially from those anticipated, estimated, projected or expected. Additional information concerning these and other factors that could impact the Partnership can be found in Part I, Item 1A, Risk Factors of the Partnership s Annual Report on Form 10-K for the year ended March 31, 2018 and in the other reports it files from time to time with the Securities and Exchange Commission. Readers are cautioned not to place undue reliance on any forward-looking statements contained in this presentation, which reflect management s opinions only as of the date hereof. Except as required by law, the Partnership undertakes no obligation to revise or publicly update any forward-looking statement. (1) Market Data and Unit Count as of 1/11/2018. (NGL-PB ticker for Class B Preferred Units) (2) Balance Sheet Data as of 9/30/2018, Market Capitalization and Enterprise Value include Preferred Equity 2
3 NGL Energy Partners LP Overview 3


4 Segment Business Contribution Overview Crude Logistics Purchases and transports crude oil for resale to pipeline injection points, storage terminals, barge loading facilities, rail facilities, refineries and other trade hubs Provides transportation, terminaling, and storage of crude oil and condensate to third parties for a fixed-fee per barrel Long term, take-or-pay contracts on Grand Mesa Pipeline Water Solutions Provides services for the treatment, processing, and disposal of wastewater and solids generated from oil and natural gas production Revenue streams from the disposal of wastewater and solids, transportation of water through pipelines, truck and frac-tank washouts, and sales of recovered hydrocarbons and freshwater Refined Products/ Renewables Purchase refined petroleum products primarily in the Gulf Coast, Southeast, and Midwest regions of the United States and schedule them for delivery primarily on the Colonial, Plantation, Magellan and NuStar pipelines Sell our products to commercial and industrial end users, independent retailers, distributors, marketers, government entities, and other wholesalers Purchase unfinished gasoline blending components for subsequent blending into finished gasoline to supply our marketing business as well as third parties Liquids Transports, stores, and markets NGLs to and from refiners, gas processors, propane wholesalers, propane retailers, proprietary terminals, petrochemical plants, diluent markets and other merchant users of NGLs Large provider of butane to refiners for gasoline blending Utilizes underground storage to take advantage of seasonal demand Note: On July 10 th 2018, NGL Energy Partners LP announced that it closed the previously announced transaction to sell the remainder of its Retail Propane Business. See press release on NGL Energy Partners website 4


5 Business Diversity NGL LOGO Crude Logistics Water Solutions Refined Products/ Renewables Liquids Primary Drivers: Crude Oil Production and Transportation/ Storage Demand Water Volumes, Rig Count and Crude Oil Price Motor Fuels Supply/Demand and Basis Differentials Butane Blending, Weather and NGL Production Benefits From: Higher Prices Higher Prices Lower Prices Lower Prices Targeted EBITDA Contribution %: 35% 40% 10%-15% 10%-15% With the sale of its Retail Propane assets, NGL is making a strategic shift in its business which positions the Partnership to focus on, and reinvest in, Crude Logistics and Water Solutions, its two best performing and largest growth platforms 5


6 Diversified Across Multiple Businesses and Producing Basins Bakken Shale Marcellus Shale Green River Basin Pinedale Anticline DJ Basin Jonah Field Niobrara Shale Wattenberg Field Mississippi Lime Granite Wash Permian Basin NGL Owned/Leased Assets NGL Assets Water Services NGL Utilized Assets Common Carrier Propane Pipelines Colonial Products Pipeline Santa Fe Products Pipeline Magellan Products Pipeline NuStar Products Pipeline Eagle Ford NGL Rack Marketing Terminal NGL Gas Blending Terminal TransMontaigne Terminal NGL Renewable Marketing Terminal NuStar Energy Terminal Basins Assets and Marketing Presence Crude Barges and Tug Boats Crude Oil Logistics NGL Crude Terminal Grand Mesa Pipeline 6
7 NGL Operational Assumptions Business Strategy Build a Diversified Vertically Integrated Energy Business Transport crude oil from the wellhead to refiners Wastewater from the wellhead to treatment for disposal, recycle or discharge Natural Gas Liquids from fractionators / hubs to refineries and end users Refined Products from refiners to customers Achieve Organic Growth by Investing in New Assets Projects that increase volumes, enhance our operations and generate attractive rates of return Accretive organic growth opportunities that originate from assets we own and operate Invest in existing businesses such as crude oil logistics and water solutions which provide high quality, fee based revenues Accretive Growth through Strategic Acquisitions Build upon our vertically integrated business Scale our existing operating platforms Enhance our geographic diversity Continue our successful track record of acquiring companies and assets at attractive prices Focus on Businesses that Generate Long- Term Fee Based Cash Flows Focus on long-term, fee based contracts and back-to-back transactions that minimize commodity price exposure Increase cash flows that are supported by certain fee-based, multi-year contracts that include acreage dedications or volume commitments Disciplined Capital Structure Target leverage levels that are consistent with investment grade companies Maintain sufficient liquidity to manage existing and future capital requirements and take advantage of market opportunities Prudent distribution coverage to manage commodity cycles and fund growth opportunities 7
8 Operating Segments 8

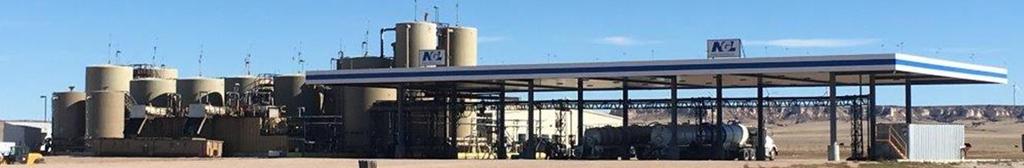
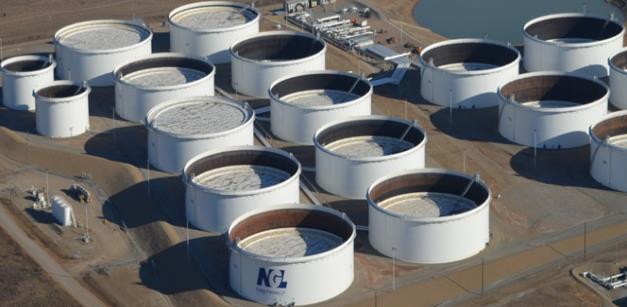
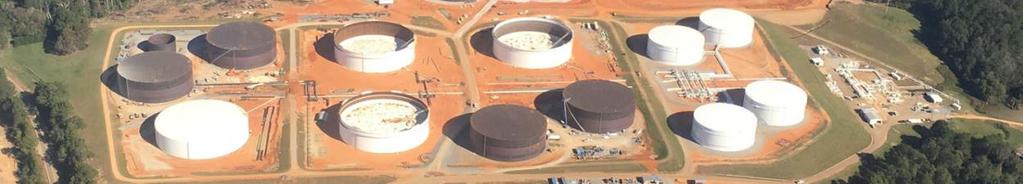
9 Crude Logistics Platform Our Crude Oil Logistics segment purchases crude oil from producers and transports it to refineries or for resale at pipeline injection stations, storage terminals, barge loading facilities, rail facilities, refineries, and other trade hubs, and provides storage, terminaling, trucking, marine and pipeline transportation services through its owned assets Grand Mesa Pipeline Crude Assets Crude Transportation Crude Marketing ~550 miles of 20 Crude oil pipeline from the DJ Basin to Cushing, OK 150,000 BPD capacity 16 total truck unloading bays Own 6 storage terminal facilities 3.6 MMbbls of storage in Cushing 1.7 MMbbls of storage in addition to Cushing Own 10 tow boats, 22 barges with >25Mbbls per barge capacity 797 GP railcars leased or owned 163 owned trucks and 260 owned trailers Operations are centered near areas of high crude oil production, such as the Bakken, DJ, Permian, Eagle Ford, Anadarko, STACK, SCOOP, Granite Wash, Mississippi Lime, and southern Louisiana at the Gulf of Mexico 970,000 BBL origin tankage 27 LACT units NGL Cushing Crude Oil Storage Tanks 4 NGL Crude Logistics Tows 9

10 Segment Grand Mesa Contribution Pipeline Grand Mesa Share of Capacity ~550 miles of 20 Crude oil pipeline from the DJ Basin to Cushing, OK NGL/Grand Mesa have 37.5% undivided joint interest 150,000 BPD capacity DJ Basin Origin Station Terminals Lucerne & Riverside Terminals in Weld County, CO 16 total truck unloading bays capable of unloading over 325 trucks per day in aggregate 970,000 BBL origin tankage Niobrara Shale Wattenberg Field Batching Capabilities Gathering Connectivity Grand Mesa offers two unique batching specs allowing producers to preserve their crude oil quality The Lucerne origin has inbound receipt connections to multiple gathering systems including: Platte River Midstream Saddle Butte Pipeline Noble Midstream NGL Crude Terminal Grand Mesa Pipeline Cushing Storage Destination Terminal NGL s Cushing Terminal has 3.6 million barrels of total shell capacity Offers producers connectivity to multiple markets including the Gulf Coast via TransCanada Marketlink Financial Guidance Total volumes for FY19 expected to average ~115kbpd Average remaining contract term on the pipeline is approximately 7 years = Lucerne & Riverside = Platteville Source: Current rig locations denoted by a black rig icon and the heat map represents permit activity in the last 180 days with permits denoted as dots based on data from DrillingInfo as of 8/7/18 10

 Assumed Crude")
 $200 $160 $120 $80 $40 $- Adjusted EBITDA (In Millions) $165-175 $118 $12 $73 $61 $59 $13 $11 $107 $28 $48 $48 FY")
11 Segment Crude Oil Contribution Logistics Crude WTI Spot Price Area of Operation $100 $80 $60 $40 $20 $- 12/31/ /31/ /31/ /31/2018 Grand Mesa Pipeline FY 2019 Forecast Assumptions Total volumes average ~115kbpd Crude Assets Cushing market rates reduced with no assumed Contango Glass Mountain Sale in FY 2018 Crude Oil Marketing/Transportation Three new tow boats are put into service (1 every three months starting in June) Assumed Crude Price forward curve April 1, 2018 March 31, 2019 ($64.56-$59.63) $200 $160 $120 $80 $40 $- Adjusted EBITDA (In Millions) $ $118 $12 $73 $61 $59 $13 $11 $107 $28 $48 $48 FY 2014 FY 2015 FY 2016 FY 2017 FY 2018 FY 2019E Glass Mountain Crude Oil Logistics 11

12 Water Solutions Platform Our Water Solutions segment provides services for the treatment and disposal of wastewater generated from crude oil and natural gas production and for the disposal of solids such as tank bottoms, drilling fluids and drilling muds and performs truck and frac tank washouts. In addition, our Water Solutions segment sells the recovered hydrocarbons that result from performing these services as well as freshwater Water Disposal Recycling & Freshwater Solids Solutions Water Pipelines ~134 completed SWD wells with over 3.2 million BPD of total capacity spanning: Pinedale Anticline (WY) DJ (CO) Eagle Ford (TX) Midland (TX) Delaware (TX) 24x7 operations at most locations 1 water recycling facilities with 65,000 BPD of total capacity Recycling opportunities in Delaware Basin Over 60 million barrels of water recycled and discharged since inception 11.6 million barrels per year of freshwater rights in New Mexico 23 million barrels per year of freshwater capacity in Texas 8 solids disposal facilities with 60,000 BPD of total capacity in Texas 2 solids facilities in Colorado Solids Processing Facility (C6) Solids Slurry Injection (C9) Provides producers with in-field disposal alternative for Gels, High Solids Content Water, Water and Oil-Based Mud, and Tank Bottoms 2 landfill facilities in permitting stages in New Mexico ~100 miles of water pipelines owned by NGL plus > 75 miles under development ~100 miles of water pipelines owned by producers Currently disposing of > 404,000 BPD of wastewater via pipelines (both NGL and producer owned) Provides producers with in-field disposal alternative for Gels, High Solids Content Water, Water and Oil-Based Mud, and Tank Bottoms generated from oil and natural gas production and drilling activities NGL saltwater disposal facility with solids processing capacity Note: Includes FY2019 Q1 Acquisitions and South Pecos assets 12


13 South Pecos Water Disposal Divestiture Highlights Transaction Highlights Represents continued progress towards NGL s capital allocation strategy Cash proceeds of $238.8 million at closing plus additional consideration upon meeting certain criteria Proceeds will be used to reduce outstanding indebtedness, improve compliance leverage to under 3.0x (1) by fiscal year-end and enhance liquidity NGL continues to focus on a self-funding model for growth opportunities as well as reducing overall leverage Asset Map Central Reeves 4 Central Reeves 3 Central Reeves Central Reeves 5 Barstow Pecos Highway 17S Pecos 2 Ranger Pecos South Pecos 3 REEVES COUNTY Pyote WARD COUNTY Supports NGL's ongoing strategy in the northern Delaware Allows NGL to focus more fully on high return opportunities around our consolidated and growing position in the TX / NM state-line area Recently acquired a large land position in the northern Delaware, where NGL is developing additional disposal facilities and significant pipeline infrastructure Continue to own and operate over 1MMBbls/d of permitted disposal capacity in the Delaware Basin following the transaction Toyah 4 Toyah 8 Toyah 6 Toyah 7 PECOS COUNTY Legend In-Service Approved Permit Pending Permit Producer E to Pecos Pipeline Central Reeves to Pecos Pipeline Producer Pipeline County Line Major Highways, Major Roads Note: Expected to close Q4 FY2019 (1) Assumes FY19 Public Guidance and all proceeds are utilized to repay compliance debt prior to 3/31/19 13
 are moving ~265k bpd in the basin")
14 Delaware Basin Characteristics Salt Water Disposal Facilities & Disposal Wells Water Pipelines NGL has 34 Salt Water Disposal Facilities & 50 Disposal Wells in-service 31 Facilities in Texas and 3 in New Mexico NGL has 1 Solids Disposal Facilities in-service at its Orla Facility NGL has 45 pipeline tie-ins currently in-service Pipelines (owned and third party) are moving ~265k bpd in the basin >50 miles of owned water pipelines in-service ~75 miles of water pipeline projects in progress at various stages of development Includes trunk line from Carlsbad, New Mexico to North of Pecos, Texas (Western Express) Sample of Delaware Customers Crude Crude Oil Production in the Delaware Basin reached 43.7 Production (1) million BBLs (~1.5mm bpd) in April 2018 Market Produced Water to Crude Ratio of Approximately 4 to 1 Dynamics (1) Total Water Disposal Market of ~6.0mm bpd (based on April 2018 crude production and water to crude ratio) Water Disposal Market still very fragmented Continue to see robust produced and flow back water demand Demand expected to increase with production Capital Focus NGL invested ~$235 million in acquisitions YTD thru 9/30/18 in Fiscal Year 2019 NGL invested ~$100 million in Delaware Basin organic projects YTD thru 9/30/18 in Fiscal Year 2019 Expected return of 5x or better on acquisitions and organic projects Note: Includes FY2019 Acquisitions and South Pecos assets (1) Delaware Basin Production Statistics by County per DrillingInfo Data as of 11/8/18 14

15 Delaware Basin SWD Facilities & Pipelines Acquisition of ~122,000 acres through the purchase of the Beckham and McCloy ranches, including locations for over 20 saltwater disposal wells and 11.6 million barrels of annual fresh water rights in New Mexico Expands service offerings to producers with capabilities to provide fresh water, recycling and treatment, cuttings landfill disposal, and produced water disposal in Eddy and Lea Counties Total cost of the acquisitions was approximately $93 million with an estimated full year run-rate Adjusted EBITDA contribution of $18 million Note: Includes FY2019 Q1 Acquisitions and South Pecos assets 15
 Area of Operation 500 400 300 200 100 0 12/31/2015 12/31/2016 12/31/2017 12/31/2018 Permian Basin Eagle Ford Basin DJ Basin FY 2019 Forecast Assumptions Adjusted EBITDA (In")
16 Segment Water Solutions Contribution U.S Oil Rig Count (1) Area of Operation /31/ /31/ /31/ /31/2018 Permian Basin Eagle Ford Basin DJ Basin FY 2019 Forecast Assumptions Adjusted EBITDA (In Millions) Primary growth focused in Permian (Delaware) and DJ basins Average skim oil percentage forecasted at 0.37% for each disposal volume Assumed Crude Price forward curve April 1, 2018 March 31, 2019 ($64.56-$59.63), further adjusted for Differentials and Hedges Pipelines, Solids disposal, Washouts, and other service revenues increase with volumes $300 $200 $100 $68 $126 $72 $63 $117 $ Growth capital and planned acquisitions adds several new facilities and disposal wells to existing footprint ~$235 million in acquisitions ~$ million in organic growth capex $- FY 2014 FY 2015 FY 2016 FY 2017 FY 2018 FY 2019E Note: Includes FY2019 Q1 Acquisitions and South Pecos assets (1) Baker Hughes as of December

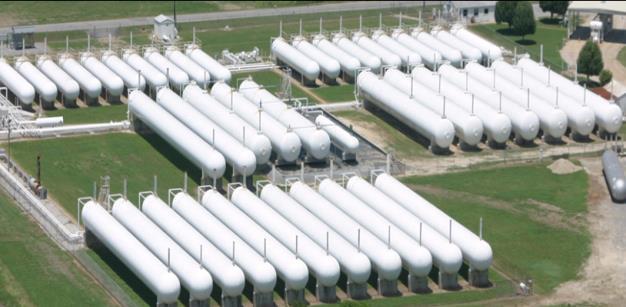
17 NGL Liquids Platform Our Liquids segment provides natural gas liquids procurement, storage, transportation, and supply services to customers through assets owned by us and third parties. We also sell butanes and natural gasolines to refiners and producers for use as blending stocks and diluent and assist refineries by managing their seasonal butane supply needs Propane/Butane Wholesale NGL Terminals Sawtooth Office locations in Denver, Chicago, Calgary, Houston, Tulsa Fleet of ~4,300 railcars 28 transloading units 400 Customers Shipper on 5 common carrier pipelines Approximately 2.8 million barrels of leased underground storage, 0.35 million barrels of above ground storage 19 Terminals with throughput capacity of ~11.3 million gallons per day 10 terminals with rail unloading capability 4 Multi-products terminals 9 Pipe-connected terminals 5 Caverns ~6.0 million barrels of butane and propane storage capacity in Utah Newly created JV structure to store refined products Railcar Rack NGL Thackerville Liquids Terminal West Memphis NGL Wholesale Liquids Terminal 17
")
 Assumes butane blending economics are better for refiners than")


18 Segment Liquids Contribution Heating Degree Days Area of Operation FY 2019 Forecast Assumptions Adjusted EBITDA (In Millions) Propane/Butane Wholesale Assumes a normal winter (5-year average of HDD) Assumes butane blending economics are better for refiners than FY 2018 NGL Terminals Results are determined by propane demand Sawtooth Newly created JV structure with additional commercial development drive Additional rights to store refined products $150 $100 $50 $- $87 $93 $101 $64 $50 $60-75 FY 2014 FY 2015 FY 2016 FY 2017 FY 2018 FY 2019E 18

19 Refined Products & Renewables Platform Our Refined Products and Renewables segment conducts gasoline, diesel, ethanol, and biodiesel marketing operations. In addition, in certain storage locations, our Refined Products and Renewables segment may also purchase unfinished gasoline blending components for subsequent blending into finished gasoline to supply our marketing business as well as third parties Southeast Gas Blending Rack Marketing and Other Line Space on Colonial and Plantation pipelines Long-term Lease of TLP SE Terminals along Colonial and Plantation Pipelines Approximately 7.0 million barrels of storage capacity TLP-Collins Storage facility in Collins, MS 1.15 million barrels capacity Colonial Pipeline in/out Nustar Storage Facility in Linden, NJ 1.2 million barrels capacity Rack marketing services from over 180 terminals in 34 states providing diesel and gasoline products Margins driven by normal supply/demand activity as well as disruption events such as weather or refinery/pipeline issues Utilizing 3 major Pipelines Magellan NuStar Explorer Ethanol and Biodiesel Blending Approximately 1.0 million barrels of storage capacity Collins, MS Refined Products Terminal 19
 Average gross margin of $0.03 per gallon Renewables blending contributes ~$4.")
 $150 $100 $50 $- Adjusted EBITDA (In Millions) $134 $125 $79 $55-80 $49 $8 FY 2014 FY 2015 FY 2016 FY 2017 FY")
20 Segment Refined Products/Renewables Contribution DOE Total U.S. Gas Supplied (1) Area of Operation 10,000 9,800 9,600 9,400 9,200 9,000 8,800 8,600 8,400 8,200 8, to 2015 Range 2011 to 2015 Average FY 2019 Forecast Assumptions Southeast (Colonial and Plantation pipelines) Average gross margin of $0.03 per gallon Renewables blending contributes ~$4.0 million of gross margin Gas Blending Nymex delivery point allows for increased price protection for Southeast volumes Rack Marketing and Other Diesel demand growth in the Permian basin Increased storage capacity to utilize for blending No significant legislative impact (Renewables) $150 $100 $50 $- Adjusted EBITDA (In Millions) $134 $125 $79 $55-80 $49 $8 FY 2014 FY 2015 FY 2016 FY 2017 FY 2018 FY 2019E (1) Department of Energy EIA weekly data for 12/28/18. 20
21 Financial Overview 21


22 Financial Objectives Strong Balance Sheet The Partnership has made significant strides with ~$1.5 billion in asset sales and debt reduction in LTM and will continue to pursue a flexible balance sheet with a leverage target of less than 3.25x on a compliance basis Goal of achieving investment grade rating Cash Flow Predictability Increasing fee-based business and long-term contracts with high credit quality customers Transitioning to a more traditional midstream repeatable cash flow model Lower Cost of Capital Continue to pursue opportunities to find and execute on low cost of capital financing in the current and future environments Consistently pursuing strategies that increase NGL s unit price and lower cost of debt Crude and Water segments provide accretive growth platforms Accretive Capital Projects Accretive growth through organic growth projects and strategic acquisitions focused on assets backed by multi-year fee based contracted cash flows Sufficient liquidity to operate the business and execute growth objectives Robust Distribution Coverage Targeting over 1.3x distribution coverage Excess distribution coverage will be used to strengthen the balance sheet and fund growth opportunities 22
23 2 nd Quarter Update Segment Summary Crude Oil Logistics outperformed expectations primarily due to strong results from Grand Mesa as the pipeline continues to benefit from increased production out of the DJ Basin as well as improved margins in most basins. Water Solutions performed below expectations due to lower-than-expected skim oil cut and basin differentials impacting the net price received for skim oil sales. Refined Products/Renewables performed below expectations due to significant price volatility and minor supply disruptions, offset by stronger demand at our wholesale locations, especially in the Southeast and West Texas. Second half of FY2019 should benefit from contango. Liquids performed above expectations as a result of higher margins due to increased prices, improved railcar utilization and increased volumes attributable to an increase in NGL volumes being transported via railcar due to increased production and thirdparty pipeline infrastructure issues. Executed balance sheet and leverage improving transactions: Note Repurchases: Announced Redemption of all outstanding 6.875% Senior Notes due 2021 and subsequently redeemed in October Asset Sales: Sold Retail Propane sale for a gross consideration of $900 million in cash Water growth initiated: Completed Water acquisitions of approximately $235 million, primarily in the Delaware Basin Invested approximately $140 million on new SWD facilities, disposal wells, and pipelines Quarterly Summary Performance ($ s In Millions) (2) Sep-18 Sep-17 % Variance Total Volume (In Thousand's) Refined Products/Renewables Gasoline (BBL's) 47,067 26,459 78% Diesel (BBL's) 12,057 14,990-20% Ethanol (BBL's) % Biodiesel (BBL's) % Crude Oil (BBL's) 11,891 8,562 39% Crude Oil (Owned Pipelines) (BBL's) 9,578 8,182 17% Liquids Propane (GAL's) 266, ,775 3% Butane (GAL's) 131, ,419 5% Other NGL's (GAL's) 124, ,009 22% Water Solutions Permian Basin (BBL's) 489, ,290 79% Eagle Ford Basin (BBL's) 271, ,792 29% DJ Basin (BBL's) 166, ,952 53% Other Basins (BBL's) 80,577 63,443 27% Total Water Processed (BBL's) 1,007, ,477 54% Total Revenue $ 6,654.6 $ 3, % Total Cost of Sales $ 6,509.5 $ 3, % (1) Adjusted EBITDA $ 95.4 $ % Distributable Cash Flow (1) $ 40.1 $ % Distribution to LP Unitholders $ 0.39 $ % TTM Distribution Coverage 0.95x 0.80x Maintenance Capex $ 15.3 $ % Growth Capex with Investments $ $ % Covenant Compliance Leverage 3.7x 5.4x Total Debt (Excluding Working Capital Facility) $ 1,791.2 $ 2, % Working Capital Facility $ $ % Total Liquidity $ $ % (1) Does not include acquisition expenses. (2) Covenant Compliance Leverage excludes the working capital facility and includes Pro Forma effects of projects in construction, recent acquisitions/divestitures and redemption of the 6.875% Senior Notes 23


 Does not include TLP capital expenditures (2) Includes the GP and preferred")
24 Performance Metrics Adjusted EBITDA (In Millions) Acquisition, Growth and Maintenance Capex (In Millions) (1) $1,269 $443 $424 $381 $408 $450 $961 $24 $184 $271 $600 $491 $334 $133 $160 $138 $164 $162 $59 $14 $32 $35 $30 $26 $50 $38 $ $235 $40-45 IPO FY 2013 FY 2014 FY 2015 FY2016 FY 2017 FY2018 FY2019E FY 2013 FY 2014 FY 2015 FY2016 FY 2017 FY 2018E FY 2019E Acquisitions Growth Capital Maintenance Capital Distributable Cash Flow & Total Distributions (In Millions) (2) Distribution Coverage $169 $168 $320 $266 $290 $274 $210 $182 $180 >$250 $225 $ x 1.2x 0.9x 1.2x 0.8x 1.1x 1.3x Target FY 2014 FY 2015 FY2016 FY 2017 FY2018 FY2019E Distributable Cash Flow Distributions FY 2014 FY 2015 FY2016 FY 2017 FY2018 FY2019E (1) Does not include TLP capital expenditures (2) Includes the GP and preferred unit distributions, if any, and assumes the most recent quarterly distribution annualized 24
 3.25x or less $389 $- Apr-18 Apr-19 Apr-20 Apr-21 Apr-22 Apr-23 Apr-24 Apr-25 Credit Facility due 10/2021 5.125% Notes due 7/2019 6.875% Notes due 10/2021 7.500% Notes due 11/2023 6.")
 9/30/2018 6/30/2018 Variance Cash and Equivalents $ 36,374 $ 13,682 $ 22,692 Total Debt: Senior Secured Revolving Credit Facilities Working Capital Facility")

25 Credit Profile $1,200 $800 $ x 4.50x 3.00x 1.50x 2.9x Debt Maturities as of 9/30/18 (In Millions) Covenant Compliance Leverage 3.2x 3.2x 3.9x $961 This is tied out $353 $367 (1) 4.7x 4.4x $611 (2) 3.25x or less $389 $- Apr-18 Apr-19 Apr-20 Apr-21 Apr-22 Apr-23 Apr-24 Apr-25 Credit Facility due 10/ % Notes due 7/ % Notes due 10/ % Notes due 11/ % Notes due 2/ x Target Capitalization (In Thousands) 9/30/2018 6/30/2018 Variance Cash and Equivalents $ 36,374 $ 13,682 $ 22,692 Total Debt: Senior Secured Revolving Credit Facilities Working Capital Facility 759,000 1,060,500 (301,500) Acquisition Facility 65, ,500 (200,500) 5.125% Senior Notes due , , % Senior Notes due 2021 (1) 367, , % Senior Notes due , , % Senior Notes due , ,135 - Other Long-Term Debt 5,654 5,815 (161) Total Debt, Excluding Working Capital Facility $ 1,791,208 $ 1,991,869 $ (200,661) 10.75% Class A Convertible Preferred Units $ 104,362 $ 91,559 $ 12,803 Equity: General Partner (50,613) (50,919) 306 Limited Partners 2,046,621 1,740, ,211 Class B preferred limited partners 202, ,731 - Accumulated Other Comprehensive Loss (270) (257) (13) Noncontrolling interests 78,945 79,463 (518) Total Capitalization $ 4,172,984 $ 4,054,856 $ 118,128.00x FY 2013 FY 2014 FY 2015 FY2016 FY 2017 FY 2018 FY 2019E (1) 6.875% Senior Notes were called and retired as of October 16 th, 2018 (2) Covenant Compliance Leverage excludes acquisition expenses, excludes the working capital facility and includes Pro Forma adjustments for projects in construction or recent acquisitions/divestitures. Total Indebtedness at September 30, 2018 per the Partnership s Credit Facility and used for covenant compliance totaled $1.4 billion as pro forma credit was given for the redemption of the 6.875% Senior Notes.. 25
26 NGL Operational Assumptions Key Investment Highlights Diversified and Attractive Asset Base Multiple business segments with significant geographic diversity reduce cash flow volatility Presence in the highest rate of return oil & gas producing regions in North America as well as the highest growing population areas for consumer demand Natural hedge between certain business segments reduces commodity price volatility and risk exposure Vertical and Horizontal Integration Vertical integration allows for capture of margin across the value chain from wellhead to end-user Emphasis on asset ownership drives ability to capitalize on multiple revenue/bolt-on opportunities Offer a menu of services to producers and customers Stable Cash Flows Focus on medium to long-term, repeatable fee-based cash flows Combination of fee-based, take-or-pay, acreage dedication, margin-based and cost-plus revenue contracts Targeting ~70% fee based revenues in normal commodity price environment Strong Credit Profile and Liquidity Targeting a distribution coverage over 1.3x on a TTM basis Excess distribution coverage will be reinvested in growth opportunities and reduce indebtedness Targeting a capital structure with compliance leverage of under 3.25x and total leverage under 5.0x Experienced & Incentivized Management Team Extensive industry and MLP experience with proven record of acquiring, integrating, operating and growing successful businesses Senior management holds significant limited partner interests, which strengthens alignment of incentives with lenders and public unitholders Supportive general partner which is privately owned, of which over 65% is held by current and former management and directors, with no indebtedness 26
27 Appendix 27
 (DE LP) 100% NGL Energy Operating LLC (DE LLC) NGL Crude Logistics")
 (1) Includes the operations of our Legacy Gavilon crude oil logistics, refined products, and")
28 NGL Organizational Chart Members 100% NGL Energy Holdings LLC G.P. (DE LLC) 0.1% GP Interest IDR s 123,741,462 C.U. Outstanding 99.9% LP Interest Limited Partners NGL Energy Partners LP (NYSE: NGL) (DE LP) 100% NGL Energy Operating LLC (DE LLC) NGL Crude Logistics (NGL Crude Logistics, LLC) (1) NGL Water Solutions (NGL Water Solutions, LLC) NGL Liquids (NGL Liquids, LLC) NGL Refined Products/Renewables (TransMontaigne LLC) (1) Includes the operations of our Legacy Gavilon crude oil logistics, refined products, and renewables businesses. 28
29 2Q 19 Adjusted EBITDA & DCF Walk Three Months Ended September 30, Six Months Ended September 30, (in thousands) (in thousands) Net income (loss) $ 354,939 $ (173,579) $ 185,650 $ (237,286) Less: Net loss (income) attributable to noncontrolling interests 518 (80) 863 (132) Less: Net loss attributable to redeemable noncontrolling interests Net income (loss) attributable to NGL Energy Partners LP 355,505 (173,371) 186,959 (236,733) Interest expense 41,367 50,288 87,779 99,566 Income tax expense , Depreciation and amortization 53,507 69, , ,489 EBITDA 451,194 (53,546) 391, Net unrealized (gains) losses on derivatives (1,893) 18,077 17,060 16,076 Inventory valuation adjustment 25,770 (2,165) 1,168 (21,347) Lower of cost or market adjustments - 5,333 (413) 9,411 (Gain) loss on disposal or impairment of assets, net (403,185) 111,451 (301,418) 100,238 (Gain) loss on early extinguishment of liabilities, net - (1,943) 137 1,338 Equity-based compensation expense 19,219 6,065 24,730 14,886 Acquisition expense 2, ,115 (54) Revaluation of liabilities - 5, ,600 Gavilon legal matter settlement ,000 - Other 1,402 1,616 3,219 2,641 Adjusted EBITDA 95,370 90, , ,681 Less: Cash interest expense 38,892 47,344 82,732 93,715 Less: Income tax expense , Less: Maintenance capital expenditures 15,299 7,994 27,689 14,521 Less: Other Distributable Cash Flow $ 40,055 $ 35,070 $ 63,488 $ 20,642 29
30 2Q 19 & 2Q 18 Adjusted EBITDA by Segment Crude Oil Logistics Water Solutions Liquids Three Months Ended September 30, 2018 Refined Products and Renewables (in thousands) Corporate and Other Discontinued Operations Consolidated Operating income (loss) $ 31,022 $ 9,770 $ 10,758 $ (29,507) $ (35,352) $ - $ (13,309) Depreciation and amortization 18,870 26,342 6, ,750 Amortization recorded to cost of sales , ,384 Net unrealized (gains) losses on derivatives (6,142) 1,788 2, (1,878) Inventory valuation adjustment , ,770 Loss on disposal or impairment of assets, net 3, , ,988 Equity-based compensation expense ,219-19,219 Acquisition expense ,864-2,865 Other income (expense), net 9 (370) ,560-1,471 Adjusted EBITDA attributable to unconsolidated entities Adjusted EBITDA attributable to noncontrolling interest - 26 (229) (203) Other 1, (70) - - 1,401 Discontinued operations (511) (511) Adjusted EBITDA $ 48,477 $ 38,813 $ 20,530 $ (1,876) $ (10,063) $ (511) $ 95,370 Crude Oil Logistics Water Solutions Liquids Three Months Ended September 30, 2017 Refined Products and Renewables (in thousands) Corporate and Other Discontinued Operations Consolidated Operating income (loss) $ 1,196 $ (7,548) $ (118,107) $ 21,042 $ (16,459) $ - $ (119,876) Depreciation and amortization 20,958 25,253 6, ,595 Amortization recorded to cost of sales , ,506 Net unrealized gains on derivatives 2,170 3,022 12, ,874 Inventory valuation adjustment (2,165) - - (2,165) Lower of cost or market adjustments - - (2,476) 7, ,333 (Gain) loss on disposal or impairment of assets, net (157) ,729 (7,528) ,959 Equity-based compensation expense ,065-6,065 Acquisition expense Other income, net ,415-1,637 Adjusted EBITDA attributable to unconsolidated entities 3, , ,142 Adjusted EBITDA attributable to noncontrolling interest - (190) (190) Revaluation of liabilities - 5, ,600 Other 1, ,616 Discontinued operations ,392 3,392 Adjusted EBITDA $ 29,601 $ 27,273 $ 16,065 $ 22,216 $ (7,795) $ 3,392 $ 90,752 30
31 2Q 19 YTD & 2Q 18 YTD Adjusted EBITDA by Segment Six Months Ended September 30, 2018 Crude Oil Logistics Water Solutions Liquids Refined Products and Renewables Corporate and Other (in thousands) Discontinued Operations Consolidated Operating (loss) income $ (68,716) $ 10,739 $ 13,381 $ (485) $ (52,782) $ - $ (97,863) Depreciation and amortization 38,099 51,651 12, , ,795 Amortization recorded to cost of sales , ,849 Net unrealized losses on derivatives 1,270 10,898 4, ,981 Inventory valuation adjustment , ,168 Lower of cost or market adjustments - - (504) (413) Loss (gain) on disposal or impairment of assets, net 105,261 3, (3,026) ,323 Equity-based compensation expense ,730-24,730 Acquisition expense ,000-4,161 Other income (expense), net 23 (370) (32,241) - (32,298) Adjusted EBITDA attributable to unconsolidated entities Adjusted EBITDA attributable to noncontrolling interest - (86) (551) (637) Revaluation of liabilities Gavilon legal matter settlement ,000-35,000 Other 2, ,218 Discontinued operations ,025 5,025 Adjusted EBITDA $ 78,918 $ 77,410 $ 31,371 $ 1,887 $ (18,927) $ 5,025 $ 175,684 Six Months Ended September 30, 2017 Crude Oil Logistics Water Solutions Liquids Refined Products and Renewables Corporate and Other (in thousands) Discontinued Operations Consolidated Operating income (loss) $ 5,553 $ (8,702) $ (126,879) $ 35,538 $ (34,185) $ - $ (128,675) Depreciation and amortization 41,793 49,261 12, , ,012 Amortization recorded to cost of sales , ,091 Net unrealized losses on derivatives 1,511 3,022 11, ,846 Inventory valuation adjustment (21,347) - - (21,347) Lower of cost or market adjustments , ,411 (Gain) loss on disposal or impairment of assets, net (3,716) ,729 (15,056) ,142 Equity-based compensation expense ,886-14,886 Acquisition expense (54) - (54) Other income, net ,914-3,370 Adjusted EBITDA attributable to unconsolidated entities 7, , ,008 Adjusted EBITDA attributable to noncontrolling interest - (434) (434) Revaluation of liabilities - 5, ,600 Other 2, ,641 Discontinued operations ,184 10,184 Adjusted EBITDA $ 55,437 $ 49,418 $ 14,825 $ 14,417 $ (14,600) $ 10,184 $ 129,681 31
Investor Presentation June 2018
 Investor Presentation June 2018 Company Information NYSE Ticker NGL Energy Partners LP Contact Information Corporate Headquarters NGL Energy Partners LP 6120 South Yale Avenue, Suite 805 Tulsa, Oklahoma
NGL Energy Partners LP
 NGL Energy Partners LP August 2013 Presenters H. Michael Krimbill Chief Executive Officer NGL James J. Burke Chief Executive Officer High Sierra 2 NGL Energy Partners Overview NGL is a diversified midstream
White Cliffs Pipeline. David Minielly VP Operations
 White Cliffs Pipeline David Minielly VP Operations 1 Forward-looking Information Certain matters contained in this presentation include forward-looking statements within the meaning of Section 27A of the
TransMontaigne Partners L.P. (NYSE TLP) Wells Fargo Energy Symposium December 9 th and 10 th, 2014
 Wells Fargo Energy Symposium December 9 th and 10 th, 2014") TransMontaigne Partners L.P. (NYSE TLP) Wells Fargo Energy Symposium December 9 th and 10 th, 2014 Forward Looking Statements All statements, other than statements of historical facts, contained herein
TransMontaigne Partners L.P. (NYSE TLP) Wells Fargo Energy Symposium December 9 th and 10 th, 2014 Forward Looking Statements All statements, other than statements of historical facts, contained herein
Citi MLP / Midstream Infrastructure Conference. Las Vegas Aug. 2016
 Citi MLP / Midstream Infrastructure Conference Las Vegas Aug. 2016 1 Forward-Looking Statements Portions of this document constitute forward-looking statements as defined by federal law. Although management
TransMontaigne Partners L.P. (NYSE TLP) Wells Fargo th Annual Energy Symposium December 10 th, 2013
 Wells Fargo th Annual Energy Symposium December 10 th, 2013") TransMontaigne Partners L.P. (NYSE TLP) Wells Fargo 2013 12 th Annual Energy Symposium December 10 th, 2013 Forward Looking Statements All statements, other than statements of historical facts, contained
TransMontaigne Partners L.P. (NYSE TLP) Wells Fargo 2013 12 th Annual Energy Symposium December 10 th, 2013 Forward Looking Statements All statements, other than statements of historical facts, contained
NGL Energy Partners LP
 PROSPECTUS SUPPLEMENT (To Prospectus dated February 15, 2017) 7FEB201703440936 NGL Energy Partners LP 7,400,000 9.00% Class B Fixed-to-Floating Rate Cumulative Redeemable Perpetual Preferred Units (Liquidation
Investor Presentation. Third Quarter 2015
 Investor Presentation Third Quarter 2015 Forward-looking Information Certain matters contained in this presentation include "forward-looking statements" within the meaning of Section 27A of the Securities
Investor Presentation. January 4, 2017
 Investor Presentation January 4, 2017 Forward-Looking Statements Cautionary Statement Regardng Forward-Looking Statements This presentation contains or incorporates by reference forward-looking statements
Master Limited Partnership Association Annual Investor Conference. Orlando June 2016
 Master Limited Partnership Association Annual Investor Conference Orlando June 2016 1 Forward-Looking Statements Portions of this document constitute forward-looking statements as defined by federal law.
Casper Terminal Acquisition
 Casper Terminal Acquisition October 2015 Cautionary Statements This presentation may contain forward-looking statements within the meaning of U.S. federal securities laws, including statements related
UBS MLP One-on-One Conference
 UBS MLP One-on-One Conference January 12-13 Park City, UT Forward-looking Information Certain matters contained in this presentation include "forward-looking statements" within the meaning of Section 27A
Investor Presentation. December 2016
 Investor Presentation December 2016 Forward-Looking Statements Under the Private Securities Litigation Act of 1995 This document may contain or incorporate by reference forward-looking statements as defined
Wells Fargo Annual Pipeline and MLP Symposium
 Wells Fargo Annual Pipeline and MLP Symposium New York City Dec. 2017 1 Forward-Looking Statements Portions of this document constitute forward-looking statements as defined by federal law. Although management
2017 Citi. One-on-One MLP / Midstream Infrastructure Conference
 2017 Citi One-on-One MLP / Midstream Infrastructure Conference Aug 16 17, 2017 Forward-Looking Statements Statements contained in this presentation other than statements of historical fact are forward-looking
Morgan Stanley Midstream MLP and Diversified Natural Gas Corporate Access Event. March 2014
 Morgan Stanley Midstream MLP and Diversified Natural Gas Corporate Access Event March 2014 Forward-looking Information Certain matters contained in this presentation include "forward-looking statements"
Third-Quarter 2017 Earnings Conference Call Presentation. October 26, 2017
 Third-Quarter 2017 Earnings Conference Call Presentation October 26, 2017 Forward Looking Statements This presentation contains forward-looking statements within the meaning of federal securities laws
NYSE: MMP. SunTrust Midstream Summit
 NYSE: MMP SunTrust Midstream Summit New York City May 10, 2018 Forward-Looking Statements Portions of this document constitute forward-looking statements as defined by federal law. Although management
NYSE: MMP. MLP and Energy Infrastructure Conference
 NYSE: MMP MLP and Energy Infrastructure Conference Orlando May 23, 2018 Forward-Looking Statements Portions of this document constitute forward-looking statements as defined by federal law. Although management
INVESTOR PRESENTATION DECEMBER 2018
 INVESTOR PRESENTATION DECEMBER 2018 Safe Harbor Disclosure Statement Statements made during the course of this presentation that are not historical facts are forward-looking statements within the meaning
Investor Presentation. March 2-4, 2015 Strong. Innovative. Growing.
 Investor Presentation March 2-4, 2015 Strong. Innovative. Growing. 1 Forward-Looking Statements This presentation contains forward-looking statements within the meaning of the federal securities laws.
Investor Presentation
 Investor Presentation September 2017 2 Noble Midstream Partners LP Overview Partnership Overview Premier E&P Sponsorship Noble Midstream Partners LP ( NBLX ) is a midstream MLP formed by sponsor, Noble
Wells Fargo Wells Fargo 2014 Energy Symposium Annual Energy Symposium
 Wells Fargo Wells Fargo 2014 Energy Symposium Annual Energy Symposium New York City Dec. 2014 New York City Dec. 2015 1 Forward-Looking Statements Portions of this document constitute forward-looking statements
INVESTOR PRESENTATION MAY 2018
 INVESTOR PRESENTATION MAY 2018 Safe Harbor Disclosure Statement Statements made during the course of this presentation that are not historical facts are forward-looking statements within the meaning of
UBS MLP One-on-One Conference. January 2014
 UBS MLP One-on-One Conference January 2014 Forward-looking Information Certain matters contained in this presentation include "forward-looking statements" within the meaning of Section 27A of the Securities
SECOND QUARTER Earnings Review
 SECOND QUARTER 2014 Earnings Review 8/6/2014 Forward-Looking Statements Under the Private Securities Litigation Act of 1995 This document may contain or incorporate by reference forward-looking statements
UBS One-on-One MLP Conference
 UBS One-on-One MLP Conference January 13, 2015 Strong. Innovative. Growing. 1 Forward-Looking Statements This presentation contains forward-looking statements within the meaning of the federal securities
Master Limited Partnership Association Investor Conference
 Master Limited Partnership Association Investor Conference Orlando May 31 June 1, 2017 1 Forward-Looking Statements Portions of this document constitute forward-looking statements as defined by federal
Investor Presentation: May 2016
 Investor Presentation: May 2016 Safe Harbor Disclosure Statement Statements made during the course of this presentation that are not historical facts are forward looking statements within the meaning of
Citi One-On-One MLP / Midstream Infrastructure Conference. August 20, 2014 Strong. Innovative. Growing.
 Citi One-On-One MLP / Midstream Infrastructure Conference August 20, 2014 Strong. Innovative. Growing. 1 Forward-Looking Statements This presentation contains forward-looking statements within the meaning
NYSE: MMP. RBC Capital Markets Midstream Conference
 NYSE: MMP RBC Capital Markets Midstream Conference Dallas Nov. 13, 2018 Forward-Looking Statements Portions of this document constitute forward-looking statements as defined by federal law. Although management
2017 MLPA. Master Limited Partnership Investor Conference
 2017 MLPA Master Limited Partnership Investor Conference MAY 31 June 1, 2017 Forward-Looking Statements Statements contained in this presentation other than statements of historical fact are forward-looking
Targa Resources Corp. Fourth Quarter 2018 Earnings & 2019 Guidance Supplement February 20, 2019
 Targa Resources Corp. Fourth Quarter 2018 Earnings & 2019 Guidance Supplement February 20, 2019 Forward Looking Statements Certain statements in this presentation are "forward-looking statements" within
Second Quarter 2018 Update
 PEOPLE PROCESS TECHNOLOGY Second Quarter 2018 Update August 8, 2018 Earnings Call Forward-Looking Statements Under the Private Securities Litigation Act of 1995 This document may contain or incorporate
2017 MLPA Investor Conference
 2017 MLPA Investor Conference May 31 June 2, 2017 2 Forward Looking Statements and Non-GAAP Measures This presentation contains certain forward-looking statements within the meaning of the federal securities
Evercore ISI Energy Summit. Houston March 7, 2017
 Evercore ISI Energy Summit Houston March 7, 2017 1 Forward-Looking Statements Portions of this document constitute forward-looking statements as defined by federal law. Although management believes any
Capital Link Master Limited Partnership Investing Forum
 Capital Link Master Limited Partnership Investing Forum March 2, 2017 2 Forward Looking Statements and Non-GAAP Measures This presentation contains certain forward-looking statements within the meaning
INVESTOR PRESENTATION JANUARY 2018
 INVESTOR PRESENTATION JANUARY 2018 Safe Harbor Disclosure Statement Statements made during the course of this presentation that are not historical facts are forward-looking statements within the meaning
Fourth Quarter 2018 Earnings & 2019 Guidance Call
 Fourth Quarter 2018 Earnings & 2019 Guidance Call February 19, 2019 2 Forward Looking Statements This presentation contains certain forward-looking statements within the meaning of federal securities law.
Enable Midstream Partners, LP
 Enable Midstream Partners, LP MLPA 2016 Investor Conference June 3, 2016 Forward-looking Statements This presentation and the oral statements made in connection herewith may contain forward-looking statements
NYSE: MMP. Citi One-on-One MLP / Midstream Infrastructure Conference
 NYSE: MMP Citi One-on-One MLP / Midstream Infrastructure Conference Las Vegas Aug. 15-16, 2018 Forward-Looking Statements Portions of this document constitute forward-looking statements as defined by federal
TULSA MLP CONFERENCE. Tulsa, OK November 15, 2016
 TULSA MLP CONFERENCE Tulsa, OK November 15, 2016 DEREK REINERS Senior Vice President, Chief Financial Officer and Treasurer Page 2 FORWARD-LOOKING STATEMENTS Statements contained in this presentation that
Investor Handout December 2018
 Investor Handout December 2018 2 Forward Looking Statements This presentation contains certain forward-looking statements within the meaning of federal securities law. Words such as anticipates, believes,
Citi s 2012 MLP/Midstream Infrastructure Conference. August 22-23, 2012
 Citi s 2012 MLP/Midstream Infrastructure Conference August 22-23, 2012 Forward-looking Information Certain matters contained in this presentation include forward-looking statements within the meaning of
Wells Fargo Pipeline, MLP and Utility Symposium
 Wells Fargo Pipeline, MLP and Utility Symposium December 6 & 7, 2016 2 Forward Looking Statements and Non-GAAP Measures This presentation contains certain forward-looking statements within the meaning
Targa Resources Corp. Announces Delaware Basin and Grand Prix Expansions March 2018
 Targa Resources Corp. Announces Delaware Basin and Grand Prix Expansions March 2018 Forward Looking Statements Certain statements in this presentation are "forward-looking statements" within the meaning
Enable Midstream Partners, LP
 Enable Midstream Partners, LP Fourth Quarter 2014 Conference Call February 18, 2015 Forward-looking Statements This presentation and the oral statements made in connection herewith may contain forward-looking
(NYSE:TLP) Master Limited Partnership Association (MLPA) Conference
 Master Limited Partnership Association (MLPA) Conference") (NYSE:TLP) Master Limited Partnership Association (MLPA) Conference June 1, 2017 Forward Looking Statements All statements, other than statements of historical facts, contained herein and made by representatives
(NYSE:TLP) Master Limited Partnership Association (MLPA) Conference June 1, 2017 Forward Looking Statements All statements, other than statements of historical facts, contained herein and made by representatives
Fourth-Quarter 2017 Earnings Conference Call Presentation. February 1, 2018
 Fourth-Quarter 2017 Earnings Conference Call Presentation February 1, 2018 Forward Looking Statements This presentation contains forward-looking statements within the meaning of federal securities laws
Forward Looking Statements
 January 2010 1 Forward Looking Statements This presentation contains forward looking statements within the meaning of the federal securities laws. Forward looking statements are not guarantees of performance.
May 9, First Quarter 2018 Results Earnings Conference Call
 May 9, 2018 Earnings Conference Call Non-GAAP Financial Measures SemGroup s non-gaap measures, Adjusted EBITDA and Total Segment Profit, are not GAAP measures and are not intended to be used in lieu of
Investor Presentation: UBS MLP Conference January 2016
 Investor Presentation: UBS MLP Conference January 2016 Safe Harbor Disclosure Statement Statements made during the course of this presentation that are not historical facts are forward looking statements
2018 Update and 2019 Outlook
 PEOPLE PROCESS TECHNOLOGY 2018 Update and 2019 Outlook February 12, 2019 Earnings Call Forward-Looking Statements Under the Private Securities Litigation Reform Act of 1995 This document may contain or
ARB Midstream, LLC. The Private Equity Perspective on Energy Infrastructure. February 2017
 ARB Midstream, LLC The Private Equity Perspective on Energy Infrastructure February 2017 ARB Midstream Background ARB Midstream was formed in August 2014 Formerly of NGL Energy Partners (NYSE:NGL) Highly
ENERGY TRANSFER EQUITY, L.P.
 ENERGY TRANSFER EQUITY L.P. Credit Suisse Conference June 23 2015 Jamie Welch Group CFO DISCLAIMER This presentation relates to a presentation the management of Energy Transfer Equity L.P. (ETE) will give
Second-Quarter 2017 Earnings Conference Call Presentation. July 27, 2017
 Second-Quarter 2017 Earnings Conference Call Presentation July 27, 2017 Forward Looking Statements This presentation contains forward-looking statements within the meaning of federal securities laws regarding
Wells Fargo Securities 12 th Annual Energy Symposium
 Wells Fargo Securities 12 th Annual Energy Symposium December 2013 Forward-Looking Statements Under the Private Securities Litigation Act of 1995 This document may contain or incorporate by reference forward-looking
Creating Superior Value Go for Extraordinary
 Creating Superior Value Go for Extraordinary Mizuho Energy Summit April 9-10, 2018 Forward Looking Statements This presentation (and oral statements made regarding the subjects of this presentation) includes
TransMontaigne Announces First Quarter Results and Expansion
 TransMontaigne Announces First Quarter Results and Expansion TransMontaigne will expand its Brownsville, Texas operations, supported by the execution of longterm, fee-based terminaling and pipeline agreements
EPD NYSE 2ND QUARTER 2017 FACT SHEET DISTRIBUTION REINVESTMENT PLAN $ $1.68/Unit. Baa1/BBB+ ENTERPRISEPRODUCTS.COM
 FINANCIAL PERFORMANCE EPD UNIT PRICE 8/23/17 CURRENT ANNUALIZED DISTRIBUTION 26.02 1.68/Unit YIELD RANKING ON FORTUNE 500 6.5% 122 SENIOR UNSECURED DEBT RATINGS MOODY S/STANDARD & POOR S Baa1/BBB+ PARTNERSHIP
Wells Fargo Pipeline, MLP & Energy Symposium
 Wells Fargo Pipeline, MLP & Energy Symposium Barry E. Davis President & Chief Executive Officer December 11, 2013 RIGHT PLATFORM. RIGHT OPPORTUNITIES. RIGHT PEOPLE. 1 Forward-Looking Statements & Non-GAAP
Credit Suisse MLP and Energy Logistics Conference
 Credit Suisse MLP and Energy Logistics Conference New York City June 2014 www.magellanlp.com Forward-Looking Statements Portions of this document constitute forward-looking statements as defined by federal
TransMontaigne Partners Announces Third Quarter 2017 Results
 TransMontaigne Partners Announces Third Quarter 2017 Results Net earnings for the third quarter of 2017 totaled $11.0 million, compared to $11.9 million in the prior year third quarter Consolidated EBITDA
Investor Presentation
 PEOPLE PROCESS TECHNOLOGY Investor Presentation December 2018 Forward-Looking Statements Under the Private Securities Litigation Reform Act of 1995 This document may contain or incorporate by reference
Enable Midstream Partners, LP
 Enable Midstream Partners, LP Fourth Quarter 2016 Conference Call February 21, 2017 Forward-looking Statements This presentation and the oral statements made in connection herewith may contain forward-looking
FIXED INCOME INVESTOR UPDATE. July 2017
 FIXED INCOME INVESTOR UPDATE July 2017 FORWARD-LOOKING STATEMENTS Statements contained in this presentation that include company expectations or predictions should be considered forward-looking statements
Mizuho Energy Infrastructure Summit. April 2017
 Mizuho Energy Infrastructure Summit April 2017 Forward Looking Statements This presentation contains forward-looking statements within the meaning of federal securities laws regarding MPLX LP ( MPLX )
Targa Resources Corp. (NYSE:TRGP)
") Targa Resources Corp. (NYSE:TRGP) Investor Presentation March 2015 Forward Looking Statements Certain statements in this presentation are "forward-looking statements" within the meaning of Section 27A
Targa Resources Corp. (NYSE:TRGP) Investor Presentation March 2015 Forward Looking Statements Certain statements in this presentation are "forward-looking statements" within the meaning of Section 27A
WELLS FARGO ENERGY SYMPOSIUM. New York Dec. 6, 2016
 WELLS FARGO ENERGY SYMPOSIUM New York Dec. 6, 2016 TERRY K. SPENCER President and Chief Executive Officer Page 2 FORWARD-LOOKING STATEMENTS Statements contained in this presentation that include company
MLPA Investor Conference. June 2016
 MLPA Investor Conference June 2016 Disclaimers Forward Looking Statements This presentation contains forward-looking statements within the meaning of Section 27A of the Securities Act of 1933, as amended,
TransMontaigne Announces Fourth Quarter and Full Year 2017 Results and the Filing of its 2017 Annual Report on Form 10-K
 TransMontaigne Announces Fourth Quarter and Full Year 2017 Results and the Filing of its 2017 Annual Report on Form 10-K Acquired two terminal facilities on the U.S. West Coast with approximately 5 million
RBC Capital Markets 2013 MLP Conference
 RBC Capital Markets 2013 MLP Conference November 21, 2013 RIGHT PLATFORM. RIGHT OPPORTUNITIES. RIGHT PEOPLE. 1 Forward-Looking Statements & Non-GAAP Financial Information This presentation contains forward
Pawnee Terminal Acquisition July 2015
 Pawnee Terminal Acquisition July 2015 Cautionary Note Forward Looking Statements Certain statements and information in this presentation may constitute "forward-looking statements." Certain expressions
SemGroup Reports Financial Results for First Quarter 2018
 SemGroup Reports Financial Results for First Quarter 2018 Tulsa, Okla. - May 8, 2018 - SemGroup Corporation (NYSE:SEMG) today reported first quarter 2018 net loss of $33 million, compared to net income
Investor Presentation
 Investor Presentation Second Quarter 2017 Results August 2017 Non-GAAP Financial Measures Investor Presentation - August 2017 SemGroup s non-gaap measure, Adjusted EBITDA, is not a GAAP measure and is
Oiltanking s Houston Ship Channel Pipeline and Storage Project September 21,
 Oiltanking s Houston Ship Channel Pipeline and Storage Project September 21, 2012 Trying to look all big and dumb.. Forward-Looking Statements Some of the information in this presentation may contain forward-looking
Regency Energy Partners LP NAPTP MLP Investor Conference May 22, 2013
 Regency Energy Partners LP NAPTP MLP Investor Conference May 22, 2013 Forward Looking Statements and Other Disclaimers This presentation includes forward looking statements. Forward looking statements
Third Quarter 2018 Earnings Call
 PEOPLE PROCESS TECHNOLOGY Third Quarter 2018 Earnings Call November 6, 2018 Forward-Looking Statements Under the Private Securities Litigation Reform Act of 1995 This document may contain or incorporate
Midcoast Energy Partners, L.P. Investment Community Presentation. March 2014
 Midcoast Energy Partners, L.P. Investment Community Presentation March 2014 Forward Looking Statement This presentation includes forward-looking statements, which are statements that frequently use words
Targa Resources Corp. Fourth Quarter 2017 Earnings & 2018 Guidance Supplement February 15, 2018
 Targa Resources Corp. Fourth Quarter 2017 Earnings & 2018 Guidance Supplement February 15, 2018 Forward Looking Statements Certain statements in this presentation are "forward-looking statements" within
Morgan Stanley Midstream MLP and Diversified Natural Gas Corporate Access Event
 Morgan Stanley Midstream MLP and Diversified Natural Gas Corporate Access Event March 4-5, 2014 LEGAL NOTICE/FORWARD-LOOKING STATEMENTS This presentation contains forward-looking statements that we believe
2012 Wells Fargo Securities Research & Economics 11 th Annual Pipeline, MLP and Energy. Symposium
 2012 Wells Fargo Securities Research & Economics 11 th Annual Pipeline, MLP and Energy Symposium December 4-5, 2012 Forward-Looking Statements Under the Private Securities Litigation Act of 1995 This document
May 24, 2018 MLP & Energy Conference
 May 24, 2018 MLP & Energy Conference Carlin Conner, CEO Non-GAAP Financial Measures SemGroup s non-gaap measures, Adjusted EBITDA and Total Segment Profit, are not GAAP measures and are not intended to
NAPTP MLP Conference. Carlin Conner, CEO Bob Fitzgerald, CFO. May 22, 2014
 NAPTP MLP Conference Carlin Conner, CEO Bob Fitzgerald, CFO May 22, 2014 Forward-looking Information Certain matters contained in this presentation include "forward-looking statements" within the meaning
Forward Looking Statements
 (NYSE:TLP) May 2018 Forward Looking Statements All statements contained herein and made by representatives of TransMontaigne Partners L.P. (the Partnership ) during this presentation, other than statements
2 nd Quarter Operations Report AUGUST 2017
 2 nd Quarter Operations Report AUGUST 207 FOCUS ON PEOPLE STRIVE FOR EXCELLENCE BE ETHICAL DELIVER RESULTS BE GOOD STEWARDS INVESTOR NOTICE This presentation contains forward-looking statements within
INFRASTRUCTURE 8 LOGISTICS 9 WHOLESALE 11
 Contents BUSINESS OVERVIEW 2 SELECTED FINANCIAL INFORMATION 2 Q1 2018 REVIEW 3 PROJECT DEVELOPMENTS AND MARKET OUTLOOK 4 RESULTS OF CONTINUING OPERATIONS 7 INFRASTRUCTURE 8 LOGISTICS 9 WHOLESALE 11 EXPENSES
Deutsche Bank MLP, Midstream, and Natural Gas Conference. May 2017
 Deutsche Bank MLP, Midstream, and Natural Gas Conference May 2017 Forward Looking Statements This presentation contains forward-looking statements within the meaning of federal securities laws regarding
IPAA Oil & Gas Investment Symposium Presentation April 13, :35 p.m.
 IPAA Oil & Gas Investment Symposium Presentation April 13, 2011 1:35 p.m. Overview of Operations Tulsa based company founded in 1963 with long history of operations in the Mid-Continent Ticker: UNT / NYSE
INFRASTRUCTURE 8 LOGISTICS 10 WHOLESALE 10
 Contents BUSINESS OVERVIEW 2 SELECTED FINANCIAL INFORMATION 2 2018 REVIEW 3 PROJECT DEVELOPMENTS, ACQUISITIONS AND MARKET OUTLOOK 5 RESULTS OF CONTINUING OPERATIONS 7 INFRASTRUCTURE 8 LOGISTICS 10 WHOLESALE
Driving Distinctive Growth Goldman Sachs 2017 Global Energy Conference January 2017
 Driving Distinctive Growth Goldman Sachs 2017 Global Energy Conference January 2017 2015 Tesoro Corporation. All Rights Reserved. Forward Looking Statements On November 17, 2016, our sponsor, Tesoro Corporation,
NAPTP Annual MLP Investor Conference NASDAQ: CPNO. May 12, 2010
 NAPTP Annual MLP Investor Conference NASDAQ: CPNO May 12, 2010 Disclaimer Statements made by representatives of Copano Energy, L.L.C. ( Copano ) during this presentation will include forward-looking statements,
TransMontaigne Announces Third Quarter Results
 TransMontaigne Announces Third Quarter Results Achieved record levels of revenue, Consolidated EBITDA and distributable cash flow for the third quarter of 2018 Revenue for the third quarter of 2018 totaled
Crestwood Announces First Quarter 2018 Financial and Operating Results
 NEWS RELEASE Crestwood Announces First Quarter 2018 Financial and Operating Results 5/1/2018 Adjusted EBITDA increased 12% year-over-year driven by a 23% increase in G&P segment EBITDA Increased year-over-year
Enable Midstream Partners, LP
 Enable Midstream Partners, LP Second Quarter 2015 Conference Call August 5, 2015 Forward-looking Statements This presentation and the oral statements made in connection herewith may contain forward-looking
Investor Presentation HOWARD WEIL ENERGY CONFERENCE MARCH 2015
 Investor Presentation HOWARD WEIL ENERGY CONFERENCE MARCH 2015 Forward-Looking Statements and Other Disclaimers This presentation contains forward-looking statements within the meaning of Section 27A of
Acquisition of Navigator Energy Services, LLC
 Acquisition of Navigator Energy Services, LLC April 2017 Forward-Looking Statements Statements contained in this presentation other than statements of historical fact are forward-looking statements. While
energy partners lp Investor Update June 2018
 energy partners lp Investor Update June 2018 Disclaimers This presentation contains forward-looking statements made by Valero Energy Corporation ( VLO or Valero ) and Valero Energy Partners LP ( VLP or
August 9, Second Quarter 2018 Results Earnings Conference Call
 August 9, 2018 Second Quarter 2018 Results Earnings Conference Call Non-GAAP Financial Measures Second Quarter 2018 Results SemGroup s non-gaap measures, Adjusted EBITDA, Cash Available for Dividends (CAFD)
2015 Jefferies Energy Conference Pete Bowden Global Head of Midstream Energy Investment Banking November Jefferies LLC Member SIPC
 2015 Jefferies Energy Conference Pete Bowden Global Head of Midstream Energy Investment Banking November 2015 Jefferies LLC Member SIPC Current Macro Environment 1 Production / Consumption (MMBbl/d) Stock