Emirates NBD Announces First Half 2013 Results
|
|
|
- Chester Hensley
- 5 years ago
- Views:
Transcription
, the leading bank in the region, today announced its half year results for the period ended.")
1 For immediate release Emirates NBD Announces First Half 2013 Results Net Profit up 40% to AED 1.81 billion Dubai, 22 July 2013 Emirates NBD (DFM: EmiratesNBD), the leading bank in the region, today announced its half year results for the period ended. Results Highlights H net profit of AED 1.81 billion, up 40% compared with AED 1.29 billion in H Total income of AED 5.55 billion, up 7% from H Operating profit before impairments of AED 3.64 billion, up 10% from H Net impairment loss on financial assets of AED 1.88 billion, improved by 8% compared with H Total assets up 9% at AED billion compared with AED billion at the end of 2012 Customer loans at AED billion, up 6% compared with AED billion at the end of 2012 Customer deposits at AED billion, up 8% compared with AED billion at the end of 2012 Headline loan to deposit ratio at 101% as against 102% at the end of 2012 Capital adequacy ratio at 18.5% Emirates NBD s Chief Executive Officer, Mr. Rick Pudner, said: During the first half of 2013, we have once again delivered a robust set of financial results with net profit for the period up by 40% compared to the same period in This is a reflection of positive momentum in the UAE economy which has continued to be resilient despite the continued uncertain global economic climate. The growth momentum in our retail and Islamic franchises has evidently gained pace. During the period, we have also successfully completed the acquisition of BNP Paribas (BNPP) Egypt. Emirates NBD s Chief Financial Officer, Mr. Surya Subramanian, said: The operating performance during the first half of 2013 has been strong supported by top line growth and effective management of net interest margin. Preimpairment operating profits increased by 10% compared to the same period in The Bank has continued to optimize its balance sheet through increase of Tier 1 capital by AED 3.67 billion, Tier 2 capital by AED 2.9 billion, AED 2.7 billion medium term borrowings and has also repaid AED 7.8 billion of Ministry of Finance (MoF) Deposits received in Page 1 of 8
2 Financial Review AED million Half year ended 30 Jun 2013 Half year ended 30 Jun 2012 Better / (Worse) (%) Quarter ended 30 Jun 2013 Quarter ended 30 Jun 2012 Better / (Worse) (%) Net interest income 3,661 3,416 7% 1,913 1,639 17% Noninterest income 1,889 1,769 7% 1, % Total income 5,550 5,185 7% 2,920 2,499 17% Operating expenses (1,882) (1,836) (3%) (973) (894) (9%) Amortisation of intangibles (32) (40) 20% (16) (20) 19% Operating profit before impairment 3,636 3,309 10% 1,931 1,585 22% Impairment allowances (1,884) (2,055) 8% (997) (954) (4%) Operating profit 1,752 1,254 40% % Impairment and share of profit/(loss) of associates % % Taxation charge (10) (11) 9% (3) (5) 40% Net profit 1,808 1,289 40% % Cost to income ratio (%) 33.9% 35.4% 1.5% 33.3% 35.8% 2.5% Net interest margin (%) 2.42% 2.43% (0.01%) 2.48% 2.28% 0.20% EPS (AED) % % Return on average shareholders equity (%) 13.7% 10.2% 3.5% 14.9% 10.3% 4.6% AED billion as at 30Jun 2013 as at 31Dec 2012 Better/(Worse) (%) as at 31 Mar 2013 Better/(Worse) (%) Total Assets % % Loans % % Deposits % % Impaired Loan Ratio (%) 13.9% 14.3% 0.4% 14.2% 0.3% Impaired Loan Coverage Ratio (%) 53% 49% 4% 51% 2% Capital Adequacy Ratio (%) 18.5% 20.6% (2.1%) 19.7% (1.2%) Tier 1 Ratio (%) 14.5% 13.8% 0.7% 13.5% 1.0% Total Income Total income for H amounted to AED 5,550 million; an increase of 7% compared with AED 5,185 million in H Net interest income for H improved by 7% to AED 3,661 million from AED 3,416 million in H The improvement in net interest income is attributable mainly to higher spread in loans and deposits which is partly offset by lower treasury spreads. Noninterest income recorded an increase of 7% to AED 1,889 million in H compared with H1 2012, driven primarily by increased banking fee income, brokerage fee income, gain on sale of investment securities and foreign exchange income. Page 2 of 8
3 Total Costs Costs in H amounted to AED 1,882 million and saw a marginal increase by 3% over the previous year due to higher staff costs, BNPP Egypt acquisition and BNPP Egypt administrative costs. However the Cost to Income ratio for H improved by 1.5% from H as improving top line momentum, as expected, offset the increase in costs which were primarily directed at customer facing activities. Credit Quality and Impairments Emirates NBD continues to proactively manage credit quality and impaired loans across the bank s corporate, Retail and Islamic financing portfolios which have improved marginally during H by 0.4% to end the period at 13.9%. The impairment charge in H improved by 8% to AED 1,884 million compared with AED 2,055 million in H This impairment charge was primarily composed of specific provisions made in relation to the bank s corporate and Islamic financing portfolios. As at, total portfolio impairment allowances amount to AED 3.7 billion or 2.8% of unclassified credit risk weighted assets, in excess of the UAE Central Bank requirement of 1.5% by AED 1.7 billion. Associates and Joint Ventures The positive contribution of the Bank s investments in associates and joint ventures amounted to AED 67 million during the period compared with AED 46 million in H The carrying value of Union Properties PJSC (UPP) has decreased as a result of sale of a portion of UPP shares held by Emirates NBD in H Net Profit Net profit for the Group was AED 1,808 million for H1 2013, 40% above the profit posted in H of AED 1,289 million due to a higher top line and bottom line growth. Customer Loans and Deposits Customer Loans as at (including Islamic financing) amounted to AED billion, an increase of 6% from end Customer Deposits as at were AED billion, an increase of 8% from end The loan to deposit ratio marginally improved in H to 100.6% from 102.0% at the end of Capital As at, the bank s total capital adequacy ratio and Tier 1 capital ratio were 18.5% and 14.5% respectively. The movement in capital ratio is mainly due to increase in risk weighted assets resulting from the Egypt acquisition and repayment of AED 7.8 billion MoF deposits; which was mainly offset by new Tier 1 and Tier 2 capital, which the Bank raised during the period. Risk weighted assets increased by 5% during the period, as expected, primarily from the Egypt acquisition. Tier 1 ratio increased by 0.7% relative to end2012 as a result of the new issue of Tier 1 capital. Page 3 of 8
4 Business Performance Consumer & Wealth Management (CWM) In H1 2013, income for the division increased by 9% over H to AED 2,422 million from AED 2,229 million. This was driven by 6% growth in net interest income and a 14% improvement in fee income. During the period, CWM continued its focus on increasing revenue with several initiatives being launched to improve processes and customer service. Credit quality remained tightly managed and retail loan portfolio delinquencies during the period continued to witness the improving trends evident throughout 2011 and CWM s sustained focus on deposit growth during H1 2013, driven by a strong momentum in current and savings account, resulted in growth of 9% in customer deposits from end2012 levels to reach AED 96 billion. In Auto Loans, an exclusive tie up with Porsche Financial Services was launched across all dealer counters at Porsche, Audi and Volkswagen in the UAE the first of its kind in the region. Mortgage bookings continued steady growth from end2012 with the increased activities in the real estate sector. Various new products were launched during the period such as enhanced Safe Deposit Locker Proposition, Chinese Yuan account, Retail Islamic Liabilities product suite and goal based Recurring Deposit. Done Deals platform was launched for Credit and Debit cardholders in partnership with Cobone, offering a variety of discounts on products and services. Business Banking launched the RISE initiative, providing SME owners in the UAE with a comprehensive platform to learn, connect and grow their businesses. Emirates NBD was awarded "Best Retail Bank in the UAE" by the Asian Banker in March This is recognition of a longterm, sustainable, profitable franchise with the customer at its core proposition. The Emirates NBD Corporate Card was awarded the 'Best Corporate Card' at the Smart Card Awards Middle East 2013, for the second consecutive year. Wholesale Banking Despite an ongoing challenging environment, Wholesale Banking continued its robust performance in H and delivered a healthy net profit of AED 532 million; up by 76% as compared to H Net interest income increased by 5.3% in H to AED 1,583 million compared with AED 1,503 million in H and management s focus on nonfunded/service related avenues resulted in growth in fee and commission income by 14% to AED 646 million compared with AED 567 million in H1 2012, particularly from foreign exchange and debt capital markets activities. In terms of balance sheet, H registered an increase of 5% both in its Loan and Deposits book as compared to end2012; reflecting the management s drive to steadily grow quality assets accompanied by lower provisioning requirements in H by 11% compared to H Page 4 of 8
5 The Investment Banking platform, Emirates NBD Capital Ltd, continued its strong performance in H and executed several notable transactions which included acting as mandated lead arranger, advisor and bookrunner for syndicate loans with total deal value of USD 10.6 billion for major clients like Archirodon Group NVNetherlands, Saudi Oger Limited, Zain Group Kuwait, SBER Bank Russia, and Investment Corporation of Dubai. It also acted as joint lead arranger and bookrunner for several Sukuk and Bond issuers including Emirates NBD, Emirates Airlines, Government of Dubai and DEWA. During H1 2013, the management continued execution of its comprehensive wholesale banking strategy and transformation process of becoming the dynamic Wholesale Banking powerhouse in the Middle East and witnessed successful results during the period which enhanced the division s overall performance. Global Markets & Treasury (GMT) GMT reported a total income of AED 216 million for H as against AED 443 million in H Income generation was broad based. During 2013, Sales Desk continued to show healthy revenues in line with Corporate clients are looking to hedge Foreign Currency payables at favourable foreign exchange rates. Balance Sheet hedging products saw an expected increase with more clients looking to take advantage of a prevailing low interest rate environment. Improved customer activity is expected during the second half of the year on the back of marked improvement in the US economy and anticipated quantitative easing (QE) rollback by Federal Reserve. During the first half, Trading Desk has performed broadly in line with The performance was broad based across products with foreign exchange trading, credit trading having better performance and Rates Trading, which remained down, is expected to pick up in second half of the year. In a landmark deal by the Global Funding desk, Emirates NBD improved the capital structure of the bank by issuing AED 3.67 billion Tier I Perpetual non call 6 Notes, AED 7.8 billion of Ministry of Finance funds were also repaid. Islamic Banking (IB) H financial result reflects IB s aspiration to become the leading Islamic bank in the region with a net profit of AED 115 million as compared to a net loss of AED 91 million in the same period last year. Total income after customers share of profit witnessed an increase to AED 701 million from AED 556 million for the same period last year, an increase of 26%. Financing receivables grew marginally by 2% to AED 23.7 billion from AED 23.3 billion as at December IB continued to implement its aggressive growth plans and is being regarded as the fastest growing Islamic bank in the region. The H growth sets up the tone right for IB success with primary focus on the retail segment Page 5 of 8
6 and strengthening the corporate segment by introducing innovative products. In H1 2013, IB continued its offerings to target segments of SMEs and priority clients, with several new products like commercial finance and POS finance. In recognition of the IB transformation, the Bank has been recognized as the Best Islamic Bank in the UAE 2013 by two prestigious international magazines, Capital Finance International (CFI) and World Finance. The awards came as a confirmation of the success the bank had in Information Technology and Operations (ITO) In H1 2013, Group IT finalized the Transition Service Agreement with BNP Paribas Paris. Project board approval was obtained and a mandate project has been initiated to finalize the application and Infrastructure landscape for the integration. Following the Customer Relationship Management (CRM) implementation for Emirates Islamic Bank, Siebel CRM was rolled out for Emirates NBD as well, as the Campaign, Lead & Opportunity Management tool enables the bank to have a structured Marketing & Sales experience across all frontline staff. Since the golive date, Emirates Islamic Bank has launched multiple campaigns across channels i.e. Internet Banking, SMS, , Website. Crosssell campaigns have been launched across branches and the online channels. The Contact Center and Direct Sales Force have also been migrated to CRM for lead and opportunity management. In addition, the Combat Risk Solution was delivered for Emirates NBD to manage the risk and statutory requirements in three of the international business locations London, Singapore and KSA. Group IT s Lean Transformation program continued with focus on strengthening the customer experience and enhancing end user satisfaction during H As part of the Information Security program, several campaigns have been launched through social media and other channels with an objective of building customer awareness on secure banking practices. Procurement and Realty Services have delivered efficiencies during H Negotiations have been concluded for a single ATM vendor providing the Group with significant added value including the replacement of more than 200 machines. Page 6 of 8
7 Group Initiatives Tanfeeth Over H1 2013, Tanfeeth made significant progress in delivering its target of a 15% improvement in all key performance areas for the Group, in addition to the acrosstheboard service improvements of 2030% made in Tanfeeth s strategy to achieve this focuses on continuing to institutionalise a lean operating culture through widescale business transformations, implementation of its bestpractice Tanfeeth Operating Model, and through extensive people investments. This includes comprehensive learning and development, and performance management systems. In H1 2013, Tanfeeth continued delivering services for a leading telecommunications provider and government authority in the UAE, and is now nearing successful completion of its first transformation and advisory engagement for a regional banking organization. During the period, Tanfeeth also reached a significant milestone, hitting 2,000Full Time Employees (FTEs). As Tanfeeth s top strategic priority, for the remainder of 2013, it will maintain concerted efforts to expand its geographic footprint in the GCC region across a range of industries and sectors, while delivering value for its parent company. Outlook The UAE remains wellpositioned to enjoy solid growth in 2013 driven by an expansion in nonoil sectors, particularly manufacturing, tourism and retail sectors, which should offset an expected stabilisation in oil production. Although the external environment remains challenging, economic data in the first half of 2013 supports our view that growth is likely to come in at 3.8% this year from an estimated 4.4% in Emirates NBD is well placed to capitalise on the improving economic fundamentals as the Bank has a clear strategy in place to further enhance shareholder returns and take advantage of the selected growth opportunities. This strategy is built around five core building blocks which include delivering excellent customer experience, building a high performance organisation, driving core businesses, running an efficient organisation and driving geographic expansion. END Page 7 of 8
8 Notes to editors: Awards Emirates NBD named UAE s Best Foreign Exchange Provider 2013 by Global Finance. Emirates NBD Asset Management named UAE Asset Manager of the Year at MENA Fund Manager Awards Emirates NBD Securities has been declared as Winner of NASDAQ Dubai s Retail Broker of the Month Award for February Emirates NBD named Best Retail Bank in the UAE by the Asian Banker. Emirates NBD wins bronze award for best sponsorship of Omega Dubai Desert Classic. Emirates NBD wins Best SME Internet Banking Service award by Banker Middle East. Emirates NBD wins Best Corporate Card Award for two consecutive years at the Smart Card Awards Middle East Emirates NBD wins Visa LEADER Award as The Best Issuing Institution in MENA at the Visa APCEMEA 2013 Security Summit. Emirates NBD Securities won Retail Broker of the Month for March 2013 at NASDAQ Dubai awards. Emirates NBD wins 'ebanking 2013 Excellence Award' for best mobile banking application at the 18th Middle East egovernment and e Services Excellence Awards. Emirates NBD wins Best Borrower in the ME by Euroweek. Emirates NBD named Best Bank in the UAE at the Euromoney Awards for Excellence About Emirates NBD Emirates NBD (DFM: Emirates NBD) is a leading bank in the region. Emirates NBD has a leading retail banking franchise, with 210 branches and over 901 ATMs and CDMs in the UAE and overseas. It is a major player in the UAE corporate and retail banking arena, and has strong Islamic banking, investment banking, private banking, asset management, global markets & treasury and brokerage operations. The bank has operations in the UAE, Egypt, the Kingdom of Saudi Arabia, Qatar, Singapore, the United Kingdom and Jersey (Channel Islands), and representative offices in India and China. For more information, please visit: For more information: Ibrahim Sowaidan Head Group Corporate Affairs Emirates NBD Telephone: / Investor Relations Emirates NBD Telephone: IR@emiratesnbd.com Page 8 of 8

9 Q Results Presentation July 22,
10 Important Information Disclaimer The material in this presentation is general background information about Emirates NBD's activities current at the date of the presentation. It is information given in summary form and does not purport to be complete. It is not intended to be relied upon as advice to investors or potential investors and does not take in to account the investment objectives, financial situation or needs of any particular investor. These should be considered, with or without professional advice when deciding if an investment is appropriate. The information contained here in has been prepared by Emirates NBD. Some of the information relied on by Emirates NBD is obtained from sources believed to be reliable but does not guarantee its accuracy or completeness. Forward Looking Statements It is possible that this presentation could or may contain forwardlooking statements that are based on current expectations or beliefs, as well as assumptions about future events. These forwardlooking statements can be identified by the fact that they do not relate only to historical or current facts. Forwardlooking statements often use words such as anticipate, target, expect, estimate, intend, plan, goal, believe, will, may, should, would, could or other words of similar meaning. Undue reliance should not be placed on any such statements because, by their very nature, they are subject to known and unknown risks and uncertainties and can be affected by other factors that could cause actual results, and the Group s plans and objectives, to differ materially from those expressed or implied in the forwardlooking statements. There are several factors which could cause actual results to differ materially from those expressed or implied in forward looking statements. Among the factors that could cause actual results to differ materially from those described in the forwardlooking statements are changes in the global, political, economic, business, competitive, market and regulatory forces, future exchange and interest rates, changes in tax rates and future business combinations or dispositions. Emirates NBD undertakes no obligation to revise or update any forward looking statement contained within this presentation, regardless of whether those statements are affected as a result of new information, future events or otherwise. 2
11 Q Financial Results Highlights Highlights Net profit of AED 972 million, improved by +50% vs. Q and +16% vs. Q Net interest income improved by +17% yoy and +9% qoq Noninterest income improved by 17% yoy and by 14% qoq; core fee income improved by 6% qoq Costs increased by 6% yoy, 4% qoq while Cost to Income Ratio improved by 3.3% yoy and 2.1% q oq after excluding acquisition costs relating to the Egypt transaction Continued balance sheet derisking and conservative provisioning resulted in net impairment allowances of AED 997 million Net loans increased 11% yoy and 5% qoq Deposits increased 3% qoq and 11% yoy Headline LTD ratio at 101% vs.100% at end of Q Key Performance Indicators AED million Q Q Better/ (Worse) Q Better/ (Worse) Net interest income 1,913 1,639 17% 1,748 9% Noninterest income 1, % % Total income 2,920 2,499 17% 2,630 11% Operating expenses (973) (894) (9%) (909) (7%) Amortisation of intangibles (16) (20) 20% (15) (7%) Preimpairment operating profit 1,931 1,585 22% 1,706 13% Impairment allowances (997) (954) (4%) (888) (12%) Operating profit % % Share of profits of associates % 26 54% Taxation charge (3) (5) 40% (7) 57% Net profit % % Cost: income ratio 33.3% 35.8% 2.5% 34.6% 1.3% Net interest margin 2.48% 2.28% 0.2% 2.39% 0.09% AED billion 30Jun13 30Jun12 Better/ (Worse) 31Mar13 Better/ (Worse) Loans % % Deposits % % 3
12 Net Interest Income Highlights Net Interest Margin (%) NIM increased by 9 bps from 2.39% in Q to 2.48% in Q which coupled with balance sheet growth resulted in an increase in net interest income which is 9% higher than the previous quarter Q NIM increase is driven mainly by higher spreads in loans and deposits partly offset by decrease in treasury spreads Qtrly NIM YTD NIM Q2 11 Q3 11 Q4 11 Q1 12 Q2 12 Q3 12 Q4 12 Q1 13 Q2 13 Net Interest Margin Drivers (%) Q to Q Q Loan Spreads Deposit Spreads Treasury Spreads Other Q Loan Spreads Deposit Spreads Treasury Spreads Other Q
13 Funding and Liquidity Highlights Loan to Deposit (LTD) Ratio (%) Headline LTD ratio of 100.6% at Q The LTD ratio is being managed within a target range of 95%105% Liquid assets* of AED 32.2 billion as at (11% of total liabilities) Issued AED 2.42 billion medium term debt during 2013 via private placements Issued AED 3.6 billion of Tier 1 capital notes Issued AED 2.75 billion of Tier 2 notes in March 2013 Repaid AED 1.3 billion of subordinated debt Repaid AED 7.8 billion to Ministry of Finance in H Q Q Q Q Q Q3 12 LTD Ratio (%) Q4 12 Q1 13 Q2 13 Composition of Liabilities and Maturity of Debt Issued (AED million) Composition of Liabilities Debt / Sukuk Issued Others Banks 7% 10% 4% 78% Customer deposits 2, ,617 Maturity Profile of Debt/Sukuk Issued 100% = AED 21.4 billion *including cash and deposits with Central Banks but excluding interbank balances and liquid investment securities , , , , , ,
14 Loan and Deposit Trends Highlights Trend in Gross Loans by Type (AED billion) Signs of modest pickup in new underwriting across all business segments with 12% growth in gross loans from Q Gross loans given to customers of BNP Paribas Egypt are AED 3.8 billion. 66% of these loans relate to corporate customers Customer deposits of BNP Paribas Egypt are AED 7.3 billion. 54% of these deposits are CASA Balance sheet optimisation initiatives successful in improving deposit mix: Q2 12 Corporate Q3 12 Consumer +12% Q Trend in Deposits by Type (AED billion) 22 Islamic Q1 13 Treasury Q % Growth of 11% in deposits +11% CASA growth of 32% or AED 28 billion from Q and 13% from Q % 50% of total deposits in the form of CASA at end of Q compared to 42% and 43% at end of Q and Q respectively Q2 12 Other 123 Q3 12 Time CASA Q Q1 13 Q2 13 6
15 NonInterest Income Highlights Noninterest income improved by 14% qoq and 17% yoy Increase of 80% yoy and 52% qoq in income from noncore items due to: Higher property income in Q from the gain on sale of properties held as inventory due to a robust real estate market Lower investment securities income in Q due to higher credit spreads Core fee income improved qoq and yoy by 6%, key trends being: Improvement in banking fee income (15% qoq and 27% yoy) arising from increased fee on Loan Syndication as we reached out to regional customers Improvement in brokerage/asset management fee income (27% qoq and 52% yoy) Forex, Rates & Other was stable qoq & was 16% lower yoy Composition of Non Interest Income (AED million) AED million Q Q Better/ (Worse) Trend in Core Gross Fee Income (AED million) Q Better/ (Worse) Core gross fee income % % Fees & commission expense (53) (20) 165% (24) 121% Core fee income % 726 6% Property income % % Investment securities income / (loss) (5%) 124 (2%) Total Non Interest Income 1, % % +10% Q2 12 Q3 12 Forex, Rates & Other Brokerage & AM fees Q4 12 Fee Income Trade finance Q Q % 7
16 Operating Costs and Efficiency Highlights Cost to Income Ratio (%) Q Costs increased by 6% yoy (Excluding costs of the Egypt acquisition). CI Ratio improved yoy and qoq Excluding the BNP Paribas Egypt numbers, the CI ratio would have been 33.1% at Q Costs increased by 7% qoq by AED 64 million to AED 973 million in Q resulting from: BNP Paribas Egypt acquisition costs AED 24 million BNP Paribas Egypt administrative costs AED 18 million Increase in other costs by AED 20 million The cost to income ratio will be managed to the longer term target range of c.34%35% Q4 11 Q1 12 Q2 12 Q3 12 Q4 12 Q1 13 CI Ratio Cost Composition (AED million) % Q % Q2 12 Q3 12 Q4 12 Q1 13 Q2 13 Dubai Bank Occupancy cost Other Cost Staff Cost Depreciation 8
17 Credit Quality Highlights Q net impairment charge of AED 997 million driven principally by additional net specific corporate loan provisions Total portfolio impairment allowances amount to AED 3.7 billion or 2.8% of credit RWAs Management targets for impaired loan coverage ratios: 80%85% on underlying NPL portfolio 55%60% on overall impaired loans to be achieved by 2013 Target coverage ratios to be achieved through more conservative provisioning for and recognition of impaired loans Impaired Loan & Coverage Ratios (%) Q2 12 Q3 12 Impact of DW/DH* % Q4 12 Q1 13 Q2 13 Coverage ratio, excl. DW/DH* % NPL ratio, excl. DW/DH* Coverage ratio, incl. DW/DH* % Impaired Loans and Impairment Allowances (AED billion) Impaired Loans Impairment Allowances Q2 12 DW/DH* Q3 12 Core Corporate Q4 12 Retail Q1 13 Q2 13 Q2 12 Islamic Investment Securities Q3 12 Q4 12 Q1 13 Q2 13 *DW/DH = includes D1 (exposure AED 9.3 billion; provision AED 506 million) and D2B (exposure AED 4.6 billion; provision AED 2.51 billion) 9
18 Capital Adequacy Highlights Capitalization CAR declined 1.2% while T1 increased by 1% qoq to 18.5% and 14.5% respectively resulting from: Increase in Tier 1 capital by AED 3.5 billion in H due to the newly issued T1 capital of AED 3.7 billion in May 2013, net profit of AED 1.8 billion, deduction of goodwill and intangibles of AED 0.5 billion related to the Egypt acquisition and the dividend payout of AED 1.4 billion paid in March % increase in RWAs due to the inclusion of BNP Paribas Egypt s assets Net decrease in T2 capital of AED 5.7 billion due to the repayment of T2 of AED 7.8 billion (eligible after amortization: AED 6.2 billion) during Q partially offset by the new issuance of T2 capital of AED 2.88 billion The impact of the Egypt acquisition was anticipated when we first announced the transaction and excluding the same, ENBDs T1% and the CAR% would have been at 15.5% and 19.6% respectively Q2 12 Q3 12 Q4 12 Q1 13 T2 T1 T1 % CAR % Q2 13 Capital Movements (AED billion) Risk Weighted Assets Basel II (AED billion) 31 Dec 2012 to 30 Jun 2013 Tier 1 Tier 2 Total Capital as at 31 Dec Net profits generated FY 2012 dividend paid (1.4) (1.4) Newly issued T Repayment of T2* (6.2) (6.2) Amortization of MOF T2 / subordinated debt (1.08) (1.08) Interest on T1 securities (0.1) (0.1) Newly issued T Repayment of subordinated debt (1.3) (1.3) Other (0.5) (0.5) Capital as at 30 Jun * Net of amortization Q2 12 Q3 12 Operational Risk +2% Q % Q1 13 Q2 13 Market Risk Credit Risk 10
19 Acquisition of BNP Paribas Egypt Highlights On 9 June 2013, Emirates NBD acquired a 95.2% stake in BNP Paribas Egypt Acquisition of the remaining 4.8% of share is under process and the transfer of ownership of these shares will be completed in 2013 Total consideration of USD 500 million is 1.4 times the estimated fair value of net assets acquired The difference between the fair value of assets acquired and purchase consideration is goodwill and intangibles The fair value of the assets and liabilities was determined by an external expert The purchase price allocation exercise is currently in progress, hence the goodwill and intangibles will be adjusted once the exercise is completed Acquisition related costs of AED 24.4 million were incurred and are included in General & Administrative Expenses Financial Impact Upon Acquisition (AED million) AED million Book value of assets 1,128 Fair value adjustments 118 Fair value of net assets acquired 1,246 Goodwill and intangibles 592 Purchase consideration paid 1,838 Represented by: Purchase consideration paid in cash 1,748 Acquisition related cost (Capitalized) 2 Minority interest 88 Total 1,838 11
20 Acquisition of BNP Paribas Egypt Business Overview Business Overview Full service commercial banking platform: Corporate Banking: focused on large corporate and MNCs; serves c.4,000 clients Retail Banking: High growth segment; serves c.246,000 clients Treasury: AUMs of c.$446m; serves c.670 clients Wide presence in Egypt through 61 branches and 169 ATMs Financially sound with robust profitability and a healthy balance sheet Financial Highlights* Financial Highlights Full service commercial banking platform: AED million Dec 2011 Dec 2012 Net interest income Corporate Banking: focused on large corporate and MNCs; serves c.3,000 clients Noninterest income Total income Retail Banking: High growth segment; serves c.195,000 clients Operating expenses (301) (261) Preimpairment operating profit Treasury: AUMs of c.$800m; serves c.670 clients Impairment allowances (18) (23) Operating Wide presence profit in Egypt through an 162 extensive 181 network of 69 branches and 161 ATMs; rolled out 59 Tax (29) (26) branches in the last 6 years Net Profit Financially sound with robust profitability and a Cost: income ratio 62.5% 56.1% healthy balance sheet Net interest margin 3.5% 3.9% Segment Breakdown Corporate Gross Loans 100% = AED 3.5 billion 64% 36% Retail Deposits 100% = AED 7.6 billion Corporate 51% 49% Retail AED billion Dec 2011 Dec 2012 Loans Deposits NPL Ratio 4.6% 3.8% NPL Coverage ratio 116% 128% 12
21 Divisional Performance Wholesale Banking Continued focus on realignment to ensure enhanced future customer service quality and share of wallet, increased crosssell of Treasury and Investment Banking products and increased Cash Management and Trade Finance penetration Revenue increased 10% qoq and 19% yoy Loans rose by 5% from end of Q as new underwriting more than offset normal loan repayments Deposits grew by 6% from end of Q Balance Sheet Trends AED billion Q4 12 Loans +5% Q Q2 13 Deposits +6% Revenue Trends AED million Q2 12 NFI +19% 1, Q1 13 NII 1, Q % Consumer Banking & Wealth Management CWM continued to improve its position during the quarter Revenue improved 4% qoq and 13% yoy Deposits grew 5% qoq and 9% from end 2012 Loans grew 8% qoq and 12% from end of 2012 driven by growth in personal loans, credit cards and the SME segment The bank has added 9 ATM machines during the period. Branch count has been maintained as we promote our channel optimization strategy Balance Sheet Trends AED billion % Q4 12 Q1 13 Q2 13 Loans Deposits +9% Revenue Trends AED million 1, % 372 1, Q2 12 NFI 1,184 Q1 13 NII Q % 13
22 Divisional Performance (cont d) Global Markets & Treasury Revenue has marginally decreased to AED 104 million in Q from a AED 112 million in Q due to higher realization of AFS investments in Q1 After excluding one off gains mainly arising from sale of certain investments in Q2 2012, on like to like comparison, 2013 Trading revenues are broadly in line with 2012 Treasury sales revenues for Q are marginally better than Q as volatility returned to the FX markets which saw some hedging interest from clients; the prevailing low interest rate scenario attracted some interest rate hedging activities as well Revenue Trends AED million Q2 12 NFI 47% Q1 13 NII 104 7% Q2 13 Islamic Banking* Islamic Banking revenue improved 32% yoy and by 18% qoq to AED 379 million in Q (net of customers share of profit) Financing receivables increased by 2% to AED 23.7 billion from end of Q Customer accounts increased by 1% to AED 25.9 billion from end of Q As at end of Q2 2013, branches totaled 49 while the ATM & SDM network totaled 176 Balance Sheet Trends* AED billion +2% % Revenue Trends* AED million % % Q4 12 Q1 13 Q2 13 Financing receivables Customer accounts Q2 12 NFI Q1 13 Profit Q2 13 *Includes Emirates Islamic Bank and Dubai Bank 14
23 Emirates NBD has a focused longerterm strategy built on 5 core building blocks 1 Deliver an excellent customer experience Drive core business Run an efficient organization Drive geographic expansion 2 Build a high performing organization 15
24 2013 Strategic Priorities Deliver an excellent customer experience Build a high performing organization Drive core business Run an efficient organization Drive geographic expansion Continuous Group wide Current Service Excellence Program, e.g. end to end process optimization to improve turnaround times, etc. Further improvement of convenience and ease of access, e.g. through enhancement of mobile banking offering Active management of social media to drive customer service Continue to drive Nationalization efforts Run Group wide Employee Engagement Program Rollout of Wholesale Banking strategy, e.g. enhanced key account planning process involving Corporate, Retail Banking, Treasury and Wealth Management Further buildup of CASA book through strong Retail franchise Continuous focus to grow underpenetrated areas like SME business and Wealth Management Leverage new partnerships, e.g. collaboration with Porsche Financial Services to grow auto loan business in the region Ongoing organizational review and streamlining of organizational setup Completion of IT lean transformation Continuous performance transformation of back office functions in Tanfeeth Ongoing organic growth in KSA, UK and Singapore with additional focus of opening Rep Offices in selected markets Integration of BNP Paribas operations in Egypt 16
25 Outlook Economic Outlook During 2012 the UAE economy continued to display resiliency with an estimated GDP growth of 4.4% underpinned by rising oil output and modest private sector expansion Continued strength and growth witnessed in Dubai s traditional trade, logistics, tourism and retail sales sectors and signs of green shoots in the Dubai property market For 2013 the external environment remains challenging in the context of recessionary risks in the Eurozone, below trend US growth and an expected slowdown in Asia Nevertheless, the UAE remains wellpositioned to enjoy robust GDP growth of 3.8% in 2013 driven by solid expansion in nonoil sectors offsetting an expected stabilisation in oil production In Dubai, growth is expected to be at 3.8% in 2013 from an estimated 4.4% in 2012 as manufacturing, tourism and hospitality and nonoil foreign trade continue to benefit from strengthening regional consumption and investment Emirates NBD is well placed to take advantage of the strong continued growth in Dubai Capitalisation and liquidity continue to be extremely strong, offering resilience and flexibility for the future Significantly derisked and strengthened balance sheet offers strong platform for capturing future growth opportunities The Bank has a clear strategy in place and is focused on relentless execution 17
26 Summary Profitability Net profit improved significantly qoq and yoy by 16% and 50% respectively to AED 1,913 million Income Total income improved qoq and yoy by 11% and 17% respectively CI Ratio Cost to Income ratio has improved qoq and yoy from 34.6% and 35.8% respectively to 33.3% Credit Quality NPL coverage improved by 1.3% during Q Capitalisation and Liquidity Strategy Capitalisation and liquidity continue to be extremely strong, offering resilience and flexibility for the future Significant progress made in achieving strategic imperatives Outlook Emirates NBD is well placed and has a clear strategy in place to take advantage of the improving growth outlook 18
27 Investor Relations PO Box 777 Emirates NBD Head Office, 4th Floor Dubai, UAE Tel: IR@emiratesnbd.com 19

28 GROUP CONSOLIDATED STATEMENT OF FINANCIAL POSITION AS AT 31 DECEMBER 2009 GROUP CONDENSED CONSOLIDATED INTERIM FINANCIAL STATEMENTS FOR THE SIX MONTHS PERIOD ENDED 30 JUNE
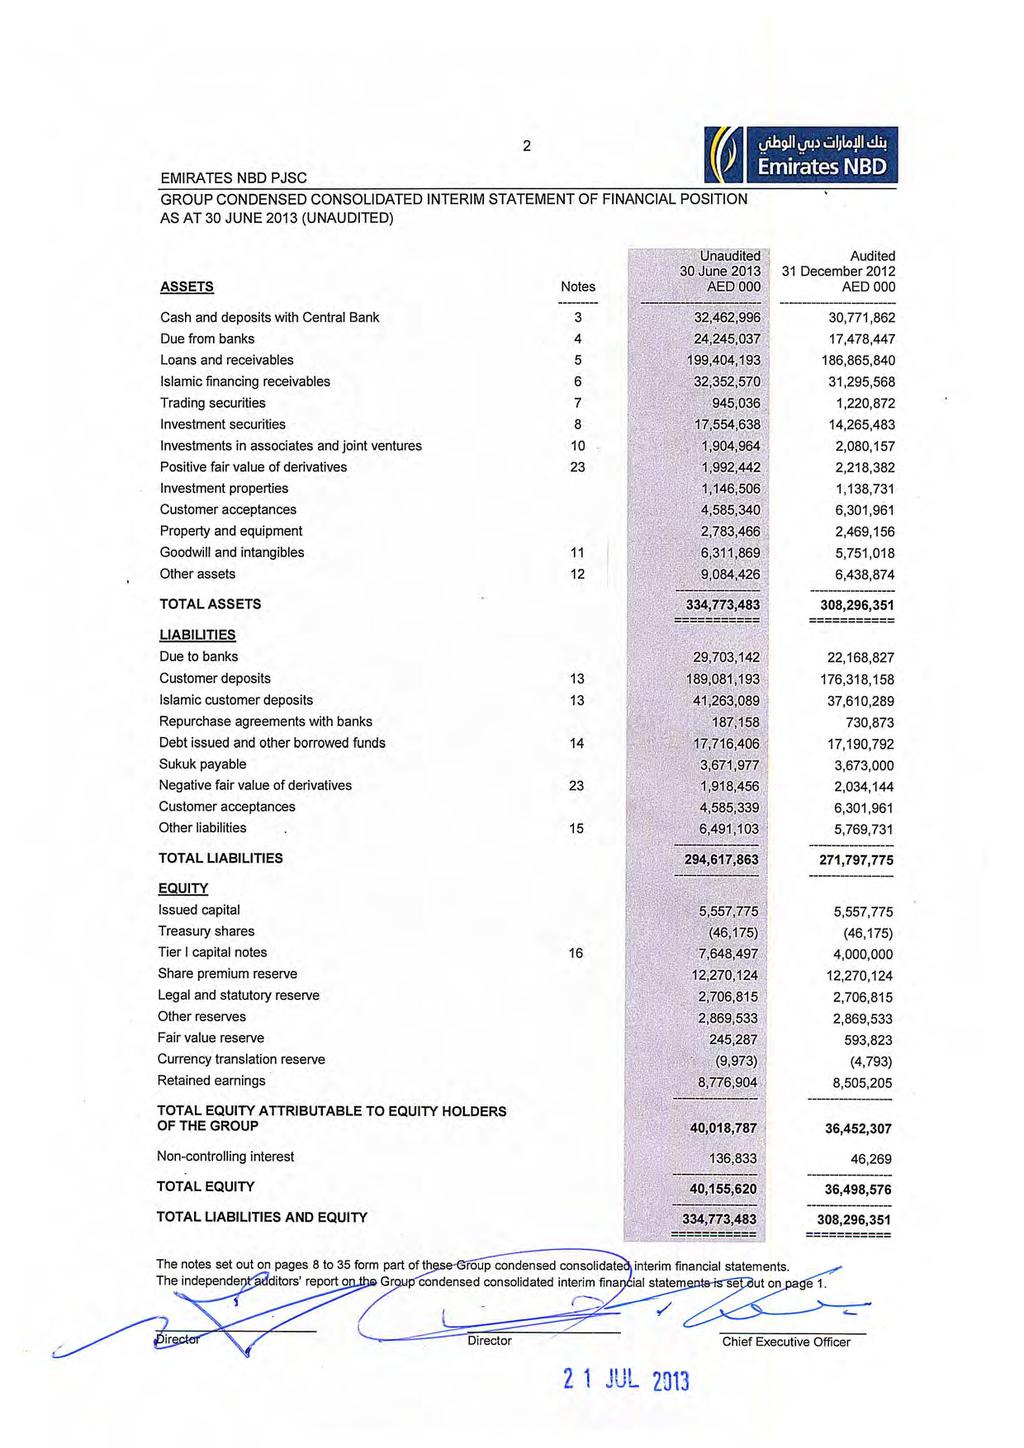
29 GROUP CONDENSED CONSOLIDATED INTERIM FINANCIAL STATEMENTS Contents Page Independent auditors report on review of the Group condensed consolidated interim financial statements 1 Group condensed consolidated interim statement of financial position 2 Group condensed consolidated interim income statement 3 Group condensed consolidated interim statement of comprehensive income 4 Group condensed consolidated interim statement of cash flows 5 6 Group condensed consolidated interim statement of changes in equity 7 Notes to the Group condensed consolidated interim financial statements 8 35
30
31
32 GROUP CONDENSED CONSOLIDATED INTERIM INCOME STATEMENT 3 three months period ended three months period ended six months period ended six months period ended 30 June June 2012 Notes Interest income 2,270,215 2,214,570 4,493,021 4,565,131 Interest expense (637,766) (693,431) (1,356,932) (1,447,269) Net interest income 1,632,449 1,521,139 3,136,089 3,117,862 Income from Islamic financing and investment products 415, , , ,238 Distribution to depositors and profit paid to Sukuk holders (135,585) (165,182) (287,620) (358,406) Net income from Islamic financing and investment products 280, , , ,832 Net interest income and income from Islamic financing and investment products net of distribution to depositors 1,912,632 1,639,137 3,660,855 3,415,694 Fee and commission income 607, ,670 1,141, ,848 Fee and commission expense (53,020) (19,698) (76,621) (57,817) Net fee and commission income 554, ,972 1,065, ,031 Net (loss)/gain on trading securities (6,174) (15,951) (13,160) 22,189 Other operating income , , , ,261 Total operating income 2,919,609 2,499,034 5,549,920 5,185,175 General and administrative expenses 18 (973,097) (893,873) (1,882,104) (1,836,112) Amortisation of intangibles (15,750) (19,535) (31,500) (40,000) Operating profit before impairment charges 1,930,762 1,585,626 3,636,316 3,309,063 Net impairment loss on financial assets 19 (996,483) (954,532) (1,884,484) (2,055,349) Operating profit after impairment charges 934, ,094 1,751,832 1,253,714 Share of profit of associates and joint ventures 40,785 21,417 66,554 45,575 Taxation charge (3,418) Group profit for the period 971,646 = Attributable to: (5,091) 647,420 = (9,959) 1,808,427 = (10,723) 1,288,566 = Equity holders of the Group 970, ,548 1,807,568 1,288,661 Noncontrolling interest 850 (128) 859 (95) Group profit for the period 971,646 = 647,420 = 1,808,427 = 1,288,566 = Earnings per share = = = = The notes set out on pages 8 to 35 form part of these Group condensed consolidated interim financial statements. The independent auditors report on the Group condensed consolidated interim financial statements is set out on page 1.
33 GROUP CONDENSED CONSOLIDATED INTERIM STATEMENT OF COMPREHENSIVE INCOME 4 three months period ended three months period ended 30 June 2012 six months period ended six months period ended 30 June 2012 Group profit for the period 971, ,420 1,808,427 1,288,566 Items that may be reclassified subsequently to Income statement: Other comprehensive income Cash flow hedges: Effective portion of changes in fair value (21,533) 9,574 (30,287) 29,996 Fair value reserve (availableforsale financial assets): Net change in fair value (175,590) 161,377 (117,067) 432,410 Net amount transferred to income statement (90,783) (123,294) (201,182) (218,750) Items that are not reclassified subsequently to Income statement: Currency translation reserve (6,412) (4,292) (5,180) (2,888) Other comprehensive income for the period (294,318) Total comprehensive income for the period 677,328 Attributable to: 43, ,785 = (353,716) 1,454, ,768 1,529,334 = Equity holders of the Group 676, ,913 1,453,852 1,529,429 Noncontrolling interest 850 Total recognised income for the period 677,328 (128) 690,785 = 859 1,454,711 (95) 1,529,334 = The notes set out on pages 8 to 35 form part of these Group condensed consolidated interim financial statements. The independent auditors report on the Group condensed consolidated interim financial statements is set out on page 1.
34 5 GROUP CONDENSED CONSOLIDATED INTERIM STATEMENT OF CASH FLOWS six months period ended OPERATING ACTIVITIES six months period ended 30 June 2012 Group profit for the period 1,808,427 1,288,566 Adjustment for non cash items Impairment loss on loans and receivables 1,257,761 1,453,186 Impairment loss on Islamic financing receivables 490, ,028 Impairment loss on investment securities 91,386 67,238 Interest unwind on impaired loans (45,660) (40,691) Amortisation of fair value (net) 23,239 33,609 Premium discount on Investment securities 18,857 30,058 Unrealised foreign exchange gain (87,654) (150,149) Amortisation of intangibles 31,500 40,000 Depreciation of property and equipment 146, ,930 Share of profit of associates and joint ventures (66,554) (45,575) Unrealised loss/(gain) on investments 73,012 (65,119) Revaluation loss on investment properties 14,342 12,937 Operating profit before changes in operating assets and liabilities 3,755,822 3,301,018 Increase in interest free statutory deposits (2,897,838) (1,702,960) Increase in certificate of deposits with Central Bank maturing after three months Decrease/(increase) in amounts due from banks maturing after three (2,000,000) (5,205,000) months 1,381,643 (1,333,457) Increase/(decrease) in amounts due to banks maturing after three months 212,341 (226,683) Net change in other liabilities/other assets (2,023,418) 68,495 Net change in fair value of derivatives 79, ,470 Increase in customer deposits (including Islamic deposits) 8,680,389 15,102,635 Increase in loans and receivables (10,191,528) (5,086,837) Increase in Islamic financing receivables (1,547,630) (1,867,719) Net cash flows (used in)/from operating activities (4,550,233) 3,212,962
35 GROUP CONDENSED CONSOLIDATED INTERIM STATEMENT OF CASH FLOWS 6 INVESTING ACTIVITIES six months period ended six months period ended 30 June 2012 Decrease/(increase) in trading securities (net of fair value movements) 239,008 (576,721) (Increase)/decrease in investment securities (net of fair value movements) (2,112,048) 1,646,011 Decrease in investments in associates and joint ventures 242,302 8,259 Sale of investment in subsidiary 5,204 Acquisition of Investment Properties (22,117) (21,736) Acquisition of subsidiary (661,218) Advance for acquisition of NCI in subsidiary (88,324) Additions to property and equipment (net) (39,838) (129,880) Net cash flows (used in)/from investing activities (2,437,031) 925,933 FINANCING ACTIVITIES Decrease in deposits under repurchase agreements (543,715) (1,237,280) Increase in debt issued and other borrowed funds 525,614 4,518,941 (Decrease)/increase in Sukuk borrowing (1,023) 597,319 Interest on tier I capital notes (147,901) (130,433) Issuance of tier I capital notes Dividends paid Net cash flows from financing activities (Decrease)/increase in cash and cash equivalents (refer Note 26) 3,648,497 (1,387,968) (1,110,374) 2,093,504 2,638,173 == == (4,893,760) 6,777,068 == == The notes set out on pages 8 to 35 form part of these Group condensed consolidated interim financial statements. The independent auditors report on the Group condensed consolidated interim financial statements is set out on page 1.
36 7 GROUP CONDENSED CONSOLIDATED INTERIM STATEMENT OF CHANGES IN EQUITY ATTRIBUTABLE TO EQUITY HOLDERS OF THE GROUP Issued capital Treasury shares Tier I capital notes Share premium reserve Legal and statutory reserve Other reserves Fair value reserve Currency translation reserve Retained earnings Total Noncontrolling interest Group total Balance as at 1 January ,557,775 (46,175) 4,000,000 12,270,124 2,706,815 2,869, ,823 (4,793) 8,505,205 36,452,307 46,269 36,498,576 Total comprehensive income for the period (348,536) (5,180) 1,807,568 1,453, ,454,711 Increase in noncontrolling interest* 89,705 89,705 Tier I capital notes issued during the period (note 16) 3,648,497 3,648,497 3,648,497 Interest on tier I capital notes (147,901) (147,901) (147,901) Dividends paid (1,387,968) (1,387,968) (1,387,968) Balance as at 5,557,775 (46,175) 7,648,497 12,270,124 2,706,815 2,869, ,287 (9,973) 8,776,904 40,018, ,833 40,155,620 ======= ======= ======= ======= Balance as at 1 January ,557,775 (46,175) 4,000,000 12,270,124 2,451,405 2,869, ,289 (3,686) 7,587,509 34,934,774 46,280 34,981,054 Total comprehensive income for the period 243,656 (2,888) 1,288,661 1,529,429 (95) 1,529,334 Increase in noncontrolling interest Tier I capital notes issued during the period Interest on tier I capital notes (130,433) (130,433) (130,433) Dividends payable (1,110,374) (1,110,374) (1,110,374) Balance as at 30 June ,557,775 (46,175) 4,000,000 12,270,124 2,451,405 2,869, ,945 (6,574) 7,635,363 35,223,396 46,185 35,269,581 ======= ======= *Increase in noncontrolling interest is due to acquisition of BNP Paribas Egypt, a subsidiary of the Group. Note: No allocation to legal and statutory and other reserves has been made for the six months period ended as this will be effected at the year end. The notes set out on pages 8 to 35 form part of these Group condensed consolidated interim financial statements. The independent auditors report on the Group condensed consolidated interim financial statements is set out on page 1.
37 NOTES TO THE GROUP CONDENSED CONSOLIDATED INTERIM FINANCIAL STATEMENTS 8 1 CORPORATE INFORMATION Emirates NBD PJSC (the Bank ) was incorporated in the United Arab Emirates on 16 July 2007, under the Commercial Companies Law (Federal Law Number 8 of 1984 as amended) as a Public Joint Stock Company. The Bank was incorporated principally to give effect to the merger between Emirates Bank International PJSC ( EBI ) and National Bank of Dubai PJSC ( NBD ). The merger became effective from 16 October 2007, while the legal merger was completed on 4 February Post this date, EBI and NBD ceased to exist. The condensed consolidated interim financial statements for the period ended comprise the Bank and its subsidiaries (together referred to as the Group ) and the Group s interest in associates and joint ventures. The Bank is listed on the Dubai Financial Market (TICKER: EMIRATESNBD ). The Group s principal business activities are corporate banking, consumer banking, treasury and Islamic banking. The Bank s website is The registered address of the Bank is Post Box 777, Dubai, United Arab Emirates ( UAE ). The Group is 55.6% owned by Investment Corporation of Dubai (the parent company), a company in which the Government of Dubai is the majority shareholder. 2 BASIS OF PREPARATION AND SIGNIFICANT ACCOUNTING POLICIES These condensed consolidated interim financial statements have been prepared in accordance with International Accounting Standard ( IAS ) 34 Interim Financial Reporting. The accounting policies applied by the Group in the preparation of the condensed consolidated interim financial statements are consistent with those applied by the Group in the annual consolidated financial statements for the year ended 31 December The adoption of the new and amended IFRS and IFRIC interpretations with effect from 1 January 2013 has had no effect on the interim condensed consolidated financial statements of the Group. These condensed consolidated interim financial statements do not include all the information and disclosures required for full annual consolidated financial statements prepared in accordance with International Financial Reporting Standards and should be read in conjunction with the Groups financial statements as at and for the year ended 31 December In addition, results for the six months ended are not necessarily indication of the results that may be expected for the financial year ending 31 December In preparing these condensed consolidated interim financial statements, significant judgments made by the management in applying the Group s accounting policies and the key sources of estimation were the same as those that were applied to the consolidated financial statements as at and for the year ended 31 December (a) Estimates The preparation of condensed consolidated interim financial statements requires management to make judgments, estimates and assumptions that affect the application of accounting policies and the reported amounts of assets and liabilities, income and expense. Actual results may differ from these estimates. (b) Financial risk management The Group s financial risk management objectives and policies are consistent with those disclosed in the consolidated financial statements as at and for the year ended 31 December 2012.
Q Results Presentation. 18 April 2018
 Q1 218 Results Presentation 18 April 218 2 Important Information Disclaimer The material in this presentation is general background information about the activities of Emirates NBD Bank PJSC (Emirates
Emirates NBD Announces First Half 2014 Results
 For immediate release Emirates NBD Announces First Half 2014 Results Net Profit up 30% to AED 2.35 billion Pre-impairment Operating Profit up 35% to AED 4.91 billion Dubai, 24 July 2014 Financial Highlights
Emirates NBD Announces First Quarter 2011 Results
 For immediate release Emirates NBD Announces First Quarter 2011 Results Strong Financial Performance Total Income of AED 2.3 billion; Net Profit of AED 1.4 billion Dubai, 26 April 2010 Emirates NBD (DFM:
H Results Presentation. 19 July 2017
 H1 2017 Results Presentation 19 July 2017 2 Important Information Disclaimer The material in this presentation is general background information about the activities of Emirates NBD Bank PJSC (Emirates
Q Results Presentation. 19 April 2017
 Q1 2017 Results Presentation 19 April 2017 2 Important Information Disclaimer The material in this presentation is general background information about the activities of Emirates NBD Bank PJSC (Emirates
FY 2017 Results Presentation. 16 January 2018
 FY 217 Results Presentation 16 January 218 2 Important Information Disclaimer The material in this presentation is general background information about the activities of Emirates NBD Bank PJSC (Emirates
Emirates NBD Announces First Half 2015 Results
 For immediate release Emirates NBD Announces First Half 2015 Results Net profits up 41% to AED 3.3 billion on higher income and lower provisions Total Income up 7% to AED 7.6 billion as net interest income
Top line. strong. Page 1 of 6. delivered an. 19% as the. the Bank s grew 39% boosted by business as. The Bank s repayments.
 For immediate releasee Emirates NBD Announces Third Quarter 2014 Results Top line growth powers Net Profit up 51% to AED 3.91 billion supported by strong economic growth in Dubai Pre-impairment Operating
Emirates NBD Announces First Quarter 2018 Results
 For immediate release Emirates NBD Announces First Quarter 2018 Results Net profit up 27% y-o-y and 10% q-o-q to AED 2.4 billion Dubai, 18 April 2018 Emirates NBD (DFM: EmiratesNBD), a leading bank in
Emirates NBD Announces First Half 2018 Results
 For immediate release Emirates NBD Announces First Half 2018 Results Record Half-Year as Net Profit exceeds AED 5 billion, up 29% y-o-y on higher net interest income and lower provisions Dubai, 18 July
Emirates NBD Announces Full Year 2018 Results
 For immediate release Emirates NBD Announces Full Year 2018 Results AED 10 billion Net Profit up 20% y-o-y on higher income Total assets surpass AED 500 billion Proposed dividend of 40% Dubai, 16 January
Emirates NBD FY 2011 Results Presentation. February 15, 2012
 Emirates NBD FY 20 Results Presentation February 5, 202 Important Information Disclaimer The material in this presentation is general background information about Emirates NBD's activities current at the
EMIRATES NBD BANK PJSC
 GROUP CONDENSED CONSOLIDATED INTERIM FINANCIAL STATEMENTS FOR THE SIX MONTHS PERIOD ENDED 30 JUNE 2017 GROUP CONDENSED CONSOLIDATED INTERIM FINANCIAL STATEMENTS Contents Page Independent auditor s report
EMIRATES NBD BANK PJSC
 GROUP CONDENSED CONSOLIDATED INTERIM FINANCIAL STATEMENTS FOR THE THREE MONTHS PERIOD ENDED 31 MARCH 2017 GROUP CONDENSED CONSOLIDATED INTERIM FINANCIAL STATEMENTS Contents Page Independent auditors report
EMIRATES NBD BANK PJSC
 GROUP CONDENSED CONSOLIDATED INTERIM FINANCIAL STATEMENTS FOR THE NINE MONTHS PERIOD ENDED 30 SEPTEMBER GROUP CONDENSED CONSOLIDATED INTERIM FINANCIAL STATEMENTS Contents Page Independent auditor s report
Robust Financial Performance. Operating Profit up 52% to AED 1.3 billion. Total Income of AED 5.2 billion; Net Profit of AED 1.
 For U immediate release UEmirates NBD Announces First Half 2012 Results Robust Financial Performance Operating Profit up 52% to AED 1.3 billion Total Income of AED 5.2 billion; Net Profit of AED 1.3 billion
EMIRATES NBD BANK PJSC
 GROUP CONDENSED CONSOLIDATED INTERIM FINANCIAL STATEMENTS FOR THE THREE MONTHS PERIOD ENDED 31 MARCH 2016 GROUP CONDENSED CONSOLIDATED INTERIM FINANCIAL STATEMENTS Contents Page Independent auditors report
EmiratesNBD. Q Financial Results. 26 October 2009
 EmiratesNBD Q3 2009 Financial Results 26 October 2009 Important Information Disclaimer The material in this presentation is general background information about Emirates NBD's activities current at the
Earnings Presentation Q2 12
 AbuDhabi Commercial Bank PJSC Earnings Presentation Q2 12 1 Disclaimer This document has been prepared by Abu Dhabi Commercial Bank PJSC ( ADCB ) for information purposes only. The information, statements
Emirates NBD Announces Full Year 2016 Results
 For immediate release Emirates NBD Announces Full Year 2016 Results Net profit up 2% to AED 7.24 billion Proposed dividend maintained at 40% Dubai, 16 January 2017 Emirates NBD (DFM: EmiratesNBD), the
Emirates NBD Investor Presentation. May/June 2016
 Emirates NBD Investor Presentation May/June 2016 2 Important Information Disclaimer The material in this presentation is general background information about the activities of Emirates NBD Bank PJSC (Emirates
Dubai Islamic Bank Group 1 st half 2015 Financial Results H net profit up by 35% to AED 1,801 million
 Press Release: Dubai Islamic Bank Group 1 st half Financial Results H1 net profit up by 35% to AED 1,801 million Dubai, July 29, Dubai Islamic Bank (DFM: DIB), the first Islamic bank in the world and the
2014 Full Year Results Presentation
 2014 Full Year Results Presentation 11 February 2015 Disclaimer: This material should be read as an overview of OCBC s current business activities and operating environment. It should not be solely relied
ABU DHABI COMMERCIAL BANK PJSC REPORTS NINE MONTH 2018 NET PROFIT OF AED BILLION THIRD QUARTER 2018 NET PROFIT OF AED 1.
 Abu Dhabi Commercial Bank Sheikh Zayed Street P. O. Box: 939, Abu Dhabi http://www.adcb.com ABU DHABI COMMERCIAL BANK PJSC REPORTS NINE MONTH 2018 NET PROFIT OF AED 3.483 BILLION THIRD QUARTER 2018 NET
Dubai Islamic Bank Group announces Quarter 1, 2016 Financial Results
 Press Release: Dubai Islamic Bank Group announces Quarter 1, 2016 Financial Results Q1 2016 net profit up by 18 per cent to over AED 1 billion Dubai, April 27, 2016 Dubai Islamic Bank (DFM: DIB), the first
Dubai Islamic Bank Group 1 st Half 2016 Financial Results H net profit up by 11% to over AED 2 billion
 Press Release: Dubai Islamic Bank Group 1 st Half 2016 Financial Results H1 2016 net profit up by 11% to over AED 2 billion Dubai, July 27, 2016 Dubai Islamic Bank (DFM: DIB), the first Islamic bank in
Emirates NBD Investor Presentation. Aug/Sep 2012
 Emirates NBD Investor Presentation Aug/Sep 2012 1 Important Information Disclaimer The material in this presentation is general background information about Emirates NBD's activities current at the date
Abu Dhabi Commercial Bank PJSC Earnings presentation
 Abu Dhabi Commercial Bank PJSC 2017 Earnings presentation January 2018 Disclaimer THIS PRESENTATION IS NOT AN OFFER OR SOLICITATION OF AN OFFER TO BUY OR SELL SECURITIES. IT IS SOLELY FOR USE AS AN INVESTOR
ABU DHABI COMMERCIAL BANK PJSC REPORTS NINE MONTH 2015 NET PROFIT OF AED BN, UP 18% YEAR ON YEAR
 Abu Dhabi Commercial Bank Sheikh Zayed Street P. O. Box: 939, Abu Dhabi http://www.adcb.com Press Release: Immediate Release ABU DHABI COMMERCIAL BANK PJSC REPORTS NINE MONTH 2015 NET PROFIT OF AED 3.736
Abu Dhabi Islamic Bank net profit for 2013 increases 20.7% to AED billion
 MANAGEMENT DISCUSSION & ANALYSIS FOR THE YEAR ENDING 31 DECEMBER Abu Dhabi Islamic Bank net profit for increases 20.7% to AED 1.450 billion Total assets increased 19.8% to AED 103.2 billion Group Financial
ABU DHABI COMMERCIAL BANK PJSC REPORTS NINE MONTH 2017 NET PROFIT OF AED BILLION, UP 2% YEAR ON YEAR
 Abu Dhabi Commercial Bank Sheikh Zayed Street P. O. Box: 939, Abu Dhabi http://www.adcb.com ABU DHABI COMMERCIAL BANK PJSC REPORTS NINE MONTH 2017 NET PROFIT OF AED 3.206 BILLION, UP 2% YEAR ON YEAR THIRD
A Century of History A Global Service
 A Century of History A Global Service Bank of China Limited 2012 Interim Results August 24, 2012 Forward-looking Statement Disclaimer This presentation and subsequent discussions may contain forward-looking
ABU DHABI COMMERCIAL BANK PJSC REPORTS FIRST HALF 2018 NET PROFIT OF AED BILLION, SECOND QUARTER 2018 NET PROFIT OF AED 1.
 Abu Dhabi Commercial Bank Sheikh Zayed Bin Sultan Street P. O. Box: 939, Abu Dhabi http://www.adcb.com ABU DHABI COMMERCIAL BANK PJSC REPORTS FIRST HALF 2018 NET PROFIT OF AED 2.332 BILLION, SECOND QUARTER
Abu Dhabi Commercial Bank PJSC ( ADCB or the Bank ) today reported its financial results for the year ended 31 December 2017.
 today reported its financial results for the year ended 31 December 2017.") Abu Dhabi Commercial Bank Sheikh Zayed Bin Sultan Street P. O. Box: 939, Abu Dhabi http://www.adcb.com ABU DHABI COMMERCIAL BANK PJSC REPORTS FULL YEAR NET PROFIT OF 4.278 BILLION, UP 3% YEAR ON YEAR FOURTH
Abu Dhabi Commercial Bank Sheikh Zayed Bin Sultan Street P. O. Box: 939, Abu Dhabi http://www.adcb.com ABU DHABI COMMERCIAL BANK PJSC REPORTS FULL YEAR NET PROFIT OF 4.278 BILLION, UP 3% YEAR ON YEAR FOURTH
AMMB Q1FY12 RESULTS Growth momentum continues; higher non-interest income and lower allowances
 AMMB Q1FY12 RESULTS Growth momentum continues; higher non-interest income and lower allowances ( AMMB ) continues its growth momentum with a 20% increase in Profit after Tax and Minority Interest ( PATMI
ABU DHABI COMMERCIAL BANK PJSC REPORTS FIRST HALF 2017 NET PROFIT OF AED BILLION, SECOND QUARTER 2017 NET PROFIT OF AED 1.
 Abu Dhabi Commercial Bank Sheikh Zayed Street P. O. Box: 939, Abu Dhabi http://www.adcb.com Press Release: Immediate Release ABU DHABI COMMERCIAL BANK PJSC REPORTS FIRST HALF 2017 NET PROFIT OF AED 2.114
ABU DHABI COMMERCIAL BANK PJSC REPORTS FIRST QUARTER 2015 NET PROFIT OF AED BN, AN INCREASE OF 13% YEAR ON YEAR, AND 22% QUARTER ON QUARTER
 Abu Dhabi Commercial Bank Sheikh Zayed Street P. O. Box: 939, Abu Dhabi http://www.adcb.com Press Release: Immediate Release ABU DHABI COMMERCIAL BANK PJSC REPORTS FIRST QUARTER 2015 NET PROFIT OF AED
Emirates NBD Dubai Economy Tracker
 Press Release Under strict embargo until: 08:15 (DUBAI) / 04:15 (UTC), January 10 th 2017 Emirates NBD Dubai Economy Tracker Dubai private sector experiences strong end to 2016 Dubai, January 10, 2017:
Earnings presentation Financial year 2011 results
 AbuDhabiCommercial BankPJSC Earnings presentation Financial year 2011 results 1 Disclaimer This document has been prepared by Abu Dhabi Commercial Bank PJSC ( ADCB ) for information purposes only. The
Investor Presentation. June 2018
 Investor Presentation June 2018 Contents Bank Muscat Introduction Operating environment Bank Muscat business - Overview Financial Performance Annexure Note: The financial information is updated as of 30
FIRST GULF BANK Q3/9M 13 EARNINGS PRESENTATION
 FIRST GULF BANK Q3/9M 13 EARNINGS PRESENTATION DISCLAIMER This presentation provides information in summary form only and is not intended to be complete. It is not intended to be relied upon as advice
Key Performance Highlights (H1FY11 vs H1FY10)
") Press release, 12 November 2010 AMMB delivers a strong performance, PATMI of RM 701.2 mil for H1FY11, up 40.7% HoH Higher revenues and lower allowances, and good loans and deposit growth Proposed interim
Press release, 12 November 2010 AMMB delivers a strong performance, PATMI of RM 701.2 mil for H1FY11, up 40.7% HoH Higher revenues and lower allowances, and good loans and deposit growth Proposed interim
Dubai Islamic Bank 1st Quarter 2017 Net Profit reaches AED Billion
 Press Release: Dubai Islamic Bank 1st Quarter 2017 Net Profit reaches AED 1.042 Billion Net profit up by 4% compared to same period in 2016 Financing assets up by 6% to AED 121.4 billion Deposits up by
Analysts Presentation First Half 2018 Financial Results. Dato' Khairussaleh Ramli Group Managing Director RHB Banking Group 30 August 2018
 Analysts Presentation First Half Financial Results Dato' Khairussaleh Ramli Group Managing Director RHB Banking Group 30 August Executive Summary H1 Financial Results Strategy Update Summary and Outlook
Siam Commercial Bank PCL
 Siam Commercial Bank PCL CLSA Investors Forum 2011 September 2011 1. Agenda Review of Result 2Q11 Page 3-17 2. Going Forward 19-23 IMPORTANT DISCLAIMER: Information contained in this document has been
ABU DHABI COMMERCIAL BANK PJSC REPORTS FIRST QUARTER 2018 NET PROFIT OF AED BILLION, AN INCREASE OF 13% QUARTER ON QUARTER, AND 9% YEAR ON YEAR
 Abu Dhabi Commercial Bank Sheikh Zayed Bin Sultan Street P. O. Box: 939, Abu Dhabi http://www.adcb.com ABU DHABI COMMERCIAL BANK PJSC REPORTS FIRST QUARTER 2018 NET PROFIT OF AED 1.207 BILLION, AN INCREASE
Abu Dhabi Islamic Bank net profit for 2012 increases 4.0% to AED billion after provisions of AED 802 million
 MANAGEMENT DISCUSSION & ANALYSIS FOR THE YEAR ENDING 31 DECEMBER 2012 Abu Dhabi Islamic Bank net profit for 2012 increases 4.0% to AED 1.201 billion after provisions of AED 802 million Total assets at
BRD - GROUP R E S U LT S 3 R D Q U AR T E R AN D F I R S T 9 M O N T H S N O V E M B E R
 BRD - GROUP R E S U LT S 3 R D Q U AR T E R AN D F I R S T 9 M O N T H S 2 0 1 7 0 6 N O V E M B E R 2 0 1 7 DISCLAIMER The consolidated and separate financial position and income statement for the period
EMIRATES NBD BANK PJSC
 GROUP CONDENSED CONSOLIDATED INTERIM FINANCIAL STATEMENTS FOR THE THREE MONTHS PERIOD ENDED 31 MARCH 2018 GROUP CONDENSED CONSOLIDATED INTERIM FINANCIAL STATEMENTS Contents Page Independent auditor s report
Abu Dhabi Commercial Bank PJSC Q1 15 Investor presentation
 Abu Dhabi Commercial Bank PJSC Q1 15 Investor presentation THIS PRESENTATION IS NOT AN OFFER OR SOLICITATION OF AN OFFER TO BUY OR SELL SECURITIES. IT IS SOLELY FOR USE AS AN INVESTOR PRESENTATION AND
INVESTOR PRESENTATION
 INVESTOR PRESENTATION CLSA ASEAN CORPORATE ACCESS FORUM 2013 14 th March 2013 Agenda Page 1. Review of Result 2012 3-19 2. Future Positioning 21-23 IMPORTANT DISCLAIMER: Information contained in this document
ABU DHABI COMMERCIAL BANK PJSC REPORTS FIRST QUARTER 2013 NET PROFIT OF AED 903 MN, AN INCREASE OF 5% YEAR ON YEAR* AND 44% QUARTER ON QUARTER*
 Abu Dhabi Commercial Bank PJSC Salam Street P. O. Box: 939, Abu Dhabi http://www.adcb.com Press Release: Immediate Release ABU DHABI COMMERCIAL BANK PJSC REPORTS FIRST QUARTER 2013 NET PROFIT OF AED 903
Commenting on the performance, Bill Winters, Group Chief Executive, said:
 31 October 2018 Standard Chartered PLC - Interim Management Statement Standard Chartered PLC (the Group) today releases its Interim Management Statement for the period 30 September 2018. All figures are
EMIRATES NBD BANK PJSC BASEL II PILLAR III DISCLOSURES FOR THE YEAR ENDED 31 DECEMBER 2017
 EMIRATES NBD BANK PJSC BASEL II PILLAR III DISCLOSURES FOR THE YEAR ENDED 31 DECEMBER 2017 BASEL II PILLAR III DISCLOSURES Contents Page Overview 1 Information on subsidiaries and significant investments
HSBC Holdings plc Interim Results 2012 Presentation to Investors and Analysts
 A Chinese ship in Brazil s largest port, Santos. Photography: Matthew Mawson HSBC Holdings plc Interim Results 2012 Presentation to Investors and Analysts Forward-looking statements This presentation and
Our strategic priorities an update
 Our strategic priorities an update DBS Group Holdings 2Q 2010 financial results 30 July 2010 Disclaimer: The information contained in this document is intended only for use during the presentation and
Analysts Presentation 3 rd Quarter 2017 Financial Results. Dato' Khairussaleh Ramli Group Managing Director RHB Banking Group 27 November 2017
 Analysts Presentation 3 rd Quarter Financial Results Dato' Khairussaleh Ramli Group Managing Director RHB Banking Group 27 November Executive Summary 3 rd Quarter Financial Results Strategy Update Summary
4Q17 and FY2017 Financial Results. January 19, 2018
 4Q17 and FY2017 Financial Results January 19, 2018 Forward-looking statements and use of key performance metrics and non-gaap Financial Measures This document contains forward-looking statements within
Second Quarter 2017 Results Presentation 27 July 2017
 Second Quarter 2017 Results Presentation 27 July 2017 Disclaimer: This material should be read as an overview of OCBC s current business activities and operating environment. It should not be solely relied
Delivering Growth and Excellence
 Delivering Growth and Excellence Bank of China Limited 2011 Interim Results Aug 24, 2011 Forward-looking Statement Disclaimer This presentation and subsequent discussions may contain forward-looking statements
THE HONGKONG AND SHANGHAI BANKING CORPORATION LIMITED 2012 CONSOLIDATED RESULTS HIGHLIGHTS. Pre-tax profit up 19% to HK$108,729m (HK$91,370m in 2011).
.") News Release 4 March 2013 THE HONGKONG AND SHANGHAI BANKING CORPORATION LIMITED CONSOLIDATED RESULTS HIGHLIGHTS Pre-tax profit up 19% to HK$108,729m (HK$91,370m in ). tributable profit up 23% to HK$83,008m
News Release 4 March 2013 THE HONGKONG AND SHANGHAI BANKING CORPORATION LIMITED CONSOLIDATED RESULTS HIGHLIGHTS Pre-tax profit up 19% to HK$108,729m (HK$91,370m in ). tributable profit up 23% to HK$83,008m
Investor Presentation. September 2014
 Investor Presentation September 2014 Contents I. UNB Introduction 1 II. UAE Economy and Banking Industry 3 III. UNB Business Overview 5 IV. Financial Highlights and Performance 10 V. Awards and Certifications
SIAM COMMERCIAL BANK PCL.
 SIAM COMMERCIAL BANK PCL. 1Q17 Financial Results Analyst Meeting Presentation April 21 st, 2017 IMPORTANT DISCLAIMER: Information contained in this document has been prepared from several sources and the
INVESTOR PRESENTATION
 INVESTOR PRESENTATION J.P. MORGAN THAILAND CONFERENCE 2011 Deepak Sarup, CFO 17 th March 2011 AGENDA Pages I. Review of Results 2010 3-15 II. Future Positioning 17-27 III. 2011 Targets 29 IMPORTANT DISCLAIMER:
EMIRATES NBD BANK PJSC
 GROUP CONDENSED CONSOLIDATED INTERIM FINANCIAL STATEMENTS FOR THE NINE MONTHS PERIOD ENDED 30 SEPTEMBER GROUP CONDENSED CONSOLIDATED INTERIM FINANCIAL STATEMENTS Contents Page Independent auditor s report
Grupo Financiero HSBC. Financial information at 30 September Q09. Press Release. Quarterly Report Third Quarter 2009
 Grupo Financiero HSBC Financial information at tember 3Q09 Press Release Quarterly Report Third Quarter Release date: 30 October 1 October 30, GRUPO FINANCIERO HSBC, S.A. DE C.V. THIRD QUARTER FINANCIAL
1Q19 Financial Results. April 18, 2019
 1Q19 Financial Results April 18, 2019 Forward-looking statements and use of key performance metrics and non-gaap financial measures This document contains forward-looking statements within the meaning
 Grow & diversify the economy Increase employment Strengthen Islamic values & national identity Offer a fulfilling & healthy life Enhance government effectiveness Enable social responsibility Lower the
H1FY18 RESULTS ANALYST PRESENTATION. 26 February 2018
 RESULTS ANALYST PRESENTATION 26 February 2018 1 Agenda 1 Financial Highlights: Key financial highlights Strong underlying performance led by healthy top-line, improved efficiencies & stable asset quality
ABU DHABI COMMERCIAL BANK REPORTS SECOND QUARTER 2011 NET PROFIT OF AED 1,335 MN, FIRST HALF 2011 NET PROFIT OF AED 1,918 MN
 Abu Dhabi Commercial Bank Salam Street P. O. Box: 939, Abu Dhabi http://www.adcb.com Press Release: Immediate Release ABU DHABI COMMERCIAL BANK REPORTS SECOND QUARTER 2011 NET PROFIT OF AED 1,335 MN, FIRST
First Quarter 2017 Results Presentation 09 May 2017
 First Quarter 2017 Results Presentation 09 May 2017 Disclaimer: This material should be read as an overview of OCBC s current business activities and operating environment. It should not be solely relied
Earnings at yet another record as franchise operates at higher plane April 27, 2012
 Earnings at yet another record as franchise operates at higher plane April 27, 2012 Disclaimer: The information contained in this document is intended only for use during the presentation and should not
China Merchants Bank Co., Ltd. 1H11 Results Announcement
 China Merchants Bank Co., Ltd. 1H11 Results Announcement August 31, 2011 0 Forward-Looking Statement Disclaimer This presentation and subsequent discussions may contain forward-looking statements that
Abu Dhabi Islamic Bank net profit for Q increases 10.1% to AED million
 MANAGEMENT DISCUSSION & ANALYSIS FOR THE QUARTER ENDING 31 MARCH 2015 Abu Dhabi Islamic Bank net profit for Q1 2015 increases 10.1% to AED 450.8 million Customer financing assets increased 13.3% year-on-year
FIRST QUARTER 2016 NET PROFIT OF AED BILLION
 Abu Dhabi Commercial Bank Sheikh Zayed Street P. O. Box: 939, Abu Dhabi http://www.adcb.com Press Release: Immediate Release ABU DHABI COMMERCIAL BANK PJSC REPORTS FIRST QUARTER 2016 NET PROFIT OF AED
ABU DHABI COMMERCIAL BANK PJSC REPORTS NINE MONTH 2012 NET PROFIT OF AED 2,131 MN, OPERATING INCOME OF AED 4,985 MN
 Abu Dhabi Commercial Bank Salam Street P. O. Box: 939, Abu Dhabi http://www.adcb.com Press Release: Immediate Release ABU DHABI COMMERCIAL BANK PJSC REPORTS NINE MONTH 2012 NET PROFIT OF AED 2,131 MN,
Third Quarter 2017 Results Presentation 26 October 2017
 Third Quarter 2017 Results Presentation 26 October 2017 Disclaimer: This material should be read as an overview of OCBC s current business activities and operating environment. It should not be solely
2015 Full Year Results Presentation
 2015 Full Year Results Presentation 17 February 2016 Disclaimer: This material should be read as an overview of OCBC s current business activities and operating environment. It should not be solely relied
3Q18 Quarterly Supplement
 3Q18 Quarterly Supplement October 12, 2018 2018 Wells Fargo & Company. All rights reserved. Table of contents 3Q18 Results 3Q18 Highlights Pages 2 3Q18 Earnings 3 Year-over-year results 4 Balance Sheet
THE HONGKONG AND SHANGHAI BANKING CORPORATION LIMITED 2014 INTERIM CONSOLIDATED RESULTS HIGHLIGHTS
 4 August 2014 THE HONGKONG AND SHANGHAI BANKING CORPORATION LIMITED 2014 INTERIM CONSOLIDATED RESULTS HIGHLIGHTS Profit before tax down 38% to HK$59,096m (HK$95,550m in the first half of ). Attributable
EMIRATES NBD BANK PJSC BASEL II PILLAR III DISCLOSURES FOR THE YEAR ENDED 31 DECEMBER 2016
 EMIRATES NBD BANK PJSC BASEL II PILLAR III DISCLOSURES FOR THE YEAR ENDED BASEL II PILLAR III DISCLOSURES Contents Page Overview 1 Information on subsidiaries and significant investments 4 Consolidated
Investor Presentation. Annual Accounts
 Investor Presentation Annual Accounts SEB a unique Nordic Bank Relationships Corporates Stability 2 Unique corporate franchise Truly embedded corporate bank Mergers & Acquisitions Foreign Exchange Trade
FGB reports net profit of AED 2.87 Billion in the first half of 2015, up by 7%
 Press Release FGB reports net profit of AED 2.87 Billion in the first half of 2015, up by 7% FGB achieved a H1 2015 Group Net Profit of AED 2.87 Billion, up 7% from H1 2014. Second quarter net profit up
ANNOUNCEMENT OF 2011 INTERIM RESULTS
 Hong Kong Exchanges and Clearing Limited and The Stock Exchange of Hong Kong Limited take no responsibility for the contents of this announcement, make no representation as to its accuracy or completeness
United Overseas Bank Investor Roadshow November 2006
 United Overseas Bank Investor Roadshow November 2006 Disclaimer : This material that follows is a presentation of general background information about the Bank s activities current at the date of the presentation.
HSBC Bank plc Annual Repor t and A ccounts 20 Additional Information 2013
 HSBC Bank plc Additional Information 2013 Additional Information Presentation of Information This document, which should be read in conjunction with the HSBC Bank plc Annual Report and Accounts 2013, contains
EMIRATES NBD PJSC GROUP CONSOLIDATED FINANCIAL STATEMENTS FOR THE YEAR ENDED 31 DECEMBER 2013
 EMIRATES NBD PJSC GROUP CONSOLIDATED FINANCIAL STATEMENTS FOR THE YEAR ENDED 31 DECEMBER EMIRATES NBD PJSC GROUP CONSOLIDATED FINANCIAL STATEMENTS Contents Page Independent auditors report on the Group
Investor presentation
 FY17 INVESTOR PRESENTATION 1 18 August 2017 Investor presentation FY17 Agenda FY17 INVESTOR PRESENTATION 1. Overview & strategic landscape Melos Sulicich CEO & Managing Director 2. Financial results David
Dubai Islamic Bank Group 1 st Quarter 2015 Financial Results Q net profit up by 34 per cent to AED 850 million
 Press Release: Dubai Islamic Bank Group 1 st Quarter 2015 Financial Results Q1 2015 net profit up by 34 per cent to AED 850 million Dubai, April15, 2015 Dubai Islamic Bank (DFM: DIB), the first Islamic
Lloyds TSB Group plc. Results for half-year to 30 June 2005
 Lloyds TSB Group plc Results for half-year to 30 June 2005 PRESENTATION OF RESULTS Up to 31 December 2004 the Group prepared its financial statements in accordance with UK Generally Accepted Accounting
3Q17 Financial Results. October 20, 2017
 3Q17 Financial Results October 20, 2017 Forward-looking statements and use of key performance metrics and Non-GAAP financial measures This document contains forward-looking statements within the Private
GROUP CONDENSED CONSOLIDATED INTERIM FINANCIAL STATEMENTS (UNAUDITED)
") In the Name of Allah The most Gracious and Merciful Emirates Islamic Bank (Public Joint Stock Company) Head Office 3rd Floor, Building 16, Dubai Health Care City, Dubai Tel.: +971 600599995 Fax: +971 4
In the Name of Allah The most Gracious and Merciful Emirates Islamic Bank (Public Joint Stock Company) Head Office 3rd Floor, Building 16, Dubai Health Care City, Dubai Tel.: +971 600599995 Fax: +971 4
RAKBANK Investor Relations Presentation Q The National Bank of Ras Al-Khaimah (P.S.C)
") Investor Relations Presentation Q1 2014 The National Bank of Ras Al-Khaimah (P.S.C) Snapshot of Ras Al Khaimah Situated less than one hour from Dubai, Ras Al Khaimah is the fourth largest of the seven
Investor Relations Presentation Q1 2014 The National Bank of Ras Al-Khaimah (P.S.C) Snapshot of Ras Al Khaimah Situated less than one hour from Dubai, Ras Al Khaimah is the fourth largest of the seven
First Quarter 2018 Interim Report
 First Quarter 2018 Interim Report Highlights For the quarter ended 31 March 2018 compared with the same period in the prior year. Strong growth in operating income of $35m, or 6.9%, from $506m to $541m.
QNB Investor Relations Presentation June 2011
 QNB Investor Relations Presentation June 211 Forward Looking Statement This presentation and subsequent discussion may contain certain forward-looking statements with respect to the financial condition,
ING Bank Śląski S.A. 3Q 2011 Financial Results ING BANK ŚLĄSKI. Warsaw 3 November
 ING Bank Śląski S.A. Warsaw 3 November 2011 www.ingbank.pl ING BANK ŚLĄSKI Disclaimer ING Bank Śląski S.A. Annual Accounts are prepared in accordance with International Financial Reporting Standards as
ICICI Group: Performance & Strategy. November 2015
 ICICI Group: Performance & Strategy November 2015 Certain statements in these slides are forward-looking statements. These statements are based on management's current expectations and are subject to uncertainty
ICICI Group: Strategy & Performance
 ICICI Group: Strategy & Performance Agenda India: macroeconomic scenario Indian banking sector ICICI Group 2 Growth indicators Strong long term growth fundamentals Key drivers of growth Favourable demographics
THE HONGKONG AND SHANGHAI BANKING CORPORATION LIMITED 2014 CONSOLIDATED RESULTS HIGHLIGHTS
 23 February 2015 THE HONGKONG AND SHANGHAI BANKING CORPORATION LIMITED CONSOLIDATED RESULTS HIGHLIGHTS Pre-tax profit HK$111,189m (HK$144,756m in ) tributable profit HK$86,428m (HK$119,009m in ) Return
Royal Bank of Canada Second Quarter Results May 24, 2018
 Royal Bank of Canada Second Quarter Results May 24, 2018 All amounts are in Canadian dollars unless otherwise indicated and are based on financial statements prepared in compliance with International Accounting