2016 First Half Results Ended 30 th June CONFERENCE CALL Cesena,30 th August 2016
|
|
|
- Bartholomew Barrett
- 5 years ago
- Views:
Transcription

1 2016 First Half Results Ended 30 th June 2016 CONFERENCE CALL Cesena,30 th August 2016
2 1. TREVI Group 2. 1H 2016 Financial Results 3. Q&A 4. Appendix 2

3 Special foundation services Oil drilling rigs 278,1m 92,2m 1H16 Revenues Special foundation rigs Oil drilling services 124,5m 50,6m 3


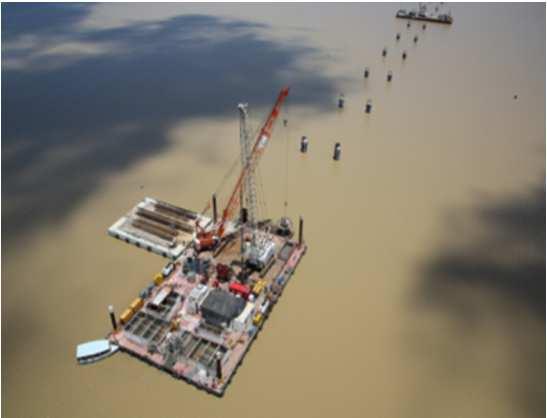

4 Special foundation services 278,1m 1H16 Revenues Geotechnical Works Environment Marine Works Deep Foundations Tunnel Consolidation 4


5 Special foundation rigs 124,5 mln 1H16 Revenues 5


6 Oil drilling rigs Land Rigs 92,2m 1H16 Revenues Hydraulic Drilling Rigs Mud Pumps Modular Offshore AHEAD Rigs Drawworks Conventional Packages Top Drives 6

7 ARGENTINA: PERU : 7 RIGS HH102 2 RIGS HH102 2 RIGS HH220 1 RIG HH220 CILE: VENEZUELA: 1 RIG HH200 1 RIG HH300 1 RIG HH102 1 WO HH102 COLOMBIA: 1 RIGS HH200 Oil drilling services 50,6m 1H16 Revenues 7


8 Foundations Sector 8


9 Oil & Gas Sector 9
10 Group s Divisions Overlook Strong cash generation Very strong order intake in the first half; Trevi Division hard backlog represents 77% of total; it increased to 829 million Euros from 585 (first half 2015); The quality of hard backlog is represented by higher than in recent past implicit margins; Good level of operating margins are expected to be achieved in 2H16; Positive trends in international construction markets and in particular in infrastructure sector; 8,6% HoH increase in revenue, Strong improvement in margins, due to better market conditions and higher efficiency in production and commercial process; Positive feedback from international clients in Bauma Exhibition, the largest event in the Industry; High Technology new line of products introduced at the Bauma Exhibition are expected to generate increased volume of sales and margins; Investment in HIT products is securing new markets segments and major opportunities; 10
11 Group s Divisions Overlook Continued strong volatility and uncertainty in O&G. Price per barrel of petrol (Brent) increased to more than 50 dollars from the minimum of 28 touched in January (plus 79% in 8 months); Negotiations in progress for supply of rigs in different geographic area expected to be concluded in second half; HoH 39% decrease in revenues due to market conditions; Drillmec is waging on a reorganization plan and cost cutting, started in October 2015, which will bring major results in second half; Management is focused in improving services and is offering to clients maintenance, training and engineering through medium terms contracts to improve profitability of operating drilling rigs; Planned investments in R&D for increasing operation efficiency and controls (DMS remote, Shale Oil design); Management is focused on working capital decrease through better management of credits Struggling with decreased rig utilization rate Marginality challenged by more uncertain environment Negotiating contracts renewals to secure continuing operations 11
12 1. TREVI Group 2. 1H 2016 Financial Results 3. Q&A 4. Appendix 12
13 Financial Highlights Revenues 519m Ebitda 62m Ebit 26m Net Result -24m Backlog 1.074m Net Financial Position 396m 13
14 Financial Highlights 1H16 yoy 1H16 % 1H15 % Euro VALUE OF PRODUCTION 557,9 627,5 REVENUES 519,3 100,0% 601,1 100,0% EBITDA 62,3 12,0% (48,8) -8,1% EBIT 25,6 4,9% (104,5) -17,4% FINANCIAL COSTS (14,1) -2,7% (13,0) -2,2% TAXES 15,3 3,0% 4,8 0,8% NET PROFIT (23,6) -4,5% (128,1) -21,3% Euro 1H16 1H15 NET CAPITAL EMPLOYED 930, ,5 EQUITY 534,3 558,0 NET FINANCIAL POSITION 396,3 464,2 BACKLOG 1.074, ,7 1H16 1H15 NFP / EBITDA 3,3X n/a NFP / EQUITY 0,74X 0,83X 1H16 1H15 EMPLOYEES
15 Revenues Before and After Consolidation Euro mln 1H16 1H15 % Drilling Rigs (DRILLMEC) 92,2 152,3-39,4% Drilling Services (PETREVEN) 50,6 71,3-29,0% Interdivisional Adjustments and Eliminations (0,7) (1,0) Sub-Total Oil & Gas Sector 142,1 222,5-36,1% Special Foundation Services (TREVI) 278,1 283,8-2,0% Machines for Special Foundations (SOILMEC) 124,5 114,7 8,6% Interdivisional Adjustments and Eliminations (10,5) (8,3) Sub-Total Foundation Sector 392,1 390,2 0,5% Parent Company 13,4 13,2 Interdivisional Eliminations (28,4) (24,8) TOTAL CONSOLIDATED REVENUES 519,3 601,1-13,6% 15


16 One Group Revenues 519,3 m 16


17 Eur mln Financial Ratios 17


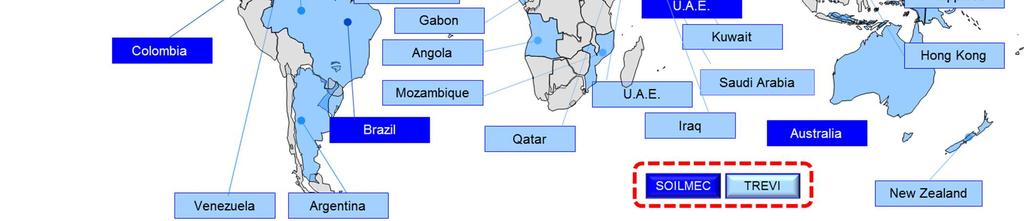
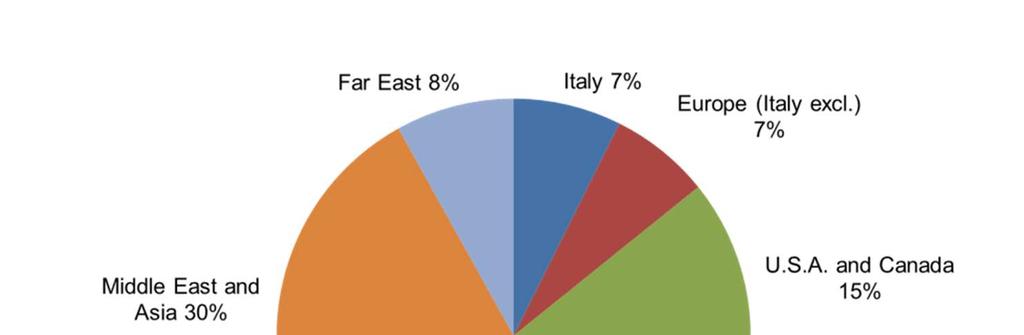
18 Breakdown per Geographical Area The Group 18


19 Backlog The Group Foundation Sector Oil & Gas Sector 19


20 Net Financial Position 20
 (*)")


21 Equity and Net Financial Position Euro mln (*) (*) Short Term Debt Long Term Debt *Includes net increase in capital of 192,9m EQUITY NET FINANCIAL POSITION 21


22 Foundations Sector The Group 390,2 392,1 Based on non Consolidated Data 22


23 Oil & Gas Sector 222,5 142,1 Based on non Consolidated Data 23
 The award follows an international tender issued in October 2015,")

24 MOSUL DAM 273 million contract value Contract assigned by: Iraqi Ministry of Water Resources (MWR) The award follows an international tender issued in October 2015, which followed an expedited process Technologies: Advanced and customized drilling and cement grouting activities for the consolidation of the foundations of the dam. 24


25 MOSUL DAM Other activities include: repair and maintenance of the bottom outlet tunnels will also take place as they are currently damaged Specialized courses and training for technicians and local staff for the use of Soilmec (TREVI Group) drilling rigs will also commence The presence of the Italian military forces, will ensure the safety of the more than 450 technicians and staff of TREVI 25


26 Galata, Cruise Terminal, Istanbul 26


27 Downtown Doha Project Doha - Mesheireb 27


28 Ras Abu Fontas A3 Reverse Osmosis Project Doha 28
")
29 Brookfield Project, Dubai (Norman Foster) 29

30 Metro Algeri 30


31 Riachuelo Project Argentina 31


32 Commissioning for Mosul dam Project Soilmec Italy 32


33 Orogel - SR-120 Soilmec Italy 33


34 SR-45 Soilmec UK 34


35 Bauma


36 Bauma


37 First well for SOCAR P32 The Drillmec HH300 rig has completed the works on the construction of the first well on platform. All works have been completed ahead of schedule. 37


38 ORDERS IN THE OIL & GAS SECTOR TOTALING ABOUT 197 MILLION EURO Five 2000hp AC rigs and two 3000HP rigs with ENAFOR, an Algerian leading drilling services company and acting on behalf of SONATRACH, the national oil company and largest African operator. Two rigs of 2000hp AC HSL (Hydraulic Swing Lift) with one of the largest drilling contractors operating in Saudi Arabia. The Saudi company has operated for more than 50 years in the industry and has an important role in the expansion program of Saudi Aramco, the leading oil company in the country and world leader in proven reserves. 38


39 Drilling activities in the Andes (Geothermal) On November 1 st 2015 the drilling rig of Drillmec H-202 Extreme started drilling activities at the Cerro Pabellon well at 4,550 meters above the sea level. 39
40 1. TREVI Group 2. 1H 2016 Financial Results 3. Q&A 4. Appendix 40
41 Income Statement 1H16 vs 1H15 Eur 000 1H16 1H15 TOTAL REVENUES Changes in inventories of finished and semi-finished products Increase in fixed assets for internal use Other non-ordinary operating revenues 0 0 VALUE OF PRODUCTION Raw materials and external services Other operating costs VALUE ADDED Personnel expenses EBITDA (48.760) % Total Revenues 12,0% -8,1% Depreciation Provisions and write-downs EBIT ( ) % Total Revenues 4,9% -17,4% Financial revenues/(expenses) (14.096) (12.954) Gains/(Losses) on exchange rates (17.165) (7.006) Other Gains/(Losses) (303) 0 EBT (6.012) ( ) Tax Minorities (1.178) GROUP NET PROFIT (23.576) ( ) 41
42 Statement of Financial Position 1H16 vs 1H15 FY15 Eur 000 1H16 1H15 Fixed assets Tangible fixed assets Intangible fixed assets Financial fixed assets Net working capital Inventories Trade receivables ( ) - Trade payables (-) ( ) ( ) ( ) - Pre-payments (-) ( ) ( ) Other assets (liabilities) Fixed assets plus net working capital (21.225) Post-employment benefits (-) (19.708) (21.543) NET INVESTED CAPITAL Financed by: Group net shareholders' funds Minorities' share of net shareholders' funds Total financial indebtedness TOTAL SOURCES OF FINANCING
43 1. TREVI Group 2. 1H 2016 Financial Results 3. Q&A 4. Appendix 43
44 Company Facts The Group Ownership*: 51% Market: 49% 172 Dams worldwide Established: 1957 Listed: 1999 Value Proposition: Fully integrated Special Foundation Services and Oil & Gas Company *Includes FSI 1st Oil & Gas Rig manufacturer in Europe >50 Metros in world 6 Main projects US Army Corps >62 Marine Projects in the world 44
45 The Group 52 Companies 38 Countries 69 Business Units Divisions: Special Foundations Oil & Gas Synergies Innovation Advantage FY 2015 Results Revenues 1,342m Ebitda 9m Ebit -88m NFP 420m FY 2015 KPI Added Value 273m Backlog 949,4m Employees 7,867 FY

46 Track Record of Growth and Excellence Revenues 46
47 Disclaimer The Executive in charge of the preparation of accounting documents Daniele Forti declares, pursuant to paragraph 2 of article 154-bis of the consolidated law on finance, that the accounting information contained in this presentation corresponds to the document results, books and accounting records. This presentation, prepared by TREVI Finanziaria Industriale SpA, contains forward looking information and statements about the group and in no case may it be interpreted as an offer or an invitation to sell or purchase any security issued by the company or its subsidiaries. These statements include financial projections and estimates and their underlying assumptions, statements regarding plans, objectives and expectations to future operations, products and services, and statements regarding future performance. Forward looking statements involve inherent risks and uncertainties are current only at the date they are made. However, the management of TREVI Finanziaria Industriale SpA believes that the expectations are reasonable, but, at the same time, points out to holders and investors that all the information and all the statements are subject to various risk and many of which are very difficult to predict and to control. TREVI Finanziaria Industriale SpA does not undertake any obligation to update forward looking statements to reflect any changes in own expectations with regard thereto or any changes in events. 47

48 Investor Relations Team:
2016 Full Year Results Ended 31th December CONFERENCE CALL Cesena,13th April 2017
 2016 Full Year Results Ended 31th December 2016 CONFERENCE CALL Cesena,13th April 2017 1. TREVI Group 2. FY 2016 Financial Results 3. Q&A 4. Appendix 2 Special foundation services Oil drilling rigs 612,0m
2015 Full Year Results. Ended 31 st December 2015 CONFERENCE CALL. Cesena 24 March Financial Results
 2015 Full Year Results Ended 31 st December 2015 CONFERENCE CALL Cesena 24 March 2015 Financial Results 1. TREVI Group 2. FY 2015 Financial Results 3. Appendix 4. Q&A 2 Special foundation services Oil
2013 Annual Results. Ended 31 st December 2013 CONFERENCE CALL. Cesena 25 th March Financial Results
 2013 Annual Results Ended 31 st December 2013 CONFERENCE CALL Cesena 25 th March 2014 Financial Results 1. TREVI Group 2. FY 2013 Financial Results 3. Appendix 4. Q&A (ITALY) World Record at 250 meters
Financial Results CONFERENCE CALL Third Quarter Results. Cesena 14 th November2014. Ended 30 th September 2014
 Financial Results 2014 Third Quarter Results Ended 30 th September 2014 CONFERENCE CALL Cesena 14 th November2014 1. TREVI Group 2. 9M 2014 Financial Results 3. Q&A 4. Appendix Rome (ITALY) Metro Line
Simone Trevisani. CEO of Drillmec
 Simone Trevisani CEO of Drillmec Who we are?... 2 The Group FOUNDATION ENGINEERING OIL&GAS GROUP SYNERGIES Special foundation services Oil drilling rigs CONSTANT INNOVATION Special foundation rigs OUR
RESULTS ENDED 30 JUNE 2013
 RESULTS ENDED 30 JUNE 2013 STRONG INCREASE IN TOTAL REVENUES AND MARGINS Consolidated key financial and economic data 1H13 Value of Production 678m Revenues 663m EBITDA 76m EBIT 43m Net Financial Position
GOOD OPERATING MARGINS AND CASH GENERATION IN FIRST HALF 2016 RESULTS
 GOOD OPERATING MARGINS AND CASH GENERATION IN FIRST HALF 2016 RESULTS Cesena, 29 August 2016 The Board of Directors of TREVI - Finanziaria Industriale S.p.A., the holding company of the TREVI Group, one
MANDATE TO THE CRO TO DEFINE THE TERMS OF THE EXCLUSIVE NEGOTIATION WITH BAIN CAPITAL CREDIT FOR POSSIBLE DEBT RESTRUCTURING
 MANDATE TO THE CRO TO DEFINE THE TERMS OF THE EXCLUSIVE NEGOTIATION WITH BAIN CAPITAL CREDIT FOR POSSIBLE DEBT RESTRUCTURING DISCUSSIONS WITH THE BANKING NETWORK FOR A STANDSTILL AGREEMENT AND A FINANCIAL
RESULTS ENDED 30 SEPTEMBER 2014
 RESULTS ENDED 30 SEPTEMBER 2014 INCREASE IN BACKLOG AND NET INCOME Consolidated key financial and economic data 3Q14 Revenues 274m EBITDA 32m EBIT 17m Net Profit 9m Consolidated key financial and economic
Trevi Group Italy Capital goods
 30 August 2013 Trevi Group Italy Capital goods Buy (Hold) Target price EUR6.90 Current price EUR6.22 Matteo Bonizzoni, CFA mbonizzoni@keplercheuvreux.com +39 02 80 62 83 43 Sound delivery and business
The name of the Issuer is TREVI : Finanziaria Industriale S.p.A. and it has been constituted as a joint: stock company.
 Document prepared on 16 th June 2014 1 CONTENTS 1. ISSUER INFORMATION... 3 1.1. Name, Place and Registration Number of the Issuer... 3 1.2. Date the Issuer was constituted and its duration... 3 1.3. Registered
Trevi Finanziaria. Growth driven by Middle East and US. 12 October 2007 Industrials Change in Estimates. Price: Target price: 16.
 12 October 2007 Industrials Change in Estimates Price: 14.53 Target price: 16.40 Outperform 15 14 13 12 12/10/07 2005 2006 EPS Adj. ( ) 0.20 0.42 0.66 0.87 1.05 DPS ( ) 0.03 0.05 0.08 0.11 0.14 BVPS (
Outlook 2014 & 2013 Annual Results. Mini Bond. Presentation to the Financial Community. Milan 10th July 2014
 Outlook 2014 & 2013 Annual Results Mini Bond Presentation to the Financial Community Milan 10th July 2014 1. TREVI Group 2. FY13 & 1Q14 Financial Results 3. Foundation Engineering 4. Oil & Gas Focus 5.
Trevi Finanziaria. New investments to meet material intake. 12 May 2008 Capital Goods Update. Price: Target price: 16.
 12 May 2008 Capital Goods Update Price: 16.44 Target price: 16.80 Outperform 17 16 15 14 13 12/5/08 2006 2007 2008E 2009E EPS Adj. ( ) 0.42 0.83 0.99 1.28 DPS ( ) 0.05 0.10 0.13 0.16 BVPS ( ) 1.91 2.23
INFORMATION REQUIRED BY CONSOB PURSUANT TO ART.114 OF THE LEGISLATIVE DECREE No.58/98
 INFORMATION REQUIRED BY CONSOB PURSUANT TO ART.114 OF THE LEGISLATIVE DECREE No.58/98 Cesena, December 31, 2018 Trevi Finanziaria Industriale S.p.A. (the "Company"), as requested by Consob on December
Trevi Finanziaria. Debt worries seem excessive. 19 February 2009 Capital Goods Change in Estimates. Price: 5.07 Target price: 6.
 19 February 2009 Capital Goods Change in Estimates Price: 5.07 Target price: 6.90 Outperform 18 16 14 12 19/2/09 EPS Adj. ( ) 0.83 1.06 1.06 1.24 DPS ( ) 0.10 0.10 0.10 0.13 BVPS ( ) 2.23 3.19 4.14 5.28
POSTPONEMENT OF THE APPROVAL OF THE INTERIM REPORT AT SEPTEMBER 30, 2017 AND THE ANNUAL FINANCIAL REPORT AT DECEMBER 31, 2017.
 POSTPONEMENT OF THE APPROVAL OF THE INTERIM REPORT AT SEPTEMBER 30, 2017 AND THE ANNUAL FINANCIAL REPORT AT DECEMBER 31, 2017. INFORMATION REQUIRED BY CONSOB PURSUANT TO ART.114 OF THE LEGISLATIVE DECREE
TREVI- Finanziaria Industriale S.p.A.
 TREVI- Finanziaria Industriale S.p.A. Consolidated Quarterly Report First Quarter 2001 TREVI Finanziaria Industriale S.p.A. Headquarters (FC) - Via Larga 201 - Share Capital 32.000.000.000 fully paid-up
Annual Report and Accounts at 31 December 2014
 Annual Report and Accounts at 31 December 2014 TREVI Finanziaria Industriale S.p.A. Annual Report and Accounts at 31 December 2014 TREVI Finanziaria Industriale S.p.A. Registered Office Cesena (Forlì-Cesena)
Consolidated financial results 2014
 PRESS RELEASE Consolidated financial results 2014 The Board of Directors has approved the Consolidated Financial Statement at December 31st, 2014. Consolidated income statement data: o Total revenues of
H Financial Results
 Milan August 1 st, 2013 1 AGENDA H1 2013 Highlights & FY 2013 Outlook Financial Results Appendix 2 H1 2013 Key Financials Euro Millions, % on Sales Sales Adjusted EBITDA (3) Adjusted EBIT (4) -1.8% * 7,973
Saipem: Board of Directors approves six-month report at June 30, 2011 H1 PROFITS AT RECORD LEVELS
 Saipem: Board of Directors approves six-month report at June 30, H1 PROFITS AT RECORD LEVELS Net profit for the second quarter of amounted to Euro 225 million, a 13.6% increase compared to the second quarter
Saipem: Board of Directors approves Interim Report as at March 31, 2011 IMPROVED RESULTS VERSUS Q1 2010
 Interim Report at March 31, 2011 Saipem: Board of Directors approves Interim Report as at March 31, 2011 IMPROVED RESULTS VERSUS Revenues amounted to Euro 2,954 million: +11.9% compared to the first quarter.
FY 2017 CONSOLIDATED RESULTS
 Gruppo FY 2017 CONSOLIDATED RESULTS Conference Call Contents Financial highlights Ascopiave Group structure as of 31st December 2017 FY 2017 consolidated income statement Consolidated balance sheet as
TREVI - Finanziaria Industriale S.p.A. Half-year Condensed Consolidated Financial Statements at 30 June 2015
 TREVI - Finanziaria Industriale S.p.A. Half-year Condensed Consolidated Financial Statements at 30 June 2015 TREVI Finanziaria Industriale S.p.A. Registered Office Cesena (Forlì-Cesena) Via Larga 201 Italy
Borsa Italiana. Paolo Rocca Chairman and CEO
 Paolo Rocca Chairman and CEO Disclaimer This presentation contains forward-looking statements. Forward-looking statements are based on management s current views and assumptions and involve known and unknown
1stQ 2018 CONSOLIDATED RESULTS
 Gruppo 1stQ 2018 CONSOLIDATED RESULTS Conference Call Contents Financial highlights Ascopiave Group structure as of 31st march 2018 1stQ 2018 consolidated income statement Consolidated balance sheet as
Presentation at Swedbank s Nordic Energy Summit - 20 March Atle Sæbø EVP & CFO
 Presentation at Swedbank s Nordic Energy Summit - 20 March 2014 Atle Sæbø EVP & CFO Our people Our assets Our clients ~3,100 employees worldwide Modern and high capability assets Long term relationships
Helmerich & Payne, Inc. Capital One Securities, Inc Energy Conference December 7, 2016
 Helmerich & Payne, Inc. Capital One Securities, Inc. 2016 Energy Conference December 7, 2016 Statements within this presentation are forward-looking statements within the meaning of the Securities Act
Date of issue: 13 Giugno Maria Mingari. Analyst: President of the Rating Committee: Cristina Zuddas. Cerved Rating Agency S.p.a.u.s.
 Date of issue: 13 Giugno 214 Analyst: President of the Rating Committee: Maria Mingari Cristina Zuddas Cerved Rating Agency S.p.a.u.s. Trevi Finanziaria Industriale S.p.A. Società Per Azioni Via Larga,
PRESS RELEASE SAIPEM: Board of Directors approves Interim Report as at March 31, 2013, results in line with expectations.
 PRESS RELEASE SAIPEM: Board of Directors approves Interim Report as at March 31, 2013, results in line with expectations. Confirmation of results guidance 2013 released on January 29, 2013. Despite uncertainty
Annual Report and Accounts at 31 December 2016
 Annual Report and Accounts at 31 December 2016 TREVI Finanziaria Industriale S.p.A. Annual Report and Accounts at 31 December 2016 TREVI Finanziaria Industriale S.p.A. Registered Office Cesena (Forlì-Cesena)
Another Order in Drilling Machines.
 Trevi Group 4.7.26 Another Order in Drilling Machines. Trevi Group announced that EDRA signed a contract with NIOC for the production of four full-packaged drilling systems, which should generate USD 93.5M
April 2015 A LEADING TECH COMPANY
 April 2015 A LEADING TECH COMPANY This presentation has been produced by Indra for the sole purpose expressed therein. Therefore, neither this presentation nor any of the information contained herein constitutes
RESULTS 9M12. MADRID, 14 NOVEMBER
 RESULTS MADRID, 14 NOVEMBER 2012 www.indra.es CONTENTS 1. Introduction - 3 2. Main Figures - 6 3. Analysis of Revenues and Commercial Activity - 7 3.1. Analysis by Segment - 8 3.2. Analysis by Vertical
Trevi Group. Hold (None) Slow recovery priced in. keplercheuvreux.com
 Slow recovery priced in. keplercheuvreux.com") 06 August 2013 Trevi Group Italy Capital goods Hold (None) Target price EUR 6.50 Current price EUR 6.36 Matteo Bonizzoni, CFA mbonizzoni@keplercheuvreux.com +39 02 80 62 83 43 Slow recovery priced in Very
06 August 2013 Trevi Group Italy Capital goods Hold (None) Target price EUR 6.50 Current price EUR 6.36 Matteo Bonizzoni, CFA mbonizzoni@keplercheuvreux.com +39 02 80 62 83 43 Slow recovery priced in Very
FY 2017 FINANCIAL RESULTS. Milan February 27 th, 2018
 FY 2017 FINANCIAL RESULTS Milan February 27 th, 2018 1 AGENDA FY 2017 Highlights o o Group overview Results by business Financial results Appendix 2 Key Achievements of 2017 General Cable Acquisition Leadership
BORSA ITALIANA - STAR segment PRESS RELEASE. INTERIM REPORT AS AT SEPTEMBER 30 th 2017 (in brackets results as at 30/09/2016)
") BORSA ITALIANA - STAR segment PRESS RELEASE INTERIM REPORT AS AT SEPTEMBER 30 th 2017 (in brackets results as at 30/09/2016) GROWTH CONTINUES FOR THE GROUP NET PROFIT MORE THAN DOUBLED FURTHER STRONG PROGRESS
BORSA ITALIANA - STAR segment PRESS RELEASE INTERIM REPORT AS AT SEPTEMBER 30 th 2017 (in brackets results as at 30/09/2016) GROWTH CONTINUES FOR THE GROUP NET PROFIT MORE THAN DOUBLED FURTHER STRONG PROGRESS
FY 2016 Financial Results. Milan March 1st 2017
 FY 2016 Financial Results Milan March 1st 2017 Agenda FY 2016 Highlights o o Group overview Results by business Financial results Appendix FY 2016 Financial Results 2 FY 2016 Highlights Adj. EBITDA at
Annual Report and Accounts at 31 December 2012
 Annual Report and Accounts at 31 December 2012 TREVI Finanziaria Industriale S.p.A. Annual Report and Consolidated Annual Report 31 December 2012 TREVI Finanziaria Industriale S.p.A. Registered Office
Integrated Solutions Provider
 Stringing Energy Automation Railway Trencher Integrated Solutions Provider 2017 Results Presentation 1 st March 2018 www.tesmec.com Index Corporate Strategy 2017 Results 2018 Outlook 1 st March 2018 2
2017 FY Consolidated Results
 2017 FY Consolidated Results March 12, 2018 2017 FY Consolidated Results / 1 2017: Strong performance delivery Results Ahead of Targets Succesful M&A activities Solid and Efficient Financial & Debt Structure
Q Financial Results. Milan May 10th, 2016
 Q1 2016 Financial Results Milan May 10th, 2016 Agenda Q1 2016 Highlights o o o Group overview Results by business Outlook Financial results Appendix Q1 2016 Financial Results 2 Q1 2016 Highlights Organic
Magseis ASA Q th August Expanding operational footprint
 Magseis ASA Q2 2018 16 th August 2018 Expanding operational footprint Disclaimer This presentation (the Presentation") has been prepared by Magseis ASA (the Company or Magseis ). The Presentation contains
THE BOARD OF DIRECTORS APPROVES INTERIM CONSOLIDATED REPORT AT 31 MARCH 2017
 Milan, April 28 th 2017 THE BOARD OF DIRECTORS APPROVES INTERIM CONSOLIDATED REPORT AT 31 MARCH 2017 Order backlog at EUR 6,454.0 million (+0.6%); New Orders acquired in the period at EUR 266.1 million
H Financial Results. Milan July 28th, 2016
 H1 2016 Financial Results Milan July 28th, 2016 Agenda H1 2016 Highlights o o o Group overview Results by business Outlook Financial results Appendix H1 2016 Financial Results 2 H1 2016 Highlights Organic
ASTALDI, NET PROFIT INCREASED BY 16.7% TO EURO 10.2 MLN ORDER BACKLOG OUTREACHES EURO 8.5 BLN
 ASTALDI, NET PROFIT INCREASED BY 16.7% TO EURO 10.2 MLN ORDER BACKLOG OUTREACHES EURO 8.5 BLN Main consolidated data as at March 31, 2008 Total revenues scored Euro 334.1 million, +26.4% on an annual basis
Saipem: First Quarter 2016 results, confirmation of guidance for 2016
 Interim Report at March 31, 2016 Approved by the Board of Directors on April 27, 2016 Saipem: First Quarter 2016 results, confirmation of guidance for 2016 San Donato Milanese, April 27, 2016 - The Board
HMS Group announces management statement and financial highlights for FY 2017
 HMS Group announces management statement and financial highlights for FY 2017, Russia HMS Group Plc (the Group ) (LSE: HMSG), the leading pump, oil & gas equipment and compressor manufacturer and provider
BAUER Aktiengesellschaft
 BAUER Aktiengesellschaft Group Presentation First Quarter 2012 In-house exhibition in Schrobenhausen, Germany Key Figures FY 2011 1,600 Total Group revenues (in EUR million) 1,527 1,276 1,304 1,372 120
Trevi Finanziaria. Waiting for the big order. 21 November 2006 Industrials Change in Estimates. Price: 8.02 Target price: 10.
 21 November 2006 Industrials Change in Estimates Price: 8.02 Target price: 10.85 Outperform 8.50 8.00 7.50 7.00 6.50 21/11/06 2003 2004 2005 2006E 2007E EPS Adj. ( ) 0.04 0.04 0.20 0.38 0.65 DPS ( ) 0.02
H FINANCIAL RESULTS. Milan September 18 th, 2018
 H1 2018 FINANCIAL RESULTS Milan September 18 th, 2018 1 AGENDA H1 2018 Highlights o o o Group overview Results by business Outlook Financial results Appendix 2 H1 2018 Financial Highlights Organic sales
THE BOARD APPROVES THE RESULTS AT 30 SEPTEMBER 2012
 A Milan, 29 October 2012 THE BOARD APPROVES THE RESULTS AT 30 SEPTEMBER 2012 Revenues of EUR 873.5 million (+3.8%) EBIT at EUR 77.6 million (+0.6%) Profit for the period at EUR 45.6 million (-6.6%) New
PRESS RELEASE. The Board of Directors approves the Consolidated Interim Financial Report for the first half of 2016.
 PRESS RELEASE B&C Speakers S.p.A. The Board of Directors approves the Consolidated Interim Financial Report for the first half of 2016. Consolidated revenues of Euro 18.67 million (+0.9% compared with
BAUER AG. Group Presentation Full year BAUER AG, D Schrobenhausen IR-Presentation_FY_2015
 BAUER AG Group Presentation Full year 2015 Key Figures FY 2015 FY 2014* in EUR million FY 2015 in EUR million FY in % Total Group revenues, of which - Germany - International - Construction - Equipment
Saipem: results for the third quarter and the first nine months of 2017
 Saipem: results for the third quarter and the first nine of San Donato Milanese, October 24, - The Board of Directors of Saipem S.p.A., chaired by Paolo Andrea Colombo, yesterday approved the Saipem Group
Tesmec Group Results. Analyst Presentation, 14 March Corporate
 Tesmec Group Results Analyst Presentation, 14 March 2013 Corporate Agenda Business update A.Caccia Dominioni, CEO & Paolo Mosconi, GM Economics Results A.Bramani, CFO - Financial Results A.Bramani, CFO
Sandvik. Good progress towards a more efficient Sandvik. Interim report on fourth quarter Sandvik fourth quarter 2013
 Good progress towards a more efficient 1 fourth quarter 2013 Full-year highlights Strategy execution Supply Chain optimization initiative launched Continued strong progress at Materials Technology Significant
Fidia S.p.A.: the BoD approves the Quarterly Report as at September 30, 2017
 Press release Fidia S.p.A.: the BoD approves the Quarterly Report as at September 30, 2017 Main consolidated figures as at September 30, 2017 Net revenues: 28,8 million euros (37,1 million euros as at
30 September Biesse: approves quarterly report to. Order intake - backlog - revenues: profitability: net profit: net financial position:
 Biesse: approves quarterly report to 30 September 2017 highlights 9 months 2017: Order intake - backlog - revenues: o order intake (machineries) +16.8% compared to September 2016 o backlog +26.1% compared
RESULTS MADRID, 23 FEBRUARY
 RESULTS 2011 MADRID, 23 FEBRUARY 2012 www.indra.es CONTENTS 1. Introduction - 3 2. Main Figures - 7 3. Analysis of Revenues and Commercial Activity - 8 3.1. Analysis by Segment - 9 3.2. Analysis by Vertical
FY 2011 FY 2011 CONSOLIDATED RESULTS
 FY 211 FY 211 CONSOLIDATED RESULTS Conference Call Pag. 1 Contents Financial highlights Ascopiave Group structure as of December, 31st 211 FY 211 income statement Impact of Robin Hood Tax review Balance
FY 2015 consolidated results. March 23, 2016
 FY 2015 consolidated results March 23, 2016 Agenda Delivery on strategic plan Financial results Business analysis Closing remarks 1 Delivery on strategic plan Opening remarks Operational efficiency delivering
Magseis ASA Q nd November 2017
 Magseis ASA Q3 2017 2 nd November 2017 Highlights Another strong quarter Strong financial performance: Revenue of USD 28.7m and EBITDA of USD 13.9m Revised EBITDA guidance to USD 24-26m for the full year,
FY2017 FILA Group Results
 FY2017 FILA Group Results Disclaimer This document has been prepared by F.I.L.A. S.p.A. ( F.I.L.A. or the Company ), for information purposes only, exclusively with the aim of assisting you to understand
INTERIM REPORT ON OPERATIONS AT 31 MARCH Astaldi, consolidated net profit up by 14%
 INTERIM REPORT ON OPERATIONS AT 31 MARCH 2010 1 Astaldi, consolidated net profit up by 14% Total revenues up by 6.9% to EUR 460.7 million EBITDA: +10.5% to EUR 51.8 million, with the EBITDA margin up to
BORSA ITALIANA - STAR segment PRESS RELEASE
 BORSA ITALIANA - STAR segment PRESS RELEASE INTERIM REPORT AS AT MARCH 31 st 2018 (in brackets results as at 31/03/2017) GROWTH OF REVENUES AND ORDER ACQUISITION PROFITABILITY IMPROVEMENT CONTINUES Consolidated
ITALMOBILIARE SOCIETA PER AZIONI
 ITALMOBILIARE SOCIETA PER AZIONI PRESS RELEASE BOARD OF DIRECTORS EXAMINES CONSOLIDATED RESULTS FOR REVENUE: 1,145.6 MILLION EURO (1,220.7 MILLION EURO IN ) TOTAL LOSS FOR THE PERIOD OF 38.2 MILLION EURO
First Half 2011 Conference Call
 Moving ahead First Half 2011 Conference Call 29 th July, 2011 Copyright Datalogic 2007-2011 DISCLAIMER This document has been prepared by Datalogic S.p.A. (the "Company") for use during meetings with investors
FY 2018 FINANCIAL RESULTS
 FY FINANCIAL RESULTS Full Year LRG shows strong performance improvement compared to, with results in line with outlook FY Revenue (M ) Adjusted Ebitda (M ) Ebit (M ) NPF (M ) 184,2 38,9 206,3 39,2 +20,9
Cavotec MSL Investor Relations. Presentation of Cavotec MSL 1H2010 Results! New Zealand, August 2010!
 Cavotec MSL Investor Relations Presentation of Cavotec MSL 1H2010 Results New Zealand, August 2010 Who is Cavotec Cavotec is a global engineering group, developing innovative solutions that help industry
ASTALDI: NET PROFIT UP +20.1% AT 32 MILLION EUROS NET INDEBTEDNESS DOWN TO MILLION EUROS
 The Board of Directors has approved the Intermediate Report at 30 September 2008 ASTALDI: NET PROFIT UP +20.1% AT 32 MILLION EUROS NET INDEBTEDNESS DOWN TO 467.7 MILLION EUROS Main consolidated data at
TOD S S.p.A. - In the first half of 2017 Group s sales totaled 483 million Euros (Roger Vivier: +11%); net income was 34.7 million Euros.
; net income was 34.7 million Euros.") Milan August 3 rd, 2017 TOD S S.p.A. - In the first half of 2017 Group s sales totaled 483 million Euros (Roger Vivier: +11%); net income was 34.7 million Euros. The Board of Directors approved Tod s Group
Milan August 3 rd, 2017 TOD S S.p.A. - In the first half of 2017 Group s sales totaled 483 million Euros (Roger Vivier: +11%); net income was 34.7 million Euros. The Board of Directors approved Tod s Group
1H15 Results Presentation. July 30, 2015
 1H15 Results Presentation July 30, 2015 1H15 Key facts Sales: Euro 426.9 million +6.7% (+4.0% constant FX) Directly Operated Stores Same Store Sales: +6.4% (2Q15 +7.9%) EBITDA: Euro 26.6 million +28.3%
FY 2012 FY 2012 CONSOLIDATED RESULTS
 FY 212 FY 212 CONSOLIDATED RESULTS Conference Call Pieve di Soligo, March, 15th 213 Pag. 1 Contents Financial highlights Ascopiave Group structure as of December, 31st 212 FY 212 income statement Balance
Astaldi. Italian Investment Seminar April 27, 2005
 Astaldi Italian Investment Seminar April 27, 2005 1 2004-2006 2006 Plan 2005-2009 2009 Plan >> The strong operating capacity of the Group, both in Italy and abroad, as proven by: The efficacy of 2004-2006
30 June approves the Interim Financial Report for the six month period to. June IH
 approves the Interim Financial Report for the six month period to 30 June 2016 Compared to the same period of 2015: revenues, net profit and order intake all increase order backlog at a record high net
BAUER Aktiengesellschaft
 BAUER Aktiengesellschaft Group Presentation First Quarter 2011 Foundation works in Jakarta, Indonesia 11-5-13 IR-Presentation_AnalystConference_Q12011 BAUER AG, D-86529 Schrobenhausen Key Figures FY 2010
Q RESULTS INVESTOR PRESENTATION
 Q1 2018 RESULTS INVESTOR PRESENTATION INFORMATION Quarterly financial statements are unaudited and are not subject to any review Half year financial statements are subject to limited review by statutory
Trevi Finanziaria. First half confirms growth trend. 20 September 2006 Industrials Change in Estimates. Price: 6.65 Target price: 7.
 20 September 2006 Industrials Change in Estimates Price: 6.65 Target price: 7.70 Outperform 8.00 7.50 7.00 6.50 6.00 18/9/06 2004 2005 2006E 2007E EPS Adj. ( ) 0.04 0.20 0.38 0.48 DPS ( ) 0.02 0.07 0.12
2014 Results Conference Call. 9 th March, 2015
 2014 Results Conference Call 9 th March, 2015 Agenda 2014 Results Outlook 2 2014 Results 3 2014 Key Factors FOCUS ON CLIENT Anticipate clients needs offering new products to improve their efficiency and
H Results. H Results
 1 H1 17 Highlights Market demand continue to increase (+2.0) Net Sales strong increase 12.6, driven by strong Cooking Own brand business performance +21 EBITDA adjusted* increase by 13.0, positively impacted
FULL YEAR RESULTS AND DEVELOPMENTS March 2018
 FULL YEAR RESULTS AND DEVELOPMENTS 2017 6 March 2018 CONTENTS 1 Highlights & progress strategy 2017 2 Developments solutions segments 3 Financial performance 4 Outlook 5 Questions & answers 2 FY Results
2005 First Half Consolidated Results
 2005 First Half Consolidated Results 1 Index 1H 2005 Results Transition to IFRS: main impacts Appendix 2 1H 2005 Main Highlights The following data and all comparisons with previous periods are based on
Financial Results Investor Presentation
 26.3.2013 2012 Financial Results Investor Presentation SAFE HARBOR STATEMENT Certain statements in this slide show, including those addressing the Company s beliefs, f, plans, objectives, estimates or
INTERIM FINANCIAL REPORT AS AT SEPTEMBER 30, 2017 (Translation into English of the original Italian version)
") INTERIM FINANCIAL REPORT AS AT SEPTEMBER 30, 2017 (Translation into English of the original Italian version) JOINT-STOCK COMPANY - SHARE CAPITAL EURO 62.393.755,84 MANTOVA COMPANY REGISTER AND TAX NO.
INTERIM FINANCIAL REPORT AS AT SEPTEMBER 30, 2017 (Translation into English of the original Italian version) JOINT-STOCK COMPANY - SHARE CAPITAL EURO 62.393.755,84 MANTOVA COMPANY REGISTER AND TAX NO.
2Q 2018 RESULT PRESENTATION
 2Q 2018 RESULT PRESENTATION 15 August 2018 www.mermaid-group.com Disclaimer: The information contained in this document is intended only for use during the presentation and should not be disseminated or
PRESS RELEASE ACOTEL GROUP: interim report for three months ended 30 September 2013.
 PRESS RELEASE ACOTEL GROUP: interim report for three months ended 30 September 2013. Consolidated results for 9M 2013: Revenue 90.1 million ( 72.9 million in 9M 2012) Negative EBITDA 2 million (positive
title 9 Months 2012 title Conference Call 12 th November 2012 date
 title 9 Months 2012 title Conference Call 12 th November 2012 date DISCLAIMER This document has been prepared by Datalogic S.p.A. (the "Company") for use during meetings with investors and financial analysts
OVERVIEW. Highlights. Business and Products Development. H Financials. FY 2014 Company Guidance
 H1 14 Results DISCLAIMER These statements are related, among others, to the intent, belief or current expectations of the customer base, estimates regarding future growth in the different business lines
9M 2017 FILA Group Results
 9M 2017 FILA Group Results Disclaimer This document has been prepared by F.I.L.A. S.p.A. ( F.I.L.A. or the Company ), for information purposes only, exclusively with the aim of assisting you to understand
FY 2012 Results. March 13 th, 2013
 FY 2012 Results March 13 th, 2013 ASTALDI GROUP FY 2012 RESULTS Conference Call, March 13 2013 1 1 2012 RESULTS OVERALL OUTLOOK Positive Group performance in a very difficult year both in the domestic
Saipem: the Board of Directors approves third quarter results to 30 September 2006
 A Joint Stock Company with Registered Office In San Donato Milanese, Italy Full paid-up Share Capital Euro 441,410,900 Fiscal Code and Milan Companies Register No. 00825790157 Switchboard +39-025201 Fax
This presentation is being distributed to professional investors only and may not be reproduced, redistributed or published in whole or in part.
 2009 Annual Results Disclaimer This document has been prepared by Vianini Lavori S.p.A. for information purposes only and it is not intended as an offer or solicitation of an offer to purchase or sell
Saipem: the Board of Directors approves third quarter results at September 30, 2007
 A Joint Stock Company with Registered Office In San Donato Milanese, Italy Full paid-up Share Capital 441,410,900 Fiscal Code and Milan Companies Register No. 00825790157 Switchboard +39-025201 Fax +39-0252054295
UBS GLOBAL OIL & GAS CONFERENCE. May 20 th, 2015
 UBS GLOBAL OIL & GAS CONFERENCE May 20 th, 2015 Forward-looking Statements This presentation contains various forward-looking statements and information that are based on management s current expectations
BORSA ITALIANA - STAR segment PRESS RELEASE. INTERIM REPORT AS AT SEPTEMBER 30 th 2018 (in brackets results as at 30/09/2017)
") BORSA ITALIANA - STAR segment PRESS RELEASE INTERIM REPORT AS AT SEPTEMBER 30 th 2018 (in brackets results as at 30/09/2017) THE GROWTH OF THE GROUP CONTINUES ALSO IN THE THIRD QUARTER 2018, DESPITE THE
BORSA ITALIANA - STAR segment PRESS RELEASE INTERIM REPORT AS AT SEPTEMBER 30 th 2018 (in brackets results as at 30/09/2017) THE GROWTH OF THE GROUP CONTINUES ALSO IN THE THIRD QUARTER 2018, DESPITE THE
1Q 2015 Results. May 8, 2015
 1Q 2015 Results May 8, 2015 Highlights of the period Good operating results: recurring EBITDA +4% Latam: confirmed positive trends, EBITDA +33% yoy and reorganization kicked -off Renewables: +0.2 GW capacity
TREVI Finanziaria Industriale S.p.A. Registered Office: Via Larga, 201, Cesena (FC), Share Capital: Euro 82,391,632.
, Share Capital: Euro 82,391,632.") TREVI Finanziaria Industriale S.p.A. Registered Office: Via Larga, 201, Cesena (FC), Share Capital: Euro 82,391,632.50 fully paid up Register of Companies of Forlì Cesena, Tax code and VAT No. 01547370401
TREVI Finanziaria Industriale S.p.A. Registered Office: Via Larga, 201, Cesena (FC), Share Capital: Euro 82,391,632.50 fully paid up Register of Companies of Forlì Cesena, Tax code and VAT No. 01547370401
FY 2018 FINANCIAL RESULTS. MILAN March 5 th,2019
 FY 2018 FINANCIAL RESULTS MILAN March 5 th,2019 AGENDA FY 2018 Highlights o Group overview o Results by business o Outlook Financial Results Appendix 2 FY 2018 Financial Highlights Fully combined organic