Creditor Presentation
|
|
|
- Evelyn Ryan
- 5 years ago
- Views:
Transcription
1 Creditor Presentation Fourth Quarter, Fiscal Year Ended ch 213 Nomura Holdings, Inc. April 213 Nomura
2 Disclaimer This document is produced by Nomura Holdings, Inc. ( Nomura ). Nothing in this document shall be considered as an offer to sell or solicitation of an offer to buy any security, commodity or other instrument, including securities issued by Nomura or any affiliate thereof. Offers to sell, sales, solicitations to buy, or purchases of any securities issued by Nomura or any affiliate thereof may only be made or entered into pursuant to appropriate offering materials or a prospectus prepared and distributed according to the laws, regulations, rules and market practices of the jurisdictions in which such offers or sales may be made. The information and opinions contained in this document have been obtained from sources believed to be reliable, but no representations or warranty, express or implied, are made that such information is accurate or complete and no responsibility or liability can be accepted by Nomura for errors or omissions or for any losses arising from the use of this information. All rights regarding this document are reserved by Nomura. No part of this document shall be reproduced, stored in a retrieval system or transmitted in any form or by any means, electronic, mechanical, photocopying, recording or otherwise, without the prior written permission of Nomura. This document contains statements that may constitute, and from time to time our management may make forward-looking statements within the meaning of the safe harbor provisions of The Private Securities Litigation Reform Act of Any such statements must be read in the context of the offering materials pursuant to which any securities may be offered or sold in the United States. These forward-looking statements are not historical facts but instead represent only our belief regarding future events, many of which, by their nature, are inherently uncertain and outside our control. Actual results and financial condition may differ, possibly materially, from what is indicated in those forward-looking statements. You should not place undue reliance on any forward-looking statement and should consider all of the following uncertainties and risk factors, as well as those more fully discussed under Nomura s most recent Annual Report on Form 2-F and other reports filed with the U.S. Securities and Exchange Commission ( SEC ) that are available on Nomura s website ( and on the SEC s website ( Important risk factors that could cause actual results to differ from those in specific forward-looking statements include, without limitation, economic and market conditions, political events and investor sentiments, liquidity of secondary markets, level and volatility of interest rates, currency exchange rates, security valuations, competitive conditions and size, and the number and timing of transactions. Forward-looking statements speak only as of the date they are made, and Nomura undertakes no obligation to update any forward-looking statement to reflect the impact of circumstances or events that arise after the date the forward-looking statement was made. The consolidated financial information in this document is unaudited.
3 Table of Contents Executive Summary Overview of Results Retail, Asset Management, Wholesale Progress of Cost Reduction Program Non-Interest Expenses Balance Sheet Management Level3 Asset, Private Equity Investments/Investments in Equity Securities Financial Position Changes to Shareholders Equity (Tier 1) and Risk-Weighted Assets Liquidity Profile Funding Profile Appendix Unless otherwise stated, conversion of Yen figures to U.S. Dollars has been calculated at the exchange rate of USD 1 = JPY 94.16, i.e. FRB noon rate as of ch 31, 213 2
 shares (Y5.1bn) contributed to overall earnings Net revenue: Y653.")
 213 Full year Reported marked increase in revenue and income: Both income before income taxes and net income 1 at highest level since fiscal year ended ch 27 Net revenue: Y1,813.")
 Healthy balance sheet Highly liquid, healthy balance sheet: 82% of assets are highly liquid trading-related assets Conservative Risk Profile Balance Sheet Management Substantial")

4 Executive Summary Financial Highlights 213 Fourth Quarter Significant QoQ increase in revenue and income: Both income before income taxes and net income 1 at highest level since 26 4Q Robust Retail performance and one-off gain on secondary offering of Nomura Real Estate Holdings( NREH ) shares (Y5.1bn) contributed to overall earnings Net revenue: Y653.6bn (+68% QoQ) Income before income taxes: Y169.7bn (13.1x QoQ) Net income 1 : Y82.4bn (4.1x QoQ) ROE: 14.8% (3Q:ROE3.8%) 213 Full year Reported marked increase in revenue and income: Both income before income taxes and net income 1 at highest level since fiscal year ended ch 27 Net revenue: Y1,813.6bn (+18% YoY) Income before income taxes: Y237.7bn (+18% YoY) Net income 1 : Y17.2bn (9.3x YoY) ROE: 4.9% (:ROE.6%) Healthy balance sheet Highly liquid, healthy balance sheet: 82% of assets are highly liquid trading-related assets Conservative Risk Profile Balance Sheet Management Substantial Liquidity: Liquidity portfolio Y5.9tn ($62bn) as of ch 213, 16% of total assets Conservative funding profile: Approx 8% of unsecured funding is comprised of long-term debt. Funding sources and debt maturities are diversified Robust financial position Basel 3 basis 2 : Tier 1 ratio of 11.7%, Tier 1 common ratio 3 of 11.7% (1) Net income attributable to Nomura Holdings shareholders. (2) Credit risk assets are calculated using the internal model method. (3) Tier 1 common ratio is defined as Tier 1 capital minus minority interest divided by risk-weighted assets. 3
5 Overview of Results Quarter Full Year Key Points (USD bn) 213 4Q 1Q 2Q 3Q 4Q Net revenue Retail Asset Management Wholesale Segment Total Other Unrealized gain (loss) on Investments in equity securities 1 Non-interest expenses Income (loss) before income taxes Segment Total Other Unrealized gain (loss) on Investments in equity securities 1 Net income (loss) $ $ $ $ $ $ $ $ $ $ $ $ $.88 QoQ YoY +68% +31% +45% +5% -3% +16% +4% +24% +17% +33% 3.6x +24% +156% +13% +29% +1% 13.1x +179% +35% +167% - 3.4x +156% +13% 4.1x 3.7x 1, , ,813.6 $ $ $ $6.85 1,111.7 $ $ $.4 1,575.9 $ $ $ $ $ $1.14 YoY +18% +14% +5% +16% +14% +18% 9.9x +9% +18% 4.2x -81% 9.9x 9.3x Fourth Quarter Results Income before income taxes from three business segments totaled Y96.8bn (+35% QoQ), representing strongest quarter since 28 1Q Retail Net revenue Y138.7bn (+45% QoQ) Income before income taxes Y57.2bn (+182% QoQ) Stock market rally underpinned strong growth in sales of equity-related products Asset Management Net revenue Y18.3bn (-3% QoQ) Income before income taxes Y3.9bn (-46% QoQ) Revenues in line with last quarter which included revenues from performance fees and dividends Wholesale Net revenue Y196.9bn (+4% QoQ) Income before income taxes Y35.7bn (-2% QoQ) Strongest revenues since 21 3Q with Japan revenues showing a sharp increase QoQ Full Year Results Income before income taxes from three business segments totaled Y193.5bn (4.2x YoY); All businesses reported higher income YoY Retail Performance rebounded in 2H as consulting-based sales approach now well established and market conditions turned favorable Asset Management Steady growth in assets under management Wholesale Revenues driven by Fixed Income Absorbed effects of cost reduction program and reported revenues in Equities and Investment Banking 6 in line with last year Continued efforts to raise profitability: Reduced cost base significantly, achieving profitability at pretax level (1) Unrealized gain (loss) on investments in equity securities held for operating purposes. (2) Income before income taxes in Other segment of Y5.1bn: (i) Capital gain on NREH stock offering: Y11.6bn; Unrealized gain on remaining stake: Y38.5bn, (ii) Earnings of subsidiaries, equity in earnings of affiliates, earnings from businesses not included in three segments: Y4bn, (iii) Loss (Y34.8bn) due to changes in own and counterparty credit spreads. (3) Net income (loss) attributable to Nomura Holdings shareholders. (4) Net revenue in Investment Banking excluding Other. 4
6 Retail Net Revenue and Income Before Income Taxes (USD bn) Net Asset Inflows 1 and Investment Trust Net Inflows 2, Retail Client Assets Net asset inflow (lhs) 647 Retail Client Assets(JPY tn) 17 Quarter 213 4Q 1Q 2Q 3Q 4Q Net revenue Non-interest expenses Income before income taxes $ $ $ QoQ Investment trust net inflows (rhs) YoY 96 Full Year ($.4bn) ($89bn) YoY +45% +5% $ % +8% +13% $ % +182% +182% $ % ($2.3bn) -75 Key Points Fourth Quarter Results Net revenue and income before income taxes increased markedly QoQ; Income before income taxes at highest level since 26 3Q Total sales jumped 69% QoQ Stock market rally underpinned strong growth in sales of equity-related products Increased costs of approximately Y5bn related to new IT system were more than offset by strong revenues Client franchise Retail client assets Y83.8trn Accounts with balance 5.2m Net asset inflows Y38bn Full Year Results Consulting-based sales are now well established and performance improved sharply in 2H as market conditions turned favorable Total Sales 5, 4, 3, Stocks Bonds Investment trusts Others 2, 1, Q / 12 1Q / Jun 12 2Q / Sep 12 3Q / Dec 12 4Q / 13 4Q 1Q 2Q 3Q 4Q (1) Net asset inflows = Asset inflows asset outflows. Retail client assets exclude portion from regional financial institutions. (2) Retail channel only. 5
7 Asset Management Net Revenue and Income Before Income Taxes % 22% 21% (USD bn) Investment Trust Business Flows of Funds 1 and Nomura Asset Management Share of Public Investment Trust ket Quarter 213 4Q 1Q 2Q 3Q 4Q Net revenue Non-interest expenses Income before income taxes Investment trust business (excl. ETFs) $ $ $ % 22.2% 22.1% QoQ ETFs 37 YoY -3% +16% % +24% % -5% Nomura Asset Management Share of Public Investment Trust ket (%) Full Year $ $ $ % 22.3% YoY ($4.9bn) ($.7bn) +5% +5% +3% Key Points Fourth Quarter Results Revenues in line with last quarter which included revenues from performance fees and dividends; Assets under management increased by 1% QoQ Income before income taxes declined QoQ due to one-off charge related to revaluation of assets Investment trust business Investor risk appetite increased with funds primarily flowing into Japan stock and high dividend stock investment trusts 4Q fund inflows Nomura High Dividend Infrastructure Equity Premium Fund: Y139.9bn Nomura Japan Brand Investment Stock Fund: Y128.4bn Nomura Japan High Dividend Stock Premium Fund: Y99.1bn Enhanced Next Funds ETF product lineup Newly listed Nomura Japan Equity High Dividend 7 ETF to meet investor needs for income Total of 4 ETFs with AuM of Y2.6trn at end (Maintained #1 spot with 51% market share) 2 Investment advisory business AuM increased 1% QoQ supported by the market rally; Continued to win mandates for a diverse range of products Full Year Results Steady growth in AuM; Both net revenue and income before income taxes increased YoY Assets Under Management (JPY trn) AuM (gross) 3 AuM (net) ($383bn) 27.9 ($296bn) 2% 19% 213 4Q / 12 1Q / Jun 12 2Q / Sep 12 3Q / Dec 12 4Q / Jun 12 Sep 12 Dec (1) Based on assets under management (net). (2) Source: The Investment Trusts Association, Japan. (3) Total assets under management for Nomura Asset Management, Nomura Funds Research and Technologies, Nomura Corporate Research and Asset Management, and Nomura Private Equity Capital. (4) Net after deducting duplications from assets under management (gross). 6
8 Wholesale Net Revenue and Income (Loss) Before Income Taxes 1 (USD bn) Net Revenue by Region Quarter 213 4Q 1Q 2Q 3Q 4Q Net revenue Fixed Income Equity Investment Banking (net) Other Investment Banking Non-interest expenses Income (loss) before income taxes Investment Banking (gross) $ $ $ Q 1Q 2Q 3Q 4Q Full Year (1) Figures have been reclassified to conform to the current presentation following a reorganization in April (2) Net revenue in Investment Banking excluding Other. QoQ YoY 213 AEJ Americas EMEA Japan YoY +4% +24% $ % -2% +24% $ % +38% +26% $ $ % +1% $.76.4 $ $ $ $ $.47-97% $.13-23% +2% $ % +1% $6.9-2% 3.x $ % +9% $1.52 +% -4% -48% -15% -3% - +1% Key Points Fourth Quarter Results Net revenue at highest level since 21 3Q; Japan revenues jumped significantly Higher costs as a result of one-off expenses of Y6bn related to cost reduction program and due to yen depreciation Fixed Income Second highest quarterly revenues for the year as strong performance in Japan offset slower revenues in international franchise Japan: Revenue opportunities increased due to shift in macro economic environment Client revenues up 24% QoQ on growth across all regions Product level performance Rates : Globally, revenues remained solid. EMEA revenues softened from a strong 3Q on lower market volatility Securitized Products: Revenues were resilient but declined QoQ as asset prices stabilized Equities Client revenues Up 37% QoQ on higher turnover on major markets. Strong rebound in Japan Trading revenues Trading driven by rise in major market indices Derivatives: Continued growth since 3Q. Particularly strong growth in Japan and AEJ Migration of Execution Services to Instinet Migration complete for most major clients, cost reductions exceed target Investment Banking Although revenues declined from 3Q when private equity gains were booked, Investment Banking (Net) increased 32% on the back of solid business in Japan Gross revenue: Y44.1bn (up both QoQ and YoY) Japan: Highest revenues in eight quarters Revenues driven by ECM transactions for REITs, etc, and by landmark DCM deals International: Maintained momentum despite lower revenue opportunities Executed diverse range of transactions such as M&A and solutions primarily for financial institutions and financial sponsors Leveraged finance revenues continued to grow in the Americas Full Year Results Revenues were driven by Fixed Income which reported stronger revenues YoY across all products and international regions Absorbed effects of cost reduction program and reported revenues in Equities and Investment Banking 2 in line with last year Continued efforts to raise profitability: Costs down by 3% 7
9 Progress of Cost Reduction Program Timeline of $1bn Cost Reduction Program Progress to 213 Announced in Sep : $1bn Japan 18% AEJ 15% PE 43% 213 2Q 213 2H Wholesale: Personnel expenses % 9% 1% Additional $1bn cost reductions 78% complete as of end of ch Personnel expense reductions progressing ahead of schedule (9% complete) Improving profitability Americas 21% EMEA 46% NPE 57% Wholesale: Non-personnel expenses Wholesale: Total 2% 69% 1% 27% 78% 1% Migrating Execution Services to Instinet Migration complete for most major clients, cost reductions exceeded initial target Reorganized Research coverage and Derivatives business Reallocated resources in Investment banking to key coverage areas Corporate has revamped IT system cost structure and improved business efficiencies Region PE vs. NPE (1) Regional and PE vs. NPE breakdowns for $1bn cost reduction have been adjusted from the figures announced on September 6,. 8
10 Non-Interest Expenses Full Year Quarter Key Points Other Business development expenses Occupancy and related depreciation Information processing and communications 1,6 1,2 1,45.9 1,575.9 (1) Full year Non-interest expenses: Y1,575.9bn (+9% YoY) Increase is due to an adjustment related to the consolidation period for Nomura Land and Building Commissions and floor brokerage Compensation and benefits 8 (2) 3 2 (consolidated in May 211), higher cost of goods sold at NREH on stronger revenues, and other factors (Reference) Excluding NREH 4 1 Excluding NREH, expenses were roughly flat YoY -- (1) Fourth Quarter Non-interest expenses: Y483.9bn QoQ 4Q 1Q 2Q 3Q 4Q Compensation and benefits % Commissions and floor brokerage % Information processing and communications % Occupancy and related depreciation % Business development expenses % Other % Total 1,45.9 1, % (+29% QoQ) Other expenses increased 54% QoQ due to a rise in cost of goods sold at NREH Excluding NREH, expenses increased by 11% QoQ --- (2) 9
 Full Year Non-interest expenses roughly flat YoY (+2%) Higher costs in international business due to yen depreciation Increase in one-off expenses Booked one-off expenses of Y18.")

11 (Reference) Non-Interest Expenses (excl. NREH) Full Year Non-interest expenses roughly flat YoY (+2%) Higher costs in international business due to yen depreciation Increase in one-off expenses Booked one-off expenses of Y18.5bn related to cost reduction program, up from Y12.4bn in prior year Loss on disposal of It system of approx. Y7.bn Goodwill impairment charge of Y8.3bn Non-interest expenses were down YoY excluding the above factors Quarter Non-interest expenses increased 11% QoQ Compensation and benefits Booked one-off expense of Y7.5bn related to cost reduction program, up from Y3.9bn in the previous quarter Increased bonus pool in line with stronger revenues, higher costs in international business due to yen deprecation, other factors Information processing and communications Costs related to new Retail IT system increased by Y5bn ked increase in income before income taxes QoQ as robust revenues more than offset higher costs 1, Q 1Q 2Q 3Q 4Q 1
12 Balance Sheet Management Balance Sheet Composition Highly Liquid, Healthy Balance Sheet 82% of assets are highly liquid trading and related assets that are marked to market, and matched to trading and related liabilities through repos, etc. (regionally and by currency) Other assets are funded by equity and long-term debt, ensuring structural stability Balance Sheet (ch 213) Assets Trading Assets and Related 1 Liabilities / Equity Trading Liabilities and Related 1 Funding Profile Conservative Funding Profile Approx. 8% of unsecured funding 3 is long-term debt Unsecured funding sources are diversified across products, investor types and maturities Conservative Risk Profile Peripheral Europe net country exposure of $.92bn (decreased by $2.bn from December ) Net Level 3 assets 2 continued to be moderate, 25% of Tier 1 capital as of ch 213 Other Liabilities Financial Position Robust Financial Position Basel 3 basis 4 Liquidity Portfolio 3 Substantial Liquidity Portfolio Y5.9tn($62bn), 16% of total assets Maintain a high quality liquidity portfolio surplus without the need for additional unsecured funding over a certain period Cash and Cash Deposits Other Assets Short-Term Borrowings Long-Term Borrowings Total Equity Tier 1 ratio at 11.7%, and Tier 1 common ratio 5 at 11.7% Leverage remains at prudent levels, with gross leverage at 16.5x and net leverage 6 at 1.4x (1) Trading assets and related: Reverse repo, securities, derivatives, etc. Trading liabilities and related: Repo, securities loaned, derivatives liabilities, etc. (2) Preliminary. (3) Definition differs from financial disclosures reflecting Liquidity Management s view. Cash and cash deposits portion of liquidity portfolio excludes segregated client funds. (4) Credit risk assets are calculated using the internal model method. (5) Tier 1 common ratio is defined as Tier 1 capital minus minority interest divided by risk-weighted assets. (6) Net leverage: Total assets minus securities purchased under agreements to resell and securities borrowed, divided by Nomura Holdings shareholders equity. 11
13 Level3 Asset, Private Equity Investments/Investments in Equity Securities We will continue to control Level 3 assets and less liquid non-trading assets such as private equity, investments in equity securities at manageable levels Level 3 Assets 1 Private Equity Investments / Investments in Equity Securities (JPY tn) Level 3 Assets(lhs) PE(lhs) % Net Level 3 Assets(lhs) Net Level 3 Assets/Tier1 Capital(rhs) 125% 5 Investments in Equity Securities(lhs) (PE+Investments in Equity Securities)/Total Assets(%)(rhs) 2.5% 4. 1% 4 1.8% 2.% 3. 75% 3 1.4% 1.5% % 37% 31% 29% 32% 25% 25% 5% 25% %.8%.8%.8%.5%.6% 1.%.5% Jun Sep 213 Dec 213 % Jun Sep 213 Dec 213.% (1) Preliminary. 12
14 Financial Position Balance Sheet Related Indicators and Capital Ratios RWA and Tier 1 Capital Ratio (USD bn) Dec 31, 1 31, , (Basel 2.5 basis) (Basel 3 basis) (Basel 3 basis) Total Assets 38,562 37, % 16.9% RWA(Basel2 basis)(lhs) RWA(Basel2.5 basis)(lhs) RWA(Basel3 basis)(lhs) Tier1 Ratio(rhs) 17.3% 16.4% 14.2% 15.% 15.1% 11.7% 2% 15% Tier 1 2,174 2, % Tier Tier % Total capital 2,492 2, RWA 12,834 17, Tier 1 ratio 16.9% 11.7% 11.7% Tier 1 common ratio % 11.7% 11.7% Leverage Ratio Jun Sep 213 Dec 213 % Total capital ratio 19.4% 13.8% 13.8% (x) 22 Gross Leverage Ratio Net Leverage Ratio Total assets decreased QoQ due partly to deconsolidation of NREH ch-end Tier 1 ratio and Tier 1 common ratio declined QoQ to 11.7% (preliminary) due primarily to introduction of Basel 3, partly offset by declined trading positions and deconsolidation of NREH Basel 3 Tier 1 ratio and Tier 1 common ratio (applying fully loaded Basel standards to 213 balance sheet for reference) are approximately 1% (1) Credit risk assets are calculated using the internal model method. (2) Tier 1 common ratio is defined as Tier 1 capital minus minority interest divided by risk-weighted assets. (3) Net leverage: Total assets minus securities purchased under agreements to resell and securities borrowed, divided by Nomura Holdings shareholders equity Jun Sep Dec
 (Reference) Fully loaded Basel 3 219 applied to balance sheet at end of ch Tier 1 ratio Tier 1 common ratio Tier 1 16.9% 18.")

15 Changes to Shareholders Equity (Tier 1) and Risk-Weighted Assets Dec vs. 213 (Preliminary) (Reference) Fully loaded Basel applied to balance sheet at end of ch Tier 1 ratio Tier 1 common ratio Tier % 18.8% 11.7% 14.9% 18.8% 11.7% 2, ,94 2,94 Approx. 1% Approx. 1% Increase in RWA due to introduction of Basel 3 +1,9 +4,7 Risk-weighted assets 17,753 12,834-1, ,11 Dec (Basel 2.5) Effect of deconsolidation of NREH Others (Decline in trading positions) 213 (Basel 2.5) Credit risk ket risk 213 Phased 213 (Basel 3) introduction (Fully loaded Basel 3 219) 14
16 Liquidity Profile Liquidity Portfolio 1 : JPY5.9tn($62bn), 16% of Total Assets Firm-Wide Liquidity Management Liquidity Portfolio (USD bn) LP/Total Assets Liquidity Stress Test ~ Quantify Liquidity Risk Tolerance 1% 15% 16% 15% 15% 15% 14% 16% The firm carries out its liquidity stress test daily in order to maintain adequate liquidity to withstand hypothetical stress cash outflows under a market-wide stress and an additional idiosyncratic stress without accessing unsecured funding $26 29 Others 8% $53 21 Breakdown ( 213) by Instrument Deposit 11% Reverse Repo 81% $7 $66 $67 $68 $64 $ Jun EUR 14% Sep by Currency JPY 24% 213 GBP 13% Dec USD 41% Others 8% 213 Major Assumptions on Potential Outflows No access to additional / refinancing unsecured funding Widening haircuts on outstanding repo funding Collateralization of clearing banks and depositories Drawdowns on loan commitments Loss of liquidity from market losses on inventory Potential cash outflow in the event of credit rating downgrades Portfolio Assets Liquidity portfolio managed using reverse repos mainly in Japan/US/German/UK government bonds and cash and cash equivalents No GIIPS Exposures in the Liquidity Portfolio (1) Definition differs from financial disclosures reflecting Liquidity Management s view. Cash and cash deposits portion of liquidity portfolio excludes segregated client funds. 15
17 Funding Profile Maintaining both a diversified and less-credit-sensitive unsecured funding structure allowing us the ability to withstand changes in lending climate Maturities of long-term debt are staggered and the weighted average life of the firm s long-term debt 3 is over 5 years We will continue to focus on diversification Unsecured Funding 1 Unsecured Long-term Debt Profile 2 Short-Term Debt 18% Current Portion of Long-Term Debt 7% Long-Term Debt 75% Outstanding by kets CP Interbank Deposit Loans (including sub-loans) Euro MTN/Yen, Retail bonds etc ( 213) ( 213) (US$bn) Outstanding By Region Bank Lending ket Retail ket Non Japan 22% Japan 78% Maintain an adequate liquidity portfolio for potential cash needs from debt maturities for the next 12 months Average Maturities: > 5years 5 Breakdown of shortterm/ and long-term debt Funding of Short-term debt Euro MTN/others, Wholesale bonds etc Funding of long-term debt Wholesale ket 1Q 2Q 3Q 4Q 1Q 2Q 3Q 4Q 1Q 2Q 3Q 4Q 1Q 2Q 3Q 4Q 1Q 2Q 3Q 4Q '14 '15 '16 '17 18 >5Y (1) Definition differs from financial disclosures reflecting Liquidity Management s view. (2) Redemption schedule is individually estimated by considering the probability of redemption as of ch 213 under certain stressed scenarios. (3) Excludes current portion of long-term debt 16
18 Appendix
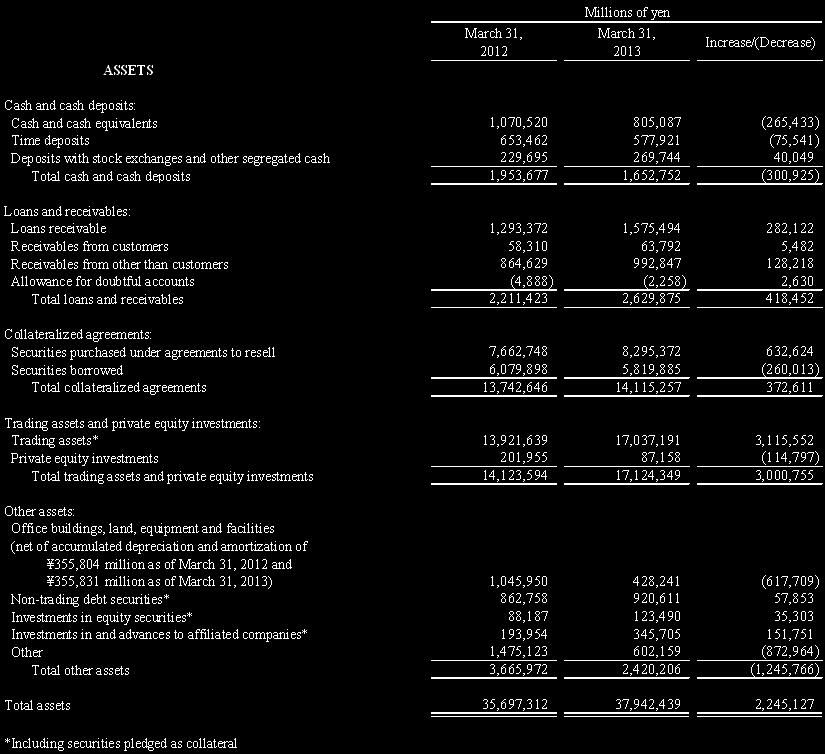
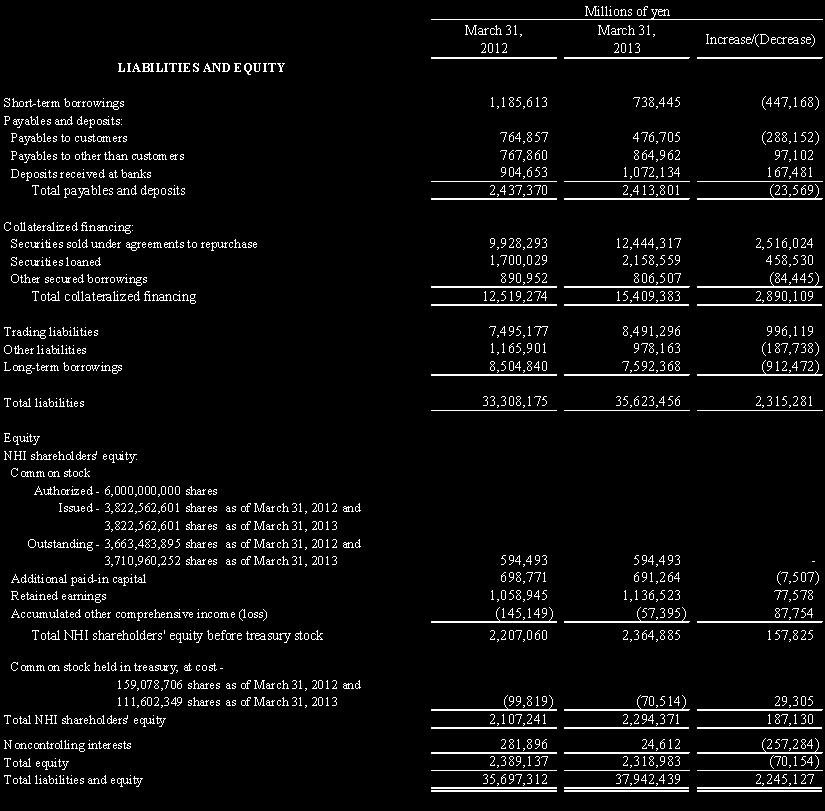
19 Consolidated Balance Sheet 18
20 Consolidated Income Full Year Quarter Q 1Q 2Q 3Q 4Q Revenue Commissions Fees from investment banking Asset management and portfolio service fees Net gain on trading Gain (loss) on private equity investments Interest and dividends Gain (loss) on investments in equity securities Other Total revenue 1, , Interest expense Net revenue 1, , Non-interest expenses 1,45.9 1, Income before income taxes Net income attributable to NHI shareholders
21 Segment Other Income (loss) before income taxes Full Year Quarter Net gain (loss) related to economic hedging transactions -6-8 Realized gain(loss) on investments in equity securities held for operating purposes Q 1Q 2Q 3Q 4Q Equity in earnings of affiliates Corporate items Others 1, Income (Loss) before income taxes (1) Due to a reorganization in April, reported amounts for Wholesale and Other have been reclassified. 2
22 Value at Risk Definition 99% confidence level 1-day time horizon for outstanding portfolio Inter-product price fluctuations considered From April 1, to ch 29, 213 (billions of yen) Maximum: 8.7 Minimum: 4.3 Average: 6.1 (billions of yen) (billions of yen) 31, Jun. 3, Sep. 3, Dec. 31,. 31, 213 Equity Interest rate Foreign exchange Sub-total Diversification benefit VaR
23 Exposure to European Peripheral Countries GIIPS Country Exposure (Preliminary, as of 31, 213) (US$m) Net inventory 1 Net counter party 2 Net exposure total Total Counter party 2 Of which, reserve / hedges Total Changes from Dec Peripheral net country exposure of $918m as of end of ch Declined by $2.2bn (-69%) from end of December ($2.94bn) Greece Ireland Mostly due to significant decline in Italian sovereign exposure Italy ,812 Portugal Inventory is all trading assets marked to market Spain European peripheral countries Total ,19 Sovereign ,817 Non-sovereign (1) Inventory, both long and short positions (2) Net counterparty exposure (i.e. repurchase transactions, securities lending and OTC derivatives) less collateral. 22
24 Number of Employees. 31, Jun. 3, Sep. 3, Dec. 31,. 31, 213 Japan (excluding FA) 1 19,598 2,197 2,39 19,877 14,123 Japan (FA) 2,11 2,14 1,981 1,951 1,97 Europe 4,14 3,975 3,94 3,747 3,618 Americas 2,42 2,423 2,425 2,316 2,271 Asia-Pacific 2 6,352 6,454 6,43 6,27 6,37 Total 34,395 35,63 34,815 34,98 27,956 (1) Excludes employees of private equity investee companies (2) Includes Powai office in India. 23
25 Credit Ratings As of ch 31, 213 Standard & Poor s Moody s Rating and Investment Information Japan Credit Rating Agency Nomura Holdings, Inc. Long-term BBB+ Baa3 A+ AA- Short-term A-2 - a-1 - Outlook stable stable negative stable Nomura Securities Co., Ltd. Long-term A- Baa2 A+ AA- Short-term A-2 P-2 a-1 - Outlook stable stable negative stable The Nomura Trust & Banking Co., Ltd. Long-term A- - - AA- Short-term A-2 - a-1 - Outlook stable - - stable Nomura Bank International plc Long-term A- - - AA- Short-term A Outlook stable - - stable 24
Creditor Presentation First quarter, year ending March 2015
 Connecting Markets East & West Creditor Presentation First quarter, year ending March 2015 Nomura Holdings, Inc. August 2014 Nomura Outline Presentation Executive Summary (p. 3) Overview of Results (p.
Consolidated Results of Operations Third quarter, year ending March 2017
 Connecting Markets East & West Consolidated Results of Operations Third quarter, year ending March 2017 (US GAAP) Nomura Holdings, Inc. January 2017 Nomura Outline Presentation Executive summary (p. 2)
Consolidated Results of Operations Second quarter, year ending March 2018
 Connecting Markets East & West Consolidated Results of Operations Second quarter, year ending March 2018 (US GAAP) Nomura Holdings, Inc. October 2017 Nomura Outline Presentation Executive summary (p. 2-3)
Consolidated Results of Operations Fourth quarter, year ended March 2017
 Connecting Markets East & West Consolidated Results of Operations Fourth quarter, year ended March 2017 (US GAAP) Nomura Holdings, Inc. April 2017 Nomura Outline Presentation Executive summary (p. 2-3)
Consolidated Results of Operations Third quarter, year ending March 2018
 Connecting Markets East & West Consolidated Results of Operations Third quarter, year ending March 2018 (US GAAP) Nomura Holdings, Inc. February 2018 Nomura Outline Presentation Executive summary (p. 2)
Connecting Markets East & West. Investor Day. FY2015/16 overview of results. Takumi Kitamura CFO Nomura Holdings, Inc. April 27, 2016.
 Connecting Markets East & West Investor Day overview of results Takumi Kitamura CFO Nomura Holdings, Inc. April 27, 2016 Nomura Executive summary full year highlights Smooth start to year, but earning
Presentation at Nomura Investment Forum 2014
 Connecting Markets East & West Presentation at Nomura Investment Forum 2014 Koji Nagai Group CEO Nomura Holdings, Inc. December 2, 2014 Nomura 1. Introduction Update on progress of FY2015/16 management
Please turn to page two.
 I will now give you an overview of our financial results for the full year and fourth quarter ended March 2014, using the document titled Consolidated Results of Operations. Please turn to page two. 1
Overview of Goldman Sachs. February 2019
 Overview of Goldman Sachs February 209 Cautionary Note on Forward-Looking Statements This presentation includes forward-looking statements. These statements are not historical facts, but instead represent
Presentation at Nomura Investment Forum 2015
 Connecting Markets East & West Presentation at Nomura Investment Forum 2015 Koji Nagai Group CEO Nomura Holdings, Inc. December 1, 2015 Nomura 1. Reconfirming FY2019/20 management target Reconfirming FY2019/20
Overview of Goldman Sachs. May 9, 2018
 Overview of Goldman Sachs May 9, 208 Cautionary Note on Forward-Looking Statements This presentation includes forward-looking statements. These statements are not historical facts, but instead represent
Deutsche Bank Q results
 Cost and capital fully on track revenue growth is now key Disciplined execution against our 2018 adjusted cost and headcount targets On track to meet our 2019 commitments Franchise focus regaining market
Morgan Stanley Fixed Income Investor Conference Call
 Morgan Stanley Fixed Income Investor Conference Call August 3, 2012 Notice The information provided herein may include certain non-gaap financial measures. The reconciliation of such measures to the comparable
Overview of Goldman Sachs. November 2017
 Overview of Goldman Sachs November 207 Cautionary Note on Forward-Looking Statements This presentation may include forward-looking statements. These statements are not historical facts, but instead represent
Overview of Goldman Sachs. October 2014
 Overview of Goldman Sachs October 2014 Cautionary Note on Forward Looking Statements Today s presentation may include forward-looking statements. These statements are not historical facts, but instead
Fixed Income Investor Presentation. August 4, 2015
 Fixed Income Investor Presentation August 4, 2015 Cautionary Note on Forward-Looking Statements Today s presentation may include forward-looking statements. These statements are not historical facts, but
First Quarter 2012 Results
 First Quarter 2012 Results Presentation to Investors and Media April 25, 2012 Disclaimer Cautionary statement regarding forward-looking statements This presentation contains forward-looking statements
Fourth Quarter and Full-Year 2011 Results Presentation to Investors and Analysts. February 9, 2012
 Fourth Quarter and Full-Year 2011 Results Presentation to Investors and Analysts February 9, 2012 Disclaimer Cautionary statement regarding forward-looking statements This presentation contains forward-looking
Second quarter 2011 results. July 26, 2011
 Second quarter 2011 results Second quarter 2011 results July 26, 2011 Cautionary statement regarding forward-looking statements This presentation contains statements that constitute forward-looking statements,
Overview of 1H, FY3/2013 performance. Sumitomo Mitsui Financial Group, Inc. November 14, 2012
 Overview of FY3/213 performance Sumitomo Mitsui Financial Group, Inc. November 14, 212 Overview of FY3/213 performance SMFG consolidated net income: 1H results exceeded May forecast; revised full year
Fixed Income Investor Presentation. August 1, 2017
 Fixed Income Investor Presentation August, 207 Cautionary Note on Forward-Looking Statements This presentation may include forward-looking statements. These statements are not historical facts, but instead
The Royal Bank of Scotland Group
 The Royal Bank of Scotland Group Q311 Fixed Income Investor Call 4 th November 2011 John Cummins Group Treasurer Liam Coleman Deputy Group Treasurer Emete Hassan Head of Debt Investor Relations Important
INVESTOR PRESENTATION. Junichi Ujiie President & CEO, Nomura Holdings, Inc. May 2002
 INVESTOR PRESENTATION Junichi Ujiie President & CEO, Nomura Holdings, Inc. May 2002 Outline of the Presentation Results of Operations Business Environment Group Vision & Business Execution Strategies by
Fourth Quarter and Full-Year 2012 Results
 As announced on March 14, 2013, certain Credit Suisse Group entities have entered into agreements with bond investors of affiliates of National Century Financial Enterprises, Inc. (NCFE) to end all bond
Second Quarter Results 2009
 Second Quarter Results 2009 Zurich July 23, 2009 Cautionary statement Cautionary statement regarding forward-looking and non-gaap information This presentation contains forward-looking statements within
Interim earnings update 15 October 2008
 Interim earnings update 15 October 2008 Publication scheme for 15 October 2008 8.00 a.m. CEST - Press release and Powerpoint presentation available on www.kbc.com 9.30 a.m. CEST - Teleconference for financial
Nomura Investors Day 2010
 Nomura Investors Day 2010 May 10, 2010 Kenichi Watanabe President and CEO Nomura Holdings, Inc. 1. This document is produced by Nomura Holdings, Inc. ("Nomura"). Copyright 2010 Nomura Holdings, Inc. All
NEWS RELEASE. R&I Affirms Ratings: Mizuho Financial Group. Rating and Investment Information, Inc. (R&I) has announced the following:
 has announced the following:") Oct 27, 2017 R&I Affirms Ratings: Mizuho Financial Group Rating and Investment Information, Inc. (R&I) has announced the following: SEC. COMPANY NAME CODE 8411 Mizuho Financial Group, Inc. ---- Mizuho
Oct 27, 2017 R&I Affirms Ratings: Mizuho Financial Group Rating and Investment Information, Inc. (R&I) has announced the following: SEC. COMPANY NAME CODE 8411 Mizuho Financial Group, Inc. ---- Mizuho
amendments to IAS 39 3Q2008 Results Chief Financial Officer 30 October 2008
 3Q financials reflect amendments to IAS 39 3Q Results Stefan Krause Chief Financial Officer 30 October Agenda 1 Summary 2 Key current issues 3 Segment results 4 Risk, capital and liquidity management Investor
Presentation to Investors and Analysts
 Fourth Quarter and Full Year 2016 Results Presentation to Investors and Analysts February 14, 2017 Disclaimer (1/2) The data presented in this presentation relating to the Swiss Universal Bank refers to
GOLDMAN SACHS REPORTS FIRST QUARTER EARNINGS PER COMMON SHARE OF $3.92 AND INCREASES THE QUARTERLY DIVIDEND TO $0.46 PER COMMON SHARE
 The Goldman Sachs Group, Inc. 200 West Street New York, New York 10282 GOLDMAN SACHS REPORTS FIRST QUARTER EARNINGS PER COMMON SHARE OF $3.92 AND INCREASES THE QUARTERLY DIVIDEND TO $0.46 PER COMMON SHARE
Investor presentation. Result presentation
 Investor presentation Result presentation 21 Highlights Income Solid results given present macroeconomic climate Lower provisioning for credit losses and no new NPL formation Provisions for credit losses
MORGAN STANLEY Financial Supplement - 1Q 2015 Table of Contents
 Page # MORGAN STANLEY Financial Supplement - 1Q 2015 Table of Contents 1. Quarterly Financial Summary 2. Quarterly Consolidated Income Statement Information 3. Quarterly Earnings Per Share Summary 4-5.
Interim Report as of September 30, 2017
 Interim Report as of September 30, 2017 The Group at a glance Nine months ended Sep 30, 2017 Sep 30, 2016 Key financial information Post-tax return on average shareholders equity 3.5 % 1.0 % Post-tax return
NEWS RELEASE. R&I Affirms Ratings: Sumitomo Mitsui Financial Group. Rating and Investment Information, Inc. (R&I) has announced the following:
 has announced the following:") Oct 27, 2017 R&I Affirms Ratings: Sumitomo Mitsui Financial Group Rating and Investment Information, Inc. (R&I) has announced the following: SEC. COMPANY NAME CODE 8316 Sumitomo Mitsui Financial Group,
Oct 27, 2017 R&I Affirms Ratings: Sumitomo Mitsui Financial Group Rating and Investment Information, Inc. (R&I) has announced the following: SEC. COMPANY NAME CODE 8316 Sumitomo Mitsui Financial Group,
2017 DFAST Mid-Cycle Stress Test Disclosure Citi Severely Adverse Scenario
 Citi 2017 2017 DFAST Mid-Cycle Stress Test Disclosure Citi Severely Adverse Scenario October 27, 2017 2017 Mid-Cycle Stress Test Overview Under the stress testing requirements of the Dodd-Frank Wall Street
Fourth quarter 2011 results
 Fourth quarter 2011 results Fourth quarter 2011 results February 7, 2012 Cautionary statement regarding forward-looking statements This presentation contains statements that constitute forward-looking
Fourth Quarter and Full-Year 2010 Results
 Fourth Quarter and Full-Year 2010 Results Zurich - Presentation to Investors and Analysts February 10, 2011 Cautionary statement Cautionary statement regarding forward-looking and non-gaap information
2016 RISK AND PILLAR III REPORT SECOND UPDATE AS OF JUNE 30, 2017
 2016 RISK AND PILLAR III REPORT SECOND UPDATE AS OF JUNE 30, 2017 NATIXIS - 2016 Risk & Pillar III Report second update as of June 30, 2017 2 TABLE OF CONTENTS Update by chapter of the Risk and Pillar
Second Quarter Results 2010
 Zurich July 22, 2010 Cautionary statement Cautionary statement regarding forward-looking and non-gaap information This presentation contains forward-looking statements within the meaning of the Private
Consolidated Results of Operations (US GAAP)
") Consolidated Results of Operations (US GAAP) Fourth quarter, year ended March 29 Nomura Holdings, Inc. April 29 1 1. This document is produced by Nomura Holdings, Inc. ("Nomura"). Copyright 29 Nomura Holdings,
Consolidated Results of Operations (US GAAP) Fourth quarter, year ended March 29 Nomura Holdings, Inc. April 29 1 1. This document is produced by Nomura Holdings, Inc. ("Nomura"). Copyright 29 Nomura Holdings,
May 9, Results for the 1st quarter of 2012
 May 9, 2012 Results for the 1st quarter of 2012 Disclaimer This presentation may contain forward-looking statements and comments relating to the objectives and strategy of Groupe BPCE. By their very nature,
Financial Results 2013
 Financial Results 2013 Creating a New Base for the Future 13 February 2014 Gerard van Olphen (Chairman of the Board) Maurice Oostendorp (CFRO) I. Highlights 2013, Strategy Update SNS REAAL FINANCIAL RESULTS
Private Banking pre-tax income of CHF 0.9 billion with net new assets of CHF 18.0 billion
 CREDIT SUISSE GROUP AG Paradeplatz 8 Telephone +41 844 33 88 44 P.O. Box Fax +41 44 333 88 77 CH-8070 Zurich media.relations@credit-suisse.com Switzerland Media Release Credit Suisse Group reports underlying*
Third quarter and first nine months 2013 results. 7 November 2013
 Third quarter and first nine months 2013 results 7 November 2013 DISCLAIMER This presentation may include prospective information on the Group, supplied as information on trends. This data does not represent
Fourth Quarter and Full Year 2014 Results
 Fourth Quarter and Full Year 2014 Results Presentation to Investors February 12, 2015 Disclaimer Cautionary statement regarding forward-looking statements This presentation contains forward-looking statements
NOMURA Half Year Report for the 115th Fiscal Year (From April 1, 2018 to September 30, 2018)
") This document is a translation of the Japanese language original prepared solely for convenience of reference. In the event of any discrepancy between this translated document and the Japanese language
This document is a translation of the Japanese language original prepared solely for convenience of reference. In the event of any discrepancy between this translated document and the Japanese language
Fixed Income Investor Presentation. May 1, 2014
 Fixed Income Investor Presentation May, 204 Cautionary Note on Forward-Looking Statements Today s presentation may include forward-looking statements. These statements represent the Firm s belief regarding
Second Quarter 2013 Results
 Second Quarter 2013 Results Presentation to Investors and Media July 25, 2013 Disclaimer Cautionary statement regarding forward-looking statements This presentation contains forward-looking statements
Full Year and Fourth Quarter 2018 Earnings Results
 Full Year and Fourth Quarter Earnings Results Media Relations: Jake Siewert 212-902-5400 Investor Relations: Heather Kennedy Miner 212-902-0300 The Goldman Sachs Group, Inc. 200 West Street New York, NY
GOLDMAN SACHS REPORTS FIRST QUARTER EARNINGS PER COMMON SHARE OF $5.59
 The Goldman Sachs Group, Inc. 200 West Street New York, New York 10282 GOLDMAN SACHS REPORTS FIRST QUARTER EARNINGS PER COMMON SHARE OF $5.59 NEW YORK, April 20, 2010 - The Goldman Sachs Group, Inc. (NYSE:
First Quarter 2019 Earnings Results
 First Quarter Earnings Results Media Relations: Jake Siewert 212-902-5400 Investor Relations: Heather Kennedy Miner 212-902-0300 The Goldman Sachs Group, Inc. 200 West Street New York, NY 10282 First Quarter
Deutsche Bank Michael Cohrs Head of Global Banking Member of the Group Executive Committee
 Deutsche Bank Michael Cohrs Head of Global Banking Member of the Group Executive Committee UBS Global Financial Services Conference New York, 14 May 2008 Agenda 1 Deutsche Bank Group 2 Global Banking 3
Second Quarter 2013 Interim Report First Quarter 2014 Interim Report
 HSBC Bank Canada Second First Quarter Quarter Interim Interim Report Report Abc HSBC BANK CANADA First Quarter Interim Report Corporate profile HSBC Bank Canada, a subsidiary of HSBC Holdings plc, is the
Deutsche Bank Q results
 Execution on strategic plan to materially improve returns to shareholders over time Conservative balance sheet management provides a solid basis to continue reshaping the franchise and focus on growth
Full Year and Fourth Quarter 2018 Earnings Results Presentation. January 16, 2019
 Full Year and Fourth Quarter 2018 Earnings Results Presentation January 16, 2019 Earnings Call Agenda 1 David M. Solomon, Chairman and Chief Executive Officer Strategic priorities Macro perspectives and
THE GOLDMAN SACHS GROUP, INC.
 UNITED STATES SECURITIES AND EXCHANGE COMMISSION Washington, D.C. 20549 FORM 8-K CURRENT REPORT Pursuant to Section 13 or 15(d) of the Securities Exchange Act of 1934 Date of Report (Date of earliest event
Leading the way in Asia, Africa and the Middle East. Half Year Results 2013
 Leading the way in Asia, Africa and the Middle East Half Year Results 2013 Forward looking statement This presentation contains or incorporates by reference forward-looking statements regarding the belief
Commenting on the performance, Bill Winters, Group Chief Executive, said:
 31 October 2018 Standard Chartered PLC - Interim Management Statement Standard Chartered PLC (the Group) today releases its Interim Management Statement for the period 30 September 2018. All figures are
Regulatory Capital Pillar 3 Disclosures
 Regulatory Capital Pillar 3 Disclosures December 31, 2016 Table of Contents Background 1 Overview 1 Corporate Governance 1 Internal Capital Adequacy Assessment Process 2 Capital Demand 3 Capital Supply
Royal Bank of Canada Third Quarter Results August 26, 2015
 Royal Bank of Canada Third Quarter Results August 26, 2015 All amounts are in Canadian dollars and are based on financial statements prepared in compliance with International Accounting Standard 34 Interim
Deutsche Bank. Deutsche Bank. Alexander von zur Muehlen Group Treasurer. Deutsche Bank. Investor Relations. Alexander von zur Muehlen, Group Treasurer
 Alexander von zur Muehlen Group Treasurer UBS Global Financial Services UBS Conference 13 th 2011 Global Financial Services Conference New York, 11 May 2011 Agenda 1 1Q2011: On track for target 2 The new
Deutsche Bank Q4 & FY 2017 results
 Highlights Improved profitability despite revenue headwinds Reduced costs in 2017, but more work to do Maintained high levels of liquidity and CET1 capital, supported by capital raise Success in resolving
The Goldman Sachs Group, Inc. LIQUIDITY COVERAGE RATIO DISCLOSURE
 The Goldman Sachs Group, Inc. LIQUIDITY COVERAGE RATIO DISCLOSURE For the quarter ended December 31, 2018 TABLE OF CONTENTS Page No. Introduction 1 Liquidity Coverage Ratio 2 High-Quality Liquid Assets
Presentation to Investors and Analysts
 First Quarter 2018 Results Presentation to Investors and Analysts April 25, 2018 Disclaimer This material does not purport to contain all of the information that you may wish to consider. This material
INVESTOR PRESENTATION 2017 RESULTS
 INVESTOR PRESENTATION 2017 RESULTS 1 DISCLAIMER This presentation is not, and is not intended to be, an offer to sell any security or the solicitation of an offer to purchase any security. The following
JEFFERIES REPORTS FISCAL FOURTH-QUARTER 2014 FINANCIAL RESULTS; PURSUING STRATEGIC ALTERNATIVES FOR BACHE BUSINESS
 FOR IMMEDIATE RELEASE JEFFERIES REPORTS FISCAL FOURTH-QUARTER 2014 FINANCIAL RESULTS; PURSUING STRATEGIC ALTERNATIVES FOR BACHE BUSINESS NEW YORK, December 16, 2014 -- Jefferies Group LLC today announced
Balance sheet transformation Capital, funding and liquidity
 Balance sheet transformation Capital, funding and liquidity ING Investor Day Amsterdam 13 January 2012 Priorities in transitioning to Basel III 1 2 3 4 Strong capital generation and a conservative funding
3Q Interim Statement and Business Highlights
 3Q Interim Statement and Business Highlights 9 November 2011 Pierre Mariani, CEO Philippe Rucheton, CFO Disclaimer This presentation and the information contained herein are provided for information purposes
TD Bank Financial Group Delivers Strong 2004 Results Through Focused Strategies and Disciplined Approach To Capital
 4th Quarter 2004 News Release Twelve months ended October 31, 2004 TD Bank Financial Group Delivers Strong 2004 Results Through Focused Strategies and Disciplined Approach To Capital ANNUAL HIGHLIGHTS
Profit Announcement For the full year ended 30 June 2013
 Profit Announcement For the full year ended 30 June 2013 COMMONWEALTH BANK OF AUSTRALIA ACN 123 123 124 14 AUGUST 2013 FIND OUT MORE VIA OUR APP ASX Appendix 4E Results for announcement to the market (1)
Pillar 3 Disclosure (UK)
") MORGAN STANLEY INTERNATIONAL LIMITED Pillar 3 Disclosure (UK) As at 31 December 2009 1. Basel II accord 2 2. Background to PIllar 3 disclosures 2 3. application of the PIllar 3 framework 2 4. morgan stanley
MORGAN STANLEY INTERNATIONAL LIMITED Pillar 3 Disclosure (UK) As at 31 December 2009 1. Basel II accord 2 2. Background to PIllar 3 disclosures 2 3. application of the PIllar 3 framework 2 4. morgan stanley
Citizens Financial Group, Inc. Dodd-Frank Act Mid-Cycle Company-Run Stress Test Disclosure. July 6, 2015
 Citizens Financial Group, Inc. Dodd-Frank Act Mid-Cycle Company-Run Stress Test Disclosure July 6, 2015 The information classification of this document is Public. Page 1 Table of Contents 1. Introduction...
Jefferies A Global Investment Banking Firm
 Jefferies A Global Investment Banking Firm April 2015 Jefferies LLC Member SIPC Notes on Forward Looking Statements This document contains forward looking statements within the meaning of the safe harbor
GOLDMAN SACHS REPORTS EARNINGS PER COMMON SHARE OF $9.01 FOR 2017 EXCLUDING TAX LEGISLATION (1), EARNINGS PER COMMON SHARE WERE $19.
, EARNINGS PER COMMON SHARE WERE $19.") The Goldman Sachs Group, Inc. 200 West Street New York, New York 10282 GOLDMAN SACHS REPORTS EARNINGS PER COMMON SHARE OF $9.01 FOR 2017 EXCLUDING TAX LEGISLATION (1), EARNINGS PER COMMON SHARE WERE $19.76
The Goldman Sachs Group, Inc. 200 West Street New York, New York 10282 GOLDMAN SACHS REPORTS EARNINGS PER COMMON SHARE OF $9.01 FOR 2017 EXCLUDING TAX LEGISLATION (1), EARNINGS PER COMMON SHARE WERE $19.76
4Q 2017 And Full Year Earnings Review And 2018 Outlook
 4Q 2017 And Full Year Earnings Review And 2018 Outlook January 24, 2018 (Preliminary Results) FC1 Ford Credit Strategy ORIGINATE Support Ford and Lincoln sales Strong dealer relationships Full spread of
Basel III Pillar 3 Disclosures Report. For the Quarterly Period Ended December 31, 2015
 BASEL III PILLAR 3 DISCLOSURES REPORT For the quarterly period ended December 31, 2015 Table of Contents Page 1 Morgan Stanley... 1 2 Capital Framework... 1 3 Capital Structure... 2 4 Capital Adequacy...
The Goldman Sachs Group, Inc. LIQUIDITY COVERAGE RATIO DISCLOSURE
 The Goldman Sachs Group, Inc. LIQUIDITY COVERAGE RATIO DISCLOSURE For the quarter ended September 30, 2017 TABLE OF CONTENTS Page No. Introduction 1 Liquidity Coverage Ratio 2 High-Quality Liquid Assets
Morgan Stanley 2Q16 Fixed Income Investor Update. August 30, 2016
 Morgan Stanley 2Q16 Fixed Income Investor Update August 30, 2016 Notice The information provided herein may include certain non-gaap financial measures. The reconciliation of such measures to the comparable
Liquidity Coverage Ratio ( LCR ) For the quarter ended 31 Mar 2017
 For the quarter ended 31 Mar 2017") Liquidity Coverage Ratio ( LCR ) For the quarter ended 31 Mar 017 DBS Group Holdings Ltd Incorporated in the Republic of Singapore Company Registration Number: 19990115M The following disclosures for the
Liquidity Coverage Ratio ( LCR ) For the quarter ended 31 Mar 017 DBS Group Holdings Ltd Incorporated in the Republic of Singapore Company Registration Number: 19990115M The following disclosures for the
Second Quarter 2018 Earnings Results
 The Goldman Sachs Group, Inc. 200 West Street New York, New York 10282 Second Quarter Earnings Results Goldman Sachs Reports Second Quarter Earnings Per Common Share of $5.98 Solid performance across all
Fixed Income Investor Presentation. August 2, 2016
 Fixed Income Investor Presentation August 2, 206 Cautionary Note on Forward-Looking Statements This presentation may include forward-looking statements. These statements are not historical facts, but instead
Morgan Stanley 3Q15 Fixed Income Investor Call. November 3, 2015
 Morgan Stanley 3Q15 Fixed Income Investor Call November 3, 2015 Notice The information provided herein may include certain non-gaap financial measures. The reconciliation of such measures to the comparable
LIQUIDITY COVERAGE RATIO DISCLOSURE
 LIQUIDITY COVERAGE RATIO DISCLOSURE For the quarterly period ended December 31, 2018 Table of Contents Liquidity Coverage Ratio 1 High Quality Liquid Assets and other liquidity sources 3 Net Cash Outflows
Earnings presentation Financial year 2011 results
 AbuDhabiCommercial BankPJSC Earnings presentation Financial year 2011 results 1 Disclaimer This document has been prepared by Abu Dhabi Commercial Bank PJSC ( ADCB ) for information purposes only. The
Acquisition of Altamira Creating the undisputed leader in NPL and REO servicing in Southern Europe. January 8, 2019
 Acquisition of Altamira Creating the undisputed leader in NPL and REO servicing in Southern Europe January 8, 2019 Strategic Highlights of a Landmark Acquisition for dobank Altamira Asset Management Leading
Investor Presentation Third Quarter, August 28, 2007
 Investor Presentation Third Quarter, 2007 August 28, 2007 1 Caution Regarding Forward-Looking Statements This document includes forward-looking statements which are made pursuant to the safe harbour provisions
The UBI Banca Group Consolidated Results as at 30 th September th November 2016
 The UBI Banca Group Consolidated Results as at 30 th September 2016 11 th November 2016 Disclaimer This document has been prepared by Unione di Banche Italiane Spa ("UBI") for informational purposes only
(brief presentation)
") (brief presentation) DISCLAIMER This document is not an offer of securities for sale in the United States, Canada, Australia, Japan or any other jurisdiction. Securities may not be offered or sold in the
(brief presentation) DISCLAIMER This document is not an offer of securities for sale in the United States, Canada, Australia, Japan or any other jurisdiction. Securities may not be offered or sold in the
THE GOLDMAN SACHS GROUP, INC. (Exact name of registrant as specified in its charter)
") UNITED STATES SECURITIES AND EXCHANGE COMMISSION Washington, D.C. 20549 FORM 8-K CURRENT REPORT Pursuant to Section 13 or 15(d) of the Securities Exchange Act of 1934 Date of Report (Date of earliest event
UNITED STATES SECURITIES AND EXCHANGE COMMISSION Washington, D.C. 20549 FORM 8-K CURRENT REPORT Pursuant to Section 13 or 15(d) of the Securities Exchange Act of 1934 Date of Report (Date of earliest event
Third Quarter 2018 Earnings Results
 The Goldman Sachs Group, Inc. 200 West Street New York, New York 10282 Third Quarter Earnings Results Goldman Sachs Reports Third Quarter Earnings Per Common Share of $6.28 We delivered solid results in
- Net income of EUR 393 million, due to improved earnings, realized gains on investments and lower impairments
 Société : Aegon Compartiment : Autre ISIN : NL0000303709 Diffuseur : PR Newswire Type de document : Communiqués d'information permanente / Résultats et CA Date de publication : 25/02/2010 02:00 Reports
THE GOLDMAN SACHS GROUP, INC.
 UNITED STATES SECURITIES AND EXCHANGE COMMISSION Washington, D.C. 20549 FORM 8-K CURRENT REPORT Pursuant to Section 13 or 15(d) of the Securities Exchange Act of 1934 Date of Report (Date of earliest event
2018 Annual Stress Test Disclosure Dodd-Frank Wall Street Reform and Consumer Protection Act
 Citi 2018 2018 Annual Stress Test Disclosure Dodd-Frank Wall Street Reform and Consumer Protection Act June 21, 2018 Overview 2018 Annual Stress Test In February 2018, the Federal Reserve Board (FRB) launched
GOLDMAN SACHS REPORTS SECOND QUARTER EARNINGS PER COMMON SHARE OF $4.10. Highlights
 The Goldman Sachs Group, Inc. 200 West Street New York, New York 10282 GOLDMAN SACHS REPORTS SECOND QUARTER EARNINGS PER COMMON SHARE OF $4.10 NEW YORK, July 15, 2014 - The Goldman Sachs Group, Inc. (NYSE:
Deutsche Bank. Chief Financial Officer. Frankfurt / New York / Boston / The Netherlands 3 7 November 2008
 Deutsche Bank Stefan Krause Chief Financial Officer Frankfurt / New York / Boston / The Netherlands 3 7 November 2008 Agenda 1 Third quarter 2008 results 2 Key current issues 3 Risk and capital management
Q109. Russ Robertson. Defining great customer experience. Financial Results. Interim Chief Financial Officer. March 3, 2009
 Defining great customer experience. Q109 Financial Results Russ Robertson Interim Chief Financial Officer March 3, 2009 Forward Looking Statements Caution Regarding ForwardLooking Statements Bank of Montreal
High Yield. LarrainVial Seminario Mercados Globales - Ideas Hans Stoter Head of Credit Investments ING Investment Management
 High Yield Hans Stoter Head of Credit Investments ING Investment Management LarrainVial Seminario Mercados Globales - Ideas 2010 Santiago, Lima May 11 13, 2010 What is High Yield Corporate debt with rating
FOURTH QUARTER 2011 EARNINGS RELEASE
 FOURTH QUARTER 2011 EARNINGS RELEASE ROYAL BANK OF CANADA REPORTS FOURTH QUARTER AND RECORD 2011 RESULTS All amounts are in Canadian dollars and on a continuing basis unless otherwise noted and are based
Fact Book January June 2011
 Fact Book January June STOCKHOLM 14 JULY SEB Fact Book January June N Table of contents Table of contents...2 About SEB...3 SEB history...3 Financial targets...3 Organisation...4 Corporate Governance...5