|
|
|
- Cleopatra Jefferson
- 5 years ago
- Views:
Transcription
1
2
3
4
5
6
7
8
9 NSE Code: ISEC BSE Code: Press Release 9MFY19 Performance Highlights 1.2 million active clients, +10% Vs 9MFY lakh new clients acquired Revenue at `1,299 crore; PAT at ` 369 crore PAT margin at 28%; Absolute cost down by 1% Return on Equity (RoE) continued to remain robust at ~ 55% (annualized) Mumbai, Jan 14, 2019 ICICI Securities (ISec), a part of the ICICI Group and a leading investment services firm in India, today announced financial results for nine month period ending December 31 st, 2018 (9MFY19). For 9MFY19, the company reported revenue of `1,299 crore against `1,351 crore in the year ago period. Profit After Tax (PAT) stood at `369 crore against `402 crore in 9MFY18. During the fiscal, there were several short term headwinds like volatile market, NBFC liquidity crisis, frozen state of primary market, and significant regulatory changes, which impacted the overall business sentiment and performance. Commenting on the performance of the company Ms. Shilpa Kumar, Managing Director and Chief Executive Officer, said, As the fundamental India growth story continues, we believe that the structural opportunity in the financial savings market remains attractive. Our long term growth strategy is two pronged increased customer acquisition and increased engagement with them. With that in mind, we continue to invest in newer products and services across all our business lines and we are fully committed to play a leading role in India s financialisation journey.
10 ISec has rolled out several new product and process innovations with a view to increase its customer acquisition and engagement. The company has relaunched its digitized customer acquisition process T20 -- under which a customer can be on-boarded in 20 mins and begin trading immediately after that. ISec launched a revolutionary new offering eatm orders under which retail investors get upto Rs 50,000 per day from their share sale proceeds transferred to their accounts within 30 minutes of trade (vs T+2 settlement cycle followed normally) at no extra cost. In order to tap the potential in tier 2/3 cities, ISec has launched a mobile app for its Business Partners, numbering ~6,500, which will help in better service delivery by them and deepen their client engagement and improve scalability. For its Private Wealth clients, an offering called Direct2U under the Investment Advisory Services has been launched which besides allowing them to invest in direct MF schemes for a fee, also provides process-based risk assessment, defined asset allocation strategies and active investment advisory. In order to further enhance client engagement, the company is looking at providing more health insurance options on its platform and has already tied-up with a standalone health insurance specialist company. In the Broking segment, ISec has over 43 lac operational accounts, of which over 3.2 lac were added during the current fiscal. Restrictions on saving of Aadhaar data impacted the pace of new client acquisition. Overall active clients increased by 10% to 1.2 million in 9MFY19 from the year ago period. ISec s equity ADTO growth of 10% outpaced the 4% growth for the industry during the period. Total brokerage revenue (excluding interest income) stood at `704 crore in 9MFY19 against `749 crore in 9MFY18. Distribution revenue in 9MFY19 stood at `351 crore which is an improvement of 7% from the year ago period. Distribution business contributed 27% to our overall revenue in 9MFY19, up from 24% in 9MFY18.
11 Mutual Fund distribution remains a strong contributor to this segment, accounting for 60% of distribution revenue in 9MFY19, against 61% in 9MFY18. Disallowing payment of upfront MF commission to distributor had a significant impact on the company s distribution business. Average AUM of the mutual funds distributed by the company increased by 19% to `346 billion in 9MFY19 against 14% for the industry. ISec is India s second largest nonbank MF distributor by revenue with a strong offline presence through a network of ~200 ICICIdirect branches in 75+ cities, a nationwide network of 6,500+ sub-brokers, authorized persons, IFAs & IAs, and presence in 3,100+ ICICI Bank branches. In terms of the notification issued by the Ministry of Corporate Affairs, the Company has adopted Indian Accounting Standards (referred to as Ind AS ) notified under the Companies (Indian Accounting Standards) Rules, 2015 with effect from April 1, Results for the period ended December 31, 2018 are in compliance with Indian Accounting Standards (IND AS).The results for the period ended December 31, 2017 have been restated to comply with IND AS. About ICICI Securities ICICI Securities Limited (ISec) is a subsidiary of ICICI Bank Ltd. The company began its operation in May 1995 and continues to grow its operation through expanding its client base and providing different type of services. ICICI Securities Ltd is a technology-based firm offering a wide range of financial services including investment banking, institutional broking, retail broking, private wealth management, and financial product distribution. ICICI Securities sees its role as 'Creating Informed Access to the Wealth of the Nation' for its diversified set of clients that include corporates, financial institutions, high net-worth individuals and retail investors. ICICI Securities is listed on National Stock Exchange (NSE) and the Bombay Stock Exchange (BSE). For details, visit: Disclaimer Except for the historical information contained herein, statements in this release which contain words or phrases such as 'will', expected to, etc., and similar expressions or variations of such expressions may constitute 'forward-looking statements'. These forward-looking statements involve a number of risks, uncertainties and other factors that could cause actual results, opportunities and growth potential to differ materially from those suggested by the forward-looking statements. These risks and uncertainties include, but are not limited to, the actual growth in broking business and other financial services in the countries that we operate or where a material number of our customers reside, our ability to successfully implement our strategy, including our use of the Internet and other technology our exploration of merger and acquisition opportunities, our ability to integrate mergers or acquisitions into our operations and manage the risks associated with such acquisitions to achieve our strategic and financial objectives, our growth and expansion in domestic and overseas markets, technological changes, our ability to market new products, the outcome of any legal, tax or regulatory
12 proceedings in India and in other jurisdictions we are or become a party to, the future impact of new accounting standards, our ability to implement our dividend policy, the impact of changes in insurance regulations and other regulatory changes in India and other jurisdictions on us. ICICI Securities Limited undertakes no obligation to update forward-looking statements to reflect events or circumstances after the date thereof. For further details, contact: ICICI Securities Ltd. Rabin Ghosh rabin.ghosh@icicisecurities.com Adfactors PR Ltd. Rasika Badshah rasika.badshah@adfactorspr.com
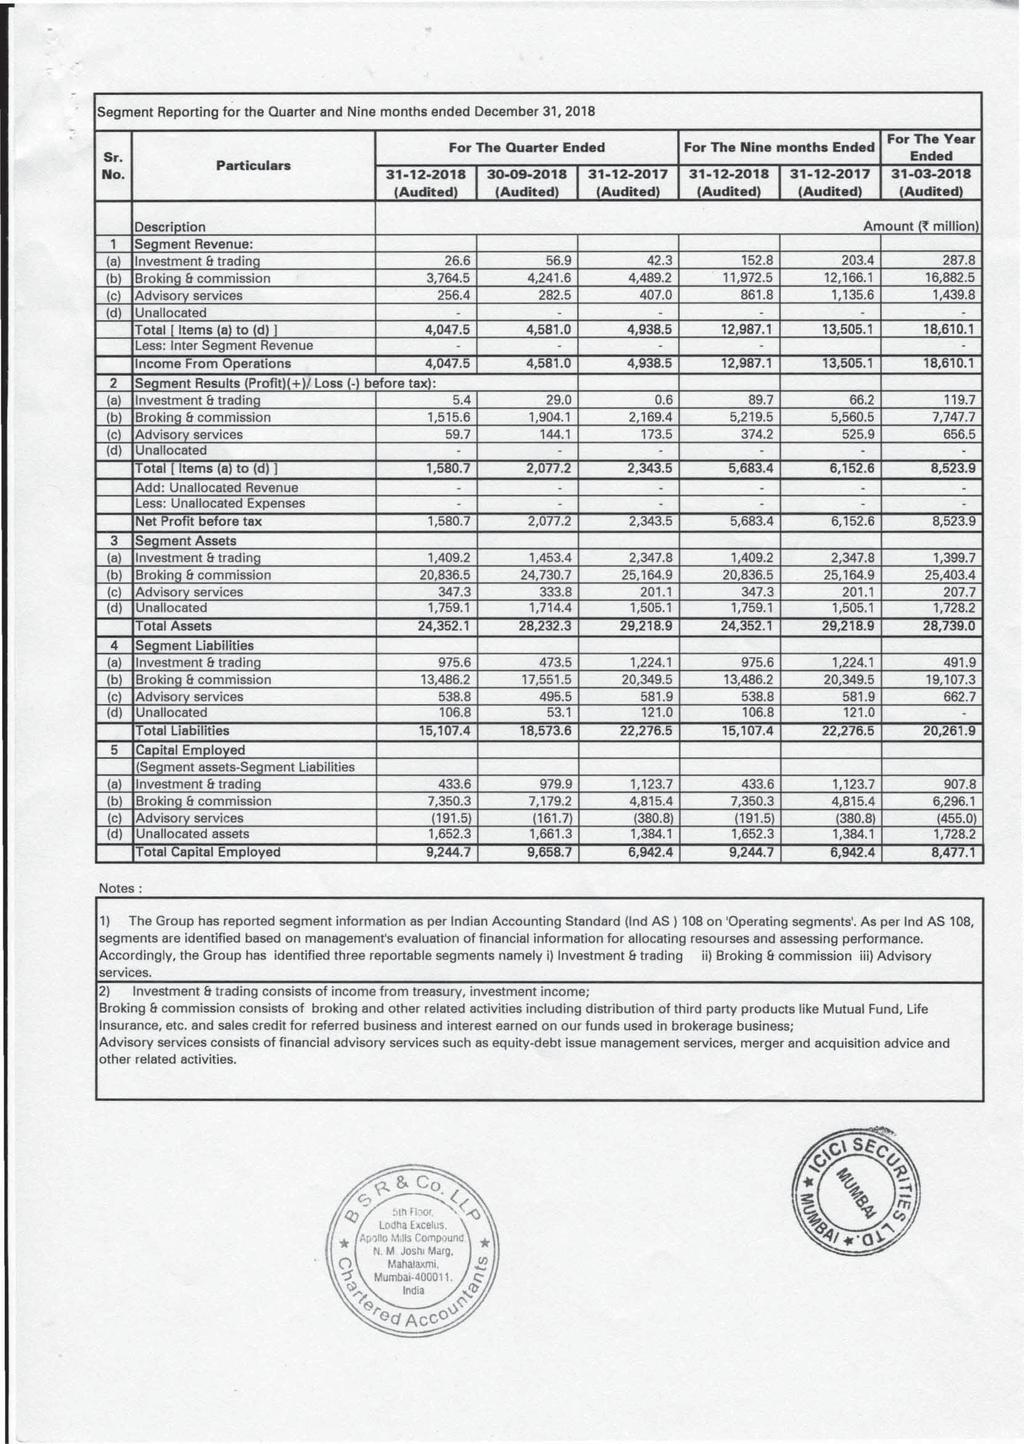
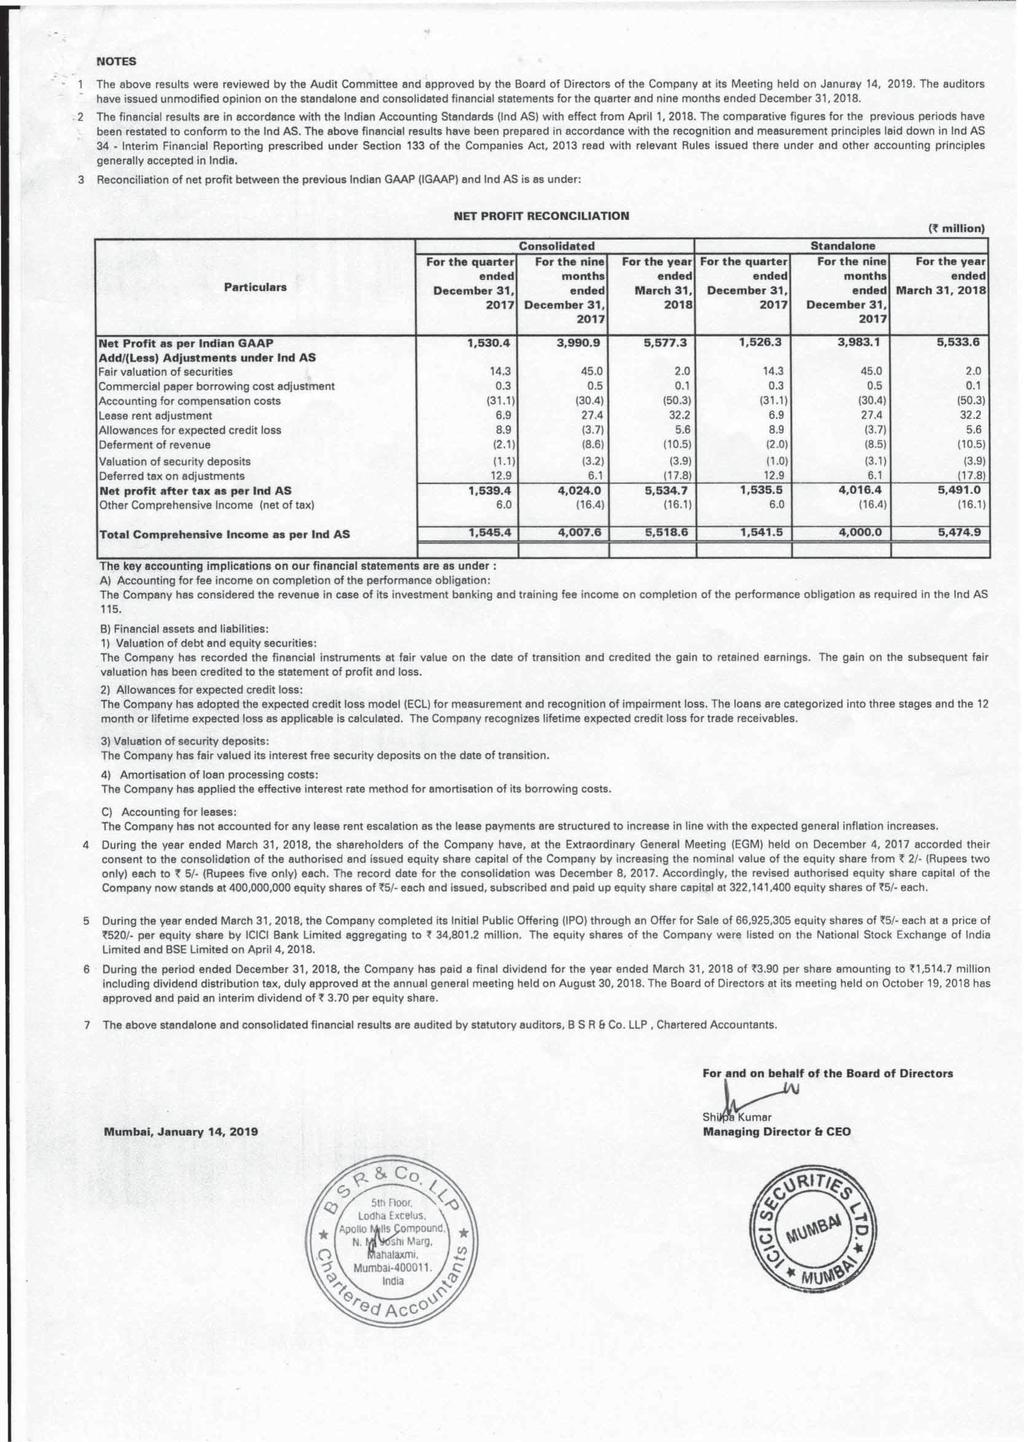
13 January 14, 2019 PERFORMANCE FOR THE NINE MONTH ENDED DECEMBER 31, 2018 Financial performance review Consolidated revenues for 9M-FY2019 declined by 4% Y-o-Y from ` 13,505.1 million to ` 12,987.1 million. Consolidated profit after tax decreased by 8% from ` 4,024.0 million in 9M-FY18 to ` 3,692.0 million in 9M-FY19 (` in million) Profit & Loss Account 9M-FY18 9M-FY19 % Change Brokerage income 7, ,040.3 (6.0) Income from services 4, ,477.6 (4.5) Interest and other operating income 1, , Profit/(loss) on sale of securities (net) (52.1) Total income 13, ,987.1 (3.8) Employee benefits expenses 4, , Operating expenses 1, (14.3) Finance costs (8.7) Depreciation (4.0) Other expenses 1, , Total expenses 7, ,303.7 (0.7) Profit before tax 6, ,683.4 (7.6) Tax expense 2, ,991.4 (6.4) Profit after tax 4, ,692.0 (8.3) Other comprehensive income/(losses), net of taxes (16.4) (21.4) 30.5 Total comprehensive income for the period 4, ,670.6 (8.4) (` in million) Balance Sheet March December % Change 31, , 2018 Financial assets 25, ,742.7 (16.3) Non-financial assets 2, ,609.4 (5.6) Total assets 28, ,352.1 (15.3) Financial liabilities 14, ,343.4 (35.6) Non-financial liabilities 5, , Equity 8, , Total liabilities 28, ,352.1 (15.3)
14 The performance highlights for 9M-FY2019 are given below: 6% decrease in brokerage income at ` 7,040.3 million in 9M-FY2019 due to decrease in equity delivery volume partially compensated by increase in derivative volumes. The income from services decreased from ` 4,690.7 million in 9M-FY2018 to ` 4,477.6 million in 9M-FY2019 primarily on account of decrease in corporate finance fees partially offset by increase in third party distribution fees. o Revenue from Mutual fund distribution is the major contributor in our distribution income. Our income from distribution of mutual fund increased at slower rate due to regulatory changes in the commission structure and reduction of TER leading to slow growth of distribution income. o Our Corporate finance income declined due to muted primary market with funds mobilization/ raised decreasing by 77%. Interest income increased from ` 1,134.1 million in 9M-FY2018 to ` 1,377.8 million in 9M-FY2019 primarily due to increase in interest income on fixed deposits and margin funding facility. Income from trading in securities decreased from ` million in 9M-FY2018 to ` 91.4 million in 9M-FY2019 primarily due to decrease in treasury gains on derivatives and mutual funds. Staff cost was largely flat at ` 4,217.1 million in 9M-FY2019 compared to ` 4,178.6 million in 9M-FY2018 Operating expense decreased from ` 1,103.7 million in 9M-FY2018 to ` million in 9M-FY2019 primarily due to decrease in depository transaction charges and commission expenses. Other expenses increased from ` 1,600.3 million in 9M-FY2018 to ` 1,705.7 million in 9M-FY2019 primarily on account of reversal of cenvat credit in 9M-FY2018 and increase in royalty expense and software development expense in 9M-FY2019. Finance cost decreased by 9% from ` million in 9M-FY2018 to ` million in 9M-FY2019 on account of decrease in average borrowing from commercial papers. Total assets decreased from ` 28,739.0 million at March 31, 2018 to ` 24,352.1 million at December 31, 2018 primarily on account of reduction in financial assets. Financial assets decreased from ` 25,975.6 million at March 31, 2018 to ` 21,742.7 million at December 31, 2018 primarily due to reduction in fixed deposits, margin trading facility book and reduction in trade receivables which comprises of broking debtors and fee debtors. Financial liabilities decreased from ` 14,511.8 million at March 31, 2018 to ` 9,343.4 million at December 31, 2018 decrease in commercial paper borrowings and trade creditors.
15 Disclaimer Except for the historical information contained herein, statements in this release which contain words or phrases such as 'will', expected to, etc., and similar expressions or variations of such expressions may constitute 'forward-looking statements'. These forward-looking statements involve a number of risks, uncertainties and other factors that could cause actual results, opportunities and growth potential to differ materially from those suggested by the forward-looking statements. These risks and uncertainties include, but are not limited to, the actual growth in broking business and other financial services in the countries that we operate or where a material number of our customers reside, our ability to successfully implement our strategy, including our use of the Internet and other technology our exploration of merger and acquisition opportunities, our ability to integrate mergers or acquisitions into our operations and manage the risks associated with such acquisitions to achieve our strategic and financial objectives, our growth and expansion in domestic and overseas markets, technological changes, our ability to market new products, the outcome of any legal, tax or regulatory proceedings in India and in other jurisdictions we are or become a party to, the future impact of new accounting standards, our ability to implement our dividend policy, the impact of changes in insurance regulations and other regulatory changes in India and other jurisdictions on us. ICICI Securities Limited undertakes no obligation to update forwardlooking statements to reflect events or circumstances after the date thereof. This release does not constitute an offer of securities. For investor queries please call Harvinder Jaspal/Vipul Mewada or IR@icicisecurities.com 1 billion/million = 100 crore / 10 Lakhs
Performance review 9M-FY2019. January 14, 2019
 Performance review 9M-FY2019 January 14, 2019 Natural beneficiary of transforming savings environment Leading equity broker in India 1 powered by ICICIdirect Strong online presence aided by pan India distribution
Sub: Outcome of the Board Meeting held on October 19,2018
 (I,C,C, Securities October 19,2018 National Stock Exchange of India Limited Listing Department Exchange Plaza, C-1, Block G, Bandra Kurla Complex, Bandra (E), Mumbai - 400 051 BSE Limited Listing Department
News Release January 21, Performance Review Quarter ended December 31, 2009
 News Release January 21, 2010 Performance Review Quarter ended December 31, 6% sequential increase in standalone profit after tax to Rs. 1,101 crore for the quarter ended December 31, from Rs. 1,040 crore
Sub: Outcome of earnings call held for results for the quarter & nine months ended December 31,2018
 ICICI Securities January 14,2019 National Stock Exchange of India Limited Listing Department Exchange Plaza, C-1, Block G, Sandra Kurla Complex, Sandra (E), Mumbai - 400 051 Dear Sir/Madam, SSE Limited
Performance review Q1-FY2019
 Performance review Q1-FY2019 July 23, 2018 ICICI Securities: Natural beneficiary of transforming savings environment Largest equity broker in India 1 powered by ICICIdirect Strong online presence aided
Performance review FY2018
 Performance review FY2018 April 14, 2018 ICICI Securities: Natural beneficiary of transforming savings environment Largest equity broker in India * powered by ICICIdirect Strong online presence aided by
Performance for the period ended December 31, 2016
 News release January 24, 2017 BSE Code: 540133 NSE Code: ICICIPRULI Performance for the period ended December 31, 2016 ~ New business Annualised Premium Equivalent (APE*) increased by 27.6% to ` 44.58
Business presentation. December 4, 2018
 Business presentation December 4, 2018 ISEC Today Largest equity broker in India 1 powered by ICICIdirect Strong online presence aided by pan India distribution 2nd largest non - bank mutual fund distributor
News Release January 31, Performance Review Quarter ended December 31, 2012
 News Release January 31, 2013 Performance Review Quarter ended December 31, 2012 Consolidated return on equity (annualised) of 15.7% for the quarter ended December 31, 2012 (Q3-2013) 30% year-on-year increase
News Release April 24, Performance Review Quarter and year ended March 31, 2010
 News Release April 24, 2010 Performance Review Quarter and year ended March 31, 2010 35% year-on-year increase in standalone profit after tax to Rs. 1,006 crore for the quarter ended March 31, 2010 from
News Release October 30, Performance Review: Quarter ended September 30, 2014
 News Release October 30, Performance Review: Quarter ended September 30, 15% year-on-year increase in standalone profit after tax to ` 2,709 crore (US$ 439 million) for the quarter ended September 30,
Performance Review Quarter ended June 30, 2013
 News Release July 31, 2013 Performance Review Quarter ended June 30, 2013 32% year-on-year increase in consolidated profit after tax to ` 2,747 crore (US$ 463 million) for the quarter ended June 30, 2013
News Release January 24, Performance Review Quarter ended December 31, 2008
 News Release January 24, 2009 Performance Review Quarter ended December 31, 2008 Profit after tax of Rs. 1,272 crore; 25% increase over second quarter 23% year-on-year increase in operating profit for
ICICI Prudential Life declares results for Nine months ended December 31, 2018
 News Release January 22, 2019 NSE Code: ICICIPRULI BSE Code: 540133 ICICI Prudential Life declares results for Nine months ended December 31, 2018 Value of New Business (VNB) registers a growth of 18.6%
News Release May 3, Performance Review: Quarter ended March 31, 2017
 News Release May 3, 2017 Performance Review: Quarter ended March 31, 2017 189% increase in standalone profit after tax from ` 702 crore (US$ 108 million) for the quarter ended March 31, 2016 (Q4-2016)
Standalone profit crosses ` 10,000 crore
 News Release April 27, 2015 Standalone profit crosses ` 10,000 crore 14% year-on-year increase in standalone profit after tax to ` 11,175 crore (US$ 1.8 billion) for the year ended March 31, 2015 (FY2015)
Performance Review Quarter ended December 31, 2011
 News Release January 31, 2012 Performance Review Quarter ended December 31, 2011 29% year-on-year increase in consolidated profit after tax to ` 5,833 crore (US$ 1.1 billion) for the nine months ended
News Release November 7, Performance Review: Quarter ended September 30, 2016
 News Release November 7, 2016 Performance Review: Quarter ended September 30, 2016 21% year-on-year growth in retail portfolio; domestic advances grew by 16% year-on-year at September 30, 2016 18% year-on-year
News Release January 31, Performance Review: Quarter ended December 31, 2016
 News Release January 31, 2017 Performance Review: Quarter ended December 31, 2016 30% year-on-year growth in savings account deposits; Current and savings account (CASA) ratio at 49.9% at December 31,
News Release April 26, Performance Review Year ended March 31, 2008: ICICI Bank s profit after tax crosses US$ 1.0 billion
 News Release April 26, 2008 Performance Review Year ended March 31, 2008: ICICI Bank s profit after tax crosses US$ 1.0 billion The Board of Directors of ICICI Bank Limited (NYSE: IBN) at its meeting held
News Release July 29, Performance Review: Quarter ended June 30, 2016
 News Release July 29, 2016 Performance Review: Quarter ended June 30, 2016 22% year-on-year growth in retail portfolio; domestic advances grew by 17% year-on-year at June 30, 2016 18% year-on-year growth
Earnings Conference Call Quarter and Half Year ended September 30, 2018 (Q2 & H1 - FY2019) October 19, 2018
 October 19, 2018") Earnings Conference Call Quarter and Half Year ended September 30, 2018 (Q2 & H1 - FY2019) MANAGEMENT: MS. SHILPA KUMAR MANAGING DIRECTOR & CHIEF EXECUTIVE OFFICER MR. HARVINDER JASPAL - CHIEF FINANCIAL
Earnings Conference Call Quarter and Half Year ended September 30, 2018 (Q2 & H1 - FY2019) MANAGEMENT: MS. SHILPA KUMAR MANAGING DIRECTOR & CHIEF EXECUTIVE OFFICER MR. HARVINDER JASPAL - CHIEF FINANCIAL
VNB growth of 93.1% Embedded Value rises to ` billion
 News release: April 24, 2018 NSE Code: ICICIPRULI BSE Code: 540133 VNB growth of 93.1% Embedded Value rises to ` 187.88 billion ICICI Prudential Life Insurance announces a strong full year financial performance.
News Release October 30, Performance Review: Quarter ended September 30, 2015
 News Release October 30, Performance Review: Quarter ended September 30, 12% year-on-year increase in standalone profit after tax to ` 3,030 crore (US$ 462 million) for the quarter ended September 30,
News Release July 31, 2014
 News Release July 31, 2014 Performance Review: Quarter ended June 30, 2014 17% year-on-year increase in standalone profit after tax to ` 2,655 crore (US$ 441 million) for the quarter ended June 30, 2014
Continued to perform on core operating parameters
 News Release May 7, 2018 Performance Review: Quarter ended March 31, 2018 Strong balance sheet growth Total domestic loan growth at 15% year-on-year at March 31, 2018 driven by retail Retail loans grew
News Release April 25, 2009
 News Release April 25, 2009 Performance Review Year ended March 31, 2009 Dividend of Rs. 11 per share proposed, same as previous year Profit before tax of Rs. 5,117 crore for the year ended March 31, 2009
Performance Review Quarter ended September 30, 2013
 News Release October 25, 2013 Performance Review Quarter ended September 30, 2013 20% year-on-year increase in standalone profit after tax to ` 2,352 crore (US$ 376 million) for the quarter ended September
IPO Report ICICI SECURITIES LTD SUBSCRIBE. Valuation. IPO Details. Research Analyst : Astha Jain
 IPO Report ICICI SECURITIES LTD SUBSCRIBE IPO Details Issue Date 22 nd Mar-26 th Mar 2018 Price Band 519-520/Share Bid Lot 28 & in multiplethereof Face Value Rs 5/Share Listing BSE, NSE Offer For Sale
News Release July 26, 2008
 News Release July 26, 2008 Performance Review Quarter ended June 30, 2008 The Board of Directors of ICICI Bank Limited (NYSE: IBN) at its meeting held at Vadodara today, approved the audited accounts of
News Release July 27, 2018
 News Release July 27, 2018 Performance Review: Quarter ended June 30, 2018 The core operating profit (profit before provisions and tax, excluding treasury income) grew by 17% year-on-year to 5,042 crore
News Release October 27, Performance Review: Quarter ended September 30, 2017
 News Release October 27, 2017 Performance Review: Quarter ended September 30, 2017 Decline in gross NPA additions to 4,674 crore (US$ 716 million) in the quarter ended September 30, 2017 (Q2-2018) compared
 News release: April 24, 2018 NSE Code: ICICIPRULI BSE Code: 540133 VNB growth of 93.1% Embedded Value rises to ` 187.88 billion ICICI Prudential Life Insurance announces a strong full year financial performance.
General Insurance Corporation of India
 IPO Note: General Insurance Corporation of India Industry: Insurance Reco: Subscribe Date: October 05, 2017 Issue Snapshot Company Name General Insurance Corporation of India Issue Opens October 11, 2017
News Release October 26, Performance Review: Quarter ended September 30, 2018
 News Release October 26, 2018 Performance Review: Quarter ended September 30, 2018 The core operating profit (profit before provisions and tax, excluding treasury income) grew by 10% year-on-year to 5,285
Sasken Q3 FY07 Revenues at Rs 131 crore up 73% YoY PAT increases by 71% YoY
 Media Release For Immediate Release Sasken Q3 FY07 Revenues at Rs 131 crore up 73% YoY PAT increases by 71% YoY Bangalore, January 24, 2007: Sasken Communication Technologies Limited (BSE:532663, NSE:SASKEN),
Performance and Outlook
 Performance and Outlook November 2017 NSE: AXISBANK BSE: 532215 LSE (GDR): AXB 1 Safe Harbor Except for the historical information contained herein, statements in this release which contain words or phrases
Sub: Intimation on the outcome of the Board meeting dated 18 th January 2013
 January 18, 2013 NSE / BSE NSDL / CDSL / WDM Dear Sirs, Sub: Intimation on the outcome of the Board meeting dated 18 th January 2013 Kindly refer our letters dated 9 th January 2013 and 15 th January 2013,
News Release January 30, Performance Review: Quarter ended December 31, 2018
 News Release January 30, 2019 Performance Review: Quarter ended December 31, 2018 Core operating profit (profit before provisions and tax, excluding treasury income) grew by 14% year-on-year to 5,667 crore
1. Mr. V P Mahendra, Director retired as a Director of the Company
 July 28, 2011 NSE / BSE NSDL / CDSL / WDM-NSE Dear Sir, We wish to inform you of the following changes in the constitution of the Board of directors of the Company approved at the 33 rd annual general
India Infoline Limited Press Release For immediate publication
 India Infoline Limited Press Release For immediate publication Mumbai, India January 29, 2014 IIFL Consolidated 9MFY14 Net Profit at 197 Cr, up 3% yoy; Income at 2,050 Cr, up 6% yoy Announces 3 per share
ICICI Securities IPO A Direct Purchase
 A quality report by JainMatrix Investments ICICI Securities IPO A Direct Purchase Large Cap: Rs. 16,750 cr. Mkt cap Industry Stock Broking Date 24 th Mar; IPO Opens 22-26 th Mar at Rs. 519-520 Valuations:
 SEARCHABLE FORMAT SI. No. (` in Lakhs) Three months ended/ As at Year ended/ As at March 31, 2018 December 31, 2017 March 31, 2017 March 31, 2018 March 31, 2017 (Audited) (Unudited) (Audited) (Audited)
News Release July 29, 2011
 News Release July 29, 2011 Performance Review Quarter ended June 30, 2011 53% year-on-year increase in consolidated profit after tax to ` 1,667 crore (US$ 373 million) for the quarter ended June 30, 2011
Sasken Q4 FY08 Revenues at Rs crores up 11% Quarter on Quarter
 Media Release FOR IMMEDIATE RELEASE Sasken Q4 FY08 Revenues at Rs 157.3 crores up 11% Quarter on Quarter Bangalore, April 18, 2008: Sasken Communication Technologies Limited (BSE:532663, NSE:SASKEN), a
CLSA Investor forum. September 14, 2017
 CLSA Investor forum September 14, 2017 Agenda Opportunity Industry and Competitive landscape Company strategy and performance 2 Agenda Opportunity Industry and Competitive landscape Company strategy and
JM Financial s consolidated revenue is up by 41% and consolidated net profit is up by 18 % for Q2 FY 17
 JM Financial s consolidated revenue is up by 41% and consolidated net profit is up by 18 % for Q2 FY 17 Mumbai, October 28, 2016: The Board of Directors of, at its meeting held today, approved the unaudited
Quarter ended September 30, 2018 Results update. Emkay Global Financial Services Ltd.
 Quarter ended September 30, 2018 Results update Emkay Global Financial Services Ltd. Safe Harbor This presentation and the following discussion may contain forward looking statements by Emkay Global Financial
PRESS RELEASE. Results at a Glance
 PRESS RELEASE AXIS BANK ANNOUNCES FINANCIAL RESULTS FOR THE QUARTER AND NINE-MONTHS ENDED 31 st DECEMBER 2017 Results at a Glance Financial performance: o Q3FY18 PAT up 25% YOY & 68% QOQ to `726 crores;
BSE Ltd (BSE) -New Initiatives to drive growth
 -New Initiatives to drive growth") BSE Ltd (BSE) -New Initiatives to drive growth BSE Ltd (BSE) 18-06-2018 Recommendation : Buy Strong brand recognition CMP : Rs 862 Target : NA % Allocation : 5% Sector : MISC Sensex : 35634 NSE code :
BSE Ltd (BSE) -New Initiatives to drive growth BSE Ltd (BSE) 18-06-2018 Recommendation : Buy Strong brand recognition CMP : Rs 862 Target : NA % Allocation : 5% Sector : MISC Sensex : 35634 NSE code :
FINANCIAL RESULTS FY17-18
 Investor Presentation FINANCIAL RESULTS FY17-18 MUMBAI 8 th May 2018 A leading Financial Services Conglomerate Table of Contents 1 Overview Pg. 3-6 2 Business-wise Performance Pg. 7-35 3 Consolidated Financials
HDFC Standard Life Insurance Company Ltd.
 IPO Note: HDFC Standard Life Insurance Company Ltd. Industry: Life Insurance Recommendation: Subscribe Date: November 06, 2017 Issue Snapshot Company Name HDFC Standard Life Insurance Company Ltd. Issue
ICICI Prudential Life Insurance Company Limited OFFER FOR SALE 14 - JUNE
 ICICI Prudential Life Insurance Company Limited OFFER FOR SALE 14 - JUNE - 2018 OFFER BACKGROUND The ICICI Bank Ltd (Promoter / Promoter Group) has submitted to BSE a copy of proposed offer for sale of
Q3FY15 at Rs.1382crore. 9MFY15 at Rs.3321crore. Q3FY15 at Rs.347 crore. 9MFY15 at Rs.371crore.
 Sales* Q3FY15 at Rs.1382crore. 9MFY15 at Rs.3321crore. Adj. EBITDA* Q3FY15 at Rs.463 crore. 9MFY15 at Rs.608 crore. Margins at 33.5% for Q3FY15 compared to 19.5% in Q3FY14 and at 18.3% for 9MFY15 compared
OFS: Rs. 82 bn. Rs. 700bn at upper price band JM Financial, Axis Capital, BNP Paribas, Citigroup, Deutsche, ICICI Sec., Kotak, SBI Cap.
 SBI Life Insurance Co. Ltd. - Best placed amongst peers in Life insurance industry but expensively valued - SUBSCRIBE for long term.. SBI Life Insurance Company Limited was incorporated at Mumbai on October
ICICI Securities. Investment Rationale. Objects of the issue Offer For Sale (OFS) (INR Mn) 40170
 (INR Mn) 40170") March 21, 2018 IPO - te ICICI Securities Recommendation: SUBSCRIBE ICICI Securities is a leading technology-based securities firm in India that offers a wide range of financial services including brokerage,
March 21, 2018 IPO - te ICICI Securities Recommendation: SUBSCRIBE ICICI Securities is a leading technology-based securities firm in India that offers a wide range of financial services including brokerage,
Sales (up by 13%) EBITDA. EBITDA (up by Rs. 108 crore) PAT KEY INDICATORS. before R&D. Q1FY19 : Rs.1,008 crore vs Rs 891 crore in Q1FY18
 EBITDA. EBITDA (up by Rs. 108 crore) PAT KEY INDICATORS. before R&D. Q1FY19 : Rs.1,008 crore vs Rs 891 crore in Q1FY18") Sales (up by 13%) Q1FY19 : Rs.1,008 crore vs Rs 891 crore in Q1FY18 EBITDA before R&D Q1FY19 : Rs. 90 crore vs Rs (7) crore in Q1FY18 EBITDA (up by Rs. 108 crore) Q1FY19 : Rs. 29 crore vs Rs (79) crore
Sales (up by 13%) Q1FY19 : Rs.1,008 crore vs Rs 891 crore in Q1FY18 EBITDA before R&D Q1FY19 : Rs. 90 crore vs Rs (7) crore in Q1FY18 EBITDA (up by Rs. 108 crore) Q1FY19 : Rs. 29 crore vs Rs (79) crore
Sales EBITDA EBITDA PAT KEY INDICATORS. before R&D. Q3FY19 : Rs.1,046 crore vs Rs.1,005 crore in PY. 9MFY19 : Rs.3,179 crore vs Rs.
 Sales Q3FY19 : Rs.1,046 crore vs Rs.1,005 crore in PY 9MFY19 : Rs.3,179 crore vs Rs.2,919 crore in PY EBITDA before R&D Q3FY19 : Rs.98 crore vs Rs.107 crore in PY 9MFY19: Rs.322 crore vs Rs.185 crore in
Amrapali Capital & Fin. Ser. Ltd.
 Equitymaster Agora Research Private Limited 4 April, 2014 Market data Current price* Market cap * Face value 200 150 100 50 Amrapali Capital S&P BSE SME IPO Rs 44.1 (BSE) Rs 431.2 m Rs10 BSE Code 536737
Q2 FY17 Q2 FY16 YOY Q1 FY17
 For immediate release RBL Bank H1 Net Profit up by 61.76% at Rs.205.85 crore (before exceptional item) on a YoY basis Operating Profit up by 73.63% to Rs.403.55 crore on a YoY basis Capital Adequacy Ratio
Performance Analysis:
 Performance Analysis: Q3 FY 2016 (April December 2015) February 13, 2016 2016 Bank of Baroda. All Rights Reserved 1 Bank of Baroda: Our Key Strengths Bank of Baroda is a 107 years old State-owned Bank
V-Guard Industries Ltd 9 th June, 2012
 Company Report BROKING DEPOSITORY DISTRIBUTION FINANCIAL ADVISORY V-Guard Industries Ltd 9 th June, 2012 CMP Rs.215.00 The V-Guard Group has emerged as one of the most trusted brand in India. VGIL plans
SUBSCRIBE. IPO Report HDFC ASSET MANAGEMENT COMPANY LTD. IPO Details. Research Analyst : Astha Jain
 IPO Report HDFC ASSET MANAGEMENT COMPANY LTD SUBSCRIBE IPO Details Issue Date 25 th July-27 th July 2018 Price Band 1095-1100/Share Bid Lot 13 & in multiplethereof Face Value Rs 5/Share Listing BSE, NSE
Va Tech Wabag Ltd. 11 th March, 2014 BUY
 Company Report BROKING DEPOSITORY DISTRIBUTION FINANCIAL ADVISORY Va Tech Wabag Ltd. 11 th March, 2014 BUY CMP Target Price Rs.691.30 Rs.870.00 VA Tech Wabag is Indian multinational player technology focused
(INR Crores) FY16 FY17 FY18 FY19E FY20E. Net interest income 15, , , , , Growth% -8% -2% 0% 26% 6%
 FY16 FY17 FY18 FY19E FY20E. Net interest income 15, , , , , Growth% -8% -2% 0% 26% 6%") 07-08-2015 01-08-2016 27-07-2017 22-07-2018 Result Update BUY * Aug 08, 2018 Punjab National Bank Result Update Total assets down 4 QoQ; Advances down 4 QoQ Total assets came at 7378bn dragged by 4 drop
07-08-2015 01-08-2016 27-07-2017 22-07-2018 Result Update BUY * Aug 08, 2018 Punjab National Bank Result Update Total assets down 4 QoQ; Advances down 4 QoQ Total assets came at 7378bn dragged by 4 drop
Q1-2018: Performance review. July 2017
 Q1-2018: Performance review July Certain statements in these slides are forward-looking statements. These statements are based on management's current expectations and are subject to uncertainty and changes
: ` per share. IPO opens during : Sept 28 Oct 04, 2011 Book Running Lead Manager : Atherstone Capital Markets Ltd.
 I P O N O T E Onelife Capital Advisors Ltd. September 27, 2011 Price Band : `100-110 per share Minimum Bid Lot Size : 50 Equity Shares Maximum Bid Lot Size : 1800 Equity Shares IPO opens during : Sept
Radico Khaitan Limited
 Radico Khaitan Limited (NSE: RADICO; BSE: 532497) Q3 FY2015 Earnings Presentation February 10, 2015 Important Notice This presentation contains statements that contain forward looking statements including,
Press Release
 ---------------------------------------------------------------------------------------------------- Press Release Financial Results for the Quarter and Nine Months Ended December 31, 2017. The Board of
PTC INDIA LTD. INVESTOR UPDATE MAY 2014
 PTC INDIA LTD. INVESTOR UPDATE MAY 2014 DISCLAIMER This presentation and the accompanying slides (the Presentation ), which have been prepared by PTC India Limited (the Company ), have been prepared solely
R.S. Software (India) Ltd. 11 th August, 2014 BUY
 Ltd. 11 th August, 2014 BUY") Company Report BROKING DEPOSITORY DISTRIBUTION FINANCIAL ADVISORY R.S. Software (India) Ltd. 11 th August, 2014 BUY CMP Rs.430.00 Target Price Rs.600.00 BSE Code 517447 NSE Code RSSOFTWARE Market Cap (Rs
Company Report BROKING DEPOSITORY DISTRIBUTION FINANCIAL ADVISORY R.S. Software (India) Ltd. 11 th August, 2014 BUY CMP Rs.430.00 Target Price Rs.600.00 BSE Code 517447 NSE Code RSSOFTWARE Market Cap (Rs
M&M Financial Services (MMFSL)
") April 27, 2011 Result Update KEY DATA Market Cap (INR bn) 79.9 Market Cap (USD mn) 1815.3 52 WK High / Low 913 / 398 Avg Daily Volume (BSE) 83432 Face Value (INR) 10 BSE Sensex 19545 Nifty 5868 BSE Code
April 27, 2011 Result Update KEY DATA Market Cap (INR bn) 79.9 Market Cap (USD mn) 1815.3 52 WK High / Low 913 / 398 Avg Daily Volume (BSE) 83432 Face Value (INR) 10 BSE Sensex 19545 Nifty 5868 BSE Code
Wealth First Portfolio Managers Ltd Investor Presentation
 Sarthi Capital Advisors Private Limited Bridging the Gaps Wealth First Portfolio Managers Ltd Investor Presentation January, 2018 Index Content Page Corporate Overview 4 7 Operational Overview 9 13 Industry
Annual Results FY 08. May 02, 2008
 Annual Results May 02, 2008 1 BUSINESS HIGHLIGHTS SBI Group net profit crosses USD 2.24 Billion (Rs 8,960 crore) SBI Stand-alone Net Profit crosses Rs 6,700 crore Net Profit for at Rs 6,729 crore, up by
PTC INDIA LTD. INVESTOR PRESENTATION Q1FY17
 PTC INDIA LTD. INVESTOR PRESENTATION Q1FY17 August 2016 DISCLAIMER This presentation and the accompanying slides (the Presentation ), which have been prepared by PTC India Limited (the Company ), have
SBI Life Insurance Company Ltd.
 IPO Note: SBI Life Insurance Company Ltd. Industry: Life Insurance Recommendation: Subscribe Date: September 19, 2017 Issue Snapshot Company Name SBI Life Insurance Company Ltd. Issue Opens September 20,
FY Annual Results. Investor Presentation
 FY 2011-12 Annual Results Investor Presentation Performance Highlights Q4FY12 12M FY12 Net Profit 25% YOY 25% YOY Net Interest Income 26% YOY 22% YOY Fee Income 8% YOY 25% YOY Operating Revenue 18% YOY
DIXON TECHNOLOGIES (INDIA) LIMITED
 LIMITED") DIXON TECHNOLOGIES (INDIA) LIMITED IPO Price Band : `1760 `1766 our recommendation neutral THE OFFER Issue Open : 6 Sep 2017 to 8 Sep 2017»» Issue Type: Book Built Issue IPO»» Issue Size: Offer for Sale
DIXON TECHNOLOGIES (INDIA) LIMITED IPO Price Band : `1760 `1766 our recommendation neutral THE OFFER Issue Open : 6 Sep 2017 to 8 Sep 2017»» Issue Type: Book Built Issue IPO»» Issue Size: Offer for Sale
July 24, 2018 HDFC ASSET MANAGEMENT COMPANY LIMITED. SMC Ranking (3.5/5) About the Company. Issue Highlights. Strength. Shareholding Pattern (%)
 About the Company. Issue Highlights. Strength. Shareholding Pattern (%)") HDFC ASSET MANAGEMENT COMPANY LIMITED July 24, 2018 SMC Ranking (3.5/5) Issue Highlights Industry Mutual Fund Offer for sale (Shares) 25,457,555 Reservation Portions 3,280,000 Net Offer to the Public 22,177,555
HDFC ASSET MANAGEMENT COMPANY LIMITED July 24, 2018 SMC Ranking (3.5/5) Issue Highlights Industry Mutual Fund Offer for sale (Shares) 25,457,555 Reservation Portions 3,280,000 Net Offer to the Public 22,177,555
State Bank of India (SBI) Banking. BUY Rating as per Large Cap 12 month investment period RETAIL EQUITY RESEARCH
 Banking. BUY Rating as per Large Cap 12 month investment period RETAIL EQUITY RESEARCH") COMPANY UPDATE Mar-18 Apr-18 May-18 Jun-18 Jul-18 Aug-18 Sep-18 Oct-18 Nov-18 Dec-18 Jan-19 Feb-19 Mar-19 RETAIL EQUITY RESEARCH State Bank of India (SBI) Banking BSE CODE: 500112 NSE CODE: SBIN Bloomberg
COMPANY UPDATE Mar-18 Apr-18 May-18 Jun-18 Jul-18 Aug-18 Sep-18 Oct-18 Nov-18 Dec-18 Jan-19 Feb-19 Mar-19 RETAIL EQUITY RESEARCH State Bank of India (SBI) Banking BSE CODE: 500112 NSE CODE: SBIN Bloomberg
Q1-2019: Performance review. July 27, 2018
 Q1-2019: Performance review July 27, Except for the historical information contained herein, statements in this release which contain words or phrases such as 'will', expected to, etc., and similar expressions
: Rs % Performance Highlights for the Q3 FY 12 and 9M FY 12 ended December 2011
 Press Release TOTAL BUSINESS CROSSES Rs 6,00,000 CRORE. CASA DEPOSITS CROSS Rs 1,25,000 CRORE TOTAL ASSETS CROSS Rs. 4,21,000 CRORE. NET INTEREST MARGIN REMAINS HIGH AT 3.85% BOOK VALUE PER SHARE ABOVE
Company Overview. Financial Performance
 Apr/15 May/15 Jun/15 Jul/15 Aug/15 Sep/15 Oct/15 Nov/15 Dec/15 Jan/16 Feb/16 Mar/16 Monarch Networth Capital Limited CMP: 26.00 March 23, 2016 Stock Details BSE code 511551 BSE ID MONARCH Face value (
SHARE CAPITAL A 25,800, ,800, RESERVES & SURPLUS B 22,039, ,975,847.03
 UPSE SECURITIES LIMITED REGD.OFFICE : "PADAM TOWERS",14/113, CIVIL LINES,KANPUR -208001 BALANCE SHEET AS AT 31st MARCH, 2011 PARTICULARS SCHEDULE AS AT 31.03.2011 AS AT 31.03.2010 AMOUNT ( ` ) AMOUNT (
FY18 : Rs. 3,937 crore vs Rs 4,015 crore in PY. Q4FY18 : Rs. 47 crore vs Rs (87) crore in PY. Q4FY18 : Rs. (30) crore vs Rs (177) crore in PY
 crore in PY. Q4FY18 : Rs. (30) crore vs Rs (177) crore in PY") Sales Q4FY18 : Rs.1,018 crore vs Rs 864 crore in PY FY18 : Rs. 3,937 crore vs Rs 4,015 crore in PY EBITDA before R&D Q4FY18 : Rs. 47 crore vs Rs (87) crore in PY FY18 : Rs 232 crore vs Rs 423 crore in
Sales Q4FY18 : Rs.1,018 crore vs Rs 864 crore in PY FY18 : Rs. 3,937 crore vs Rs 4,015 crore in PY EBITDA before R&D Q4FY18 : Rs. 47 crore vs Rs (87) crore in PY FY18 : Rs 232 crore vs Rs 423 crore in
JM FINANCIAL LIMITED STATEMENT OF UNAUDITED CONSOLIDATED FINANCIAL RESULTS FOR THE QUARTER AND NINE MONTHS ENDED DECEMBER 31, 2018
 JM FINANCIAL LIMITED STATEMENT OF UNAUDITED CONSOLIDATED FINANCIAL RESULTS FOR THE QUARTER AND NINE MONTHS ENDED DECEMBER 31, 2018 Sr. Particulars Quarter Ended No. 31.12.2018 30.09.2018 31.12.2018 1 Income
स आइएन/(CIN)L65190MH2004GOI148838
L65190MH2004GOI148838") स आइएन/(CIN)L65190MH2004GOI148838 For Immediate Publication / Broadcast / Telecast PR/1363 IDBI Bank on turnaround path exhibits Strong Capital position Highlights of Q3 FY 19 (Quarter ending Dec 31, 2018)
स आइएन/(CIN)L65190MH2004GOI148838 For Immediate Publication / Broadcast / Telecast PR/1363 IDBI Bank on turnaround path exhibits Strong Capital position Highlights of Q3 FY 19 (Quarter ending Dec 31, 2018)
FY17 FY18 FY19E FY20E
 Result Update NEUTRAL July 19, 2018 Kotak Mahindra Bank Result Update Moderate growth in loan book; however higher disbursement per branch Advances grew 24% YoY (from 1,423,590 mn) & 4% QoQ (from 1,697,179
Falling crude prices hit hard. Net sales ahead of estimates
 Change in Estimates Rating Target Falling crude prices hit hard BUY Sector: Oil & Gas Sector View: Neutral Analyst: Prayesh Jain research@indiainfoline.com Stock Data Sensex: 26,654 52 Week h/l (Rs): 330
Equitas Holdings Limited Investor Presentation Q3FY17
 Equitas Holdings Limited Investor Presentation Q3FY17 1 Mission Empowering through Financial Inclusion Vision To Serve 5% of Indian Households by 2025 Values Fair and Transparent 2 Highlights Q3FY17 Rs.7,181
Ujjivan Financial Services Ltd.
 IPO Note: Ujjivan Financial Services Ltd. Industry: Microfinance Recommendation: Subscribe Date: April 25, 2016 Issue Snapshot Company Name Ujjivan Financial Services Ltd. Issue Opens April 28, 2016 to
Bonanza Portfolio Ltd
 Public Issue of Tax Free Secured Redeemable Non-Convertible Bonds issued by HIGHLIGHTS OF TAX BENEFITS In exercise of the powers conferred by item (h) of sub-clause (iv) of clause (15) of Section 10 of
RURAL ELECTRIFICATION CORPORATION LIMITED (A Government of India Undertaking) HIGHLIGHTS OF TAX BENEFITS
 HIGHLIGHTS OF TAX BENEFITS") RURAL ELECTRIFICATION CORPORATION LIMITED (A Government of India Undertaking) HIGHLIGHTS OF TAX BENEFITS Interest from these Bonds shall not be included in total income of any person as per provisions
RURAL ELECTRIFICATION CORPORATION LIMITED (A Government of India Undertaking) HIGHLIGHTS OF TAX BENEFITS Interest from these Bonds shall not be included in total income of any person as per provisions
PRESS RELEASE. Results at a Glance
 PRESS RELEASE AXIS BANK ANNOUNCES FINANCIAL RESULTS FOR THE QUARTER AND YEAR ENDED 31 st MARCH 2017 Results at a Glance Quarterly Earnings register strong sequential growth: o Net Profit for Q4FY17 grew
RITES Limited IPO. RITES Limited IPO. Initial Public Offer - Note. Call Toll Free Issue Highlights:
 Issue Highlights: Issuer: Issue Type: 100% Book Built Issue IPO Issue Open: Wednesday, Jun 20, 2018 Issue Close: Friday, Jun 22, 2018 Offer Details (Fresh Issue): 25,200,000 Equity shares (Offer for sale).
Blue Star Ltd BUY. Performance Update. CMP Target Price `703 `867. 1QFY2019 Result Update Cons. Durable. 3-year price chart.
 Aug-15 Oct-15 Dec-15 Feb-16 Apr-16 Jun-16 Aug-16 Oct-16 Dec-16 Jan-17 Apr-17 May-17 Jul-17 Sep-17 Nov-17 Jan-18 Mar-18 May-18 Jul-18 1QFY2019 Result Update Cons. Durable August 10, 2018 Blue Star Ltd Performance
Indostar Capital Finance
 January 2, 2019 Buy Indostar Capital Finance Industry: BFSI Fallen, but not beaten down!!! We recently interacted with the management to get an understanding of the recent developments of the company post
Sasken Q1 Revenues at Rs 91 crore Increases by 35% YoY, 17% QoQ; Net Profit up by 81% YoY and 38% QoQ
 Media Release FOR IMMEDIATE RELEASE Sasken Q1 Revenues at Rs 91 crore Increases by 35% YoY, 17% QoQ; Net Profit up by 81% YoY and 38% QoQ Bangalore, July 20, 2006: Sasken Communication Technologies Limited
PNB HOUSING FINANCE LIMITED OFFER FOR SALE 28 - NOVEMBER
 PNB HOUSING FINANCE LIMITED OFFER FOR SALE 28 - NOVEMBER - 2017 OFFER BACKGROUND The Punjab National Bank (The "Seller") is the promoter of PNB Housing Finance Ltd ("the Company") has submitted to BSE
Sales EBITDA EBITDA PAT KEY INDICATORS. before R&D. Q2FY19 : Rs.1,125 crore vs Rs.1,022 crore in PY. H1FY19 : Rs.2,133 crore vs Rs.
 Sales Q2FY19 : Rs.1,125 crore vs Rs.1,022 crore in PY H1FY19 : Rs.2,133 crore vs Rs.1,913 crore in PY EBITDA before R&D Q2FY19 : Rs.134 crore vs Rs.85 crore in PY H1FY19: Rs.224 crore vs Rs.78 crore in