SOLID PRINCIPLES. MGM Resorts International Annual Report
|
|
|
- Jacob Simpson
- 5 years ago
- Views:
Transcription

1 SOLID PRINCIPLES. MGM Resorts International Annual Report
2 MGM Resorts International is the leader in entertainment and hospitality a diverse collection of extraordinary people, distinctive brands and best-in-class destinations. Working together, we create partnerships and experiences that engage, entertain and inspire.


3 A Letter From The Chairman ANNUAL REPORT Dear Shareholders: Faced with a critical decision, an individual relies on strength of character. To succeed in an adverse economy, a Company must stand on solid principles brought inconsistency and instability. Yet through it all, MGM Resorts International transformed what others saw as obstacles into stepping stones toward progress. We can confidently state that through the highs and lows of an erratic economy, our Company found a path above the turbulence to gain ground toward recovery. And we did so with our solid principles as our foundation. James J. Murren Chairman & CEO


4

5 3 SOLID PRINCIPLES / 2010 ANNUAL REPORT While others merely persisted in survival mode, we harnessed the uncertainty of a recession as impetus to meet our challenges. We successfully changed the MGM Resorts International narrative from a tale of liquidity into a chronicle of revival. We significantly improved the Company s balance sheet - securing liquidity, extending maturities and reducing debt. We re-branded the Company - changing our name to better represent the strength and depth of our portfolio and the global reach of our Company s brand. We launched M life - leveraging our unparalleled assets through a game-changing customer loyalty program designed to promote the breadth of our Company s offerings. We redeployed our executive team - positioning their unmatched knowledge and leadership abilities to execute our Company s efforts. We undertook numerous operating initiatives - benefiting our Company in late 2010, and we believe will continue to improve our bottom line going forward.


6 If there is a measure of a company s integrity, look to the way that company s leaders deal with their obligations to their customers, their employees and their financial partners.

7 5 SOLID PRINCIPLES / 2010 ANNUAL REPORT In 2010, we set aggressive goals to improve our liquidity profile; not only did we meet our goals, we exceeded them. We raised more than $3 billion of new capital and extended approximately $3.5 billion of our credit facility into We also put in place long-term credit facilities at both MGM Macau and CityCenter. MGM Resorts International delivered on our promise to employees and financial partners to improve our financial footing, positioning your Company to benefit from a recovery.


8 MGM Resorts International has remained fully engaged throughout the downturn to prepare our Company for success in an economic recovery. We implemented a strategy to grow our convention mix to strengthen pricing across other hotel segments and improve customer spend mid-week. We have seen early successes of that strategy driving improved convention mix, and increased ADR. Already in 2011, advance bookings are on the rise. Our resorts have approximately 1.6 million convention room nights on the books for this represents a double-digit increase over 2010 and we are still booking groups for the current year. In casino operations, we continue to see strength in our international play. In 2010, we posted an all-time record for international volume at our Strip properties with the addition of ARIA. Through M life and a strong event calendar, your Company is focused on improving market share and maximizing profitability.


9 ANNUAL REPORT The centerpiece initiative your Company deployed in 2010 was the introduction last fall of our new comprehensive customer loyalty program, M life. M life will engage customers in multiple phases, rolling out first to our casino players, and by the end of 2011, expanding to become a broad-based program also recognizing and rewarding non-gaming channels of our business. M life is in its early stages, but we ve seen very strong indications of its popularity in Mississippi and Detroit, and more recently, here in Las Vegas. We ve already enrolled more than one million customers and re-activated more than 150,000 existing customers. We believe we will capture a greater share of business from these guests and be better positioned to crossmarket our resorts in Las Vegas and throughout our regional properties.


10


11 9 SOLID PRINCIPLES / 2010 ANNUAL REPORT MGM Resorts continues to be the undisputed leader in the world of entertainment. While for the past couple of years entertainers have limited touring due to weakened consumer demand, we are seeing a renewed energy and already have in place a much stronger event calendar for 2011, both in terms of quality and quantity. We have also signed great long-term entertainment for our properties including the Blue Man Group opening at Monte Carlo in late 2012 and Cirque du Soleil s Michael Jackson show opening at Mandalay Bay in early We continue to reinvest in our market-leading assets by enhancing our product offering. Soon guests at Bellagio and MGM Grand Las Vegas will enjoy newly renovated rooms. We also have plans this year to bring Hyde Lounge to Bellagio, refresh slot machines across many of our properties, and modernize the offerings at several of our existing restaurants and retail outlets.


12 We are deeply committed to excellence in all aspects of our operations. This commitment has been widely recognized and is positively impacting our business. Following CityCenter s first full year of operations, ARIA took its rightful place in 2010 among the premium properties in Las Vegas. ARIA drove growth in the high-end market in Las Vegas and is now a leader in the baccarat market. CityCenter continues to serve as the benchmark for our industry going forward. CityCenter has received accolades and awards in nearly every discipline. Perhaps most notably, ARIA and Mandarin Oriental, Las Vegas were honored with the coveted AAA Five Diamond award in their first year of operations, a very rare distinction. In 2010, your Company made significant strides in improving the operating performance of our Macau joint venture, showing solid results in the fourth quarter and reflecting improvement across the entire business mix. As a result of improved cash flows, we received distributions from Macau totaling $192 million, including full repayment of the interest- and noninterest-bearing notes we had initially invested in that venture.


13 11 SOLID PRINCIPLES / 2010 ANNUAL REPORT The stage is set for growth in Macau with a new $950 million long-term credit facility. Along with our partner, we are actively pursuing expansion opportunities in Macau. Our overseas endeavors through our subsidiary, MGM Hospitality, are on schedule to open the first international non-gaming resort MGM Grand Sanya before the end of this year. Last year, we were pleased to announce our first partnership in India and we look forward to additional announcements and openings in dynamic cities around the globe in the years to come.


14 For several years, MGM Resorts has been recognized for its leadership in corporate social responsibility. Our diversity initiative, community engagement programs and commitment to environmental responsibility have led the gaming industry by receiving local, regional and national awards and accolades. As shareholders, we have reason to celebrate these efforts. Not only do they reflect values of critical importance to society, they are also central to our business strategy. We are inspired by these efforts and pleased to share the highlights of these programs and recognitions in the following pages. In conclusion, I want to acknowledge the extraordinary efforts of the entire team of men and women at MGM Resorts International. Everyday, they embody the fundamental core principles on which we ve built this company. Without their efforts, none of our progress this past year would have been possible. James J. Murren - Chairman & CEO Las Vegas, Nevada April 23, 2011
15 13 SOLID PRINCIPLES / 2010 ANNUAL REPORT MGM Resorts International is the recognized global leader in entertainment and hospitality. We embrace innovation and diversity to inspire excellence. We reward our employees, invest in our communities and enrich our stakeholders. We engage, entertain and exceed the expectations of our guests worldwide.


16 Diversity Over the past decade, we have spent more than $1 billion directly with minority-owned, women-owned, and disadvantaged business enterprises. In 2010 the Company celebrated the 10th anniversary of its award-winning Diversity and Inclusion Initiative, marking a decade of evolution, endurance and excellence in this business imperative. This initiative has become a central part of our Company identity: we have embedded the diversity paradigm into our core values, major business systems and operations. Leveraging diversity of viewpoints and experiences of our multicultural team members to inspire and recognize the unique contribution of each of them is the essence of inclusion. In today s competitive global economy, diversity and inclusion are key drivers in our culture of engagement, innovation and peak performance. Our diversity competency equips us to appeal to multicultural customer segments domestically and to work with diverse business partners around the world, thereby enhancing shareholder value. On another diversity front, we have strengthened strategic relationships with a diverse supplier base, yielding quality goods and services to us at highly competitive prices. Over the past decade, we have spent more than $1 billion directly with minority-owned, womenowned and disadvantaged business enterprises ( MWDBE ), not including the multiplier effect of these dollars at Tier II and further tier levels, and over $1.5 billion directly with MWDBE construction contractors, designers and other professionals. For complete details on our diversity initiative go to:


17 Community 15 SOLID PRINCIPLES / 2010 ANNUAL REPORT Since its establishment in 2002 our employee foundation has donated almost $40 million for the betterment of our communities. MGM Resorts has a deep commitment to sustaining the quality of life in the communities where we operate through financial contributions, in-kind donations, volunteer service and participation in local civic organizations. Sound host communities are vital for our employees, our customers and therefore our business. Over the past decade, MGM Resorts International combined with our employee-directed MGM Resorts Foundation has taken a holistic approach to community outreach, supporting a multitude of nonprofit organizations, agencies and causes from food, shelter and health care for human sustainability, to education and the cultural arts for talent sustainability, to economic development, environmental sustainability, and more. As just one measure of our philanthropy, since its establishment in 2002, our employee foundation has donated almost $40 million for the betterment of our communities. In 2010 alone, our foundation donated $4.8 million, despite the recessionary economy. Beyond that, our extensive employee volunteerism, a hallmark of our tradition of sharing, also reinforces our culture of performance excellence, teamwork and collaboration that is fundamental to the success of our business. For complete details on our community engagement efforts go to:


18 Environmental Responsibility Sustainability practices have become an integral part of our business planning and operations. Environmental Responsibility At MGM Resorts International we view environmental responsibility as recognizing and reducing the impacts of our business on the natural environment. We call this the Green Advantage because environmentally responsible actions not only benefit the planet but also result in more efficient operations, lower costs, and enhanced company value. Through a comprehensive, strategic approach, our Green Advantage has become an integral part of our business planning and operations with focus on the core areas of energy and water use, green building, waste and recycling, supply chain, and outreach and education. Concentrated efforts to reduce environmental impacts drive innovation throughout operations and have resulted in implementation of hundreds of best practices that have made our properties greener. MGM Resorts has demonstrated that environmental responsibility and an enhanced guest experience are complementary elements. Our accomplishments in this arena serve as a solid foundation to continue our leadership and exceed the growing expectations of our customers. For complete details on our environmental responsibility programs go to:
19 17 SOLID PRINCIPLES / 2010 ANNUAL REPORT MGM Resorts has a deep commitment to sustaining the quality of life through diversity, community, and environmental initiatives that have become part of the Company identity and pillars of our core values.
20 2010 MILESTONES & AWARDS Diversity MILESTONES Employees from Company properties participated in CEO Jim Murren s Chairman s Diversity Roundtable sessions discussing the central role of our Diversity & Inclusion Initiative in your Company s business culture. As an integral part of our diversity business objectives, MGM Resorts increased its yearover-year bookings of multicultural conventions and meetings, hosting such clients as Women s Foodservice Forum, Steve Harvey s Hoodie Awards, and the Association of Latino Professionals in Finance and Accounting. Your Company announced an aggressive goal of expanding its diversity champion workshop to graduate 4,000 managers by the end of AWARDS Top 50 Companies for Diversity - DiversityInc Magazine 40 Best Companies for Diversity - Black Enterprise Magazine Corporation of the Decade - Nevada Minority Supplier Development Council Corporate Equality Index - Human Rights Campaign Community During your Company donated over $1 million to seven Clark County School District Empowerment Schools to bolster student achievement through customized curriculums and other programs. Company employees donated more than 38 tons of canned food to Southern Nevada s food bank, Three Square - the largest single company food drive in Three Square s history. MGM Resorts Foundation grants helped 105,000 students with educational support, after-school programs and community mentors; 50,000 individuals with medical care and mental health counseling; and 195,000 individuals with food, housing and other necessities Education Hero Award - The Public Education Foundation Initiative Partner of the Year - United Way of Southern Nevada Hunger Hero Volunteer Award - Gleaners Food Bank of Southeastern Michigan Gold Fit Friendly Award - American Heart Association (Southern Mississippi) Environmental Responsibility Our extensive efforts to improve the energy efficiency of our resorts have resulted in energy savings equal to more than 9,400 homes annually and more than 47 million gallons of water saved each year. Our award-winning resort recycling programs have tripled the volume we recycle to more than 33,000 tons in Today, our Company-wide recycling rate averages over 33% and continues to climb higher. Conservation Begins at Home, our internal sustainability communications initiative, has reached our 62,000 employees through regular Green Fairs that convey the importance of going green at home and provide real examples to date we have distributed over 150,000 energy efficient CFL bulbs. Twelve Green Key Awards - Green Key Eco-Rating Program Earth-Minded Award - The American Society of Interior Designers (ASID) and Hospitality Design Magazine Friend of Glass Award - The Glass Packaging Institute 2010 Best Green Owner - The Las Vegas Business Press Complete details about the many milestones, awards and recognitions received by the Company and its properties are available at:
21 2010 Annual Report Financial Section CONTENTS Selected Financial Data Management s Discussion and Analysis of Financial Condition and Results of Operations... 3 Management s Annual Report on Internal Control Over Financial Reporting Reports of Independent Registered Public Accounting Firm Consolidated Balance Sheets Consolidated Statements of Operations Consolidated Statements of Cash Flows Consolidated Statements of Stockholders Equity Notes to Consolidated Financial Statements... 35
22 SELECTED FINANCIAL DATA For the Years Ended December 31, (In thousands, except per share data) Net revenues $ 6,019,233 $ 5,978,589 $ 7,208,767 $ 7,691,637 $ 7,175,956 Operating income (loss) (1,158,931) (963,876) (129,603) 2,863,930 1,758,248 Income (loss) from continuing operations.. (1,437,397) (1,291,682) (855,286) 1,400, ,996 Net income (loss) (1,437,397) (1,291,682) (855,286) 1,584, ,264 Basic earnings per share: Income (loss) from continuing operations $ (3.19) $ (3.41) $ (3.06) $ 4.88 $ 2.25 Net income (loss) per share $ (3.19) $ (3.41) $ (3.06) $ 5.52 $ 2.29 Weighted average number of shares , , , , ,140 Diluted earnings per share: Income (loss) from continuing operations $ (3.19) $ (3.41) $ (3.06) $ 4.70 $ 2.18 Net income (loss) per share $ (3.19) $ (3.41) $ (3.06) $ 5.31 $ 2.22 Weighted average number of shares , , , , ,747 At year-end: Total assets $ 18,896,266 $ 22,518,210 $ 23,274,716 $ 22,727,686 $ 22,146,238 Total debt, including capital leases ,050,542 14,060,270 13,470,618 11,182,003 12,997,927 Stockholders equity ,998,545 3,870,432 3,974,361 6,060,703 3,849,549 Stockholders equity per share $ 6.14 $ 8.77 $ $ $ Number of shares outstanding , , , , ,909 The following events/transactions affect the year-to-year comparability of the selected financial data presented above: Acquisitions and Dispositions k In April 2007, we sold the Primm Valley Resorts. k In June 2007, we sold the Colorado Belle and Edgewater resorts in Laughlin, Nevada (the Laughlin Properties ). k In 2007, we recognized a $1.03 billion pre-tax gain on the contribution of CityCenter to a joint venture. k In March 2009, we sold the Treasure Island casino resort ( TI ) in Las Vegas, Nevada and recorded a gain on the sale of $187 million. The results of the Primm Valley Resorts and the Laughlin Properties are classified as discontinued operations for all applicable periods presented, including the gain on sales of such assets. The results of TI are not recorded as discontinued operations, as we believe significant customer migration occurred between TI and our other Las Vegas Strip resorts. Other k Beau Rivage was closed from August 2005 to August 2006 due to Hurricane Katrina. k During 2007 and 2006, we recognized our share of profits from the sale of condominium units at The Signature at MGM Grand. We recognized $93 million and $117 million (pre-tax) of such income in 2007 and 2006, respectively. k During 2007 and 2006, we recognized $284 million and $86 million, respectively, of pre-tax income for insurance recoveries related to Hurricane Katrina. k In 2008, we recognized a $1.2 billion non-cash impairment charge related to goodwill and indefinite-lived intangible assets recognized in the Mandalay acquisition. k In 2009, we recorded non-cash impairment charges of $176 million related to our M Resort note, $956 million related to our investment in CityCenter, $203 million related to our share of the CityCenter residential impairment, and $548 million related to our land holdings on Renaissance Pointe in Atlantic City and capitalized development costs related to our MGM Grand Atlantic City Project. k In 2010, we recorded non-cash impairment charges of $1.3 billion related to our investment in CityCenter, $166 million related to our share of the CityCenter residential real estate impairment, and $128 million related to our Borgata investment. 2
23 MANAGEMENT S DISCUSSION AND ANALYSIS OF FINANCIAL CONDITION AND RESULTS OF OPERATIONS The following narrative provides information about our liquidity, financial position, results of operations and other factors affecting our current and future operating results. Executive Overview Current Operations At December 31, 2010, our operations primarily consisted of 15 wholly-owned casino resorts and 50% investments in four other casino resorts. Las Vegas, Nevada: Other: CityCenter (50% owned and managed by us), Bellagio, MGM Grand Las Vegas (including The Signature), Mandalay Bay, The Mirage, Luxor, New York- New York, Excalibur, Monte Carlo and Circus Circus Las Vegas. Circus Circus Reno and Silver Legacy (50% owned) in Reno, Nevada; Gold Strike in Jean, Nevada; Railroad Pass in Henderson, Nevada; MGM Grand Detroit in Detroit, Michigan; Beau Rivage in Biloxi, Mississippi and Gold Strike Tunica in Tunica, Mississippi; Grand Victoria (50% owned) in Elgin, Illinois; and MGM Macau (50% owned). Other operations include the Shadow Creek golf course in North Las Vegas and Fallen Oak golf course in Saucier, Mississippi. We also own the Primm Valley Golf Club at the California state line, which is currently operated by a third party under a lease agreement. The other 50% of CityCenter is owned by Infinity World Development Corp ( Infinity World ), a whollyowned subsidiary of Dubai World, a Dubai, United Arab Emirates government decree entity. CityCenter consists of Aria, a 4,004-room casino resort; Mandarin Oriental Las Vegas, a 392-room non-gaming boutique hotel; Crystals, a retail district with 334,000 of currently leaseable square feet; and Vdara, a 1,495-room luxury condominium-hotel. In addition, CityCenter features residential units in the Residences at Mandarin Oriental 225 units and Veer 669 units. Aria, Vdara, Mandarin Oriental and Crystals all opened in December 2009 and the sales of residential units within CityCenter began closing in early We receive a management fee of 2% of revenues for the management of Aria and Vdara, and 5% of EBITDA (as defined in the agreements governing our management of Aria and Vdara). In addition, we receive an annual fee of $3 million for the management of Crystals. Liquidity and Financial Position We completed a series of capital markets transactions during 2010 and extended our senior credit facility. As a result of these transactions, we believe we will have sufficient liquidity from expected future cash flows and availability under our senior credit facility to meet our financial obligations through We have significant indebtedness and continue to evaluate opportunities to improve our financial condition, but we can provide no assurance that we will be able to repay or effectively refinance our indebtedness in future periods. Capital Markets Transactions. We completed the following transactions during 2010: k k k k In March 2010, we issued $845 million of 9% senior secured notes due 2020 for net proceeds to us of approximately $826 million; In April 2010, we issued $1.15 billion of 4.25% convertible senior notes due 2015 for net proceeds to us of $1.12 billion; In October 2010, we issued 40.9 million shares of our common stock for total net proceeds to us of approximately $512 million. The underwriter exercised their overallotment option to purchase an additional 6.1 million shares from us in November 2010 and we received an additional approximately $76 million of net proceeds; and In October 2010, we issued $500 million of 10% senior notes due 2016, issued at a discount to yield 10.25%, for net proceeds to us of approximately $486 million. 3
24 Senior Credit Facility. Our senior credit facility was amended and restated in March 2010, and consisted of approximately $2.7 billion in term loans (of which approximately $874 million was required to be repaid by October 3, 2011) and a $2.0 billion revolving loan (of which approximately $302 million was required to be repaid by October 3, 2011). As discussed below, in November 2010 we repaid the outstanding balance of the loans maturing in As of December 31, 2010, our senior credit facility consisted of approximately $1.8 billion in term loans and $1.7 billion in revolving loans, and had approximately $1.2 billion of available revolving borrowing capacity. We accounted for the modification related to extending the term loans as an extinguishment of debt because the applicable cash flows under the extended term loans are more than 10% different from the applicable cash flows under the previous loans. Therefore, the extended term loans were recorded at fair value resulting in a $181 million gain and a discount of $181 million to be amortized to interest expense over the term of the extended term loans. For the twelve months ended December 31, 2010, we recorded $31 million of interest related to the amortization of this discount. Fair value of the estimated term loans was based on trading prices immediately after the transaction. In addition, we wrote off $15 million of existing debt issuance costs related to the previous term loans and had expense of $22 million for new debt issuance costs incurred related to amounts paid to extending term loan lenders in connection with the modification. We also wrote off $2 million of existing debt issuance costs related to the reduction in capacity under the non-extending revolving portion of the senior credit facility. In total, we recognized a net pre-tax gain on extinguishment of debt of $142 million in Other, net non-operating income in the first quarter of Because net proceeds from our October 2010 common stock offering were in excess of $500 million, we were required to ratably repay indebtedness under the senior credit facility of $6 million, which equaled 50% of such excess. We used the net proceeds from our October 2010 senior notes offering discussed above and a portion of the net proceeds from our October 2010 common stock offering to repay the remaining amounts owed to non-extending lenders under our senior credit facility. Loans and revolving commitments aggregating approximately $3.6 billion were extended to February 21, In November 2010, the underwriters of our common stock offering exercised their overallotment option and purchased an additional 6.1 million shares for net proceeds to us of $76 million, 50% of which was used to ratably repay indebtedness under the senior credit facility. As a result of these transactions we recorded a pre-tax loss on retirement of debt related to unamortized debt issuance costs and discounts of $9 million recorded in Other, net non-operating income in the fourth quarter of The restated senior credit facility allows us to refinance indebtedness maturing prior to February 21, 2014, but limits our ability to prepay later maturing indebtedness until the extended facilities are paid in full. We may issue unsecured debt, equity-linked and equity securities to refinance our outstanding indebtedness; however, we are required to use net proceeds (a) from indebtedness issued in amounts in excess of $250 million over amounts used to refinance indebtedness and (b) from equity issued, other than in exchange for our indebtedness, in amounts in excess of $500 million (which limit we reached with our October 2010 stock offering) to ratably prepay the credit facilities, in each case, in an amount equal to 50% of the net cash proceeds of such excess. Borgata In its June 2005 report to the New Jersey Casino Control Commission (the CCC ), on the application of Borgata for renewal of its casino license, the New Jersey Division of Gaming Enforcement (the DGE ) stated that it was conducting an investigation of our relationship with our joint venture partner in Macau and that the DGE would report to the CCC any material information it deemed appropriate. On May 18, 2009, the DGE issued a report to the CCC on its investigation. In the report, the DGE recommended, among other things, that: (i) our Macau joint venture partner be found to be unsuitable; (ii) we be directed to disengage ourselves from any business association with our Macau joint venture partner; (iii) our due diligence/compliance efforts were found to be deficient; and (iv) the CCC hold a hearing to address the report. In March 2010, the CCC approved our settlement agreement with the DGE pursuant to which we placed our 50% ownership interest in the Borgata Hotel Casino & Spa ( Borgata ) and related leased land in Atlantic City into a divestiture trust. Following the transfer of these interests into trust, we ceased to be regulated by the CCC or the DGE, except as otherwise provided by the trust agreement and the settlement agreement. Boyd Gaming Corporation ( Boyd ), who owns the other 50% interest, is not affected by the settlement. 4
25 The terms of the settlement mandate the sale of the trust property within a 30-month period ending in September During the 18 months ending in September 2011, we have the right to direct the trustee to sell the trust property, subject to approval of the CCC. If a sale is not concluded by that time, the trustee is responsible for selling the trust property during the following 12-month period. Prior to the consummation of the sale, the divestiture trust will retain any cash flows received in respect of the trust property, but will pay property taxes and other costs attributable to the trust property. We are the sole economic beneficiary of the trust and will be permitted to reapply for a New Jersey gaming license beginning 30 months after the completion of the sale of the trust assets. As of December 31, 2010, the trust has $188 million of cash and investments of which $150 million is held in treasury securities with maturities greater than 90 days and is recorded within Prepaid expenses and other. As a result of our ownership interest in Borgata being placed into a trust we no longer have significant influence over Borgata; therefore, we discontinued the equity method of accounting for Borgata at the point the assets were placed in the trust, and account for our rights under the trust agreement under the cost method of accounting. We also reclassified the carrying value of our investment related to Borgata to Other long-term assets, net. Earnings and losses that relate to the investment that were previously accrued remain as a part of the carrying amount of the investment. Distributions received by the trust that do not exceed our share of earnings are recognized currently in earnings. However, distributions to the trust that exceed our share of earnings for such periods are applied to reduce the carrying amount of our investment. The trust received net distributions from the joint venture of $113 million for the year ended December 31, We recorded $94 million as a reduction of the carrying value and $19 million was recorded as Other, net non-operating income for the year ended December 31, In connection with the settlement agreement discussed above, we entered into an amendment to our joint venture agreement with Boyd to permit the transfer of our 50% ownership interest into trust in connection with our settlement agreement with the DGE. In accordance with such agreement, Boyd received a priority partnership distribution of approximately $31 million (equal to the excess prior capital contributions by Boyd) upon successful refinancing of the Borgata credit facility in August In July 2010, we entered into an agreement to sell four long-term ground leases and their respective underlying real property parcels, approximately 11 acres, underlying the Borgata. The transaction closed in November 2010; the trust received net proceeds of $71 million and we recorded a gain of $3 million related to the sale in Property transactions, net. In October 2010, we received an offer for our 50% economic interest in the Borgata based on an enterprise value of $1.35 billion for the entire asset and in October, 2010, our Board of Directors authorized submission of this offer to Boyd in accordance with the right of first refusal provisions included in the joint venture agreement. Subsequently, Boyd announced that it does not intend to exercise its right of refusal in connection with such offer. Based on Borgata s September debt balances, the offer equated to approximately $250 million for our 50% interest. This was less than the carrying value of our investment in Borgata; therefore, we recorded an impairment charge of approximately $128 million at September 30, 2010, recorded in Property transactions, net. Since October 2010, we have continued to negotiate with the prospective purchaser as well as other parties that have expressed interest in the asset. There can be no assurance that the transaction will be completed as proposed or at all, and the final terms of any sale may differ materially from the ones disclosed above. Effect of Economic Factors on Results of Operations The state of the U.S. economy has negatively affected our results of operations over the past several years, and we expect to continue to be sensitive to certain aspects of the current economic conditions, including, for example, high unemployment and the weak housing market. The decrease in liquidity in the credit markets which began in late 2007 and accelerated in late 2008 also significantly affected our results of operations and financial condition. Uncertain economic conditions continue to affect our operating results, as businesses and consumers have altered their spending patterns which led to decreases in visitor volumes and customer spending. Businesses responded to the difficult economic conditions by reducing travel budgets. This factor, along with negative perceptions surrounding certain types of business travel, caused decreases in convention attendance in Las Vegas in 2009 and Convention and catering customers cancelled or postponed a significant number of events occurring 5
26 during Other conditions currently or recently present in the economic environment which tend to negatively affect our operating results include: k k k k Weaknesses in employment and increases in unemployment; Weak consumer confidence; Weak housing market and significant declines in housing prices and related home equity; and Decreases in airline capacity to Las Vegas. Because of these economic conditions, we have increasingly focused on managing costs and continue to review all areas of operations for efficiencies. We continually manage staffing levels across all our resorts and have reduced our salaried management positions. We suspended company contributions to our 401(k) plan and our nonqualified deferred compensation plans in 2009, which remained suspended in 2009 and We reinstated a more limited 401(k) company contribution in 2011 and will continue to monitor the plan contributions as the economy changes. Our results of operations are also affected by decisions we make related to our capital allocation, our access to capital, and our cost of capital all of which are affected by the uncertain state of the global economy and the continued instability in the capital markets. For example, we will incur higher interest costs in connection with the amendments to our senior credit facility in 2009 and Also, our general cost of debt has increased over the past few years. These factors may affect our ability to access future capital and cause future borrowings to carry higher interest rates. Impairment Charges Investment in Borgata. As previously noted, in October 2010 we received an offer equating to approximately $250 million for our 50% interest in the Borgata and our Board of Directors authorized submission of this offer to Boyd Gaming Corporation, who subsequently announced it did not intend to exercise its right of refusal. The proposed offer submitted was less than the carrying value of our investment in Borgata; therefore, we recorded an impairment charge of approximately $128 million in the third quarter of 2010 included in Property transactions, net. Investment in CityCenter. At September 30, 2009, we reviewed our CityCenter investment for impairment using revised operating forecasts developed by CityCenter management late in the third quarter. In addition, the impairment charge related to CityCenter s residential real estate under development discussed below further indicated that our investment may have experienced an other-than-temporary decline in value. Our discounted cash flow analysis for CityCenter included estimated future cash outflows for construction and maintenance expenditures and future cash inflows from operations, including residential sales. Based on our analysis, we determined the carrying value of our investment exceeded its fair value and we determined that the impairment was other-than-temporary. As a result, we recorded an impairment charge of $956 million included in Property transactions, net. At June 30, 2010, we reviewed our CityCenter investment for impairment using revised operating forecasts developed by CityCenter management. Based on current and forecasted market conditions and because CityCenter s results of operations through June 30, 2010 were below previous forecasts, and the revised operating forecasts were lower than previous forecasts, we concluded that we should review the carrying value of our investment. We determined that the carrying value of our investment exceeded our fair value determined using a discounted cash flow analysis and therefore an impairment was indicated. We intend to and believe we will be able to retain our investment in CityCenter; however, due to the extent of the shortfall and our assessment of the uncertainty of fully recovering our investment, we determined that the impairment was other-than-temporary and recorded an impairment charge of $1.12 billion included in Property transactions, net. At September 30, 2010, we recognized an increase of $232 million in our total net obligation under our CityCenter completion guarantee, and a corresponding increase in our investment in CityCenter. The increase primarily reflected a revision to prior estimates based on our assessment of the most current information derived from our close-out and litigation processes and does not reflect certain potential recoveries that CityCenter is pursuing as part of the litigation process. We completed an impairment review as of September 30, 2010 and as a 6
27 result recorded an additional impairment of $191 million in the third quarter of 2010 included in Property transactions, net. The discounted cash flow analyses for our investment in CityCenter included estimated future cash inflows from operations, including residential sales, and estimated future cash outflows for capital expenditures. The June 2010 and September 2010 analyses used an 11% discount rate and a long term growth rate of 4% related to forecasted cash flows for CityCenter s operating assets. CityCenter Residential Inventory. Included in loss from unconsolidated affiliates for the year ended December 31, 2009 is our share of an impairment charge relating to CityCenter residential real estate under development ( REUD ). CityCenter was required to review its REUD for impairment as of September 30, 2009, mainly due to CityCenter s September 2009 decision to discount the prices of its residential inventory by 30%. This decision and related market conditions led to CityCenter management s conclusion that the carrying value of the REUD was not recoverable based on estimates of undiscounted cash flows. As a result, CityCenter was required to compare the fair value of its REUD to its carrying value and record an impairment charge for the shortfall. Fair value of the REUD was determined using a discounted cash flow analysis based on management s expectations of future cash flows. The key inputs in the discounted cash flow analysis included estimated sales prices of units currently under contract and new unit sales, the absorption rate over the estimated sell-out period, and the discount rate. This analysis resulted in an impairment charge of approximately $348 million of the REUD. We recognized our 50% share of such impairment charge, adjusted by certain basis differences, resulting in a pre-tax charge of $203 million. Due to the completion of construction of the Mandarin Oriental residential inventory in the first quarter of 2010 and completion of the Veer residential inventory in the second quarter of 2010, CityCenter is required to carry its residential inventory at the lower of its carrying value or fair value less costs to sell. CityCenter determines fair value of its residential inventory using a discounted cash flow analysis based on management s current expectations of future cash flows. The key inputs in the discounted cash flow analysis include estimated sales prices of units currently under contract and new unit sales, the absorption rate over the sell-out period, and the discount rate. These estimates are subject to management s judgment and are highly sensitive to changes in the market and economic conditions, including the estimated absorption period. In the event current sales forecasts are not met, additional impairment charges may be recognized in future periods. As a result of its impairment analyses of its residential inventory, CityCenter recorded impairment charges for the Mandarin Oriental residential inventory of $171 million and $20 million in the first and third quarter of 2010 and impairment charges for the Veer residential inventory of $57 million, $55 million and $27 million, in the second, third and fourth quarters of 2010, respectively. Impairment charges in the third quarter primarily related to an increase in final cost estimates for the residential inventory. We recognized our 50% share of such impairment charges, resulting in pre-tax charges of $166 million for the year ended December 31, 2010, respectively, included in Income (loss) from unconsolidated affiliates. CityCenter Harmon Impairment. The Harmon Hotel & Spa ( Harmon ) was originally planned to include over 200 residential units and a 400-room non-gaming lifestyle hotel. In 2009, we announced that the opening of the Harmon hotel component would be delayed until we and our joint venture partner, Infinity World, mutually agreed to its completion, and that the residential component had been canceled. During the third quarter of 2010, CityCenter management determined that it is unlikely that the Harmon will be completed using the building as it now stands. As a result, CityCenter recorded an impairment charge of $279 million in the third quarter of 2010 related to construction in progress assets. The impairment of Harmon did not affect our loss from unconsolidated affiliates, because we had previously recognized our 50% share of the impairment charge in connection with prior impairments of our investment balance. M Resort Note. At June 30, 2009, we reviewed our M Resort Note for impairment. Based on our review of the operating results of M Resort, as well as the M Resort s management s revised cash flow projections post-opening, which were significantly lower than original predictions due to market and general economic conditions, we determined that the fair value of the M Resort Note was $0, that the decline in value was other-than-temporary, and that the entire amount of the indicated impairment related to a credit loss. Based on these conclusions, we 7
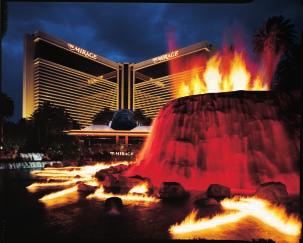
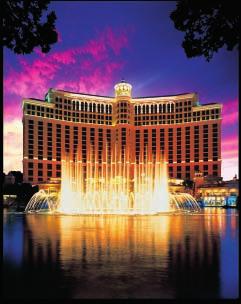
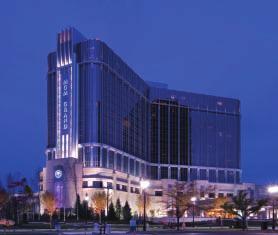
28 recorded a pre-tax impairment of $176 million in the second quarter of 2009 within Other, net. Of that amount, $82 million was reclassified from accumulated other comprehensive loss, which amount was $54 million net of tax. We stopped recording accrued paid-in-kind interest as of May 31, 2009, and no longer hold this note. Atlantic City Renaissance Pointe Land. We reviewed the carrying value of our Renaissance Pointe land holdings for impairment at December 31, 2009 as we did not intend to pursue development of our MGM Grand Atlantic City project for the foreseeable future. Our Board of Directors subsequently terminated this project. Our Renaissance Pointe land holdings included a 72-acre development site and included 11 acres of land subject to a long-term lease with the Borgata joint venture. The fair value of the development land was determined based on a market approach, and the fair value of land subject to the long-term lease with Borgata was determined using a discounted cash flow analysis using expected contractual cash flows under the lease discounted at a market capitalization rate. As a result of our review, we recorded a non-cash impairment charge of $548 million in the 2009 fourth quarter, which was included in Property transactions, net related to our land holdings on Renaissance Pointe and capitalized development costs. Goodwill and Intangible Assets Impairment. We perform our annual impairment test related to goodwill and indefinite-lived intangible assets during the fourth quarter of each year. As a result of our 2008 analysis, we recognized a non-cash impairment charge of $1.2 billion. The impairment charge related solely to the goodwill and other indefinite-lived intangible assets recognized in the 2005 acquisition of Mandalay Resort Group, and represented substantially all of the goodwill recognized at the time of the Mandalay acquisition and a minor portion of the value of trade names related to the Mandalay resorts. The impairment charge resulted from factors affected by economic conditions at the time, including: 1) lower market valuation multiples for gaming assets; 2) higher discount rates resulting from turmoil in the credit and equity markets; and 3) cash flow forecasts for the Mandalay resorts. No impairment charges were required as a result of our 2010 and 2009 analyses. Monte Carlo Fire We maintain insurance for both property damage and business interruption relating to catastrophic events, such as the rooftop fire at Monte Carlo in January Business interruption coverage covers lost profits and other costs incurred during the closure period and up to six months following re-opening. We reached final settlement agreements for the Monte Carlo Fire in early In total, we received $74 million of proceeds from our insurance carriers. We recognized the $41 million of excess insurance recoveries in income in 2009 and 2008, with recoveries offsetting a write-down of $4 million related to the net book value of damaged assets, demolition costs of $7 million, and operating costs of $21 million. In 2009, $15 million and $7 million of such excess insurance recoveries were recognized as offsets to General and administrative expense and Property transactions, net, respectively. In 2008, $9 million and $10 million of such excess insurance recoveries were recognized as offsets to General and administrative expense and Property transactions, net, respectively. Key Performance Indicators Our primary business is the ownership and operation of casino resorts, which includes offering gaming, hotel, dining, entertainment, retail and other resort amenities. Over half of our net revenue is derived from non-gaming activities as our operating philosophy is to provide a complete resort experience for our guests, including nongaming amenities for which our guests are willing to pay a premium. Our significant convention and meeting facilities allow us to maximize hotel occupancy and customer volumes during off-peak times such as mid-week or during traditionally slower leisure travel periods, which also leads to better labor utilization. We believe that we own several of the premier casino resorts in the world and have continually reinvested in our resorts to maintain our competitive advantage. As a resort-based company, our operating results are highly dependent on the volume of customers at our resorts, which in turn affects the price we can charge for our hotel rooms and other amenities. We also generate a 8
29 significant portion of our operating income from the high-end gaming segment, which can be a cause for variability in our results. Key performance indicators related to revenue are: k k Gaming revenue indicators table games drop and slots handle (volume indicators); win or hold percentage, which is not fully controllable by us. Our normal table games hold percentage is in the range of 19% to 23% of table games drop and our normal slots hold percentage is in the range of 7.5% to 8.5% of slots handle; Hotel revenue indicators hotel occupancy (a volume indicator); average daily rate ( ADR, a price indicator); revenue per available room ( REVPAR, a summary measure of hotel results, combining ADR and occupancy rate). Most of our revenue is essentially cash-based, through customers wagering with cash or paying for non-gaming services with cash or credit cards. Our resorts, like many in the industry, generate significant operating cash flow. Our industry is capital intensive and we rely heavily on the ability of our resorts to generate operating cash flow to repay debt financing, fund maintenance capital expenditures and provide excess cash for future development. We generate a majority of our net revenues and operating income from our resorts in Las Vegas, Nevada, which exposes us to certain risks, such as increased competition from new or expanded Las Vegas resorts, and from the expansion of gaming in California. We are also exposed to risks related to tourism and the general economy, including national and global economic conditions and terrorist attacks or other global events. Our results of operations do not tend to be seasonal in nature, though a variety of factors may affect the results of any interim period, including the timing of major Las Vegas conventions, the amount and timing of marketing and special events for our high-end customers, and the level of play during major holidays, including New Year and Chinese New Year. We market to different customer segments to manage our hotel occupancy, such as targeting large conventions to increase mid-week occupancy. Our results do not depend on key individual customers, although our success in marketing to customer groups, such as convention customers, or the financial health of customer segments, such as business travelers or high-end gaming customers from a particular country or region, can affect our results. Results of Operations The following discussion is based on our consolidated financial statements for the years ended December 31, 2010, 2009 and Certain results in this section are discussed on a same store basis excluding the results of TI, which was sold in March The following table summarizes our financial results: 2010 Year Ended December 31, Percentage Change 2009 Percentage Change 2008 (In thousands, except per share data) Net revenues..... $ 6,019,233 1% $ 5,978,589 (17%) $ 7,208,767 Operating expenses: Casino and hotel operations... 3,398,072 (1%) 3,439,927 (14%) 3,986,970 Reimbursed costs , % 99, % 47,404 General and administrative.... 1,128,803 3% 1,100,193 (14%) 1,278,944 Corporate expense ,241 (14%) 143,764 32% 109,279 Preopening and start-up expenses.... 4,247 (92%) 53, % 23,059 Property transactions, net ,451,474 9% 1,328,689 10% 1,210,749 Depreciation and amortization.. 633,423 (8%) 689,273 (11%) 778,236 7,099,730 4% 6,854,238 (8%) 7,434,641 Income (loss) from unconsolidated affiliates (78,434) 11% (88,227) (192%) 96,271 Operating loss... $ (1,158,931) (20%) $ (963,876) (644%) $ (129,603) Net loss... $ (1,437,397) (11%) $ (1,291,682) (51%) $ (855,286) Net loss per share... $ (3.19) 6% $ (3.41) (11%) $ (3.06) 9
30 Net revenues including reimbursed costs increased 1% from Excluding reimbursed costs, net revenues decreased 3% in 2010 and 18% in 2009 largely due to the economic factors discussed in Effect of Economic Factors on Results of Operations. As discussed further in Operating Results Detailed Revenue Information, revenues have decreased across most lines of business. In response to this decrease in revenues, we have implemented cost savings efforts to reduce departmental operating expenses, but due to our leveraged business model a significant portion of the decline in revenue affected operating results. Corporate expense decreased 14% in 2010 primarily as a result of higher legal and advisory costs associated with our activities to improve our financial position in Corporate expense in 2009 increased 32% compared to 2008 due to the legal and advisory costs as well as the accrual of bonus expense in 2009; there was no bonus accrual in 2008 due to not meeting internal profit targets. Depreciation and amortization expense in 2010 decreased 8% due to certain assets being fully depreciated. Depreciation and amortization expense decreased in 2009 due to certain assets becoming fully depreciated and the sale of TI. In addition, other transactions, events, and impairment charges had a significant impact on our earnings performance, the most significant of which are discussed in the Executive Overview section above. Operating Results Detailed Revenue Information The following table presents detail of our net revenues: 2010 Year Ended December 31, Percentage Change 2009 (In thousands) Percentage Change 2008 Casino revenue, net: Table games... $ 827,274 (13%) $ 955,238 (11%) $ 1,078,897 Slots.... 1,540,738 (2%) 1,579,038 (12%) 1,795,226 Other... 74,915 (11%) 83,784 (18%) 101,557 Casino revenue, net 2,442,927 (7%) 2,618,060 (12%) 2,975,680 Non-casino revenue: Rooms... 1,300,287 (5%) 1,370,135 (28%) 1,907,093 Food and beverage... 1,339,174 (2%) 1,362,325 (14%) 1,582,367 Entertainment, retail and other... 1,210,903 1% 1,194,383 (13%) 1,371,651 Reimbursed costs , % 99, % 47,404 Non-casino revenue... 4,209,834 5% 4,026,222 (18%) 4,908,515 6,652,761 0% 6,644,282 (16%) 7,884,195 Less: Promotional allowances... (633,528) 5% (665,693) 1% (675,428) $ 6,019,233 1% $ 5,978,589 (17%) $ 7,208,767 Table games revenue in 2010 decreased 13% in 2010 on a same store basis, mainly as a result of lower overall table games volumes which decreased 6%, and lower hold percentage. Table games revenue in 2009 decreased 11%, or 9% on a same store basis, due to a decrease in overall table games volume, despite an increase of 33% for baccarat volume. Table games hold percentage was below the mid-point of our normal range in 2010 and near the mid-point for 2009 and Slots revenue decreased 2% in 2010, or 1% on a same store basis, as a result of a decrease in volume at our Las Vegas Strip resorts. Decreases at our Las Vegas Strip resorts were partially offset by a 5% increase in revenue at MGM Grand Detroit and a 3% increase in revenue at Gold Strike Tunica. Slots revenue decreased 12% in 2009, or 9% on a same store basis, driven by a decrease in volume at our Las Vegas Strip resorts. In 2009, most of our Las Vegas Strip resorts experienced decreases in the high single digits, while MGM Grand Detroit and Gold Strike Tunica experienced decreases in the low single digits. 10
31 Rooms revenue decreased 4% on a same store basis in 2010 and 24% on a same store basis in 2009 as a result of a decrease in occupancy and lower average room rates. The following table shows key hotel statistics for our Las Vegas Strip resorts: Year Ended December 31, Occupancy... 89% 91% 92% Average Daily Rate (ADR)... $ 108 $ 111 $ 148 Revenue per Available Room (REVPAR)... $ 96 $ 100 $ 137 Food and beverage, entertainment, and retail revenues in 2010 and 2009 were negatively affected by lower customer spending and decreased occupancy at our resorts. In 2009, entertainment revenues benefited from the addition of Terry Fator at The Mirage and The Lion King at Mandalay Bay. Reimbursed costs revenue represents reimbursement of costs, primarily payroll-related, incurred by us in connection with the provision of management services. We recognize costs reimbursed pursuant to management services as revenue in the period we incur the costs. Reimbursed costs, which are related mainly to our management of CityCenter, were $359 million, $99 million and $47 million for 2010, 2009, and 2008, respectively. Operating Results Details of Certain Charges Stock compensation expense is recorded within the department of the recipient of the stock compensation award. The following table shows the amount of compensation expense related to employee stock-based awards: Year Ended December 31, (In thousands) Casino... $ 7,592 $ 10,080 $ 10,828 Other operating departments... 3,092 4,287 3,344 General and administrative... 9,974 9,584 9,485 Corporate expense and other ,330 12,620 12,620 $ 34,988 $ 36,571 $ 36,277 Preopening and start-up expenses consisted of the following: Year Ended December 31, (In thousands) CityCenter... $ 3,494 $ 52,010 $ 17,270 Other ,003 5,789 $ 4,247 $ 53,013 $ 23,059 11
32 Property transactions, net consisted of the following: Year Ended December 31, (In thousands) CityCenter investment impairment.... $ 1,313,219 $ 955,898 $ - Borgata impairment , Atlantic City Renaissance Point land impairment ,347 - Goodwill and other indefinite-lived intangible assets impairment ,179,788 Gain on sale of TI (187,442) - Other property transactions, net ,860 11,886 30,961 $ 1,451,474 $ 1,328,689 $ 1,210,749 See discussion of our impairment charges under Executive Overview. Other property transactions during 2010 related primarily to write-downs of various discontinued capital projects. Other property transactions in 2009 primarily related to write-downs of various discontinued capital projects and offset by $7 million in insurance recoveries related to the Monte Carlo fire. Other property transactions in 2008 included $30 million related to the write-down of land and building assets of Primm Valley Golf Club. The 2008 period also included approximately $9 million of demolition costs associated with various room remodel projects as well as the write-down of approximately $27 million of various discontinued capital projects. These amounts were offset by a gain on the sale of an aircraft of $25 million and $10 million of insurance recoveries related to the Monte Carlo fire. Operating Results Income (Loss) from Unconsolidated Affiliates The following table summarizes information related to our income (loss) from unconsolidated affiliates: Year Ended December 31, (In thousands) CityCenter.... $(250,482) $ (208,633) $ (19,552) MGM Macau ,575 24,615 11,898 Borgata... 6,971 72,602 59,268 Other... 35,502 23,189 44,657 $ (78,434) $ (88,227) $ 96,271 Operating results for CityCenter included $166 million and $203 million of residential real estate impairments in 2010 and 2009, respectively. As a result of the transfer of Borgata assets into trust in 2010, we no longer record Borgata income in income from unconsolidated affiliates. The 2009 results also included a $12 million charge related to development costs for our postponed joint venture project on the North Las Vegas Strip and $14 million related to insurance proceeds recognized at Borgata. 12
33 Non-operating Results The following table summarizes information related to interest on our long-term debt: Year Ended December 31, (In thousands) Total interest incurred... $ 1,113,580 $ 997,897 $ 773,662 Interest capitalized... - (222,466) (164,376) $ 1,113,580 $ 775,431 $ 609,286 Cash paid for interest, net of amounts capitalized... $ 1,020,040 $ 807,523 $ 622,297 Weighted average total debt balance... $ 12.7 billion $ 13.2 billion $ 12.8 billion End-of-year ratio of fixed-to-floating debt /19 61/39 58/42 Weighted average interest rate % 7.6% 6.0% In 2010, gross interest costs increased due to higher interest rates on our senior credit facility and newly issued fixed rate borrowings. Included in interest expense in 2010 is $31 million of amortization of debt discount associated with the amendment of our senior credit facility during In 2009, gross interest costs increased compared to 2008 mainly due to higher average debt balances during 2009, higher interest rates for borrowings under our senior credit facility in 2009, higher interest rates for newly issued fixed rate borrowings, as well as breakage fees for voluntary repayments of our revolving credit facility. We did not have any capitalized interest in 2010, as we ceased capitalization of interest related to CityCenter in December 2009 and we have no other qualifying capital projects ongoing. Capitalized interest increased in 2009 compared to 2008 due to higher CityCenter investment balances and higher weighted average cost of debt. The amounts presented above exclude non-cash gross interest and corresponding capitalized interest for 2008 and 2009 related to our CityCenter delayed equity contribution. The following table summarizes information related to our income taxes: Year Ended December 31, (In thousands) Loss before income tax $ (2,216,025) $ (2,012,593) $ (668,988) Income tax benefit (provision) , ,911 (186,298) Effective income tax rate (35.1%) (35.8%) NM Cash (received from) paid for income taxes, net of refunds.... $ (330,218) $ (53,863) $ 437,874 The income tax benefit on pre-tax loss in 2010 was provided essentially at the federal statutory rate of 35%. The income tax benefit provided on pre-tax loss in 2009 was greater than 35% primarily as a result of state tax benefit provided on the write-down of land in Atlantic City. The write-down of goodwill in 2008, which was treated as a permanently non-deductible item in our federal income tax provision, caused us to incur a provision for income tax expense in 2008 even though our pre-tax result was a loss for that year. Excluding the effect of the goodwill writedown, the effective tax rate from continuing operations for 2008 was 37.3%. The net refund of cash taxes in 2010 was due primarily to the carryback to prior years of U.S. federal income tax net operating losses incurred in The net refund of cash taxes in 2009 was due primarily to refunds of taxes that were paid in Cash taxes were paid in 2008 despite the pre-tax operating loss due to the non-deductible goodwill write-down and cash taxes paid on the gain from the CityCenter joint venture transaction that occurred in Since the CityCenter gain was realized in the fourth quarter of 2007, the associated income taxes were paid in Non-GAAP Measures Adjusted EBITDA is earnings before interest and other non-operating income (expense), taxes, depreciation and amortization, preopening and start-up expenses, and property transactions, net. Adjusted Property EBITDA is Adjusted EBITDA before corporate expense and stock compensation expense. Adjusted EBITDA and Adjusted Property EBITDA information is presented solely as a supplemental disclosure to reported GAAP measures because we believe that these measures are: 1) widely used measures of operating performance in the gaming industry, and 2) a principal basis for valuation of gaming companies. 13
34 We believe that while items excluded from Adjusted EBITDA and Adjusted Property EBITDA may be recurring in nature and should not be disregarded in evaluation of our earnings performance, it is useful to exclude such items when analyzing current results and trends compared to other periods because these items can vary significantly depending on specific underlying transactions or events that may not be comparable between the periods being presented. Also, we believe excluded items may not relate specifically to current operating trends or be indicative of future results. For example, preopening and start-up expenses will be significantly different in periods when we are developing and constructing a major expansion project and dependent on where the current period lies within the development cycle, as well as the size and scope of the project(s). Property transactions, net includes normal recurring disposals and gains and losses on sales of assets related to specific assets within our resorts, but also includes gains or losses on sales of an entire operating resort or a group of resorts and impairment charges on entire asset groups or investments in unconsolidated affiliates, which may not be comparable period over period. In addition, capital allocation, tax planning, financing and stock compensation awards are all managed at the corporate level. Therefore, we use Adjusted Property EBITDA as the primary measure of our operating resorts performance. Adjusted EBITDA or Adjusted Property EBITDA should not be construed as an alternative to operating income or net income, as an indicator of our performance; or as an alternative to cash flows from operating activities, as a measure of liquidity; or as any other measure determined in accordance with generally accepted accounting principles. We have significant uses of cash flows, including capital expenditures, interest payments, taxes and debt principal repayments, which are not reflected in Adjusted EBITDA. Also, other companies in the gaming and hospitality industries that report Adjusted EBITDA information may calculate Adjusted EBITDA in a different manner. The following table presents a reconciliation of Adjusted EBITDA to net income (loss): Year Ended December 31, (In thousands) Adjusted EBITDA... $ 930,213 $ 1,107,099 $ 1,882,441 Preopening and start-up expenses... (4,247) (53,013) (23,059) Property transactions, net... (1,451,474) (1,328,689) (1,210,749) Depreciation and amortization.... (633,423) (689,273) (778,236) Operating loss... (1,158,931) (963,876) (129,603) Non-operating income (expense): Interest expense, net... (1,113,580) (775,431) (609,286) Other, net... 56,486 (273,286) 69,901 (1,057,094) (1,048,717) (539,385) Loss before income taxes... (2,216,025) (2,012,593) (668,988) Benefit (provision) for income taxes , ,911 (186,298) Net loss... $ (1,437,397) $ (1,291,682) $ (855,286) On a same store basis, Adjusted EBITDA decreased 15% in Excluding the $166 million impact from the residential real estate impairment charges at CityCenter and $58 million of forfeited residential deposits at CityCenter in 2010, and a $203 million impairment charge related to CityCenter real estate under development, $15 million of Monte Carlo insurance recoveries and $12 million of impairment related to our proposed North Las Vegas Strip joint venture project in 2009, Adjusted EBITDA decreased 20%. Adjusted EBITDA on a same store basis decreased 38% in 2009, mainly as a result of the factors previously discussed in Operating Results Detailed Revenue Information. Excluding the real estate under development impairment, North Las Vegas Strip impairment and Monte Carlo insurance recoveries, Adjusted EBITDA decreased 27% in On a same store basis, Adjusted Property EBITDA from wholly-owned operations decreased to $1.2 billion in 2010 from $1.3 billion in 2009 as a result of previously discussed operating trends. Adjusted Property EBITDA from wholly-owned operations decreased 26% in 2009 compared to
35 The following tables present reconciliations of operating income (loss) to Adjusted Property EBITDA and Adjusted EBITDA: Operating Income (Loss) Preopening and Start-up Expenses Year Ended December 31, 2010 Property Transactions, Net (In thousands) Depreciation and Amortization Adjusted EBITDA Bellagio $ 174,355 $ - $ (17) $ 96,290 $ 270,628 MGM Grand Las Vegas , , ,093 Mandalay Bay ,859-2,892 91, ,385 The Mirage ,189 - (207) 66, ,106 Luxor , ,117 61,196 New York-New York ,845-6,880 27,529 76,254 Excalibur , ,899 63,236 Monte Carlo , ,923 24,427 33,555 Circus Circus Las Vegas..... (5,366) ,741 15,605 MGM Grand Detroit ,040 - (327) 40, ,173 Beau Rivage , ,374 61,287 Gold Strike Tunica ,115 - (540) 14,278 39,853 Management operations (27,429) ,761 (13,668) Other operations (6,046) ,583 1,125 Wholly-owned operations , , ,824 1,153,828 CityCenter (50%) (253,976) 3, (250,482) Macau (50%) , ,575 Other unconsolidated resorts.. 42, , ,224 4,247 14, ,824 1,075,685 Stock compensation (34,988) (34,988) Corporate (1,596,167) - 1,437,084 48,599 (110,484) $ (1,158,931) $ 4,247 $ 1,451,474 $ 633,423 $ 930,213 Operating Income (Loss) Preopening and Start-up Expenses Year Ended December 31, 2009 Property Transactions, Net Depreciation and Amortization Adjusted EBITDA (In thousands) Bellagio $ 157,079 $ - $ 2,326 $115,267 $ 274,672 MGM Grand Las Vegas , , ,369 Mandalay Bay , (73) 93, ,864 The Mirage , , ,118 Luxor ,527 (759) ,218 76,167 Treasure Island ,730 - (1) - 12,729 New York-New York ,445-1,631 31,479 78,555 Excalibur ,973 - (16) 24,173 72,130 Monte Carlo ,439 - (4,740) 24,895 36,594 Circus Circus Las Vegas ,015 - (9) 23,116 27,122 MGM Grand Detroit ,183-7,336 40, ,010 Beau Rivage , ,031 65,422 Gold Strike Tunica ,010 - (209) 16,250 45,051 Management operations ,285-2,473 8,564 18,322 Other operations (4,172) - (57) 5,988 1,759 Wholly-owned operations , , ,630 1,361,884 CityCenter (50%) (260,643) 52, (208,634) Macau (50%) , ,615 Other unconsolidated resorts.. 96, , ,827 53,013 9, ,630 1,274,812 Stock compensation (36,571) (36,571) Corporate (1,511,132) - 1,319,347 60,643 (131,142) $ (963,876) $ 53,013 $ 1,328,689 $689,273 $ 1,107,099 15
36 Operating Income (Loss) Preopening and Start-up Expenses Year Ended December 31, 2008 Property Transactions, Net Depreciation and Amortization Adjusted EBITDA (In thousands) Bellagio.... $ 257,415 $ - $ 1,130 $ 133,755 $ 392,300 MGM Grand Las Vegas , ,639 97, ,792 Mandalay Bay , , , ,495 The Mirage , ,080 62, ,351 Luxor ,948 1,116 2,999 43, ,173 Treasure Island... 63,454-1,828 37, ,011 New York-New York , ,627 32, ,459 Excalibur... 83, , ,149 Monte Carlo ,788 - (7,544) 25,380 64,624 Circus Circus Las Vegas... 33, ,401 56,151 MGM Grand Detroit , ,028 53, ,508 Beau Rivage , ,150 71,023 Gold Strike Tunica ,093-2,326 13,981 31,400 Management operations... 6, ,285 16,894 Other operations... (5,367) - 2,718 6,244 3,595 Wholly-owned operations ,175,497 2,673 24, ,328 1,917,925 CityCenter (50%) (36,821) 17, (19,551) Macau (50%) , ,898 Other unconsolidated resorts ,297 3, ,308 1,251,871 22,954 24, ,328 2,014,580 Stock compensation..... (36,277) (36,277) Corporate.... (1,345,197) 105 1,186,322 62,908 (95,862) $ (129,603) $ 23,059 $ 1,210,749 $ 778,236 $ 1,882,441 Liquidity and Capital Resources Cash Flows Summary Our cash flows consisted of the following: Year Ended December 31, (In thousands) Net cash provided by operating activities... $ 504,014 $ 587,914 $ 753,032 Investing cash flows: Capital expenditures, net of construction payable..... (207,491) (136,850) (781,754) Proceeds from sale of Treasure Island, net ,266 - Investments in and advances to unconsolidated affiliates..... (553,000) (963,685) (1,279,462) Distributions from unconsolidated affiliates in excess of earnings , Distributions from cost method investments , Property damage insurance recoveries ,186 21,109 Investments in treasury securities- maturities longer than 90 days... (149,999) - - Other... 75,931 16,828 58,667 Net cash used in investing activities... (586,079) (330,255) (1,981,440) Financing cash flows: Net borrowings (repayments) under bank credit facilities..... (3,207,716) (198,156) 2,480,450 Issuance of senior notes ,489,485 1,921, ,490 Retirement of senior notes..... (1,154,479) (1,176,452) (789,146) Issuance of common stock in public offering, net ,456 1,104,418 - Purchases of common stock (1,240,856) Other... (190,924) (162,811) (26,856) Net cash provided by (used in) financing activities... (1,475,178) 1,488,750 1,122,082 Net increase (decrease) in cash and cash equivalents.... $ (1,557,243) $ 1,746,409 $ (106,326) 16
37 Cash Flows Operating Activities Trends in our operating cash flows tend to follow trends in our operating income, excluding non-cash charges, but can be affected by the timing of significant tax payments or refunds and distributions from unconsolidated affiliates. Cash flow from operating activities decreased 14% in 2010 due to a decrease in operating income excluding non-cash charges, partially offset by net tax refunds of $330 million during Cash flow from operating activities decreased 22% in 2009 primarily due to a decrease in operating income and the sale of TI. Operating cash flows also decreased due to a $47 million increase in our receivable from CityCenter, partially offset by increased distributions from unconsolidated affiliates. The 2008 period also included a significant tax payment, approximately $300 million, relating to the 2007 CityCenter joint venture transaction. At December 31, 2010 and 2009, we held cash and cash equivalents of $499 million and $2.1 billion, respectively. On December 30, 2009, we borrowed the remaining availability of $1.6 billion under our senior credit facility and repaid such borrowings immediately after year end. We require a certain amount of cash on hand to operate our resorts. Beyond our cash on hand, we utilize company-wide cash management procedures to minimize the amount of cash held in banks. Funds are swept from accounts at our resorts daily into central bank accounts, and excess funds are invested overnight or are used to repay borrowings under our bank credit facilities. Cash Flows Investing Activities A significant portion of our investing activities over the past three years related to our CityCenter joint venture. In 2010, we made contributions of $553 million to CityCenter related to the completion guarantee, of which $124 million is payable to us from CityCenter from future condominium sales proceeds. In 2009, we made equity contributions of $731 million to CityCenter. In 2008, we made loans and equity contributions totaling $1.15 billion. In 2010, we recognized $135 million of distributions from unconsolidated affiliates within investing activities as a return of our investments, which primarily related to MGM Macau. We received a total of $192 million from MGM Macau in 2010, $59 million of which was recognized as cash flows from operating activities. In addition, our New Jersey trust account received $113 million of net distributions from Borgata and received $71 million from the sale of ground leases and underlying land. All amounts in the trust account, including the proceeds from the sale of our Borgata interest, will be distributed to us upon consummation of the sale of our Borgata interest. $150 million of the assets held in trust has been invested in treasury securities with maturities greater than 90 days. We received $746 million in net proceeds related to the sale of TI in The insurance recoveries classified as investing cash flows relate to the Monte Carlo fire in 2009 and Capital expenditures of $207 million in 2010 mainly relate to maintenance capital expenditures at various resorts and the purchase of an airplane. Capital expenditures of $137 million in 2009 consisted primarily of room remodel projects and various property enhancements, including capitalized interest. In 2008, capital expenditures of $782 million related to the following, including related capitalized interest: k $64 million for CityCenter people mover and related assets; k $19 million related to construction costs for MGM Grand Detroit; k $61 million of development costs related to MGM Grand Atlantic City; k $230 million related to room remodel projects; and k $408 million for various other property enhancements and amenities. 17
38 Cash Flows Financing Activities In 2010, excluding the $1.6 billion we repaid in early January on our senior credit facility, we repaid net debt of $290 million. We issued the following senior secured, convertible senior and senior notes during 2010: k $1.15 billion of 4.25% convertible senior notes due 2015 and paid $81 million for capped call transactions entered into in connection with the issuance; k $845 million of 9% senior secured notes due 2020; and k $500 million of 10% senior notes due In the fourth quarter of 2010, we issued approximately 47 million shares of our common stock for total net proceeds to us of approximately $588 million. Concurrently with our stock issuance, Tracinda sold approximately 32 million shares of our common stock. We did not receive any proceeds from the sale of such common stock by Tracinda. We repaid the following principal amounts of senior and senior subordinated notes during 2010: k k k $75 million 8.375% senior subordinated notes (redeemed prior to maturity essentially at par); $297 million 9.375% senior notes (repaid at maturity); and $782 million of our 8.5% senior notes (redeemed $136 million prior to maturity essentially at par and repaid $646 million at maturity). Excluding the $1.6 billion borrowed under the senior credit facility in late December 2009 and repaid in early January 2010, we repaid net debt of $1.1 billion in In addition, pursuant to our development agreement, we repaid $50 million of bonds issued by the Economic Development Corporation of the City of Detroit. In May 2009, we issued approximately million shares of our common stock at $7 per share, for total net proceeds to us of $1.2 billion. We issued the following senior secured and senior notes during 2009: k $650 million of % senior secured notes due 2014; k $850 million of % senior secured notes due 2017; and k $475 million of % senior notes due We repaid the following principal amounts of senior and senior subordinated notes during 2009: k k k $226.3 million 6.5% senior notes (redeemed $122.3 million prior to maturity essentially at par); $820 million 6% senior notes (redeemed $762.6 million prior to maturity essentially at par and the remaining $57.4 million was repaid at maturity); and $100 million 7.25% senior debentures (redeemed prior to maturity for $127 million). In 2008, we borrowed net debt of $2.4 billion including $2.5 billion under our senior credit facility. Also in 2008, we issued $750 million of 13% senior secured notes due We repaid the following senior and senior subordinated notes at maturity during 2008: k k $180.4 million of 6.75% senior notes; and $196.2 million of 9.5% senior notes. Also in 2008, we repurchased $345 million of principal amounts of various series of our outstanding senior notes at a purchase price of $263 million in open market repurchases as part of a repurchase program authorized by our Board of Directors. We redeemed at par $149.4 million of the principal amount of our 7% debentures due 2036 pursuant to a one-time put option by the holders of such debentures. Our share repurchases are only conducted under repurchase programs approved by our Board of Directors and publicly announced. In May 2008, our Board of Directors approved a 20 million share repurchase plan that was still fully available at December 31, 2010, subject to limitations under our agreements governing our long-term indebtedness. We did not repurchase any shares of common stock during 2010 and In 2008, we repurchased 18.1 million shares at an average price of $
39 Other Factors Affecting Liquidity MGM Macau. In September 2010, MGM China Holdings Limited, a Cayman Islands company formed by us and Ms. Pansy Ho, that would own the entity that operates MGM Macau, filed a proposed listing application on Form A1 with The Stock Exchange of Hong Kong Limited ( Hong Kong Exchange ) in connection with a possible listing of its shares on the main board of the Hong Kong Exchange. There have not been any decisions made regarding the timing or terms of any such listing, whether MGM China Holdings Limited will ultimately proceed with this transaction, or whether the application will be approved by the Hong Kong Exchange. We received approximately $192 million from MGM Macau during 2010, which represents a full repayment of our interest and non-interest bearing notes to that entity. Tax refunds. We expect to receive tax refunds of approximately $175 million during Borgata settlement. As discussed in Executive Overview Borgata, we entered into a settlement agreement with the DGE under which we will sell our 50% ownership interest in Borgata and related leased land in Atlantic City. Prior to the consummation of the sale, the divestiture trust will retain any cash flows received in respect of the trust property, but will pay property taxes and other costs attributable to the trust property. We have received significant distributions from Borgata in the past few years, and not having access to such distributions until the ultimate sale could negatively affect our liquidity in interim periods. CityCenter July 2010 capital call. We and Infinity World each made capital contributions to CityCenter of $32.5 million in July Our contribution was made through a reduction in our receivable from CityCenter. A portion of Infinity World s cash contribution was used to repay an additional portion of the amounts owed to us for costs paid by us on behalf of the joint venture. If CityCenter is unable to generate sufficient cash flows to fund its future obligations, the joint venture may request additional capital contributions from its partners. CityCenter January 2011 debt restructuring transactions. In January 2011, CityCenter completed a series of transactions including issuance of $900 million in aggregate principal amount of 7.625% senior secured first lien notes due 2016 and $600 million in aggregate principal amount of 10.75%/11.50% senior secured second lien PIK toggle notes due 2017 in a private placement. The interest rate on the second lien notes is 11.50% if CityCenter pays interest in the form of additional debt. CityCenter received net proceeds from the offering of the notes of $1.46 billion after initial purchaser s discounts and commissions but before other offering expenses. Effective concurrently with the notes offering, CityCenter s senior credit facility was amended and restated which extended the maturity of $500 million of the $1.85 billion outstanding loans until January 21, The restated senior credit facility does not include a revolving loan component. All borrowings under the senior credit facility in excess of $500 million were repaid using the proceeds of the first lien notes and the second lien notes. In addition, net proceeds from the note offerings, together with equity contributions of $73 million from the members were used to fund the interest escrow account of $159 million for the benefit of the holders of the first lien notes and the lenders under the restated senior credit facility. The restated senior credit facility is secured, on a pari passu basis with the first lien notes, by a first priority lien on substantially all of CityCenter s assets and those of its subsidiaries, except that any proceeds generated by the sale of Crystals outside of bankruptcy or foreclosure proceedings will be paid first to the lenders under the restated senior credit facility. The restated senior credit facility also contains certain covenants, including financial covenants, which require CityCenter to maintain a minimum interest coverage ratio (EBITDA to interest charges as defined in the agreement) of (i) 1.10 to 1.0 for the quarter ending September 30, 2012; (ii) 1.15 to 1.0 for the quarter ending December 31, 2012; (iii) 1.25 to 1.0 for the quarters ending March 31, 2013 and June 30, 2013; and (iv) 1.50 to 1.0 for all quarters thereafter. In addition, the restated senior credit facility limits CityCenter s capital expenditures to no more than $50 million per year (with unused amounts in any fiscal year rolling over to the next fiscal year, but not any fiscal year thereafter). Principal Debt Arrangements Our long-term debt consists of publicly held senior, senior secured, senior subordinated and convertible senior notes and our senior credit facility. We pay fixed rates of interest ranging from 4.25% to 13% on our senior, senior 19
40 secured, convertible senior and subordinated notes. At December 31, 2010, our senior credit facility had a capacity of $3.5 billion consisting of a term loan facility of $1.8 billion and a revolving credit facility of $1.7 billion and interest was based on a LIBOR margin of 5.00%, with a LIBOR floor of 2.00%, and a base margin of 4.00%, with a base rate floor of 4.00%. See Executive Overview for more information related to the amendment and extension of our senior credit facility. Our senior credit facility contains certain financial and non-financial covenants, including a quarterly minimum EBITDA test, based on a rolling 12-month EBITDA and a covenant limiting annual capital expenditures. Further, our senior credit facility and certain of our debt securities contain restrictive covenants that, among other things, limit our ability to pay dividends or distributions, repurchase or issue equity, prepay debt or make certain investments; incur additional debt or issue certain disqualified stock and preferred stock; incur liens on assets; pledge or sell assets or consolidate with another company or sell all or substantially all assets; enter into transactions with affiliates; allow certain subsidiaries to transfer assets; and enter into sale and lease-back transactions. We are in compliance with all covenants, including financial covenants under our senior credit facilities as of December 31, At December 31, 2010, we were required under our senior credit facility to maintain a minimum trailing annual EBITDA (as defined) of $1.0 billion, which increases to $1.1 billion as of March 31, 2011, $1.15 billion as of September 30, 2011, and $1.2 billion as of December 31, 2011, with additional periodic increases thereafter. As of December 31, 2010, we had annual EBITDA calculated in accordance with the terms of the agreement of approximately $1.14 billion and were in compliance with the minimum EBITDA covenant. Additionally, we are limited to $400 million of annual capital expenditures (as defined) during 2010 and are limited to $500 million of annual capital expenditures in At December 31, 2010, we were in compliance with the maximum capital expenditures covenant. All of our principal debt arrangements are guaranteed by each of our material subsidiaries, other than MGM Grand Detroit, LLC, our foreign subsidiaries and their U.S. holding companies, and our insurance subsidiaries. MGM Grand Detroit is a guarantor under the senior credit facility, but only to the extent that MGM Grand Detroit, LLC borrows under such facility. At December 31, 2010, the outstanding amount of borrowings related to MGM Grand Detroit, LLC was $450 million. In connection with our May 2009 senior credit facility amendment, MGM Grand Detroit granted lenders a security interest in its assets to secure its obligations under the senior credit facility. Also in connection with our May 2009 senior credit facility amendment, we granted a security interest in Gold Strike Tunica and certain undeveloped land on the Las Vegas Strip to secure up to $300 million of obligations under the senior credit facility. In addition, substantially all of the assets of New York-New York serve as collateral for the 13% senior secured notes issued in 2008, substantially all of the assets of Bellagio and The Mirage serve as collateral for the % and % senior secured notes issued in 2009, and substantially all of the assets of the MGM Grand serve as collateral for the 9.00% senior secured notes issued in Upon the issuance of the %, %, and 9.00% senior secured notes, the holders of our 13% senior secured notes due 2013 obtained an equal and ratable lien in all collateral securing these notes. No other assets serve as collateral for our principal debt arrangements. Off Balance Sheet Arrangements Investments in unconsolidated affiliates. Our off balance sheet arrangements consist primarily of investments in unconsolidated affiliates, which consist primarily of our investments in CityCenter, Grand Victoria, Silver Legacy, and MGM Macau. We have not entered into any transactions with special purpose entities, nor have we engaged in any derivative transactions. Our unconsolidated affiliate investments allow us to realize the proportionate benefits of owning a full-scale resort in a manner that minimizes our initial investment. We have not historically guaranteed financing obtained by our investees, and there are no other provisions of the venture agreements which we believe are unusual or subject us to risks to which we would not be subjected if we had full ownership of the resort. CityCenter completion guarantee. We entered into an unlimited completion and cost overrun guarantee with respect to CityCenter, secured by our interests in the assets of Circus Circus Las Vegas and certain adjacent undeveloped land. The terms of the completion guarantee provide that up to $250 million of net residential proceeds 20
41 from the sale of condominium properties at CityCenter would be permitted by CityCenter s lenders and our joint venture partner to fund construction costs that we will otherwise be obligated to pay under the completion guarantee, or to reimburse us for construction costs previously expended; however, the timing of receipt of such proceeds is uncertain. As of December 31, 2010, we had funded $553 million under the completion guarantee. We have recorded a receivable from CityCenter of $124 million related to these amounts, which represents amounts reimbursable to us from CityCenter from future residential proceeds. At December 31, 2010 our remaining estimated net obligation under the completion guarantee was approximately $80 million which includes estimated litigation costs related to the resolution of disputes with contractors as to the final construction costs and reflects certain estimated offsets to the amounts claimed by the contractors. CityCenter has reached, or expects to reach, settlement agreements with most of these construction subcontractors; however, significant disputes remain with the general contractor and certain subcontractors. Amounts claimed by such parties exceed amounts included in our completion guarantee accrual by approximately $200 million. Moreover, we have not accrued for any contingent payments to CityCenter related to the Harmon Hotel & Spa component, which is unlikely to be completed using the building as it now stands. We do not believe we would be responsible for funding any additional remediation efforts that might be required with respect to the Harmon; however, our view is based on a number of developing factors, including with respect to ongoing litigation with CityCenter s contractors, actions by local officials and other developments related to the CityCenter venture, that are subject to change. See the Legal Proceedings section of our Form 10-K for the year ended December 31, 2010 for the discussion of Perini litigation. In January 2011, we entered into an amended completion and cost overrun guarantee in connection with CityCenter s restated senior credit facility agreement and issuance of $1.5 billion of senior secured first lien notes and senior secured second lien notes. Consistent with the previous completion guarantee, the terms of the amended completion guarantee provide for the application of an additional $124 million of net residential proceeds from sales of condominium properties at CityCenter to fund construction costs, or to reimburse us for construction costs previously expended; however, the timing of receipt of such proceeds is uncertain. Letters of credit. At December 31, 2010, we had outstanding letters of credit totaling $37 million. Commitments and Contractual Obligations The following table summarizes our scheduled contractual obligations as of December 31, 2010: Thereafter (In millions) Long-term debt $ 455 $ 546 $ 1,384 $ 3,463 $ 2,025 $ 4,402 Estimated interest payments on longterm debt (1) Capital leases Operating leases Tax liabilities (2) Long-term liabilities CityCenter funding commitments (3) Other Purchase obligations Construction commitments Employment agreements Entertainment agreements (4) Other(5) $ 1,788 $ 1,595 $ 2,304 $ 4,056 $ 2,518 $ 5,329 (1) Estimated interest payments are based on principal amounts and expected maturities of debt outstanding at December 31, 2010, and management s forecasted LIBOR rates for our bank credit facility. (2) Approximately $144 million of liabilities related to uncertain tax positions and other tax liabilities are excluded from the table as we cannot reasonably estimate when examination and other activity related to these amounts will conclude. 21
42 (3) Under our completion guarantee for CityCenter, we are committed to fund amounts in excess of currently funded project costs. Based on current forecasted expenditures, we estimate that we will be required to fund approximately $80 million for such guarantee excluding future proceeds to be received from residential closings of $124 million. (4) Our largest entertainment commitments consist of minimum contractual payments to Cirque du Soleil, which performs shows at several of our resorts. We are generally contractually committed for a period of 12 months based on our ability to exercise certain termination rights; however, we expect these shows to continue for longer periods. (5) The amount for 2011 includes approximately $46 million of open purchase orders. Other commitments are for various contracts, including advertising, maintenance and other service agreements. See Executive Overview for discussion of our liquidity and financial position and ability to meet known obligations. Critical Accounting Policies and Estimates Management s discussion and analysis of our results of operations and liquidity and capital resources are based on our consolidated financial statements. To prepare our consolidated financial statements in accordance with accounting principles generally accepted in the United States of America, we must make estimates and assumptions that affect the amounts reported in the consolidated financial statements. We regularly evaluate these estimates and assumptions, particularly in areas we consider to be critical accounting estimates, where changes in the estimates and assumptions could have a material effect on our results of operations, financial position or cash flows. Senior management and the Audit Committee of the Board of Directors have reviewed the disclosures included herein about our critical accounting estimates, and have reviewed the processes to determine those estimates. Allowance for Doubtful Casino Accounts Receivable Marker play represents a significant portion of the table games volume at Bellagio, MGM Grand Las Vegas, Mandalay Bay and The Mirage. Our other facilities do not emphasize marker play to the same extent, although we offer markers to customers at those casinos as well. We maintain strict controls over the issuance of markers and aggressively pursue collection from those customers who fail to pay their marker balances timely. These collection efforts are similar to those used by most large corporations when dealing with overdue customer accounts, including the mailing of statements and delinquency notices, personal contacts, the use of outside collection agencies and civil litigation. Markers are generally legally enforceable instruments in the United States. At December 31, 2010 and 2009, approximately 36% and 40%, respectively, of our casino accounts receivable was owed by customers from the United States. Markers are not legally enforceable instruments in some foreign countries, but the United States assets of foreign customers may be reached to satisfy judgments entered in the United States. At December 31, 2010 and 2009, approximately 51% and 46%, respectively, of our casino accounts receivable was owed by customers from the Far East. We maintain an allowance, or reserve, for doubtful casino accounts at all of our operating casino resorts. The provision for doubtful accounts, an operating expense, increases the allowance for doubtful accounts. We regularly evaluate the allowance for doubtful casino accounts. At resorts where marker play is not significant, the allowance is generally established by applying standard reserve percentages to aged account balances. At resorts where marker play is significant, we apply standard reserve percentages to aged account balances under a specified dollar amount and specifically analyze the collectibility of each account with a balance over the specified dollar amount, based on the age of the account, the customer s financial condition, collection history and any other known information. We also monitor regional and global economic conditions and forecasts to determine if reserve levels are adequate. The collectibility of unpaid markers is affected by a number of factors, including changes in currency exchange rates and economic conditions in the customers home countries. Because individual customer account balances can be significant, the allowance and the provision can change significantly between periods, as information about a certain customer becomes known or as changes in a region s economy occur. 22
43 The following table shows key statistics related to our casino receivables: Year Ended December 31, (In thousands) Casino receivables... $ 229,318 $ 261,025 $ 243,600 Allowance for doubtful casino accounts receivable... 85,547 88,557 92,278 Allowance as a percentage of casino accounts receivable % 34% 38% Percentage of casino accounts outstanding over 180days... 28% 24% 21% The allowance for doubtful accounts as a percentage of casino accounts receivable has increased in the current year due to a larger percentage of receivables over 180 days. At December 31, 2010, a 100 basis-point change in the allowance for doubtful accounts as a percentage of casino accounts receivable would change net income by $2 million, or less than $0.01 per share. Fixed Asset Capitalization and Depreciation Policies Property and equipment are stated at cost. For the majority of our property and equipment, cost has been determined based on estimated fair values in connection with the April 2005 Mandalay acquisition and the May 2000 Mirage Resorts acquisition. Maintenance and repairs that neither materially add to the value of the property nor appreciably prolong its life are charged to expense as incurred. Depreciation and amortization are provided on a straight-line basis over the estimated useful lives of the assets. When we construct assets, we capitalize direct costs of the project, including fees paid to architects and contractors, property taxes, and certain costs of our design and construction subsidiaries. In addition, interest cost associated with major development and construction projects is capitalized as part of the cost of the project. Interest is typically capitalized on amounts expended on the project using the weighted-average cost of our outstanding borrowings, since we typically do not borrow funds directly related to a development project. Capitalization of interest starts when construction activities begin and ceases when construction is substantially complete or development activity is suspended for more than a brief period. We must make estimates and assumptions when accounting for capital expenditures. Whether an expenditure is considered a maintenance expense or a capital asset is a matter of judgment. When constructing or purchasing assets, we must determine whether existing assets are being replaced or otherwise impaired, which also may be a matter of judgment. Our depreciation expense is highly dependent on the assumptions we make about our assets estimated useful lives. We determine the estimated useful lives based on our experience with similar assets, engineering studies, and our estimate of the usage of the asset. Whenever events or circumstances occur which change the estimated useful life of an asset, we account for the change prospectively. Impairment of Long-lived Assets, Goodwill and Indefinite-lived Intangible Assets We evaluate our property and equipment and other long-lived assets for impairment based on our classification as a) held for sale or b) to be held and used. Several criteria must be met before an asset is classified as held for sale, including that management with the appropriate authority commits to a plan to sell the asset at a reasonable price in relation to its fair value and is actively seeking a buyer. For assets classified as held for sale, we recognize the asset at the lower of carrying value or fair market value less costs of disposal, as estimated based on comparable asset sales, offers received, or a discounted cash flow model. For assets to be held and used, we review for impairment whenever indicators of impairment exist. We then compare the estimated future cash flows of the asset, on an undiscounted basis, to the carrying value of the asset. If the undiscounted cash flows exceed the carrying value, no impairment is indicated. If the undiscounted cash flows do not exceed the carrying value, then an impairment is recorded based on the fair value of the asset, typically measured using a discounted cash flow model. If an asset is still under development, future cash flows include remaining construction costs. All recognized impairment losses, whether for assets to be held for sale or assets to be held and used, are recorded as operating expenses. There are several estimates, assumptions and decisions in measuring impairments of long-lived assets. First, management must determine the usage of the asset. To the extent management decides that an asset will be sold, it is 23
44 more likely that an impairment may be recognized. Assets must be tested at the lowest level for which identifiable cash flows exist. This means that some assets must be grouped, and management has some discretion in the grouping of assets. Future cash flow estimates are, by their nature, subjective and actual results may differ materially from our estimates. On a quarterly basis, we review our major long-lived assets to determine if events have occurred or circumstances exist that indicate a potential impairment. Potential factors which could trigger an impairment include underperformance compared to historical or projected operating results, negative industry or economic factors, or significant changes to our operating environment. We estimate future cash flows using our internal budgets. When appropriate, we discount future cash flows using a weighted-average cost of capital, developed using a standard capital asset pricing model, based on guideline companies in our industry. Goodwill represents the excess of purchase price over fair market value of net assets acquired in business combinations. We review goodwill and indefinite-lived intangible assets at least annually and between annual test dates in certain circumstances. We perform our annual impairment test for goodwill and indefinite-lived intangible assets in the fourth quarter of each fiscal year. Goodwill for relevant reporting units is tested for impairment using a discounted cash flow analysis based on our budgeted future results discounted using a weighted average cost of capital, developed using a standard capital asset pricing model based on guideline companies in our industry, and market indicators of terminal year capitalization rates. As of the date we completed our 2010 goodwill impairment analysis, the estimated fair values of our reporting units with associated goodwill were substantially in excess of their carrying values. Indefinite-lived intangible assets consist primarily of license rights, which are tested for impairment using a discounted cash flow approach, and trademarks, which are tested for impairment using the relief-from-royalty method. There are several estimates inherent in evaluating these assets for impairment. In particular, future cash flow estimates are, by their nature, subjective and actual results may differ materially from our estimates. In addition, the determination of capitalization rates and the discount rates used in the impairment tests are highly judgmental and dependent in large part on expectations of future market conditions. See Executive Overview and Results of Operations for discussion of write-downs and impairments of long-lived assets, goodwill and intangible assets. Other than mentioned therein, we are not aware of events or circumstances through December 31, 2010 that would cause us to review any material long-lived assets, goodwill or indefinite-lived intangible assets for impairment. Impairment of Investments in Unconsolidated Affiliates We evaluate our investments in unconsolidated affiliates for impairment whenever events or changes in circumstances indicate that the carrying value of our investment may have experienced an other-than-temporary decline in value. If such conditions exist, we compare the estimated fair value of the investment to its carrying value to determine whether an impairment is indicated and determine whether the impairment is other-than-temporary based on our assessment of relevant factors, including consideration of our intent and ability to retain our investment. We estimate fair value using a discounted cash flow analysis based on estimates of future cash flows and market indicators of discount rates and terminal year capitalization rates. See Executive Overview for discussion of impairment charges recorded in 2010 and 2009 related to our investment in CityCenter. Income Taxes We recognize deferred tax assets, net of applicable reserves, related to net operating loss carryforwards and certain temporary differences with a future tax benefit to the extent that realization of such benefit is more likely than not. Otherwise, a valuation allowance is applied. Except for certain state deferred tax assets and a foreign tax credit carryforward, we believe that it is more likely than not that our deferred tax assets are fully realizable because of the future reversal of existing taxable temporary differences. Given the negative impact of the U.S. economy on the results of our operations in the past several years and our expectations that we will continue to be adversely affected by certain aspects of the current economic conditions, we no longer rely on future operating income in assessing the realizability of our deferred tax assets and now rely only on the future reversal of existing taxable temporary differences. Accordingly, we concluded during 2010 that realization of certain of our state deferred tax 24
45 assets was no longer more likely than not and we provided a valuation allowance in the amount of $32 million, net of federal effect, with a corresponding reduction in income tax benefit. Since the future reversal of existing U.S. federal taxable temporary differences currently exceed the future reversal of existing U.S. federal deductible temporary differences, we continue to conclude that it is more likely than not that our U.S. federal deferred tax assets, other than the foreign tax credit carryforward, are realizable. Should we continue to experience operating losses of the same magnitude we have experienced in the past several years, it is reasonably possible in the near term that the future reversal of our U.S. federal deductible temporary differences could exceed the future reversal of our U.S. federal taxable temporary differences, in which case we would record a valuation allowance for such excess with a corresponding reduction of federal income tax benefit on our statement of operations. Our income tax returns are subject to examination by the Internal Revenue Service ( IRS ) and other tax authorities. Positions taken in tax returns are sometimes subject to uncertainty in the tax laws and may not ultimately be accepted by the IRS or other tax authorities. We assess our tax positions using a two-step process. A tax position is recognized if it meets a more likely than not threshold, and is measured at the largest amount of benefit that is greater than 50 percent likely of being realized. We review uncertain tax positions at each balance sheet date. Liabilities we record as a result of this analysis are recorded separately from any current or deferred income tax accounts, and are classified as current ( Other accrued liabilities ) or long-term ( Other long-term liabilities ) based on the time until expected payment. Additionally, we recognize accrued interest and penalties, if any, related to unrecognized tax benefits in income tax expense. We file income tax returns in the U.S. federal jurisdiction, various state and local jurisdictions, and foreign jurisdictions, although the taxes paid in foreign jurisdictions are not material. As of December 31, 2010, we were no longer subject to examination of our U.S. consolidated federal income tax returns filed for years ended prior to The IRS completed its examination of our consolidated federal income tax returns for the 2003 and 2004 tax years during 2010 and we paid $12 million in tax and $4 million in associated interest with respect to adjustments to which we agreed. In addition, we submitted a protest to IRS Appeals of certain adjustments to which we do not agree. The opening Appeals conference has been scheduled to occur in the first quarter of It is reasonably possible that the issues subject to Appeal may be settled within the next 12 months. During the fourth quarter of 2010, the IRS opened an examination of our consolidated federal income tax returns for the 2005 through 2009 tax years. The IRS informed us during the fourth quarter of 2010 that they would initiate an audit of the 2007 through 2009 tax years of CityCenter Holdings LLC, an unconsolidated affiliate treated as a partnership for income tax purposes. The IRS also informed us that they would initiate an audit of the 2008 through 2009 tax years of MGM Grand Detroit LLC, a subsidiary treated as a partnership for income tax purposes. Neither of these audits was initiated in 2010 but we anticipate that both will be initiated in early We reached settlement during 2010 with IRS Appeals with respect to the audit of the 2004 through 2006 tax years of MGM Grand Detroit, LLC. At issue was the tax treatment of payments made under an agreement to develop, own and operate a hotel casino in the City of Detroit. We will owe $1 million in tax as a result of this settlement. During the fourth quarter of 2010, a tentative settlement was reached with IRS Appeals with respect to the audit of the 2003 and 2004 tax years of a cost method investee of ours that is treated as a partnership for income tax purposes. The adjustments to which we agreed in such settlement will be included in any settlement that we may reach with respect to the 2003 and 2004 examination of our consolidated federal income tax return. The IRS closed during 2010 its examination of the federal income tax return of Mandalay Resort Group for the pre-acquisition year ended April 25, 2005 and issued a No-Change Letter. The statutes of limitations for assessing tax for all Mandalay Resort Group pre-acquisition years are now closed. As of December 31, 2010, other than the exceptions noted below, we were no longer subject to examination of our various state and local tax returns filed for years ended prior to The state of Illinois during 2010 initiated an audit of our Illinois combined returns for the 2006 and 2007 tax years. It is reasonably possible that this audit will close and all issues will be settled in the next 12 months. The state of New Jersey began audit procedures during 25
46 2010 of a cost method investee of ours for the 2003 through 2006 tax years. The City of Detroit previously indicated that it would audit a Mandalay Resort Group subsidiary return for the pre-acquisition year ended April 25 but no audit was initiated and the statute of limitations for assessing tax expired in No other state or local income tax returns of ours are currently under exam. Stock-based Compensation We account for stock options and stock appreciation rights ( SARs ) measuring fair value using the Black-Scholes model. For restricted stock units, compensation expense is calculated based on the fair market value of our stock on the date of grant. There are several management assumptions required to determine the inputs into the Black-Scholes model. Our volatility and expected term assumptions can significantly affect the fair value of stock options and SARs. The extent of the impact will depend, in part, on the extent of awards in any given year. In 2010, we granted 3.8 million SARs with a total fair value of $27 million. In 2009, we granted 6.8 million SARs with a total fair value of $37 million. In 2008, we granted 4.9 million SARs with a total fair value of $72 million. For 2010 awards, a 10% change in the volatility assumption (71% for 2010; for sensitivity analysis, volatility was assumed to be 64% and 78%) would have resulted in a $2 million, or 8%, change in fair value. A 10% change in the expected term assumption (4.8 years for 2010; for sensitivity analysis, expected term was assumed to be 4.3 years and 5.3 years) would have resulted in a $1 million, or 4%, change in fair value. These changes in fair value would have been recognized over the four to five-year vesting period of such awards. It should be noted that a change in the expected term would cause other changes, since the risk-free rate and volatility assumptions are specific to the term; we did not attempt to adjust those assumptions in performing the sensitivity analysis above. Recently Issued Accounting Standards Certain amendments to Accounting Standards Codification ( ASC ) Topic 810, Consolidation, became effective for us beginning January 1, Such amendments include changes to the quantitative approach to determine the primary beneficiary of a variable interest entity ( VIE ). An enterprise must determine if its variable interest or interests give it a controlling financial interest in a VIE by evaluating whether 1) the enterprise has the power to direct activities of the VIE that have a significant effect on economic performance, and 2) the enterprise has an obligation to absorb losses or the right to receive benefits from the entity that could potentially be significant to the VIE. The amendments to ASC 810 also require ongoing reassessments of whether an enterprise is the primary beneficiary of a VIE. The adoption of these amendments did not have a material effect on our consolidated financial statements. Market Risk Market risk is the risk of loss arising from adverse changes in market rates and prices, such as interest rates and foreign currency exchange rates. Our primary exposure to market risk is interest rate risk associated with our variable rate long-term debt. We attempt to limit our exposure to interest rate risk by managing the mix of our longterm fixed rate borrowings and short-term borrowings under our bank credit facilities. A change in interest rates generally does not have an impact upon our future earnings and cash flow for fixed-rate debt instruments. As fixedrate debt matures, however, and if additional debt is acquired to fund the debt repayment, future earnings and cash flow may be affected by changes in interest rates. This effect would be realized in the periods subsequent to the periods when the debt matures. As of December 31, 2010, long-term variable rate borrowings represented approximately 19% of our total borrowings. Assuming a 100 basis-point increase in LIBOR over the 2% floor specified in our senior credit facility, our annual interest cost would change by approximately $23 million based on gross amounts outstanding at 26
47 December 31, The following table provides additional information about our gross long-term debt subject to changes in interest rates: Debt maturing in, Thereafter Total Fair Value December 31, 2010 (In millions) Fixed rate $ 455 $ 546 $ 1,384 $ 1,159 $ 2,025 $ 4,402 $ 9,971 $ 10,226 Average interest rate % 6.8% 10.2% 8.4% 5.3% 9.2% 8.2% Variable rate $ - $ - $ - $ 2,304 $ - $ - $ 2,304 $ 2,156 Average interest rate.... N/A N/A N/A 7.0% N/A N/A 7.0% 27
48 Management s Responsibilities MANAGEMENT S ANNUAL REPORT ON INTERNAL CONTROL OVER FINANCIAL REPORTING Management is responsible for establishing and maintaining adequate internal control over financial reporting (as defined in Sections 13a- 15(f) and 15d- 15(f) of the Exchange Act) for MGM Resorts International and subsidiaries (the Company ). Objective of Internal Control over Financial Reporting In establishing adequate internal control over financial reporting, management has developed and maintained a system of internal control, policies and procedures designed to provide reasonable assurance that information contained in the accompanying consolidated financial statements and other information presented in this annual report is reliable, does not contain any untrue statement of a material fact or omit to state a material fact, and fairly presents in all material respects the financial condition, results of operations and cash flows of the Company as of and for the periods presented in this annual report. These include controls and procedures designed to ensure that this information is accumulated and communicated to the Company s management, including its principal executive officer and principal financial officer, as appropriate to all timely decisions regarding required disclosure. Significant elements of the Company s internal control over financial reporting include, for example: k k k k k k Hiring skilled accounting personnel and training them appropriately; Written accounting policies; Written documentation of accounting systems and procedures; Segregation of incompatible duties; Internal audit function to monitor the effectiveness of the system of internal control; Oversight by an independent Audit Committee of the Board of Directors. Management s Evaluation Management, with the participation of the Company s principal executive officer and principal financial officer, has evaluated the Company s internal control over financial reporting using the criteria established in Internal Control Integrated Framework issued by the Committee of Sponsoring Organizations of the Treadway Commission. Based on its evaluation as of December 31, 2010, management believes that the Company s internal control over financial reporting is effective in achieving the objectives described above. Report of Independent Registered Public Accounting Firm Deloitte & Touche LLP audited the Company s consolidated financial statements as of and for the year ended December 31, 2010 and issued their report thereon, which is included in this annual report. Deloitte & Touche LLP has also issued an attestation report on the effectiveness of the Company s internal control over financial reporting and such report is also included in this annual report. 28
49 REPORT OF INDEPENDENT REGISTERED PUBLIC ACCOUNTING FIRM To the Board of Directors and Stockholders of MGM Resorts International We have audited the internal control over financial reporting of MGM Resorts International and subsidiaries (the Company ) as of December 31, 2010, based on criteria established in Internal Control Integrated Framework issued by the Committee of Sponsoring Organizations of the Treadway Commission. The Company s management is responsible for maintaining effective internal control over financial reporting and for its assessment of the effectiveness of internal control over financial reporting, included in the accompanying Management s Annual Report on Internal Control Over Financial Reporting. Our responsibility is to express an opinion on the effectiveness of the Company s internal control over financial reporting based on our audit. We conducted our audit in accordance with the standards of the Public Company Accounting Oversight Board (United States). Those standards require that we plan and perform the audit to obtain reasonable assurance about whether effective internal control over financial reporting was maintained in all material respects. Our audit included obtaining an understanding of internal control over financial reporting, assessing the risk that a material weakness exists, testing and evaluating the design and operating effectiveness of internal control based on the assessed risk, and performing such other procedures as we considered necessary in the circumstances. We believe that our audit provides a reasonable basis for our opinion. A company s internal control over financial reporting is a process designed by, or under the supervision of, the company s principal executive and principal financial officers, or persons performing similar functions, and effected by the company s board of directors, management, and other personnel to provide reasonable assurance regarding the reliability of financial reporting and the preparation of financial statements for external purposes in accordance with generally accepted accounting principles. A company s internal control over financial reporting includes those policies and procedures that (1) pertain to the maintenance of records that, in reasonable detail, accurately and fairly reflect the transactions and dispositions of the assets of the company; (2) provide reasonable assurance that transactions are recorded as necessary to permit preparation of financial statements in accordance with generally accepted accounting principles, and that receipts and expenditures of the company are being made only in accordance with authorizations of management and directors of the company; and (3) provide reasonable assurance regarding prevention or timely detection of unauthorized acquisition, use, or disposition of the company s assets that could have a material effect on the financial statements. Because of the inherent limitations of internal control over financial reporting, including the possibility of collusion or improper management override of controls, material misstatements due to error or fraud may not be prevented or detected on a timely basis. Also, projections of any evaluation of the effectiveness of the internal control over financial reporting to future periods are subject to the risk that the controls may become inadequate because of changes in conditions, or that the degree of compliance with the policies or procedures may deteriorate. In our opinion, the Company maintained, in all material respects, effective internal control over financial reporting as of December 31, 2010, based on the criteria established in Internal Control Integrated Framework issued by the Committee of Sponsoring Organizations of the Treadway Commission. We have also audited, in accordance with the standards of the Public Company Accounting Oversight Board (United States), the consolidated financial statements as of and for the year ended December 31, Our report dated February 28, 2011 expressed an unqualified opinion on those financial statements. /s/ DELOITTE & TOUCHE LLP Las Vegas, Nevada February 28,
50 REPORT OF INDEPENDENT REGISTERED PUBLIC ACCOUNTING FIRM To the Board of Directors and Stockholders of MGM Resorts International We have audited the accompanying consolidated balance sheets of MGM Resorts International and subsidiaries (the Company ) as of December 31, 2010 and 2009, and the related consolidated statements of operations, stockholders equity, and cash flows for each of the three years in the period ended December 31, These financial statements are the responsibility of the Company s management. Our responsibility is to express an opinion on the financial statements based on our audits. We conducted our audits in accordance with the standards of the Public Company Accounting Oversight Board (United States). Those standards require that we plan and perform the audit to obtain reasonable assurance about whether the financial statements are free of material misstatement. An audit includes examining, on a test basis, evidence supporting the amounts and disclosures in the financial statements. An audit also includes assessing the accounting principles used and significant estimates made by management, as well as evaluating the overall financial statement presentation. We believe that our audits provide a reasonable basis for our opinion. In our opinion, such consolidated financial statements present fairly, in all material respects, the financial position of MGM Resorts International and subsidiaries as of December 31, 2010 and 2009, and the results of their operations and their cash flows for each of the three years in the period ended December 31, 2010, in conformity with accounting principles generally accepted in the United States of America. We have also audited, in accordance with the standards of the Public Company Accounting Oversight Board (United States), the Company s internal control over financial reporting as of December 31, 2010, based on the criteria established in Internal Control Integrated Framework issued by the Committee of Sponsoring Organizations of the Treadway Commission and our report dated February 28, 2011, expressed an unqualified opinion on the Company s internal control over financial reporting. /s/ DELOITTE & TOUCHE LLP Las Vegas, Nevada February 28,
51 MGM RESORTS INTERNATIONAL AND SUBSIDIARIES CONSOLIDATED BALANCE SHEETS (In thousands, except share data) At December 31, ASSETS Current assets Cash and cash equivalents... $ 498,964 $ 2,056,207 Accounts receivable, net , ,474 Inventories... 96, ,809 Income tax receivable , ,555 Deferred income taxes ,092 38,487 Prepaid expenses and other , ,969 Total current assets... 1,455,645 3,053,501 Property and equipment, net... 14,554,350 15,069,952 Other assets Investments in and advances to unconsolidated affiliates... 1,923,155 3,611,799 Goodwill... 86,353 86,353 Other intangible assets, net , ,253 Other long-term assets, net , ,352 Total other assets... 2,951,050 4,394,757 $ 18,961,045 $ 22,518,210 LIABILITIES AND STOCKHOLDERS EQUITY Current liabilities Accounts payable... $ 167,084 $ 173,719 Current portion of long-term debt ,079,824 Accrued interest on long-term debt , ,357 Other accrued liabilities , ,701 Total current liabilities... 1,246,221 2,383,601 Deferred income taxes... 2,469,333 3,031,303 Long-term debt... 12,047,698 12,976,037 Other long-term obligations , ,837 Commitments and contingencies (Note 10) Stockholders equity Common stock, $.01 par value: authorized 600,000,000 shares; Issued and outstanding 488,513,351 and 441,222,251 shares.... 4,885 4,412 Capital in excess of par value... 4,060,826 3,497,425 Retained earnings (accumulated deficit)... (1,066,865) 370,532 Accumulated other comprehensive loss... (301) (1,937) Total stockholders equity... 2,998,545 3,870,432 $ 18,961,045 $ 22,518,210 The accompanying notes are an integral part of these consolidated financial statements. 31
52 MGM RESORTS INTERNATIONAL AND SUBSIDIARIES CONSOLIDATED STATEMENTS OF OPERATIONS (In thousands, except per share data) Year Ended December 31, Revenues Casino.... $ 2,442,927 $ 2,618,060 $ 2,975,680 Rooms.... 1,300,287 1,370,135 1,907,093 Food and beverage... 1,339,174 1,362,325 1,582,367 Entertainment , , ,310 Retail , , ,053 Other , , ,288 Reimbursed costs ,470 99,379 47,404 6,652,761 6,644,282 7,884,195 Less: Promotional allowances... (633,528) (665,693) (675,428) 6,019,233 5,978,589 7,208,767 Expenses Casino.... 1,385,763 1,459,944 1,618,914 Rooms , , ,559 Food and beverage , , ,716 Entertainment , , ,822 Retail , , ,859 Other , , ,100 Reimbursed costs ,470 99,379 47,404 General and administrative... 1,128,803 1,100,193 1,278,944 Corporate expense , , ,279 Preopening and start-up expenses... 4,247 53,013 23,059 Property transactions, net... 1,451,474 1,328,689 1,210,749 Depreciation and amortization , , ,236 7,099,730 6,854,238 7,434,641 Income (loss) from unconsolidated affiliates... (78,434) (88,227) 96,271 Operating loss... (1,158,931) (963,876) (129,603) Non-operating income (expense) Interest expense, net... (1,113,580) (775,431) (609,286) Non-operating items from unconsolidated affiliates... (108,731) (47,127) (34,559) Other, net ,217 (226,159) 104,460 (1,057,094) (1,048,717) (539,385) Loss before income taxes... (2,216,025) (2,012,593) (668,988) Benefit (provision) for income taxes , ,911 (186,298) Net loss... $ (1,437,397) $ (1,291,682) $ (855,286) Loss per share of common stock Basic.... $ (3.19) $ (3.41) $ (3.06) Diluted... $ (3.19) $ (3.41) $ (3.06) The accompanying notes are an integral part of these consolidated financial statements. 32
53 MGM RESORTS INTERNATIONAL AND SUBSIDIARIES CONSOLIDATED STATEMENTS OF CASH FLOWS (In thousands) Year Ended December 31, Cash flows from operating activities Net loss... $ (1,437,397) $ (1,291,682) $ (855,286) Adjustments to reconcile net loss to net cash provided by operating activities: Depreciation and amortization , , ,236 Amortization of debt discounts, premiums and issuance costs ,983 50,852 10,620 (Gain) loss on retirement of long-term debt... (132,126) 61,563 (87,457) Provision for doubtful accounts ,832 54,074 80,293 Stock-based compensation... 34,988 36,571 36,277 Business interruption insurance lost profits... - (15,115) (9,146) Business interruption insurance cost recovery (27,883) Property transactions, net... 1,451,474 1,328,689 1,210,749 Convertible note investment impairment ,690 - Loss (income) from unconsolidated affiliates , ,178 (40,752) Distributions from unconsolidated affiliates... 92,706 93,886 70,546 Change in deferred income taxes... (634,082) (344,690) 79,516 Change in current assets and liabilities: Accounts receivable... (17,376) (121,088) 20,500 Inventories... 5,418 6,571 12,366 Income taxes receivable and payable, net ,986 (334,522) (346,878) Prepaid expenses and other.... 1,647 (17,427) 14,983 Accounts payable and accrued liabilities... 11,208 37,158 (187,858) Business interruption insurance recoveries ,391 28,891 Other.... (12,329) (26,458) (34,685) Net cash provided by operating activities , , ,032 Cash flows from investing activities Capital expenditures, net of construction payable... (207,491) (136,850) (781,754) Proceeds from sale of Treasure Island, net ,266 - Dispositions of property and equipment... 77,601 22,291 85,968 Investments in and advances to unconsolidated affiliates... (553,000) (963,685) (1,279,462) Distributions from unconsolidated affiliates in excess of earnings , Distributions from cost method investments , Property damage insurance recoveries ,186 21,109 Investments in treasury securities- maturities longer than 90 days... (149,999) - - Other... (1,670) (5,463) (27,301) Net cash used in investing activities... (586,079) (330,255) (1,981,440) Cash flows from financing activities Net borrowings (repayments) under bank credit facilities maturities of 90 days or less... (1,886,079) (1,027,193) 2,760,450 Borrowings under bank credit facilities maturities longer than 90 days.... 9,486,223 6,771,492 8,170,000 Repayments under bank credit facilities maturities longer than 90 days... (10,807,860) (5,942,455) (8,450,000) Issuance of senior notes.... 2,489,485 1,921, ,490 Retirement of senior notes... (1,154,479) (1,176,452) (789,146) Debt issuance costs.... (106,831) (112,055) (48,700) Issuance of common stock in public offering, net ,456 1,104,418 - Purchases of common stock (1,240,856) Capped call transactions... (81,478) - - Repayment of Detroit Economic Development Corporation bonds... - (49,393) - Other... (2,615) (1,363) 21,844 Net cash provided by (used in) financing activities... (1,475,178) 1,488,750 1,122,082 Cash and cash equivalents Net increase (decrease) for the period... (1,557,243) 1,746,409 (106,326) Change in cash related to assets held for sale ,154 (14,154) Balance, beginning of period... 2,056, , ,124 Balance, end of period... $ 498,964 $ 2,056,207 $ 295,644 Supplemental cash flow disclosures Interest paid, net of amounts capitalized... $ 1,020,040 $ 807,523 $ 622,297 Federal, state and foreign income taxes paid, net of refunds... (330,218) (53,863) 437,874 Non-cash investing and financing activities Increase (decrease) in investment in CityCenter related to change in completion guarantee liability (including delayed equity contribution in 2008)... $ 358,708 $ (55,000) $ 1,111,837 The accompanying notes are an integral part of these consolidated financial statements. 33
54 MGM RESORTS INTERNATIONAL AND SUBSIDIARIES CONSOLIDATED STATEMENTS OF STOCKHOLDERS EQUITY For the Years ended December 31, 2010, 2009 and 2008 (In thousands) Common Stock Shares Outstanding Par Value Capital in Excess of Par Value Treasury Stock Retained Earnings (Accumulated Deficit) Accumulated Other Comprehensive Income (Loss) Total Stockholders Equity Balances, January 1, ,769 $ 3,684 $ 3,951,162 $ (2,115,107) $ 4,220,408 $ 556 $ 6,060,703 Net income (855,286) - (855,286) Currency translation adjustment (3,190) (3,190) Valuation adjustment to M Resort convertible note, net of taxes (54,267) (54,267) Total comprehensive loss (912,743) Stock-based compensation , ,418 Change in excess tax benefit from stock-based compensation , ,494 Issuance of common stock pursuant to stock-based compensation awards , ,116 Purchases of treasury stock..... (18,150) - - (1,240,856) - - (1,240,856) Other Balances, December 31, ,507 3,693 4,018,410 (3,355,963) 3,365,122 (56,901) 3,974,361 Net loss (1,291,682) - (1,291,682) Currency translation adjustment Reclass M resort convertible note valuation adjustment to current earnings ,267 54,267 Other comprehensive income from unconsolidated affiliate, net Total comprehensive loss (1,236,718) Stock-based compensation , ,050 Change in excess tax benefit from stock-based compensation (14,854) (14,854) Issuance of common stock , (549,354) 3,355,963 (1,702,908) - 1,104,418 Issuance of common stock pursuant to stock-based compensation awards (29) (27) Other Balances, December 31, ,222 4,412 3,497, ,532 (1,937) 3,870,432 Net loss (1,437,397) - (1,437,397) Currency translation adjustment ,706 1,706 Other comprehensive loss from unconsolidated affiliate, net (70) (70) Total comprehensive loss (1,435,761) Stock-based compensation , ,247 Change in excess tax benefit from stock-based compensation (10,840) (10,840) Issuance of common stock , , ,456 Issuance of common stock pursuant to stock-based compensation awards (1,248) (1,245) Capped call transactions (52,961) (52,961) Other Balances, December 31, ,513 $ 4,885 $ 4,060,826 $ - $ (1,066,865) $ (301) $ 2,998,545 The accompanying notes are an integral part of these consolidated financial statements. 34
55 NOTE 1 ORGANIZATION MGM RESORTS INTERNATIONAL AND SUBSIDIARIES NOTES TO CONSOLIDATED FINANCIAL STATEMENTS MGM Resorts International (the Company ) is a Delaware corporation, formerly named MGM MIRAGE. As of December 31, 2010, approximately 27% of the outstanding shares of the Company s common stock were owned by Tracinda Corporation, a Nevada corporation wholly-owned by Kirk Kerkorian ( Tracinda ). Tracinda has significant influence with respect to the election of directors and other matters, but it does not have the power to solely determine these matters. MGM Resorts International acts largely as a holding company and, through whollyowned subsidiaries, owns and/or operates casino resorts. The Company owns and operates the following casino resorts in Las Vegas, Nevada: Bellagio, MGM Grand Las Vegas, The Mirage, Mandalay Bay, Luxor, New York-New York, Monte Carlo, Excalibur, and Circus Circus Las Vegas. Operations at MGM Grand Las Vegas include management of The Signature at MGM Grand Las Vegas, a condominium-hotel consisting of three towers. Other Nevada operations include Circus Circus Reno, Gold Strike in Jean, and Railroad Pass in Henderson. The Company and its local partners own and operate MGM Grand Detroit in Detroit, Michigan. The Company also owns and operates two resorts in Mississippi: Beau Rivage in Biloxi and Gold Strike Tunica. The Company also owns Shadow Creek, an exclusive world-class golf course located approximately ten miles north of its Las Vegas Strip resorts, Primm Valley Golf Club at the California/Nevada state line and Fallen Oak golf course in Saucier, Mississippi. The Company owns 50% of CityCenter, located between Bellagio and Monte Carlo. The other 50% of CityCenter is owned by Infinity World Development Corp ( Infinity World ), a wholly-owned subsidiary of Dubai World, a Dubai, United Arab Emirates government decree entity. CityCenter consists of Aria, a 4,004-room casino resort; Mandarin Oriental Las Vegas, a 392-room non-gaming boutique hotel; Crystals, a retail district with 334,000 of currently leaseable square feet; and Vdara, a 1,495-room luxury condominium-hotel. In addition, CityCenter features residential units in the Residences at Mandarin Oriental 225 units and Veer 669 units. Aria, Vdara, Mandarin Oriental and Crystals all opened in December 2009 and the residential units within CityCenter began closing in early The Company receives a management fee of 2% of revenues for the management of Aria and Vdara, and 5% of EBITDA (as defined in the agreements governing the Company s management of Aria and Vdara). In addition, the Company receives an annual fee of $3 million for the management of Crystals. The Company has 50% interests in MGM Macau, Grand Victoria and Silver Legacy. Pansy Ho Chiu-King owns the other 50% of MGM Macau. Grand Victoria is a riverboat casino in Elgin, Illinois; an affiliate of Hyatt Gaming owns the other 50% of Grand Victoria and also operates the resort. Silver Legacy is located in Reno, adjacent to Circus Circus Reno, and the other 50% is owned by Eldorado LLC. The Company also has a 50% economic interest in Borgata Hotel Casino & Spa ( Borgata ) located on Renaissance Pointe in the Marina area of Atlantic City, New Jersey; the Company s interest is held in trust and currently offered for sale. Boyd Gaming Corporation ( Boyd ) owns the other 50% of Borgata and also operates the resort. See Note 5 for further discussion of Borgata. The Company owns additional land adjacent to Borgata, a portion of which consists of common roads, landscaping and master plan improvements, and a portion of which was planned for a wholly-owned development, MGM Grand Atlantic City. As part of the settlement discussed in Note 5, the Company has agreed that an affiliate of the Company would withdraw its license application for this development. MGM Hospitality seeks to leverage the Company s management expertise and well-recognized brands through strategic partnerships and international expansion opportunities. The Company has entered into management agreements for hotels in the Middle East, North Africa, India and China. NOTE 2 SIGNIFICANT ACCOUNTING POLICIES AND BASIS OF PRESENTATION Principles of consolidation. The consolidated financial statements include the accounts of the Company and its subsidiaries. The Company s investments in unconsolidated affiliates which are 50% or less owned are accounted for under the equity method. The Company does not have a variable interest in any variable interest entities. All 35
56 intercompany balances and transactions have been eliminated in consolidation. The Company s operations are primarily in one segment: the operation of casino resorts. Other operations and foreign operations are not material. Management s use of estimates. The consolidated financial statements have been prepared in conformity with accounting principles generally accepted in the United States of America. These principles require the Company s management to make estimates and assumptions that affect the reported amounts of assets and liabilities and disclosure of contingent assets and liabilities at the date of the financial statements and the reported amounts of revenues and expenses during the reporting period. Actual results could differ from those estimates. Reclassifications. The consolidated financial statements for prior years reflect certain reclassifications, which have no effect on previously reported net income, to conform to the current year presentation. The prior year reclassifications relate to the classification of reimbursed costs as separate financial statement line items, while in past periods these costs were recorded to Other revenues and expenses. The total amounts reclassified to reimbursed costs revenue and expense for the years ended 2009 and 2008 were $99 million and $47 million, respectively. Fair value measurements. Fair value measurements affect the Company s accounting and impairment assessments of its long-lived assets, investments in unconsolidated affiliates, cost method investments, goodwill, and other intangibles. Fair value measurements also affect the Company s accounting for certain of its financial assets and liabilities. Fair value is defined as the price that would be received to sell an asset or paid to transfer a liability in an orderly transaction between market participants at the measurement date and is measured according to a hierarchy that includes: Level 1 inputs, such as quoted prices in an active market; Level 2 inputs, which are observable inputs for similar assets; or Level 3 inputs, which are unobservable inputs. The Company uses fair value measurements when assessing impairment of its investments in unconsolidated affiliates. The Company estimates such fair value using a discounted cash flow analysis utilizing Level 3 inputs, including market indicators of discount rates and terminal year capitalization rates. See Note 5 for further discussion. In connection with its accounting for the March 2010 amended and restated credit facility as discussed in Note 8, the Company estimated fair value of its senior credit facility using Level 1 inputs. The Company also uses Level 1 inputs for its long-term debt fair value disclosures. The Company used fair value measurements in the accounting for its investment in The M Resort LLC 6% convertible note and embedded call option (the M Resort Note ). As of June 30, 2009, the fair value of the convertible note and embedded call option was measured using Level 3 inputs. See below under Investment in The M Resort LLC convertible note for further discussion of the valuation of the M Resort Note. At December 31, 2009, the fair value of the Company s carrying value of its Renaissance Pointe land holdings was measured using Level 2 and Level 3 inputs. See below under Property and Equipment for further discussion of the Renaissance Pointe impairment. During 2008, the Company used Level 2 inputs to evaluate the fair value of its Primm Valley Golf Club ( PVGC ). See below under Property and Equipment for further discussion of the PVGC impairment. Cash and cash equivalents. Cash and cash equivalents include investments and interest bearing instruments with maturities of 90 days or less at the date of acquisition. Such investments are carried at cost, which approximates market value. Book overdraft balances resulting from the Company s cash management program are recorded as accounts payable, construction payable, or other accrued liabilities, as applicable. Accounts receivable and credit risk. Financial instruments that potentially subject the Company to concentrations of credit risk consist primarily of casino accounts receivable. The Company issues markers to approved casino customers following background checks and investigations of creditworthiness. At December 31, 2010, a substantial portion of the Company s receivables was due from customers residing in foreign countries. Business or economic conditions or other significant events in these countries could affect the collectibility of such receivables. Accounts receivable are typically non-interest bearing and are initially recorded at cost. Accounts are written off when management deems the account to be uncollectible. Recoveries of accounts previously written off are 36
57 recorded when received. An estimated allowance for doubtful accounts is maintained to reduce the Company s receivables to their net carrying amount, which approximates fair value. The allowance is estimated based on specific review of customer accounts as well as historical collection experience and current economic and business conditions. Management believes that as of December 31, 2010, no significant concentrations of credit risk existed for which an allowance had not already been recorded. Inventories. Inventories consist primarily of food and beverage, retail merchandise and operating supplies, and are stated at the lower of cost or market. Cost is determined primarily using the average cost method for food and beverage and operating supplies. Cost for retail merchandise is determined using the retail inventory method or specific identification method. Property and equipment. Property and equipment are stated at cost. Gains or losses on dispositions of property and equipment are included in the determination of income. Maintenance costs are expensed as incurred. Property and equipment are generally depreciated over the following estimated useful lives on a straight-line basis: Buildings and improvements.... Land improvements... Furniture and fixtures.... Equipment... 20to40years 10to20years 3to20years 3to20years The Company evaluates its property and equipment and other long-lived assets for impairment based on its classification as a) held for sale or b) to be held and used. Several criteria must be met before an asset is classified as held for sale, including that management with the appropriate authority commits to a plan to sell the asset at a reasonable price in relation to its fair value and is actively seeking a buyer. For assets held for sale, the Company recognizes the asset at the lower of carrying value or fair market value less costs to sell, as estimated based on comparable asset sales, offers received, or a discounted cash flow model. For assets to be held and used, the Company reviews for impairment whenever indicators of impairment exist. The Company then compares the estimated future cash flows of the asset, on an undiscounted basis, to the carrying value of the asset. If the undiscounted cash flows exceed the carrying value, no impairment is indicated. If the undiscounted cash flows do not exceed the carrying value, then an impairment is recorded based on the fair value of the asset, typically measured using a discounted cash flow model. If an asset is still under development, future cash flows include remaining construction costs. All recognized impairment losses, whether for assets held for sale or assets to be held and used, are recorded as operating expenses. The Company reviewed the carrying value of its Renaissance Pointe land holdings for impairment at December 31, 2009 as management did not intend to pursue its MGM Grand Atlantic City project for the foreseeable future. The Company s Board of Directors subsequently terminated this project. The Company s Renaissance Pointe land holdings include a 72-acre development site and included 11 acres of land subject to a longterm lease with the Borgata joint venture. The fair value of the development land was determined based on a market approach and the fair value of land subject to the long-term lease with Borgata was determined using a discounted cash flow analysis using expected contractual cash flows under the lease discounted at a market capitalization rate. As a result, the Company recorded a non-cash impairment charge of $548 million in the 2009 fourth quarter, which was included in Property transactions, net, related to its land holdings on Renaissance Pointe and capitalized development costs. During 2008, the Company concluded that the Primm Valley Golf Club ( PVGC ) should be reviewed for impairment due to its recent operating losses and the Company s expectation that such operating losses will continue. The estimated future undiscounted cash flows of PVGC did not exceed its carrying value. The Company determined the estimated fair value of PVGC to be approximately $14 million based on the comparable sales approach. The carrying value of PVGC exceeds its estimated fair value and as a result, the Company recorded an impairment charge of $30 million which is included in Property transactions, net for the year ended December 31, Capitalized interest. The interest cost associated with major development and construction projects is capitalized and included in the cost of the project. When no debt is incurred specifically for a project, interest is capitalized on amounts expended on the project using the weighted-average cost of the Company s outstanding 37
58 borrowings. Capitalization of interest ceases when the project is substantially complete or development activity is suspended for more than a brief period. Investment in The M Resort LLC convertible note. At June 30, 2009, the Company determined that the fair value of the M Resort Note was $0, that the decline in value was other-than-temporary, and that the entire amount of the indicated impairment related to a credit loss. The conclusion that the decline in value was other-than-temporary was based on the Company s assessment of actual results since the opening of the M Resort and M Resort s management s revised cash flow projections since its opening, which were significantly lower than original predictions due to market and general economic conditions. Based on the conclusions above, the Company recorded a pre-tax impairment charge of $176 million the accreted value as of May 31, 2009 in the second quarter of 2009 within Other, net non-operating expense. Of that amount, $82 million was reclassified from accumulated other comprehensive loss, which amount was $54 million net of tax. The Company stopped recording accrued paid-in-kind interest as of May 31, 2009, and no longer holds this note. Investments in and advances to unconsolidated affiliates. The Company has investments in unconsolidated affiliates accounted for under the equity method. Under the equity method, carrying value is adjusted for the Company s share of the investees earnings and losses, as well as capital contributions to and distributions from these companies. Distributions in excess of equity method earnings are recognized as a return of investment and recorded as investing cash inflows in the accompanying consolidated statement of cash flows. The Company evaluates its investments in unconsolidated affiliates for impairment whenever events or changes in circumstances indicate that the carrying value of its investment may have experienced an other-than-temporary decline in value. If such conditions exist, the Company compares the estimated fair value of the investment to its carrying value to determine if an impairment is indicated and determines whether the impairment is other-than-temporary based on its assessment of all relevant factors, including consideration of the Company s intent and ability to retain its investment. The Company estimates fair value using a discounted cash flow analysis based on estimated future results of the investee and market indicators of terminal year capitalization rates. See Note 5 for results of the Company s review of its investment in certain of its unconsolidated affiliates. Goodwill and other intangible assets. Goodwill represents the excess of purchase price over fair market value of net assets acquired in business combinations. Goodwill and indefinite-lived intangible assets must be reviewed for impairment at least annually and between annual test dates in certain circumstances. The Company performs its annual impairment tests in the fourth quarter of each fiscal year. No impairments were indicated as a result of the annual impairment review for goodwill and indefinite-lived intangible assets in 2010 and See Note 6 for results of the Company s 2008 annual impairment tests. Goodwill for relevant reporting units is tested for impairment using a discounted cash flow analysis based on the estimated future results of the Company s reporting units discounted using the Company s weighted average cost of capital and market indicators of terminal year capitalization rates. The implied fair value of a reporting unit s goodwill is compared to the carrying value of that goodwill. The implied fair value of goodwill is determined by allocating the fair value of the reporting unit to its assets and liabilities and the amount remaining, if any, is the implied fair value of goodwill. If the implied fair value of the goodwill is less than its carrying value then it must be written down to its implied fair value. License rights are tested for impairment using a discounted cash flow approach, and trademarks are tested for impairment using the relief-from-royalty method. If the fair value of an indefinite-lived intangible asset is less than its carrying amount, an impairment loss must be recognized equal to the difference. Revenue recognition and promotional allowances. Casino revenue is the aggregate net difference between gaming wins and losses, with liabilities recognized for funds deposited by customers before gaming play occurs ( casino front money ) and for chips in the customers possession ( outstanding chip liability ). Hotel, food and beverage, entertainment and other operating revenues are recognized as services are performed. Advance deposits on rooms and advance ticket sales are recorded as accrued liabilities until services are provided to the customer. 38
59 Gaming revenues are recognized net of certain sales incentives, including discounts and points earned in pointloyalty programs. The retail value of accommodations, food and beverage, and other services furnished to guests without charge is included in gross revenue and then deducted as promotional allowances. The estimated cost of providing such promotional allowances is primarily included in casino expenses as follows: Year Ended December 31, (In thousands) Rooms... $ 104,264 $ 105,821 $ 91,292 Food and beverage , , ,522 Other... 30,683 32,450 30,742 $ 384,058 $ 399,918 $ 410,556 Reimbursed expenses. The Company recognizes costs reimbursed pursuant to management services as revenue in the period it incurs the costs. Reimbursed costs related mainly to the Company s management of CityCenter and totaled $359 million for 2010, $99 million for 2009 and $47 million for Loyalty programs. In 2010, the Company s primary point-loyalty program in operation at most of its whollyowned resorts and Aria was Players Club. In Players Club, customers earn points based on their slots play, which can be redeemed for cash or free play at any of the Company s participating resorts. The Company records a liability based on the points earned multiplied by the redemption value less an estimate for points not expected to be redeemed and records a corresponding reduction in casino revenue. Customers overall level of table games and slots play is also tracked and used by management in awarding discretionary complimentaries free rooms, food and beverage and other services for which no accrual is recorded. Other loyalty programs at the Company s resorts typically operate in a similar manner, though they generally are available only to customers at the individual resorts. At both December 31, 2010 and 2009, the total company-wide liability for point-loyalty programs was $47 million. The Company implemented a new loyalty program ( M life ) at MGM Grand Detroit, Beau Rivage, and Gold Strike Tunica during the third quarter of 2010 and at its participating Las Vegas resorts in January Customers continue to earn points based on their slots play, which can be redeemed for free play at any of the Company s participating resorts. Under the new program, customers also earn credits ( express comps ) based on their slots play and table games play, which can be redeemed for complimentary services, including hotel rooms, food and beverage, and entertainment. The Company records a liability for the estimated costs of providing services for express comps based on the express comps earned multiplied by a cost margin less an estimate for express comps not expected to be redeemed and records a corresponding expense in the casino department. Advertising. The Company expenses advertising costs the first time the advertising takes place. Advertising expense, which is generally included in general and administrative expenses, was $123 million, $118 million, and $122 million for 2010, 2009 and 2008, respectively. Corporate expense. Corporate expense represents unallocated payroll and aircraft costs, professional fees and various other expenses not directly related to the Company s casino resort operations. In addition, corporate expense includes the costs associated with the Company s evaluation and pursuit of new business opportunities, which are expensed as incurred until development of a specific project has become probable. Preopening and start-up expenses. Preopening and start-up costs, including organizational costs, are expensed as incurred. Costs classified as preopening and start-up expenses include payroll, outside services, advertising, and other expenses related to new or start-up operations and new customer initiatives. Property transactions, net. The Company classifies transactions such as write-downs and impairments, demolition costs, and normal gains and losses on the sale of assets as Property transactions, net. See Note 14 for a detailed discussion of these amounts. 39
60 Income per share of common stock. The weighted-average number of common and common equivalent shares used in the calculation of basic and diluted earnings per share consisted of the following: Year Ended December 31, (In thousands) Weighted-average common shares outstanding used in the calculation of basic earnings per share , , ,815 Potential dilution from stock options, stock appreciation rights, restricted stock and convertible debt Weighted-average common and common equivalent shares used in the calculation of diluted earnings per share , , ,815 The Company had a loss from continuing operations for the years ended December 31, 2010, 2009 and Therefore, the approximately 28 million, 29 million and 26 million shares, respectively, underlying outstanding stock-based awards were excluded from the computation of diluted earnings per share for these periods because to include these awards would be anti-dilutive. In addition, the effect of an assumed conversion of the Company s convertible senior notes due 2015 would be anti-dilutive. Currency translation. The Company translates the financial statements of foreign subsidiaries which are not denominated in US dollars. Balance sheet accounts are translated at the exchange rate in effect at each balance sheet date. Income statement accounts are translated at the average rate of exchange prevailing during the period. Translation adjustments resulting from this process are charged or credited to other comprehensive income. Comprehensive income. Comprehensive income includes net income (loss) and all other non-stockholder changes in equity, or other comprehensive income. Elements of the Company s other accumulated comprehensive loss are reported in the accompanying consolidated statements of stockholders equity, and the cumulative balance of these elements consisted of the following: At December 31, (In thousands) Other comprehensive income from unconsolidated affiliates... $ 95 $ 165 Currency translation adjustments... (396) (2,102) $ (301) $ (1,937) Financial statement impact of Monte Carlo fire. The Company maintains insurance for both property damage and business interruption relating to catastrophic events, such as the rooftop fire at Monte Carlo in January Business interruption insurance covers lost profits and other costs incurred during the closure period and up to six months following re-opening. Non-refundable insurance recoveries received in excess of the net book value of damaged assets, clean-up and demolition costs, and post-event costs are recognized as income in the period received or committed based on the Company s estimate of the total claim for property damage and business interruption compared to the recoveries received at that time. Gains on insurance recoveries related to business interruption are recorded within General and administrative expenses and gains related to property damage are recorded within Property transactions, net. Insurance recoveries related to business interruption are classified as operating cash flows and recoveries related to property damage are classified as investing cash flows in the statement of cash flows. The Company settled its final claim with its insurance carriers related to the Monte Carlo fire in 2009 for a total of $74 million. The pre-tax impact on the Company s statements of operations for the year ended December 31, 2009 related to such insurance recoveries included a $15 million reduction of General and administrative expense and a $7 million offset to Property transactions, net. In 2008, $9 million and $10 million of such excess insurance recoveries were recognized as offsets to General and administrative expense and Property transactions, net, respectively. 40
61 Sale of TI. On March 20, 2009, the Company closed the sale of the Treasure Island casino resort ( TI ) to Ruffin Acquisition, LLC for net proceeds to the Company of approximately $746 million and recognized a pre-tax gain of $187 million related to the sale, which is included within Property transactions, net. In connection with the sale of TI, including the transfer of all of the membership interests of TI, TI was released as a guarantor of the outstanding indebtedness of the Company and its subsidiaries. As a result of the sale, the Company evaluated TI s operations for potential treatment as discontinued operations. The Company concluded significant customer migration would occur because there was a shared customer base through the Company s customer loyalty rewards program and because of the physical proximity of TI to the Company s other Las Vegas Strip resorts. Most of the loyalty rewards program customers of TI were also customers of one or more of the Company s other resorts. The Company retained the ability to market to these customers after the sale and believes the loyalty rewards program is an important factor in the migration of customer play to the Company s other resorts. The Company expects the cash flow benefits of such migration to continue for an indefinite period. Therefore, the results of the TI operations through the time of sale have not been classified as discontinued operations. Recently Issued Accounting Standards. Certain amendments to Accounting Standards Codification ( ASC ) Topic 810, Consolidation, became effective for the Company beginning January 1, Such amendments include changes to the quantitative approach to determine the primary beneficiary of a variable interest entity ( VIE ). An enterprise must determine if its variable interest or interests give it a controlling financial interest in a VIE by evaluating whether 1) the enterprise has the power to direct activities of the VIE that have a significant effect on economic performance, and 2) the enterprise has an obligation to absorb losses or the right to receive benefits from the entity that could potentially be significant to the VIE. The amendments to ASC 810 also require ongoing reassessments of whether an enterprise is the primary beneficiary of a VIE. The adoption of these amendments did not have a material effect on the Company s consolidated financial statements. NOTE 3 ACCOUNTS RECEIVABLE, NET Accounts receivable consisted of the following: At December 31, (In thousands) Casino... $ 229,318 $ 261,025 Hotel , ,390 Other... 66,449 87, , ,580 Less: Allowance for doubtful accounts... (93,760) (97,106) $ 321,894 $ 368,474 NOTE 4 PROPERTY AND EQUIPMENT, NET Property and equipment consisted of the following: At December 31, (In thousands) Land... $ 7,039,806 $ 7,121,002 Buildings, building improvements and land improvements.... 8,504,655 8,428,766 Furniture, fixtures and equipment... 3,768,476 3,814,597 Construction in progress... 72,843 66,902 19,385,780 19,431,267 Less: Accumulated depreciation and amortization... (4,831,430) (4,361,315) $ 14,554,350 $ 15,069,952 41
62 NOTE 5 INVESTMENTS IN AND ADVANCES TO UNCONSOLIDATED AFFILIATES Investments in and advances to unconsolidated affiliates consisted of the following: At December 31, (In thousands) CityCenter Holdings, LLC CityCenter (50%)... $ 1,417,843 $ 2,546,099 Marina District Development Company Borgata (50)% ,774 Elgin Riverboat Resort Riverboat Casino Grand Victoria (50%) , ,248 MGM Grand Paradise Limited Macau (50%) , ,465 Circus and Eldorado Joint Venture Silver Legacy (50%) ,408 28,345 Other... 12,569 15,868 $ 1,923,155 $ 3,611,799 The Company recorded its share of the results of operations of unconsolidated affiliates as follows: Year Ended December 31, (In thousands) Income (loss) from unconsolidated affiliates... $ (78,434) $ (88,227) $ 96,271 Preopening and start-up expenses... (3,494) (52,824) (20,960) Non-operating items from unconsolidated affiliates... (108,731) (47,127) (34,559) $ (190,659) $ (188,178) $ 40,752 CityCenter Completion guarantee. In accordance with the CityCenter joint venture agreement, as amended, and the CityCenter bank credit facility, as amended, the Company has provided an unlimited completion and cost overrun guarantee see Note 10 for further discussion. The terms of the completion guarantee provide up to $250 million of net residential proceeds from the sale of condominium properties at CityCenter would be permitted by CityCenter s lenders and the Company s joint venture partner to fund construction costs that the Company would otherwise be obligated to pay under the completion guarantee, or to reimburse the Company for construction costs previously expended; however, the timing of receipt of such proceeds is uncertain. As of December 31, 2010, the Company has funded $553 million under the completion guarantee. The Company has recorded a receivable from CityCenter of $124 million related to these amounts, which represents amounts reimbursable to the Company from CityCenter from future residential proceeds. At December 31, 2010, the Company s remaining estimated net obligation under the completion guarantee was $80 million. Distributions. The joint venture agreement provides that the first $494 million of available distributions must be distributed on a priority basis to Infinity World, with the next $494 million of distributions made to the Company, and distributions shared equally thereafter. Contributions. As of December 31, 2009 the Company and Infinity World had made all required equity contributions. In July 2010, the Company and Infinity World made additional capital contributions of $32.5 million each. The Company s contribution was made through a reduction in its receivable from CityCenter. A portion of Infinity World s cash contribution was used to repay an additional portion of the amounts owed to the Company for costs paid by the Company on behalf of the joint venture. In connection with the debt restructuring transactions discussed below, the Company and Infinity World made equity contributions of approximately $37 million each in January Investment impairments. At June 30, 2010 the Company reviewed its CityCenter investment for impairment using revised operating forecasts developed by CityCenter management. Based on current and forecasted market conditions and because CityCenter s results of operations through June 30, 2010 were below previous forecasts, and the revised operating forecasts were lower than previous forecasts, management concluded it should review the carrying value of its investment. The Company determined that the carrying value of its investment exceeded its fair 42
63 value determined using a discounted cash flow analysis and therefore an impairment was indicated. The Company intends to and believes it will be able to retain its investment in CityCenter; however, due to the extent of the shortfall and the Company s assessment of the uncertainty of fully recovering its investment, the Company determined that the impairment was other-than-temporary and recorded an impairment charge of $1.12 billion included in Property transactions, net. At September 30, 2010, the Company recognized an increase of $232 million in its total net obligation under its CityCenter completion guarantee, and a corresponding increase in its investment in CityCenter. The increase primarily reflects revisions to prior estimates based on the Company s assessment of the most current information derived from the CityCenter close-out and litigation processes and does not reflect certain potential recoveries that are being pursued as part of the litigation process. The Company completed an impairment review as of September 30, 2010 and as a result recorded an additional impairment of $191 million in the third quarter of 2010, included in Property transactions, net. The discounted cash flow analyses for the Company s investment in CityCenter included estimated future cash inflows from operations, including residential sales, and estimated future cash outflows for capital expenditures. The June 2010 and September 2010 analyses used an 11% discount rate and a long-term growth rate of 4% related to forecasted cash flows for CityCenter s operating assets. At September 30, 2009, the Company reviewed its CityCenter investment for impairment using revised operating forecasts developed by CityCenter management late in the third quarter. In addition, the impairment charge related to CityCenter s residential real estate under development discussed below further indicated that the Company s investment may have experienced an other-than-temporary decline in value. The Company s discounted cash flow analysis for CityCenter included estimated future cash outflows for construction and maintenance expenditures and future cash inflows from operations, including residential sales. Based on its analysis, the Company determined the carrying value of its investment exceeded its fair value and determined that the impairment was other-than-temporary. The Company recorded an impairment charge of $956 million included in Property transactions, net. Impairments of residential inventory. Included in loss from unconsolidated affiliates for the year ended December 31, 2010 is the Company s share of impairment charges relating to completed CityCenter residential inventory. Due to the completion of construction of the Mandarin Oriental residential inventory in the first quarter of 2010 and completion of the Veer residential inventory in the second quarter of 2010, CityCenter is required to carry its residential inventory at the lower of its carrying value or fair value less costs to sell. CityCenter determines fair value of its residential inventory using a discounted cash flow analysis based on management s expectations of future cash flows. The key inputs in the discounted cash flow analysis include estimated sales prices of units currently under contract and new unit sales, the absorption rate over the sell-out period, and the discount rate. These estimates are subject to management s judgment and are highly sensitive to changes in the market and economic conditions, including the estimated absorption period. In the event current sales forecasts are not met, additional impairment charges may be recognized in future periods. As a result of its impairment analyses of residential inventory, CityCenter recorded impairment charges for the Mandarin Oriental residential inventory of $171 million and $20 million in the first and third quarter of 2010, respectively and impairment charges for the Veer residential inventory of $57 million, $55 million and $27 million, in the second, third and fourth quarters of 2010, respectively. Impairment charges in the third quarter primarily related to an increase in final cost estimates for the residential inventory. The Company recognized its 50% share of such impairment charges, resulting in pre-tax charges of $166 million for the year ended December 31, 2010, respectively, included in Income (loss) from unconsolidated affiliates. Included in loss from unconsolidated affiliates for the year ended December 31, 2009 is the Company s share of an impairment charge relating to CityCenter residential real estate under development ( REUD ). CityCenter was required to review its REUD for impairment as of September 30, 2009, mainly due to CityCenter s September 2009 decision to discount the prices of its residential inventory by 30%. This decision and related market conditions led to CityCenter management s conclusion that the carrying value of the REUD was not recoverable based on estimates of undiscounted cash flows. As a result, CityCenter was required to compare the fair value of its REUD to its 43
64 carrying value and record an impairment charge for the shortfall. Fair value of the REUD was determined using a discounted cash flow analysis based on management s current expectations of future cash flows. The key inputs in the discounted cash flow analysis included estimated sales prices of units currently under contract and new unit sales, the absorption rate over the sell-out period, and the discount rate. This analysis resulted in an impairment charge of approximately $348 million of the REUD. The Company recognized its 50% share of such impairment charge, adjusted by certain basis differences, resulting in a pre-tax charge of $203 million. Harmon impairment. The Harmon Hotel & Spa ( Harmon ) was originally planned to include over 200 residential units and a 400-room non-gaming lifestyle hotel. In 2009, the Company announced that the opening of the Harmon hotel component would be delayed until the Company and its joint venture partner, Infinity World, mutually agreed to its completion, and that the residential component had been canceled. During the third quarter of 2010, CityCenter management determined that it is unlikely that the Harmon will be completed using the building as it now stands. As a result, CityCenter recorded an impairment charge of $279 million in the third quarter of 2010 related to construction in progress assets. The impairment of Harmon did not affect the Company s loss from unconsolidated affiliates, because the Company s 50% share of the impairment charge had previously been recognized by the Company in connection with prior impairments of its investment balance. January 2011 debt restructuring transactions. In January 2011, CityCenter completed a series of transactions including issuance of $900 million in aggregate principal amount of 7.625% senior secured first lien notes due 2016 and $600 million in aggregate principal amount of 10.75%/11.50% senior secured second lien PIK toggle notes due 2017 in a private placement. The interest rate on the second lien notes is 11.50% if CityCenter pays interest in the form of additional debt. CityCenter received net proceeds from the offering of the notes (the notes offering ) of $1.46 billion after initial purchaser s discounts and commissions but before other offering expenses. Effective concurrently with the notes offering, CityCenter s senior credit facility was amended and restated which extended the maturity of $500 million of the $1.85 billion outstanding loans until January 21, The restated senior credit facility does not include a revolving loan component. All borrowings under the senior credit facility in excess of $500 million were repaid using the proceeds of the first lien notes and the second lien notes. In addition, net proceeds from the note offerings, together with equity contributions of $73 million from the members were used to fund the interest escrow account of $159 million for the benefit of the holders of the first lien notes and the lenders under the restated senior credit facility. The restated senior credit facility is secured, on a pari passu basis with the first lien notes, by a first priority lien on substantially all of CityCenter s assets and those of its subsidiaries, except that any proceeds generated by the sale of Crystals outside of bankruptcy or foreclosure proceedings will be paid first to the lenders under the restated senior credit facility. CityCenter summary financial information. Summarized balance sheet information of the CityCenter joint venture is as follows: At December 31, (In thousands) Current assets... $ 211,646 $ 234,383 Property and other assets, net.... 9,430,171 10,499,278 Current liabilities , ,419 Long-term debt and other liabilities... 2,752,196 2,620,869 Equity... 6,508,307 7,129,373 44
65 Summarized income statement information of the CityCenter joint venture is as follows: Year Ended December 31, (In thousands) Net revenues... $ 1,330,057 $ 69,211 $ - Operating expenses, except preopening expenses... (2,194,700) (469,365) (39,347) Preopening and start-up expenses.... (6,202) (104,805) (34,420) Operating loss... (870,845) (504,959) (73,767) Interest expense... (240,731) (7,011) - Other non-operating income (expense)... (3,614) (10,360) 5,962 Net loss.... $ (1,115,190) $ (522,330) $ (67,805) Borgata In its June 2005 report to the New Jersey Casino Control Commission (the CCC ), on the application of Borgata for renewal of its casino license, the New Jersey Division of Gaming Enforcement (the DGE ) stated that it was conducting an investigation of the Company s relationship with its joint venture partner in Macau and that the DGE would report to the CCC any material information it deemed appropriate. On May 18, 2009, the DGE issued a report to the CCC on its investigation. In the report, the DGE recommended, among other things, that: (i) the Company s Macau joint venture partner be found to be unsuitable; (ii) the Company be directed to disengage itself from any business association with its Macau joint venture partner; (iii) the Company s due diligence/compliance efforts be found to be deficient; and (iv) the CCC hold a hearing to address the report. In March 2010, the CCC approved the Company s settlement agreement with the DGE pursuant to which the Company placed its 50% ownership interest in Borgata and related leased land in Atlantic City into a divestiture trust. Following the transfer of these interests into trust, the Company ceased to be regulated by the CCC or the DGE, except as otherwise provided by the trust agreement and the settlement agreement. Boyd Gaming Corporation s ( Boyd ) 50% interest is not affected by the settlement. The terms of the settlement mandate the sale of the trust property within a 30-month period ending in September During the 18 months ending September 2011, the Company has the right to direct the trustee to sell the trust property, subject to approval of the CCC. If a sale is not concluded by that time, the trustee is responsible for selling the trust property during the following 12-month period. Prior to the consummation of the sale, the divestiture trust will retain any cash flows received in respect of the trust property, but will pay property taxes and other costs attributable to the trust property. The Company is the sole economic beneficiary of the trust and will be permitted to reapply for a New Jersey gaming license beginning 30 months after the completion of the sale of the trust assets. As of December 31, 2010, the trust had $188 million of cash and investments of which $150 million is held in treasury securities with maturities greater than 90 days and is recorded within Prepaid expenses and other. As a result of the Company s ownership interest in Borgata being placed into a trust the Company no longer has significant influence over Borgata; therefore, the Company discontinued the equity method of accounting for Borgata at the point the assets were placed in the trust, and accounts for its rights under the trust agreement under the cost method of accounting. The Company also reclassified the carrying value of its investment related to Borgata to Other long-term assets, net. Earnings and losses that relate to the investment that were previously accrued remain as a part of the carrying amount of the investment. Distributions received by the trust that do not exceed the Company s share of earnings are recognized currently in earnings. However, distributions to the trust that exceed the Company s share of earnings for such periods are applied to reduce the carrying amount of its investment. The trust received net distributions from the joint venture of $113 million for the year ended December 31, The Company recorded $94 million as a reduction of the carrying value and $19 million was recorded as Other, net non-operating income in the year ended December 31, In connection with the settlement agreement discussed above, the Company entered into an amendment to its joint venture agreement with Boyd to permit the transfer of its 50% ownership interest into trust in connection with the Company s settlement agreement with the DGE. In accordance with such agreement, Boyd received a priority 45
66 partnership distribution of approximately $31 million (equal to the excess prior capital contributions by Boyd) upon successful refinancing of the Borgata credit facility in August In July 2010, the Company entered into an agreement to sell four long-term ground leases and their respective underlying real property parcels, approximately 11 acres, underlying the Borgata. The transaction closed in November 2010 and the Company received net proceeds of $71 million and recorded a gain of $3 million related to the sale in Property transactions, net. In October 2010, the Company received an offer for its 50% economic interest in the Borgata based on an enterprise value of $1.35 billion for the entire asset and on October 12, 2010, the Company s Board of Directors authorized submission of this offer to Boyd in accordance with the right of first refusal provisions included in the joint venture agreement. Subsequently, Boyd announced that it does not intend to exercise its right of refusal in connection with such offer. Based on Borgata s September debt balances, the offer equated to slightly in excess of $250 million for the Company s 50% interest. This was less than the carrying value of the Company s investment in Borgata; therefore, the Company recorded an impairment charge of approximately $128 million at September 30, 2010, recorded in Property transactions, net. Since October 2010, the Company has continued to negotiate with the prospective purchaser as well as other parties that have expressed interest in the asset. There can be no assurance that the transaction will be completed as proposed or at all, and the final terms of any sale may differ materially from the ones disclosed above. Macau In September, 2010, MGM China Holdings Limited, a Cayman Islands company formed by the Company and Ms. Pansy Ho, that would own the entity that operates MGM Macau, filed a proposed listing application on Form A1 with The Stock Exchange of Hong Kong Limited ( Hong Kong Exchange ) in connection with a possible listing of its shares on the main board of the Hong Kong Exchange. There have not been any decisions made regarding the timing or terms of any such listing, whether MGM China Holdings Limited will ultimately proceed with this transaction, or whether the application will be approved by the Hong Kong Exchange. The Company received approximately $192 million from MGM Macau during the fourth quarter of 2010, which represents a full repayment of its interest and non-interest bearing notes to that entity. The Company recognized $59 million (representing cumulative equity method earnings to date recognized by the Company) of such distributions as a cash flow from operating activities and $133 million as a cash flow from investing activities in the accompanying consolidated statement of cash flows. Basis Differences The Company s investments in unconsolidated affiliates do not equal the venture-level equity due to various basis differences. Basis differences related to depreciable assets are being amortized based on the useful lives of the related assets and liabilities and basis differences related to non depreciable assets are not being amortized. Differences between the Company s venture-level equity and investment balances are as follows: At December 31, (In thousands) Venture-level equity.... $ 3,433,966 $ 4,171,538 Fair value adjustments to investments acquired in business combinations (A) , ,701 Capitalized interest (B) , ,614 Adjustment to CityCenter equity upon contribution of net assets by MGM Resorts International (C)... (600,122) (605,513) Completion guarantee (D) , ,000 Advances to CityCenter, net of discount (E) , ,990 Write-down of CityCenter investment (F)... (2,087,593) (954,862) Receivable from CityCenter(G) ,878 - Other adjustments (H)... (194,692) (188,669) $ 1,923,155 $ 3,611,799 46
67 (A) (B) (C) (D) (E) (F) (G) (H) Includes a $267 million increase for Grand Victoria related to indefinite-lived gaming license rights and a $23 million reduction for Silver Legacy related to long-term assets and long-term debt. Relates to interest capitalized on the Company s investment balance during the unconsolidated affiliates development and construction stages. Such amounts are being amortized over the life of the underlying assets. Relates to land, other fixed assets, real estate under development, and other assets. In 2010, the Company funded $553 million under the completion guarantee, $429 million of which was recognized as equity contributions by the joint venture to be split between the partners. In 2009, this basis difference related to estimated amounts to be paid under the completion guarantee. The advances to CityCenter are recognized as long-term debt by CityCenter; however, since such advances were provided at below market rates, CityCenter recorded the advances at a discount with a corresponding equity contribution. This basis difference will be resolved when the advances are repaid and upon accretion of the discount. The write-down of the Company s CityCenter investment includes $426 million of write-downs allocated to land, which are not amortized. The remaining write-down is amortized over the average life of the underlying assets. The receivable from CityCenter will be resolved when the remaining condominium proceeds owed to the Company under the completion guarantee are repaid. Other adjustments include the deferred gain on the CityCenter transaction. The deferred gain on the CityCenter transaction has been allocated to the underlying assets and is being amortized over the life of the underlying assets. Joint Venture Financial Information Summarized balance sheet information of the unconsolidated affiliates is as follows: At December 31, (In thousands) Current assets... $ 731,381 $ 807,343 Property and other assets, net ,634,691 13,206,662 Current liabilities ,630 1,508,056 Long-term debt and other liabilities... 3,645,762 4,322,204 Equity... 6,920,680 8,183,745 Summarized results of operations of the unconsolidated affiliates are as follows: Year Ended December 31, (In thousands) Net revenues... $ 3,343,624 $ 2,269,709 $ 2,445,835 Operating expenses, except preopening expenses... (3,869,237) (2,391,712) (2,258,033) Preopening and start-up expenses.... (6,202) (105,504) (41,442) Operating income (loss)... (531,815) (227,507) 146,360 Interest expense... (288,273) (83,449) (81,878) Other non-operating expense... (27,451) (36,861) (5,660) Net income (loss)... $ (847,539) $ (347,817) $ 58,822 47
68 NOTE 6 GOODWILL AND OTHER INTANGIBLE ASSETS Goodwill and other intangible assets consisted of the following: At December 31, (In thousands) Goodwill: Mirage Resorts acquisition (2000)... $ 39,648 $ 39,648 Mandalay Resort Group acquisition (2005)... 45,510 45,510 Other.... 1,195 1,195 $ 86,353 $ 86,353 Indefinite-lived intangible assets: Detroit development rights... $ 98,098 $ 98,098 Trademarks, license rights and other , , , ,770 Other intangible assets, net... 9,034 10,483 $ 342,804 $ 344,253 There were no changes in the recorded balances of goodwill in 2010 or Goodwill remaining for the Mirage Resorts acquisition relates to Bellagio and The Mirage. The estimated fair values of Bellagio and Mirage are substantially in excess of their carrying values including goodwill. Goodwill related to the Mandalay Resort Group acquisition was primarily assigned to Mandalay Bay, Luxor, Excalibur and Gold Strike Tunica. As a result of the Company s annual impairment test of goodwill in the fourth quarter of 2008, the Company recognized a non-cash impairment charge of goodwill of $1.2 billion included in Property transactions, net. Such charge solely related to goodwill recognized in the Mandalay acquisition and represents the Company s total accumulated impairment losses related to goodwill since January 1, 2002 when the Company adopted new accounting rules for goodwill and intangible assets. Assumptions used in such analysis were affected by current market conditions including: 1) lower market valuation multiples for gaming assets; 2) higher discount rates resulting from turmoil in the credit and equity markets; and 3) current cash flow forecasts for the affected resorts. The remaining balance of the Mandalay acquisition goodwill primarily relates to goodwill assigned to Gold Strike Tunica. The fair value of Gold Strike Tunica is substantially in excess of its carrying value including goodwill. The Company s indefinite-lived intangible assets balance of $334 million includes trademarks and trade names of $217 million related to the Mandalay acquisition. As a result of the Company s annual impairment test in the fourth quarter of 2008 of indefinite-lived intangible assets, the Company recognized a non-cash impairment charge of $12 million included in Property transactions, net. Such charge solely related to trade names recognized in the Mandalay acquisition. The fair value of the trade names was determined using the relief-from-royalty method and was negatively affected by the factors discussed above relating to the impairment of goodwill. The Company s indefinite-lived intangible assets consist primarily of development rights in Detroit and trademarks. The Company s remaining finite lived intangible assets consist primarily of lease acquisition costs amortized over the life of the related leases, and certain license rights amortized over their contractual life. 48
69 NOTE 7 OTHER ACCRUED LIABILITIES Other accrued liabilities consisted of the following: At December 31, (In thousands) Payroll and related.... $ 256,305 $ 267,795 Advance deposits and ticket sales , ,911 Casino outstanding chip liability... 79,987 83,957 Casino front money deposits... 97,586 80,944 Other gaming related accruals... 79,062 80,170 Taxes, other than income taxes ,888 60,917 CityCenter completion guarantee... 79, ,000 Other... 96,004 95,007 $ 867,223 $ 923,701 NOTE 8 LONG-TERM DEBT Long-term debt consisted of the following: At December 31, (In thousands) Senior credit facility: Term loans (net of discount of $148 million in 2010)... $ 1,686,043 $ 2,119,037 Revolving loans ,000 3,392,806 $297 million 9.375% senior subordinated notes, repaid in ,135 $645.8 million 8.5% senior notes, repaid in ,689 $325.5 million 8.375% senior subordinated notes, due , ,000 $128.7 million 6.375% senior notes, due 2011, net , ,156 $544.7 million 6.75% senior notes, due , ,650 $484.2 million 6.75% senior notes, due , ,226 $150 million 7.625% senior subordinated debentures, due 2013, net , ,190 $750 million 13% senior secured notes, due 2013, net , ,144 $508.9 million 5.875% senior notes, due 2014, net , ,613 $650 million % senior secured notes, due 2014, net , ,463 $875 million 6.625% senior notes, due 2015, net , ,253 $1,150 million 4.25% convertible senior notes, due ,150,000 - $242.9 million 6.875% senior notes, due , ,900 $732.7 million 7.5% senior notes, due , ,749 $500 million 10% senior notes, due 2016, net ,600 - $743 million 7.625% senior notes, due , ,000 $850 million % senior secured notes, due 2017, net , ,438 $475 million % senior notes, due 2018, net , ,906 $845 million 9% senior secured notes, due ,000 - Floating rate convertible senior debentures, due ,472 8,472 $0.6 million 7% debentures, due 2036, net $4.3 million 6.7% debentures, due ,265 4,265 Other notes... 2,076 3,196 12,047,698 14,055,861 Less: Current portion... - (1,079,824) $ 12,047,698 $ 12,976,037 As of December 31, 2010, long-term debt due within one year of the balance sheet date is classified as longterm because the Company has both the intent and ability to repay these amounts with available borrowings under 49
70 the senior credit facility. At December 31, 2009, outstanding senior notes due within one year of the balance sheet date were classified as current obligations as the Company s senior credit facility was fully drawn. Interest expense, net consisted of the following: Year Ended December 31, (In thousands) Total interest incurred... $ 1,113,580 $ 1,028,673 $ 795,049 Interest capitalized... - (253,242) (185,763) $ 1,113,580 $ 775,431 $ 609,286 Senior credit facility. The Company s senior credit facility was amended and restated in March 2010, and consisted of approximately $2.7 billion in term loans (of which approximately $874 million was required to be repaid by October 3, 2011) and a $2.0 billion revolving loan (of which approximately $302 million was required to be repaid by October 3, 2011). As discussed below, in November 2010, the Company repaid the outstanding balance of the loans maturing in October 3, As of December 31, 2010, the Company s senior credit facility consisted of approximately $1.8 billion in term loans and $1.7 billion in revolving loans and had approximately $1.2 billion of available revolving borrowing capacity. Interest on the senior credit facility is based on a LIBOR margin of 5.00%, with a LIBOR floor of 2.00%, and a base rate margin of 4.00%, with a base rate floor of 4.00%. The weighted average interest rate on outstanding borrowings under the senior credit facility at December 31, 2010 and December 31, 2009 was 7.0% and 6.0%, respectively. The Company accounted for the modification related to the extending term loans as an extinguishment of debt because the applicable cash flows under the extended term loans were more than 10% different from the applicable cash flows under the previous loans. Therefore, the extended term loans were recorded at fair value resulting in a $181 million gain and a discount of $181 million to be amortized to interest expense over the term of the extended term loans. In the year ended December 31, 2010, the Company recognized $31 million of interest expense related to such discount amortization. Fair value of the estimated term loans was based on trading prices immediately after the transaction. In addition, the Company wrote off $15 million of existing debt issuance costs related to the previous term loans and expensed $22 million for new debt issuance costs incurred related to amounts paid to extending term loan lenders in connection with the modification. The Company also wrote off $2 million of existing debt issuance costs related to the reduction in capacity under the non-extending revolving portion of the senior credit facility. In total, the Company recognized a net pre-tax gain on extinguishment of debt of $142 million in Other, net non-operating income in the first quarter of Because net proceeds from the Company s October 2010 common stock offering were in excess of $500 million, the Company was required to ratably repay indebtedness under the senior credit facility of $6 million, which equaled 50% of such excess. The Company used the net proceeds from its October 2010 senior notes offering and a portion of the net proceeds from its October 2010 common stock offering discussed in Note 11 to repay the remaining amounts owed to non-extending lenders under its senior credit facility. Loans and revolving commitments aggregating approximately $3.6 billion were extended to February 21, In November 2010, the underwriters of the Company s common stock offering exercised their overallotment option and purchased an additional 6.1 million shares for net proceeds to the Company of $76 million, 50% of which was used to ratably repay indebtedness under the senior credit facility. As a result of these transactions the Company recorded a pre-tax loss on retirement of debt related to unamortized debt issuance costs and discounts of $9 million recorded in Other, net non-operating revenue in the fourth quarter. The restated senior credit facility allows the Company to refinance indebtedness maturing prior to February 21, 2014, but limits its ability to prepay later maturing indebtedness until the extended facilities are paid in full. The Company may issue unsecured debt, equity-linked and equity securities to refinance its outstanding indebtedness; however, the Company is required to use net proceeds (a) from indebtedness issued in amounts in excess of $250 million over amounts used to refinance indebtedness and (b) from equity issued, other than in exchange for its 50
71 indebtedness, in amounts in excess of $500 million (which limit the Company reached with its October 2010 stock offering) to ratably prepay the credit facilities, in each case, in an amount equal to 50% of the net cash proceeds of such excess. The senior credit facility contains certain financial and non-financial covenants, including a quarterly minimum EBITDA test, based on a rolling 12-month EBITDA and a covenant limiting annual capital expenditures. Further, the senior credit facility and certain of the Company s debt securities contain restrictive covenants that, among other things, limit its ability to pay dividends or distributions, repurchase or issue equity, prepay debt or make certain investments; incur additional debt or issue certain disqualified stock and preferred stock; incur liens on assets; pledge or sell assets or consolidate with another company or sell all or substantially all assets; enter into transactions with affiliates; allow certain subsidiaries to transfer assets; and enter into sale and lease-back transactions. The Company is in compliance with all covenants, including financial covenants under its senior credit facilities as of December 31, At December 31, 2010, the Company was required under its senior credit facility to maintain a minimum trailing annual EBITDA (as defined) of $1.0 billion, which increases to $1.1 billion as of March 31, 2011, $1.15 billion as of September 30, 2011, and $1.2 billion as of December 31, 2011, with additional periodic increases thereafter. As of December 31, 2010, the Company had annual EBITDA calculated in accordance with the terms of the agreement of approximately $1.14 billion and was in compliance with the minimum EBITDA covenant. Additionally, the Company is limited to $400 million of annual capital expenditures (as defined) during At December 31, 2010, the Company was in compliance with the maximum capital expenditures covenant. The Company and each of its subsidiaries, excluding MGM Grand Detroit, LLC, the Company s foreign subsidiaries and their U.S. holding companies and the Company s insurance subsidiaries, are directly liable for or unconditionally guarantee the senior credit facility, senior notes, senior debentures, and senior subordinated notes. MGM Grand Detroit, LLC is a guarantor under the senior credit facility, but only to the extent that MGM Grand Detroit, LLC borrows under such facilities. At December 31, 2010, the outstanding amount of borrowings related to MGM Grand Detroit, LLC was $450 million. See Note 16 for consolidating condensed financial information of the subsidiary guarantors and non-guarantors. Senior notes. In February 2010, the Company repaid the $297 million of outstanding principal amount of its 9.375% senior subordinated notes due 2010 at maturity. During the second quarter of 2010, the Company repurchased $136 million principal amount of its 8.5% senior notes due 2010 and $75 million principal amount of its 8.375% senior notes due 2011 essentially at par. In September 2010, the Company repaid the remaining $646 million of outstanding principal of its 8.5% senior notes due 2010 at maturity. In March 2010, the Company issued $845 million of 9% senior secured notes due 2020 for net proceeds to the Company of approximately $826 million. The notes are secured by the equity interests and substantially all of the assets of MGM Grand Las Vegas and otherwise rank equally in right of payment with the Company s existing and future senior indebtedness. Upon the issuance of such notes, the holders of the Company s 13% senior notes due 2013 obtained an equal and ratable lien in all collateral securing these notes. The Company used the net proceeds from the senior note issuance to permanently repay approximately $820 million of loans previously outstanding under its credit facility. In October 2010, the Company issued $500 million of 10% senior notes due 2016, issued at a discount to yield 10.25%, for net proceeds to the Company of approximately $486 million. The notes are unsecured and otherwise rank equally in right of payment with the Company s existing and future senior indebtedness. During 2009, the Company executed the following transactions related to its senior notes and senior secured notes: k k In May, 2009, issued $650 million of % senior secured notes due 2014 and $850 million of % senior secured notes due 2017 for total net proceeds to the Company of approximately $1.4 billion; In June, 2009, redeemed $100 million of 7.25% senior debentures at a cost of $127 million, $762.6 million of 6.0% senior notes due October 2009, essentially at par, and $122.3 million of 6.5% senior notes due July 51
72 k k 2009, essentially at par and recorded a loss on early retirement of debt of $38 million related to these transactions in Other, net; In September 2009, issued $475 million of % senior notes due 2018 for net proceeds to the Company of $451 million; and In October 2009, redeemed the remaining $57.4 million of its 6.0% notes at maturity. Senior convertible notes. In April 2010, the Company issued $1.15 billion of 4.25% convertible senior notes due 2015 for net proceeds to the Company of $1.12 billion. The notes are general unsecured obligations of the Company and rank equally in right of payment with the Company s other existing senior unsecured indebtedness. The Company used the net proceeds from the senior convertible note issuance to temporarily repay amounts outstanding under its senior credit facility. The notes are convertible at an initial conversion rate of approximately shares of the Company s common stock per $1,000 principal amount of the notes, representing an initial conversion price of approximately $18.58 per share of the Company s common stock. The initial conversion rate was determined based on the closing trading price of the Company s common stock on the date of the transaction, plus a 27.5% premium. The terms of the notes do not provide for any beneficial conversion features. In connection with the offering, the Company entered into capped call transactions to reduce the potential dilution of the Company s stock upon conversion of the notes. The capped call transactions have a cap price equal to approximately $21.86 per share. The Company paid approximately $81 million for the capped call transactions, which is reflected as a decrease in Capital in excess of par value, net of $29 million of associated tax benefits. Financial instruments that are indexed to an entity s own stock and are classified as stockholders equity in an entity s statement of financial position are not considered within the scope of derivative instruments. The Company performed an evaluation of the embedded conversion option and capped call transactions, which included an analysis of contingent exercise provisions and settlement requirements, and determined that the embedded conversion option and capped call transactions are considered indexed to the Company s stock and should be classified as equity, and therefore are not accounted for as derivative instruments. Accordingly, the entire face amount of the notes was recorded as debt until converted or retired at maturity, and the capped call transactions were recorded within equity as described above. Maturities of long-term debt. Maturities of the Company s long-term debt as of December 31, 2010 were as follows: (In thousands) Years ending December 31, $ 455, , ,384, ,463, ,025,000 Thereafter ,401,938 12,275,217 Debt premiums and discounts, net... (227,519) $ 12,047,698 Fair value of long-term debt. The estimated fair value of the Company s long-term debt at December 31, 2010 was approximately $12.4 billion, compared to its book value of $12.0 billion. At December 31, 2009, the estimated fair value of the Company s long-term debt was approximately $12.9 billion, compared to its book value of $14.1 billion. The estimated fair value of the Company s senior notes, senior subordinated notes and senior credit facility were based on quoted market prices. 52
73 NOTE 9 INCOME TAXES The Company recognizes deferred income tax assets, net of applicable reserves, related to net operating loss carryforwards and certain temporary differences. The Company recognizes future tax benefits to the extent that realization of such benefit is more likely than not. Otherwise, a valuation allowance is applied. Consolidated loss before taxes for domestic and foreign operations consisted of the following: Year Ended December 31, (In thousands) Domestic operations... $ (2,309,317) $ (2,003,584) $ (660,540) Foreign operations... 93,292 (9,009) (8,448) $ (2,216,025) $ (2,012,593) $ (668,988) The income tax provision (benefit) attributable to loss before income taxes is as follows: Year Ended December 31, (In thousands) Federal Current.... $ (186,444) $ (391,281) $ 186,051 Deferred (excluding operating loss carryforward)... (404,522) (280,603) (14,537) Deferred operating loss carryforward... (225,589) - - Other noncurrent.... 5,167 7,891 8,627 Provision (benefit) for federal income taxes... (811,388) (663,993) 180,141 State Current.... 7,262 1,105 8,608 Deferred (excluding operating loss and valuation allowance)... (13,739) (52,860) (420) Deferred operating loss carryforward... (9,619) (6,357) (231) Deferred valuation allowance... 49, Other noncurrent.... (1,707) 1,125 (1,800) Provision (benefit) for state income taxes... 31,405 (56,987) 6,157 Foreign Current... 1, Deferred Provision for foreign income taxes , $ (778,628) $ (720,911) $ 186,298 A reconciliation of the federal income tax statutory rate and the Company s effective tax rate is as follows: Year Ended December 31, Federal income tax statutory rate... (35.0%) (35.0%) (35.0%) State income tax (net of federal effect)..... (0.5) (1.9) 0.8 State valuation allowance Goodwill write-down Foreign jurisdiction (income) losses... (1.2) Tax credits... (0.2) (0.2) (1.0) Permanent and other items (35.1%) (35.8%) 27.8% 53
74 The major tax-effected components of the Company s net deferred tax liability are as follows: At December 31, (In thousands) Deferred tax assets federal and state Bad debt reserve... $ 43,007 $ 44,817 Deferred compensation... 14,278 13,967 Net operating loss carryforward ,178 5,336 Accruals, reserves and other... 80,663 98,687 Investments in unconsolidated affiliates ,416 - Stock-based compensation... 51,582 49,910 Tax credits ,774 2,491 Michigan Business Tax deferred asset, net... 39,067 37, , ,749 Less: Valuation allowance... (36,334) (4,349) 890, ,400 Deferred tax liabilities federal and state Property and equipment... (2,731,513) (2,732,737) Long-term debt... (369,946) (235,372) Investments in unconsolidated affiliates... - (173,034) Cost method investments... (41,849) - Intangibles.... (106,564) (100,073) (3,249,872) (3,241,216) Net deferred tax liability... $ (2,359,241) $ (2,992,816) The 2009 components of the Company s net deferred tax liability disclosed in the table above reflect adjustments to correct amounts previously presented. The primary impact was to move $349 million and $55 million of deferred tax liabilities from Property and equipment and Accruals, reserves, and other, respectively, to Investments in Unconsolidated Affiliates. These adjustments have no impact on the Company s consolidated balance sheet or statement of operations, and the Company does not believe the adjustments to the 2009 footnote presentation are material to the consolidated financial statements. As of December 31, 2010, the Company has excess financial reporting basis over the tax basis of its foreign corporate joint venture in Macau in the amount of $37 million that management does not consider to be essentially permanent in duration. The Company has not provided deferred taxes for such excess because there would be sufficient creditable foreign taxes to offset all U.S. income tax that would result from the future repatriation of the foreign earnings that created such excess basis. For U.S. federal income tax purposes, the Company generated in 2010 a net operating loss of $1.2 billion and general business tax credits of $7 million. Approximately $552 million of the net operating loss will be carried back to prior tax years. Consequently, the Company has recorded the expected refund from this carryback in Income tax receivable at December 31, The remaining $645 million of the net operating loss will be carried forward and will expire if not utilized by In addition, the carryback will create an alternative minimum tax credit carryforward of $12 million that will not expire and a general business tax credit carryforward of $6 million that will expire if not utilized by The general business tax credit of $7 million generated in 2010 will expire if not utilized by The Company has a charitable contribution carryforward of $5 million that will begin to expire in 2014 and a foreign tax credit carryforward of $2 million that will expire if not utilized by The Company at December 31, 2010, was close to the ownership change threshold set forth in Internal Revenue Code section 382 as a result of transactions in its stock over the past several years. Should an ownership change occur in a future period, the Company s U.S. federal income tax net operating losses and tax credits incurred prior to the ownership change would generally be subject to a post-change annual usage limitation equal to the value of the Company at the time of the ownership change multiplied by the long-term tax exempt rate at such time as established by the IRS. The Company does not anticipate that this limitation would prevent the utilization of the 54
75 Company s net operating losses and tax credits prior to their expiration or materially impact the cash taxes payable in future years. For state income tax purposes, the Company has Illinois and Michigan net operating loss carryforwards of $46 million and $154 million, respectively, which equates to deferred tax assets, after federal tax effect and before valuation allowance, of $2 million and $6 million, respectively. The Illinois and Michigan net operating loss carryforwards will begin to expire if not utilized by 2021 and 2019, respectively. The Company has New Jersey net operating loss carryforwards of $49 million, which equates to a deferred tax asset of $3 million, after federal tax effect, and before valuation allowance. The New Jersey net operating loss carryforwards will expire if not utilized by various dates from 2011 through On January 13, 2011, the state of Illinois enacted increases to its corporate income tax rate and also suspended the use of net operating loss carryforwards for three years, effective beginning The Company does not anticipate that these tax law changes will have a material impact on its Illinois deferred tax liability. At December 31, 2010, there is a $34 million valuation allowance, after federal effect, provided on certain state deferred tax assets. In addition, there is a valuation allowance of $2 million on the foreign tax credit because management believes these assets do not meet the more likely than not criteria for recognition. Given the negative impact of the U.S. economy on the results of operations in the past several years and expectations that the Company will continue to be adversely affected by certain aspects of the current economic conditions, the Company no longer relies on future operating income in assessing the realizability of its deferred tax assets and now relies only on the future reversal of existing taxable temporary differences. Accordingly, the Company concluded during 2010 that realization of certain of its state deferred tax assets was no longer more likely than not and the Company provided an additional valuation allowance in the amount of $32 million, net of federal effect, with a corresponding reduction in income tax benefit. Since the future reversal of existing U.S. federal taxable temporary differences currently exceeds the future reversal of existing U.S. federal deductible temporary differences, the Company continued to conclude that it is more likely than not that its U.S. federal deferred tax assets, other than the foreign tax credit carryforward, are realizable. Should the Company continue to experience operating losses of the same magnitude it has experienced in the past several years, it is reasonably possible in the near term that the future reversal of its U.S. federal deductible temporary differences could exceed the future reversal of its U.S. federal taxable temporary differences, in which case the Company would record a valuation allowance for such excess with a corresponding reduction of federal income tax benefit on its statement of operations. The Company assesses its tax positions using a two-step process. A tax position is recognized if it meets a more likely than not threshold, and is measured at the largest amount of benefit that is greater than 50 percent likely of being realized. Uncertain tax positions must be reviewed at each balance sheet date. Liabilities recorded as a result of this analysis must generally be recorded separately from any current or deferred income tax accounts, and at December 31, 2010, the Company has classified $16 million as current in Other accrued liabilities and $144 million as long-term in Other long-term obligations, based on the time until expected payment. A reconciliation of the beginning and ending amounts of gross unrecognized tax benefits is as follows: (In thousands) Gross unrecognized tax benefits at January 1... $ 161,377 $ 102,783 $ 77,328 Gross increases Prior period tax positions... 16,431 13,890 25,391 Gross decreases Prior period tax positions... (40,347) (10,372) (12,467) Gross increases Current period tax positions... 14,995 60,286 13,058 Settlements with taxing authorities.... (14,844) (5,210) (527) Lapse in statutes of limitations... (3,195) - - Gross unrecognized tax benefits at December $ 134,417 $ 161,377 $ 102,783 The total amount of net unrecognized tax benefits that, if recognized, would affect the effective tax rate was $30 million and $34 million at December 31, 2010 and 2009, respectively. The Company recognizes accrued interest and penalties related to unrecognized tax benefits in income tax 55
76 expense. The Company had $26 million and $24 million in interest related to unrecognized tax benefits accrued as of December 31, 2010 and 2009, respectively. No amounts were accrued for penalties as of either date. Income tax expense for the years ended December 31, 2010, 2009, and 2008 includes interest related to unrecognized tax benefits of $8 million, $8 million, and $6 million, respectively. The Company files income tax returns in the U.S. federal jurisdiction, various state and local jurisdictions, and foreign jurisdictions, although the taxes paid in foreign jurisdictions are not material. As of December 31, 2010, the Company is no longer subject to examination of its U.S. consolidated federal income tax returns filed for years ended prior to The IRS completed its examination of the Company s consolidated federal income tax returns for the 2003 and 2004 tax years during 2010 and the Company paid $12 million in tax and $4 million in associated interest with respect to adjustments to which it agreed. In addition, the Company submitted a protest to IRS Appeals of certain adjustments to which it does not agree. The opening Appeals conference has been scheduled to occur in the first quarter of It is reasonably possible that the issues subject to Appeal may be settled within the next 12 months. During the fourth quarter of 2010, the IRS opened an examination of the Company s consolidated federal income tax returns for the 2005 through 2009 tax years. The IRS informed the Company during the fourth quarter of 2010 that they would initiate an audit of the 2007 through 2009 tax years of CityCenter Holdings LLC, an unconsolidated affiliate treated as a partnership for income tax purposes. The IRS also informed the Company that they would initiate an audit of the 2008 through 2009 tax years of MGM Grand Detroit LLC, a subsidiary treated as a partnership for income tax purposes. Neither of these audits were initiated in 2010 but the Company anticipates that both will be initiated in early The Company reached settlement during 2010 with IRS Appeals with respect to the audit of the 2004 through 2006 tax years of MGM Grand Detroit, LLC. At issue was the tax treatment of payments made under an agreement to develop, own and operate a hotel casino in the City of Detroit. The Company will owe $1 million in tax as a result of this settlement. During the fourth quarter of 2010, the Company and its joint venture partner reached tentative settlement with IRS Appeals with respect to the audit of the 2003 and 2004 tax years of a cost method investee of the Company s that is treated as a partnership for income tax purposes. The adjustments to which the Company agreed in such settlement will be included in any settlement that it may reach with respect to the 2003 and 2004 examination of its consolidated federal income tax return. The IRS closed during 2010 its examination of the federal income tax return of Mandalay Resort Group for the pre-acquisition year ended April 25, 2005 and issued a No-Change Letter. The statute of limitations for assessing tax for all Mandalay Resort Group pre-acquisition years are now closed. As of December 31, 2010, other than the exceptions noted below, the Company was no longer subject to examination of its various state and local tax returns filed for years ended prior to The state of Illinois during 2010 initiated an audit of its Illinois combined returns for the 2006 and 2007 tax years. It is reasonably possible that this audit will close and all issues will be settled in the next 12 months. The state of New Jersey began audit procedures during 2010 of a cost method investee of the Company s for the 2003 through 2006 tax years. The City of Detroit previously indicated that it would audit a Mandalay Resort Group subsidiary return for the pre-acquisition year ended April 25 but no audit was initiated and the statute of limitations for assessing tax expired in No other state or local income tax returns of the Company s are currently under exam. The Company believes that it is reasonably possible that the total amounts of unrecognized tax benefits at December 31, 2010 may decrease by a range of $0 to $28 million within the next twelve months on the expectation during such period of possible settlement of certain issues under appeal in connection with the IRS audit of the Company s 2003 and 2004 consolidated federal income tax returns. NOTE 10 COMMITMENTS AND CONTINGENCIES Leases. The Company leases real estate and various equipment under operating and, to a lesser extent, capital lease arrangements. Certain real estate leases provide for escalation of rent based upon a specified price index and/or based upon periodic appraisals. 56
77 At December 31, 2010, the Company was obligated under non-cancellable operating leases and capital leases to make future minimum lease payments as follows: Operating Leases Capital Leases (In thousands) $ 13,917 $ 1, ,868 1, , , ,908 - Thereafter... 36,799 - Total minimum lease payments... $ 81,444 2,871 Less: Amounts representing interest... (132) Total obligations under capital leases... 2,739 Less: Amounts due within one year... (1,503) Amounts due after one year... $ 1,236 The current and long-term obligations under capital leases are included in Other accrued liabilities and Other long-term obligations, respectively. Rental expense for operating leases, including rental expense of discontinued operations, was $26 million for 2010, $24 million for 2009, and $29 million for CityCenter completion guarantee. The Company entered into a completion guarantee requiring an unlimited completion and cost overrun guarantee from the Company, secured by its interests in the assets of Circus Circus Las Vegas and certain adjacent undeveloped land. The terms of the completion guarantee provide for the ability to utilize up to $250 million of net residential proceeds to fund construction costs, though the timing of receipt of such proceeds is uncertain. As of December 31, 2010 the Company has funded $553 million under the completion guarantee. The Company has recorded a receivable from CityCenter of $124 million related to these amounts, which represents amounts reimbursable to the Company from CityCenter from future residential proceeds. The Company has a remaining estimated net obligation under the completion guarantee of $80 million which includes estimated litigation costs related to the resolution of disputes with contractors as to the final construction costs and reflects certain estimated offsets to the amounts claimed by the contractors. CityCenter has reached, or expects to reach, settlement agreements with most of the construction subcontractors. However, significant disputes remain with the general contractor and certain subcontractors. Amounts claimed by such parties exceed amounts included in the Company s completion guarantee accrual by approximately $200 million. Moreover, the Company has not accrued for any contingent payments to CityCenter related to the Harmon Hotel & Spa component, which is unlikely to be completed using the building as it now stands. The Company does not believe it would be responsible for funding any additional remediation efforts that might be required with respect to the Harmon; however, the Company s view is based on a number of developing factors, including with respect to on-going litigation with CityCenter s contractors, actions by local officials and other developments related to the CityCenter venture, that are subject to change. In January 2011, the Company entered into an amended completion and cost overrun guarantee in connection with CityCenter s restated senior credit facility agreement and issuance of $1.5 billion of senior secured first lien notes and senior secured second lien notes, as previously discussed. Consistent with the terms of the previous completion guarantee, the terms of the amended completion guarantee provide for the ability to utilize the remaining $124 million of net residential proceeds to fund construction costs, or to reimburse the Company for construction costs previously expended, though the timing of receipt of such proceeds is uncertain. CityCenter construction litigation. In March 2010, Perini Building Company, Inc., general contractor for the CityCenter development project (the Project ), filed a lawsuit in the Eighth Judicial District Court for Clark 57
78 County, State of Nevada, against MGM MIRAGE Design Group (a wholly-owned subsidiary of the Company which was the original party to the Perini construction agreement) and certain direct or indirect subsidiaries of CityCenter Holdings, LLC (the CityCenter Owners ). Perini asserts that the Project was substantially completed, but the defendants failed to pay Perini approximately $490 million allegedly due and owing under the construction agreement for labor, equipment and materials expended on the Project. The complaint further charges the defendants with failure to provide timely and complete design documents, late delivery to Perini of design changes, mismanagement of the change order process, obstruction of Perini s ability to complete the Harmon Hotel & Spa component, and fraudulent inducement of Perini to compromise significantly amounts due for its general conditions. The complaint advances claims for breach of contract, breach of the implied covenant of good faith and fair dealing, tortious breach of the implied covenant of good faith and fair dealing, unjust enrichment and promissory estoppel, and fraud and intentional misrepresentation. Perini seeks compensatory damages, punitive damages, attorneys fees and costs. In April 2010, Perini served an amended complaint in this case which joins as defendants many owners of CityCenter residential condominium units (the Condo Owner Defendants ), adds a count for foreclosure of Perini s recorded master mechanic s lien against the CityCenter property in the amount of approximately $491 million, and asserts the priority of this mechanic s lien over the interests of the CityCenter Owners, the Condo Owner Defendants and the Project lenders in the CityCenter property. The CityCenter Owners and the other defendants dispute Perini s allegations, and contend that the defendants are entitled to substantial amounts from Perini, including offsets against amounts claimed to be owed to Perini and its subcontractors and damages based on breach of their contractual and other duties to CityCenter, duplicative payment requests, non-conforming work, lack of proof of alleged work performance, defective work related to the Harmon Hotel & Spa component, property damage and Perini s failure to perform its obligations to pay Project subcontractors and to prevent filing of liens against the Project. Parallel to the court litigation CityCenter management conducted an extra-judicial program for settlement of Project subcontractor claims. CityCenter has resolved the claims of the majority of the 223 first-tier subcontractors, with only several remaining for further proceedings along with trial of Perini s claims and CityCenter s Harmon-related counterclaim and other claims by CityCenter against Perini and its parent guarantor, Tutor Perini. In December 2010, Perini recorded an amended notice of lien reducing its lien to approximately $313 million. The CityCenter Owners and the other defendants will continue to vigorously assert and protect their interests in the lawsuit. The range of loss beyond the claims asserted to date by Perini or any gain the joint venture may realize related to the defendants counterclaims cannot be reasonably estimated at this time. Other litigation. The Company is a party to various legal proceedings, most of which relate to routine matters incidental to its business. Management does not believe that the outcome of such proceedings will have a material adverse effect on the Company s financial position, results of operations or cash flows. Other guarantees. The Company is party to various guarantee contracts in the normal course of business, which are generally supported by letters of credit issued by financial institutions. The Company s senior credit facility limits the amount of letters of credit that can be issued to $250 million, and the amount of available borrowings under the senior credit facility is reduced by any outstanding letters of credit. At December 31, 2010, the Company had provided $37 million of total letters of credit. NOTE 11 STOCKHOLDERS EQUITY 2010 stock offering. In October 2010, the Company issued 40.9 million shares of its common stock for total net proceeds to the Company of $512 million. Concurrently with the Company s issuance, Tracinda sold approximately 27.8 million shares of the Company s common stock. The Company did not receive any proceeds from the sale of such common stock by Tracinda. In November 2010, the underwriter exercised its ability to purchase an additional 6.1 million shares from the Company and 4.2 million shares from Tracinda to cover overallotments, with net proceeds to the Company of approximately $76 million. Proceeds from the common stock offering were used to repay outstanding amounts under the Company s senior credit facility (see Note 8) and for general corporate purposes. Giving effect to the common stock offering, the Company has approximately 3.3 million authorized 58
79 shares in excess of its outstanding shares, the underwriter s overallotment option, and shares underlying its outstanding convertible senior notes and share-based awards stock offering. In May 2009, the Company issued approximately million shares, including approximately 21.5 million shares issued as a result of the underwriters exercising their over-allotment option, of its common stock at $7 per share, for total net proceeds to the Company of approximately $1.1 billion. A portion of the shares were previously held by the Company as treasury stock and a portion of the shares were newly issued. Proceeds from the common stock offering and concurrent offering of senior secured notes were used to repay outstanding amounts under the Company s senior credit facility and redeem certain outstanding senior debentures and senior notes and for general corporate purposes. Stock repurchases. Share repurchases are only conducted under repurchase programs approved by the Board of Directors and publicly announced. At December 31, 2010, the Company had 20 million shares available for repurchase under the May 2008 authorization, subject to limitations under the Company s agreements governing its long-term indebtedness. The Company did not repurchase any shares during 2010 or The Company repurchased 18.1 million shares in 2008 for $1.24 billion and an average price of $ NOTE 12 STOCK-BASED COMPENSATION Information about the Company s share-based awards. The Company adopted an omnibus incentive plan in 2005 which, as amended, allows it to grant stock options, stock appreciation rights ( SARs ), restricted stock, restricted stock units ( RSUs ), and other stock-based awards to eligible directors, officers and employees of the Company and its subsidiaries. The plans are administered by the Compensation Committee (the Committee ) of the Board of Directors. The Committee has discretion under the omnibus plan regarding which type of awards to grant, the vesting and service requirements, exercise price and other conditions, in all cases subject to certain limits, including: k k As amended, the omnibus plan allows for the issuance of up to 35 million (20 million prior to an August 2008 amendment) shares or share-based awards; and For stock options and SARs, the exercise price of the award must be at least equal to the fair market value of the stock on the date of grant and the maximum term of such an award is 10 years. Stock options and SARs granted under all plans generally have terms of either seven or ten years, and in most cases vest in either four or five equal annual installments. RSUs granted vest ratably over 4 years. The Company s practice is to issue new shares upon exercise or vesting of awards. 59
80 Activity under share-based payment plans. As of December 31, 2010, the Company had an aggregate of approximately 11 million shares of common stock available for grant as share-based awards under the Company s omnibus incentive plan. Such capacity is limited to 3.3 million shares as a result of the Company s fourth quarter 2010 common stock offering discussed in Note 11. A summary of activity under the Company s share-based payment plans for the year ended December 31, 2010 is presented below: Stock options and stock appreciation rights ( SARs ) Shares (000 s) Weighted Average Exercise Price Weighted Average Remaining Contractual Term Aggregate Intrinsic Value Outstanding at January 1, ,211 $ Granted... 3, Exercised... (140) 9.86 Forfeited or expired.... (3,792) Outstanding at December 31, , $ 59,711 Vested and expected to vest at December 31, , $ 57,761 Exercisable at December 31, , $ 21,298 The following tables include additional information related to stock options, SARs and RSUs: Restricted stock units ( RSUs ) Shares (000 s) Weighted Average Grant-Date Fair Value Nonvested at January 1, ,080 $ Granted Vested... (323) Forfeited... (66) Nonvested at December 31, , Year Ended December 31, (In thousands) Intrinsic value of share-based awards exercised or vested.... $ 4,377 $ 2,546 $ 33,342 Income tax benefit from share-based awards exercised or vested.. 1, ,494 Proceeds from stock option exercises ,116 In 2009, the Company began to net settle stock option exercises, whereby shares of common stock are issued equivalent to the intrinsic value of the option less applicable taxes. Accordingly, the Company no longer receives proceeds from the exercise of stock options. As of December 31, 2010, there was a total of $58 million of unamortized compensation related to stock options and stock appreciation rights expected to vest, which is expected to be recognized over a weighted-average period of 2.0 years. As of December 31, 2010, there was a total of $36 million of unamortized compensation related to restricted stock units, which is expected to be recognized over a weighted-average period of 1.5 years. $27 million of such unamortized compensation relates to the RSUs granted in the Company s 2008 exchange offer. RSUs 60
81 granted to corporate officers are subject to certain performance requirements determined by the Committee. Such performance requirements do not apply to RSUs granted in the exchange offer. Recognition of compensation cost. The Company recognizes the estimated fair value of stock options and SARs granted under the Company s omnibus plan based on the estimated fair value of these awards measured at the date of grant using the Black-Scholes model. For restricted stock units, compensation cost is calculated based on the fair market value of its stock on the date of grant. For stock options awards granted prior to January 1, 2006, the unamortized expense is being recognized on an accelerated basis. For all awards granted after January 1, 2006, such expense is being recognized on a straight-line basis over the vesting period of the awards. Forfeitures are estimated at the time of grant, with such estimate updated periodically and with actual forfeitures recognized currently to the extent they differ from the estimate. The Company capitalizes stock-based compensation related to employees dedicated to construction activities. In addition, the Company charges CityCenter for stock-based compensation related to employees dedicated to CityCenter. The following table shows information about compensation cost recognized: Year Ended December 31, (In thousands) Compensation cost Stock options and SARS... $ 20,554 $ 21,756 $ 37,766 RSUs... 19,693 21,294 4,652 Total compensation cost... 40,247 43,050 42,418 Less: CityCenter reimbursed costs... (5,259) (6,415) (6,019) Less: Compensation cost capitalized... - (64) (122) Compensation cost recognized as expense... 34,988 36,571 36,277 Less: Related tax benefit... (12,162) (12,689) (12,569) Compensation expense, net of tax benefit... $ 22,826 $ 23,882 $ 23,708 Compensation cost for stock options and SARs was based on the estimated fair value of each award, measured by applying the Black-Scholes model on the date of grant, using the following weighted-average assumptions: Year Ended December 31, Expected volatility... 71% 82% 50% Expected term yrs. 4.7 yrs. 4.6 yrs. Expected dividend yield... 0% 0% 0% Risk-free interest rate % 2.4% 2.7% Forfeiture rate % 3.5% 3.5% Weighted-average fair value of options granted... $ 6.91 $ 5.37 $ Expected volatility is based in part on historical volatility and in part on implied volatility based on traded options on the Company s stock. The expected term considers the contractual term of the option as well as historical exercise and forfeiture behavior. The risk-free interest rate is based on the rates in effect on the grant date for U.S. Treasury instruments with maturities matching the relevant expected term of the award. NOTE 13 EMPLOYEE BENEFIT PLANS Employees of the Company who are members of various unions are covered by union-sponsored, collectively bargained, multi-employer health and welfare and defined benefit pension plans. The Company recorded an expense of $205 million in 2010, $177 million in 2009, and $192 million in 2008 under such plans. The plans 61
82 sponsors have not provided sufficient information to permit the Company to determine its share of unfunded vested benefits, if any. The Company is self-insured for most health care benefits and workers compensation for its non-union employees. The liability for health care claims filed and estimates of claims incurred but not reported was $18 million and $20 million at December 31, 2010 and 2009, respectively. The workers compensation liability for claims filed and estimates of claims incurred but not reported was $24 million and $27 million as of December 31, 2010 and December 31, 2009, respectively. Both liabilities are included in Other accrued liabilities. The Company has retirement savings plans under Section 401(k) of the Internal Revenue Code for eligible employees. The plans allow employees to defer, within prescribed limits, up to 30% of their income on a pre-tax basis through contributions to the plans. The Company suspended contributions to the plan in 2009, though certain employees at MGM Grand Detroit and Four Seasons were still eligible for matching contributions. In the case of certain union employees, the Company contributions to the plan are based on hours worked. The Company recorded charges for 401(k) contributions of $3 million in 2010, $2 million in 2009 and $25 million in The Company reinstated a more limited 401(k) company contribution in 2011 and will continue to monitor the plan contributions as the economy changes. The Company maintains nonqualified deferred retirement plans for certain key employees. The plans allow participants to defer, on a pre-tax basis, a portion of their salary and bonus and accumulate tax deferred earnings, plus investment earnings on the deferred balances, as a deferred tax savings. Through December 31, 2008 participants earned a Company match of up to 4% of salary, net of any Company match received under the Company s 401(k) plan. In 2009, the Company suspended contributions to the plan. All employee deferrals vest immediately. The Company matching contributions vest ratably over a three-year period. The Company recorded charges for matching contributions of $1 million in The Company also maintains nonqualified supplemental executive retirement plans ( SERP ) for certain key employees. Until September 2008, the Company made quarterly contributions intended to provide a retirement benefit that is a fixed percentage of a participant s estimated final five-year average annual salary, up to a maximum of 65%. The Company has indefinitely suspended these contributions. Employees do not make contributions under these plans. A portion of the Company contributions and investment earnings thereon vest after three years of SERP participation and the remaining portion vests after both five years of SERP participation and 10 years of continuous service. The Company recorded expense under this plan of $4 million in Pursuant to the amendments of the nonqualified deferred retirement plans and SERP plans during 2008, and consistent with certain transitional relief provided by the Internal Revenue Service pursuant to rules governing nonqualified deferred compensation, the Company permitted participants under the plans to make a one-time election to receive, without penalty, all or a portion of their respective vested account balances. Based on elections made, the Company made payments to participants of $62 million in In addition, the Company made payments of $57 million to participants in 2008 related to previous versions of these plans that were terminated during the year. NOTE 14 PROPERTY TRANSACTIONS, NET Property transactions, net consisted of the following: Year Ended December 31, (In thousands) CityCenter investment impairment... $ 1,313,219 $ 955,898 $ - Borgata impairment , Atlantic City Renaissance Point land impairment ,347 - Goodwill and other indefinite-lived intangible assets impairment ,179,788 Gain on sale of TI... - (187,442) - Other property transactions, net... 9,860 11,886 30,961 $ 1,451,474 $ 1,328,689 $ 1,210,749 62
83 See Note 5 for discussion of the Company s CityCenter investment impairment and Borgata impairment in Other property transactions in 2010 include the write-off of various abandoned construction projects. See Note 2 for discussion of the Atlantic City Renaissance Pointe land impairment and Note 5 for discussion of the Company s CityCenter investment impairment in Other write-downs in 2009 included the write-down of the Detroit temporary casino and write-off of various discontinued capital projects, offset by $7 million in insurance recoveries related to the Monte Carlo fire. See discussion of goodwill and other indefinite-lived intangible assets impairment charge recorded in 2008 in Note 6. Other property transactions in 2008 included $30 million related to the write-down of land and building assets of Primm Valley Golf Club. The 2008 period also included approximately $9 million of demolition costs associated with various room remodel projects as well as the write-down of approximately $27 million of various discontinued capital projects. These amounts were offset by a gain on the sale of an aircraft of $25 million and $10 million of insurance recoveries related to the Monte Carlo fire. NOTE 15 RELATED PARTY TRANSACTIONS CityCenter Management agreements. The Company and CityCenter have entered into agreements whereby the Company is responsible for management of the design, planning, development and construction of CityCenter and is managing the operations of CityCenter for a fee. The Company is being reimbursed for certain costs in performing its development and management services. During the years ended December 31, 2010, 2009, and 2008 the Company incurred $354 million, $95 million, and $46 million, respectively, of costs reimbursable by the joint venture, primarily for employee compensation and certain allocated costs. As of December 31, 2010, CityCenter owes the Company $35 million for management services and reimbursable costs. Other agreements. The Company owns OE Pub, LLC, which leases retail space in Crystals. The Company recorded $1 million of expense related to the lease agreement in the year ended December 31, The Company entered into an agreement with CityCenter whereby the Company provides CityCenter the use of its aircraft on a time sharing basis. CityCenter is charged a rate that is based on Federal Aviation Administration regulations, which provides for reimbursement for specific costs incurred by the Company without any profit or mark-up. During the year ended December 31, 2010, the Company was reimbursed $4 million for aircraft related expenses. The Company has various other arrangements with CityCenter for the provision of certain shared services, reimbursement of costs and other transactions undertaken in the ordinary course of business. 63
84 NOTE 16 CONSOLIDATING CONDENSED FINANCIAL INFORMATION Excluding MGM Grand Detroit, LLC and certain other subsidiaries, the Company s subsidiaries that are 100% directly or indirectly owned have fully and unconditionally guaranteed, on a joint and several basis, payment of the senior credit facility, the senior notes, senior secured notes, convertible senior notes and the senior subordinated notes. Separate condensed financial statement information for the subsidiary guarantors and non-guarantors as of December 31, 2010 and 2009 and for the years ended December 31, 2010, 2009 and 2008 is as follows: CONDENSED CONSOLIDATING BALANCE SHEET INFORMATION Parent At December 31, 2010 Guarantor Subsidiaries Non-Guarantor Subsidiaries Elimination Consolidated (In thousands) Current assets $ 358,725 $ 930,936 $ 165,984 $ - $ 1,455,645 Property and equipment, net ,925, ,098 (11,972) 14,554,350 Investments in subsidiaries ,520, ,283 - (16,992,005) - Investments in and advances to unconsolidated affiliates ,923, ,923,155 Other non-current assets , , ,377-1,027,895 $ 17,173,612 $ 17,686,951 $ 1,104,459 $ (17,003,977) $ 18,961,045 Current liabilities $ 305,354 $ 911,731 $ 29,136 $ - $ 1,246,221 Intercompany accounts (44,380) 38,277 6, Deferred income taxes ,469, ,469,333 Long-term debt ,301, , ,000-12,047,698 Other long-term obligations ,726 54, ,248 Stockholders equity ,998,545 16,385, ,526 (17,003,977) 2,998,545 $ 17,173,612 $ 17,686,951 $ 1,104,459 $ (17,003,977) $ 18,961,045 Parent At December 31, 2009 Guarantor Subsidiaries Non-Guarantor Subsidiaries Elimination Consolidated (In thousands) Current assets $ 2,143,019 $ 810,991 $ 99,491 $ - $ 3,053,501 Property and equipment, net ,391, ,191 (11,972) 15,069,952 Investments in subsidiaries ,927, ,336 - (18,375,000) - Investments in and advances to unconsolidated affiliates ,353, ,465-3,611,799 Other non-current assets , , , ,958 $ 20,222,888 $ 19,510,894 $ 1,171,400 $ (18,386,972) $ 22,518,210 Current liabilities $ 344,707 $ 926,780 $ 32,290 $ - $ 1,303,777 Current portion of long-term debt... 1,079, ,079,824 Intercompany accounts (227,808) 120, , Deferred income taxes ,031, ,031,303 Long-term debt ,929, , ,000-12,976,037 Other long-term obligations ,380 60, ,837 Stockholders equity ,870,432 17,805, ,315 (18,386,972) 3,870,432 $ 20,222,888 $ 19,510,894 $ 1,171,400 $ (18,386,972) $ 22,518,210 64
85 CONDENSED CONSOLIDATING STATEMENT OF OPERATIONS INFORMATION Parent Guarantor Subsidiaries Year Ended December 31, 2010 Non-Guarantor Subsidiaries Elimination Consolidated (In thousands) Net revenues $ - $ 5,480,318 $ 538,915 $ - $ 6,019,233 Equity in subsidiaries earnings..... (1,281,514) 164,502-1,117,012 - Expenses: Casino and hotel operations ,684 3,458, ,631-3,757,542 General and administrative ,974 1,020,119 98,710-1,128,803 Corporate expense , ,199 (1,692) - 124,241 Preopening and start-up expenses.. - 4, ,247 Property transactions, net ,451,801 (327) - 1,451,474 Depreciation and amortization ,895 40, ,423 36,392 6,637, ,850-7,099,730 Income (loss) from unconsolidated affiliates (208,099) 129,665 - (78,434) Operating income (loss) (1,317,906) (1,200,767) 242,730 1,117,012 (1,158,931) Interest expense, net (1,060,511) (22,512) (30,557) - (1,113,580) Other, net ,074 (50,929) (40,659) - 56,486 Income (loss) before income taxes... (2,230,343) (1,274,208) 171,514 1,117,012 (2,216,025) Benefit (provision) for income taxes ,946 (9,316) (5,002) - 778,628 Net income (loss) $ (1,437,397) $ (1,283,524) $ 166,512 $ 1,117,012 $ (1,437,397) 65
86 CONDENSED CONSOLIDATING STATEMENT OF CASH FLOWS INFORMATION Parent Guarantor Subsidiaries Year Ended December 31, 2010 Non-Guarantor Subsidiaries Elimination Consolidated (In thousands) Cash flows from operating activities Net cash provided by (used in) operating activities $ (484,388) $ 903,454 $ 84,948 $ - $ 504,014 Cash flows from investing activities Capital expenditures, net of construction payable (201,917) (5,574) - (207,491) Dispositions of property and equipment ,292 6,309-77,601 Investments in and advances to unconsolidated affiliates (553,000) (553,000) Distributions from unconsolidated affiliates in excess of earnings ,563 1,943 67, ,058 Distributions from cost method investments, net , ,422 Investments in treasury securities with maturities greater than 90 days (149,999) - - (149,999) Other (1,670) - - (1,670) Net cash provided by (used in) investing activities (487,437) (166,929) 68,287 - (586,079) Cash flows from financing activities Net borrowings (repayments) under bank credit facilities - maturities of 90 days or less (2,098,198) - 212,119 - (1,886,079) Borrowings under bank credit facilities - maturities longer than 90 days ,068,342-1,417,881-9,486,223 Repayments under bank credit facilities - maturities longer than 90 days (9,177,860) - (1,630,000) - (10,807,860) Issuance of senior notes, net ,489, ,489,485 Retirement of senior notes (857,523) (296,956) - - (1,154,479) Debt issuance costs (106,831) (106,831) Issuance of common stock in public offering, net , ,456 Intercompany accounts ,553 (422,895) (79,658) - - Capped call transactions (81,478) (81,478) Other (1,280) (1,268) (67) - (2,615) Net cash used in financing activities.. (674,334) (721,119) (79,725) - (1,475,178) Cash and cash equivalents Net increase (decrease) for the period... (1,646,159) 15,406 73,510 - (1,557,243) Balance, beginning of period ,718, ,386 74,205-2,056,207 Balance, end of period $ 72,457 $ 278,792 $ 147,715 $ - $ 498,964 66
87 CONDENSED CONSOLIDATING STATEMENT OF OPERATIONS INFORMATION Parent Guarantor Subsidiaries Year Ended December 31, 2009 Non-Guarantor Subsidiaries Elimination Consolidated (In thousands) Net revenues $ - $ 5,435,274 $ 543,315 $ - $ 5,978,589 Equity in subsidiaries earnings..... (834,524) 65, ,993 - Expenses: Casino and hotel operations ,368 3,223, ,331-3,539,306 General and administrative , ,310 94,299-1,100,193 Corporate expense , ,394 (3,895) - 143,764 Preopening and start-up expenses , ,013 Property transactions, net ,321,353 7,336-1,328,689 Depreciation and amortization ,703 40, ,273 57,217 6,357, ,641-6,854,238 Income (loss) from unconsolidated affiliates (112,856) 24,629 - (88,227) Operating income (loss) (891,741) (969,431) 128, ,993 (963,876) Interest income (expense), net (953,820) 201,815 (23,426) - (775,431) Other, net (185,590) (57,100) (30,596) - (273,286) Income (loss) before income taxes... (2,031,151) (824,716) 74, ,993 (2,012,593) Benefit (provision) for income taxes ,469 (13,726) (4,832) - 720,911 Net income (loss) $ (1,291,682) $ (838,442) $ 69,449 $ 768,993 $ (1,291,682) 67
88 CONDENSED CONSOLIDATING STATEMENT OF CASH FLOWS INFORMATION Parent Guarantor Subsidiaries Year Ended December 31, 2009 Non-Guarantor Subsidiaries Elimination Consolidated (In thousands) Cash flows from operating activities Net cash provided by (used in) operating activities $ (652,977) $ 1,154,595 $ 86,296 $ - $ 587,914 Cash flows from investing activities Capital expenditures, net of construction payable (135,211) (1,639) - (136,850) Proceeds from sale of Treasure Island, net , ,266 Dispositions of property and equipment , ,291 Investments in and advances to unconsolidated affiliates (956,550) - (7,135) (963,685) Property damage insurance recoveries , ,186 Other (5,463) - - (5,463) Net cash used in investing activities.. - (321,481) (1,639) (7,135) (330,255) Cash flows from financing activities Net repayments under bank credit facilities - maturities of 90 days or less.. (983,593) - (43,600) - (1,027,193) Borrowings under bank credit facilities maturities longer than 90 days ,041, ,000-6,771,492 Repayments under bank credit facilities maturities longer than 90 days (5,302,455) - (640,000) - (5,942,455) Issuance of senior notes, net ,921, ,921,751 Retirement of senior notes (820,010) (356,442) - - (1,176,452) Debt issuance costs (112,055) (112,055) Issuance of common stock in public offering, net ,103, ,104,418 Intercompany accounts ,247,519 (1,222,105) (32,549) 7,135 - Payment of Detroit Economic Development Corporation bonds (49,393) - (49,393) Other ,180 (4,480) (63) - (1,363) Net cash provided by (used in) financing activities ,099,567 (1,582,347) (35,605) 7,135 1,488,750 Cash and cash equivalents Net increase (decrease) for the period... 2,446,590 (749,233) 49,052-1,746,409 Change in cash related to assets held for sale , ,154 Balance, beginning of period , ,494 30, ,644 Balance, end of period $ 2,449,255 $ (472,585) $ 79,537 $ - $ 2,056,207 68
89 CONDENSED CONSOLIDATING STATEMENT OF OPERATIONS INFORMATION Parent Guarantor Subsidiaries Year Ended December 31, 2008 Non-Guarantor Subsidiaries Elimination Consolidated (In thousands) Net Revenues $ - $ 6,623,068 $ 585,699 $ - $ 7,208,767 Equity in subsidiaries earnings..... (45,122) 49,450 - (4,328) - Expenses: Casino and hotel operations ,173 3,688, ,364-4,034,374 General and administrative ,485 1,161, ,262-1,278,944 Corporate Expense ,869 94, ,279 Preopening and start-up expenses , ,059 Property transactions, net ,204,721 6,028-1,210,749 Depreciation and amortization ,556 53, ,236 37,527 6,897, ,921-7,434,641 Income from unconsolidated affiliates ,942 11,329-96,271 Operating income (loss) (82,649) (139,733) 97,107 (4,328) (129,603) Interest income (expense), net (697,281) 104,322 (16,327) - (609,286) Other, net ,575 (6,553) (26,121) - 69,901 Income (loss) before income taxes... (677,355) (41,964) 54,659 (4,328) (668,988) Provision for income taxes (177,931) (3,158) (5,209) - (186,298) Net Income (loss) $ (855,286) $ (45,122) $ 49,450 $ (4,328) $ (855,286) 69
90 CONDENSED CONSOLIDATING STATEMENT OF CASH FLOWS INFORMATION Parent Guarantor Subsidiaries Year Ended December 31, 2008 Non-Guarantor Subsidiaries Elimination Consolidated (In thousands) Cash flows from operating activities Net cash provided by (used in) operating activities $ (977,381) $ 1,650,663 $ 79,750 $ - $ 753,032 Cash flows from investing activities Capital expenditures, net of construction payable (777,033) (4,721) - (781,754) Dispositions of property and equipment , ,968 Investments in and advances to unconsolidated affiliates (1,274,814) - (4,648) (1,279,462) Property damage insurance recoveries , ,109 Other (27,301) - - (27,301) Net cash used in investing activities.. - (1,972,071) (4,721) (4,648) (1,981,440) Cash flows from financing activities Net borrowings (repayments) under bank credit facilities - maturities of 90 days or less ,907,400 - (146,950) - 2,760,450 Borrowings under bank credit facilities maturities longer than 90 days ,820, ,000-8,170,000 Repayments under bank credit facilities maturities longer than 90 days (8,290,000) - (160,000) - (8,450,000) Issuance of senior notes, net ,441 (951) ,490 Retirement of senior notes (341,565) (447,581) - - (789,146) Debt issuance costs (48,700) (48,700) Purchases of common stock (1,240,856) (1,240,856) Intercompany accounts (575,941) 693,526 (122,233) 4,648 - Other ,978 (11,075) (59) - 21,844 Net cash provided by (used in) financing activities , ,919 (79,242) 4,648 1,122,082 Cash and cash equivalents Net decrease for the period (14,624) (87,489) (4,213) - (106,326) Change in cash related to assets held for sale (14,154) - - (14,154) Balance, beginning of period , ,137 34, ,124 Balance, end of period $ 2,665 $ 262,494 $ 30,485 $ - $ 295,644 70
91 NOTE 17 SELECTED QUARTERLY FINANCIAL RESULTS (UNAUDITED) Quarter First Second Third Fourth Total (In thousands, except for per share amounts) 2010 Net revenues $ 1,457,392 $ 1,537,695 $ 1,557,705 $ 1,466,441 $ 6,019,233 Operating income (loss) (11,423) (1,048,817) (205,901) 107,210 (1,158,931) Net income (loss) (96,741) (883,476) (317,991) (139,189) (1,437,397) Basic income (loss) per share $ (0.22) $ (2.00) $ (0.72) $ (0.29) $ (3.19) Diluted income (loss) per share $ (0.22) $ (2.00) $ (0.72) $ (0.29) $ (3.19) 2009 Net revenues $ 1,498,795 $ 1,494,155 $ 1,533,223 $ 1,452,416 $ 5,978,589 Operating income (loss) , ,099 (963,419) (486,655) (963,876) Net income (loss) ,199 (212,575) (750,388) (433,918) (1,291,682) Basic income (loss) per share $ 0.38 $ (0.60) $ (1.70) $ (0.98) $ (3.41) Diluted income (loss) per share $ 0.38 $ (0.60) $ (1.70) $ (0.98) $ (3.41) Because income per share amounts are calculated using the weighted average number of common and dilutive common equivalent shares outstanding during each quarter, the sum of the per share amounts for the four quarters does not equal the total income per share amounts for the year. As discussed in Note 5, in 2010 the Company recorded a $1.3 billion impairment charge related to its CityCenter investment and a $166 million charge related to its share of the CityCenter residential real estate impairment. The impairment of the CityCenter investment was recorded in the second and third quarters and resulted in an impact to diluted loss per share of $1.64 in the second quarter, $0.27 in the third quarter, and $1.88 for the full year of The residential real estate impairment charges were recorded in each of the four quarters of The impact to diluted loss per share was $0.13 in the first quarter, $0.04 in the second quarter, $0.07 in the third quarter, $0.02 in the fourth quarter and $0.24 on the full year of As discussed in Note 5, the Company recorded a $128 million impairment charge related to its investment in Borgata. The impairment was recorded in the third quarter of 2010, and resulted in a $0.17 impact on third quarter of 2010 diluted loss per share and a $0.18 impact on full year 2010 diluted loss per share. As discussed in Note 9, the Company recorded a $32 million reduction in the Company s income tax benefit as a result of providing reserves for certain state-level deferred tax assets. The reduction was recorded in the fourth quarter of 2010, and resulted in a $0.07 impact on fourth quarter diluted loss per share and a $0.07 impact on full year 2010 diluted loss per share. As discussed in Note 5, in 2009 the Company recorded a $956 million impairment charge related to its CityCenter investment and a $203 million charge related to its share of the CityCenter residential impairment. These impairments were recorded in the third quarter, and resulted in a $1.70 impact on third quarter 2009 diluted loss per share and a $1.98 impact on full year 2009 diluted loss per share. As discussed in Note 2, in 2009 the Company recorded a $548 million impairment charge related to its Renaissance Pointe Land. The impairment was recorded in the fourth quarter of 2009, and resulted in a $0.73 impact on fourth quarter of 2009 diluted loss per share and a $0.85 impact on full year 2009 diluted loss per share. As discussed in Note 2, the Company recorded a $176 million impairment charge related to its M Resort convertible note. The impairment was recorded in the second quarter of 2009, and resulted in a $0.32 impact on second quarter of 2009 diluted loss per share and a $0.30 impact on full year 2009 diluted loss per share. As discussed in Note 2, the Company sold TI in the first quarter of 2009 and recorded a gain of $187 million. The sale resulted in an impact of $0.44 on first quarter of 2009 diluted income per share and a $0.31 impact on the full year 2009 diluted loss per share. 71
92 (This page intentionally left blank)
93 INVESTOR INFORMATION Common Stock Information The following table represents the high and low trading prices of the Company s common stock. For the years ended December 31, HIGH LOW HIGH LOW First Quarter $12.87 $9.31 $16.89 $1.81 Second Quarter Third Quarter Fourth Quarter The Company s common stock is listed on the New York Stock Exchange under the symbol MGM. There were approximately 4,437 record holders of the Company s common stock as of March 31, The Company has not paid dividends on its common stock in the last two fiscal years. The Company intends to retain its earnings to fund the operation of its business, to service and repay its debt, to make strategic investments in high return growth projects at its proven resorts and to reserve its capital to raise its capacity to capture investment opportunities overseas and in emerging markets. Furthermore, as a holding company with no independent operations, the Company s ability to pay dividends will depend upon the receipt of dividends and other payments from its subsidiaries. The Company s senior credit facility contains financial covenants that could restrict its ability to pay dividends. The Company s Board of Directors periodically reviews its policy with respect to dividends, and any determination to pay dividends in the future will be at the sole discretion of the Board of Directors. Cautionary Language Concerning Forward-Looking Statements Statements in this annual report which are not historical facts are forward-looking statements and safe harbor statements within the meaning of the Private Securities Litigation Reform Act of 1995 and other related laws that involve risks and/or uncertainties, including risks and/or uncertainties as described in the Company s public filings with the Securities and Exchange Commission. We have based those forward-looking statements on management s current expectations and assumptions and not on historical facts. These forward-looking statements involve a number of risks and uncertainties. Among the important factors that could cause actual results to differ materially from those indicated in such forward-looking statements include effects of economic conditions and market conditions in the markets in which the Company operates and competition with other destination travel locations throughout the United States and the world. In providing forwardlooking statements, the Company is not undertaking any duty or obligation to update these statements publicly as a result of new information, future events or otherwise except as required by law. Form 10-K A copy of the Company s annual report on Form 10-K, as filed with the Securities and Exchange Commission, will be furnished without charge to any stockholder upon written request to: $250 $200 COMPARISON OF 5 YEAR CUMULATIVE TOTAL RETURN* Among MGM Resorts International, the Dow Jones US Index and the Dow Jones US Gambling Index Mr. John M. McManus Executive Vice President General Counsel and Secretary MGM Resorts International 3600 Las Vegas Blvd. South Las Vegas, NV Stock Performance Graph The graph to the right compares the cumulative 5-year total return* of holders of MGM Resorts International s common stock with the cumulative total returns of the Dow Jones US total market index and the Dow Jones US Gambling index. The graph tracks the performance of a $100 investment in the Company s common stock and in each of the indexes (with the reinvestment of all dividends) from 12/31/2005 to 12/31/2010. Transfer Agent and Registrar For Common Stock BNY Mellon Shareowner Services 480 Washington Blvd. Jersey City, NJ (800) United States (201) Foreign (800) TDD for Hearing Impaired (201) TDD for Foreign Stockholders $150 $100 $50 $0 12/05 12/06 12/07 12/08 12/09 12/10 MGM Resorts International Dow Jones US Dow Jones US Gambling *$100 invested on 12/31/05 in stock or index, including reinvestment of dividends. Fiscal year ending December 31. Copyright 2010 Dow Jones & Co. All rights reserved. 12/05 12/06 12/07 12/08 12/09 12/10 MGM Resorts International Dow Jones US Dow Jones US Gambling The stock price performance included in this graph is not necessarily indicative of future stock price performance. Independent Registered Public Accounting Firm Deloitte & Touche LLP 3883 Howard Hughes Parkway Suite 400 Las Vegas, NV 89169
94 CORPORATE INFORMATION DIRECTORS James J. Murren Director/Officer Chairman of the Board, Chief Executive Officer MGM Resorts International Robert H. Baldwin Director/Officer Chief Design and Construction Officer, MGM Resorts International William A. Bible Director Burton M. Cohen Director Willie D. Davis Director President, All-Pro Broadcasting, Inc., a radio broadcasting company Alexis M. Herman Director President and Chief Executive Officer, New Ventures, a corporate consulting company Roland Hernandez Director President, Hernandez Media Ventures, a privately held media assets company Kirk Kerkorian Director Emeritus President and Chief Executive Officer, Tracinda Corporation, a private investment company Anthony L. Mandekic Director Secretary/Treasurer, Tracinda Corporation, a private investment company Rose McKinney-James Director Managing Principal, McKinney-James and Associates, a government affairs firm Daniel J. Taylor Director Executive, Tracinda Corporation a private investment company Melvin B. Wolzinger Director OFFICERS William J. Hornbuckle Chief Marketing Officer Corey I. Sanders Chief Operating Officer Daniel J. D Arrigo Executive Vice President, Chief Financial Officer and Treasurer Phyllis A. James Executive Vice President, Special Counsel Litigation & Chief Diversity Officer Aldo Manzini Executive Vice President and Chief Administrative Officer John M. McManus Executive Vice President, General Counsel and Secretary William M. Scott IV Executive Vice President Corporate Strategy and Special Counsel Robert C. Selwood Executive Vice President and Chief Accounting Officer Rick Arpin Senior Vice President Corporate Controller Alan M. Feldman Senior Vice President Public Affairs James A. Freeman Senior Vice President Capital Markets and Strategy Shawn T. Sani Senior Vice President Taxes CORPORATE DIRECTORY MGM Resorts International 3600 Las Vegas Blvd. South Las Vegas, NV Bellagio Las Vegas, NV MGM Grand Las Vegas Las Vegas, NV Mandalay Bay Las Vegas, NV Four Seasons Hotel Las Vegas Las Vegas, NV The Mirage Las Vegas, NV Luxor Las Vegas, NV New York-New York Hotel & Casino Las Vegas, NV Excalibur Las Vegas, NV Monte Carlo Las Vegas, NV CityCenter Las Vegas, NV ARIA Resort and Casino Las Vegas, NV Vdara Hotel & Spa Las Vegas, NV Crystals Retail and Entertainment Las Vegas, NV Mandarin Oriental, Las Vegas Las Vegas, NV lasvegas Circus Circus Las Vegas Las Vegas, NV Circus Circus Reno Reno, NV Gold Strike Jean Jean, NV Railroad Pass Henderson, NV MGM Grand Detroit Detroit, MI Beau Rivage Biloxi, MS Gold Strike Tunica Tunica, MS Silver Legacy Reno, NV Grand Victoria Elgin, IL MGM Macau Macau, S.A.R

95 In Memoriam Kenny C. Guinn All of us in the MGM Resorts family were deeply saddened at the passing last July of our colleague, Gov. Kenny Guinn. Kenny was an invaluable resource, not only for our Company, but for the entire state of Nevada. He led a life of enormous accomplishment as a trusted leader both in the private and public sectors making critical contributions to our community in business, education and government. Simultaneously, he was an affable, approachable, down-to-earth family man whom many proudly called teacher, coach or friend. We can think of no better way to honor the memory of this great Nevadan and MGM Resorts Board Member than to support his passion in life: educating young people. The Company is proud to have made a donation in his memory to the Kenny Guinn Millennium Scholarship Fund knowing that future generations will benefit from this program that he founded and loved. I considered Kenny a mentor and a friend, and I miss him deeply. On behalf of our Company, we want to express our heartfelt wishes to Dema and the entire Guinn family. James J. Murren Chairman and CEO
MGM RESORTS INTERNATIONAL REPORTS FIRST QUARTER FINANCIAL AND OPERATING RESULTS
 Exhibit 99.1 MGM RESORTS INTERNATIONAL REPORTS FIRST QUARTER FINANCIAL AND OPERATING RESULTS CityCenter announces agreement to sell Mandarin Oriental Las Vegas for approximately $214 million Las Vegas,
MGM Resorts International Reports Third Quarter Financial And Operating Results
 NEWS RELEASE MGM Resorts International Reports Third Quarter Financial And Operating Results 10/30/2018 LAS VEGAS, Oct. 30, 2018 /PRNewswire/ -- MGM Resorts International (NYSE: MGM) ("MGM Resorts" or
MGM Resorts International 2012 Annual Report. era
 MGM Resorts International 2012 Annual Report era a new a landmark year Dear ShareholderS, 2012 was a landmark year for MGM Resorts International. We made major balance sheet improvements, upgraded our
The Astonishing World of MGM Resorts International.
 The Astonishing World of MGM Resorts International. 2011Annual Report 3 To Our Shareholders We are inspiring a renewed sense of passion in our business. The MGM Resorts International portfolio reflects
MGM RESORTS INTERNATIONAL REPORTS FOURTH QUARTER AND FULL YEAR FINANCIAL AND OPERATING RESULTS. Announces 8% Increase to Quarterly Cash Dividend
 Exhibit 99.1 MGM RESORTS INTERNATIONAL REPORTS FOURTH QUARTER AND FULL YEAR FINANCIAL AND OPERATING RESULTS Announces 8% Increase to Quarterly Cash Dividend Las Vegas, Nevada, February 13, 2019 MGM Resorts
WELCOME TO THE SHOW ANNUAL REPORT 2016
 WELCOME TO THE SHOW ANNUAL REPORT 2016 DEAR SHAREHOLDERS, In 2016, MGM Resorts reported consolidated Net Revenue of $9.5 billion, Net Income attributable to MGM Resorts of $1.1 billion, and Adjusted Property
MGM Resorts International (Exact name of registrant as specified in its charter)
") UNITED STATES SECURITIES AND EXCHANGE COMMISSION Washington, D.C. 20549 FORM 8-K CURRENT REPORT PURSUANT TO SECTION 13 OR 15(d) OF THE SECURITIES EXCHANGE ACT OF 1934 Date of report (Date of earliest event
UNITED STATES SECURITIES AND EXCHANGE COMMISSION Washington, D.C. 20549 FORM 8-K CURRENT REPORT PURSUANT TO SECTION 13 OR 15(d) OF THE SECURITIES EXCHANGE ACT OF 1934 Date of report (Date of earliest event
THIRD QUARTER 2017 EARNINGS
 MGM Resorts International THIRD QUARTER 2017 EARNINGS Investor Presentation November 8, 2017 Forward-Looking Statements Statements in this presentation that are not historical facts are forward-looking
M G M R E S O R T S I N T E R N A T I O N A L SUPPLEMENTAL SLIDES REVENUE RECOGNITION
 M G M R E S O R T S I N T E R N A T I O N A L SUPPLEMENTAL SLIDES REVENUE RECOGNITION 2018 M GM RESORTS INTERNATIONAL N E W R E V E N U E R E C O G N I T I O N A C C O U N T I N G S T A N D A R D As disclosed
M O M E N T U M A N N U A L R E P O R T TM % Recycled 4474_CVRc1.indd 1 3/31/15 12:52 PM
 MOMENTUM ANNUAL REPORT 2014 OPERATIONAL MOMENTUM DEAR SHAREHOLDERS, 2014 was a momentous year for MGM Resorts International. With the foundation of improving financial performance and extensive preparation
THE POWER TO ENDURE 2009 ANNUAL REPORT
 THE POWER TO ENDURE 2009 ANNUAL REPORT NO MATTER HOW TURBULENT THE TIMES, NO MATTER HOW CHALLENGING THE ENVIRONMENT, THE PEOPLE OF MGM MIRAGE HAVE SUMMONED THE STRENGTH TO ENDURE. LETTER FROM THE CHAIRMAN
A N N U A L R E P O R T
 T h e BUSINESS o ow f A N N U A L R E P O R T 2 0 1 7 D E A R S H A R E H O L D E R S 2017 was an incredible year of evolution for your Company, one that continued our focus on our long-term growth strategy
GOLDEN ENTERTAINMENT REPORTS 2018 THIRD QUARTER RESULTS
 GOLDEN ENTERTAINMENT REPORTS 2018 THIRD QUARTER RESULTS Third Quarter Highlights: - Strong Laughlin and Las Vegas Locals Property Performance - Stratosphere Renovations and Capital Plan on Schedule and
GOLDEN ENTERTAINMENT REPORTS 2018 FOURTH QUARTER RESULTS
 GOLDEN ENTERTAINMENT REPORTS 2018 FOURTH QUARTER RESULTS Fourth Quarter and Recent Highlights: The Strat Renovations Remain on Budget Completed Acquisition of Colorado Belle and Edgewater in Laughlin Six
MGM RESORTS INTERNATIONAL
 MGM RESORTS INTERNATIONAL FORM S-4 (Securities Registration: Business Combination) Filed 03/05/13 Address 3600 LAS VEGAS BLVD S LAS VEGAS, NV, 89109 Telephone 702-693-7120 CIK 0000789570 Symbol MGM SIC
GOLDEN ENTERTAINMENT REPORTS RECORD 2017 FOURTH QUARTER NET REVENUE OF $184.3 MILLION, NET LOSS OF $13.4 MILLION AND ADJUSTED EBITDA OF $29.
 GOLDEN ENTERTAINMENT REPORTS RECORD 2017 FOURTH QUARTER NET REVENUE OF $184.3 MILLION, NET LOSS OF $13.4 MILLION AND ADJUSTED EBITDA OF $29.0 MILLION LAS VEGAS March 15, 2018 Golden Entertainment, Inc.
BORGATA HOTEL CASINO & SPA QUARTERLY REPORT
 BORGATA HOTEL CASINO & SPA QUARTERLY REPORT FOR THE QUARTER ENDED SEPTEMBER 30, 2011 SUBMITTED TO THE DIVISION OF GAMING ENFORCEMENT OF THE STATE OF NEW JERSEY OFFICE OF FINANCIAL INVESTIGATIONS REPORTING
Las Vegas Sands Reports Fourth Quarter and Full Year 2016 Results
 Press Release Las Vegas Sands Reports Fourth Quarter and Full Year 2016 Results For the Quarter Ended December 31, 2016 (Compared to the Quarter Ended December 31, 2015) Consolidated Net Revenue Increased
MGM RESORTS INTERNATIONAL
 MGM RESORTS INTERNATIONAL FORM 10-K (Annual Report) Filed 03/03/14 for the Period Ending 12/31/13 Address 3600 LAS VEGAS BLVD S LAS VEGAS, NV, 89109 Telephone 702-693-7120 CIK 0000789570 Symbol MGM SIC
Las Vegas Sands Reports All-Time Record Quarterly Results. For the quarter ended March 31, 2013 compared to the quarter ended March 31, 2012:
 Press Release Las Vegas Sands Reports All-Time Record Quarterly Results For the quarter ended 2013 compared to the quarter ended 2012: Net Revenue Increased 19.5% to a Record $3.30 Billion Consolidated
Las Vegas Sands Reports Third Quarter 2017 Results. For the Quarter Ended September 30, 2017 (Compared to the Quarter Ended September 30, 2016)
") Exhibit 99.1 Las Vegas Sands Reports Third Quarter 2017 Results For the Quarter Ended September 30, 2017 (Compared to the Quarter Ended September 30, 2016) - Consolidated Net Revenue Increased 7.7% to
Exhibit 99.1 Las Vegas Sands Reports Third Quarter 2017 Results For the Quarter Ended September 30, 2017 (Compared to the Quarter Ended September 30, 2016) - Consolidated Net Revenue Increased 7.7% to
UNITED STATES SECURITIES AND EXCHANGE COMMISSION WASHINGTON, D.C FORM 8-K
 UNITED STATES SECURITIES AND EXCHANGE COMMISSION WASHINGTON, D.C. 20549 FORM 8-K CURRENT REPORT PURSUANT TO SECTION 13 OR 15(d) OF THE SECURITIES EXCHANGE ACT OF 1934 Date of Report (Date of earliest event
LAS VEGAS SANDS CORP.
 UNITED STATES SECURITIES AND EXCHANGE COMMISSION WASHINGTON, D.C. 20549 FORM 8-K CURRENT REPORT PURSUANT TO SECTION 13 OR 15(d) OF THE SECURITIES EXCHANGE ACT OF 1934 Date of Report (Date of earliest event
Las Vegas Sands Reports Record Fourth Quarter and Full Year 2014 Results. Adjusted Earnings per Diluted Share Increased 27.8% to $0.
 Press Release Las Vegas Sands Reports Record Fourth Quarter and Full Year 2014 Results For the Quarter Ended 2014 (Compared to the Quarter Ended 2013): Adjusted Earnings per Diluted Share Increased 27.8%
Las Vegas Sands Reports Fourth Quarter 2017 Results. For the Quarter Ended December 31, 2017 (Compared to the Quarter Ended December 31, 2016)
") Exhibit 99.1 Las Vegas Sands Reports Fourth Quarter 2017 Results For the Quarter Ended December 31, 2017 (Compared to the Quarter Ended December 31, 2016) - Consolidated Net Revenue Increased 11.7% to
Exhibit 99.1 Las Vegas Sands Reports Fourth Quarter 2017 Results For the Quarter Ended December 31, 2017 (Compared to the Quarter Ended December 31, 2016) - Consolidated Net Revenue Increased 11.7% to
Las Vegas Sands Reports Fourth Quarter 2018 Results. For the Quarter Ended December 31, 2018 (Compared to the Quarter Ended December 31, 2017)
") Exhibit 99.1 Las Vegas Sands Reports Fourth Quarter 2018 Results For the Quarter Ended December 31, 2018 (Compared to the Quarter Ended December 31, 2017) - Consolidated Net Revenue Increased 2.5% to $3.48
Exhibit 99.1 Las Vegas Sands Reports Fourth Quarter 2018 Results For the Quarter Ended December 31, 2018 (Compared to the Quarter Ended December 31, 2017) - Consolidated Net Revenue Increased 2.5% to $3.48
WYNN RESORTS CEO UPDATE MARCH 7, 2018
 WYNN RESORTS CEO UPDATE MARCH 7, 2018 FORWARD-LOOKING STATEMENTS This presentation contains forward-looking statements regarding operating trends, future results of operations and the completion of new
GOLDEN ENTERTAINMENT REPORTS 2018 FIRST QUARTER REVENUE OF $214.8 MILLION, NET INCOME OF $3.9 MILLION AND ADJUSTED EBITDA OF $45.
 GOLDEN ENTERTAINMENT REPORTS 2018 FIRST QUARTER REVENUE OF $214.8 MILLION, NET INCOME OF $3.9 MILLION AND ADJUSTED EBITDA OF $45.9 MILLION LAS VEGAS May 9, 2018 Golden Entertainment, Inc. (NASDAQ:GDEN)
Las Vegas Sands Corp. Reports Third Quarter 2009 Results
 Press Release Las Vegas Sands Corp. Reports Third Quarter 2009 Results Consolidated Adjusted Property EBITDAR Increases 11.7 percent to $272.3 Million on Net Revenue Increase of 3.2 percent Venetian Macao
istar Annual Report 2016
 istar Annual Report 2016 Annual Report 2016 2016 was a year of tangible progress for istar. The company set out to grow its earnings, capture unrecognized value and build a foundation for improved shareholder
LAS VEGAS SANDS CORP.
 UNITED STATES SECURITIES & EXCHANGE COMMISSION Washington, D.C. 20549 Form 10-Q QUARTERLY REPORT PURSUANT TO SECTION 13 OR 15(d) OF THE SECURITIES EXCHANGE ACT OF 1934 For the quarterly period ended September
Las Vegas Sands Corp. 1Q12 Financial Results. April 25, 2012
 Las Vegas Sands Corp. 1Q12 Financial Results April 25, 2012 Forward Looking Statements This presentation contains forward looking statements that are made pursuant to the Safe Harbor Provisions of the
LAS VEGAS CONVENTION & VISITORS AUTHORITY. S.E.C. Continuing Disclosures For the Year Ended June 30, 2016
 LAS VEGAS CONVENTION & VISITORS AUTHORITY S.E.C. Continuing Disclosures For the Year Ended June 30, 206 S.E.C. CONTINUING DISCLOSURES YEAR ENDED JUNE 30, 206 In order to comply with the continuing disclosure
Las Vegas Sands Corp. Reports Fourth Quarter and Full Year 2008 Results
 Las Vegas Sands Corp. Reports Fourth Quarter and Full Year 2008 Results Fourth Quarter 2008 Net Revenue Increases 4.3% to $1.09 Billion Full Year 2008 Net Revenue Increases 48.8% to $4.39 Billion Cost
BOARDWALK 1000, LLC DBA HARD ROCK HOTEL & CASINO QUARTERLY REPORT
 BOARDWALK 1000, LLC DBA HARD ROCK HOTEL & CASINO QUARTERLY REPORT FOR THE QUARTER ENDED SEPTEMBER 30, 2018 SUBMITTED TO THE DIVISION OF GAMING ENFORCEMENT OF THE STATE OF NEW JERSEY OFFICE OF FINANCIAL
Las Vegas Sands Reports Second Quarter 2018 Results. For the Quarter Ended June 30, 2018 (Compared to the Quarter Ended June 30, 2017)
") Exhibit 99.1 Las Vegas Sands Reports Second Quarter 2018 Results For the Quarter Ended June 30, 2018 (Compared to the Quarter Ended June 30, 2017) - Consolidated Net Revenue Increased 6.2% to $3.30 Billion
Exhibit 99.1 Las Vegas Sands Reports Second Quarter 2018 Results For the Quarter Ended June 30, 2018 (Compared to the Quarter Ended June 30, 2017) - Consolidated Net Revenue Increased 6.2% to $3.30 Billion
COMPANY CONTACT Mark Brugger (240) FOR IMMEDIATE RELEASE
 FOR IMMEDIATE RELEASE") COMPANY CONTACT Mark Brugger (240) 744-1150 FOR IMMEDIATE RELEASE DIAMONDROCK ACQUIRES THE HOTEL PALOMAR IN PHOENIX, AZ Premier Hotel with Prime Location in Downtown CityScape Development Updates 2018
COMPANY CONTACT Mark Brugger (240) 744-1150 FOR IMMEDIATE RELEASE DIAMONDROCK ACQUIRES THE HOTEL PALOMAR IN PHOENIX, AZ Premier Hotel with Prime Location in Downtown CityScape Development Updates 2018
12. Indicate by check mark whether the registrant:
 12. Indicate by check mark whether the registrant: (a) has filed all reports required to be filed by Section 17 of the Code and SRC Rule 17 thereunder or Sections 11 of the RSA and RSA Rule 11(a)-1 thereunder,
Las Vegas Operations. Wynn Palace Project in Macau
 Wynn Resorts, Limited Reports Second Quarter 2016 Results LAS VEGAS--(BUSINESS WIRE)--Jul. 28, 2016-- Wynn Resorts, Limited (Nasdaq: WYNN) today reported financial results for the second quarter ended
LAS VEGAS CONVENTION & VISITORS AUTHORITY. SEC Continuing Disclosures For the Year Ended June 30, 2017
 LAS VEGAS CONVENTION & VISITORS AUTHORITY SEC Continuing Disclosures For the Year Ended June 30, 207 SEC CONTINUING DISCLOSURES YEAR ENDED JUNE 30, 207 In order to comply with the continuing disclosure
LAS VEGAS SANDS CORP.
 UNITED STATES SECURITIES AND EXCHANGE COMMISSION WASHINGTON, D.C. 20549 FORM 8-K CURRENT REPORT PURSUANT TO SECTION 13 OR 15(d) OF THE SECURITIES EXCHANGE ACT OF 1934 Date of Report (Date of earliest event
ANNUAL REPORT 2016 THE PARK, LAS VEGAS MGM GRAND DETROIT, MICHIGAN BEAU RIVAGE, MISSISSIPPI
 MANDALAY BAY, LAS VEGAS BORGATA, NEW JERSEY ANNUAL REPORT 2016 NEW YORK-NEW YORK, LAS VEGAS MGM GRAND DETROIT, MICHIGAN EXCALIBUR, LAS VEGAS MONTE CARLO, LAS VEGAS THE PARK, LAS VEGAS GOLD STRIKE TUNICA,
Gaming Investment Forum October 2012
 Gaming Investment Forum October 2012 Safe Harbor/Non-GAAP Financial Disclosures All statements included in this presentation, other than historical information or statements of historical fact, are forward-looking
VICI Properties Inc. Announces Fourth Quarter 2017 Results
 NEWS RELEASE VICI Properties Inc. Announces Fourth Quarter 2017 Results 3/8/2018 Reports Initial Results with Fourth Quarter Diluted EPS of $0.19 per share Completes Formation Transactions and Closes its
Las Vegas Sands Corp. 2Q12 Financial Results. July 25, 2012
 Las Vegas Sands Corp. 2Q12 Financial Results July 25, 2012 Forward Looking Statements This presentation contains forward looking statements that are made pursuant to the Safe Harbor Provisions of the Private
Investor Presentation
 Investor Presentation March 2017 Forward-Looking Statements Statements in this presentation that are not historical facts are "forward-looking" statements and "safe harbor statements" within the meaning
Management Discussion and Analysis of Financial Condition and Results of Operations
 February 25, 2011 of Financial Condition and Results of Operations This ( MD&A ) was prepared as of February 25, 2011 and should be read in conjunction with the unaudited Interim Consolidated Financial
MGM GRAND DETROIT A VALUE ADDED DEVELOPMENT STRATEGY
 MGM GRAND DETROIT A VALUE ADDED DEVELOPMENT STRATEGY Introduction The MGM Grand Detroit was a successful project that was opened ahead of schedule and under budget. The project won national design/development
Investor Update March 2018
 Investor Update March 2018 Forward-looking Statements / Regulation G This presentation may contain statements that are "forward-looking statements" within the meaning of the safe harbor provisions of the
1Q 2018 Earnings C A E S A R S E N T E R T A I N M E N T C O R P O R A T I O N M A Y 2,
 1Q 2018 Earnings C A E S A R S E N T E R T A I N M E N T C O R P O R A T I O N M A Y 2, 2 0 1 8 1 Forward Looking Statements Certain information in this presentation and discussed on the conference call
STARWOOD REPORTS FOURTH QUARTER 2011 RESULTS
 CONTACT: Jason Koval (203) 351-3500 FOR IMMEDIATE RELEASE February 2, 2012 STARWOOD REPORTS FOURTH QUARTER 2011 RESULTS STAMFORD, CT, February 2, 2012 Starwood Hotels & Resorts Worldwide, Inc. (NYSE: HOT)
Wynn Resorts, Limited Reports Third Quarter 2013 Results
 IMMEDIATE RELEASE Wynn Resorts, Limited Reports Third Quarter 2013 Results LAS VEGAS, October 24, 2013 -- Wynn Resorts, Limited (Nasdaq: WYNN) today reported financial results for the third quarter ended
EX a _1ex99d1.htm EX-99.1
 EX-99.1 2 a16-13308_1ex99d1.htm EX-99.1 Exhibit 99.1 ISLE OF CAPRI CASINOS, INC. ANNOUNCES FISCAL 2016 FOURTH QUARTER AND YEAR RESULTS SAINT LOUIS, MO June 14, 2016 Isle of Capri Casinos, Inc. (NASDAQ:
 PRESS RELEASE View printer-friendly version
 T H I R D Q U A R T E R E A R N I N G S
 M G M R E S O R T S I N T E R N A T I O N A L T H I R D Q U A R T E R 2 0 1 8 E A R N I N G S O C T O B E R 3 0, 2 0 1 8 M GM RESORTS INTERNATIONAL FORWARD-LOOKING STATEMENTS Statements in this presentation
HONG KONG DISNEYLAND ANNUAL BUSINESS REVIEW FOR THE FISCAL YEAR 2009
 KEY HIGHLIGHTS Since its grand opening in 2005, HKDL remains focused on steadily growing its business and establishing its brand as the premier vacation, entertainment, and convention resort destination
Caesars Entertainment Reports Financial Results for the First Quarter of 2018 Announces New $500 Million Share Repurchase Authorization
 Exhibit 99.1 Contact: Media Investors Stephen Cohen Joyce Arpin (347) 489-6602 (702) 880-4707 Caesars Entertainment Reports Financial Results for the First Quarter of 2018 Announces New $500 Million Share
GREAT CANADIAN GAMING ANNOUNCES THIRD QUARTER 2018 RESULTS, CORPORATE REFINANCING, AND REDEMPTION OF SENIOR UNSECURED NOTES
 GREAT CANADIAN GAMING ANNOUNCES THIRD QUARTER 2018 RESULTS, CORPORATE REFINANCING, AND REDEMPTION OF SENIOR UNSECURED NOTES November 5, 2018 Coquitlam, B.C. Great Canadian Gaming Corporation [TSX:GC] (
MGM CHINA HOLDINGS LIMITED
 Hong Kong Exchanges and Clearing Limited and The Stock Exchange of Hong Kong Limited take no responsibility for the contents of this announcement, make no representation as to its accuracy or completeness
HARRAH'S RESORT, ATLANTIC CITY QUARTERLY REPORT
 HARRAH'S RESORT, ATLANTIC CITY QUARTERLY REPORT FOR THE QUARTER ENDED MARCH 31, 2010 SUBMITTED TO THE CASINO CONTROL COMMISSION OF THE STATE OF NEW JERSEY DIVISION OF FINANCIAL EVALUATION REPORTING MANUAL
RLH Corporation Reports Fourth Quarter 2017 Results
 RLH Corporation Reports Fourth Quarter 2017 Results March 28, 2018 DENVER, March 28, 2018 (GLOBE NEWSWIRE) -- Red Lion Hotels Corporation (the Company ) (NYSE:RLH), a growing hospitality company doing
MGM CHINA HOLDINGS LIMITED
 Hong Kong Exchanges and Clearing Limited and The Stock Exchange of Hong Kong Limited take no responsibility for the contents of this announcement, make no representation as to its accuracy or completeness
MGM CHINA HOLDINGS LIMITED
 Hong Kong Exchanges and Clearing Limited and The Stock Exchange of Hong Kong Limited take no responsibility for the contents of this announcement, make no representation as to its accuracy or completeness
BOARDWALK 1000, LLC DBA HARD ROCK HOTEL & CASINO QUARTERLY REPORT
 BOARDWALK 1000, LLC DBA QUARTERLY REPORT FOR THE QUARTER ENDED DECEMBER 31, 2018 SUBMITTED TO THE DIVISION OF GAMING ENFORCEMENT OF THE STATE OF NEW JERSEY OFFICE OF FINANCIAL INVESTIGATIONS REPORTING
1Q16 Earnings Call Presentation April 20, 2016
 The Venetian Macao Sands Cotai Central, Macao Marina Bay Sands, Singapore The Parisian Macao (Opening 2016) 1Q16 Earnings Call Presentation April 20, 2016 Sands Macao Four Seasons Macao Sands Bethlehem
Interim Consolidated Financial Statements. Mood Media Corporation Unaudited For the three and nine months ended September 30, 2014
 Interim Consolidated Financial Statements Mood Media Corporation For the three and nine months ended INTERIM CONSOLIDATED STATEMENTS OF FINANCIAL POSITION As at Notes December 31, ASSETS Current assets
MOHEGAN GAMING & ENTERTAINMENT ANNOUNCES SECOND QUARTER FISCAL 2018 OPERATING RESULTS
 MOHEGAN GAMING & ENTERTAINMENT ANNOUNCES SECOND QUARTER FISCAL 2018 OPERATING RESULTS Uncasville, Connecticut, May 3, 2018 Mohegan Gaming & Entertainment, or MGE, the owner and operator of Mohegan Sun
Caesars Entertainment Reports Financial Results for the First Quarter of 2017
 Exhibit 99.1 Contact: Media Investors Stephen Cohen Brian Blackman (347) 489-6602 (702) 407-6330 Caesars Entertainment Reports Financial Results for the First Quarter of 2017 LAS VEGAS, May 2, 2017 - Caesars
AFFINITY GAMING ANNOUNCES THREE AND TWELVE MONTHS RESULTS FOR THE PERIOD ENDED DECEMBER 31, 2011
 AFFINITY GAMING ANNOUNCES THREE AND TWELVE MONTHS RESULTS FOR THE PERIOD ENDED DECEMBER 31, 2011 Las Vegas, NV April 3, 2012 Affinity Gaming, LLC (the Company ) today announced results for the three and
COVANTA HOLDING CORPORATION REPORTS 2018 THIRD QUARTER RESULTS AND REAFFIRMS 2018 GUIDANCE
 COVANTA HOLDING CORPORATION REPORTS 2018 THIRD QUARTER RESULTS AND REAFFIRMS 2018 GUIDANCE MORRISTOWN, NJ, October 25, 2018 - Covanta Holding Corporation (NYSE: CVA) ("Covanta" or the "Company"), a world
ORIENT-EXPRESS HOTELS REPORTS THIRD QUARTER 2009 RESULTS
 Contact: Martin O Grady Pippa Isbell Vice President, Chief Financial Officer Vice President, Corporate Communications Tel: +44 20 7921 4038 Tel: +44 20 7921 4065 E: martin.ogrady@orient-express.com E:
2012 INVESTOR PRESENTATION
 2012 INVESTOR PRESENTATION OCTOBER 2012 P: 702-341-2400 W: AffinityGamingLLC.com 1 SAFE HARBOR This presentation contains forward-looking statements within the meaning of the Private Securities Litigation
MGM RESORTS INTERNATIONAL ANALYST & INVESTOR DAY PRESENTATION. June 16, 2016
 MGM RESORTS INTERNATIONAL ANALYST & INVESTOR DAY PRESENTATION June 16, 2016 Legal Disclaimers Cautionary Statement Concerning Forward-Looking Statements Statements in this presentation that are not historical
HYATT REPORTS SECOND QUARTER 2010 RESULTS
 CONTACT Investors: Atish Shah Hyatt Hotels Corporation 312-780-5427 atish.shah@hyatt.com Media: Farley Kern Hyatt Hotels Corporation 312-780-5506 farley.kern@hyatt.com FOR IMMEDIATE RELEASE HYATT REPORTS
Volume III Issue III. The Fiscal Impact of Southern Nevada Tourism: The Industry s Contribution to Major Public Revenues 2010 Update
 Volume III Issue III Page 1 Applied Analysis was retained by the Las Vegas Convention and Visitors Authority (the LVCVA ) to review and analyze the economic impacts associated with its various operations
SALES TAX ATTRIBUTABLE TO VISITORS
 EXECUTIVE SUMMARY Applied Analysis was retained by the Las Vegas Convention and Visitors Authority (the LVCVA ) to review and analyze the economic impacts associated with its various operations and southern
SECURITIES AND EXCHANGE COMMISSION SEC FORM 17-Q
 SECURITIES AND EXCHANGE COMMISSION SEC FORM 17-Q QUARTERLY REPORT PURSUANT TO SECTION 17 OF THE SECURITIES REGULATION CODE AND SRC RULE 17(2)(b) THEREUNDER 1. For the quarterly period ended September 30,
STARWOOD REPORTS FOURTH QUARTER 2014 RESULTS AND DECLARES FIRST QUARTER DIVIDEND OF $0.375 PER SHARE
 Investor Contact Stephen Pettibone 203-351-3500 Media Contact KC Kavanagh 866-478-2777 One StarPoint Stamford, CT 06902 United States STARWOOD REPORTS FOURTH QUARTER 2014 RESULTS AND DECLARES FIRST QUARTER
MGM Resorts International Global Gaming Operators MGM NYSE $31.01 Company Update
 27 April 2017 North American Research Rating: Buy Price Target: $40.00 Price $31.01 52wk Range $21.12 - $30.62 Shares Outstanding (MM) 574.5 Market Capitalization (MM) $17,814.2 Enterprise Value (MM) $33,514.7
Hilton Reports Third Quarter Results
 Investor Contact 7930 Jones Branch Drive Jill Slattery McLean, VA 22102 +1 703 883 6043 ir.hilton.com Media Contact Nigel Glennie +1 703 883 5262 Hilton Reports Third Quarter Results MCLEAN, VA (October
J.P. Morgan SMid Cap Conference November 2011
 J.P. Morgan SMid Cap Conference November 2011 Safe Harbor/Non-GAAP Financial Disclosures All statements included in this presentation, other than historical information or statements of historical fact,
Sabre Reports Fourth Quarter and Full Year 2014 Results
 Sabre Reports Fourth Quarter and Full Year 2014 Results Airline and Hospitality Solutions Momentum Continues, Including New Fourth Quarter Agreements With Alitalia, Copa and Wyndham Travelocity Segment
Caesars Entertainment WeChat Marketing. China-Friendly 2.0 November, 2017
 Caesars Entertainment WeChat Marketing China-Friendly 2.0 November, 2017 Caesars Entertainment: The World s Premier Provider of Branded Resort Entertainment Since 1937 CAESARS ENTERTAINMENT OVERVIEW Facts
Franchise Services of North America Inc. Consolidated Financial Statements
 Consolidated Financial Statements As at September 30, 2011 and for the years ended September 30, 2011 and 2010 1 Contents Auditors' Report 3 Consolidated Financial Statements Consolidated Balance Sheets
4Q & FY 2017 Earnings
 4Q & FY 2017 Earnings C A E S A R S E N T E R T A I N M E N T C O R P O R A T I O N M A R C H 7, 2 0 1 8 1 Forward Looking Statements Certain information in this presentation and discussed on the conference
SANDS CHINA LTD. (Incorporated in the Cayman Islands with limited liability) (Stock Code: 1928)
 (Stock Code: 1928)") Hong Kong Exchanges and Clearing Limited and The Stock Exchange of Hong Kong Limited take no responsibility for the contents of this announcement, make no representation as to its accuracy or completeness
Hong Kong Exchanges and Clearing Limited and The Stock Exchange of Hong Kong Limited take no responsibility for the contents of this announcement, make no representation as to its accuracy or completeness
2002 Financial Highlights
 2002 Financial Highlights (in thousands, except per share amounts, ratios and operating data) 2002 2001 2000 OPERATING RESULTS Total Revenues $ 440,380 $ 436,658 $ 436,574 O T H E R D A T A EBITDA (a)
Enterprise Community Loan Fund, Inc. Financial Statements and Independent Auditor's Report. December 31, 2017 and 2016
 Financial Statements and Independent Auditor's Report Index Page Independent Auditor's Report 2 Financial Statements Statements of Financial Position 3 Statements of Activities 4 Statements of Functional
Management s Discussion and Analysis
 1. 2. 3. 4. 5. 6. 7. 8. 9. 10. 11. 12. 13. 14. 15. 16. 17. 18. 19. 20. 21. 22. 23. Forward-Looking Statements Overview Strategic Framework Key Financial Performance Indicators Overall Financial Performance
THE WALT DISNEY COMPANY REPORTS RESULTS FOR THE FOURTH QUARTER AND FISCAL YEAR 2005
 FOR IMMEDIATE RELEASE November 17, THE WALT DISNEY COMPANY REPORTS RESULTS FOR THE FOURTH QUARTER AND FISCAL YEAR BURBANK, Calif. The Walt Disney Company today reported earnings for the fourth quarter
STARWOOD REPORTS SECOND QUARTER 2012 RESULTS
 Investor Contact Stephen Pettibone 203-351-3500 Media Contact KC Kavanagh 866-478-2777 One StarPoint Stamford, CT 06902 United States STARWOOD REPORTS SECOND QUARTER 2012 RESULTS STAMFORD, Conn. (July
FOR IMMEDIATE RELEASE. Genesis HealthCare Contact: Investor Relations GENESIS HEALTHCARE REPORTS FIRST QUARTER 2015 RESULTS
 FOR IMMEDIATE RELEASE Genesis HealthCare Contact: Investor Relations 610-925-2000 GENESIS HEALTHCARE REPORTS FIRST QUARTER 2015 RESULTS Solid Quarter With Pro Forma 1 Adjusted: o EBITDAR of $185.4 Million
STARWOOD REPORTS SECOND QUARTER 2016 RESULTS
 Exhibit 99.1 Investor Contact Stephen Pettibone 203-351-3500 Media Contact KC Kavanagh 866-478-2777 One StarPoint Stamford, CT 06902 United States STARWOOD REPORTS SECOND QUARTER 2016 RESULTS STAMFORD,
TIME INC. REPORTS THIRD QUARTER 2017 RESULTS. Operating Income Grows to $51 Million and Adjusted OIBDA Grows 15% Year-Over-Year to $115 Million
 TIME INC. REPORTS THIRD QUARTER 2017 RESULTS Operating Income Grows to $51 Million and Adjusted OIBDA Grows 15% Year-Over-Year to $115 Million Generated 36% of Revenues from Digital and Brand Extensions
SANDS CHINA LTD. 金沙中國有限公司
 Hong Kong Exchanges and Clearing Limited and The Stock Exchange of Hong Kong Limited take no responsibility for the contents of this announcement, make no representation as to its accuracy or completeness
INTERIM REPORT RAPPORT INTERMÉDIAIRE
 INTERIM REPORT RAPPORT INTERMÉDIAIRE POUR LES FOR NEUFS THE NINE MOIS MONTHS TERMINÉS ENDED LE 27 OCTOBER OCTOBRE 27, 2018 2018 MESSAGE TO SHAREHOLDERS Dear shareholders, Sales for the third quarter ended
COVANTA HOLDING CORPORATION REPORTS 2017 THIRD QUARTER RESULTS AND REAFFIRMS 2017 GUIDANCE
 COVANTA HOLDING CORPORATION REPORTS 2017 THIRD QUARTER RESULTS AND REAFFIRMS 2017 GUIDANCE MORRISTOWN, NJ, October 26, 2017 - Covanta Holding Corporation (NYSE: CVA) ("Covanta" or the "Company"), a world
Transform MGM MIRAGE 2006 ANNUAL REPORT
 Transform MGM MIRAGE 2006 ANNUAL REPORT ationtake a look around. What do you see? 2 At MGM MIRAGE, we challenge you to look again. It is a simple and indisputable fact of life: How you see the world depends
The Second Cup Ltd. Management s Discussion and Analysis
 CAUTION REGARDING FORWARD-LOOKING STATEMENTS Certain statements in this ( MD&A ) may constitute forward-looking statements within the meaning of applicable securities legislation. The terms the Company,
Overall, we outperformed against the high end of each of our on average and over time financial targets.
 PIPER JAFFRAY 16 TH ANNUAL FINANCIAL SERVICES CONFERENCE Talking points prepared for presentation to the Piper Jaffray 16 TH Annual Financial Services Conference by American Express Executive Vice President