Building Pride. Building Joy. RESULT PRESENTATION Q2 FY17 26 th October,
|
|
|
- Giles Park
- 5 years ago
- Views:
Transcription


1 Building Pride. Building Joy. RESULT PRESENTATION Q2 FY17 26 th October,
2 Key Developments Operations New Sales MIS Sales for Q2 FY17 is Rs lacs across projects Project Completion Till date completed and handed over 6 projects measuring total developed area of 2.27 Million sqft as on 30 th September, 2016 (Alcove, Megatrade, Parishkaar, Trade square, Expansia & Citadel) Ongoing Projects Currently, executing 5 projects in Ahmedabad and Bengaluru measuring Million sq ft of developable area (Sporcia, Uplands, Beyond Five, Megaestate and Megapark) Others Received building use(bu) permission for one of its projects in Ahmedabad i.e. Arvind Citadel Appointment of Big4 Audit Firm as Statutory Auditors of the Company Citadel won Residential Property of the Year award in Realty Plus Conclave & Excellence Awards (Gujarat)


3 Awards & Recognition Till Date 8 th May, 2015 Won the Emerging developer of the year- Residential award in Realty Plus Excellence Awards 8 th May, 2015 Uplands won the Luxury project of the year award in Realty Plus Excellence Awards 20th Feb, 2016 Bagged Emerging Developer of the Year India award in ABP News Real Estate Award th Feb, 2016 Uplands won Integrated Township of the Year India award in ABP News Real Estate Award th April, 2016 Uplands has been adjudged as Integrated Township of the year award in The Golden Globe Tigers Award th April, 2016 MD & CEO of the Company has been proclaimed as the Real Estate Most Enterprising CEO of the Year award in The Golden Globe Tigers Award st July, 2016 Citadel has been awarded the Residential Property of the Year by Realty Plus Conclave & Excellence Awards (Gujarat)
4 Consolidated Financials for Q2 FY17 Revenue EBITDA PBT PAT Revenue of Rs lacs during Q2 FY17 as against Rs. 781 lacs in Q2 FY16 and Rs lacs in Q1 FY17 Revenue up by 190% Yr-on-Yr and 1% Qtr-on-Qtr EBITDA of Rs. 674 lacs during Q2 FY17 as against Rs. 161 lacs in Q2 FY16 and Rs. 757 lacs in Q1 FY17 EBITDA up by 319% Yr-on-Yr and down by 11% Qtr-on-Qtr EBITDA margin at 30% PBT of Rs. 341 lacs during Q2 FY17 as against Rs. (10) lacs in Q2 FY16 and Rs. 463 lacs during Q1 FY17 PBT up by 3648% Yr-on-Yr and down by 26% Qtr-on-Qtr PBT margin at 15% PAT (after minority interest) of Rs. 226 lacs during Q2 FY17 as against Rs. (30) lacs in Q2 FY16 and Rs. 302 lacs during Q1 FY17 PAT up by 845% Yr-on-Yr and down by 25% Qtr-on-Qtr PAT margin at 10% 4
5 Financials - Others Collections Total collections of Rs lacs during Q2 FY17 Resulted into positive Net Operational cash flow of Rs. 658 lacs Unrecognized Revenue Unrecognized revenue from sold units is about Rs. 33,590 lacs Loan and Debt Consolidated debt as on 30 th September, 2016 is Rs lacs Consolidated D/E ratio stands at 0.67:1 Average cost of debt for Q2 FY 17 is 10.70% Others 5
6 Table of Contents Strategic Performance Financial Performance Project Performance 6
7 Five Strategic Pillars 1. Asset light/ low capex model to optimize ROE Focus on JD/JV deals Focus on Residential segment (low CAPEX requirement) No blocking of funds to create long term land bank 2. Leveraging of Arvind brand 3. Low Financial and Operational Leveraging Optimum D/E ratio: Infuse additional equity based on requirement Maintain operational efficiency to ensure lower level of Working Capital requirement Lean organization structure by out-sourcing noncore functions Take advantage of Arvind s Brand equity Focus on residential segment targeted for end use customer Expand in mini-metros like Ahmedabad and Bangalore; Explore new markets such as Pune where Arvind brand is more visible 7
8 Five Strategic Pillars 4. Optimum/ conservative risk profile Primary focus on end-consumption residential segment Steady and cautious geographic expansion Conservative Legal and Technical Due-diligence of projects Each geographic market to have reasonable critical mass 5. Innovative/Customer-Centric products, designs & services Set industry benchmarks in Product Designs and Innovation Partner with best in class agencies for Architecture, Landscaping, Customer Services and Designs Leverage technology to provide best in class experience and service to the customers Restrict land value of project within reasonable limit 8
")


 1000% 800% 600%")
9 Financial Snapshot (Consolidated Quarter) Turnover EBITDA Rs. in lacs 2,500 2,264 2, ,000 1,500 1, Q2 FY17 Q1 FY17 Q2 FY16 - Q2 FY17 Q1 FY17 Q2 FY16 PAT YoY Growth % (50) Q2 FY17 Q1 FY17 Q2 FY16 (30) 1000% 800% 600% 400% 200% 0% 845% 319% 190% Turnover EBITDA PAT 9
10 Balance Sheet Abstract (Consolidated) Rs. in lacs Particulars As on As on Shareholders' Fund 16,097 14,349 Non-Current Liabilities 6,210 5,183 Current Liabilities 20,427 16,034 Total Equity and Liabilities 42,734 35,566 Non-Current Assets 5,436 5,421 Current Assets 37,298 30,145 Total Assets 42,734 35,566 10
11 Liabilities Abstract (Consolidated) Rs. in lacs Particulars As on As on Long term Borrowings 5,333 4,297 Deferred Tax Liabilities Other Long term Liabilities 8 8 Long-term Provisions Total Non-Current Liabilities 5,425 4,380 Short-term Borrowings Trade Payables 8,594 7,156 Other Current Liabilities Advances from Customers 5,557 3,381 Others 5,380 4,506 Short-term Provisions Total Current Liabilities 20,427 16,034 11
12 Asset Abstract (Consolidated) Rs. in lacs Particulars As on As on Fixed Assets 1, Other Non-Current Assets 4,434 4,462 Total Non-Current Assets 5,436 5,421 Cash and Bank Balance Trade Receivables 4,978 3,848 Inventories 25,578 17,205 Short-term Loans and Advances 4,628 5,888 Other Current Assets 1,187 2,824 Total Current Assets 37,298 30,145 12
13 Profit and Loss Account Abstract (Consolidated) Particulars Q2FY17 Q1FY17 Q2FY16 FY16 H1FY17 H1FY16 Net Sales/Income from Operations % of Growth Q2FY17 Vs Q1 FY17 Q2 FY16 2,264 2, ,468 4,512 1,808 1% 190% Other Operating Income Other Income Total Revenue 2,270 2, ,652 4,521 1,861 1% 184% Operating Costs 1,024 1, , Employee Benefit Expenses , Other Costs Total Expenditure 1,596 1, ,984 3,090 1,437 EBITDA ,668 1, % 319% EBITDA % 30% 34% 21% 32% 32% 23% Rs. in lacs Continued 13
14 Profit and Loss Account Abstract (Consolidated) Particulars Q2FY17 Q1FY17 Q2FY16 FY16 H1FY17 H1FY16 Depreciation and Amortization Finance Cost % of Growth Q2FY17 Vs Q1 FY17 Q2 FY16 PBT (10) 2, % 3648% PBT % 15% 21% -1% 24% 18% 2% Provision for Tax , PAT before Minority Interest (36) 1, (14) Minority Interest (11) (7) (6) (38) (19) (6) PAT after Minority Interest (30) 1, (8) -25% 845% PAT % 10% 13% -4% 15% 12% 0% Rs. in lacs Note: Figures have been regrouped & reclassified, wherever necessary 14
15 Key Financial Parameters Particular Q2FY17 FY16 FY 15 EBITDA Margin 30% 32% 29% PAT Margin 10% 15% 12% ROCE 12% 19% 17% RONW/ROE 16% 25% 20% Debt/Equity 0.67:1 0.63: :1 15
16 26-Aug Sep Sep Sep Oct Oct Oct Nov Nov Nov Dec Dec Dec Jan Jan Jan Feb Feb Feb Mar Mar Mar Apr Apr Apr May May May Jun Jun Jun Jul Jul Jul Jul Aug Aug Aug Sep Sep Sep-16 Strategic Performance Financial Performance Project Performance Performance of Scrip (From Listing) Performance of Scrip (from Listing) BSE Sensex Index BSE Realty Index AIL Index Note : Closing levels of Sensex and Realty Index as on Aug 26, 2015 was 25, and 1, respectively, the same has been indexed to 100. For Arvind Infrastructure Limited, the Listed close price as on Aug 26, 2015 of Rs is indexed to
17 Shareholding Pattern (%) Others, 40.39% Promoter and Promoter Group, 47.37% Category 30-Sept Jun Mar-16 Promoter and Promoter Group Foreign Institutional Investors(FIIs) 47.37% 47.37% 47.37% 4.02% 5.57% 0.00% Mutual Funds 2.18% 0.50% 0.63% Insurance Companies 6.04% 6.04% 6.04% Insurance Companies, 6.04% Mutual Funds, 2.18% Foreign Institutional Investors(FIIs), 4.02% Others 40.39% 40.52% 45.96% No. of Shareholders as on 30th Sept, 2016: 137,376 17


18 Project Portfolio Completed Projects Ongoing Projects Upcoming Projects 18
19 Project till Date Synopsis Residential Projects Est. Area (sqft) Area Booked Till Date (sqft) Inventory as on Date (sqft) Booking Value till Date (Rs. Lac) Revenue Recognized till Date (Rs. Lac) Project Completion (%) Avg. Price (Rs./sqft) Alcove 1,032, ,734 55,926 2,288 2, Megatrade 80,914 67,502 13,412 2,740 2, ,059 Parishkaar/ Tradesquare* 915, ,809-25,423 25, ,776 Sporcia 492, , ,752 17,023 11, ,395 Uplands (Phase I) 4,179,816 1,910,169 2,269,647 25, ,330*** Citadel 101,859 89,336 12,523 4,968 4, ,561 Expansia 140, ,147 23,129 6,426 6, ,486 Megaestate (Phase I) Strategic Performance Financial Performance Project Performance 63,119 7,557 55, ,085 Beyond Five** 6,674, ,324 6,412,986 1, TOTAL 86,498 52,907 * The number pertains to entire project, out of which AIL is entitled for 41% ** Formal Launch in Oct-16 *** Uplands is a residential township project having significant revenue from land. Figures are weighted average of land plus construction realization. 19
20 Quarterly Synopsis Residential Projects Area Booked in Q2FY17 (sqft.) Units Booked in Q2FY17 (nos.) Sales Value for Q2FY17 (Rs. Lac) Amount Collected in Q2FY17 (Rs. Lac) Revenue Recognized in Q2FY17 (Rs. Lac) Sporcia 3, ,656 1,826 Uplands 21, ,128 - Citadel 8, Expansia 4, Megaestate - - (4) (14) - Beyond Five* - - (9) 2 - *Formal Launch in Oct -16 Notes :- 1. Apart from above projects, we have recognized revenue from Sanjaynagar Project for Rs. 179 lacs during the quarter. 2.Sanjaynagar is a slum rehabilitation project, against which we have received TDR/FSI and we have booked income of Rs. 179 lacs from the sale of TDR/FSI during the quarter. 20

21 Sporcia Location: Product: Project Size: Hebbal, Bengaluru High rise Residential Apartments 456 Apartments Deal Structure: Outright Purchase Architect: Features: RSP Design Indoor and Outdoor Sports Amenities Entertainment & Health facilities Landscaping Ample Parking Dual Plumbing System 24 Hrs Power Back-Up for common areas 21


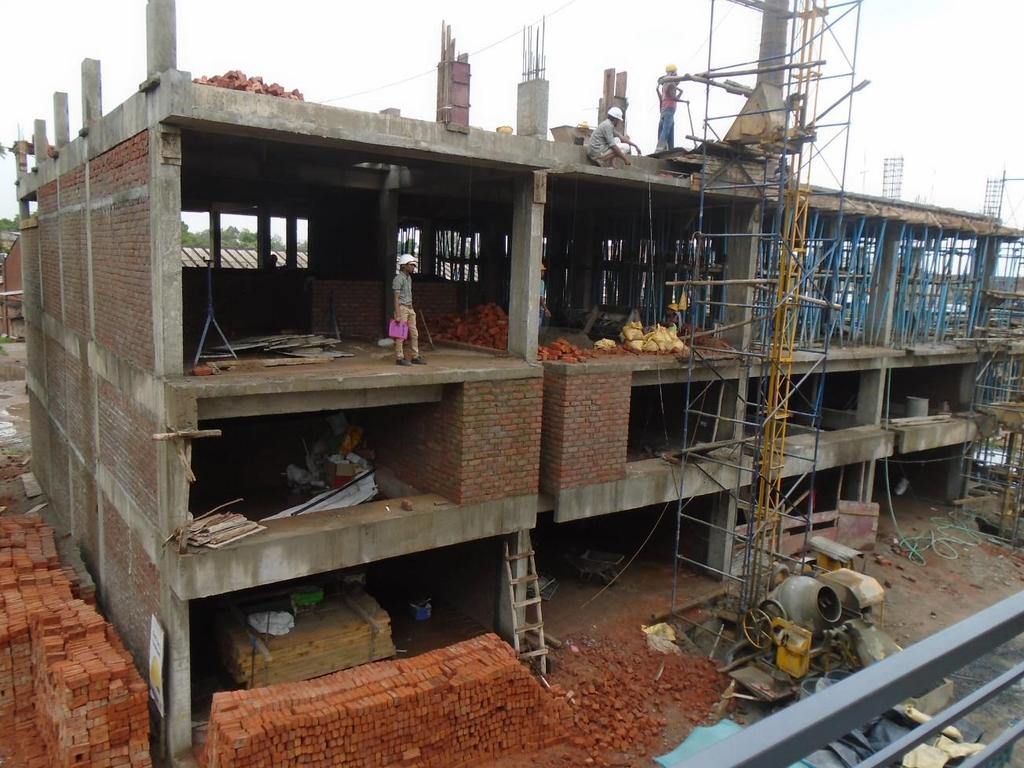
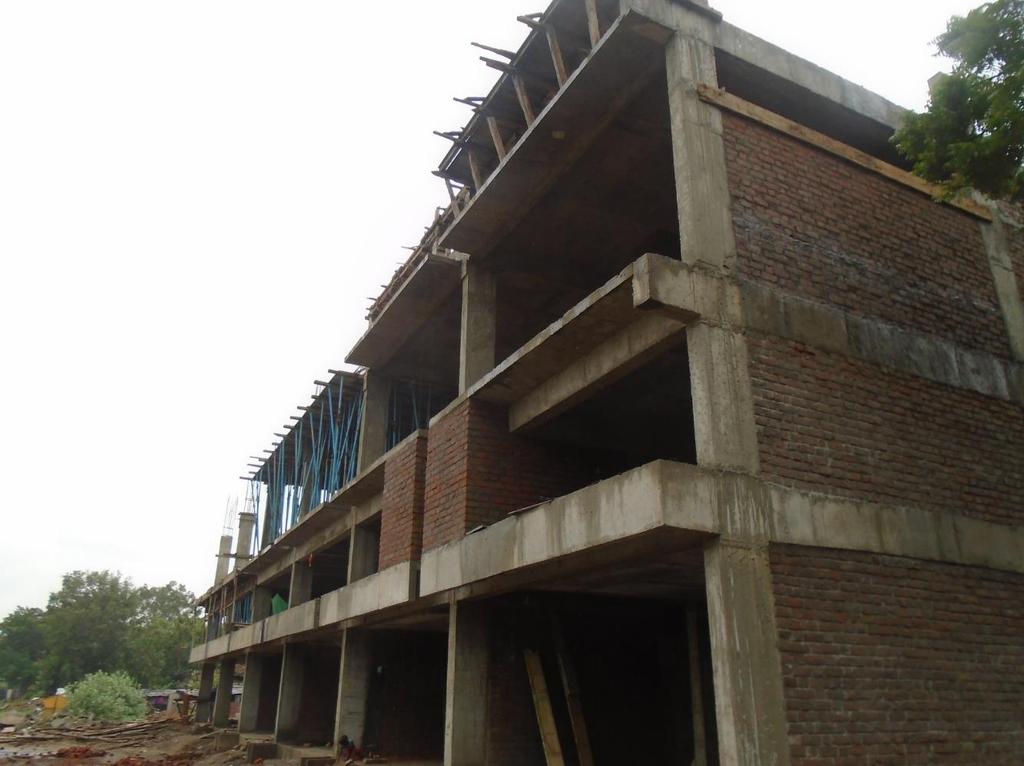
22 Sporcia Actual Site Images 22
 Premium Concierge Services Disney themed kids bedroom - Optional Personal Swimming Pool, Gym, Home Theatre - Optional")
23 Uplands Location: Product: Nasmed Village, Gandhi Nagar Premium golf based township Project Size: 282 Villas (Phase I) Deal Structure: Joint Development Architect: Woods Bagot Features: 9 Hole Executive Golf Course 3 Clubs (Golf Square, Zen Square, Fun Square) Premium Concierge Services Disney themed kids bedroom - Optional Personal Swimming Pool, Gym, Home Theatre - Optional 23


24 Uplands Rendered image Golf Course Construction 24


25 Uplands Zen Club 25


26 Uplands Actual Villa Construction 26

27 Citadel Location: Product: Project Size: C G Road, Ahmedabad 3&4 BHK Premium Apartments 58 units Deal Structure: Development Agreement Architect: Features: 99 Studio/E-Cube Lush Green Garden with Sitouts and Walkways Amphitheatre Children's Play Area 24X7 CC TV Surveillance Video Door Security System Ample Covered Parking 27


28 Citadel Actual Site Images 28

29 Expansia Location: Product: Project Size: Whitefield, Bengaluru Villas & Low rise Apartments 50 Units(22 Villas,28 Apartments) Deal Structure: Development Agreement Architect: Features: HOK, USA State of the art club house Swimming pool Fully furnished A/C Gymnasium Kids play area Open air Amphitheatre 29


30 Expansia Actual Site Images 30


31 Expansia Actual Site Images Night View 31

32 Megaestate Location: Product: Naroda Road, Ahmedabad Industrial Sheds Project Size: 30 Sheds (Phase I) Deal Structure: Development Agreement Architect: Features E-Cube State of the art design Contemporary external façade Contemporary landscape design Rain water harvesting Wide Entrance Ample Parking Space Drainage Facilities 32
33 Megaestate Actual Site Images 33

34 Beyond Five Location: Product: Project Size: Moti Devti, Sanand, Ahmedabad Weekend Homes - Plots 814 Units Deal Structure: Joint Development Architect: Woods Bagot Features 9 Hole Executive Golf Course Clubhouse powered by SMAAASH, which is perfected by Sachin Tendulkar Bowling Alley Golf Promenade Formal Launch in June-16 34


35 Beyond Five Villa side view Club house 35
36 Immediate Project Pipeline Arvind Skylands, Bengaluru Land Area: Acres Built Up Area: 4,20,000 Sq Ft Product Type: High rise Apartments Deal Structure: Outright Purchase Arvind Bengaluru 4, Bengaluru* Land Area: Built Up Area: Product Type: Deal Structure: * Term Sheet signed, other formalities pending 36
37 Thank You Arvind Infrastructure Ltd (CIN: U45201GJ2008PLC055771) Registered & Corporate Office: 24, Govt. Servant s Society, Adj. Municipal Market, C. G. Road, Ahmedabad Tel: Investor Relations: Mehul Shah Chief Financial Officer mehul.shah@arvind.in Prakash Makhwana Company Secretary prakash.makhwana@arvind.in Jagdish Dalal Investor Relations jagdish.dalal@arvind.in Disclaimer: The information in this presentation contains certain forward looking statements. These include statements regarding outlook on future development schedules, business plans and expectations of Capital expenditures. These statements are based on current expectations that involve a Number of risks and uncertainties which could cause actual results to differ from those anticipated by the Company. 37
38 Annexure Note Considering the nature of the business carried on by the Company whereby revenues do not necessarily accrue evenly over the projects period, the revenues of the quarter and/or the year may not be strictly comparable with the results of the corresponding quarter and/or the year. Total areas of the projects are calculated based on the carpet areas, the total areas of the projects have been given merely to make them comparable with other projects of other developers across the country. All areas / configurations of projects are based on present estimates and are subject to change based on regulatory requirements and / or management decisions. Abbreviations: EBITDA = Earnings before Interest, Tax, Depreciation and Amortisation nos. = Numbers PAT = Profit After Tax PBT = Profit Before Tax ROCE = Return on Capital Employed RONW = Return on Net Worth Rs. sqft. = Indian Rupees = Square Feet 38
Received approval for additional residential area of ~5.30 lakh sq.ft. in Three Sixty West (Oasis Realty)
") Key Developments Received approval for additional residential area of ~5.30 lakh sq.ft. in Three Sixty West (Oasis Realty) Commerz II 4 additional floors leased (~ 1 lakh sq.ft. GLA) Achieved annual gross
Key Developments Received approval for additional residential area of ~5.30 lakh sq.ft. in Three Sixty West (Oasis Realty) Commerz II 4 additional floors leased (~ 1 lakh sq.ft. GLA) Achieved annual gross
Mr. Vikas Oberoi honoured as best successor Second Generation at Hindustan Times Real Estate Awards
 Key Developments Achieved highest ever top line in any financial year Commenced bookings for the fifth tower at Sky City, Borivali Crossed 1,000 units of bookings in Sky City Awards Mr. Vikas Oberoi honoured
PROPINSIGHT A Detailed Property Analysis Report
 PROPINSIGHT A Detailed Property Analysis Report 40,000+ Projects 10,000+ Builders 1,200+ Localities Report Created On - 7 Oct, 2015 Price Insight This section aims to show the detailed price of a project
Company Overview. Financial Performance
 Dec-14 Jan-15 Feb-15 Mar-15 Apr-15 May-15 Jun-15 Jul-15 Aug-15 Sep-15 Oct-15 Nov-15 Nimbus Projects Limited CMP: 34. December 4, 15 Stock Details BSE code 511714 BSE ID NIMBSPROJ Face value ( ) 1 No of
Ansal Properties & Infrastructure Ltd. Investors Update Q2 FY 14 November 14 th, 2013
 Ansal Properties & Infrastructure Ltd. Investors Update Q2 FY 14 November 14 th, 2013 Synopsis Operational Metrics 4.56 Particulars UOM H1FY14 H1FY13 FY13 Area Sold mn.sq.ft. 8.05 8.66 20.37 Sale Value
XML Publisher Balance Sheet Vision Operations (USA) Feb-02
 Feb-02") Page:1 Apr-01 May-01 Jun-01 Jul-01 ASSETS Current Assets Cash and Short Term Investments 15,862,304 51,998,607 9,198,226 Accounts Receivable - Net of Allowance 2,560,786
Page:1 Apr-01 May-01 Jun-01 Jul-01 ASSETS Current Assets Cash and Short Term Investments 15,862,304 51,998,607 9,198,226 Accounts Receivable - Net of Allowance 2,560,786
Visaka Industries Ltd
 Company Update Superior Product Mix & New Age Markets to Aid Growth New investments to aid growth: Visaka continues to give a good set of numbers. YoY EPS grew at 142% aided by a revenue growth of 1.5%
Amber Enterprises India Ltd
 3QFY2019 Result Update Consumer Durable February 16, 2019 Amber Enterprises India Ltd Performance Update (` cr) 3QFY19 3QFY18 % yoy 2QFY19 % qoq Revenue 388.8 338.4 14.9 226.3 71.8 EBITDA 22.1 24.1 (8.2)
Results Presentation FY 2017
 Results Presentation FY 2017 Company overview Trusted Brand Strong existing clientele Focus on 3 cities Mumbai, Pune and Bengaluru Fully Paid-for land Focus on Execution 20 Years Of track record of real
Results Presentation FY 2016
 Results Presentation FY 2016 Company overview Trusted Brand Strong existing clientele Focus on 3 cities Mumbai, Pune and Bangaluru Fully Paid-for land Focus on Execution 18 Years Of track record of real
CCL Products BUY. Brewing Steadily. CMP Target Price `300 `360. Initiating Coverage Coffee. January 4, year price chart
 5-Jan 5-Apr 5-Jul 5-Oct 5-Jan 5-Apr 5-Jul 5-Oct 5-Jan 5-Apr 5-Jul 5-Oct CCL Products Brewing Steadily CCL Products Limited (CCL) is the largest Indian manufacturer and exporter of instant coffee. With
Fineotex Chemical Ltd
 Company Update Decent Performance under Macroeconomic Pressure; Business Traction to Continue: Fineotex Chemical recorded decent set of result as consolidated sales grew by 1.1% YoY (largely in line) to
Cummins India Ltd Bloomberg Code: KKC IN
 Company Update Margins Under Pressure; Domestic Recovery Underway Half-yearly revenue was flat; margins were under pressure: Cummins India revenue, EBITDA and PAT for H1FY17 reached to Rs.24,784mn, Rs.4,649mn
Garware Wall Ropes ACCUMULATE. Performance Highlights CMP. `550 Target Price `618. 2QFY2017 Result Update Textile. Investment Period 12 months
 2QFY217 Result Update Textile November 16, 216 Garware Wall Ropes Performance Highlights Quarterly Data (`cr) 2QFY17 2QFY16 % yoy 1QFY17 % qoq Revenue 232 214 8.5 225 3.3 EBITDA 4 26 5.9 31 29.4 Margin
Blue Star Ltd BUY. Performance Update. CMP Target Price `703 `867. 1QFY2019 Result Update Cons. Durable. 3-year price chart.
 Aug-15 Oct-15 Dec-15 Feb-16 Apr-16 Jun-16 Aug-16 Oct-16 Dec-16 Jan-17 Apr-17 May-17 Jul-17 Sep-17 Nov-17 Jan-18 Mar-18 May-18 Jul-18 1QFY2019 Result Update Cons. Durable August 10, 2018 Blue Star Ltd Performance
Religare Investment Call
 v-17 Dec-17 Jan-18 Feb-18 Mar-18 Apr-18 May-18 Jun-18 Jul-18 Aug-18 Sep-18 Oct-18 v-18 Q2FY19 Result Update Q2FY19 Result Update BUY CMP (Rs) 5,813 Target Price (Rs) 6,519 Potential Upside 12.1% Sensex
Religare Investment Call
 Q3FY18 Result Update Consumer Durables Symphony Ltd. BUY CMP (Rs) Target Price (Rs) Potential Upside Sensex Nifty Key Stock data BSE Code NSE Code Bloomberg Shares o/s, Cr (FV 2) Market Cap (Rs Cr) 3M
SQS India BFSI Ltd HOLD. Impact of Macro Headwinds Still Hurting; Revenue from US May Pick up in FY18E
 Company Update Impact of Macro Headwinds Still Hurting; Revenue from US May Pick up in FY18E EBITDA Margins recovered by 618 bps QoQ: The company has witnessed many challenges over the year FY17 starting
Inox Wind BUY. Performance Highlights. CMP Target Price `242 `286. 4QFY2016 Result Update Capital Goods. 3 year price chart
 4QFY216 Result Update Capital Goods May 11, 216 Inox Wind Performance Highlights Quarterly Data (Consolidated) ( ` cr) 4QFY16 4QFY15 % chg (yoy) 3QFY16 % chg (qoq) Total Income 1,829 93 96.6 941 94.2 EBITDA
Rallis India SELL. Performance Highlights. `231 Target Price 189 CMP. 2QFY2018 Result Update Agrichemical. Investment Period 12 months
 Jan-12 Jun-12 Nov-12 Apr-13 Sep-13 Feb-14 Jul-14 Dec-14 May-15 Oct-15 Mar-16 Aug-16 Jan-17 Jun-17 Nov-17 2QFY2018 Result Update Agrichemical November 21, 2017 Rallis India Performance Highlights Y/E March
Investor Update. For the year and quarter ending 31 st March,
 Investor Update For the year and quarter ending 31 st March, 2015 BSE: 523716 NSE: ASHIANA Bloomberg: ASFI:IN Reuters: AHFN.NS www.ashianahousing.com 2014, Ashiana Housing Limited. All Rights Reserved.
Religare Investment Call
 BUY CMP (Rs) Target Price (Rs) Potential Upside Sensex Nifty 378 430 13.7% 31,159 9,625 Future looks promising Wonderla Holidays Ltd's Q4FY17 result was a mixed bag as the company reported healthy growth
AVANTI FEEDS LIMITED-Schedule of Audio Conference Call for Investors on * * *
 1Avanti a 1 Feeds Limited Aiding Sustainability & Reliability to Aquaculture Ref: AFL/BSE & NSE/2018-19/ 16 1 h November, 2018 The Deputy General Manager BSE, Limited Corporate Relation Department 1st
Bharat Forge. Result Update. Q4FY13 Result Highlights. Valuation. No Respite in Sight May 29, Institutional Research 1
 [ Result Update Equity India Forging & Industrials Bharat Forge Ltd. No Respite in Sight May 29, 2013 CMP (`) Target (`) 241 238 Potential Upside Absolute Rating (1.24)% HOLD Market Info (as on May 28,
Greenply Industries BUY. The plywood maker for growing India. Target Price. Initiating Coverage Plywood. 3-year price chart.
 Initiating Coverage Plywood March 03, 2018 Greenply Industries The plywood maker for growing India Greenply Industries Ltd (GIL) manufactures plywood & allied products and medium density fibreboards (MDF).
Company Overview. Financial Performance
 Jan-15 Feb-15 Mar-15 Apr-15 May-15 Jun-15 Jul-15 Aug-15 Sep-15 Oct-15 Nov-15 Dec-15 Anisha Impex Ltd CMP: 11.85 December 31, 2015 Stock Details BSE code 537785 BSE ID Face value ( ) 10 No of shares (m)
Pantaloon Retail India
 Sequential moderation in SSS growth May 16, 211 Gautam Duggad gautamduggad@plindia.com +91 22 66322233 Rating BUY Price Rs241 Target Price Rs332 Implied Upside 37.8% Sensex 18,531 (Prices as on May 13,
GAIL India NEUTRAL. Performance Highlights CMP. `363 Target Price - 2QFY2013 Result Update Oil & Gas. Investment Period -
 2QFY2013 Result Update Oil & Gas October 26, 2012 GAIL India Performance Highlights Quarterly highlights (Standalone) Y/E March (` cr) 2QFY2013 2QFY2012 % chg (yoy) 1QFY2013 % chg (qoq) Net sales 11,361
CMP: INR1,327 TP: INR1,607(+21%) Buy
 Buy") 24 May 217 4QFY17 Results Update Sector: Technology Tata Elxsi BSE SENSEX S&P CNX 3,32 9,361 Bloomberg TELX IN Equity Shares (m) 31 M.Cap.(INRb)/(USDb) 45.8 /.7 52-Week Range (INR) 1863 / 122 1, 6, 12
24 May 217 4QFY17 Results Update Sector: Technology Tata Elxsi BSE SENSEX S&P CNX 3,32 9,361 Bloomberg TELX IN Equity Shares (m) 31 M.Cap.(INRb)/(USDb) 45.8 /.7 52-Week Range (INR) 1863 / 122 1, 6, 12
Bloomberg Code: ATA IN
 Auto OEM: 3-Wheelers Atul Feb Auto 03, 2015 Ltd India Research Stock Broking Bloomberg Code: ATA IN Stable quarter led by surge in exports volumes (TP revised ) : Operating revenue, EBITDA and PAT grew
THE PHOENIX MILLS LIMITED. Quarterly Earnings Update, Q3-FY2012 January 23, 2012
 THE PHOENIX MILLS LIMITED Quarterly Earnings Update, Q3-FY2012 January 23, 2012 Table of contents Section Slide No. About The Phoenix Mills Limited 3 Group Highlights 4 Financial Update 5 Highlights during
Financial & Business Highlights For the Year Ended June 30, 2017
 Financial & Business Highlights For the Year Ended June, 17 17 16 15 14 13 12 Profit and Loss Account Operating Revenue 858 590 648 415 172 174 Investment gains net 5 162 909 825 322 516 Other 262 146
Brigade Enterprises. Recovery in Sight. Business segment Real Estate Lease rental Hospitality segment
 B Brigade Enterprises Recovery in Sight Key Market Indicators (Consolidated) Latest Date 05-Dec-2017 Latest Price (Rs) 296.20 Previous Close (Rs) 298.45 1 Day Price Var% -0.75 1 Year Price Var% 93.59 52
EQUI-GRADE Analytical Power for Investment Decision
 Nov-12 Dec-12 Jan-13 Feb-13 Mar-13 Apr-13 May-13 Jun-13 Jul-13 Aug-13 Sep-13 Oct-13 EQUI-GRADE Analytical Power for Investment Decision Iron & Steel and Lighting Products November 28, 2013 Good Fundamentals,
Ahluwalia Contracts (India)
") May-14 Jul-14 Aug-14 Sep-14 Oct-14 Dec-14 Jan-15 Feb-15 Apr-15 May-15 India Research Infrastructure May 22, 215 QUARTERLY REVIEW Bloomberg: AHLU IN Reuters: AHLU.BO BUY Better performance ahead ACIL posted
May-14 Jul-14 Aug-14 Sep-14 Oct-14 Dec-14 Jan-15 Feb-15 Apr-15 May-15 India Research Infrastructure May 22, 215 QUARTERLY REVIEW Bloomberg: AHLU IN Reuters: AHLU.BO BUY Better performance ahead ACIL posted
Maruti Suzuki (RHS) BUY. Operationally In Line; Reiterate Buy. Automobiles October 31, 2014 RESULT REVIEW. Outlook & Valuation.
 BUY. Operationally In Line; Reiterate Buy. Automobiles October 31, 2014 RESULT REVIEW. Outlook & Valuation.") Oct13 Dec13 Jan14 Feb14 Apr14 May14 Jun14 Aug14 Sep14 Oct14 India Research Automobiles RESULT REVIEW Bloomberg: MSIL IN Reuters: MRTI.BO BUY Operationally In Line; Reiterate Buy India s (MSIL) Revenue/EBIDTA/PAT
Oct13 Dec13 Jan14 Feb14 Apr14 May14 Jun14 Aug14 Sep14 Oct14 India Research Automobiles RESULT REVIEW Bloomberg: MSIL IN Reuters: MRTI.BO BUY Operationally In Line; Reiterate Buy India s (MSIL) Revenue/EBIDTA/PAT
Near-term pressure, but long-term outlook positive
 INDUSTRY IT CMP (as on 2 Nov 2015) Rs 1,812 Target Price Rs 2,050 Nifty 8,051 Sensex 26,559 KEY STOCK DATA Bloomberg ECLX IN No. of Shares (mn) 30 MCap (Rs bn) / ($ mn) 55/843 6m avg traded value (Rs mn)
NTPC Ltd. Results in line with estimates, BUY for attractive valuations. Power. EBITDA margins up at 26% (+700bps QoQ): EBITDA margins
: EBITDA margins") Apr-11 May-11 Jun-11 Jul-11 Aug-11 Sep-11 Oct-11 Nov-11 Dec-11 Jan-12 Feb-12 Mar-12 Apr-12 May-12 NTPC Ltd 11 May 2012 105 Power Result Review Rating: BUY Current Price: Rs 148 Target Price: Rs 189 Upside:
Apr-11 May-11 Jun-11 Jul-11 Aug-11 Sep-11 Oct-11 Nov-11 Dec-11 Jan-12 Feb-12 Mar-12 Apr-12 May-12 NTPC Ltd 11 May 2012 105 Power Result Review Rating: BUY Current Price: Rs 148 Target Price: Rs 189 Upside:
BUY. KDDL LTD Result Update (PARENT BASIS): Q1 FY16 SYNOPSIS. CMP Target Price AUGUST 22 nd 2015 ISIN: INE291D01011
: Q1 FY16 SYNOPSIS. CMP Target Price AUGUST 22 nd 2015 ISIN: INE291D01011") BUY CMP 280.10 Target Price 322.00 KDDL LTD Result Update (PARENT BASIS): Q1 FY16 AUGUST 22 nd 2015 ISIN: INE291D01011 Index Details Stock Data Sector Other Apparels & Accessories BSE Code 532054 Face
BUY CMP 280.10 Target Price 322.00 KDDL LTD Result Update (PARENT BASIS): Q1 FY16 AUGUST 22 nd 2015 ISIN: INE291D01011 Index Details Stock Data Sector Other Apparels & Accessories BSE Code 532054 Face
THE B E A CH TO WN S O F P ALM B EA CH
 THE B E A CH TO WN S O F P ALM B EA CH C OU N T Y F LO R I D A August www.luxuryhomemarketing.com PALM BEACH TOWNS SINGLE-FAMILY HOMES LUXURY INVENTORY VS. SALES JULY Sales Luxury Benchmark Price : 7,
Bata India BUY. Performance Update. CMP `1,008 Target Price `1,243. 2QFY2019 Result Update Footwear. Historical share price chart.
 Nov-15 Jan-16 Apr-16 Jul-16 Oct-16 Jan-17 Apr-17 Jul-17 Oct-17 Jan-18 Apr-18 Jul-18 Oct-18 2QFY2019 Result Update Footwear November 3, 2018 Bata India Performance Update Y/E March (` cr) 2QFY19 2QFY18
Brigade Group Investor Presentation Q4 FY (CIN: L85110KA1995PLC019126) 1
 1") Brigade Group Investor Presentation Q4 FY 2015 16 (CIN: L85110KA1995PLC019126) 1 Consolidated Financial Highlights FY 2015 16: Revenue of Rs. 16,997 Mn 28% increase over previous year PBT of Rs. 2,309
Brigade Group Investor Presentation Q4 FY 2015 16 (CIN: L85110KA1995PLC019126) 1 Consolidated Financial Highlights FY 2015 16: Revenue of Rs. 16,997 Mn 28% increase over previous year PBT of Rs. 2,309
S R K Industries Ltd. BSE Scrip Code:
 S R K Industries Ltd. BSE Scrip Code: 531307 Textiles March 15, 2013 Equity Statistics Current Market Price Rs. 28.4 52 Week High/Low Rs. 32.65/2.90 Market Capitalisation Rs. Crores 10.71 Free Float Rs.
Company Overview. Financial Performance
 Jan/15 Feb/15 Mar/ Apr/15 May/ Jun/15 Jul/15 Aug/15 Sep/15 Oct/15 Nov/ Dec/15 Parnax Lab Limited CMP: 53.90 January 08, 2016 Stock Details BSE code 506128 BSE ID PARNAXLAB Face value ( ) 10 No of shares
Inox Wind BUY. Performance Highlights. CMP Target Price `390 `505. 2QFY2016 Result Update Capital Goods. 3 year price chart
 2QFY2016 Result Update Capital Goods October 27, 2015 Inox Wind Performance Highlights Quarterly Data (Consolidated) ( ` cr) 2QFY16 2QFY15 % chg (yoy) 1QFY16 % chg (qoq) Revenues 1,008 543 85.6 636 58.6
Mahindra & Mahindra Ltd.
 Nov-15 Jan-16 Apr-16 Jul-16 Oct-16 Jan-17 Apr-17 Jul-17 Oct-17 Jan-18 Apr-18 Jul-18 Oct-18 2QFY2019 Result Update Automobile November 15, 2018 Mahindra & Mahindra Ltd. Performance Update Y/E March (` cr)
Consolidated Sales (Cr) Growth EBITDA (Cr) Margin PAT Margin EPS (Rs) P/E RoE
 Growth EBITDA (Cr) Margin PAT Margin EPS (Rs) P/E RoE") Aug-17 Sep-17 Oct-17 Nov-17 Dec-17 Jan-18 Feb-18 Mar-18 Apr-18 May-18 Jun-18 Jul-18 Aug-18 2904 Recommendation CMP Target Price BUY Rs. 312 Rs. 443 Better times ahead! reported a good set of numbers in
Aug-17 Sep-17 Oct-17 Nov-17 Dec-17 Jan-18 Feb-18 Mar-18 Apr-18 May-18 Jun-18 Jul-18 Aug-18 2904 Recommendation CMP Target Price BUY Rs. 312 Rs. 443 Better times ahead! reported a good set of numbers in
MRF BUY. Performance Highlights. CMP `9,407 Target Price `11,343. Company Update Automobile. Key financials
 Company Update Automobile February 22, 212 MRF Performance Highlights Y/E Sept. (` cr) 1QSY12 1QSY11 % chg (yoy) 4QSY11 % chg (qoq) Net sales 2,875 2,167 32.7 2,62 9.8 EBITDA 258 243 5.9 181 42.6 EBITDA
Nirlon Ltd BSE Scrip Code:
 Nirlon Ltd BSE Scrip Code: 500307 Misc. Commercial Services September 14, 2012 Equity Statistics Current Market Price Rs. 44.5 52 Week High / Low Rs. 61.75/30.50 Market Capitalisation Rs. crores 319.7
HCC BUY. Infrastructure April 10, QIP step in the right direction EVENT UPDATE. India Research. Bloomberg: HCC IN Reuters: HCNS.
 Jan-14 Mar-14 Apr-14 May-14 Jul-14 Aug-14 Sep-14 Nov-14 Dec-14 Jan-15 India Research Infrastructure April 10, 2015 EVENT UPDATE Bloomberg: IN Reuters: HCNS.BO BUY QIP step in the right direction has successfully
BHEL SELL RESULTS REVIEW 1QFY15 13 AUG CMP (as on 12 Aug 2014) Rs 224 Target Price Rs 188
 Rs 224 Target Price Rs 188") RESULTS REVIEW 1QFY15 13 AUG 2014 BHEL SELL INDUSTRY CAPITAL GOODS CMP (as on 12 Aug 2014) Rs 224 Target Price Rs 188 Nifty 7,727 Sensex 25,881 KEY STOCK DATA Bloomberg/Reuters BHEL IN/BHEL.BO No. of Shares
RESULTS REVIEW 1QFY15 13 AUG 2014 BHEL SELL INDUSTRY CAPITAL GOODS CMP (as on 12 Aug 2014) Rs 224 Target Price Rs 188 Nifty 7,727 Sensex 25,881 KEY STOCK DATA Bloomberg/Reuters BHEL IN/BHEL.BO No. of Shares
Gillette India. Institutional Equities. 2QFY19 Result Update BUY. Marketing Investments Mask Improved Top-line Performance
 2QFY19 Result Update Gillette India 13 February 2019 Reuters: GILE.NS; Bloomberg: GILL IN Marketing Investments Mask Improved Top-line Performance Gillette India s (GILL) 2QFY19 operating and net earnings
Religare Investment Call
 Q3FY18 Result Update Auto Ancillary BUY CMP (Rs) Target Price (Rs) Potential Upside Sensex Nifty Key Stock data BSE Code NSE Code Bloomberg Shares o/s, Cr (FV 10) Market Cap (Rs Cr) 3M Avg Volume 52 week
Still on track. Exhibit 1: ICT is on track for FY09E
 Country: India Sector: Indian Education Diviya Nagarajan Diviya.Nagarajan@jmfinancial.in Tel: (91 22) 6630 3066 Subhashini Gurumurthy Subhashini.Gurumurthy@jmfinancial.in Tel: (91 22) 6630 3069 Price:
Religare Investment Call
 v-17 v-17 Dec-17 Jan-18 Jan-18 Feb-18 Mar-18 Mar-18 Apr-18 May-18 May-18 Jun-18 Jul-18 Aug-18 Aug-18 Sep-18 Oct-18 Oct-18 Q2FY19 Result Update Q2FY19 Result Update BUY CMP (Rs) 282 Target Price (Rs) 321
INOX WIND LIMITED Q2FY18 INVESTOR UPDATE
 INOX WIND LIMITED Q2FY18 INVESTOR UPDATE DISCLAIMER This presentation and the following discussion may contain forward looking statements by Inox Wind Limited ( IWL or the Company ) that are not historical
Company Overview. Financial Performance
 Jan-15 Feb-15 Mar-15 Apr-15 May-15 Jun-15 Jul-15 Aug-15 Sep-15 Oct-15 Nov-15 Dec-15 Jan-16 Shri Jagdamba Polymers Ltd. CMP: 44.2 January 15, 216 Stock Details BSE code 512453 BSE ID SHRJAGP Face value
Trident Ltd. Buy & Add on dips
 Trident Ltd. Buy & Add on dips 33,351.8 38,689.6 37,553.3 36,656.6 46,944.2 18-Apr-17 18-May-17 18-Jun-17 18-Jul-17 18-Aug-17 18-Sep-17 18-Oct-17 18-Nov-17 18-Dec-17 18-Jan-18 18-Feb-18 18-Mar-18 Trident
@5}; i i,, DeeffiflE anga Comp ny Secretary. 07thAugust, 2018
 Earnings IWL: N01: 37: 2018 07thAugust, 2018 The Secretary The Secretary BSE Limited National Stock Exchange of India Limited Phiroze Jeej eebhoy Towers Exchange Plaza, Bandra Kurla Complex Dalal Street,
PEER GROUPS CMP MARKET CAP EPS P/E (X) P/BV(X) DIVIDEND Company Name (Rs.) Rs. in mn. (Rs.) Ratio Ratio (%)
 P/BV(X) DIVIDEND Company Name (Rs.) Rs. in mn. (Rs.) Ratio Ratio (%)") BUY CMP 2125.00 Target Price 2330.00 CERA SANITARYWARE LTD Result Update (PARENT BASIS): Q1 FY16 JULY 15 th 2015 ISIN: INE739E01017 Index Details Stock Data Sector Furniture & Furnishing BSE Code 532443
BUY CMP 2125.00 Target Price 2330.00 CERA SANITARYWARE LTD Result Update (PARENT BASIS): Q1 FY16 JULY 15 th 2015 ISIN: INE739E01017 Index Details Stock Data Sector Furniture & Furnishing BSE Code 532443
(Rs. in Lacs) Statement of Unaudited Standalone Financial Results for the Quarter Ended on June 30, 2017 Quarter Ended Sr.
 Statement of Unaudited Standalone Financial Results for the Quarter Ended on June 30, 2017 Quarter Ended Sr.") (Rs. in Lacs) Statement of Unaudited Standalone Financial Results for the on June 30, 2017 1 Income a. Revenue from operations 12,975 15,260 b. Other Income 1,265 535 Total Revenue 14,240 15,795 2 Expenses
(Rs. in Lacs) Statement of Unaudited Standalone Financial Results for the on June 30, 2017 1 Income a. Revenue from operations 12,975 15,260 b. Other Income 1,265 535 Total Revenue 14,240 15,795 2 Expenses
Quick take. Ruchira Papers Ltd. BUY. Creating value through paper. Target Price. Investment Period 12 Months. 3 year daily price chart.
 Ltd. Creating value through paper Limited (RPL) manufactures writing paper, printing paper and Kraft paper. The company's white writing and printing paper is used in making notebooks and writing material,
INVEST. Unitech Ltd. highly speculative which indicates a significantly higher credit risk. October 24, 2009
 October 24, 2009 Unitech Ltd. Analyst: Preeti Gupta preetig@bajajcapital.com Reviewed By: Alok Agarwala aloka@bajajcapital.com Industry Chairman Construction Ramesh Chandra Inc.Year 1971 Net Reserves (Rs.cr)
ITC. Rating: Target price: EPS: Relative better visibility despite the smoke, Maintain BUY CMP. Target. Rating. Rs.389. Buy. Rs.
 : price: EPS: Relative better visibility despite the smoke, Maintain BUY ITC reported revenues of Rs.~87.2bn (+13% y-o-y), operating profits of Rs.32.8bn (+15% y-o-y) and PAT of Rs.~23.8bn (+16% y-o-y).
Mahindra & Mahindra Ltd.
 May-15 Aug-15 Nov-15 Feb-16 May-16 Aug-16 Nov-16 Feb-17 May-17 Aug-17 Nov-17 Feb-18 4QFY2018 Result Update Automobile May 30, 2018 Mahindra & Mahindra Ltd. Performance Update Y/E March (` cr) 4QFY18 4QFY17
Anant Raj Ltd. Stock Data. Stock Performance (%) Shareholding Pattern (%) Company Update Real Estate India Research. NVS Wealth Managers
 Shareholding Pattern (%) Company Update Real Estate India Research. NVS Wealth Managers") Company Update Real Estate India Research NVS Wealth Managers Anant Raj Ltd. CMP: 43 Nifty 8588 Sensex 28298 Nifty PE 22.6 Sensex PE 23.7 Stock Data Sector Real Estate BSE Code 515055 NSE Code ARCP IS
Company Update Real Estate India Research NVS Wealth Managers Anant Raj Ltd. CMP: 43 Nifty 8588 Sensex 28298 Nifty PE 22.6 Sensex PE 23.7 Stock Data Sector Real Estate BSE Code 515055 NSE Code ARCP IS
Company Overview. Industry Overview. Financial Performance
 Feb/15 Mar/15 Apr/15 May/15 Jun/15 Jul/15 Aug/15 Sep/15 Oct/15 Nov/15 Dec/15 Jan/16 Trade Wings Limited CMP: 105.00 January 29, 2016 Stock Details BSE code 509953 BSE ID TRADWIN Face value ( ) 10 No of
Company Overview. Financial Performance
 Apr/15 May/15 Jun/15 Jul/15 Aug/15 Sep/15 Oct/15 Nov/15 Dec/15 Jan/16 Feb/16 Mar/16 Monarch Networth Capital Limited CMP: 26.00 March 23, 2016 Stock Details BSE code 511551 BSE ID MONARCH Face value (
Goodyear India ACCUMULATE. Performance Highlights. CMP Target Price `326 `374. 1QCY2012 Result Update Tyres. Key financials
 1QCY212 Result Update Tyres June 6, 212 Goodyear India Performance Highlights Y/E December (` cr) 1QCY212 1QCY211 % chg (yoy) 4QCY211 % chg (qoq) Net sales 331 336 (1.6) 395 (16.2) EBITDA 2 24 (18.6) 34
NIIT Technologies Ltd. (NIIT Tech)
") Result Update October 17, 2012 NIIT Technologies Ltd. (NIIT Tech) In-line Performance; Forex loss haunted net margin: Maintain Buy CMP : Rs.286 Reco : BUY Target : Rs.345 STOCK INFO BSE 532541 NSE NIITTECH
Result Update October 17, 2012 NIIT Technologies Ltd. (NIIT Tech) In-line Performance; Forex loss haunted net margin: Maintain Buy CMP : Rs.286 Reco : BUY Target : Rs.345 STOCK INFO BSE 532541 NSE NIITTECH
Company Overview. Financial Performance
 Feb/15 Mar/15 Apr/15 May/15 Jun/15 Jul/15 Aug/15 Sep/15 Oct/15 Nov/15 Dec/15 Jan/16 CMP: 32.30 February 11, 2016 Stock Details BSE code 526558 BSE ID JAMEHOT Face value ( ) 10 No of shares (m) 8.0 52 week
CCL Products BUY. Performance Update. CMP Target Price `278 `360. 3QFY2018 Result Update Coffee. Historical share price chart.
 Feb-15 May-15 Aug-15 Oct-15 Jan-16 Apr-16 Jul-16 Oct-16 Jan-17 Apr-17 Jul-17 Oct-17 Jan-18 3QFY2018 Result Update Coffee February 5, 2018 CCL Products Performance Update Y/E March (` cr) Q3FY18 Q3FY17
(Rs. in Lacs) Statement of Standalone Unaudited Financial Results for the Quarter and Half Year ended September 30, 2017 Quarter Ended
 Statement of Standalone Unaudited Financial Results for the Quarter and Half Year ended September 30, 2017 Quarter Ended") Statement of Standalone Unaudited Financial Results for the Quarter and September 30, 2017 1 Income 18,425 15,044 12,975 a. Revenue from operations 31,400 30,304 1,043 929 1,265 b. Other Income 2,308 1,464
Statement of Standalone Unaudited Financial Results for the Quarter and September 30, 2017 1 Income 18,425 15,044 12,975 a. Revenue from operations 31,400 30,304 1,043 929 1,265 b. Other Income 2,308 1,464
Omaxe Ltd. Q2FY12 Result Update. Enhancing investment decisions. CRISIL Limited. All Rights Reserved.
 Q2FY12 Result Update Enhancing investment decisions CRISIL Limited. All Rights Reserved. Explanation of CRISIL Fundamental and Valuation (CFV) matrix The CFV Matrix (CRISIL Fundamental and Valuation Matrix)
Asian Granito BUY. Performance Highlights CMP. `270 Target Price `351. Outlook and valuation. 3QFY2017 Result Update Ceramics
 3QFY2017 Result Update Ceramics January 25, 2017 Asian Granito Performance Highlights Quarterly Data (` cr) 3QFY17 3QFY16 % yoy 2QFY17 % qoq Revenue 247 236 4.3 265 (7.1) EBITDA 34 27 25.3 31 7.2 Margin
TVS Motors. Source: Company Data; PL Research
 Margins trajectory looking up ; Accumulate November 01, 2017 Saksham Kaushal sakshamkaushal@plindia.com +91 22 66322235 Poorvi Banka poorvibanka@plindia.com +91 22 66322426 Rating Accumulate Price Rs709
Music Broadcast BUY. Performance Update. CMP Target Price `329 `475. 2QFY2019 Result Update Media. Historical share price chart.
 Mar-17 May-17 Jul-17 Sep-17 Nov-17 Jan-18 Mar-18 May-18 Jul-18 Sep-18 2QFY2019 Result Update Media November 3, 2018 Music Broadcast Performance Update Y/E March (` cr) 2QFY19 2QFY18 % yoy 1QFY19 % qoq
PBT Crosses Milestone of Rs. 2 Billion
 BUSINESS UPDATE PBT Crosses Milestone of Rs. 2 Billion Op. EBITDA margin at 23.1%, Adj. Op. EBITDA Margin at 24.7% Net Debt / Op. EBITDA at 1.75x Christy sales growth at 35% YoY Mumbai, Jan 31, 2017: Welspun
Company Overview. Industry Overview. Financial Performance
 Jan/15 Feb/15 Mar/15 Apr/15 May/15 Jun/15 Jul/15 Aug/15 Sep/15 Oct/15 Nov/15 Dec/15 CMP: 27.80 January 20, 2016 Stock Details BSE code 534623 BSE ID JUPITERIN Face value ( ) 10 No of shares (m) 10 52 week
Maruti Suzuki India BUY. Performance Update. CMP `6,705 Target Price `8,552. 2QFY2019 Result Update Automobile. Historical share price chart
 Oct-15 Jan-16 Apr-16 Jul-16 Oct-16 Jan-17 Apr-17 Jul-17 Oct-17 Jan-18 Apr-18 Jul-18 Oct-18 2QFY2019 Result Update Automobile November 3, 2018 Maruti Suzuki India Performance Update Y/E March (` cr) 2QFY19
Bata India BUY. Performance Update. CMP Target Price `842. 1QFY2019 Result Update Footwear. Historical share price chart.
 Jul-15 Oct-15 Jan-16 Apr-16 Jul-16 Oct-16 Jan-17 Apr-17 Jul-17 Oct-17 Jan-18 Apr-18 Jul-18 1QFY2019 Result Update Footwear July 23, 2018 Bata India Performance Update Y/E March (` cr) 1QFY19 1QFY18 % yoy
Religare Investment Call
 Oct-17 v-17 Dec-17 Jan-18 Feb-18 Mar-18 Apr-18 May-18 Jun-18 Jul-18 Aug-18 Sep-18 Oct-18 BUY CMP (Rs) 190 Target Price (Rs) 247 Potential Upside 29.7% Sensex 33,349 Nifty 10,030 Key Stock data BSE Code
Navkar Corporation BUY. Performance Update. CMP Target Price `175 `265. 2QFY2017 Result Update Logistics. Historical share price chart.
 2QFY2017 Result Update Logistics December 2, 2016 Navkar Corporation Performance Update Y/E March (` cr) 2QFY17 2QFY16 % yoy 1QFY17 % qoq Net sales 90 86 5.2 90 (0.2) EBITDA 33 37 (9.8) 38 (12.8) EBITDA
Century Plyboards Ltd
 May-15 Aug-15 Nov-15 Feb-16 May-16 Aug-16 Nov-16 Feb-17 May-17 Aug-17 Nov-17 Feb-18 4QFY2018 Result Update Plywood May 19, 2018 Century Plyboards Ltd Performance Update (Rs cr) 4QFY18 4QFY17 % yoy 3QFY17
Dr Reddy s Laboratories
 : price: EPS: How does our one year outlook change? We maintain rating on DRRD post the company s 3QFY16 results Revenue growth for the quarter was muted (3% yoy) due to disappointing performances in Russia
Company Overview. Financial Performance
 Jan-15 Feb-15 Mar-15 Apr-15 May-15 Jun-15 Jul-15 Aug-15 Sep-15 Oct-15 Nov-15 Dec-15 CMP: 31.25 December 24, 2015 Stock Details BSE code 523878 BSE ID TOTEX Face value ( ) 10 No of shares (m) 8.1 Market
PEER GROUPS CMP MARKET CAP EPS P/E (X) P/BV(X) DIVIDEND Company Name (Rs.) Rs. in mn. (Rs.) Ratio Ratio (%)
 P/BV(X) DIVIDEND Company Name (Rs.) Rs. in mn. (Rs.) Ratio Ratio (%)") BUY CMP 734.45 Target Price 845.00 WELSPUN INDIA LIMITED Result Update (CONSOLIDATED): Q2 FY16 OCTOBER 24 th 2015 ISIN: INE192B01023 Index Details Stock Data Sector Textiles BSE Code 514162 Face Value
BUY CMP 734.45 Target Price 845.00 WELSPUN INDIA LIMITED Result Update (CONSOLIDATED): Q2 FY16 OCTOBER 24 th 2015 ISIN: INE192B01023 Index Details Stock Data Sector Textiles BSE Code 514162 Face Value
Maruti Suzuki India BUY. Performance Update. CMP `9,315 Target Price `10,820. 1QFY2019 Result Update Automobile. Historical share price chart
 Jul-15 Sep-15 Nov-15 Jan-16 Mar-16 May-16 Jul-16 Sep-16 Nov-16 Jan-17 Mar-17 May-17 Jul-17 Sep-17 Nov-17 Jan-18 Mar-18 May-18 1QFY2019 Result Update Automobile July 27, 2018 Maruti Suzuki India Performance
Alembic BUY. Performance Highlights. Target Price. 1QFY2011 Result Update Pharmaceutical. Investment Period 12 months
 1QFY2011 Result Update Pharmaceutical August 2, 2010 Alembic Performance Highlights Y/E March (Rs cr) 1QFY2011 4QFY2010 % chg (qoq) 1QFY2010 % chg (yoy) Net Sales 279 267 4.6 291 (4.0) Other Income 1 1
Marico Kaya BUY RESULTS REVIEW 4QFY15 29 APR 2015
 RESULTS REVIEW 4QFY15 29 APR 2015 Marico Kaya INDUSTRY FMCG CMP (as on 28 Apr 2015) Rs 1,635 Target Price Rs 1,823 Nifty 8,240 Sensex 27,226 KEY STOCK DATA Bloomberg MAKA IN No. of Shares (mn) 13 MCap
Religare Investment Call
 BUY CMP (Rs) Target Price (Rs) Potential Upside Sensex Nifty Key Stock data BSE Code NSE Code Bloomberg Shares o/s, Cr (FV 2) Market Cap (Rs Cr) 3M Avg Volume 52 week H/L Shareholding Pattern (%) Promoter
Hero MotoCorp NEUTRAL. Performance Highlights. CMP `2,245 Target Price - 4QFY2012 Result Update Automobile. Investment Period - Key financials
 4QFY212 Result Update Automobile Hero MotoCorp Performance Highlights Y/E March (` cr) 4QFY12 4QFY11 % chg (yoy) Angel est. % diff NEUTRAL CMP `2,245 Target Price - Investment Period - Net sales 6,35 5,391
Astra Microwave Products
 Aug-13 Oct-13 Dec-13 Feb-14 Apr-14 Jun-14 Aug-14 Research Desk Stock Broking Capital Goods - Defence August 4, 2014 RESULT REVIEW Bloomberg: ASTM@IN Reuters: ASTM.BO Results in-line with expectation-maintain
Power Mech Projects. Institutional Equities. 2QFY18 Result Update BUY. Strong Business Scalability Likely; Retain Buy
 2QFY18 Result Update Power Mech Projects 23 November 217 Reuters: POMP.BO; Bloomberg: POWM IN Strong Business Scalability Likely; Retain Buy Power Mech Projects (PMPL) posted 2QFY18 consolidated revenues
CMP (Rs) 775 Upside/ (Downside) (%) (1.4) Market Cap. (Rs bn) 11.4 Free Float (%) 35.0 Shares O/S (mn) 14.7
 775 Upside/ (Downside) (%) (1.4) Market Cap. (Rs bn) 11.4 Free Float (%) 35.0 Shares O/S (mn) 14.7") 2QFY18 Result Update November 23, 2017 Market Cap. (Rs bn) 11.4 Free Float (%) 35.0 Shares O/S (mn) 14.7 High Order Book Provides Revenue Visibility (PMPL) has delivered a healthy performance in 2QFY18.
2QFY18 Result Update November 23, 2017 Market Cap. (Rs bn) 11.4 Free Float (%) 35.0 Shares O/S (mn) 14.7 High Order Book Provides Revenue Visibility (PMPL) has delivered a healthy performance in 2QFY18.
Indiabulls Real Estate Limited. Unaudited Financial Results Q3 FY th January, 2017
 Indiabulls Real Estate Limited Unaudited Financial Results Q3 FY 2016-17 25 th January, 2017 Safe Harbour Statement This document contains certain forward looking statements based on current expectations
Hero MotoCorp ACCUMULATE. Performance Highlights. CMP `3,226 Target Price `3,466. 3QFY2017 Result Update Automobile. 3-year price chart
 3QFY2017 Result Update Automobile February 14, 2017 Hero MotoCorp Performance Highlights ACCUMULATE CMP `3,226 Target Price `3,466 Y/E March (` cr) 2QFY17 2QFY16 % chg (yoy) 1QFY17 % chg (qoq) Investment
Power Mech Projects. Institutional Equities. 2QFY19 Result Update BUY. Strong Order Book Drives Robust Execution
 2QFY19 Result Update Power Mech Projects 21 November 218 Reuters: POMP.BO; Bloomberg: POWM IN Strong Order Book Drives Robust Execution Power Mech Projects (PMPL) posted 2QFY19 consolidated revenues of
PEER GROUPS CMP MARKET CAP EPS P/E (X) P/BV(X) DIVIDEND Company Name (Rs.) Rs. in mn. (Rs.) Ratio Ratio (%)
 P/BV(X) DIVIDEND Company Name (Rs.) Rs. in mn. (Rs.) Ratio Ratio (%)") BUY CMP 191.60 Target Price 220.00 SESHASAYEE PAPER & BOARDS LTD Result Update (PARENT BASIS): Q3 FY15 APRIL 8 th, 2015 ISIN: INE630A01016 Index Details Stock Data Sector Paper & Paper Products BSE Code
BUY CMP 191.60 Target Price 220.00 SESHASAYEE PAPER & BOARDS LTD Result Update (PARENT BASIS): Q3 FY15 APRIL 8 th, 2015 ISIN: INE630A01016 Index Details Stock Data Sector Paper & Paper Products BSE Code
10,11,497 square feet (sq ft; developer s share is 8,26,133 sq ft)
") Ozone KNS Oasis Rating assigned: Bangalore 5 Star October 2017 Project profile Type of project Location of project Type of development Land area Total saleable area No. of villas/blocks No. of plots Unit
Ozone KNS Oasis Rating assigned: Bangalore 5 Star October 2017 Project profile Type of project Location of project Type of development Land area Total saleable area No. of villas/blocks No. of plots Unit