HALF-YEARLY REPORT 1 JANUARY 30 JUNE 2018
|
|
|
- Sharyl Garrett
- 5 years ago
- Views:
Transcription
1 HALF-YEARLY REPORT 1 JANUARY 30 JUNE

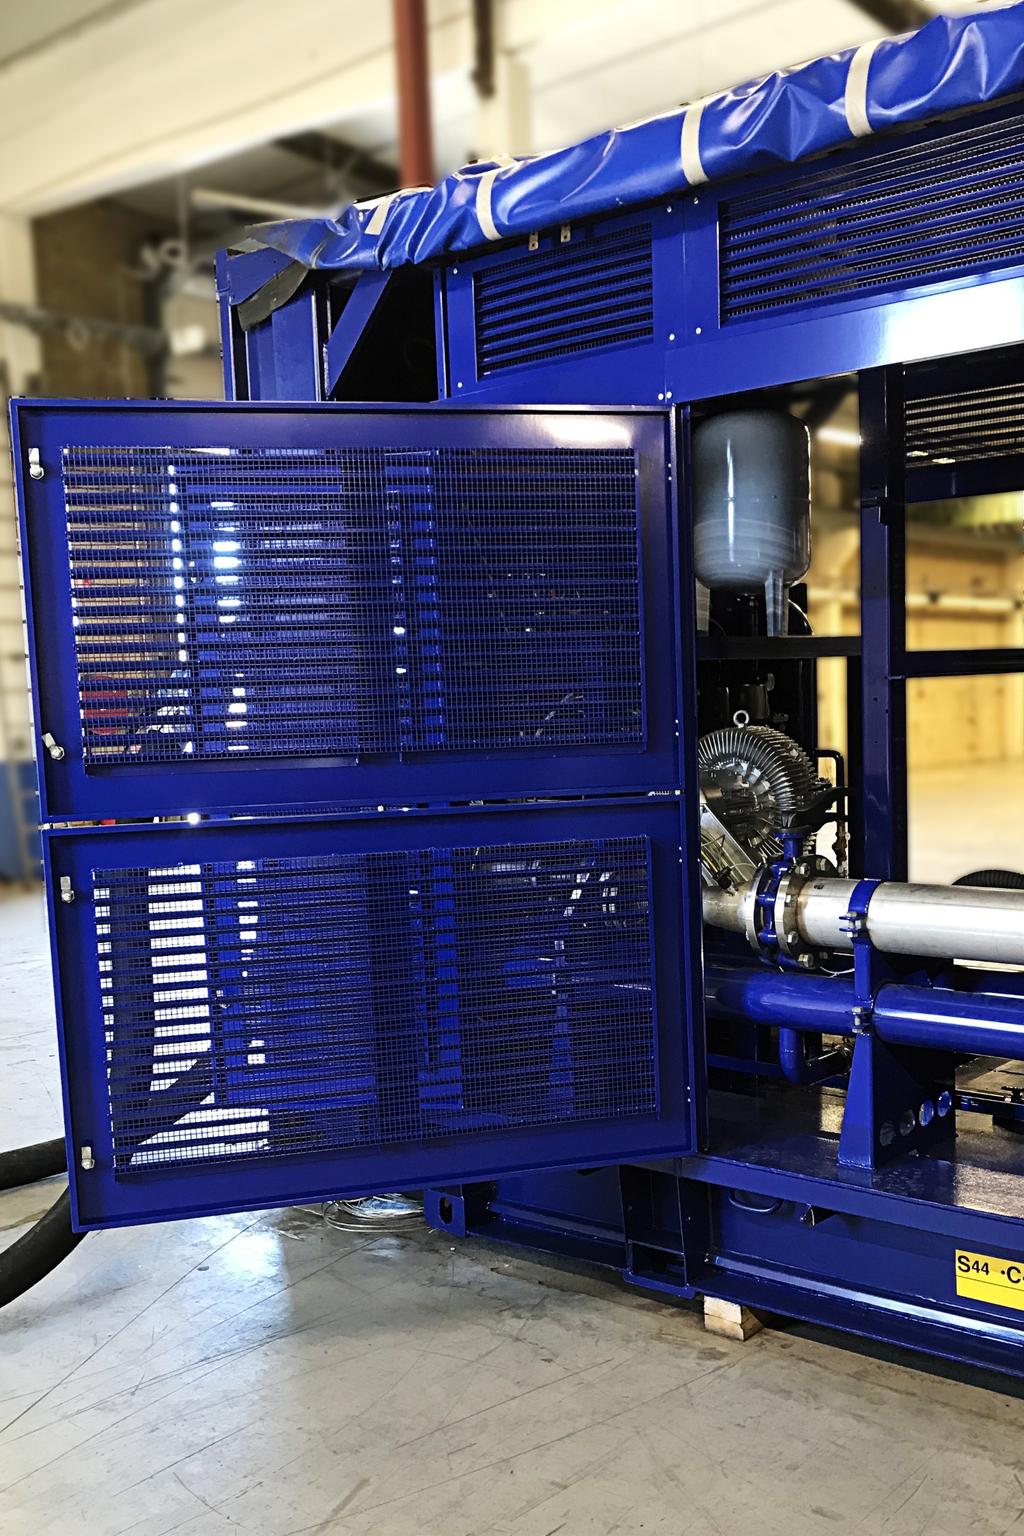
2 RIPASSO ENERGY AB IN BRIEF Ripasso Energy AB is a Swedish environmental technology company founded in 2008 with a mission to develop and commercialise Stirling technology s ability to convert thermal energy to electricity. The company currently produces solutions and products for generating electricity at low cost compared to other renewable and sustainable alternatives. Ripasso has the environmental technology market s best Stirling engine, featuring a unique combination of high power and high efficiency. The technology is based on Kockum s world-class Stirling engine for submarines. The company s latest product the PWR BLOK 400-F is a unique, climate-friendly solution for extracting electricity from industrial residual and the flare gases at record-low prices. Manufacturing and assembly take place in Sweden. Ripasso currently has operations and customers in both Europe and Africa. The company s shares are listed in Sweden (on the NGM Nordic MTF), and also trade on the Börse Stuttgart in Germany. MATERIAL EVENTS JANUARY-JUNE 2018 Following our sales successes in 2017, on in January Heije Westberg was employed as Chief Technology Officer (CTO). Westberg has a strong management background with many years of experience developing and building technical organisations, and brings a large body of technical know-how, with a doctorate from Chalmers and Gothenburg University. Jens Bruno joined Ripasso in June as CFO. Bruno brings 20 years of experience in financial management and financial markets, gained both in Sweden and in Eastern Europe and will further strengthen our financial reporting and compliance functions. Due to the significant interest shown by the South African ferrochrome industry in the company s product, the PWR BLOK 400-F, the company has opened a wholly owned subsidiary and sales office in South Africa. The Head of Ripasso South Africa is David de Mattos. He most recently served as Sales Manager at Clarke Energy, and many years experience with gas engines and projects in the metals and mining industry. In order to strengthen the internal organisation and to further develop our product portfolio, Ann Grant was brought on as Senior Combustion System Engineer, while Ulrika Grimfeldt was hired to head up Combustion System Technology. Grant was recruited from Volvo Car Corporation, and Grimfeldt from Volvo Penta. Production of Afarak Mogale s first PWR BLOK order is proceeding according to plan in Sibbhult and Vaggeryd. The Company has signed a memorandum of understanding with two shareholders regarding the project financing of up to 72 PWR Blok units at a price of EUR500,000 per unit (totalling EUR 36 million). The final terms of this agreement will depend on a number of factors and the MoU may or may not result in a final agreement Due to increased public interest in the company s shares, the Board decided to expand its reporting to the market and will begin reporting on a quarterly basis in 3Q The planned installation in South Africa 2

3 MATERIAL EVENTS AFTER THE END OF THE PERIOD Ripasso Energy has been requested to provide a detailed proposal for the installation on two production ferro-chrome production sites in South Africa. In total, this comprises 72 PWR BLOK worth 36 million euros. A test container has been sent to South Africa for live testing and further data collection for the upcoming full-scale installation. Ripasso Energy has started to market PWR BLOK for the use of synthesis gas and lowquality LPG in South Africa and has received a good response. The goal is to provide technology to local projects in South Africa where distributed power supply can be at a lower cost than purchases from the national electricity company. Ripasso Energy's Board of Directors has decided to prepare the company for listing on a regulated stock exchange. Market place will be chosen during H and listing is planned to Q The major shareholders in consultation with the Board have asked the nomination committee to meet and evaluate the composition of the board and, if appropriate, seek new candidates with relevant skills and experience. FIRST HALF OF 2018 IN BRIEF Income amounts to TSEK 29,826 (TSEK 15,510), and in full comprises capitalised work for own account in the amount of TSEK 29,826 (TSEK 15,510). Profit/loss after financial items is recognised in the amount of TSEK -1,725 (TSEK - 2,509). The loss is largely attributable to other external expenses and personnel costs. Earnings per share amount to SEK (SEK -0.03). The equivalent earnings per share after taking into account dilution by potential shares from existing warrants and the convertible loan amounts to SEK (SEK -0.03). As at the end of the period, capitalised development costs amount to TSEK 247,689 (TSEK 201,431). Cash flow amounted to TSEK -39,338 (TSEK - 16,796). As at the balance sheet date, equity amounted to TSEK 285,216 (TSEK 208,124). Welding of a motor stand into a container for the PWR BLOCK, March

4 CEO S STATEMENT The first order received for our new product, the PWR BLOK, has pushed the company into a new phase where our primary focus is on sales and production. Therefore, since the turn of the year, we have strengthened the organisation by adding a number of key personnel. They will be an important part of building a stable, strong organisation. This to meet the high demand for the company s technology for the recovery of energy and industrial residual gases. The goal is to build the platform the company needs to handle rapid future growth. For this reason, when filling the first PWR BLOK order, our approach will be to create a structure that is both capable of handling large-scale production and harnessing the economies of scale that we know are achievable. The entire company has been bursting with activity during the first six months of this year. Our development and production team in Sibbhult, Gothenburg and Vaggeryd has been laser-focused on the production and testing of the PWR BLOK to meet the delivery schedule established together with Afarak Mogale. It is very pleasing to see us doing so well in terms of technology, quality and delivery time. our primary focus area: The South African ferrochrome sector. The response we have seen from a number of large smelters is very good. This convinces us that our strategy is the right one. Currently we are working with a number of potential buyers to come up with a solution to suit their particular needs. It is in this context that the agreement we reached with two of our major shareholders in the spring regarding potential project financing comes into play. The agreement in principle makes it possible for Ripasso Energy to offer major customers in the ferrochrome industry the option to only make a commitment to purchase energy at a fixed price over a certain period. The electricity they will be able to buy is cheaper than what they are paying today and is extracted from residual gases that are currently not utilised but are simply flared off. This offering has attracted a strong interest in South Africa. We are therefore very happy that we now have been requested to propose a mayor project. A project of that size would enable us to grow manufacturing volumes to a level that makes the PWR BLOK product highly profitable. Furthermore, we have received proposals from companies in other sectors that also produce combustible residual gases as a byproduct of production. Our technology has the single advantage of having a very wide range of applications, as it can be adapted to a variety of gas compositions. Our focus does remain on the ferrochrome industry, but we will also adapt the PWR BLOK to other gases. The company is well-equipped to meet a growing order backlog. Ripasso Energy has significant momentum, and we are seeing strong demand for the PWR BLOK without any direct competition, which gives me plenty of confidence for the next half of Gunnar Larsson CEO Ripasso Energy AB (publ) We have also strengthened our presence on the South African market by establishing an office in Johannesburg. This makes it possible for us to reach out to additional customers in 4
5 Income statement Amount in SEK thousands Operating income Net turnover Capitalised work for own account 29,682 15,257 31,684 Other operating income ,350 Total income 29,826 15,510 34,034 Operating expenses Raw materials and consumables -24,604-9,986-23,322 Other external expenses -7,016-3,257-7,587 Costs of personnel -5,527-3,943-8,188 Depreciation/amortisation of tangible fixed assets Other operating expenses Total expenses -37,473-17,235-39,171 Operating profit -7,647-1,725-5,137 Profit/loss from financial items Interest income and similar items Interest charges and similar income items -2, Profit/loss from financial items -2, Profit/loss after financial items -10,318-1,725-5,539 Tax on profit/loss for the period Profit/loss for the period -10,318-1,725-5,539 5
6 Balance sheet Amount in SEK thousands ASSETS Fixed assets Intangible fixed assets Capitalised expenditures for development work 247, , ,007 Total fixed assets 247, , ,007 Tangible fixed assets Other improvements and installations Property, plant and equipment 1, Total tangible fixed assets 1, Financial fixed assets Other long-term securities holdings Total financial fixed assets Total fixed assets 249, , ,230 Current assets Inventories, etc. Goods in process 7,803 2,782 2,933 Advance payments to suppliers Total current assets 8,439 2,782 2,933 Current receivables Current tax receivables Other receivables 5,045 1,667 5,321 Prepaid expenses Total current receivables 5,451 2,140 5,689 Cash and bank balances 62,202 10, ,540 Total current assets 76,092 15, ,162 TOTAL ASSETS 325, , ,392 6
7 EQUITY AND LIABILITIES Amount in SEK thousands Equity Restricted equity Share capital Unregistered share capital Fund for development fees 53,979 37,403 53,979 Total 54,774 38,015 54,774 Unrestricted equity Share premium reserve 299, , ,217 Retained earnings -58,457-36,341-52,917 Net income -10,318-1,725-5,539 Total 230, , ,761 Total equity 285, , ,535 Long term liabilities Convertible loan 26,955-25,291 Total long term liabilities 26,955-25,291 Current liabilities Prepayments from customers 305 2, Accounts payable 10,679 3,450 4,658 Other current liabilities Accrued expenses and deferred income 2,330 3,009 2,449 Total 13,524 8,956 7,566 TOTAL EQUITY AND LIABILITIES 325, , ,392 7
8 Cash flow statement Amount in SEK thousands Operating activities Profit/loss after financial items -10,318-1,725-5,539 Adjustments for items not included in cash flow, etc Total -10,193-1,695-5,481 Paid income tax Cash flow from operating activities before changes in working capital -10,193-1,695-5,481 Cash flow from changes in working capital Increase (-) / decrease (+) in inventories -5,506-1,316-1,468 Increase (-) / decrease (+) in operating receivables 238-1,187-4,735 Increase (+) / decrease (-) in operating liabilities 5,958 2,750 1,361 Cash flows from operating activities -9,503-1,448-10,323 Investing activities Acquisition of intangible fixed assets -29,682-15,237-31,813 Acquisition of tangible fixed assets -1, Acquisition of financial assets Cash flow from investing activities -31,499-15,348-31,993 Financing activities New share issue ,226 Shareholders contributions Amortisation of loans 1,664-25,291 Cash flow from financing activities 1, ,517 Cash flow for the period -39,338-16,796 74,201 CASH AND EQUIVALENTS, BEGINNING OF THE PERIOD 101,540 27,339 27,339 CASH AND EQUIVALENTS END OF THE PERIOD 62,202 10, ,540 8
9 Key ratios Amount in SEK thousands Profitability Operating income 29,826 15,510 34,034 Operating profit -7,647-1,725-5,137 Operating profit, after tax -10,318-1,725-5,539 Return on equity in % -3,6 % -0,8 % -1,9 % Capital structure Equity/asset ratio in % 88% 96% 90% Quick ratio in % 500% 142% % Weighted average outstanding shares 79,505,021 61,157,709 61,157,709 Potential shares attributable to outstanding options (*) 4,640,000 4,640,000 4,640,000 Ongoing share issue ,347,312 Bonds/Convertible loans (**) 5,572,146-5,572,146 Number of shareholders (*) 5,380 4,360 5,350 Earnings per share, SEK Diluted EPS, SEK Dividend per share Staff Average number of employees Costs of personnel 5,527 3,943 8,188 (*) As at the balance sheet date (**) Based on a conversion rate of SEK 4.50 per share COMMENTS ON THE INCOME STATEMENT AND BALANCE SHEET Financial position and earnings The Company s income amounts to TSEK 29,826 (TSEK 15,510), and primarily comprises capitalised work for own account in the amount of TSEK 29,682 (TSEK 15,257). Net sales amount to TSEK 0 (TSEK 0) and profit/loss after financial items is recognised in the amount of TSEK 10,318 (TSEK - 1,725). The loss is largely attributable to other external expenses and personnel costs. Of the personnel costs, TSEK 4,054 (TSEK 3,131) has been capitalised as work for own account. As at the end of the period, capitalised development costs amount to TSEK 247,689 (TSEK 201,531). Cash flow and financial position The company s cash flow amounts to TSEK -39,338 (TSEK 16,796). As at the balance sheet date, cash and cash equivalents amounted to TSEK 62,202 (TSEK 10,543). The negative cash flow is largely attributable to product development costs, which have been capitalised. Changes in equity As at the balance sheet date, the Company s equity amounted to TSEK 285,216 (TSEK 208,124). During the period, the company s equity has been reduced by a total of TSEK 1,725, i.e. by the earnings for the period. As at the balance sheet date, there are outstanding shares having a quota value of SEK
10 FINANCIAL CALENDAR Results for 3Q 2018 will be published on 13 November 2018 The year-end report for 2018 will be published on 12 February 2019 The annual accounts for 2018 will be published on 26 March 2019 The Annual General Meeting will be held on 26 April 2019 Results for 1Q 2019 will be published on 7 May 2019 The half-yearly report for the first half of 2019 will be published on 14 August 2019 ACCOUNTING POLICIES The interim report has been prepared in accordance with the Swedish Annual Accounts Act and the general provisions of the Swedish Accounting Standards Board, BFNAR 2012:1 Annual Accounts and Consolidated Accounts (K3 regulations). For more detailed policies, please refer to the company s annual accounts for the 2017 financial year. RISKS The company s business consists mainly of developing and commercialising new technology. The company s development is thus associated with technical, financial and regulatory risks. For more detailed information about the company s risks, please refer to the company s 2017 annual accounts. The annual accounts are available on the company s website. This interim report has not been audited. Gothenburg, 14 August 2018 Sven Sahle Chairman of the Board Andreas Ahlström Board Member Johan Ekesiöö Board Member Ulf Gundemark Board Member Benedict Morgan Board Member Gerd Jakob Board Member Gunnar Larsson CEO 10
11 KEY RATIO DEFINITIONS Operating income Operating profit Operating profit, after tax Return on equity Equity/asset ratio Quick ratio Weighted average outstanding shares Potential shares attributable to outstanding options Earnings per share Diluted earnings per share Dividend per share Average number of employees Costs of personnel All income, including capitalised work for own account Profit/loss after amortisation/depreciation Profit/loss after tax. Profit/loss after tax in relation to equity. Total equity / Total assets. Total equity refers to taxed equity, plus 78 % of untaxed reserves. Current assets, excluding inventories, divided by short-term liabilities incl. proposed dividends. Outstanding shares at the beginning of the period adjusted for newly issued shares during the period, multiplied by a time-weighting factor. Outstanding options at the end of the period converted into potential shares. Calculated profit/loss for the year divided by the weighted average of outstanding shares. Calculated profit/loss for the year divided by the weighted average of outstanding shares and potential shares attributable to outstanding options and convertible loans. Established dividend per eligible share. Average number of employees during the period. Personnel costs during the period, including salaries, other remuneration and social welfare costs. CONTACT Gunnar Larsson, CEO, gunnar.larsson@ripassoenergy.com Ripasso Energy AB headquarters: +46 (0) Ripasso Energy AB is required to disclose this information in accordance with the EU Market Abuse Regulation. The information was submitted for publication at the initiative of the above contact person on 14 August Ripasso Energy AB (Publ) Gruvgatan 35B Västra Frölunda Corporate id ir@ripassoenergy.com 11
QUARTERLY REPORT. Ripasso Energy AB (publ) July September 2018 Quarterly Report 1 JULY 30 SEPTEMBER 2018
 July September 2018 Quarterly Report 1 JULY 30 SEPTEMBER 2018") QUARTERLY REPORT Ripasso Energy AB (publ) July September 2018 Quarterly Report 1 JULY 30 SEPTEMBER 2018 1 RIPASSO ENERGY AB IN BRIEF Ripasso Energy AB is a Swedish clean tech company founded in 2008 with
QUARTERLY REPORT Ripasso Energy AB (publ) July September 2018 Quarterly Report 1 JULY 30 SEPTEMBER 2018 1 RIPASSO ENERGY AB IN BRIEF Ripasso Energy AB is a Swedish clean tech company founded in 2008 with
The year that was TABLE OF CONTENTS
 ANNUAL REPORT 2017 2 Annual Report 2017 INTRODUCTION TABLE OF CONTENTS The year that was INTRODUCTION The year that was Ripasso in brief CEO s statement Vision, business concept & objectives Strategy MARKET
The Bilia Group s earnings in 2015 were charged with closure costs for the Danish operation, see page 9.
 Net turnover amounted to SEK 5,433 M (4,715). Operating profit excluding items affecting comparability amounted to SEK 185 M (153). The Group s net profit for the period was SEK 143 M (23) and earnings
Invitation to subscribe for shares in Ripasso Energy AB (publ) December 2017
 December 2017") Invitation to subscribe for shares in Ripasso Energy AB (publ) December 2017 This document is an unofficial English translation of the Swedish-language Prospectus and references to the Prospectus refer
Invitation to subscribe for shares in Ripasso Energy AB (publ) December 2017 This document is an unofficial English translation of the Swedish-language Prospectus and references to the Prospectus refer
press release Report for the first six months of 2010 First six months Second quarter
 press release 28 July 2010 Report for the first six months of 2010 First six months Net turnover amounted to SEK 7,900 M (6,609). Operating profit was SEK 212 M (23) and the operating margin was 2.7 per
press release Report for the first quarter of 2011 First quarter
 press release 3 May 2011 Report for the first quarter of 2011 First quarter Net turnover amounted to SEK 4,344 M (3,742). Operating profit was SEK 98 M (83) and the margin was 2.3 per cent (2.2). Profit
Everything to do with our finances. And then some. Report for the first quarter of 2013
 Everything to do with our finances. And then some. Report for the first quarter of 2013 Report for the first quarter of 2013 First quarter Net turnover amounted to SEK 4,048 M (4,562). Operating profit
Bioservo Technologies AB Interim report, January-June 2018
 Bioservo Technologies AB Interim report, January-June 2018 Second quarter of 2018 in brief Net sales rose to SEK 1.6 M (0.6) EBITDA amounted to SEK -4.0 M (-4.7) EBIT totalled SEK -4.7 M (-5.1) Bioservo
Net turnover amounted to SEK 11,866 M (10,096). The Group s net profit for the period was SEK 336 M (320) and earnings per share SEK 6.60 (6.35).
. The Group s net profit for the period was SEK 336 M (320) and earnings per share SEK 6.60 (6.35).") Net turnover amounted to SEK 11,866 M (10,096). The Group s net profit for the period was SEK 336 M (320) and earnings per share SEK 6.60 (6.35). Net turnover amounted to SEK 6,433 M (5,381). Operational
Net turnover amounted to SEK 11,866 M (10,096). The Group s net profit for the period was SEK 336 M (320) and earnings per share SEK 6.60 (6.35). Net turnover amounted to SEK 6,433 M (5,381). Operational
Smart Eye Interim Report January December 2017
 Smart Eye Interim Report January December 2017 I Summary fourth quarter 2017 Net sales totalled SEK 10,506 (14,574) thousand which corresponds to a drop of 28%. Operating profit/loss totalled SEK 14,814
Interim report OmniCar Holding AB omnicar.com
 Interim report 2017-01-01 2017-12-31 OmniCar Holding AB 559113-3987 omnicar.com Interim report Summary OmniCar or the Company means the Group, namely OmniCar Holding AB (registered under company registration
Interim report Bilia AB (publ) 1 January 30 September (25) Sept Continuing operations
 1 January 30 September (25) Sept Continuing operations") Net turnover amounted to SEK 17,609 M (14,693). Operational earnings amounted to SEK 622 M (518). The Group s profit for the period was SEK 463 M (451) and earnings per share SEK 9.10 (8.95). Net turnover
Net turnover amounted to SEK 17,609 M (14,693). Operational earnings amounted to SEK 622 M (518). The Group s profit for the period was SEK 463 M (451) and earnings per share SEK 9.10 (8.95). Net turnover
The Annual General Meeting will be held at 5:30 p.m. on Thursday 3 May 2018, at our premises at Hammarby Kaj 10A, Stockholm.
 Annual Report 2017 INFORMATION FOR THE SHAREHOLDERS 2018 ANNUAL GENERAL MEETING FOR SOFTRONIC AB (PUBL), CIN 556249-0192 The Annual General Meeting will be held at 5:30 p.m. on Thursday 3 May 2018, at
press release Fourth Quarter and Year-End Report 2011 Year-End 2011 Fourth quarter
 press release 3 February 2012 Fourth Quarter and Year-End Report 2011 Year-End 2011 Net turnover amounted to SEK 18,160 M (16,257). Net profit for the year was SEK 420 M (407) and earnings per share SEK
Interim report Azelio AB January 1 September 30, 2018
 Interim report Azelio AB January 1 September 30, Requests from 52 countries since demonstrator launch Equity/assets ratio 84% 30 September Increase in number of employees 15% July September Summary During
Year-end report 2017 Bilia AB (publ) 1 (20)
 1 (20)") Net turnover amounted to SEK 27,492 M (23,306). Operational earnings amounted to SEK 1,006 M (887). Net profit for the year was SEK 691 M (636) and earnings per share SEK 6.75 (6.20). Operating cash flow
Net turnover amounted to SEK 27,492 M (23,306). Operational earnings amounted to SEK 1,006 M (887). Net profit for the year was SEK 691 M (636) and earnings per share SEK 6.75 (6.20). Operating cash flow
Commenting on the result for the first six months, Bilia s Managing Director Jan Pettersson says:
 press release 1 August 2007 Report for the first six months of 2007 First six months Net turnover amounted to SEK 7,165 M (7,079). Profit before tax amounted to SEK 86 M (29). Net profit amounted to SEK
INTERIM REPORT JULY SEPTEMBER 2017
 INTERIM REPORT JULY SEPTEMBER 2017 Third quarter of 2017 (July to September): Net Turnover of SEK 2.4 million (SEK 5.3 million) Operating Loss/EBIT of SEK -12.7 million (SEK-10.4 million) Result for the
Interim report January 1 March 31, A stable start of 2016
 Interim report January 1 March 31, Åseda, April 19, A stable start of First quarter Turnover MSEK 26.6 (256.4), up 2 percent compared to previous year Operating profit MSEK 7.1 (1.1), non recurring start-up
NY BILD. Summary of the Fortnox Group for the second quarter of 2018 (compared with the same period last year).
.") 2016 Interim Report April - June 2018 Summary of the Fortnox Group for the second quarter of 2018 (compared with the same period last year). Net sales for the Group increased by 41.0 percent to SEK 89.8
2016 Interim Report April - June 2018 Summary of the Fortnox Group for the second quarter of 2018 (compared with the same period last year). Net sales for the Group increased by 41.0 percent to SEK 89.8
Troax Group AB (publ) Hillerstorp 8th of November, 2018
 Hillerstorp 8th of November, 2018") Troax Group AB (publ) Hillerstorp 8th of November, 2018 INTERIM REPORT JANUARY - SEPTEMBER 2018 JULY - SEPTEMBER Order intake increased by 14 per cent to 40,1 (35,3) MEUR. Adjusted for currency the increase
Troax Group AB (publ) Hillerstorp 8th of November, 2018 INTERIM REPORT JANUARY - SEPTEMBER 2018 JULY - SEPTEMBER Order intake increased by 14 per cent to 40,1 (35,3) MEUR. Adjusted for currency the increase
INTERIM REPORT JANUARY MARCH 2018
 INTERIM REPORT JANUARY MARCH 2018 First quarter of 2018 (January to March): Net Turnover of SEK 8.3 million (SEK 6.3 million) Operating Loss/EBIT of SEK -19.8 million (SEK -9 million) Result for the period
Smart Eye Interim Report 1 January 30 September 2017
 Smart Eye Interim Report 1 January 30 September 2017 Summary Q3 2017 Net revenue amounted to TSEK 12,945 (10,092), equivalent to an increase of 28%. The operating result was TSEK 8,180 ( 4,634), which
Second quarter of 2016 (Q2 2015) Events during the second quarter of Second quarter and the first six months in brief
 Events during the second quarter of Second quarter and the first six months in brief") Interim Report January-June 2016 Evolution Gaming Group AB (publ) Second quarter of 2016 (Q2 2015) Revenues increased by 50% to EUR 27.1 million (18.1) Profit for the period amounted to EUR 7.6 million
Interim Report January-June 2016 Evolution Gaming Group AB (publ) Second quarter of 2016 (Q2 2015) Revenues increased by 50% to EUR 27.1 million (18.1) Profit for the period amounted to EUR 7.6 million
Lindab International AB (publ) Interim Report
 Interim Report") Lindab Interim Report January-September Lindab International AB (publ) Interim Report Third quarter Net sales increased by 2 percent to SEK 2,081 m (2,042), of which organic growth amounted to 2 percent.
Lindab Interim Report January-September Lindab International AB (publ) Interim Report Third quarter Net sales increased by 2 percent to SEK 2,081 m (2,042), of which organic growth amounted to 2 percent.
Group net sales increased by 12 percent to MSEK (107.2). At comparable exchange rates sales increased by 8 percent.
. At comparable exchange rates sales increased by 8 percent.") KSEK KSEK January - March 2012 April 26, 2012 First quarter 2012 Group net sales increased by 12 percent to 119.6 MSEK (107.2). At comparable exchange rates sales increased by 8 percent. The operating
KSEK KSEK January - March 2012 April 26, 2012 First quarter 2012 Group net sales increased by 12 percent to 119.6 MSEK (107.2). At comparable exchange rates sales increased by 8 percent. The operating
HMS Networks AB (publ)
") HMS Networks AB (publ) January December 2010 Yearend report Yearend report 2010 Net sales increased by 41 % and profit after tax increased by 200% Net sales for the year increased to SEK 344.5 m (244.5),
HMS Networks AB (publ) January December 2010 Yearend report Yearend report 2010 Net sales increased by 41 % and profit after tax increased by 200% Net sales for the year increased to SEK 344.5 m (244.5),
Annual Report for 24Money Payments AB (publ)
") 2015080426493 The Swedish Companies Registration Office 20 July 2015 Annual Report for 556884-4483 Financial year 2014 Certificate of adoption The undersigned director of certifies that the income statement
2015080426493 The Swedish Companies Registration Office 20 July 2015 Annual Report for 556884-4483 Financial year 2014 Certificate of adoption The undersigned director of certifies that the income statement
Bioservo Technologies AB Interim Report January September 2018
 Bioservo Technologies AB Interim Report January September 2018 Third quarter of 2018 in brief Net sales rose to SEK 1.0 M (0.5) EBITDA amounted to SEK -5.8 M (-3.9) EBIT totalled SEK -6.7 M (-4.5) Page
Strong online sales and improved margins
 FIRST QUARTER SEPTEMBER 1, 2016 NOVEMBER 30, 2016 Strong online sales and improved margins Interim Report September November 2016 First quarter Net sales for the quarter increased 7.5 per cent to SEK 2,284
Scania Interim Report January June 2007
 26 July Scania Interim Report January June Scania reports strong volume and revenue growth Order bookings continue to be strong, up 39 percent in the first six months Sharp increase in earnings, operating
Interim report January March 2018
 Interim report January March 218 Strong growth and stable margin First quarter 218 Net sales rose by percent to SEK 945 million (815). Organic growth was 9 percent. Order intake was in line with net sales.
VBG GROUP INTERIM REPORT Q3JANUARY SEPTEMBER 2018
 VBG GROUP INTERIM REPORT JANUARY SEPTEMBER The VBG Group is an international industrial group with some 1,6 employees in 18 countries. The Parent Company VBG Group AB is a long-term owner that provides
Troax Group AB (publ) Hillerstorp 13th of February, 2019
 Hillerstorp 13th of February, 2019") Troax Group AB (publ) Hillerstorp 13th of February, 2019 INTERIM REPORT JANUARY - DECEMBER 2018 OCTOBER - DECEMBER Order intake increased by 9 per cent to 41,7 (38,4) MEUR. Adjusted for currency the increase
Troax Group AB (publ) Hillerstorp 13th of February, 2019 INTERIM REPORT JANUARY - DECEMBER 2018 OCTOBER - DECEMBER Order intake increased by 9 per cent to 41,7 (38,4) MEUR. Adjusted for currency the increase
Annual report and consolidated financial statements for the financial year 2012
 MISEN ENERGY AB (publ.) Corporate Identity Number Annual report and consolidated financial statements for the financial year 2012 The Board of Directors and Managing Director present the following annual
CELLINK AB (publ) Interim report September-November 2018/2019 (Q1)
 Interim report September-November 2018/2019 (Q1)") CELLINK AB (publ) Interim report September-November 2018/2019 (Q1) 1 Interim report September-November 2018/2019 CELLINK AB (publ), org.nr. 559050-5052 Continued growth and improved margins. First quarter
CELLINK AB (publ) Interim report September-November 2018/2019 (Q1) 1 Interim report September-November 2018/2019 CELLINK AB (publ), org.nr. 559050-5052 Continued growth and improved margins. First quarter
Interim Report January March 2017
 Interim Report January March 2017 Significant events during the period 1 February Christer Ahlberg started as new CEO for Sedana Medical group. In March, AnaConDa was approved in South Korea, which is
Interim report January - March First quarter. The group in brief
 Interim report January - March 2017 First quarter Net sales increased by 105% to MSEK 21.1 (10.3) Operating profit declined to MSEK -4.9 (-3.3). Adjusted operating profit* increased to MSEK 1.6 (-3.3)
Positive start to the year
 G & L B e i j e r A B Q 1 2 0 1 4 Positive start to the year the quarter in brief 71.3 sek m Operating profit 4.5% Operating margin 45.6 sek m Net profit for the period 1.03 sek Profit per share Quarter
Year-end report 2017 January - December YEAR-END REPORT 2017 OCTOBER DECEMBER 2017 JANUARY DECEMBER 2017
 Year-end report 2017 January - December Troax Group AB (publ) Hillerstorp 12th of February, 2018 YEAR-END REPORT 2017 OCTOBER DECEMBER 2017 Order intake increased by 17 per cent to 38,4 (32,8) MEUR. Adjusted
INTERIM REPORT 1/1 30/9, 2017 AINO HEALTH AB
 Q3 INTERIM REPORT 1/1 30/9, 2017 AINO HEALTH AB 559063-5073 Third quarter 2017 THREE IMPORTANT EVENTS NEW AGREEMENT SIGNED WITH FINNISH CONSTRUCTION COMPANY HARTELA. AINO HEALTH S FIRST AGREEMENT WITHIN
Interim report January 1 March 31, 2008 for the Scribona Group
 SCRIBONA AB (publ), corporate identification no. 556079-1419 Interim report January 1 March 31, 2008 for the Scribona Group Solna, May 30, 2008 Q1 2008 Net sales for the first quarter reached SEK 1,903
INTERIM REPORT, 1 APRIL 30 JUNE 2017 AINO HEALTH AB
 Q2 INTERIM REPORT, 1 APRIL 30 JUNE 2017 AINO HEALTH AB 559063-5073 Second quarter 2017 THREE IMPORTANT EVENTS TURNOVER CONTINUES ON THE SAME LEVEL AS Q1 - SALES PIPELINE IS GROWING LAUNCHES IN GERMANY
hms networks JANUARY - DECEMBER 2013 Fourth quarter
 hms networks Y E A R - E N D R E P O R T 2 0 1 3 JANUARY - DECEMBER q Net sales for the full year reached SEK 501 m (382), corresponding to a 31 % increase. The revaluation of the Swedish currency had
Year-end Report 2016 January - December YEAR-END REPORT 2016 OCTOBER DECEMBER 2016 JANUARY DECEMBER 2016 TROAX GROUP FIGURES
 Year-end Report 2016 January - December Troax Group AB (publ) Hillerstorp 14th February, 2017 YEAR-END REPORT 2016 OCTOBER DECEMBER 2016 Order intake increased by 21 per cent, or 26 per cent adjusted for
Report for the first quarter of 2006
 press release 4 May 2006 Report for the first quarter of 2006 First quarter Net turnover amounted to SEK 3,200 M (2,696). Operating profit excluding items affecting profitability amounted to SEK 33 M (63).
1 January 31 december Year-End Report - Cabonline Group Holding
 1 January 31 december 2017 Year-End Report - Cabonline Group Holding October-December 2017 January-December 2017 Net sales amounted to SEK 1,560 million (1,531) EBITDA before non-recurring items amounted
V ä s t e r å s, A p r i l 2 7,
 V ä s t e r å s, A p r i l 2 7, 2 0 1 7 AQ Group AB (publ), First quarter, 2017-1 - First quarter, January-March 2017 in brief Continued growth in sales and profit Net sales increased by 25% to SEK 1 002
First quarter report 2008
 First quarter report 2008 Net Entertainment NE AB (publ) Org. nr. 556532-6443 Birger Jarlsgatan 57 B, 113 56 Stockholm www.netent.com, info@netent.com 1 (15) Net Entertainment NE AB (publ) Net Entertainment
Troax Group AB (publ) Hillerstorp 15th of August, 2018
 Hillerstorp 15th of August, 2018") Troax Group AB (publ) Hillerstorp 15th of August, 2018 INTERIM REPORT JANUARY - JUNE 2018 APRIL - JUNE Order intake increased by 8 per cent to 42,9 (39,8) MEUR. Adjusted for currency the increase was 10
Troax Group AB (publ) Hillerstorp 15th of August, 2018 INTERIM REPORT JANUARY - JUNE 2018 APRIL - JUNE Order intake increased by 8 per cent to 42,9 (39,8) MEUR. Adjusted for currency the increase was 10
Interim report July-September 2015
 Interim report July-September 2015 (This is a translation of the Swedish version, if any differences the Swedish one is valid) The third quarter of July to September Operating income totaled -1 189 TSEK
Interim Report January September 2016
 Third Quarter - 20 Interim Report January September 20 The order intake was MSEK 3,438.2 (3,0.3), which is an increase of 11.3% after adjustment for currency effects of MSEK -3.1 and acquisitions of MSEK
Interim report January 1 September 30, Raw material impact makes quarterly result negative
 Interim report January 1 September 30, Åseda, October 23, Raw material impact makes quarterly result negative Third quarter Turnover MSEK 219.6 (177.6), up 24 percent compared to previous year Operating
INTERIM REPORT APRIL - JUNE 2018
 Interim report 2018 Bellman Group AB (publ) (Org nr 559108-3729) Stockholm, 29 August, 2018 INTERIM REPORT APRIL - JUNE 2018 The Bellman Group is comprised of Bellmans Åkeri & Entreprenad AB and Grundab
Strong online performance and increased margins
 Q3 THIRD QUARTER MARCH 1, 2016 MAY 31, 2016 Strong online performance and increased margins Summary of third quarter of 20 Third quarter Net sales for the quarter rose 3.6 per cent to SEK 1,989 million
Ripasso Energy AB Gruvgatan 35B, SE Västra Frölunda, Sweden
 Annual report 2016 2 2017 Ripasso Energy AB Gruvgatan 35B, SE-421 30 Västra Frölunda, Sweden www.ripassoenergy.com info@ripassoenergy.com Annual report for the 2016 financial year for Ripasso Energy AB
The operating profit was MSEK (396.0) representing a 32.4% increase with an operating margin of 11.7 (10.1)%
 representing a 32.4% increase with an operating margin of 11.7 (10.1)%") Fourth Quarter - 20 YEAR-END REPORT 20 The order intake was MSEK 4,653.0 (4,113.4), which is an increase of 9.4% after adjusting for currency effects of MSEK -6.5 and acquisitions of MSEK 308.8 Net sales
Fourth Quarter - 20 YEAR-END REPORT 20 The order intake was MSEK 4,653.0 (4,113.4), which is an increase of 9.4% after adjusting for currency effects of MSEK -6.5 and acquisitions of MSEK 308.8 Net sales
INTERIM REPORT JANUARY - SEPTEMBER 2017
 Interim report Q3 2017 January - September Troax Group AB (publ) Hillerstorp 6th of November, 2017 INTERIM REPORT JANUARY - SEPTEMBER 2017 JULY SEPTEMBER 2017 Order intake increased by 30 per cent to 35,3
Interim Report Jan- Sept 2018
 Interim Report Jan- Sept JULY SEPTEMBER > Net sales increased 23 per cent to SEK 420.1 million (342.7). In USD, net sales increased 12 per cent. > Order intake increased 21 per cent to SEK 411.2 million
Fredrik Börjesson. Stefan Hedelius
 15995949.1 Extraordinary General Meeting in Momentum Group AB (publ) on 28 November 2017. Account of the Board of Directors of Momentum Group AB (publ) in accordance with Chapter 19, Section 24, Paragraph
Interim report. January - March First quarter January - March 2015
 Interim report January - March 2015 April 28, 2015 First quarter January - March 2015 Group net sales in the first quarter 2015 amounted to 144.2 MSEK (113.7), an increase by 26.8 percent compared to the
Jan-March Jan-March 12-months rolling. Jan-Dec SEK m
 Instalco Interim report January - March Continued healthy growth and good profitability January March Net sales increased by SEK 45.2 million to SEK 689 (474) million. Organic growth was 9.3 percent. Adjusted
Strong growth and increased earnings across all business areas
 Nolato AB three-month interim report 218, page 1 of 18 Nolato AB (publ) three-month interim report 218 Strong growth and increased earnings across all business areas First quarter of 218 in brief Sales
Net entertainment interim report january-march 2009 the best ONliNe gaming solutions
 Net entertainment INTERIM REPORT january-march 2009 the best online gaming solutions INTERIM REPORT JANUARY - MARCH 2009 Revenues for the first quarter increased by 60.7 % to SEK 68.7 (42.8) million Operating
FINANCIAL INFORMATION IN BRIEF
 INTERIM REPORT 1 January 30 September 2016 FINANCIAL INFORMATION IN BRIEF Third quarter: 1 July-30 September 2016 Sales for the third quarter amounted to SEK 0.6 (1.0) million. Operating result in the
1 Financial reports Comments on the profit and loss statement... 11
 Annual Report 2017 Innehåll 1 Financial reports... 7 2 Comments on the profit and loss statement... 11 2.1 Operating revenue... 11 2.2 Operating profit and loss... 11 2.3 Net financial items... 13 2.4
Interim report. January - September Interim report for the period January - September Third quarter, July - September 2015
 Interim report January - September 2015 October 30, 2015 Interim report for the period January - September 2015 Third quarter, July - September 2015 Group net sales in the third quarter 2015 amounted to
Entry into the Canadian market through an agreement with British Columbia Lottery Corporation for provision of Live Casino services
 Interim Report January March 2017 Evolution Gaming Group AB (publ) First quarter of 2017 (Q1 2016) Operating revenues increased by 60% to EUR 39.7 million (24.8) EBITDA increased by 65% to EUR 17.0 million
Order intake increased by 31 per cent to 78,3 (59,6) MEUR. Adjusted for acquisition and
 MEUR. Adjusted for acquisition and") Interim report Q2 2017 January - June Troax Group AB (publ) Hillerstorp 16th August, 2017 INTERIM REPORT 2017 APRIL JUNE 2017 Order intake increased by 30 per cent to 39,8 (30,5) MEUR. Adjusted for acquisition
Interim report Q2 2017 January - June Troax Group AB (publ) Hillerstorp 16th August, 2017 INTERIM REPORT 2017 APRIL JUNE 2017 Order intake increased by 30 per cent to 39,8 (30,5) MEUR. Adjusted for acquisition
INTERIM REPORT JANUARY MARCH 2018
 24 April 2018 INTERIM REPORT JANUARY MARCH 2018 Reporting period January March Net sales increased by 10.4 per cent to SEK 2,674 (2,423) million. Organically, net sales decreased by 0.6 per cent EBITA*
Year End Report January December 2017
 Year End Report January December 2017 Above: Enviro s design of a pyrolysis plant with a capacity of 30,000 tons tires/year and 9,000 tons of recovered Carbon Black Year End report Scandinavian Enviro
Investments and adaptations for the future one-off costs impacting the result
 Interim report January 1 September 30, 2017 Odd Molly International AB (publ) Stockholm, Sweden, October 24, 2017 Investments and adaptations for the future one-off costs impacting the result JULY 1 SEPTEMBER
Continued profitable growth and strong order book
 Interim Report January June Continued profitable growth and strong order book Mkr % % Revenue 83,6 68,2 23 163,1 125,4 30 Gross Profit 43,2 34,1 27 85,4 66,4 29 Gross margin (%) 51,7 50,1 3 52,4 53,0-1
INTERIM REPORT 3 MONTHS
 1 April-30 June 2018 Revenue increased by 10 percent to MSEK 1,543 (1,400). Operating profit amounted to MSEK 70 (42). Adjusted operating profit (excluding items affecting comparability) increased by 35
Operating profit was MSEK (524.2), representing a 29.3% increase with an operating margin of 13.1 (11.7)%
, representing a 29.3% increase with an operating margin of 13.1 (11.7)%") Fourth Quarter - 20 YEAR-END REPORT 20 Order intake was MSEK 5,238.4 (4,653.0), which is an overall growth of 12.6% adjusted to 0.9% for acquisitions (MSEK 576.6) and currency effects (MSEK -35.2) Net
Fourth Quarter - 20 YEAR-END REPORT 20 Order intake was MSEK 5,238.4 (4,653.0), which is an overall growth of 12.6% adjusted to 0.9% for acquisitions (MSEK 576.6) and currency effects (MSEK -35.2) Net
Year-end report January - December 2015
 Year-end report January - December 1 October - 1) Revenue increased 5 per cent to SEK 1,447 M (1,373). Excluding the acquisition of Opus Equipment, revenue increased 3 per cent. Adjusted for currency effects
Interim Report January June 2017
 Interim Report January June 2017 Above: Enviro s design of a pyrolysis plant with a capacity of 30.000 tons tires/year Scandinavian Enviro Systems AB (publ) Inerim report January June 2017 Interim report
INTERIM REPORT
 INTERIM REPORT 2018-01-01 2018-03-31 OMNICAR HOLDING AB Interim report Summary OmniCar or the Company means the Group, namely OmniCar Holding AB (registered under company registration number 559113-3987)
Interim Report January March 2017
 First Quarter - 2017 Interim Report January March 2017 Order intake was MSEK 1,314.0 (1,142.0), which is an overall growth of.1% adjusted to 4.7% for acquisitions of MSEK 118.0. The overall year to date
Continued favourable organic growth
 Continued favourable organic growth (Figures in brackets refer to the corresponding period in 2006.) Sales for kitchen company Nobia rose by 6 per cent during the third quarter to SEK 3,861 million (3,631).
Interim report, January June 2010
 Second quarter - Interim report, January June Net sales MSEK 1,166 (1,233) Net sales, excluding exchange rate differences MSEK 1,208 (1,233) Operating profit MSEK 40.4 (59.2) Income after taxes MSEK 28.2
Interim report. 1 January 30 September xano Industri AB (publ)
") Interim report 1 January 30 September 2013 xano Industri AB (publ) Interim REPORT 1 January 30 SEPTEMBER 2013 page 2 Interim report 1 January 30 September 2013 THE INTERIM PERIOD Net revenue totalled SEK
Interim report 1 January 30 September 2013 xano Industri AB (publ) Interim REPORT 1 January 30 SEPTEMBER 2013 page 2 Interim report 1 January 30 September 2013 THE INTERIM PERIOD Net revenue totalled SEK
H & M HENNES & MAURITZ AB THREE-MONTH REPORT
 H & M HENNES & MAURITZ AB THREE-MONTH REPORT 1 December 2007 29 February 2008 Sales excluding VAT for the H&M Group for the first three months of the financial year amounted to SEK 19,742 m (16,772), an
SCANIA INTERIM REPORT JANUARY MARCH 2004
 27 April 2004 SCANIA INTERIM REPORT JANUARY MARCH 2004 The year has started better than expected. Scania launched the new R-series at the end of March and the reception in our sales organisation has been
hms networks JANUARY - DECEMBER 2014 Fourth quarter
 hms networks Y E A R - E N D R E P O R T 2 0 1 4 JANUARY - DECEMBER q Net sales for the full year increased by 18 % reaching SEK 589 m (501), corresponding to a 13 % increase in local currencies. The revaluation
Improved result for the third year in row
 Year end report January 1 December 31, 2018 Improved result for the third year in row This is a translation of the Swedish version of the report. In case of any discrepancies, the Swedish version shall
GUNNEBO INTERIM REPORT JANUARY JUNE 2015
 GUNNEBO INTERIM REPORT JANUARY JUNE 2015 Gothenburg, July 17, 2015 The CEO s comments on the second quarter Order intake increased organically by 14% during the second quarter. Several major orders were
Half-year report January-June 2018 Published on July 18, 2018
 Half-year report January-June 2018 Published on July 18, 2018 Second quarter 2018 Increased sales and higher result Sales increased 7 per cent to 3,461 MSEK (3,230). Operating profit increased 9 per cent
EBITDA for the period, adjusted for currency effects, was SEK 2.8 (-10.0) million.
 million.") INTERIM REPORT JANUARY MARCH 2015 Net sales were SEK 70.8 (44.5) million. EBITDA for the period, adjusted for currency effects, was SEK 2.8 (-10.0) million. Basic earnings per share amounted to SEK -0.06
INTERIM REPORT JANUARY MARCH 2015 Net sales were SEK 70.8 (44.5) million. EBITDA for the period, adjusted for currency effects, was SEK 2.8 (-10.0) million. Basic earnings per share amounted to SEK -0.06
Interim report OmniCar Holding AB omnicar.dk
 Interim report 2017-01-01 2017-09-30 OmniCar Holding AB 559113-3987 omnicar.dk Interim report Summary OmniCar or the Company means the Group, namely OmniCar Holding AB (registered under company registration
SCANIA INTERIM REPORT JANUARY SEPTEMBER 2004
 1 November 2004 The first nine months of 2004 turned out well, and volume rose in practically all markets. The new truck range has been well received by customers and the trade press. The changeover of
Ework commences year on-track
 Interim report Q1 2018 Ework commences year on-track First Quarter 2018 compared to Net sales increased by 10% to SEK 2,623 M (2,389). EBIT was down by 18% to SEK 22.5 M (27.4). Order intake fell by 5%
Interim report January-September 2017 Published on October 26, 2017
 Interim report January-September 2017 Published on October 26, 2017 Third quarter 2017 Increased sales and strong result Sales increased 7 per cent to 2,936 MSEK (2,742). Operating profit amounted to 470
Semi- Annual Report January June 2014 CybAero AB (publ)
") Semi- Annual Report January June 2014 (publ) Net sales: SEK 20.8 million (SEK 24.4 million, full year 2013) EBITA: SEK - 4.7 million (SEK - 15 million, full year 2013) Operating loss: SEK 10 million (SEK
Semi- Annual Report January June 2014 (publ) Net sales: SEK 20.8 million (SEK 24.4 million, full year 2013) EBITA: SEK - 4.7 million (SEK - 15 million, full year 2013) Operating loss: SEK 10 million (SEK
INTERIM REPORT JANUARY SEPTEMBER 2016
 SaltX Technology Holding AB (publ) INTERIM REPORT JANUARY SEPTEMBER 2016 CEO Karl Bohman We have made significant progress within all of SaltX Technology s focus areas where the project with Rheem/ Oak
INTERIM REPORT. 1 January 30 September THE INTERIM PERIOD THE THIRD QUARTER. Important events during the period
 INTERIM REPORT 1 January 30 September 2018 THE INTERIM PERIOD Net revenue totalled SEK 1,495 million (1,23 Operating profit amounted to SEK 173 million (166) Profit before tax amounted to SEK 162 million
NY BILD. Summary of the Fortnox Group for the first quarter of 2018 (compared with the same period last year).
.") 2016 Interim Report January - March 2018 Summary of the Fortnox Group for the first quarter of 2018 (compared with the same period last year).»» Net sales for the Group increased by 32.6 percent to SEK
2016 Interim Report January - March 2018 Summary of the Fortnox Group for the first quarter of 2018 (compared with the same period last year).»» Net sales for the Group increased by 32.6 percent to SEK
HALF YEAR REPORT. Strong order intake and new significant contracts signed
 January June 2017 HALF YEAR REPORT Strong order intake and new significant contracts signed second quarter Net sales reached SEK 708 million (686), an increase of 3.0% on the same period last year. Operating
Annual Report for the 2017 financial year
 1 The Board and CEO of myfc Holding AB (publ) hereby present the Annual Report for the 2017 financial year The Annual Report is presented in Swedish kronor, SEK thousands Directors Report The Board and
Interim report January March 2015
 Interim report January March Gross cash collections SEK 791m Portfolio acquisitions SEK 273m January March (compared with the first quarter ) Gross cash collections increased by 48 per cent to SEK 791m