Full Year Results 2014/15. Analysts Conference November 4, 2015
|
|
|
- Branden Harvey
- 5 years ago
- Views:
Transcription

1 Full Year Results 2014/15
2 Cautionary note Certain statements in this presentation regarding the business of Barry Callebaut are of a forwardlooking nature and are therefore based on management s current assumptions about future developments. Such forward-looking statements are intended to be identified by words such as believe, estimate, intend, may, will, expect, and project and similar expressions as they relate to the company. Forward-looking statements involve certain risks and uncertainties because they relate to future events. Actual results may vary materially from those targeted, expected or projected due to several factors. The factors that may affect Barry Callebaut s future financial results are discussed in the Letter to Investors as well as in the Annual Report 2014/15. Such factors are, among others, general economic conditions, foreign exchange fluctuations, competitive product and pricing pressures as well as changes in tax regimes and regulatory developments. The reader is cautioned to not unduly rely on these forward-looking statements that are accurate only as of today, Nov 4, Barry Callebaut does not undertake to publish any update or revision of any forward-looking statements. Page 2
3 FY Results 2014/15 Agenda First impressions & Highlights FY 2014/15 - CEO Antoine de Saint-Affrique Performance FY 2014/15 - CFO Victor Balli The way forward - CEO Antoine de Saint-Affrique Questions & Answers session -CEO & CFO Page 3

4 First impressions & Highlights FY 2014/15 - CEO Antoine de Saint-Affrique


5 My first impressions Unique focus and deep expertise Disciplined Innovative Entrepreneurial Balancing the short and long-term People Values Performance Page 5


6 FY results 2014/15 A view on the market The new normal: volatile & complex Currencies and economic growth Raw materials A world of new opportunities Consumer driven Premiumization, personalization, taste, clean/clear labels, snacking Sustainability & traceability Customer centric Innovate with& for customers New types of customers Page 6


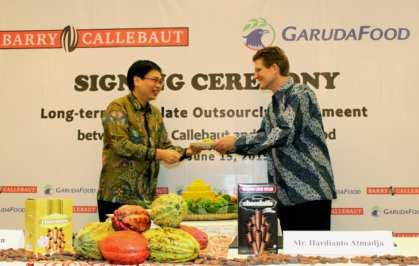
7 2014/15: delivering the short term, building for the long term Expansion of Chocolate factory in Brazil and Poland Oct-Nov 2014 Start-up of operations in our first Chocolate factory in India Jan 2015 Inaguration new CHOCOLATE ACADEMY TM centers in Dubai, Cologne, Moscow and Tokyo Jan-March 2015 Optimized cocoa Fermentation process, for superior tasting chocolate March 2015 Acquisition of American Almond in North America June 2015 Inaguration of the first chocolate factory in Chile Signing of outsourcing agreement with WFC (USA) Launched new chocolate recipes with higher thermo tolerance Signing Long-term outsourcing agreement with GarudaFood in Indonesia Sustainability partnerships with Hershey and Mondelez and launch of the Cocoa Horizons Foundation Dec 2014 Feb 2015 March 2015 Jun 2015 Aug-Oct 2015 Page 7

 increased by 7.4% in local currencies, net profit down 2.7%. 1 Source Nielsen -2.")
8 FY results 2014/15 Barry Callebautcontinues to significantly outperform the global chocolate market Sales volume growth +4.5%, significantly outperforming the market 1 and accelerating in Q4 Broad-based growth mainly driven by developed markets, as well as outsourcing, Gourmet and emerging markets Continued focus on margins and cost in a challenging market environment Operating profit (EBIT) increased by 7.4% in local currencies, net profit down 2.7%. 1 Source Nielsen -2.7% volume growth in chocolate confectionery for 26 countries Page 8

9 Performance FY 2014/15 CFO Victor Balli
10 FY results 2014/15 Volume growth above global market with acceleration in Q4 (tonnes) +4.5% +10.7% +0.2% % 16' % 15,208 45' Page 10 Q1 Q2 Q3 Q4 Sales Volume FY 2014/15 Market Volume growth * -1.8% -1.7% -3.3% -3.9% -2.7% * Source: Nielsen chocolate confectionery in volume 26 countries


11 FY results 2014/15... and with positive contribution from our key growth drivers Emerging Markets Long-term outsourcing & Strategic Partnerships +5.1% vs prior year +6.6% vs prior year +17.3% +16.5% Gourmet & Specialties +6.0% vs prior year +6.5 % Volume growth FY 2014/15 CAGR 5 year Volume 33% 32% 10% % of total Group Sales Volume Page 11
12 FY results 2014/15 Solid volume growth gaining momentum, strong profit improvement in local currencies (In CHF mio.) SalesVolume Total (in tonnes) Group performance FY 2014/15 (in CHF) % vs prioryear (in CHF) % vsprior year in local currencies 1,794, % Sales Revenue 6, % +12.1% Gross Profit % +4.8% EBIT Total EBIT per tonne % -4.7% +7.4% +2.9% Net profit for the year % -2.7% Page 12


13 FY results 2014/15 Good performance in developed regions Europe Americas Asia Pacific Global Cocoa 4% 28% 28% 42% 25% 26% Volume growth +3.9% +4.7% +7.2% +5.1% EBIT growth in local currencies +19.7% -0.3% +5.9% -33.7% EBIT growth in CHF +8.1% +3.3% -0.4% -42.4% Page 13
14 Gross Profit FY 2014/15 Gross profit up +4.8% in local currencies, due to solid volume growth, strong focus on margins and despite a historically low cocoa combined ratio in CHF mio % -1.7% Gross Profit 2013/14 Volume effects Product Mix Cocoa Processing Add. Direct costs due to growth and others Gross Profit 2014/15 before FX FX impact Gross Profit 2014/15 Page 14
15 Cocoa processing profitability Challenging cocoa market environment with negative impact from the cocoa combined ratio in FY 2014/15, strongly affecting current fiscal year European combined ratio - 6 months forward ratio 4.0 FY 2014/ Combined ratio Butter ratio 1.0 Powder ratio 0.0 Oct-07 Oct-08 Oct-09 Oct-10 Oct-11 Oct-12 Oct-13 Oct-14 Oct-15 For cocoa processors, profitability depends on the ratio between input costs (price of cocoa beans) and combined output prices (price of cocoa butter and powder). Page 15
16 Cocoa Leadership Project Assert our leadership in Cocoa, fully leverage our scale and improve profitability Commercial leadership Differentiating and repositioning the product offering Focus on commercial excellence Sustainability Centralized global steering Centralizing key strategic activities, such as cocoa combined ratio management Key accounts Make or buy decision Operations & Supply Chain leadership Optimizing our cocoa manufacturing footprint Capacity reduction in Asia: Closure of factory in Thailand Reduce cocoa processing capacity in Malaysia Establish most efficient global product flows Page 16
17 EBIT FY 2014/15 Operating profit improved 7.4% in local currencies, due to a good product & customer mix, as well as stricter fixed cost discipline in CHF mio % % EBIT 2013/14 Additional Gross Profit Additional SG&A from business growth Add. Costs, other scope and nonrecurring items EBIT 2014/15 before FX FX impact EBIT 2014/15 Page 17
18 6-year EBIT per tonne development Improvement of the EBIT per tonne in constant currencies continued EBIT per tonne in constant currencies EBIT per tonne in CHF (as reported) +8.2% Volume in kmt 2009/ / / / / /15 Page 18
19 From EBITDA to Net Profit Net Profit -2.7% in local currencies (-5.9% in CHF), due to higher average financing requirements, a foreign exchange loss, as well as higher taxes in CHF mio % EBITDA Depreciation and amortization EBIT Net Financial expenses Income taxes Net Profit for the year 2014/15 Net Profit for the year 2013/14 Page 19
20 Raw materials evolution Cocoa bean price still at relatively high levels, other raw materials below prior year 300% FY 14/15 FY vs. prior year 250% 200% 150% Cocoa beans +4% Sugar world -9% 100% 50% Sugar EU -21% Milk powder -23% 0% Sep.2007 Sep.2008 Sep.2009 Sep.2010 Sep.2011 Sep.2012 Sep.2013 Sep.2014 Sep.2015 Note: All figures are indexed to Sep 2007 Source: Cocoa beans London (2 nd position), Sugar world London n 5 (2nd position), Sugar EU Kingsmanestimates W-Europe DDP, skimmed milk powder average price Germany, Netherlands, France. Page 20
21 Net Working Capital Working Capital below prior year as a result of reduction in inventories and positive currencies effect in CHF mio. Receivables Stocks Payables % Net Working Capital Aug 14 Growth impact Price and operational impact Growth impact Operational Improvement Growth impact Price impact and operational improvements Others and FX impacts Net Working Capital Aug 15 Page 21
22 Cash Flow Cash Flow improvement due to lower investment in working capital in CHF mio % (PY -279) -145 (PY- 142) -205 (PY -227) -85 (PY -80) +87 (PY +271) +24 (PY +17) Operating Cash Flow* FY 2013/14 Operating Cash Flow* FY 2014/15 Investment in Working Capital and others Interest paid and income taxes Cash flow from investing activities Dividend Cash flow from financing activities and FX Net increase in cash and cash equivalents * Before Working Capital changes Page 22
23 Balance Sheet & key ratios Deleveraging of the company and improvement of key financial ratios remain a high priority Aug 15 Aug 14 Total Assets [CHF m] 5' '167.5 Net Working Capital [CHF m] 1' '674.6 Non-Current Assets [CHF m] 2' '175.6 Net Debt [CHF m] 1' '803.5 Shareholders' Equity [CHF m] 1' '790.7 Debt/Equity ratio 97.5% 100.7% Solvency ratio 32.7% 34.7% Net debt / EBITDA 3.2x 3.4x Interest cover ratio 4.1x 4.5x ROIC 9.8% 10.5% ROE 13.5% 14.7% Page 23
24 Dividend Proposed dividend of CHF 14.50, stable payout ratio of 33% Proposed dividend CHF per share 1 Payout ratio Payout of 33%of Net Profit 31% 33% 35% 33% 33% Not subject to withholding tax Timetable for dividend Shareholder approval: Dec 9, 2015 (AGM) Expected ex-date: Feb 29, 2016 Expected payment date: March 2, * Net Profit in CHF mio. * As proposed by the Board to our Shareholders 1) From reserves from capital contributions 2) For individuals who are taxed in Switzerland and hold the shares privately also no income tax Page 24
25 5-year development Long-term and continued strong volume and EBIT growth in a capital intensive business Sales Volume CAGR +9.1% EBIT CAGR +7.9% Currency effects (cumulated) BC Group 10/11 11/12 12/13 13/14 14/15 10/11 11/12 12/13 13/14 14/15 CAPEX Net Working Capital CAGR +14.6% CAGR +14.6% 10/11 11/12 12/13 13/14 14/15 10/11 11/12 12/13 13/14 14/15 Page 25

26 The way forward CEO Antoine de Saint-Affrique
27 We have a clear and successful long-term strategy Vision Heart and engine of the chocolate and cocoa industry Expansion 4 strategic pillars Innovation Cost Leadership Sustainable, profitable growth Sustainable Cocoa Page 27


28 Strategy unchanged, execution adjusted We are entering the next phase of our journey Focus on consistent, above market-growth and enhanced profitability: SMART GROWTH Sustainable growth Margin accretive growth Accelerated growth in Gourmet, Specialties and emerging markets Return on Capital and greater focus on Free Cash Flow Talent & Team Page 28


29 Expansion: Accelerate Gourmet, Specialties and Emerging Markets Further drive Gourmet & Specialties Further expand in Emerging markets Further leverage Outsourcing & strategic partnerships Page 29


30 Innovation: Margin accretive growth, value added products & services Products Channels Be on trend Be ahead of the curve Added-value products Added-value services Clean label, free from Acticoa Decorations, Inclusions, fillings, Co-creation Thermo-tolerant Innovative concepts Fermentation 2 & 3 D printing Page 30


31 Cost Leadership: Returns from scale, leverage & operational excellence Leverage our global scale Operational excellence Leverage our footprint Cocoa Leadership Leverage our scale European shared service centre Continuous improvement One + Finance Excellence Quality Culture Western Europe & EEMEA Centralized combined ratio management Page 31


32 Sustainable Cocoa: innovation, implementation, impact Sustainable practices, prosperous communities, long term supply Leading sustainability A holistic approach Collaborating for impact Pre-competitive platforms Setting new benchmarks Cocoa Horizons Foundation Capability based On the ground Customer partnerships NGO partnerships & certification Fuelling consumer demand Page 32
 We will strike a balance betweenvolume growth and enhanced profitability as well as free cash flow generation: smart growth")

33 Outlook Strive for smart balance between consistent, above-market volume growth and enhanced profitability Mid-term guidance (until 2017/18) We will strike a balance betweenvolume growth and enhanced profitability as well as free cash flow generation: smart growth Average volume growth 4-6% EBIT growthon averageabovevolumegrowth 1 Outlook Challenging fiscal year 2015/16 due to the current cocoa products market, which will temporarily affect our profitability Page 33 1 In local currencies and barring any major unforeseen events

34 Thank you Page 34
Full Year Results 2016/17. Analysts Conference November 8, 2017
 Full Year Results 2016/17 Analysts Conference Cautionary note Certain statements in this presentation regarding the business of Barry Callebaut are of a forwardlooking nature and are therefore based on
Roadshow presentation 3-Month Key Sales Figures 2016/17. January 2017
 Roadshow presentation 3-Month Key Sales Figures 2016/17 Agenda BC at a glance Highlights 3 months 2016/17 Strategy & Outlook Page 2 BC at a glance Who we are? The heart and engine of the chocolate industry
Roadshow presentation 9 months Key Sales Figures 2016/17. July 2017
 Roadshow presentation 9 months Key Sales Figures 2016/17 Agenda BC at a glance Highlights Q3 2016/17 Strategy & Outlook Page 2 BC at a glance Who are we? The heart and engine of the chocolate industry
Roadshow presentation - Half-Year Results 2015/16. April 2016
 Roadshow presentation - Half-Year Results 2015/16 April 2016 Agenda BC at a glance Highlights HY 2015/16 Financial Review Strategy & Outlook Page 2 BC at a glance We are present in the key parts of the
Roadshow presentation 9-Month Key Sales Figures July 2016
 Roadshow presentation 9-Month Key Sales Figures 2015-16 Agenda BC at a glance Highlights 9 months 2015/16 Strategy & Outlook Page 2 BC at a glance Who we are? The heart and engine of the chocolate industry
Half-year Results 2013/14
 Half-year Results 2013/14 Media Conference April 3, 2014 Cautionary note Certain statements in this presentation regarding the business of Barry Callebaut are of a forward-looking nature and are therefore
April 1, 2011 Barry Callebaut H1 2010/11 results presentation
 Half-Year Results 2010/11 Media presentation April 1, 2011 April 1, 2011 Barry Callebaut H1 2010/11 results presentation Cautionary note Certain statements in this presentation regarding the business of
Half-year Results 2013/14
 Half-year Results 2013/14 Analysts Conference April 3, 2014 Cautionary note Certain statements in this presentation regarding the business of Barry Callebaut are of a forward-looking nature and are therefore
Full Year Results 2012/13
 Full Year Results 2012/13 Analysts Conference Nov 7, 2013 Because we love chocolate Cautionary note Certain statements in this presentation regarding the business of Barry Callebaut are of a forward-looking
Roadshow presentation - Full-Year Results 2016/17. November 2017
 Roadshow presentation - Full-Year Results 2016/17 Agenda BC at a glance Highlights FY 2016/17 Financial Review Strategy & Outlook Page 2 BC at a glance Who are we? The heart and engine of the chocolate
Roadshow presentation Half Year Results 2017/18. April 2018
 Roadshow presentation Half Year Results 2017/18 April 2018 Agenda BC at a glance Highlights HY 2017/18 Financial Review HY 2017/18 Strategy & Outlook Page 2 April 2018 HY 2017/18 Roadshow Presentation
Half-Year Results 2016/17
 Half-Year Results 2016/17 We are the heart and engine of the chocolate and cocoa industry Half-Year Results 2016/17 in brief Volume growth picking up in Q2 +3.5%, fueled by key growth drivers, resulting
Barry Callebaut Roadshow presentation - Q1 2010/11. January 2011
 Barry Callebaut Roadshow presentation - Q1 2010/11 Agenda BC at a glance Q1 Key Sales Figures Strategy & Outlook Q & A 2 Barry Callebaut as the heart and engine of the chocolate industry Cocoa Plantations
INVESTOR PRESENTATION
 INVESTOR PRESENTATION HALF YEAR 2010 CONTENTS 1 PERFORMANCE HIGHLIGHTS HY 2010 2 ENVIRONMENT HY 2010 3 P&L & B/S DETAILS HY 2010 4 MATERIAL COST DEVELOPMENT 5 OUTLOOK 2010 6 QUESTIONS & ANSWERS 1 PERFORMANCE
Wrap up by CFO October 21, Victor Balli Chief Financial Officer
 Investor Day Paris Wrap up by CFO October 21, 2011 Victor Balli Chief Financial Officer BC volume development (in 000 MT, incl consumer WE) Volume in 000 metric tons (MT) +8.9% per year +6 8 % per year
Lindt & Sprüngli LINDT & SPRÜNGLI. Half-Year Results 2009
 Lindt & Sprüngli Half-Year Results 2009 1 HALF YEAR RESULTS 2009 Half-Year Results 2009 Introduction 2 HALF YEAR RESULTS 2009 HY Results 2009 Introduction ENVIRONMENT HY 2009: General factors Consumers:
Half-Year Results 2017/18
 Half-Year Results 2017/18 We are the heart and engine of the chocolate and cocoa industry Half-Year Results 2017/18 in brief Sales volume growth +8.0% Sales revenue of CHF 3.5 billion, 1.8% in local currencies
Financial Analysts Presentation March 17th, 2009
 ANNUAL RESULTS 2008 Financial Analysts Presentation March 17th, 2009 1 Annual Media Conference FULL YEAR 2008 GROUP MANAGEMENT Group Management Ernst Tanner Duty Free & Country Responsibility Hansjürg
Annual Results 2008/09 Analyst and Investor presentation
 Annual Results 2008/09 Analyst and Investor presentation November 12, 2009 Impressions after 10 weeks Strengths Entrepreneurship Leading-edge manufacturing technology Customer centric Global footprint
Private Banking Update
 Private Banking Update Citigroup Swiss Private Banking Roundtable Zurich, September 9, 2008 Martin Mende, Private Banking Head of Business Development Cautionary statement Cautionary statement regarding
Nilfisk Financial Results 2017 Webcast presentation - February 28
 Webcast presentation - February 28 Today s presenters Nilfisk CEO Hans Henrik Lund Nilfisk CFO Karina Deacon Page 2 Agenda 1 2 3 4 5 6 Highlights Business unit update Financials Nilfisk Next Outlook 2018
Annual Results 2008/09 Media presentation
 Annual Results 2008/09 Media presentation November 12, 2009 Impressions after 10 weeks Strengths Entrepreneurship Leading-edge manufacturing technology Customer centric Global footprint Chocolate is an
Dean Foods. Earnings Report. February 11, 2009
 Dean Foods Fourth Quarter and Year End 2008 Earnings Report February 11, 2009 Forward Looking Statements The following statements made in this presentation are forward looking and are made pursuant to
Investor Presentation
 14 MAR 2016 Investor Presentation 4Q and FY 2015 Results Hussein Hachem, CEO Bashar Obeid, CFO Management Update 4Q 2015 Results FY 2015 Results Long-term Performance Outlook & Guidance Page 1 Disclaimer
September 11, Corporate Update. Rich Tobin, President & Chief Executive Officer
 September 11, 2018 Corporate Update Rich Tobin, President & Chief Executive Officer Forward-Looking Statements and Non-GAAP Measures Our comments may contain forward-looking statements that are inherently
Investor Presentation HY2018. Maître Chocolatier Suisse Depuis 1845
 Investor Presentation HY2018 Agenda 1. Performance Highlights HY2018 2. P&L and B/S Details HY2018 3. Outlook 2018 July 24, 2018 HY 2018 Investor Presentation 2 Performance Highlights HY2018 P&L Statement
WESCO International John Engel Chairman, President and CEO. William Blair & Company 36 th Annual Growth Stock Conference June 14, 2016
 WESCO International John Engel Chairman, President and CEO William Blair & Company 36 th Annual Growth Stock Conference June 14, 2016 Safe Harbor Statement Note: All statements made herein that are not
WESCO International John Engel Chairman, President and CEO. EPG Conference May 16, 2016
 WESCO International John Engel Chairman, President and CEO Safe Harbor Statement Note: All statements made herein that are not historical facts should be considered as forwardlooking statements within
Finning reports Q results; increases dividend
 Q2 2017 EARNINGS RELEASE August 9, 2017 Finning reports Q2 2017 results; increases dividend Vancouver, B.C. Finning International Inc. (TSX: FTT) ( Finning or the Company ) reported 2 nd quarter 2017 results
Full Year Results Roadshow Presentation NOVEMBER, 2012
 Full Year Results 2011-12 Roadshow Presentation NOVEMBER, 2012 Agenda BC at a glance Highlights FY11/12 Financials Strategy and outlook 2 Barry Callebaut is present in all stages of the industrial chocolate
FULL YEAR REPORT, 2017 TELEPHONE/AUDIO CONFERENCE 8 FEBRUARY 2018, AT CET TOMMY ANDERSSON, PRESIDENT AND CEO HELENA WENNERSTRÖM, EVP AND CFO
 TELEPHONE/AUDIO CONFERENCE 8 FEBRUARY 2018, AT 15.30 CET TOMMY ANDERSSON, PRESIDENT AND CEO HELENA WENNERSTRÖM, EVP AND CFO DIRECT LINK AUDIOCAST: HTTPS://TV.STREAMFABRIKEN.COM/BULTEN Q4 2017 TELECONFERENCE:
February21, Name of chairman
 SPRING Nestlé Full PRESS Year Results CONFERENCE 2007 February21, 2008 Disclaimer This presentation contains forward looking statements which reflect Management s current views and estimates. The forward
HALF-YEAR 2016 INVESTOR PRESENTATION
 HALF-YEAR 2016 INVESTOR PRESENTATION AGENDA 1. Performance Highlights HY2016 2. P&L and B/S Details HY2016 3. Outlook Environment 2016 Investor Presentation HY2016 July 22, 2016 2 PERFORMANCE HIGHLIGHTS
Petra Foods posts US$26.3 million net profit in FY2007 net profit on 60% rise in sales to US$836.6m
 FOR IMMEDIATE RELEASE Petra Foods posts US$26.3 million net profit in FY2007 net profit on 60% rise in sales to US$836.6m EBITDA growth of 9.1% reinforces the strong fundamentals of both Divisions Financial
Strong performance, delivering a record free cash flow Full Year Results 2012
 Strong performance, delivering a record free cash flow Full Year Results 2012 Vernier, 5 th February 2013 Gilles Andrier CEO Full Year Results 2012 Financial Highlights Sales CHF 4.3 billion, up 6.6% in
Continuous Improvement of Operating Performance Half Year Results 2014
 Continuous Improvement of Operating Performance Half Year Results 2014 Vernier, 17 July 2014 Gilles Andrier CEO Half Year Results 2014 Highlights Sales CHF 2.2 billion, up 4.5% on a like-for-like* basis
2010 Full Year Results Conference Call. James Singh Chief Financial Officer
 2010 Full Year Results Conference Call James Singh Chief Financial Officer Disclaimer This presentation contains forward looking statements which reflect Management s current views and estimates. The forward
DSM Capital Markets Day 2018
 DSM Capital Markets Day 2018 Targets 2021 focused on growth, cash and value Geraldine Matchett CFO ROYAL DSM CAPITAL MARKETS DAY LONDON (UK) - 20 JUNE 2018 Safe harbor statement This presentation may contain
Growing dynamically in Western Europe
 資料 5 Growing dynamically in Western Europe Vassilis Vovos Regional President, Western Europe Caution on Forward-Looking Statements Today s presentations contain forward-looking statements. These statements
Schaeffler Group Mobility for tomorrow Klaus Rosenfeld Chief Executive Officer
 Schaeffler Group Mobility for tomorrow Klaus Rosenfeld Chief Executive Officer Capital Markets Day July 20 th, 2016 London Agenda 1 Overview 2 Our Strategy 3 Our Action Plan 4 Our Financial Ambitions 5
Short Report 2014/15. We are the heart and engine of the chocolate and cocoa industry
 Short Report 2014/15 We are the heart and engine of the chocolate and cocoa industry The Barry Callebaut Group is the world s leading chocolate and cocoa manufacturer, mastering every step from the sourcing
2007 half year results roadshow
 2007 half year results roadshow 2007 half year results roadshow - August 2007 Disclaimer This presentation contains forward looking statements which reflect Management s current views and estimates. The
Henkel AG & Co. KGaA. Klaus Keutmann Frankfurt,
 Henkel AG & Co. KGaA Klaus Keutmann Frankfurt, 21.01.2015 Disclaimer This information contains forward-looking statements which are based on current estimates and assumptions made by the corporate management
Fourth quarter results 2015
 1 Fourth quarter results 2015 11 February 2016 Peter A. Ruzicka, President & CEO Continued growth in the fourth quarter 4.1% organic growth 1 17% EBIT (adj.) 2 growth in BCG Full-year EPS doubled to NOK
MAISONS DU MONDE: FULL-YEAR 2017 RESULTS
 PRESS RELEASE MAISONS DU MONDE: FULL-YEAR 2017 RESULTS Very good performance across the board, in line with targets Solid sales growth and profitability Excellent free cash flow generation and strong deleveraging
(Registration no C)
") 3 rd rd Quarter & 9-Month 2014 Financial Results (unaudited) 11 November 2014 1 1 Important Note on Forward Looking Statements The presentation herein may contain forward looking statements by the management
3 rd rd Quarter & 9-Month 2014 Financial Results (unaudited) 11 November 2014 1 1 Important Note on Forward Looking Statements The presentation herein may contain forward looking statements by the management
Schaeffler AG 17 th GCC Kepler Cheuvreux. Jan 17, 2018 Frankfurt
 Schaeffler AG 17 th GCC Kepler Cheuvreux Jan 17, 2018 Frankfurt Disclaimer This presentation contains forward-looking statements. The words "anticipate", "assume", "believe", "estimate", "expect", "intend",
2008 Half Year Results. 30 July 2008
 1 2008 Half Year Results 30 July 2008 2 This material may be deemed to include forward-looking statements within the meaning of Section 27A of the US Securities Act of 1933 and Section 21E of the US Securities
FIRST-HALF 2018 RESULTS 30 JULY 2018
 FIRST-HALF 2018 RESULTS 30 JULY 2018 Disclaimer FORWARD LOOKING STATEMENTS This presentation contains certain statements that constitute "forward-looking statements", including but not limited to statements
Good business momentum with strongly improved net profit Half year results 2012
 Good business momentum with strongly improved net profit Half year results 2012 Vernier, 3 August 2012 Gilles Andrier CEO Half Year Results 2012 Financial highlights Sales CHF 2.1 billion, up 6.9% in local
Half-Year Results 2011/12
 Half-Year Results 2011/12 With annual sales of about CHF 4.6 billion (EUR 3.6 billion/usd 5.0 billion) for fiscal year 2010/11, Zurich-based is the world s leading manufacturer of high-quality cocoa and
WESCO International John Engel Chairman, President and CEO
 WESCO International John Engel Chairman, President and CEO Raymond James 37 th Annual Institutional Investors Conference 2016 Raymond James 37th Annual Institutional Investors Conference 2016 Safe Harbor
Unilever - CAGE Conference. Paul Polman CEO Roger Seabrook VP Investor Relations London - 19 th March 2012
 Unilever - CAGE Conference Paul Polman CEO Roger Seabrook VP Investor Relations London - 19 th March 2012 Contents 1 2011 key takeaways 2 Our progress over the last 3 years 3 Your questions addressed 2011
Henkel Our strategic priorities for the future. Hans Van Bylen / Carsten Knobel Press Conference, November 17, 2016
 Henkel 2020 + Our strategic priorities for the future Hans Van Bylen / Carsten Knobel Press Conference, November 17, 2016 Disclaimer This information contains forward-looking statements which are based
FINANCIAL OVERVIEW AL MISTYSYN SENIOR VICE PRESIDENT, FINANCE & CHIEF FINANCIAL OFFICER FINANCIAL COMMUNITY PRESENTATION OCTOBER 3, 2017
 FINANCIAL OVERVIEW AL MISTYSYN SENIOR VICE PRESIDENT, FINANCE & CHIEF FINANCIAL OFFICER FINANCIAL COMMUNITY PRESENTATION OCTOBER 3, 2017 Forward Looking Statement The presentations today will contain certain
AXA. Henri de Castries. Chairman & CEO. London - October 2, Sanford C. Bernstein Strategic Decisions Conference
 AXA Henri de Castries Chairman & CEO London - October 2, 2013 Sanford C. Bernstein Strategic Decisions Conference Cautionary note concerning forward-looking statements Certain statements contained herein
Bekaert First Half 2017 Results
 Bekaert First Half 2017 Results Matthew Taylor, CEO Beatríz García-Cos, CFO 28 July 2017 Bekaert achieves strong sales and profits in H1 2017 - Consolidated sales of 2.1 billion (+15%) and combined sales
1 st quarter 2015 results
 1 st quarter 2015 results continued improvement Jacques van den Broek, CEO Robert Jan van de Kraats, CFO Randstad Holding nv disclaimer & definitions Certain statements in this document concern prognoses
Full Year 2009 Results. Givaudan reinforces its leadership position
 Full Year 2009 Results Givaudan reinforces its leadership position Vernier, 16 February 2010 Gilles Andrier CEO Full Year 2009 results Business highlights The new Givaudan platform has passed its test
Talanx Strategy Frankfurt, 23 October Torsten Leue, CEO
 Talanx Strategy Frankfurt, 23 October 2018 Torsten Leue, CEO Key messages We commit to an increased RoE of 800 bps above risk-free an annual EPS-growth 5% on average 35% to 45 % payout of IFRS earnings
H RESULTS PRESENTATION
 H1 2018 RESULTS PRESENTATION 03.09.2018 H1 2018 RESULTS PRESENTATION DISCLAIMER This presentation (the "Presentation") has been prepared and is issued by, and is the sole responsibility of Telepizza Group,
Strengthening the economic model
 Strengthening the economic model Cécile CABANIS Executive Vice President, Chief Financial Officer Strategy and Information Systems DISCLAIMER This document is presented by Danone. It contains certain forward-looking
Fourth Quarter 2017 Earnings Conference Call. November 7, 2017
 Fourth Quarter 2017 Earnings Conference Call November 7, 2017 Safe Harbor Statement Our commentary and responses to your questions may contain forward-looking statements, including our outlook for the
Investor Update Michael Willome, Group CEO Alex Waser, CEO Bystronic
 Investor Update Michael Willome, Group CEO Alex Waser, CEO Bystronic d Baader Swiss Equities Conference Bad Ragaz, January 11, 2018 Seite 1 Investor Konzernleitungs-Sitzung Update, Baader vom Helvea 9.
HARVEY NASH GROUP PLC. Albert Ellis, CEO Mark Garratt, CFO. results ahead of expectations increased dividend strong platform to accelerate growth
 HARVEY NASH GROUP PLC Albert Ellis, CEO Mark Garratt, CFO results ahead of expectations increased dividend strong platform to accelerate growth HIGHLIGHTS Results ahead of expectations Strong operating
2007 Revenue and Results. 2007: strong increase in results Strengthened growth momentum. February 15 th, 2008
 2007 Revenue and Results 2007: strong increase in results Strengthened growth momentum February 15 th, 2008 2007 revenue and results Agenda A successful 2007 Be the recognized industry leader John Glen
IFF Q Earnings Conference Call
 INTERNATIONAL FLAVORS & FRAGRANCES IFF Q2 2018 Earnings Conference Call August 8, 2018 Cautionary Statement This presentation contains forward-looking statements within the meaning of Section 27A of the
ANNUAL GENERAL MEETING METRO AG. 15 February 2019
 ANNUAL GENERAL MEETING METRO AG 15 February 2019 DISCLAIMER AND NOTES To the extent that statements in this presentation do not relate to historical or current facts, they constitute forward-looking statements.
Zumtobel Group AG FY 2014/15 results
 Zumtobel Group AG FY 2014/15 results June 24, 2015 1 24 June 2015 Annual Results 2014/15 Improvement in revenues and earnings, restructuring measures on track Financials FY 2014/15 at a glance Group revenues
All integration targets achieved entering a new era of profitable growth. Full Year 2010 Results
 All integration targets achieved entering a new era of profitable growth Full Year 2010 Results Vernier, 8 February 2011 Gilles Andrier CEO Full Year 2010 Results Financial Highlights Sales CHF 4.2 billion,
Nestlé India Limited 20th Financial Analysts Meet - Gurgaon 30th November 2011
 Nestlé India Limited 20 th Financial Analysts Meet - Gurgaon 30 th November 2011 Disclaimer This presentation may contain statements which reflect Management s current views and estimates and could be
2018 Q1 results. Millicom International Cellular S.A. Kicking off 2018 with accelerating momentum
 2018 Q1 results Kicking off 2018 with accelerating momentum Mauricio Ramos, CEO Tim Pennington, CFO April 25 th, 2018 Millicom International Cellular S.A. Disclaimer This presentation may contain certain
German Investment Seminar 2011 Commerzbank AG New York January 10-11, 2011
 German Investment Seminar 2011 Commerzbank AG Mark Langer Chief Financial Officer Dennis Weber Head of Investor Relations New York January 10-11, 2011 German Investment Seminar, Commerzbank HUGO BOSS January
Half-Year 2014 Analyst and Investor Presentation
 Half-Year 204 Analyst and Investor Presentation DKSH Holding Ltd. August, 204 Welcome to the DKSH Half-Year 204 Analyst and Investor Presentation Page 2 H 204: Growth in a challenging market environment
Q4 & FY 2018 Results. January 30, 2019
 Q4 & FY 2018 Results January 30, 2019 This presentation contains a number of forwardlooking statements. Words, and variations of words, such as will, expect, may, believe, estimate, deliver, potential,
ANNOUNCEMENT OF PRELIMINARY RESULTS
 The leading high service distributor to engineers worldwide ANNOUNCEMENT OF PRELIMINARY RESULTS YEAR ENDED 31 MARCH 2009 29 May 2009 Agenda Overview and current trading Ian Mason Financial performance
Financial results & business update. Quarter and year ended 31 December February 2016
 Financial results & business update Quarter and year ended 31 December 2015 11 February 2016 Disclaimer 3 Any remarks that we may make about future expectations, plans and prospects for the company constitute
Full-Year 2017/18 Results Stäfa, May 22, 2018 Arnd Kaldowski, CEO Hartwig Grevener, CFO Thomas Bernhardsgrütter, IR
 Full-Year 2017/18 Results Stäfa, Arnd Kaldowski, CEO Hartwig Grevener, CFO Thomas Bernhardsgrütter, IR Disclaimer This presentation contains forward-looking statements, which offer no guarantee with regard
MAISONS DU MONDE: FULL-YEAR 2018 RESULTS
 PRESS RELEASE MAISONS DU MONDE: FULL-YEAR 2018 RESULTS Strong performance in line with targets Continued solid momentum in online and international sales Focus on strategic pillars to deliver further profitable
PT Ultrajaya Milk Industry & Trading Company Tbk. FY 2013 results update
 PT Ultrajaya Milk Industry & Trading Company Tbk. FY 2013 results update April 2014 0 Disclaimer These materials are not intended to be a public offering document under Law of the Republic of Indonesia
Driving shareholder value
 KONE CMD 2017 Driving shareholder value ILKKA HARA, CFO SEPTEMBER 29, 2017 AGENDA FINANCIAL OVERVIEW BUILDING ON THE STRONG BUSINESS MODEL INVESTING FOR THE FUTURE LOOKING AHEAD Financial overview 3 Sales
Positive trend in earnings and strong cash flow
 Positive trend in earnings and strong cash flow Presentation of the Q3/2017 result Martin Lindqvist, President & CEO Håkan Folin, CFO October 25, 2017 Agenda Q3/2017 and performance by division Financials
2007 Interim Results 1 August 2007
 2 2007 Interim Results 1 August 2007 This material may be deemed to include forward-looking statements within the meaning of Section 27A of the US Securities Act of 1933 and Section 21E of the US Securities
INEOS STYROLUTION. Q1/ 2018 Investor Earnings Call
 INEOS STYROLUTION Q1/ 2018 Investor Earnings Call Disclaimer The following presentation includes forward-looking statements, within the meaning of the US securities laws, based on our current expectations
2012 Interim Results - Presentation ZURICH, 23 AUGUST 2012
 2012 Interim Results - Presentation ZURICH, 23 AUGUST 2012 Agenda - Highlights - Financials - Outlook 2 Strong position in Asia leads to improved operating results for HY 2012 Turnover +26.7% Negative
Annual Shareholder Meeting. Joachim Kreuzburg Chairman of the Board and CEO 03. April 2018
 Annual Shareholder Meeting Joachim Kreuzburg Chairman of the Board and CEO 03. April 2018 Disclaimer This presentation contains statements concerning Sartorius Stedim Biotech Group s future performance.
Investor Presentation
 Investor Presentation May 2013 48,000 employees 200 offices 70 countries 1 global platform Table of Contents I. Company Description II. Global Growth Strategy III. Financial Overview IV. Appendix 2 Company
SIX MONTHS REPORT, JAN JUN 2018
 SIX MONTHS REPORT, JAN JUN 2018 TELEPHONE/AUDIO CONFERENCE 11 JULY 2018, AT 11.00 CET TOMMY ANDERSSON, PRESIDENT AND CEO HELENA WENNERSTRÖM, EVP AND CFO DIRECT LINK AUDIOCAST: HTTPS://TV.STREAMFABRIKEN.COM/BULTEN
31 March 2018 Audited Preliminary Results. 6 June 2018
 31 March 2018 Audited Preliminary Results 6 June 2018 1 Presentation Team Euan Fraser Chief Executive Officer Stuart McNulty UK Chief Executive Officer John Paton Chief Financial Officer Has led Alpha
Finning reports Q results
 Q3 2017 EARNINGS RELEASE November 7, 2017 Finning reports Q3 2017 results Vancouver, B.C. Finning International Inc. (TSX: FTT) ( Finning or the Company ) reported third quarter 2017 results today. All
Henkel Roadshow Q November, 2014
 Henkel Roadshow Q3 2014 November, 2014 Disclaimer This information contains forward-looking statements which are based on current estimates and assumptions made by the corporate management of Henkel AG
Agenda. 1. Highlights FY 2012 Results. 2. Operational Performance Priorities for Financials. 5. Conclusion
 1MARCH 2013 Legal Disclaimer Information in this presentation may involve guidance, expectations, beliefs, plans, intentions or strategies regarding the future. These forward-looking statements involve
July 26, 2017 LafargeHolcim Ltd 2015
 Second Quarter 2017 Results Beat Hess, Chairman and Interim CEO Roland Köhler, Interim COO and Regional Head of Europe, Australia/NZ & Trading Ron Wirahadiraksa, CFO July 26, 2017 LafargeHolcim Ltd 2015
Nestlé Press conference, February 19, 2010
 Nestlé Press conference, February 19, 2010 2 Nestlé Press conference, February 19, 2010 Paul Bulcke Chief Executive Officer Nestlé S.A. Richard Laube John Harris Laurent Freixe Luis Cantarell Frits van
8 April 2004 Annual Investor Conference 2004
 8 April 2004 Annual Investor Conference 2004 Dr Jürg Witmer Chief Executive Officer Highlights 2003 Actual sales growth of 9% in local currencies Industry leadership reaffirmed Gross margin affected by
Q Results. October 29, 2018
 Q3 2018 Results October 29, 2018 Forwardlooking Statements This presentation contains a number of forwardlooking statements. Words, and variations of words, such as will, expect, may, should, believe,
2018 Half Year Results
 A GLOBAL LEADER IN METAL FLOW ENGINEERING 2018 Half Year Results 26 July 2018 Patrick André Chief Executive 1 Disclaimer This presentation, which has been prepared by Vesuvius plc (the Company ), includes
Full-year results 2017 Conference. February 15, 2018 Nestlé full-year results 2017
 Full-year results 2017 Conference 1 Disclaimer This presentation contains forward looking statements which reflect Management s current views and estimates. The forward looking statements involve certain
Summary. Solid underlying growth of the business. Investments in sustainable long-term growth. On track to achieve our financial targets
 HY 2002 RESULTS Summary Solid underlying growth of the business Investments in sustainable long-term growth On track to achieve our financial targets 1 Key Highlights HY 2002 (IAS) (1)(2) Post- Restructuring
Dean Foods Third Quarter 2008 Earnings Report. November 4, 2008
 Dean Foods Third Quarter 2008 Earnings Report November 4, 2008 Forward Looking Statements The following statements made in this presentation are forward looking and are made pursuant to the safe harbor